health care costs and access disparities in appalachia · health care costs and access disparities...
TRANSCRIPT
Health Care Costs and Access Disparities in Appalachia Prepared for: Appalachian Regional Commission 1666 Connecticut Avenue NW Suite 700 Washington, DC 20009-1068 January 2012 Contract #CO-16835-2010
Prepared by: PDA, Inc. Nancy M. Lane, MA Andrew Y. Lutz, BS Kimberly Baker, BS The Cecil B. Sheps Center for Health Services Research University of North Carolina – Chapel Hill Thomas R. (Bob) Konrad, PhD Thomas R. Ricketts, PhD Randy Randolph, MRP Charles Tran, BS Christopher A. Beadles, MD
APPALACHIAN REGIONAL COMMISSION

HEALTH CARE COSTS AND ACCESS DISPARITIES IN APPALACHIA January 2012 ACKNOWLEDGEMENTS This report was prepared by PDA, Inc. in Raleigh, North Carolina in collaboration with The Cecil G. Sheps Center for Health Services Research at the University of North Carolina Chapel Hill. It was developed for the Appalachian Regional Commission under contract CO-16835-2010. The principal authors of this report and the related research study include: Nancy M. Lane, PDA, Inc.; Thomas R. (Bob) Konrad, PhD, Tomas C. Ricketts, III, PhD, Randy Randolph, MRP, Charles Tran, BS, and Christopher A. Beadles, MD from The UNC Sheps Center; Andrew Y. Lutz, BS and Kimberly Baker, BS at PDA, Inc. In addition, this report has been reviewed by David Carrier, PhD of the Appalachian Regional Commission. The authors wish to thank our program officer David Carrier for his insights and review comments on various technical aspects of the report. In addition, we are indebted Paulette Pack, Administrative Assistant, PDA, Inc., for countless hours of assistance editing the report and to Laurie Leadbetter and Christiane Voisin at The UNC Sheps Center for assistance with the literature search. APPALACHIAN REGIONAL COMMISSION Funding for this project was provided by the Appalachian Regional Commission (ARC) to PDA Inc. through a competitive solicitation led by David Carrier, PhD and John Cartwright, PhD.
ABOUT THE AUTHORS
PDA, INC. Nancy M. Lane, MA. Ms. Lane serves as the President of PDA, Inc. and has led health care program development efforts for more than 30 years. With nine years’ experience with the Appalachian Regional Commission, she has developed skills in regional health care system design and policy development. Ms. Lane helped to develop the Rural Health Clinics Act, PL 95-210. She has completed health care delivery system research on the Veterans Health Administration and private health care providers. Andrew Lutz, BS. Mr. Lutz received his Bachelors of Science in Finance from the University of North Carolina at Chapel Hill. He conducts health industry, market and company-specific research, processes documentation and works with space programming and policy review. Kimberly Baker, BS. Ms. Baker received her Bachelor of Science in Business and Marketing from Western Carolina in Cullowhee, North Carolina. She provides assistance with market analysis, preparing maps describing target populations, and quality control checks.
THE CECIL B. SHEPS CENTER FOR HEALTH SERVICES RESEARCH UNIVERSITY OF NORTH CAROLINA – CHAPEL HILL
Thomas C. Ricketts, Ph.D. Dr. Ricketts is a Professor of Health Policy and Administration and Social Medicine, and the Director of the Health Policy Analysis Unit in the Cecil G. Sheps Center for Health Services Research at the University of North Carolina at Chapel Hill. The focus of his research has been on policy making for the health care workforce and access to care for rural and underserved populations. He was the founding director of the North Carolina Rural Health Research and Policy Analysis Center. Dr. Ricketts is a member of the Institute of Medicine Task Force on the Geographic Wage Index. Thomas R. (Bob) Konrad, Ph. D. Dr. Konrad is a Senior Fellow at the North Carolina Institute on Aging and served as Co-Director of the Program for Health Services Research at the University of North Carolina at Chapel Hill on Health Professions and Primary Care, with Donald Pathman (PHP&PC) at the Cecil G. Sheps Center. He holds academic appointments as Professor of Social Medicine (School of Medicine), Professor of Health Policy and Administration (School of Public Health), and Research Professor in the Division of Pharmaceutical Policy and Evaluative Sciences (School of Pharmacy). Dr. Konrad is familiar with a variety of health professions databases and data collection strategies, measurements and modeling issues. Randy Randolph, MRP. Mr. Randolph is an Applications Analyst Programmer for the Cecil G. Sheps Center for Health Services Research at the University of North Carolina at Chapel Hill. As a programmer, he has been an essential team member on various database projects involving the development of metrics and geo-coded data sets and mapping. Christopher Beadles, MD and Charles Tran, BS were graduate students associated with the Sheps Center. Dr. Beadles is pursuing his Ph.D. in health services research. Mr. Tran is pursuing his MPH.
PDA, Inc. & Cecil. G. Sheps Center/UNC-Chapel Hill ARC Contract No.: CO-16835-2010 iii
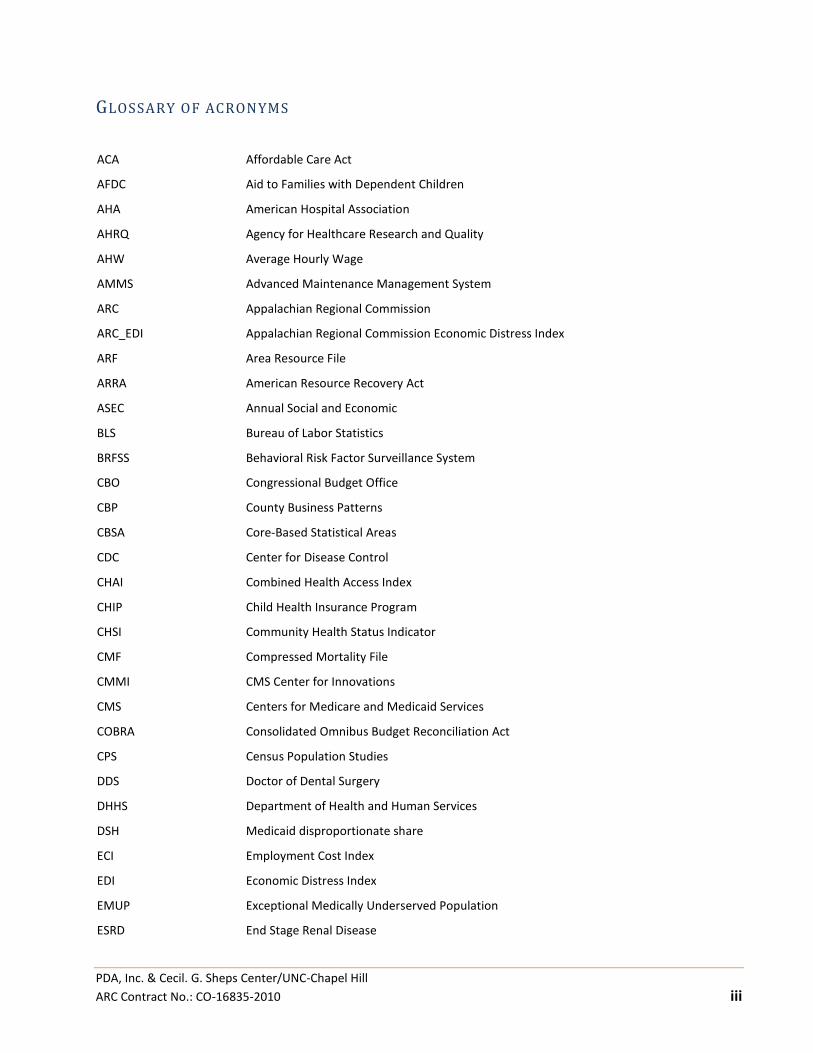
GLOSSARY OF ACRONYMS
ACA Affordable Care Act
AFDC Aid to Families with Dependent Children
AHA American Hospital Association
AHRQ Agency for Healthcare Research and Quality
AHW Average Hourly Wage
AMMS Advanced Maintenance Management System
ARC Appalachian Regional Commission
ARC_EDI Appalachian Regional Commission Economic Distress Index
ARF Area Resource File
ARRA American Resource Recovery Act
ASEC Annual Social and Economic
BLS Bureau of Labor Statistics
BRFSS Behavioral Risk Factor Surveillance System
CBO Congressional Budget Office
CBP County Business Patterns
CBSA Core-Based Statistical Areas
CDC Center for Disease Control
CHAI Combined Health Access Index
CHIP Child Health Insurance Program
CHSI Community Health Status Indicator
CMF Compressed Mortality File
CMMI CMS Center for Innovations
CMS Centers for Medicare and Medicaid Services
COBRA Consolidated Omnibus Budget Reconciliation Act
CPS Census Population Studies
DDS Doctor of Dental Surgery
DHHS Department of Health and Human Services
DSH Medicaid disproportionate share
ECI Employment Cost Index
EDI Economic Distress Index
EMUP Exceptional Medically Underserved Population
ESRD End Stage Renal Disease
Health Care Costs and Access Disparities in Appalachia
PDA, Inc. & Cecil. G. Sheps Center/UNC-Chapel Hill
iv ARC Contract No.: CO-16835-2010
ESRI Environmental Systems Research Institute
FDA U.S. Food and Drug Administration
FMAP Federal Medical Assistance Percentage
FPL Federal Poverty Level
FQHC Federally Qualified Health Centers
FT Federal Trade Commission
FY Fiscal Year
GAF Geographic Adjustment Factor
GDP Gross Domestic Product
GDSC Governor's Designation Secretary Certified
GPCI Geographic Practice Cost Index
GPO Government Printing Office
GSP Gross State Product
HCCA Healthcare Costs, Coverage, and Access Index
HCC Health Care Cost
HCRA Health Care Resource Availability
HCUP Healthcare Costs and Utilization Project
HI Hospital Insurance
HIC Health Insurance Coverage
HOSPBEDS Acute Hospital Beds
HRSA Health Resource and Service Administration
HSA Health Savings Account
HWI Hospital Wage Index
IOM Institute of Medicine
IPPS Inpatient Prospective Payment System
IRS Internal Revenue Source
J-1 Visa Non-immigrant visa issued by the U.S., esp. for medical or business training within the U.S.
JAMA Journal of the American Medical Association
KCMU Kaiser Commission on Medicaid and the Uninsured
KFF Kaiser Family Foundation
MAX Medicaid Analytic Extract
MEPS Medical Expenditure Panel Survey
MSA Metropolitan Statistical Areas
MUA Medically Underserved Areas
Glossary of Acronyms
PDA, Inc. & Cecil. G. Sheps Center/UNC-Chapel Hill ARC Contract No.: CO-16835-2010 v
MUA/P Medical Underserved Areas & Populations
MUP Medically Underserved Population
NASBO National Association of State Budget Officers
NCHS National Center for Health Statistics
nda No data available
NHE National Health Expenditures
NHSC National Health Service Corps
NIS National Immunization Survey
NPCP Non-Primary Care Physicians
NPRM3 Notice of Proposed Rule Making
nrf No report, survey sample size fewer than 50
OA Old Age
OCC Occupational Mix
OHRM Office of the Actuary Health Reform Model
OMB Office of Management and Budget
OSCAR Online Survey, Certification and Reporting
PCP Primary Care Physicians
PCSA Primary Care Service Area
PHC Personal health care
PHCE Personal Health Care Expenditures
PPACA Patient Protection and Affordable Care Act
ResDAC Research Data Assistant Center
RHC Rural Health Clinic
RIMS II Regional Input-Output Modeling System
RN Registered Nurse
RSA Rural Service Area
RTP Research Triangle Park
SAHIE Small Area Health Insurance Estimates
SAMSA Substance Abuse and Mental Health Administration
SCHIP State’s Children’s Health Insurance Program
SES Socioeconomic status
SGR Sustainable Growth Rate
SHADAC State Health Access Data Assistance Center
SID State Inpatient Databases
Health Care Costs and Access Disparities in Appalachia
PDA, Inc. & Cecil. G. Sheps Center/UNC-Chapel Hill
vi ARC Contract No.: CO-16835-2010
SMI Supplementary Medical Insurance
SSA Social Security Administration
SSI Supplemental Security Income
TRH Tennessee Rural Health
TRICARE VA and Department of Defense health insurance plan
UNC University of North Carolina at Chapel Hill
VA Veterans Administration
VHA Veterans Health Administration
VISN Veterans Integrated Service Networks
VISTA Veterans Health Information Systems and Technology Architecture
WIC Woman, Infants, and Children Program
YPLL Years of Potential Life Lost
YPLL_75 Years of Potential Life Lost under age 75 per 100,000 population
ZBP Zip Code Business Patterns
PDA, Inc. & Cecil. G. Sheps Center/UNC-Chapel Hill ARC Contract No.: CO-16835-2010 vii
TABLE OF CONTENTS
GLOSSARY OF ACRONYMS ................................................................................................................................................... III
LIST OF FIGURES ..........................................................................................................................................................XI
LIST OF TABLES ........................................................................................................................................................ XIII
EXECUTIVE SUMMARY AND KEY FINDINGS ................................................................................................................. XV
HEALTH COST AND ACCESS INDEX .......................................................................................................................................XV
KEY FINDINGS ....................................................................................................................................................... XVII
Healthcare Cost, Coverage, and Access Index.................................................................................................. xvii Tests of Relationships between the HCCA and Health and Economic Status ................................................... xvii Influence of Socioeconomic Status on Relationships between HCCA and Health Status in Appalachia ........... xix Other Healthcare Use Measures ........................................................................................................................xx
HEALTH REFORM POLICY ISSUES ......................................................................................................................................... XX
CHAPTER 1 INTRODUCTION .......................................................................................................................................... 1
1.1. CONTEXT FOR ARC HEALTHCARE ACCESS INDEX ............................................................................................................ 1
1. 2 LITERATURE REVIEW ................................................................................................................................................. 1
1.2.1 Healthcare Access .................................................................................................................................... 1 1.2.2 Costs of Care and Bankruptcy .................................................................................................................. 3 1.2.3 Federal Funding For Healthcare ............................................................................................................... 4 1.2.4 State and Local Spending on Healthcare .................................................................................................. 6 1.2.5 Impact of Medicaid on State Economic Activity ....................................................................................... 8
1.3 INDEX CONSTRUCTION .............................................................................................................................................. 9
1.4 EXISTING MEASURES OF HEALTHCARE ACCESS AND DISPARITIES ..................................................................................... 10
1.4.1 Healthcare Disparities Scorecards .......................................................................................................... 10 1.4.2 Health Cost Measures ............................................................................................................................ 13 1.4.3 Insurance Coverage Measures ............................................................................................................... 14 1.4.4 Healthcare resource Measures .............................................................................................................. 14 1.4.5 Health Status Measures ......................................................................................................................... 15
1.5 STRUCTURE OF THE REPORT..................................................................................................................................... 16
CHAPTER 2 HEALTHCARE COST, COVERAGE, AND ACCESS INDEX ................................................................................ 17
2.1 INDEX CRITERIA ..................................................................................................................................................... 17
2.2 INDEX COMPONENTS .............................................................................................................................................. 17
2.3 HEALTH CARE COST (HCC) COMPONENT ................................................................................................................... 17
2.4 HEALTH INSURANCE COVERAGE (HIC) COMPONENT ..................................................................................................... 18
2.5 HEALTH CARE RESOURCES AVAILABILITY (HCRA) COMPONENT ...................................................................................... 18
Health Care Costs and Access Disparities in Appalachia
PDA, Inc. & Cecil. G. Sheps Center/UNC-Chapel Hill
viii ARC Contract No.: CO-16835-2010
CHAPTER 3 APPALACHIAN HEALTHCARE ACCESS ........................................................................................................ 19
3.1 APPLICATION OF INDEX ........................................................................................................................................... 19
3.2 MAPS OF HEALTHCARE COST, COVERAGE AND ACCESS INDEX (HCCA) AND COMPONENTS .................................................. 21
3.2.1 Healthcare Cost, Coverage and Access (HCCA) Index ............................................................................. 22 3.2.2 Health Care Cost (HCC) Component ....................................................................................................... 24 3.2.3 Health Insurance Coverage (HIC) Component ........................................................................................ 26 3.2.4 Health Care Resource Availability (HCRA) Component .......................................................................... 28
3.3 SUMMARY OF FINDINGS FOR HEALTHCARE COST, COVERAGE, AND ACCESS (HCCA) INDEX IN APPALACHIAN REGION ............... 30
3.4 RESULTS IN APPALACHIAN STATES ............................................................................................................................. 32
3.4.1 Healthcare Cost, Coverage, and Access (HCCA) Index ............................................................................ 32 3.4.2 Health Care Cost (HCC) Component ....................................................................................................... 33 3.4.3 Health Insurance Coverage (HIC) Component ........................................................................................ 34 3.4.4 Health Care Resource Availability (HCRA) Component .......................................................................... 35
3.5 HEALTHCARE COST, COVERAGE, AND ACCESS (HCCA) INDEX AND DISTRESSED APPALACHIAN COUNTIES ................................ 36
3.6 OTHER MEASURES OF HEALTH CARE ACCESS .............................................................................................................. 39
3.6.1 Independent Measures........................................................................................................................... 39 3.6.2 Children Insured ..................................................................................................................................... 40 3.6.3 Disability Coverage ................................................................................................................................. 44 3.6.4 Health Outcomes .................................................................................................................................... 46 3.6.5 Veterans Health Affairs Utilization......................................................................................................... 49
CHAPTER 4 CORRELATION OF HEALTHCARE COST, COVERAGE, AND ACESS (HCCA) INDEX WITH HEALTH STATUS, ECONOMY AND PERSISTENT POVERTY ..................................................................................................... 53
4.1 APPALACHIA ........................................................................................................................................................ 53
4.2 RURAL AND ECONOMICALLY DISTRESSED AREAS .......................................................................................................... 53
4.3 RELATIONSHIPS BETWEEN HEALTHCARE COST, COVERAGE, AND ACCESS (HCCA) INDEX AND COUNTY SOCIOECONOMICS ......... 54
4.3.1. Analytic Approach .................................................................................................................................. 54 4.3.2 Correlations of Healthcare Cost, Coverage, and Access (HCCA) Index and Its Components with
YPLL_75, the ARC Economic Distress Index, and Prevalence of Disability .............................................. 55 4.3.3 Controlling for the Economic Distress Index ........................................................................................... 58 4.3.4 Testing the Relationships of Components of Healthcare Cost, Coverage, and Access (HCCA) Index to
Health Status and Economic Distress ..................................................................................................... 59 4.3.5 Controlling for Persistent Poverty .......................................................................................................... 59
4.4 SUMMARY OF STATISTICAL CORRELATIONS: ACCESS AND HEALTH STATUS......................................................................... 61
Table of Content
PDA, Inc. & Cecil. G. Sheps Center/UNC-Chapel Hill ARC Contract No.: CO-16835-2010 ix
CHAPTER 5 POLICY ISSUES FOR ARC ............................................................................................................................ 63
5.1 SUPPLY OF HEALTH CARE PROVIDERS......................................................................................................................... 63
5.2 HEALTH SYSTEM DESIGN ......................................................................................................................................... 64
5.3 HEALTH CARE COST ISSUES ...................................................................................................................................... 65
5.4. COST-ACCESS RELATIONSHIP.................................................................................................................................... 67
5.5 INDIRECT ECONOMIC IMPACT OF HEALTHCARE COST .................................................................................................... 68
5.5.1 Loss of Disposable Income ..................................................................................................................... 68 5.5.2 Medical Bankruptcy ............................................................................................................................... 68 5.5.3 Per Capita Spending ............................................................................................................................... 70
5.6 CMS GEOGRAPHIC WAGE INDEX .............................................................................................................................. 73
5.7 SOCIAL COST OF HEALTHCARE ACCESS BARRIERS ......................................................................................................... 76
5.8 HEALTH REFORM AND STATE MEDICAID BURDENS ....................................................................................................... 77
CHAPTER 6 BEST PRACTICES IN PROVIDING BETTER HEALTH INSURANCE ................................................................... 81
6.1 RURAL RESIDENTS ................................................................................................................................................. 81
6.2 POTENTIAL FOR APPALACHIAN REGION ...................................................................................................................... 82
6.3 IMPACT OF HEALTH REFORM LEGISLATION .................................................................................................................. 83
6.3.1 Insurance Exchanges ................................................................................................................................ 83 6.3.2 Innovation Opportunities ......................................................................................................................... 84 6.3.3 Delivery System ........................................................................................................................................ 84 6.3.4 Estimated Changes In Medicaid State Spending ...................................................................................... 86
CHAPTER 7 SUMMARY FINDINGS AND RECOMMENDATIONS ..................................................................................... 91
7.1 CONCLUSIONS AND FINDINGS FROM THE HEALTHCARE COST, COVERAGE AND ACCESS INDEX (HCCA) ................................... 91
7.2 IMPLICATIONS OF HEALTH REFORM ........................................................................................................................... 91
7.3 RECOMMENDATIONS .............................................................................................................................................. 92
7.3.1 Policy Issues ............................................................................................................................................. 92 7.3.2 Participate with Institute of Medicine Committee to Modify CMS Geographic Wage Index ................. 93 7.3.3. Support Regional And Local Healthcare Labor force Reforms And Technology .................................... 95 7.3.4 Advocate for Low Resource Areas .......................................................................................................... 96 7.3.5 Actively Engage with CMS Center for Medicare and Medicaid Innovations .......................................... 97
7.4 AREAS FOR FURTHER STUDY .................................................................................................................................... 98
CHAPTER 8 REFERENCES ............................................................................................................................................. 99
Health Care Costs and Access Disparities in Appalachia
PDA, Inc. & Cecil. G. Sheps Center/UNC-Chapel Hill
x ARC Contract No.: CO-16835-2010
APPENDICES.............................................................................................................................................................. 105
APPENDIX A: CMS WAGE INDEX ............................................................................................................................ 105
APPENDIX B: SHEPS CENTER MEDICALLY UNDERSERVED MAP ...................................................................................... 109
APPENDIX C: FEDERAL MEDICAL ASSISTANCE PERCENTAGE RATES BY STATE 2011 ........................................................... 111
APPENDIX D: NATIONAL HEALTH SPENDING PROJECTIONS THROUGH 2020 .................................................................... 113
APPENDIX E: OVERVIEW OF MEDICAID ECONOMIC IMPACT .......................................................................................... 115
APPENDIX F: MEDICAID COVERAGE AND SPENDING: HEALTH REFORM ........................................................................... 119
APPENDIX G: MEDICAID COVERAGE AND SPENDING: HEALTH REFORM ........................................................................... 121
APPENDIX H: CDC COMMUNITY HEALTH STATUS INDICATORS SAMPLE: COOSA COUNTY, ALABAMA.................................... 123
APPENDIX I: DEFINITION OF ELIGIBLE LOCATION FOR RURAL HEALTH CLINIC................................................................... 125
APPENDIX J: NEGOTIATED RULEMAKING COMMITTEE: DRAFT EXCEPTIONAL MEDICALLY UNDERSERVED POPULATION (EMUP), OCTOBER 12, 2011 ........................................................................................................................... 127
APPENDIX K: METHODOLOGY FOR ARC HEALTH CARE COST AND ACCESS INDEX ............................................................. 129
APPENDIX L: USE OF VETERANS HEALTH ADMINISTRATION SERVICES IN APPALACHIAN COUNTIES, 2009 ............................. 153
APPENDIX M: MULTIVARIATE REGRESSION ANALYSIS OF HCCA INDEX ............................................................................ 155
APPENDIX N: COUNTY ECONOMIC STATUS IN APPALACHIA, FY 2012 ............................................................................. 179
PDA, Inc. & Cecil. G. Sheps Center/UNC-Chapel Hill ARC Contract No.: CO-16835-2010 xi
LIST OF FIGURES
FIGURE 1 – COUNTY HEALTHCARE COST, COVERAGE AND ACCESS INDEX IN APPALACHIA, 2011 ............................................................. XVI FIGURE 2 – AVERAGE OF HCCA INDEX AND COMPONENTS BY GEOGRAPHIC GROUP ........................................................................... XVII FIGURE 3 –COMPARISON OF ESTIMATED PREVENTABLE MORTALITY RATES IN 2005-2007 ................................................................. XVIII FIGURE 4 – HEALTH CARE ACCESS EARLY DEFINITIONS ..................................................................................................................... 2 FIGURE 5- EMERGING MODEL OF HEALTH CARE ACCESS ................................................................................................................... 2 FIGURE 6 – FORECAST OF STATE AND LOCAL TOTAL HEALTH EXPENDITURES, 2009 -2019 ...................................................................... 7 FIGURE 7 – PERCENT CHANGE IN TOTAL MEDICAID SPENDING AND ENROLLMENT, FY 1998 - FY 2011 .................................................... 9 FIGURE 8 – TOTAL PER CAPITA MEDICARE ESRD PAYMENTS, WHOLE STATE ALABAMA (2003) ............................................................ 12 FIGURE 9 – TOTAL PER CAPITA ESRD PAYMENTS APPALACHIAN COUNTIES, ALABAMA (2003).............................................................. 12 FIGURE 10 – COUNTY HCCA INDEX IN THE U.S., 2011 .................................................................................................................. 22 FIGURE 11 - COUNTY HEALTHCARE COST, COVERAGE AND ACCESS (HCCA) INDEX IN APPALACHIA, 2011 ............................................... 23 FIGURE 12 – COUNTY HCC COMPONENT IN THE U.S., 2011 .......................................................................................................... 24 FIGURE 13 – COUNTY HEALTH CARE COST (HCC) COMPONENT IN APPALACHIA, 2011 ........................................................................ 25 FIGURE 14 - COUNTY HIC COMPONENT IN THE U.S., 2011 ............................................................................................................ 26 FIGURE 15 – COUNTY HEALTH INSURANCE COVERAGE (HIC) COMPONENT IN APPALACHIA, 2011 ......................................................... 27 FIGURE 16 - COUNTY HCRA COMPONENT IN THE U.S., 2011 ......................................................................................................... 28 FIGURE 17 - COUNTY HEALTH CARE RESOURCE AVAILABILITY (HCRA) COMPONENT IN APPALACHIA, 2011 ............................................. 29 FIGURE 18 - DISTRIBUTION OF COUNTIES IN ARC STATES BY INDEX AND COMPONENT (N=1070 COUNTIES) ............................................ 30 FIGURE 19 - DISTRIBUTION OF ARC COUNTIES BY INDEX AND COMPONENT (N=420) .......................................................................... 30 FIGURE 20 - HCCA INDEX OF COUNTIES IN APPALACHIAN STATES .................................................................................................... 32 FIGURE 21 - HCC PERCENTILE DISTRIBUTION OF COUNTIES IN THE APPALACHIAN STATES ..................................................................... 33 FIGURE 22 – HIC DISTRIBUTION OF COUNTIES IN APPALACHIAN STATES ............................................................................................ 34 FIGURE 23 - HCRA DISTRIBUTION OF COUNTIES IN APPALACHIAN STATES ......................................................................................... 35 FIGURE 24 – COMPARISON OF HCCA PERCENTILE RANKING TO DISTRESS LEVEL FOR ALL COUNTIES IN U.S. ............................................. 36 FIGURE 25 – COMPARISON OF HCCA PERCENTILE RANKING TO DISTRESS LEVEL FOR ALL COUNTIES IN APPALACHIAN STATES ...................... 37 FIGURE 26 - COMPARISON OF HCCA PERCENTILE RANKING TO DISTRESS LEVEL FOR APPALACHIAN COUNTIES .......................................... 38 FIGURE 27 – COUNTY PERCENTILE OF CHILDREN UNDER 18 INSURED BY MEDICAID / CHIP IN THE U.S., 2009 ......................................... 40 FIGURE 28 – COUNTY PERCENTILE RANK OF PERCENT CHILDREN UNDER 18 INSURED BY MEDICAID / CHILDREN’S HEALTH INSURANCE
PROGRAM (CHIP) IN APPALACHIA, 2009 .................................................................................................................. 41 FIGURE 29 – COUNTY PERCENTILE OF CHILDREN UNDER 20 INSURED IN THE U.S., 2007 ...................................................................... 42 FIGURE 30 - COUNTY PERCENTILE RANK OF PERCENT OF CHILDREN UNDER 20 INSURED IN APPALACHIA, 2009 ......................................... 43 FIGURE 31 - COUNTY MEDICARE DISABILITY ENROLLMENT IN THE U.S., 2007 .................................................................................... 44 FIGURE 32 - COUNTY PERCENTILE RANK OF PERCENT MEDICARE DISABILITY ENROLLMENT IN APPALACHIA, 2007 ..................................... 45 FIGURE 33 – COUNTY YEARS OF PREVENTABLE POTENTIAL LIFE LOST UNDER AGE 75 IN THE U.S., 2007 ................................................ 46
Health Care Costs and Access Disparities in Appalachia
PDA, Inc. & Cecil. G. Sheps Center/UNC-Chapel Hill
xii ARC Contract No.: CO-16835-2010
FIGURE 34 – COUNTY PERCENTILE RANK OF YEARS OF PREVENTABLE POTENTIAL LIFE LOST PER 100,000 POPULATION UNDER AGE 75 IN APPALACHIA, 2005-2007 ...................................................................................................................................... 47
FIGURE 35 – COMPARISON OF ESTIMATED PREVENTABLE MORTALITY IN 2005-2007 ......................................................................... 48 FIGURE 36 – COUNTY VETERAN USE OF VHA SERVICES IN THE U.S., 2009 ........................................................................................ 50 FIGURE 37 – COUNTY VETERAN USE OF VETERANS HEALTH ADMINISTRATION (VHA) SERVICES IN APPALACHIA, 2009 .............................. 51 FIGURE 38 – PERCENTILE DISTRIBUTION OF UNIQUE USERS AS A PERCENTAGE OF VA ELIGIBLES, APPALACHIAN COUNTIES, 2009 ................ 52 FIGURE 39 –UNIQUE USERS AS A PERCENTAGE OF VA ELIGIBLES, APPALACHIAN COUNTIES, 2009 ......................................................... 52 FIGURE 40 – PERSISTENT POVERTY COUNTIES, 1970-2000 ............................................................................................................ 60 FIGURE 41 – 2009 NATIONAL HEALTHCARE EXPENDITURES ............................................................................................................ 66 FIGURE 42 - PRICE-ADJUSTED MEDICARE EXPENDITURES PER BENEFICIARY BY HOSPITAL, 2008 ............................................................. 71 FIGURE 3 – COUNTY CMS HOSPITAL GEOGRAPHIC WAGE INDEX ADJUSTED FOR GAF IN THE U.S., 2011 ............................................... 74 FIGURE 4 – COUNTY PERCENTILE RANK OF CMS HOSPITAL GEOGRAPHIC WAGE INDEX IN APPALACHIA, 2011 ......................................... 75 FIGURE 45 – APPALACHIAN REGION UNINSURED BY AGE GROUP, 2009 ............................................................................................ 83 FIGURE 46 - MEDICALLY UNDERSERVED AREAS & POPULATIONS IN THE UNITED STATES ..................................................................... 109 FIGURE 47 - CORE BASED STATISTICAL AREAS PER OMB .............................................................................................................. 133 FIGURE 48 - SCATTER PLOT REGRESSION MODEL: PREDICTIVE VALUE OF YPLL_75 BY ARC_EDI AND HCCA INDEX FOR ALL COUNTIES IN
THE U.S. (N=3007 COUNTIES) .............................................................................................................................. 156 FIGURE 49 - SCATTERPLOT OF REGRESSION MODEL: PREDICTIVE VALUE OF YPLL_75 BY ARC_EDI AND HCCA INDEX, FOR ALL COUNTIES
IN THE 13 APPALACHIAN STATES (N=1069 COUNTIES) .............................................................................................. 157 FIGURE 50 - REGRESSION MODEL: PREDICTIVE VALUE OF YPLL_75 BY ARC_EDI AND HCCA INDEX FOR ALL COUNTIES IN THE
APPALACHIAN REGION (N=419 COUNTIES) .............................................................................................................. 158 FIGURE 51 - REGRESSION MODEL: YPLL_75 BY PERSISTENT POVERTY OF THE COUNTY AND HCCA INDEX, FOR ALL COUNTIES IN THE
U.S. (N=3007 COUNTIES) .................................................................................................................................... 163 FIGURE 52 - REGRESSION MODEL: YPLL_75 BY PERSISTENT POVERTY OF THE COUNTY AND HCCA INDEX FOR ALL COUNTIES IN THE 13
APPALACHIAN STATES (N=1069 COUNTIES) ............................................................................................................. 164 FIGURE 53 - REGRESSION MODEL: YPLL_75 BY PERSISTENT POVERTY OF THE COUNTY AND HCCA, FOR ALL COUNTIES IN THE
APPALACHIAN REGION (N=419 COUNTIES) .............................................................................................................. 165 FIGURE 54 - LOGRITHMIC TRANFORMATION OF YEARS OF POTENTIAL LIFE LOST PER 10,000 POPULATION UNDER AGE 75 ...................... 169 FIGURE 55 - COMPARISON OF ESTIMATED PREVENTABLE MORTALITY RATES IN 2005-2007 ............................................................... 170 FIGURE 56 - CORRESPONDENCE BETWEEN ARC_EDI AND YPLL_75 PER 10,000 POPULATION IN ALL U.S. COUNTIES, 2005-2007 ......... 171 FIGURE 57 - CORRESPONDENCE BETWEEN HCCA INDEX AND YPLL_75, ALL U.S. COUNTIES, 2005-2007 ........................................... 172 FIGURE 58 – YPLL_75, ALL U.S. COUNTIES, 2005-2007 – ARRAYED BY ARC_EDI (5LEVELS) AND HCCA INDEX ................................. 173 FIGURE 59 – YPLL_75, ALL U.S. COUNTIES, 2005-2007 – ARRAYED BY ARC_EDI (3LEVELS) AND HCCA INDEX ................................. 174 FIGURE 60 – YPLL_75, APPALACHIAN COUNTIES, 2005-2007 – ARRAYED BY ARC_EDI (3LEVELS) AND HCCA INDEX .......................... 175 FIGURE 61 –YPLL_75, APPALACHIAN COUNTIES, 2005-2007ARRAYED BY ARC_EDI (3 LEVELS) AND HCC COMPONENT ...................... 176 FIGURE 62– YPLL_75, APPALACHIAN COUNTIES, 2005-2007 ARRAYED BY ARC_EDI (3 LEVELS) AND HIC COMPONENT ....................... 177 FIGURE 63 – YPLL_75, APPALACHIAN COUNTIES, 2005-2007 ARRAYED BY ARC_EDI (3 LEVELS) AND HCRA COMPONENT ................... 178 FIGURE 64 – COUNTY ECONOMIC STATUS IN APPALACHIA, FY 2012 .............................................................................................. 179
PDA, Inc. & Cecil. G. Sheps Center/UNC-Chapel Hill ARC Contract No.: CO-16835-2010 xiii
LIST OF TABLES
TABLE 1 - HEALTHCARE COST, COVERAGE AND ACCESS INDEX COMPONENTS ..................................................................................... XV
TABLE 2- CORRELATION OF HCCA AND ITS COMPONENTS, THE ARC ECONOMIC DISTRESS INDEX, AND MEDICARE DISABILITY ENROLLMENT WITH PREMATURE MORTALITY ................................................................................................................................... XIX
TABLE 3 – HCRA INPUT DATABASE ............................................................................................................................................ 18
TABLE 4 - HEALTHCARE COST, COVERAGE AND ACCESS (HCCA) INDEX CALCULATION .......................................................................... 19
TABLE 5 – HEALTH CARE COSTS (HCC) COMPONENT CALCULATION.................................................................................................. 19
TABLE 6 - HEALTH INSURANCE COVERAGE (HIC) COMPONENT CALCULATION ..................................................................................... 19
TABLE 7 – HEALTH CARE RESOURCE AVAILABILITY (HCRA) COMPONENT CALCULATION ....................................................................... 20
TABLE 8 - RAW VALUES FOR HCCA AND SUBCOMPONENTS – ALL U.S. COUNTIES (N=3110 COUNTIES) ................................................. 31
TABLE 9 - RAW VALUES FOR HCCA AND SUBCOMPONENTS –APPALACHIAN STATES (N=1070 COUNTIES) .............................................. 31
TABLE 10 - RAW VALUES FOR HCCA AND SUBCOMPONENTS – APPALACHIAN COUNTIES (N=420 COUNTIES) .......................................... 31
TABLE 11 – COUNT OF ARC COUNTIES BY HCCA PERCENTILE GROUP ............................................................................................... 32
TABLE 12 – COUNT OF ARC COUNTIES BY HCC PERCENTILE GROUP ................................................................................................. 33
TABLE 13 – COUNT OF ARC COUNTIES BY HIC PERCENTILE GROUP .................................................................................................. 34
TABLE 14 – COUNT OF ARC COUNTIES BY HCRA PERCENTILE GROUPS ............................................................................................. 35
TABLE 15 – NATIONAL EXPENDITURES HCCA BY ARC ECONOMIC DISTRESS INDEX 2011 (N=3110) ...................................................... 36
TABLE 16 – APPALACHIAN STATES HCCA BY ARC ECONOMIC DISTRESS INDEX (N=1070 COUNTIES) ...................................................... 37
TABLE 17 – APPALACHIAN COUNTIES HCCA BY ARC ECONOMIC DISTRESS INDEX (N=420 COUNTIES) .................................................... 38
TABLE 18 – INDEPENDENT MEASURES CALCULATION ..................................................................................................................... 39
TABLE 19 - CORRELATIONS BETWEEN MEASURES OF HEALTH STATUS, ECONOMIC DISTRESS, AND PROPOSED HCCA AND ITS COMPONENTS, FOR ALL COUNTIES IN THE U.S. (N=3110 COUNTIES)* .................................................................................................. 57
TABLE 20 - CORRELATIONS BETWEEN MEASURES OF HEALTH STATUS, ECONOMIC DISTRESS, AND PROPOSED HCCA INDEX AND ITS COMPONENTS, FOR ALL COUNTIES IN THE 13 APPALACHIAN STATES (N=1070 COUNTIES)* .................................................. 57
TABLE 21 - CORRELATIONS BETWEEN MEASURES OF HEALTH STATUS, ECONOMIC DISTRESS, AND PROPOSED HCCA INDEX AND ITS COMPONENTS, FOR ALL COUNTIES IN THE APPALACHIAN REGION (N=420COUNTIES)* ........................................................ 58
TABLE 22 – ACA IMPACT ON APPALACHIAN STATE MEDICAID ENROLLMENT AND SPENDING ................................................................. 78
TABLE 23 – APPALACHIAN STATES SHARE OF U.S. POPULATION AND U.S. MEDICAID ENROLLMENT ....................................................... 79
TABLE 24 – FEDERAL MATCHING PERCENTAGE (FMAP) FOR MEDICAID IN APPALACHIAN STATES .......................................................... 79
TABLE 25 – MEDICAID ENROLLMENT AND SPENDING IN APPALACHIAN STATES, 2009 .......................................................................... 80
TABLE 26 - SUMMARY OF MEDICAID EXPANSION EFFECT ON STATE BUDGETS ..................................................................................... 88
TABLE 27- CMS WAGE INDEX APPROVED FOR USE IN 2010 MEDICARE PAYMENTS .......................................................................... 105
TABLE 28 - FEDERAL ASSISTANCE PERCENTAGES AND ENHANCED FEDERAL MEDICAL ASSISTANCE PERCENTAGES ..................................... 111
TABLE 29- PROJECTED NATIONAL HEALTH EXPENDITURES: THE ESTIMATED IMPACT OF REFORM - AGGREGATE AMOUNTS ....................... 113
TABLE 30 – MEDICAID ECONOMIC IMPACT FOR ARC STATES ........................................................................................................ 115
Health Care Costs and Access Disparities in Appalachia
PDA, Inc. & Cecil. G. Sheps Center/UNC-Chapel Hill
xiv ARC Contract No.: CO-16835-2010
TABLE 31 - NATIONAL AND STATE-BY-STATE RESULTS FOR ADULTS AT OR BELOW 133 PERCENT FPL (STANDARD PARTICIPATION SCENARIO) 119
TABLE 32 - NATIONAL AND STATE-BY-STATE RESULTS FOR ADULTS AT OR BELOW 133 PERCENT FPL .................................................... 121
TABLE 33 - APPALACHIAN STATE HEALTH CARE SPENDING BY STATE OF RESIDENCE RANK ORDERED* ................................................... 132
TABLE 34 - NUMBER AND PERCENT OF COUNTIES WITHOUT PHYSICIANS, 2008 (U.S. AND ARC COUNTIES) .......................................... 140
TABLE 35 - MEAN VALUES OF PHYSICIANS TO POPULATION RATIOS OF VARIOUS TYPES ...................................................................... 141
TABLE 36 - PHYSICIANS PER 100,000 POPULATION, APPALACHIAN AND NON-APPALACHIAN COUNTIES, ARRAYED BY PERCENTILE ............. 142
TABLE 37 - HEALTH INSURANCE ACCESS COMPONENT CONSTRUCTION ............................................................................................ 144
TABLE 38 - SUMMARY OF SUBCOMPONENT INDICES..................................................................................................................... 146
TABLE 39 – HCC COMPONENT CONSTRUCTION AND FOR CONSTRUCTING THE FINAL HCCA INDEX INDICATOR ....................................... 147
TABLE 40 - STEPS IN HIC COMPONENT CONSTRUCTION ................................................................................................................ 148
TABLE 41 - STEPS IN HCRA COMPONENT CONSTRUCTION ............................................................................................................ 149
TABLE 42 – SAHIE EXTRACTED DATA FROM ARF ........................................................................................................................ 151
TABLE 43 – UNIQUE USERS AS A PERCENTAGE OF VA ELIGIBLE’S BY NATIONAL PERCENTILE GROUP ...................................................... 153
TABLE 44 – UNIQUE USERS AS A PERCENTAGE OF VA ELIGIBLE’S .................................................................................................... 153
TABLE 45 - REGRESSION MODEL: PREDICTIVE VALUE OF YEARS OF POTENTIAL LIFE LOST_751 BY ARC ECONOMIC DISTRESS INDEX AND HCCA, FOR ALL COUNTIES IN THE U.S. (N=3007 COUNTIES) ........................................................................................ 156
TABLE 46 - REGRESSION MODEL: PREDICTIVE VALUE OF YPLL_751 BY ARC_EDI AND HCCA INDEX FOR ALL COUNTIES IN THE 13 APPALACHIAN STATES (N=1069 COUNTIES) ............................................................................................................ 157
TABLE 47 - REGRESSION MODEL: PREDICTIVE VALUE OF YPLL_751 BY ARC_EDI AND HCCA INDEX FOR ALL COUNTIES IN THE APPALACHIAN REGION (N=419 COUNTIES) ............................................................................................................... 158
TABLE 48 - REGRESSION MODEL: YPLL_751 BY ARC_EDI AND COMPONENTS OF HCCA INDEX FOR ALL COUNTIES IN THE U.S. (N=3007 COUNTIES) ............................................................................................................................................. 160
TABLE 49 - REGRESSION MODEL: YPLL_751 BY ARC_EDI AND COMPONENTS OF HCCA INDEX FOR ALL COUNTIES IN THE 13 APPALACHIAN STATES (N=1069 COUNTIES) .............................................................................................................. 161
TABLE 50 - REGRESSION MODEL: YPLL_751 BY ARC_EDI AND COMPONENTS OF HCCA INDEX FOR ALL COUNTIES IN THE APPALACHIAN REGION (N=419 COUNTIES) ............................................................................................................... 162
TABLE 51 - REGRESSION MODEL: YPLL_751 BY PERSISTENT POVERTY OF THE COUNTY AND HCCA INDEX, FOR ALL COUNTIES IN THE U.S. (N=3007 COUNTIES) ...................................................................................................................................... 163
TABLE 52 - REGRESSION MODEL: YPLL_751 PERSISTENT POVERTY OF THE COUNTY AND HCCA INDEX FOR .......................................... 164
TABLE 53 - REGRESSION MODEL: YPLL_751 BY PERSISTENT POVERTY OF THE COUNTY AND HCCA FOR ALL COUNTIES IN THE APPALACHIAN REGION (N=419 COUNTIES) ............................................................................................................... 165
TABLE 54 - REGRESSION MODEL: YPLL_751 BY PERSISTENT POVERTY OF THE COUNTY AND COMPONENTS OF HCCA INDEX FOR ALL COUNTIES IN THE U.S. (N=3007 COUNTIES) ........................................................................................................ 166
TABLE 55 - REGRESSION MODEL: YPLL_751 BY PERSISTENT POVERTY OF THE COUNTY AND COMPONENTS OF HCCA INDEX FOR ALL COUNTIES IN THE 13 APPALACHIAN STATES (N=1069 COUNTIES) ............................................................................ 167
TABLE 56 - REGRESSION MODEL: YPLL_751 BY PERSISTENT POVERTY OF THE COUNTY AND COMPONENTS OF HCCA INDEX, FOR ALL COUNTIES IN THE APPALACHIAN REGION (N=419 COUNTIES) ........................................................................................ 168
PDA, Inc. & Cecil. G. Sheps Center/UNC-Chapel Hill ARC Contract No.: CO-16835-2010 xv
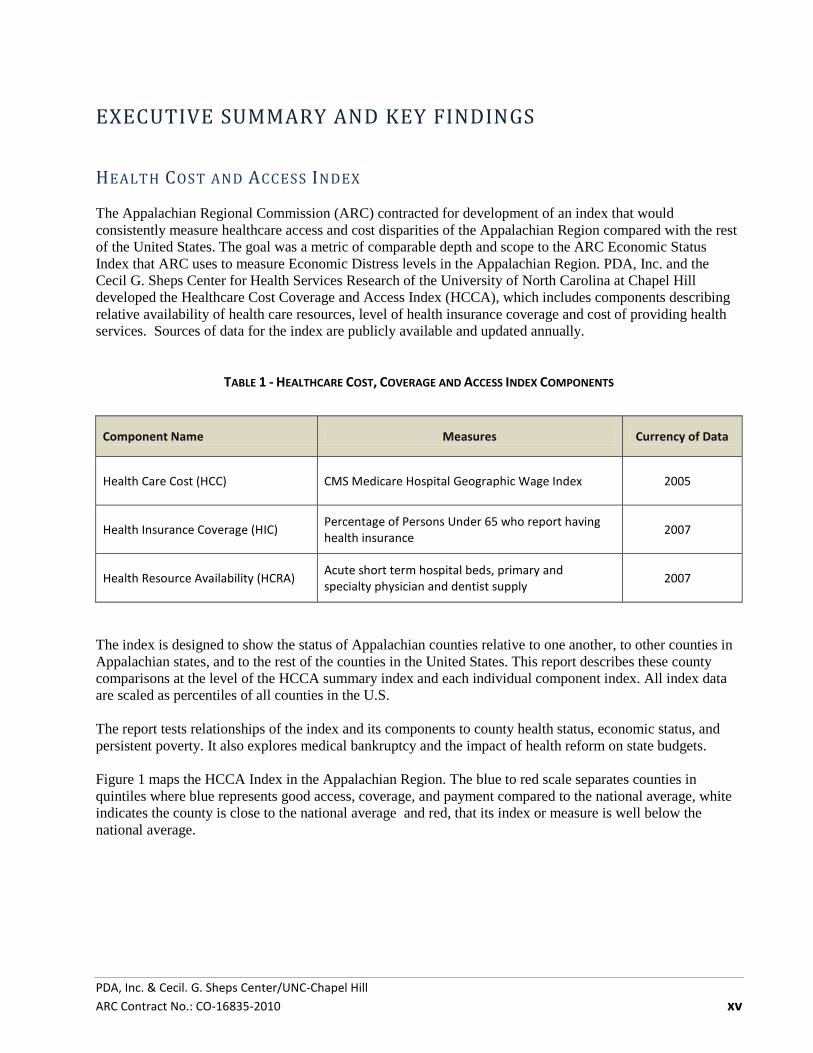
EXECUTIVE SUMMARY AND KEY FINDINGS HEALTH COST AND ACCESS INDEX The Appalachian Regional Commission (ARC) contracted for development of an index that would consistently measure healthcare access and cost disparities of the Appalachian Region compared with the rest of the United States. The goal was a metric of comparable depth and scope to the ARC Economic Status Index that ARC uses to measure Economic Distress levels in the Appalachian Region. PDA, Inc. and the Cecil G. Sheps Center for Health Services Research of the University of North Carolina at Chapel Hill developed the Healthcare Cost Coverage and Access Index (HCCA), which includes components describing relative availability of health care resources, level of health insurance coverage and cost of providing health services. Sources of data for the index are publicly available and updated annually.
TABLE 1 - HEALTHCARE COST, COVERAGE AND ACCESS INDEX COMPONENTS
Component Name Measures Currency of Data
Health Care Cost (HCC) CMS Medicare Hospital Geographic Wage Index 2005
Health Insurance Coverage (HIC) Percentage of Persons Under 65 who report having health insurance 2007
Health Resource Availability (HCRA) Acute short term hospital beds, primary and specialty physician and dentist supply 2007
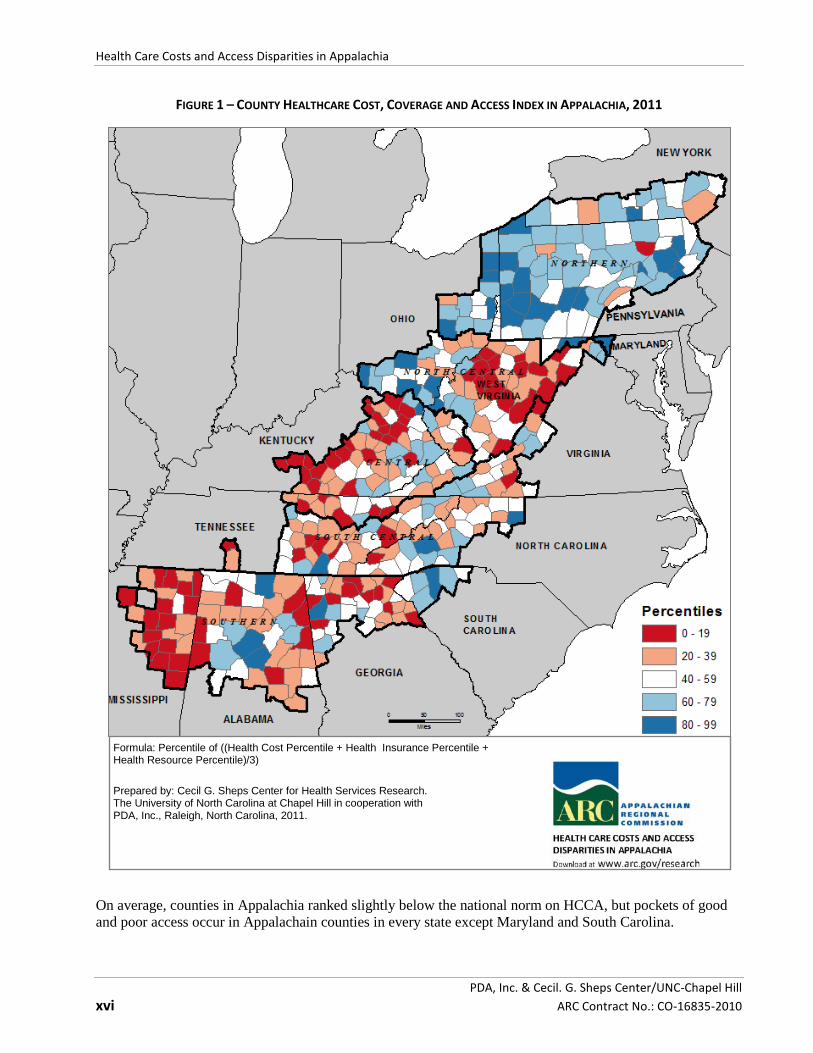
The index is designed to show the status of Appalachian counties relative to one another, to other counties in Appalachian states, and to the rest of the counties in the United States. This report describes these county comparisons at the level of the HCCA summary index and each individual component index. All index data are scaled as percentiles of all counties in the U.S. The report tests relationships of the index and its components to county health status, economic status, and persistent poverty. It also explores medical bankruptcy and the impact of health reform on state budgets. Figure 1 maps the HCCA Index in the Appalachian Region. The blue to red scale separates counties in quintiles where blue represents good access, coverage, and payment compared to the national average, white indicates the county is close to the national average and red, that its index or measure is well below the national average.
Health Care Costs and Access Disparities in Appalachia
PDA, Inc. & Cecil. G. Sheps Center/UNC-Chapel Hill
xvi ARC Contract No.: CO-16835-2010
FIGURE 1 – COUNTY HEALTHCARE COST, COVERAGE AND ACCESS INDEX IN APPALACHIA, 2011
On average, counties in Appalachia ranked slightly below the national norm on HCCA, but pockets of good and poor access occur in Appalachain counties in every state except Maryland and South Carolina.
Formula: Percentile of ((Health Cost Percentile + Health Insurance Percentile + Health Resource Percentile)/3)
Prepared by: Cecil G. Sheps Center for Health Services Research. The University of North Carolina at Chapel Hill in cooperation with PDA, Inc., Raleigh, North Carolina, 2011.
Executive Summary and Key Findings
PDA, Inc. & Cecil. G. Sheps Center/UNC-Chapel Hill ARC Contract No.: CO-16835-2010 xvii
KEY FINDINGS HEA LT HCAR E CO ST, CO V ER A GE, AND ACC ES S INDE X
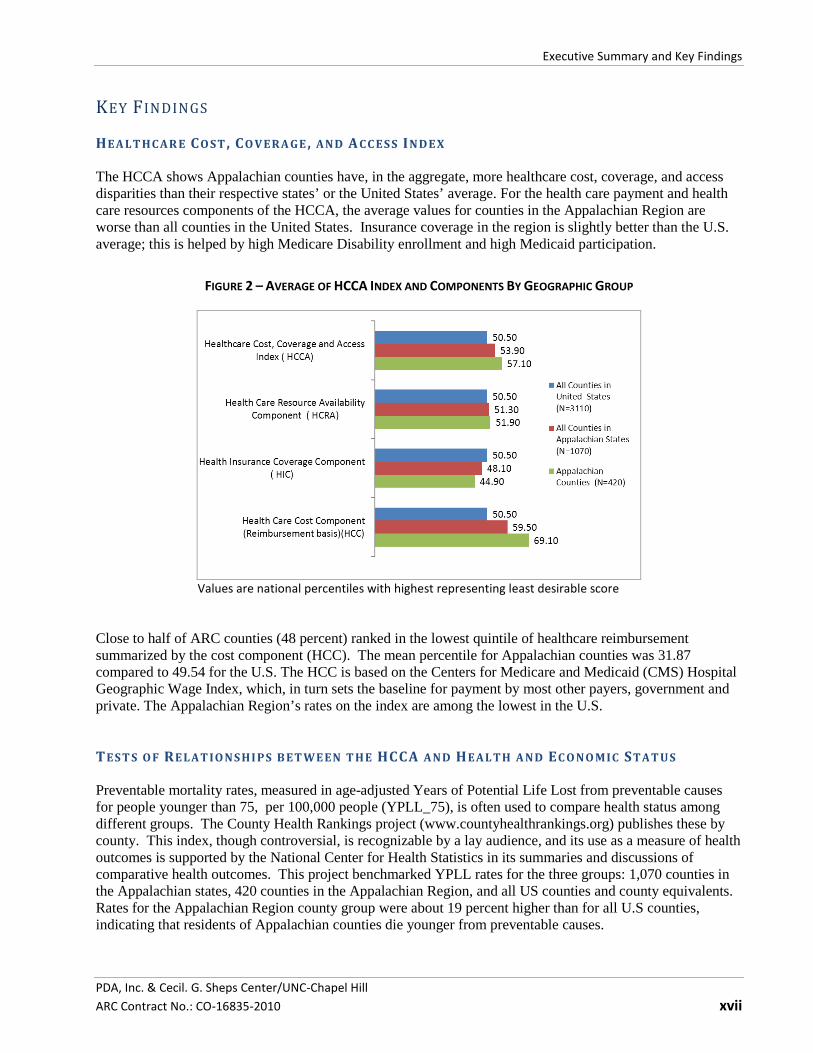
The HCCA shows Appalachian counties have, in the aggregate, more healthcare cost, coverage, and access disparities than their respective states’ or the United States’ average. For the health care payment and health care resources components of the HCCA, the average values for counties in the Appalachian Region are worse than all counties in the United States. Insurance coverage in the region is slightly better than the U.S. average; this is helped by high Medicare Disability enrollment and high Medicaid participation.
FIGURE 2 – AVERAGE OF HCCA INDEX AND COMPONENTS BY GEOGRAPHIC GROUP
Values are national percentiles with highest representing least desirable score
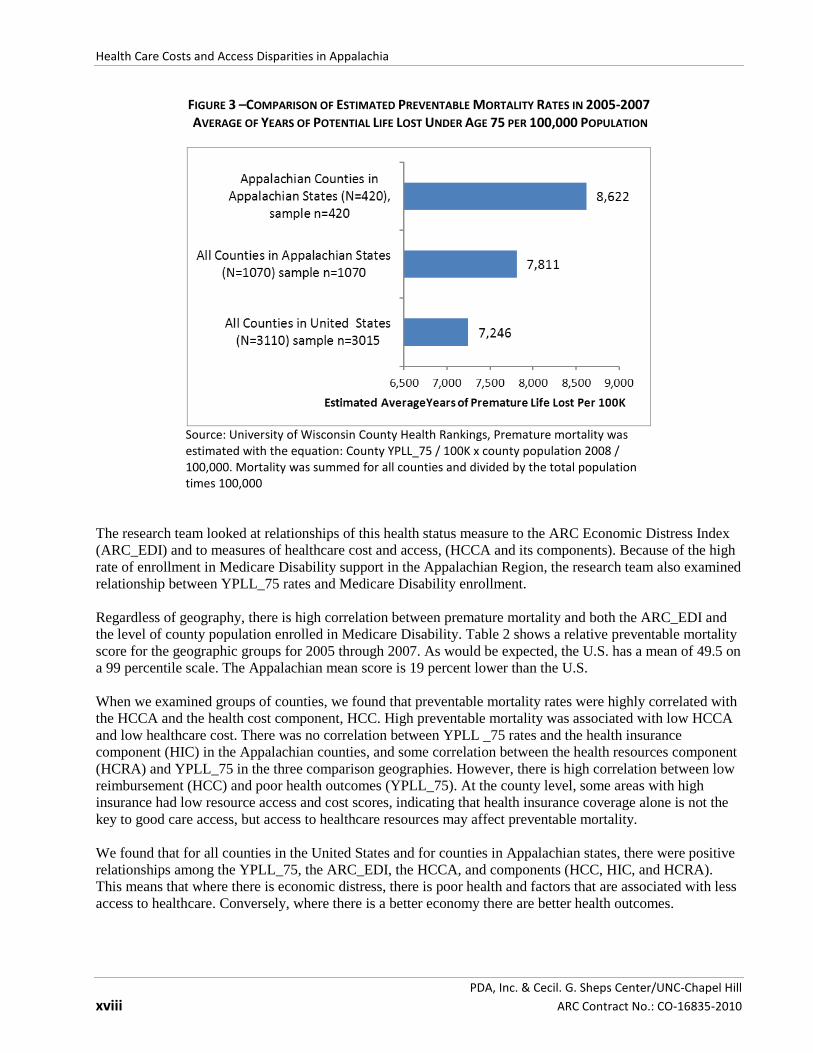
Close to half of ARC counties (48 percent) ranked in the lowest quintile of healthcare reimbursement summarized by the cost component (HCC). The mean percentile for Appalachian counties was 31.87 compared to 49.54 for the U.S. The HCC is based on the Centers for Medicare and Medicaid (CMS) Hospital Geographic Wage Index, which, in turn sets the baseline for payment by most other payers, government and private. The Appalachian Region’s rates on the index are among the lowest in the U.S. TES T S O F RE LAT IO NS HI PS B ET WE EN T HE HCCA AND HEAL TH A ND EC O NO MIC STAT U S Preventable mortality rates, measured in age-adjusted Years of Potential Life Lost from preventable causes for people younger than 75, per 100,000 people (YPLL_75), is often used to compare health status among different groups. The County Health Rankings project (www.countyhealthrankings.org) publishes these by county. This index, though controversial, is recognizable by a lay audience, and its use as a measure of health outcomes is supported by the National Center for Health Statistics in its summaries and discussions of comparative health outcomes. This project benchmarked YPLL rates for the three groups: 1,070 counties in the Appalachian states, 420 counties in the Appalachian Region, and all US counties and county equivalents. Rates for the Appalachian Region county group were about 19 percent higher than for all U.S counties, indicating that residents of Appalachian counties die younger from preventable causes.
Health Care Costs and Access Disparities in Appalachia
PDA, Inc. & Cecil. G. Sheps Center/UNC-Chapel Hill
xviii ARC Contract No.: CO-16835-2010
FIGURE 3 –COMPARISON OF ESTIMATED PREVENTABLE MORTALITY RATES IN 2005-2007 AVERAGE OF YEARS OF POTENTIAL LIFE LOST UNDER AGE 75 PER 100,000 POPULATION
Source: University of Wisconsin County Health Rankings, Premature mortality was estimated with the equation: County YPLL_75 / 100K x county population 2008 / 100,000. Mortality was summed for all counties and divided by the total population times 100,000
The research team looked at relationships of this health status measure to the ARC Economic Distress Index (ARC_EDI) and to measures of healthcare cost and access, (HCCA and its components). Because of the high rate of enrollment in Medicare Disability support in the Appalachian Region, the research team also examined relationship between YPLL_75 rates and Medicare Disability enrollment. Regardless of geography, there is high correlation between premature mortality and both the ARC_EDI and the level of county population enrolled in Medicare Disability. Table 2 shows a relative preventable mortality score for the geographic groups for 2005 through 2007. As would be expected, the U.S. has a mean of 49.5 on a 99 percentile scale. The Appalachian mean score is 19 percent lower than the U.S. When we examined groups of counties, we found that preventable mortality rates were highly correlated with the HCCA and the health cost component, HCC. High preventable mortality was associated with low HCCA and low healthcare cost. There was no correlation between YPLL _75 rates and the health insurance component (HIC) in the Appalachian counties, and some correlation between the health resources component (HCRA) and YPLL_75 in the three comparison geographies. However, there is high correlation between low reimbursement (HCC) and poor health outcomes (YPLL_75). At the county level, some areas with high insurance had low resource access and cost scores, indicating that health insurance coverage alone is not the key to good care access, but access to healthcare resources may affect preventable mortality. We found that for all counties in the United States and for counties in Appalachian states, there were positive relationships among the YPLL_75, the ARC_EDI, the HCCA, and components (HCC, HIC, and HCRA). This means that where there is economic distress, there is poor health and factors that are associated with less access to healthcare. Conversely, where there is a better economy there are better health outcomes.
Executive Summary and Key Findings
PDA, Inc. & Cecil. G. Sheps Center/UNC-Chapel Hill ARC Contract No.: CO-16835-2010 xix
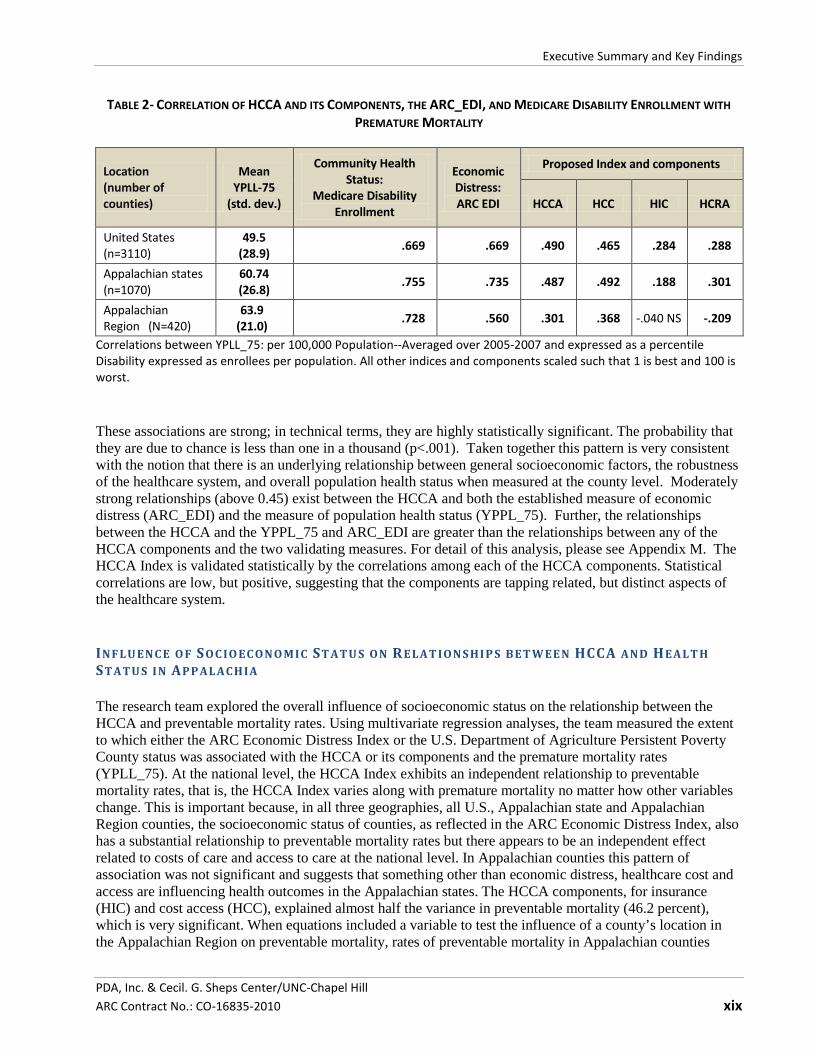
TABLE 2- CORRELATION OF HCCA AND ITS COMPONENTS, THE ARC_EDI, AND MEDICARE DISABILITY ENROLLMENT WITH PREMATURE MORTALITY
Location (number of counties)
Mean YPLL-75
(std. dev.)
Community Health Status:
Medicare Disability Enrollment
Economic Distress: ARC EDI
Proposed Index and components
HCCA HCC HIC HCRA
United States (n=3110)
49.5 (28.9) .669 .669 .490 .465 .284 .288
Appalachian states (n=1070)
60.74 (26.8) .755 .735 .487 .492 .188 .301
Appalachian Region (N=420)
63.9 (21.0) .728 .560 .301 .368 -.040 NS -.209
Correlations between YPLL_75: per 100,000 Population--Averaged over 2005-2007 and expressed as a percentile Disability expressed as enrollees per population. All other indices and components scaled such that 1 is best and 100 is worst. These associations are strong; in technical terms, they are highly statistically significant. The probability that they are due to chance is less than one in a thousand (p<.001). Taken together this pattern is very consistent with the notion that there is an underlying relationship between general socioeconomic factors, the robustness of the healthcare system, and overall population health status when measured at the county level. Moderately strong relationships (above 0.45) exist between the HCCA and both the established measure of economic distress (ARC_EDI) and the measure of population health status (YPPL_75). Further, the relationships between the HCCA and the YPPL_75 and ARC_EDI are greater than the relationships between any of the HCCA components and the two validating measures. For detail of this analysis, please see Appendix M. The HCCA Index is validated statistically by the correlations among each of the HCCA components. Statistical correlations are low, but positive, suggesting that the components are tapping related, but distinct aspects of the healthcare system. INF LU ENC E O F SOC IO EC ONO M IC ST ATU S ON RE LAT ION S HI P S BET W EE N HCCA AND HEA LT H STATU S I N APP AL ACH IA The research team explored the overall influence of socioeconomic status on the relationship between the HCCA and preventable mortality rates. Using multivariate regression analyses, the team measured the extent to which either the ARC Economic Distress Index or the U.S. Department of Agriculture Persistent Poverty County status was associated with the HCCA or its components and the premature mortality rates (YPLL_75). At the national level, the HCCA Index exhibits an independent relationship to preventable mortality rates, that is, the HCCA Index varies along with premature mortality no matter how other variables change. This is important because, in all three geographies, all U.S., Appalachian state and Appalachian Region counties, the socioeconomic status of counties, as reflected in the ARC Economic Distress Index, also has a substantial relationship to preventable mortality rates but there appears to be an independent effect related to costs of care and access to care at the national level. In Appalachian counties this pattern of association was not significant and suggests that something other than economic distress, healthcare cost and access are influencing health outcomes in the Appalachian states. The HCCA components, for insurance (HIC) and cost access (HCC), explained almost half the variance in preventable mortality (46.2 percent), which is very significant. When equations included a variable to test the influence of a county’s location in the Appalachian Region on preventable mortality, rates of preventable mortality in Appalachian counties
Health Care Costs and Access Disparities in Appalachia
PDA, Inc. & Cecil. G. Sheps Center/UNC-Chapel Hill
xx ARC Contract No.: CO-16835-2010
compared to other counties in Appalachian states were higher than would be predicted on the basis of their scores on ARC_EDI and HCCA alone, suggesting that there may be another factor beyond the combined impact of socioeconomic status and health system characteristics access, cost and coverage, that accounts for variations in preventable mortality in Appalachia. OTHER HE AL THC AR E USE MEA SU R ES The study also reviewed other measures of healthcare use and expenditures in the Appalachian Region as reported by the CMS and the Veterans Health Administration (VHA). Most of the Appalachian Region had high Medicare expenditures per capita in 2009. This may be affected by a combination of the region’s particularly high per capita enrollment in Medicare Disability programs and its lower health status. Parts of Central and Southern Appalachia rank in the highest national quintile of per capita enrollment in Medicare Disability in 2007, and Disability enrollees are heavy healthcare users. In central and southern Appalachia, as much as 15.6 percent of the population received Medicare Disability payments. Information from 2007 VHA use files showed military veterans in the Appalachian Region, particularly the central sub-region and western Pennsylvania were among the highest users of VHA services in the U.S. The research team also reviewed the scientific literature on relationships between personal healthcare expenditures and bankruptcy, finding that healthcare costs are associated with bankruptcy, though the extent is not clear. Several studies noted that social policy design flaws in many government safety net health insurance programs not only discourage individual economic pursuits; they also leave many people at risk of bankruptcy from expensive, uncovered medical care costs if they are not treated in clinics and hospitals with safety net programs.
HEALTH REFORM POLICY ISSUES Health reform will change health insurance coverage and the structure of the healthcare delivery system. Among the issues under study is the CMS Medicare Hospital Geographic Wage Index, the HCC component of the HCCA. This index establishes a baseline rate for 60 percent of Medicare payments and, by reference, for other payers as well. Presently the average county in the Appalachian Region receives lower payments than the U.S. average. Moreover, in general, Appalachian counties have not benefited as much from the work-arounds that have helped other rural communities to side-step low rates. A “Frontier” adjustment, for example, brings communities in several states in the west to the lower of their own or the national average index. ARC may wish to consider advocacy to give rural Appalachian counties parity with Frontier counties when policy makers consider adjustments to the index. Federal health reform will increase insurance coverage. A review of the scientific and policy literature indicates that the Affordable Care Act’s coverage initiatives will have a direct impact on state Medicaid budgets. Most reports indicate that Appalachian states’ total Medicaid costs will increase, although the amounts are a function of a state’s current coverage policies. Individual Appalachian states may see costs increase 1.4 to 15.4 percent1 to cover six to 41 percent more people2. This will occur when health reform is fully implemented in 2014. In that year, each state Medicaid program must cover all persons with incomes under 133 percent of the national poverty level. Because HCCA results show low correlation between health insurance coverage and preventable mortality rates, more coverage alone may not result in health status improvements. The study’s demonstrated relationships between payment and resource availability suggest that without payment changes many people with new coverage may have trouble getting service.
1 Table 26 of this report. 2 Table 22 of this report, Kaiser Commission on Medicaid and the Uninsured, on line, 2010.
Executive Summary and Key Findings
PDA, Inc. & Cecil. G. Sheps Center/UNC-Chapel Hill ARC Contract No.: CO-16835-2010 xxi
Health reform initiatives will clearly require more healthcare resources in Appalachia. Two programs championed by ARC, the Rural Health Clinics Act and the J-1 visa waiver program for foreign medical graduates can improve resource availability. For different reasons, both merit renewed attention in the health reform environment. The former addresses payment for primary healthcare providers and the latter addresses supply of healthcare providers to underserved areas. ARC encouragement of broadband communications to rural areas will also help with the technology needed to support contemporary health care delivery, thus expand resource access. Finally, encouragement of expanded roles for entry workers in health care labor force will be similarly beneficial.

Health Care Costs and Access Disparities in Appalachia
PDA, Inc. & Cecil. G. Sheps Center/UNC-Chapel Hill
xxii ARC Contract No.: CO-16835-2010