health and work spotlight on mental health · sources: black, 2008 health and work costs the costs...
TRANSCRIPT

Sources: Adult Psychiatric Morbidity in England, 2007; Health and wellbeing at work: a survey of employees, 2014; Cimpean & Drake 2011; Naylor et al 2012; OECD, 2014; Labour Force Survey, various years
Health and Work Spotlight on Mental Health
Almost
1in6people of working age have a diagnosable mental health condition
long-term sickness absencein England attributed to mental ill health
In 2016,
42.7% employment rate
for those who report mental illness as their main health problem (Mental
illness, phobia, panics, nervous disorders (including depression, bad
nerves or anxiety. Compared to 74% of all population
Each year mental ill-health costs the economy an estimated
£70bnthrough lost productivity, social benefits and health care.
Work can be a cause of stress and common mental health problems: in 2014/159.9m days were lost to
work-related
stress, depression or anxiety
In 2015, some 48% of
Employment and Support Allowance recipientshad a ‘Mental or Behavioural disorder’ as their primary condition
Of people with physical long term conditions,
1in3also have mental illness, most often depression or anxiety
were lost to
stress, depression and anxiety’ in 2014 – an increase of 24% since 2009
Mental health conditions are a leading cause of sickness absence in the UK
19%
£
15mdays
OVER
Sources: Adult Psychiatric Morbidity in England, 2007; Health and wellbeing at work: a survey of employees, 2014; Cimpean & Drake 2011; Naylor et al 2012; OECD, 2014; Labour Force Survey, various years

Sources: Black, 2008
Health and Work Costs
The costs tothe taxpayer
– benefit costs, additional health costs and forgone taxes –
are estimated to be
An unhealthy workforce hurts
the UK's economy and society due to lost productivity, reducing in income tax receipts, increases in long-term
sickness and increased healthcare costs. Better management of employee health
can minimise these costs.
The combined costsof sickness absence, lost productivity through
worklessness, and health-related productivity losses, are estimated to be over
£100bn annuallyThis is greater than the current annual budget for the NHS
and equivalent to the entire GDP of Portugal
Costs
over£60bn
ProductivityCost of
sickness absence and worklessness
Annual budget for NHS
GDP of Portugal
UK PLC
O

Over halfof people with a long
term condition say their
health is a
to the type or amount of workthey can do, rising to over 80%
when someone has threeor more conditions
Sources: Steadman et al, 2016; NHS, 2012; Labour Force Survey, 2012; Vaughan-Jones & Barham, 2009 * Working age population: individuals aged 16 to 64
Health and Work Health of the working age* population
1 in 3 of the working age population in England report having at least one
long-term health condition
Long-term conditionsand limiting long-term conditions are
more prevalent in older people
1 in 7 of the working age population in England report having
more than one long-term condition
Long-term conditions are associated with social class and type of occupation
People in the poorest communities have a 60 per cent higher prevalence of long-term conditions than those in the richest.
Employees from
unskilledoccupations(52%)
experience long-term conditions more than groups from
professional occupations (33%)
In the coming years the
workforce is projected toget older
Average age
By 2030 40% of the working age population will have a
long term condition
General Socio-economic factors Future
16 to 24
15%
45 to 6425 to 44 65 to 74 75 and over
21%
42%
57%
69%
39 4320302016
over 11m people
BARRIER £ £ £
£ +60%

Sources: Adult Psychiatric Morbidity in England, 2007; Health and wellbeing at work: a survey of employees, 2014; Cimpean & Drake 2011; Naylor et al 2012; OECD, 2014; Labour Force Survey, various years
Health and Work Health of UK employees
42%of employees with a healthcondition felt their condition
affected their work ‘a greatdeal’ or ‘to some extent’
Sources: Health and wellbeing at work: a survey of employees, 2014; Labour Force Survey, 2012
1in3of current UKemployees have a
long-termhealth condition
Employees with mental and physical health comorbidity were much
more likely to see their health as affecting work
29%were affected ‘a great deal’compared to
15% of those with a mental health condition only
13%of those with a physical condition onlyand
1in4of UK employeesreported having a
physical health
condition
1in5of those employees with
physical health conditions,
also reported having a mental health condition 1in8
of current employeesreported having a
mental health condition
1in10employees reported having
musculoskeletal conditions
Sources: Adult Psychiatric Morbidity in England, 2007; Health and wellbeing at work: a survey of employees, 2014; Cimpean & Drake 2011; Naylor et al 2012; OECD, 2014; Labour Force Survey, various yearsSources: Health Survey for England, 2013; Health and wellbeing at work: a survey of employees, 2014; Labour Force Survey analyses, various years; Vaughan-Jones & Barham, 2009; Routes onto Employment and Support Allowance, 2011
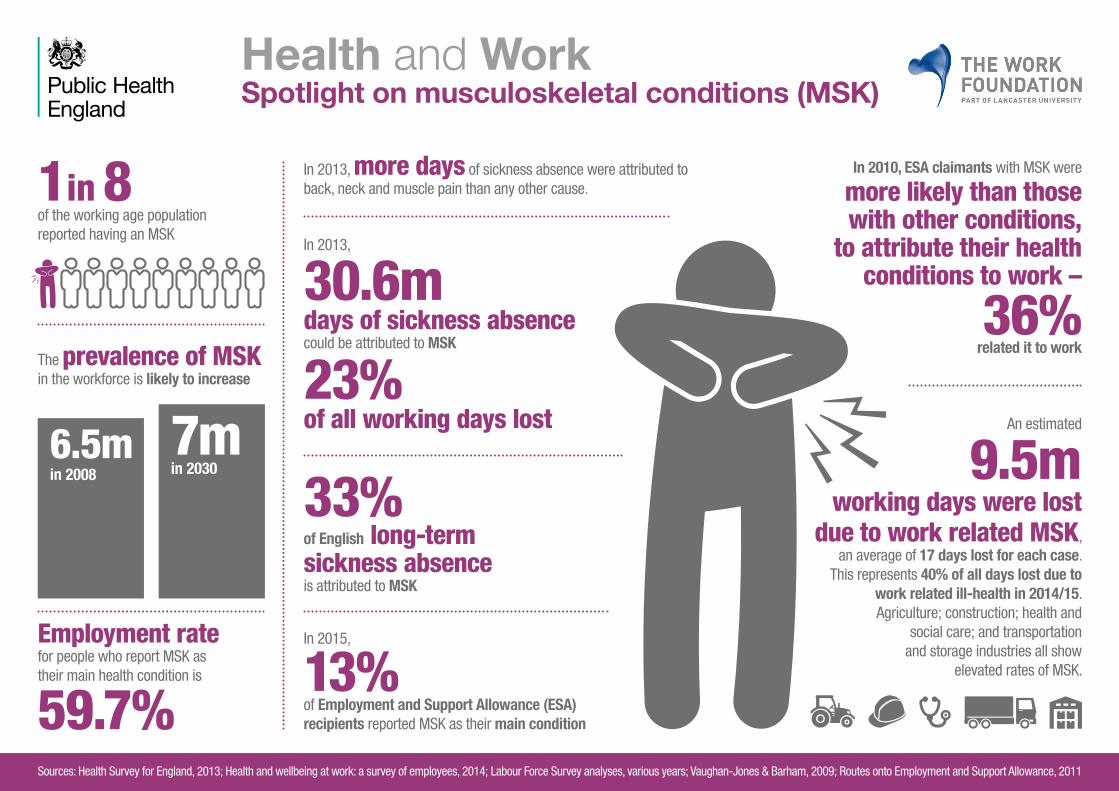
1in 8of the working age population reported having an MSK
Employment rate for people who report MSK as their main health condition is
59.7%
Health and Work Spotlight on musculoskeletal conditions (MSK)
In 2013, more days of sickness absence were attributed to back, neck and muscle pain than any other cause.
In 2013,
30.6mdays of sickness absencecould be attributed to MSK
23%of all working days lost
33%
of English long-term sickness absence is attributed to MSK
An estimated
9.5mworking days were lost
due to work related MSK, an average of 17 days lost for each case.
This represents 40% of all days lost due to work related ill-health in 2014/15.Agriculture; construction; health and
social care; and transportation and storage industries all show
elevated rates of MSK.
In 2015,
13% of Employment and Support Allowance (ESA) recipients reported MSK as their main condition
In 2010, ESA claimants with MSK were
more likely than those with other conditions,
to attribute their health conditions to work –
36%related it to work
The prevalence of MSK in the workforce is likely to increase
6.5min 2008
7min 2030

Sources: Adult Psychiatric Morbidity in England, 2007; Health and wellbeing at work: a survey of employees, 2014; Cimpean & Drake 2011; Naylor et al 2012; OECD, 2014; Labour Force Survey, various years
31m days
Sources: Black & Frost, 2011; Health and wellbeing at work: a survey of employees, 2014; Labour Force Survey, various years; Vaughan-Jones & Barham, 2010; Routes onto Employment and Support Allowance, 2011
Health and Work Managing health at work for employers
131mworking days are lostto sickness absence every year
42% of employees experience at least one period of sickness absence in a year
7% of employees take periods of sickness absence lasting 2 weeks or more
4.4 daysare lost on average for
each workerdue to sickness absence
Main causes for lost working days in 2013
Percentage of hours lost to
sickness in 2013
Private sector
1.8%
Public sector
2.9%
Costs of presenteeism(attending work while ill)are estimated to be
£30bnannually
Employers spend
£9bn each yearon sick pay and associated costs
1in3of employees with a long termhealth condition have
not discussed itwith their employer
52%of employeesreport having access tooccupational health through their work.
39% report having
access toindependent counselling
27m days
15m days
Musculoskeletal conditions
Stress, anxiety or depression
Minor illnesses (coughs and colds)

Sources: Adult Psychiatric Morbidity in England, 2007; Health and wellbeing at work: a survey of employees, 2014; Cimpean & Drake 2011; Naylor et al 2012; OECD, 2014; Labour Force Survey, various years
Health and Work Spotlight on Small Medium Enterprises (SME)
SMEs (between 0 and 249 employees) represent a very large proportion of UK workplaces. In 2015,
99.9%of all UK private sector businesseswere SMEs
95% of people who move from
economic inactivity into work in the private sector start their own business or work for a SME
Sickness absence is lower in smaller
businesses% of working hours lost to sickness,
by number of employees
Similar whenself-reported
% that reported no absence in a year:
61%Employees in
small business (1-49)
56%Large firm employees
They employ 15.6m people, accounting for
60% of private sector employment
Employees in micro businesses(<10 employees) are twice as likely to leave work and move onto Employment Support Allowance without a period of sickness absence than those in larger businesses, suggesting that micro businesses and their
employees can find managing ill-health challenging
Only
21% of employees of small businesses (<50 employees) reporting access to occupational health, and only
12% reporting access to Employee Assistance Programmes
Sources: Department for Business, Innovation and Skills, 2015; Labour Force Survey, various years; Health and wellbeing at work: a survey of employees, 2014; Understanding the journeys from work to Employment and Support Allowance, 2015
2.3%Between 25-500 employees
1.7%< 25
employees

Sources: Adult Psychiatric Morbidity in England, 2007; Health and wellbeing at work: a survey of employees, 2014; Cimpean & Drake 2011; Naylor et al 2012; OECD, 2014; Labour Force Survey, various years
Health and Work Unemployment and economic inactivity
In March 2016, there were
31m peopleaged 16+in work
74%16-64 employment rate
5%unemployment
17%unemployed
9%employed
22%economically inactive
In 2016,
6% of working age adults are on Employment Support Allowance/incapacity benefits
Having a
long-term condition is associated with unemployment and worklessnesswith an employment rate of only
60%
Unemployed people are defined as those who are not working, but are looking for work.
Economic inactivity: people not in employment who have not been seeking work within the last 4 weeks and/or are unable to start work within the next 2 weeks.
Among working age people, those who are economically inactive have the highest prevalence of long term conditions
(42%) and limiting long term conditions
(31%) even when accounting for age and income.
Unemployed people were
more than twice as likely as employed people to report having a limiting long term condition
Sources: Office for National Statistics, 2016; Adult Health in Great Britain, 2012; Black & Frost 2011; Labour Force Survey, 2015
£

Sources: Adult Psychiatric Morbidity in England, 2007; Health and wellbeing at work: a survey of employees, 2014; Cimpean & Drake 2011; Naylor et al 2012; OECD, 2014; Labour Force Survey, various years
Health and Work Welfare
Sources: Black & Frost 2011; Routes onto Employment and Support Allowance, 2011; OECD 2014; CESI, 2015; ONS 2014
The annual State spend onhealth-related benefits
£13bnAnnual cost to the State of the average claimant receiving Employment and Support Allowance (ESA)
£8,500Each year, approximately
330,000 people
flow from work on to the State’s main health-related benefit, ESA
£
50+
2in3are male
Over
1in3are over 50 years of age
Around
140,000people a yearfall out of work and claim health related benefits without having a period of sick leave beforehand
Summary of ESA claimants by condition (August 2015)
13% Diseases of the musculoskeletal conditions and connective tissue
48% Mental and behavioural disorders
Diseases of the nervous system6% Diseases of the circulatory and respiratory system6% Injury, poisoning and other external causes5%
Other12%
Sources: Adult Psychiatric Morbidity in England, 2007; Health and wellbeing at work: a survey of employees, 2014; Cimpean & Drake 2011; Naylor et al 2012; OECD, 2014; Labour Force Survey, various years
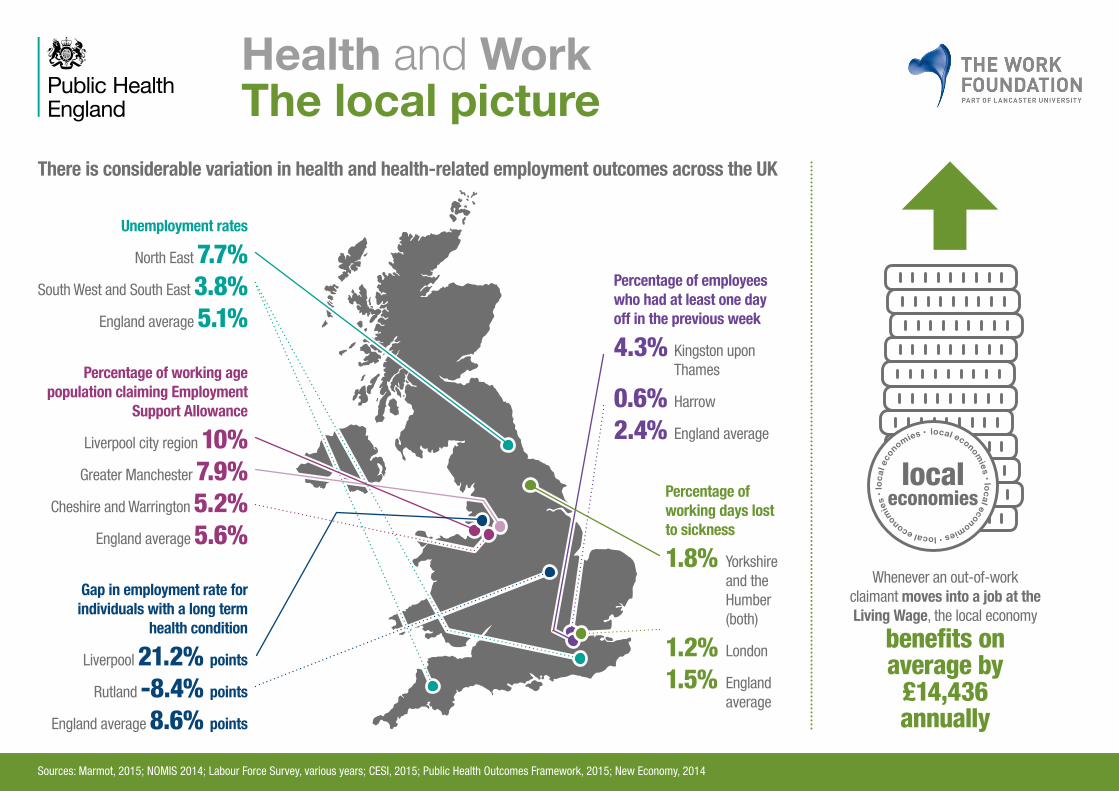
Percentage of employees who had at least one day off in the previous week
4.3% Kingston upon Thames
0.6% Harrow
2.4% England average
Health and Work The local picture
Sources: Marmot, 2015; NOMIS 2014; Labour Force Survey, various years; CESI, 2015; Public Health Outcomes Framework, 2015; New Economy, 2014
Percentage of working days lost to sickness
1.8% Yorkshire and the Humber (both)
1.2% London
1.5% England average
There is considerable variation in health and health-related employment outcomes across the UK
Percentage of working age population claiming Employment
Support Allowance
Liverpool city region 10%Greater Manchester 7.9%
Cheshire and Warrington 5.2% England average 5.6%
Unemployment rates
North East 7.7% South West and South East 3.8%
England average 5.1%
Gap in employment rate for individuals with a long term
health condition
Liverpool 21.2% points Rutland -8.4% points
England average 8.6% points
Whenever an out-of-work claimant moves into a job at the Living Wage, the local economy
benefits on average by
£14,436annually
local economies • local economies • local econom
ies • l
ocal
eco
nomies •
local economies

Sources: Adult Psychiatric Morbidity in England, 2007; Health and wellbeing at work: a survey of employees, 2014; Cimpean & Drake 2011; Naylor et al 2012; OECD, 2014; Labour Force Survey, various years
!
Health and Work Supporting older workers with health problems
Sources: ONS, Labour market projections 2006-2020; Dupre et al 2012; Meneton et al., 2014; Phillips 2013; Labour Force Survey, various years; Crawford et al 2010; Older Workers Statistical Information Booklet 2013; Routes onto Employment and Support Allowance, 2011; Work Programme Statistics, 2015
People with a disability and those aged 50 and over are
less successful in getting a job through the Work Programme
By 2020, it isestimated that
1in3 British workers will be over the age of 50 years
Older people are more likely to experience longer periods of unemployment
Among those aged over 50 even a
short period of unemploymentincreases the risk of mortality and a heart attack as much as smoking
Of the 7.2m people aged 50-64 who are employed,
42% are living with a health condition or disability
Long term absentee employees
Economic inactivity rate vs Unemployment
rate
For those who are not working when asked why:
10% say they are not looking for work due to sickness or disability
4% say they are looking after the home or family
12% of 50-64 year olds are retired
Each year,
330,000 people move from work onto Employment Support Allowance
1in3 are over 50 years old
47% of unemployed 50-64 year olds have been out of work for a year or more
compared to 40% of unemployed 25-49 year olds,
46%27%
and only 33% of unemployed 18-24 year olds
14%
of long term absentee employees in England are aged 50 or over, as compared to
of the employee population overall
50+
29% 5%
6%50-64 year-olds
25-49 year-olds£

Sources: Adult Psychiatric Morbidity in England, 2007; Health and wellbeing at work: a survey of employees, 2014; Cimpean & Drake 2011; Naylor et al 2012; OECD, 2014; Labour Force Survey, various years
93% indicated that their chronic condition had an impact on their self-confidence leading them to believe that certain careers were not viable
Health and Work Young people and health at work
Sources: Kessler et al 2005; Labour Force Survey, 2011 & 2012; Bevan et al., 2013; National Pupil Database academic years 2005/06 to 2010/11
Chronic health conditions also lead young people at school age to review their career plans:
Disabled people are around 3 times as likely not to hold any qualifications compared to non-disabled people, and around half as likely to hold a degree-level qualification
Post-19 Education
EducationAbout halfof mental health conditionsbegin before the age of 14
Young peoplewith disabilitiesaccount for 7% of the 16-24 population
16% of the total NEET (not in education, employment or training) group
Among 16 to 24 year olds with
work-limitingdisabilitiesthe unemployment rate is
For young people without such disabilities it is
The employment rate gap between people with and without disabilities widens after education
27.8 percentage pointsat the age of 23
36.2 percentage pointsat the age of 24
In a study reporting on how young people’s chronic conditions can affect their ability to prepare for and seek employment
54% reporting having to delay their education or training, while
63% reported that their condition prevented them from reaching their full educational potential
24%
14%
The percentage of pupils at the end of Key Stage 4 achieving 5 or more GCSEs at grades A* to C
% of people who do not hold any formal qualification
% of people who hold degree-level qualifications
working age disabled people19.2%
students with SEN without a statement59.2%
students with SEN with a statement24.9%
working age disabled people14.9%
working age non-disabled people6.5%
28.1% working age non-disabled people
88.9% students without Special Educational Needs (SEN)

Health and Work Spotlight on alcohol, drugs and tobacco
£7bn
72%
34k+£1,52213684%
50k+
Alcohol Drugs Smoking
17mworking days lost annually through absences caused by alcohol
Smoking affects organisational productivity
Many smokers would welcome the support of their employers in helping to quit
employers are reluctant to employ people with a known history of substance misuse
Employment and volunteering leads to better treatment outcomes, and reduced relapse rates
Estimated costs in lost productivity through unemployment and sickness related to alcohol
of people entering treatment for alcohol problems were not in paid employment at the start of their treatment
of individuals seeking treatment in England for opiate problems were not in paid employment at the start of their treatment
Smokers take between 1 and 2.7 more sick days off per year than non-smokers
hours of lost productivity time every year for the average smoker – costing the average business
Smokers may also take more breaks during the working day
individuals claiming incapacity benefits had a primary disabling condition of drugs misuse
Claimants are hesitant to self- disclose substance misuse for fear that it could affect their benefit entitlement
individuals in Great Britain in 2013 were claiming incapacity benefits with a primary disabling condition of alcohol misuse
This equates to
in unproductive wages
say they would find free information on quitting smoking useful71%say they would like their employers to promote campaigns like Stoptober and No Smoking Day67%would like information about their local stop smoking service for support78%
People with severe and multiple disadvantage (substance misuse, homelessness, mental health and offending history) are likely to be the furthest from the labour market and need the most support around education, training and employment
In 2013
In 2014/15
Sources: Black 2016, Health Committee Government’s Alcohol Strategy, 2012, NTA Statistics,2016, DWP 2014, Cebr 2014
£
PHE Publications gateway number: 2017099