filedranetz hdpq® data sheet xplorer, xplorer-400, guide & visa . feature summary portable...
TRANSCRIPT
DRANETZ HDPQ® DATA SHEET
XPLORER, XPLORER-400, GUIDE & VISA
FEATURE SUMMARY
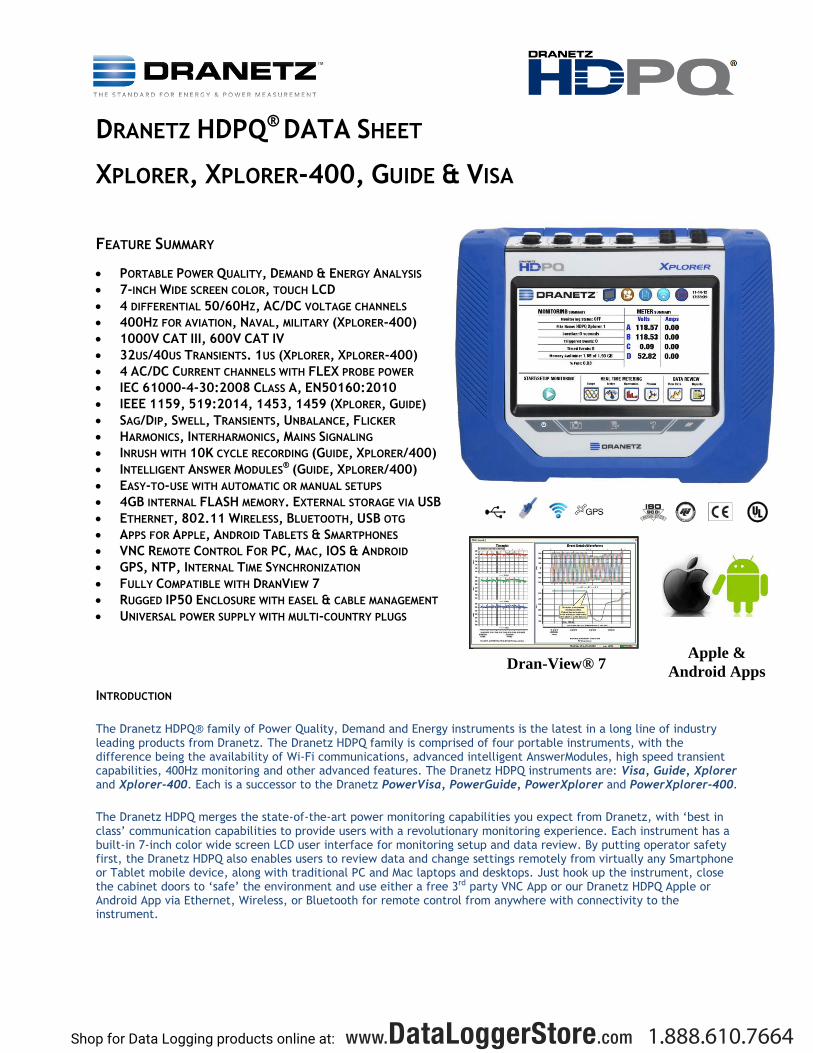
PORTABLE POWER QUALITY, DEMAND & ENERGY ANALYSIS
7-INCH WIDE SCREEN COLOR, TOUCH LCD
4 DIFFERENTIAL 50/60HZ, AC/DC VOLTAGE CHANNELS
400HZ FOR AVIATION, NAVAL, MILITARY (XPLORER-400)
1000V CAT III, 600V CAT IV
32US/40US TRANSIENTS. 1US (XPLORER, XPLORER-400)
4 AC/DC CURRENT CHANNELS WITH FLEX PROBE POWER
IEC 61000-4-30:2008 CLASS A, EN50160:2010
IEEE 1159, 519:2014, 1453, 1459 (XPLORER, GUIDE)
SAG/DIP, SWELL, TRANSIENTS, UNBALANCE, FLICKER
HARMONICS, INTERHARMONICS, MAINS SIGNALING
INRUSH WITH 10K CYCLE RECORDING (GUIDE, XPLORER/400)
INTELLIGENT ANSWER MODULES® (GUIDE, XPLORER/400)
EASY-TO-USE WITH AUTOMATIC OR MANUAL SETUPS
4GB INTERNAL FLASH MEMORY. EXTERNAL STORAGE VIA USB
ETHERNET, 802.11 WIRELESS, BLUETOOTH, USB OTG
APPS FOR APPLE, ANDROID TABLETS & SMARTPHONES
VNC REMOTE CONTROL FOR PC, MAC, IOS & ANDROID
GPS, NTP, INTERNAL TIME SYNCHRONIZATION
FULLY COMPATIBLE WITH DRANVIEW 7
RUGGED IP50 ENCLOSURE WITH EASEL & CABLE MANAGEMENT
UNIVERSAL POWER SUPPLY WITH MULTI-COUNTRY PLUGS
INTRODUCTION
The Dranetz HDPQ® family of Power Quality, Demand and Energy instruments is the latest in a long line of industry leading products from Dranetz. The Dranetz HDPQ family is comprised of four portable instruments, with the difference being the availability of Wi-Fi communications, advanced intelligent AnswerModules, high speed transient capabilities, 400Hz monitoring and other advanced features. The Dranetz HDPQ instruments are: Visa, Guide, Xplorer and Xplorer-400. Each is a successor to the Dranetz PowerVisa, PowerGuide, PowerXplorer and PowerXplorer-400.
The Dranetz HDPQ merges the state-of-the-art power monitoring capabilities you expect from Dranetz, with ‘best in class’ communication capabilities to provide users with a revolutionary monitoring experience. Each instrument has a built-in 7-inch color wide screen LCD user interface for monitoring setup and data review. By putting operator safety first, the Dranetz HDPQ also enables users to review data and change settings remotely from virtually any Smartphone or Tablet mobile device, along with traditional PC and Mac laptops and desktops. Just hook up the instrument, close the cabinet doors to ‘safe’ the environment and use either a free 3rd party VNC App or our Dranetz HDPQ Apple or Android App via Ethernet, Wireless, or Bluetooth for remote control from anywhere with connectivity to the instrument.
Dran-View® 7
77Compatible
Apple &
Android Apps
Shop for Data Logging products online at: www.DataLoggerStore.com 1.888.610.7664
DRANETZ HDPQ APPLICATIONS
The Dranetz HDPQ family is a series of portable monitoring instruments that is intended for temporary and semi-permanent Power Quality, Demand, and Energy surveys. It has a 7-inch color, touch user interface that allows for easy setup and reporting using the local display. Ethernet, wireless and Bluetooth interfaces are available for the user (model dependent) to remotely control the instrument from a safe environment using a VNC interface and/or the Dranetz Apple/Android App, greatly reducing exposure to hazardous environments.
Dranetz HDPQ instruments measure 4 channels of voltage and 4 channels of current to measure and detect changes in the electrical circuit being measured. The instrument measures Sags/Dips, Swells, Harmonics and Flicker in accordance with all accepted worldwide industry standards, such as IEC 61000-4-30:2008 Class A, IEC 61000-4-7, IEC 61000-4-15, IEEE 1159, IEEE 519:2014 and IEEE 1453, and more. Low, medium and high frequency Transients are also measured (model dependant), as well as power parameters, such as Watts, VA, VAR, Power Factor, Demand/Energy, and many more.
The Dranetz HDPQ family is ideally suited for many industries and applications, such as:
Electric Utilities
Facilities
Electrical contractors
Hospital and Healthcare
Military and Government
Consultants
Service
Rental companies
Education
Chemical, petrochemical and other industries
Many more
This data sheet describes the features, benefits, and specifications for each of the Dranetz HDPQ instruments. Although many advanced features are shared by all HDPQ instruments, some features are only available in certain instruments, which are noted below.
MEASUREMENT INPUTS – ALL HDPQ INSTRUMENTS
Voltage Dranetz HDPQ has (4) differential AC/DC voltage channels rated 1000V CAT III/600V CAT IV. Voltage channels are labeled A, B, C, D and are connected to the circuit using supplied 1000V, 6ft (2m) black (+) and white (-) cables terminated in 4mm plugs and alligator clips. Colored cable clips are provided to match to identifying phase colors.
Current Dranetz HDPQ has (4), 1.5V typical, AC/DC current channels with the standard Dranetz ‘TR’ style connector. Current channels are labeled A, B, C, D and are connected to the circuit using available Dranetz clamp and Flex CT’s. Each current connector supplies 3Vdc power to compatible Dranetz Flex CT’s.
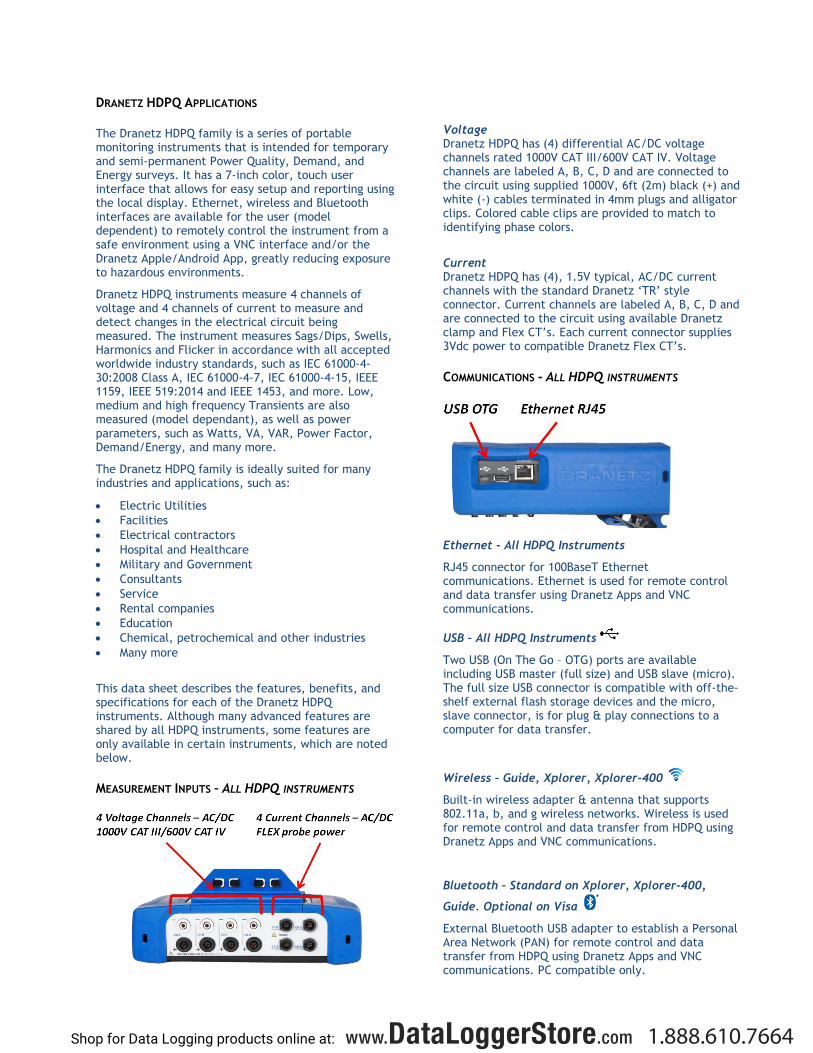
COMMUNICATIONS - ALL HDPQ INSTRUMENTS
Ethernet - All HDPQ Instruments
RJ45 connector for 100BaseT Ethernet communications. Ethernet is used for remote control and data transfer using Dranetz Apps and VNC communications.
USB – All HDPQ Instruments
Two USB (On The Go – OTG) ports are available including USB master (full size) and USB slave (micro). The full size USB connector is compatible with off-the-shelf external flash storage devices and the micro, slave connector, is for plug & play connections to a computer for data transfer.
Wireless – Guide, Xplorer, Xplorer-400
Built-in wireless adapter & antenna that supports 802.11a, b, and g wireless networks. Wireless is used for remote control and data transfer from HDPQ using Dranetz Apps and VNC communications.
Bluetooth – Standard on Xplorer, Xplorer-400,
Guide. Optional on Visa
External Bluetooth USB adapter to establish a Personal Area Network (PAN) for remote control and data transfer from HDPQ using Dranetz Apps and VNC communications. PC compatible only.
Shop for Data Logging products online at: www.DataLoggerStore.com 1.888.610.7664
INSTRUMENT POWER & GPS – ALL HDPQ INSTRUMENTS
Instrument Power
External 90VAC-265VAC, 50/60HZ, 12V output universal power supply. US, UK, Euro, and Australian country plugs are included. A user accessible NIMH rechargeable battery (UPS) is included with a 2hr (3hr for Guide & Visa) run time on a full charge. Charge time for a depleted battery is 3hrs.
Time Synchronization Three methods of time synchronization are available and the system will use the best available time source: GPS using an external GPS receiver and antenna for time synchronization to 1ms, Network Time Protocol (NTP) time synchronization via Ethernet or wireless for time synchronization to 10ms and internal clock.
CONTROLS - ALL HDPQ INSTRUMENTS
Color LCD, Touch Display - All HDPQ Instruments
All Dranetz HDPQ instruments have a built-in 7-inch (measured diagonally) color LCD touch display with an LED backlight. The 7-inch LCD is the primary user interface for the Dranetz HDPQ, including instrument setup, real-time metering, data analysis, and reporting.
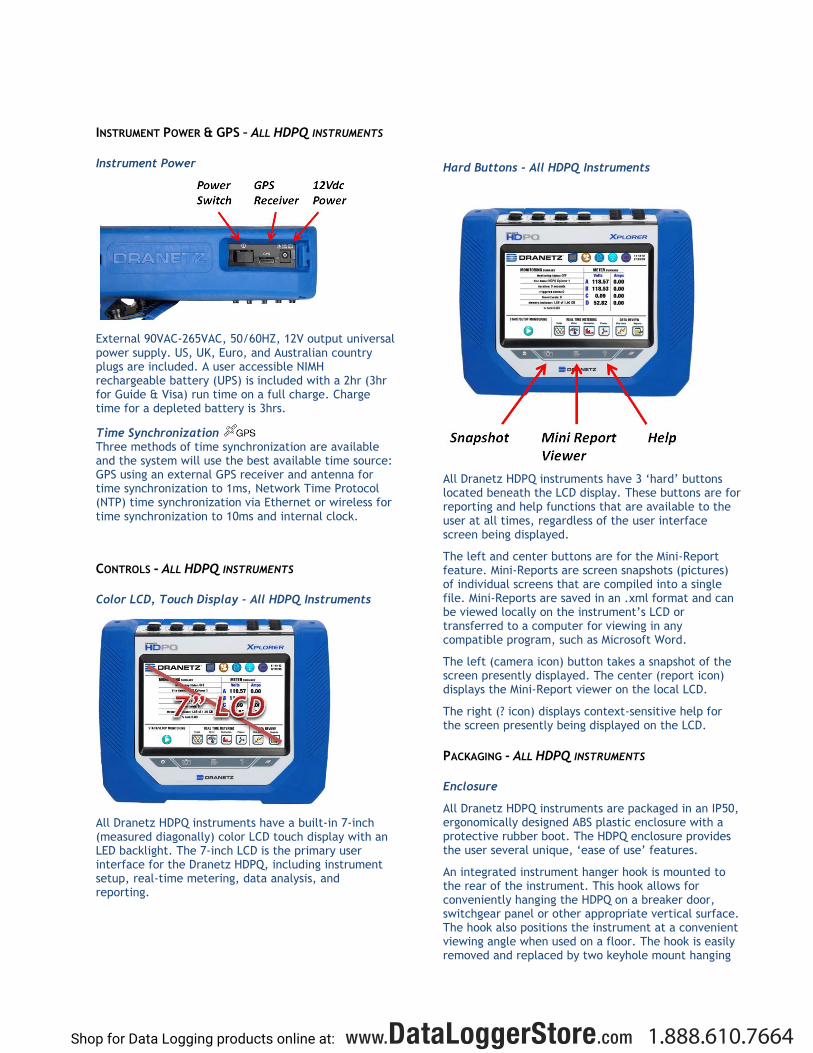
Hard Buttons - All HDPQ Instruments
All Dranetz HDPQ instruments have 3 ‘hard’ buttons located beneath the LCD display. These buttons are for reporting and help functions that are available to the user at all times, regardless of the user interface screen being displayed.
The left and center buttons are for the Mini-Report feature. Mini-Reports are screen snapshots (pictures) of individual screens that are compiled into a single file. Mini-Reports are saved in an .xml format and can be viewed locally on the instrument’s LCD or transferred to a computer for viewing in any compatible program, such as Microsoft Word.
The left (camera icon) button takes a snapshot of the screen presently displayed. The center (report icon) displays the Mini-Report viewer on the local LCD.
The right (? icon) displays context-sensitive help for the screen presently being displayed on the LCD.
PACKAGING - ALL HDPQ INSTRUMENTS
Enclosure
All Dranetz HDPQ instruments are packaged in an IP50, ergonomically designed ABS plastic enclosure with a protective rubber boot. The HDPQ enclosure provides the user several unique, ‘ease of use’ features.
An integrated instrument hanger hook is mounted to the rear of the instrument. This hook allows for conveniently hanging the HDPQ on a breaker door, switchgear panel or other appropriate vertical surface. The hook also positions the instrument at a convenient viewing angle when used on a floor. The hook is easily removed and replaced by two keyhole mount hanging
Shop for Data Logging products online at: www.DataLoggerStore.com 1.888.610.7664
buttons for mounting the Dranetz HDPQ in a Dranetz weather resistant enclosure, or other enclosure.
Integrated cable management is available for the user to neatly and safely ‘dress’ the voltage and current measurement cables by securing them to the instrument. Wire retainers are available on the instrument hanger, as well as a unique cable guide system that is available on the instrument stand.
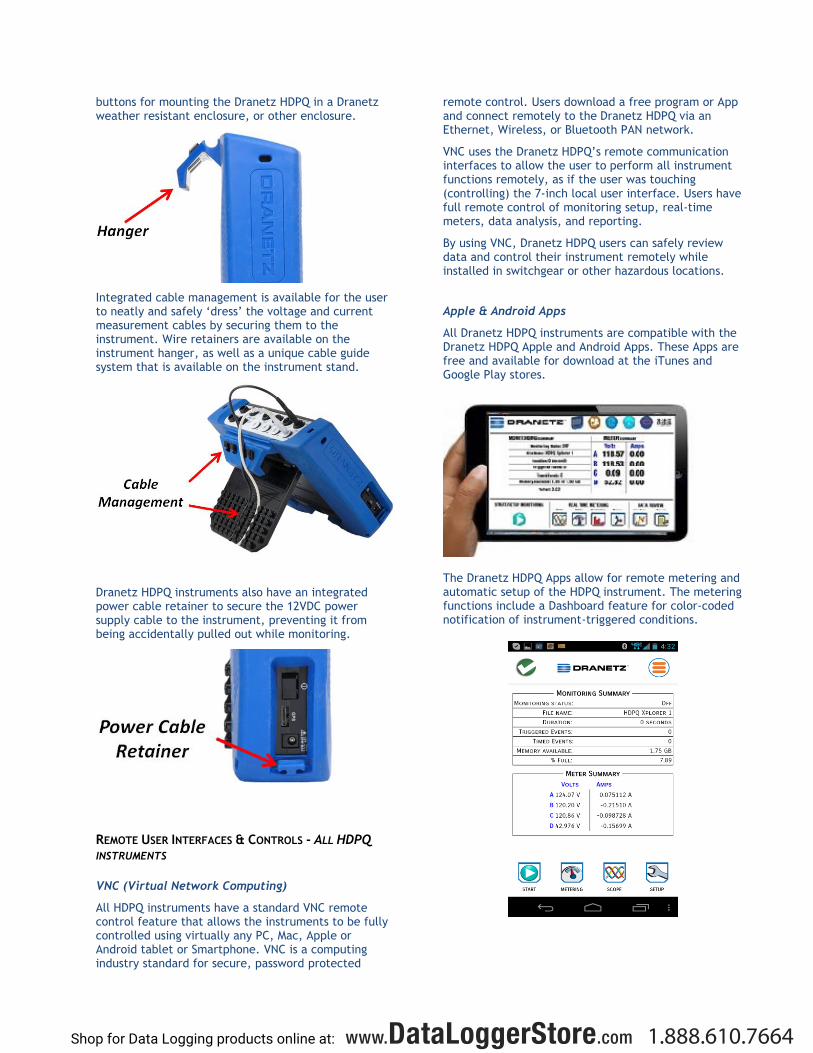
Dranetz HDPQ instruments also have an integrated power cable retainer to secure the 12VDC power supply cable to the instrument, preventing it from being accidentally pulled out while monitoring.
REMOTE USER INTERFACES & CONTROLS - ALL HDPQ
INSTRUMENTS
VNC (Virtual Network Computing)
All HDPQ instruments have a standard VNC remote control feature that allows the instruments to be fully controlled using virtually any PC, Mac, Apple or Android tablet or Smartphone. VNC is a computing industry standard for secure, password protected
remote control. Users download a free program or App and connect remotely to the Dranetz HDPQ via an Ethernet, Wireless, or Bluetooth PAN network.
VNC uses the Dranetz HDPQ’s remote communication interfaces to allow the user to perform all instrument functions remotely, as if the user was touching (controlling) the 7-inch local user interface. Users have full remote control of monitoring setup, real-time meters, data analysis, and reporting.
By using VNC, Dranetz HDPQ users can safely review data and control their instrument remotely while installed in switchgear or other hazardous locations.
Apple & Android Apps
All Dranetz HDPQ instruments are compatible with the Dranetz HDPQ Apple and Android Apps. These Apps are free and available for download at the iTunes and Google Play stores.
The Dranetz HDPQ Apps allow for remote metering and automatic setup of the HDPQ instrument. The metering functions include a Dashboard feature for color-coded notification of instrument-triggered conditions.
Shop for Data Logging products online at: www.DataLoggerStore.com 1.888.610.7664
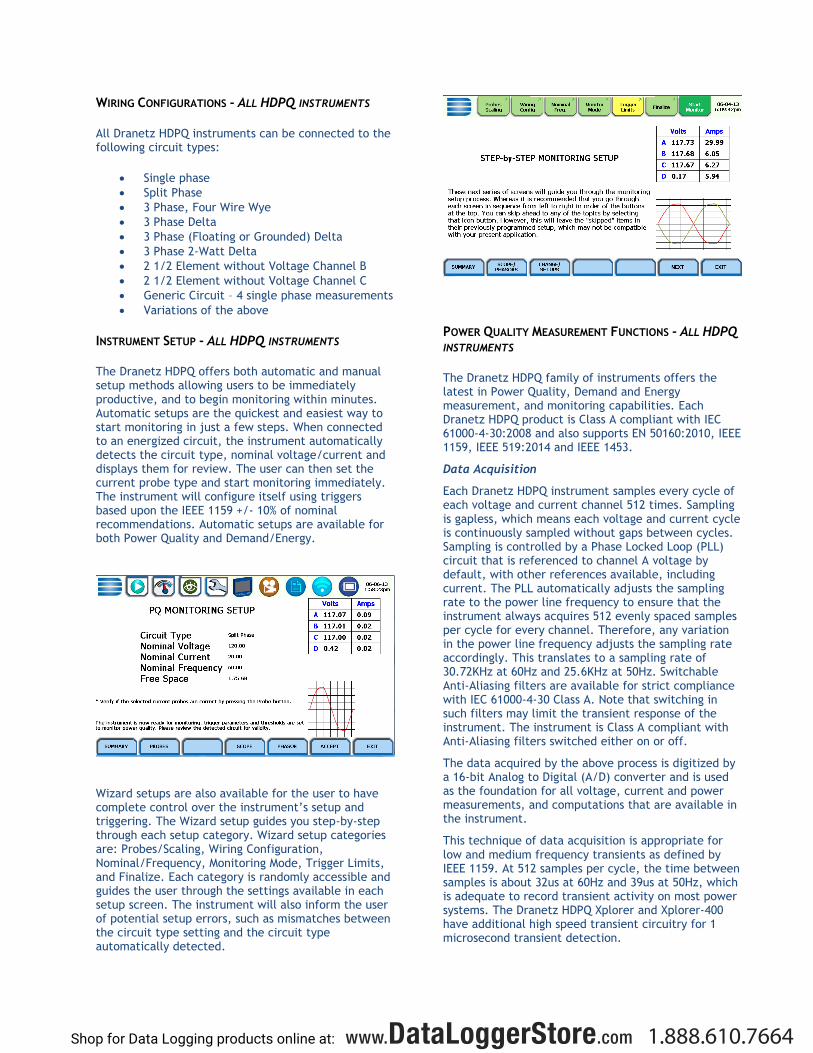
WIRING CONFIGURATIONS - ALL HDPQ INSTRUMENTS
All Dranetz HDPQ instruments can be connected to the following circuit types:
Single phase
Split Phase
3 Phase, Four Wire Wye
3 Phase Delta
3 Phase (Floating or Grounded) Delta
3 Phase 2-Watt Delta
2 1/2 Element without Voltage Channel B
2 1/2 Element without Voltage Channel C
Generic Circuit – 4 single phase measurements
Variations of the above
INSTRUMENT SETUP - ALL HDPQ INSTRUMENTS
The Dranetz HDPQ offers both automatic and manual setup methods allowing users to be immediately productive, and to begin monitoring within minutes. Automatic setups are the quickest and easiest way to start monitoring in just a few steps. When connected to an energized circuit, the instrument automatically detects the circuit type, nominal voltage/current and displays them for review. The user can then set the current probe type and start monitoring immediately. The instrument will configure itself using triggers based upon the IEEE 1159 +/- 10% of nominal recommendations. Automatic setups are available for both Power Quality and Demand/Energy.
Wizard setups are also available for the user to have complete control over the instrument’s setup and triggering. The Wizard setup guides you step-by-step through each setup category. Wizard setup categories are: Probes/Scaling, Wiring Configuration, Nominal/Frequency, Monitoring Mode, Trigger Limits, and Finalize. Each category is randomly accessible and guides the user through the settings available in each setup screen. The instrument will also inform the user of potential setup errors, such as mismatches between the circuit type setting and the circuit type automatically detected.
POWER QUALITY MEASUREMENT FUNCTIONS - ALL HDPQ
INSTRUMENTS
The Dranetz HDPQ family of instruments offers the latest in Power Quality, Demand and Energy measurement, and monitoring capabilities. Each Dranetz HDPQ product is Class A compliant with IEC 61000-4-30:2008 and also supports EN 50160:2010, IEEE 1159, IEEE 519:2014 and IEEE 1453.
Data Acquisition
Each Dranetz HDPQ instrument samples every cycle of each voltage and current channel 512 times. Sampling is gapless, which means each voltage and current cycle is continuously sampled without gaps between cycles. Sampling is controlled by a Phase Locked Loop (PLL) circuit that is referenced to channel A voltage by default, with other references available, including current. The PLL automatically adjusts the sampling rate to the power line frequency to ensure that the instrument always acquires 512 evenly spaced samples per cycle for every channel. Therefore, any variation in the power line frequency adjusts the sampling rate accordingly. This translates to a sampling rate of 30.72KHz at 60Hz and 25.6KHz at 50Hz. Switchable Anti-Aliasing filters are available for strict compliance with IEC 61000-4-30 Class A. Note that switching in such filters may limit the transient response of the instrument. The instrument is Class A compliant with Anti-Aliasing filters switched either on or off.
The data acquired by the above process is digitized by a 16-bit Analog to Digital (A/D) converter and is used as the foundation for all voltage, current and power measurements, and computations that are available in the instrument.
This technique of data acquisition is appropriate for low and medium frequency transients as defined by IEEE 1159. At 512 samples per cycle, the time between samples is about 32us at 60Hz and 39us at 50Hz, which is adequate to record transient activity on most power systems. The Dranetz HDPQ Xplorer and Xplorer-400 have additional high speed transient circuitry for 1 microsecond transient detection.
Shop for Data Logging products online at: www.DataLoggerStore.com 1.888.610.7664
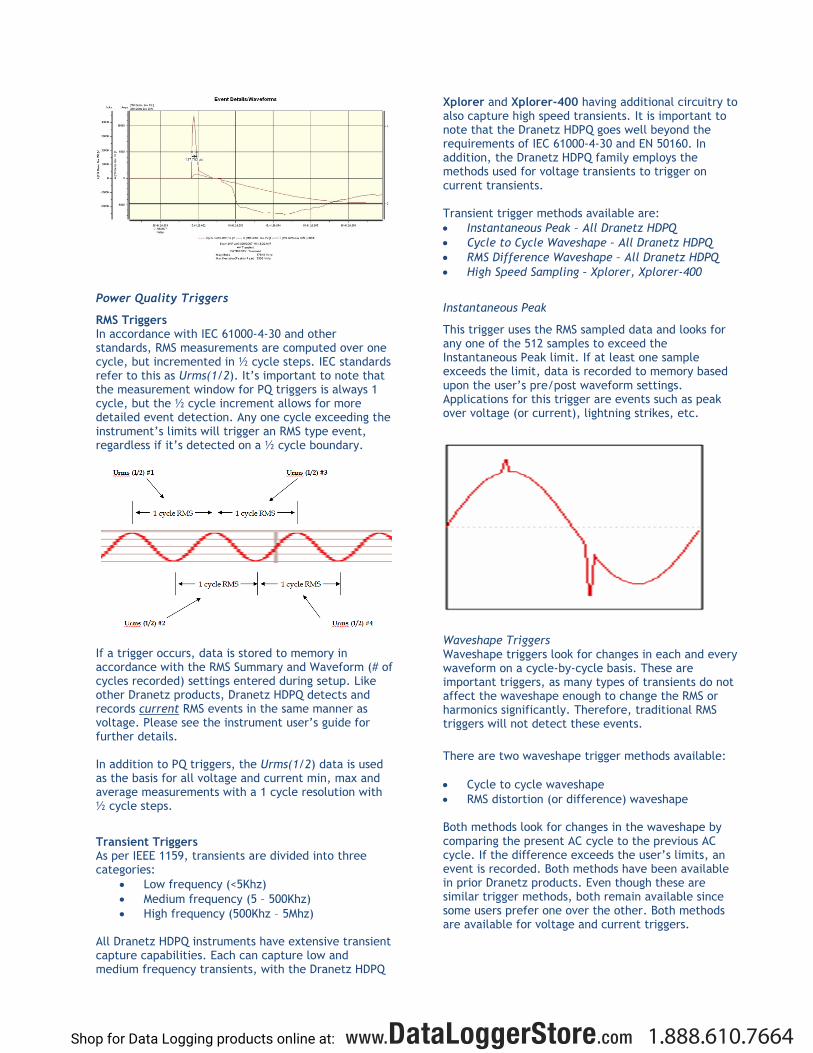
Power Quality Triggers
RMS Triggers In accordance with IEC 61000-4-30 and other standards, RMS measurements are computed over one cycle, but incremented in ½ cycle steps. IEC standards refer to this as Urms(1/2). It’s important to note that the measurement window for PQ triggers is always 1 cycle, but the ½ cycle increment allows for more detailed event detection. Any one cycle exceeding the instrument’s limits will trigger an RMS type event, regardless if it’s detected on a ½ cycle boundary.
If a trigger occurs, data is stored to memory in accordance with the RMS Summary and Waveform (# of cycles recorded) settings entered during setup. Like other Dranetz products, Dranetz HDPQ detects and records current RMS events in the same manner as voltage. Please see the instrument user’s guide for further details. In addition to PQ triggers, the Urms(1/2) data is used as the basis for all voltage and current min, max and average measurements with a 1 cycle resolution with ½ cycle steps.
Transient Triggers As per IEEE 1159, transients are divided into three categories:
Low frequency (<5Khz)
Medium frequency (5 – 500Khz)
High frequency (500Khz – 5Mhz) All Dranetz HDPQ instruments have extensive transient capture capabilities. Each can capture low and medium frequency transients, with the Dranetz HDPQ
Xplorer and Xplorer-400 having additional circuitry to also capture high speed transients. It is important to note that the Dranetz HDPQ goes well beyond the requirements of IEC 61000-4-30 and EN 50160. In addition, the Dranetz HDPQ family employs the methods used for voltage transients to trigger on current transients. Transient trigger methods available are:
Instantaneous Peak – All Dranetz HDPQ
Cycle to Cycle Waveshape – All Dranetz HDPQ
RMS Difference Waveshape – All Dranetz HDPQ
High Speed Sampling – Xplorer, Xplorer-400
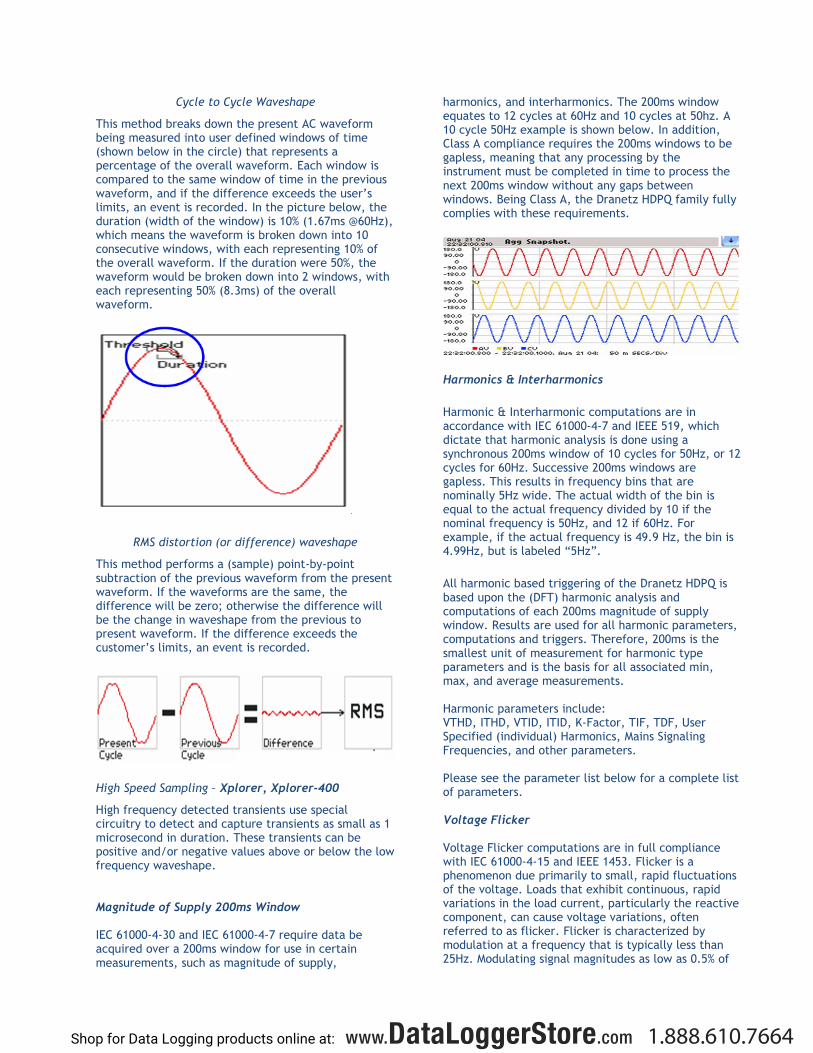
Instantaneous Peak
This trigger uses the RMS sampled data and looks for any one of the 512 samples to exceed the Instantaneous Peak limit. If at least one sample exceeds the limit, data is recorded to memory based upon the user’s pre/post waveform settings. Applications for this trigger are events such as peak over voltage (or current), lightning strikes, etc.
Waveshape Triggers Waveshape triggers look for changes in each and every waveform on a cycle-by-cycle basis. These are important triggers, as many types of transients do not affect the waveshape enough to change the RMS or harmonics significantly. Therefore, traditional RMS triggers will not detect these events.
There are two waveshape trigger methods available:
Cycle to cycle waveshape
RMS distortion (or difference) waveshape Both methods look for changes in the waveshape by comparing the present AC cycle to the previous AC cycle. If the difference exceeds the user’s limits, an event is recorded. Both methods have been available in prior Dranetz products. Even though these are similar trigger methods, both remain available since some users prefer one over the other. Both methods are available for voltage and current triggers.
Shop for Data Logging products online at: www.DataLoggerStore.com 1.888.610.7664
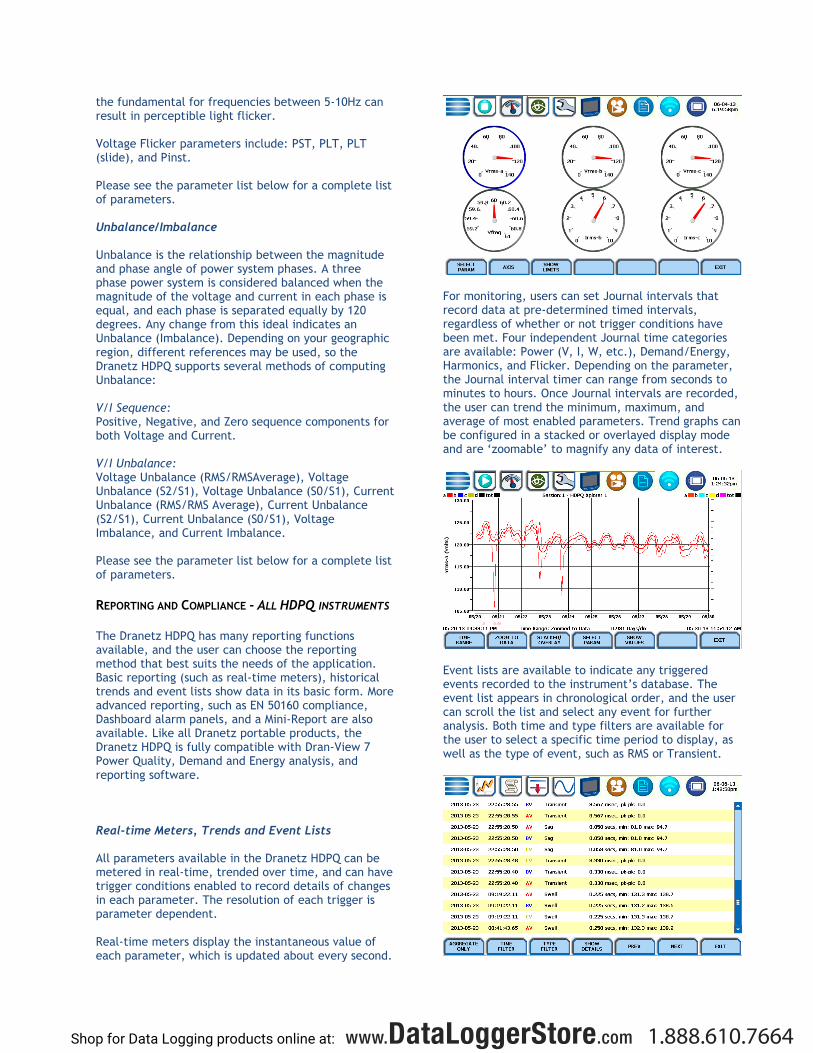
Cycle to Cycle Waveshape
This method breaks down the present AC waveform being measured into user defined windows of time (shown below in the circle) that represents a percentage of the overall waveform. Each window is compared to the same window of time in the previous waveform, and if the difference exceeds the user’s limits, an event is recorded. In the picture below, the duration (width of the window) is 10% (1.67ms @60Hz), which means the waveform is broken down into 10 consecutive windows, with each representing 10% of the overall waveform. If the duration were 50%, the waveform would be broken down into 2 windows, with each representing 50% (8.3ms) of the overall waveform.
RMS distortion (or difference) waveshape
This method performs a (sample) point-by-point subtraction of the previous waveform from the present waveform. If the waveforms are the same, the difference will be zero; otherwise the difference will be the change in waveshape from the previous to present waveform. If the difference exceeds the customer’s limits, an event is recorded.
High Speed Sampling – Xplorer, Xplorer-400
High frequency detected transients use special circuitry to detect and capture transients as small as 1 microsecond in duration. These transients can be positive and/or negative values above or below the low frequency waveshape. Magnitude of Supply 200ms Window IEC 61000-4-30 and IEC 61000-4-7 require data be acquired over a 200ms window for use in certain measurements, such as magnitude of supply,
harmonics, and interharmonics. The 200ms window equates to 12 cycles at 60Hz and 10 cycles at 50hz. A 10 cycle 50Hz example is shown below. In addition, Class A compliance requires the 200ms windows to be gapless, meaning that any processing by the instrument must be completed in time to process the next 200ms window without any gaps between windows. Being Class A, the Dranetz HDPQ family fully complies with these requirements.
Harmonics & Interharmonics
Harmonic & Interharmonic computations are in accordance with IEC 61000-4-7 and IEEE 519, which dictate that harmonic analysis is done using a synchronous 200ms window of 10 cycles for 50Hz, or 12 cycles for 60Hz. Successive 200ms windows are gapless. This results in frequency bins that are nominally 5Hz wide. The actual width of the bin is equal to the actual frequency divided by 10 if the nominal frequency is 50Hz, and 12 if 60Hz. For example, if the actual frequency is 49.9 Hz, the bin is 4.99Hz, but is labeled “5Hz”.
All harmonic based triggering of the Dranetz HDPQ is based upon the (DFT) harmonic analysis and computations of each 200ms magnitude of supply window. Results are used for all harmonic parameters, computations and triggers. Therefore, 200ms is the smallest unit of measurement for harmonic type parameters and is the basis for all associated min, max, and average measurements. Harmonic parameters include: VTHD, ITHD, VTID, ITID, K-Factor, TIF, TDF, User Specified (individual) Harmonics, Mains Signaling Frequencies, and other parameters. Please see the parameter list below for a complete list of parameters. Voltage Flicker Voltage Flicker computations are in full compliance with IEC 61000-4-15 and IEEE 1453. Flicker is a phenomenon due primarily to small, rapid fluctuations of the voltage. Loads that exhibit continuous, rapid variations in the load current, particularly the reactive component, can cause voltage variations, often referred to as flicker. Flicker is characterized by modulation at a frequency that is typically less than 25Hz. Modulating signal magnitudes as low as 0.5% of
Shop for Data Logging products online at: www.DataLoggerStore.com 1.888.610.7664
the fundamental for frequencies between 5-10Hz can result in perceptible light flicker. Voltage Flicker parameters include: PST, PLT, PLT (slide), and Pinst. Please see the parameter list below for a complete list of parameters. Unbalance/Imbalance Unbalance is the relationship between the magnitude and phase angle of power system phases. A three phase power system is considered balanced when the magnitude of the voltage and current in each phase is equal, and each phase is separated equally by 120 degrees. Any change from this ideal indicates an Unbalance (Imbalance). Depending on your geographic region, different references may be used, so the Dranetz HDPQ supports several methods of computing Unbalance: V/I Sequence: Positive, Negative, and Zero sequence components for both Voltage and Current. V/I Unbalance: Voltage Unbalance (RMS/RMSAverage), Voltage Unbalance (S2/S1), Voltage Unbalance (S0/S1), Current Unbalance (RMS/RMS Average), Current Unbalance (S2/S1), Current Unbalance (S0/S1), Voltage Imbalance, and Current Imbalance. Please see the parameter list below for a complete list of parameters.
REPORTING AND COMPLIANCE - ALL HDPQ INSTRUMENTS
The Dranetz HDPQ has many reporting functions available, and the user can choose the reporting method that best suits the needs of the application. Basic reporting (such as real-time meters), historical trends and event lists show data in its basic form. More advanced reporting, such as EN 50160 compliance, Dashboard alarm panels, and a Mini-Report are also available. Like all Dranetz portable products, the Dranetz HDPQ is fully compatible with Dran-View 7 Power Quality, Demand and Energy analysis, and reporting software. Real-time Meters, Trends and Event Lists All parameters available in the Dranetz HDPQ can be metered in real-time, trended over time, and can have trigger conditions enabled to record details of changes in each parameter. The resolution of each trigger is parameter dependent. Real-time meters display the instantaneous value of each parameter, which is updated about every second.
For monitoring, users can set Journal intervals that record data at pre-determined timed intervals, regardless of whether or not trigger conditions have been met. Four independent Journal time categories are available: Power (V, I, W, etc.), Demand/Energy, Harmonics, and Flicker. Depending on the parameter, the Journal interval timer can range from seconds to minutes to hours. Once Journal intervals are recorded, the user can trend the minimum, maximum, and average of most enabled parameters. Trend graphs can be configured in a stacked or overlayed display mode and are ‘zoomable’ to magnify any data of interest.
Event lists are available to indicate any triggered events recorded to the instrument’s database. The event list appears in chronological order, and the user can scroll the list and select any event for further analysis. Both time and type filters are available for the user to select a specific time period to display, as well as the type of event, such as RMS or Transient.
Shop for Data Logging products online at: www.DataLoggerStore.com 1.888.610.7664
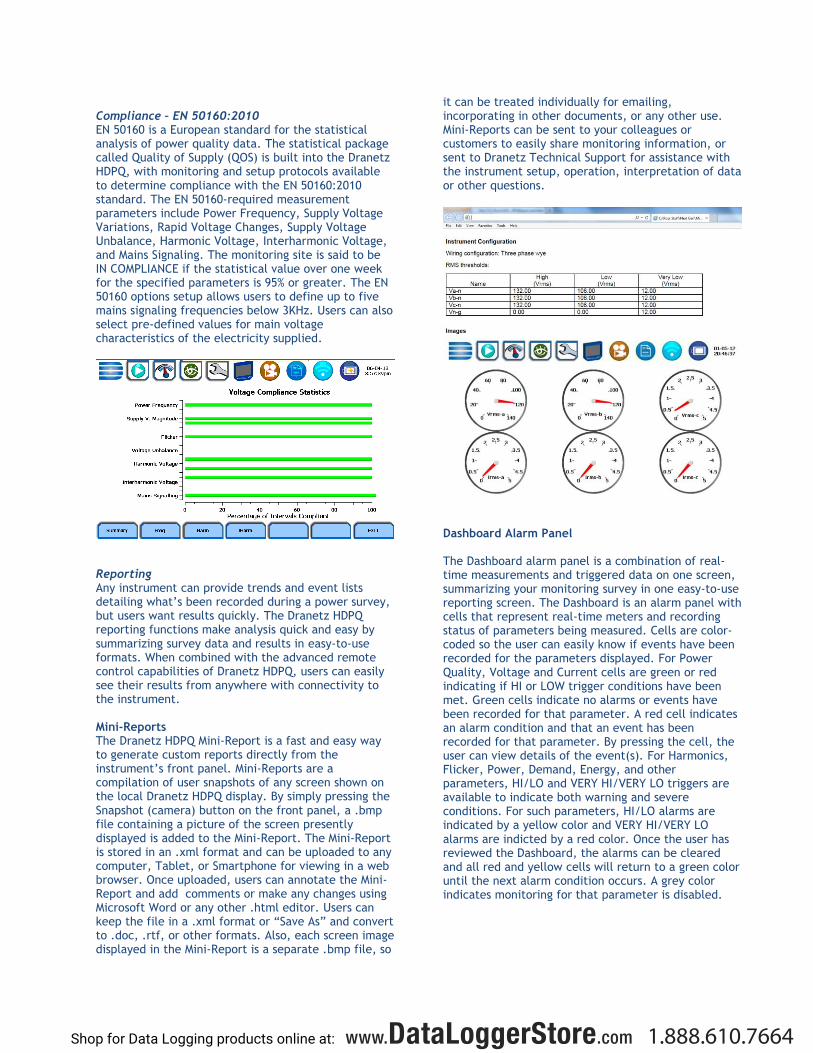
Compliance – EN 50160:2010 EN 50160 is a European standard for the statistical analysis of power quality data. The statistical package called Quality of Supply (QOS) is built into the Dranetz HDPQ, with monitoring and setup protocols available to determine compliance with the EN 50160:2010 standard. The EN 50160-required measurement parameters include Power Frequency, Supply Voltage Variations, Rapid Voltage Changes, Supply Voltage Unbalance, Harmonic Voltage, Interharmonic Voltage, and Mains Signaling. The monitoring site is said to be IN COMPLIANCE if the statistical value over one week for the specified parameters is 95% or greater. The EN 50160 options setup allows users to define up to five mains signaling frequencies below 3KHz. Users can also select pre-defined values for main voltage characteristics of the electricity supplied.
Reporting Any instrument can provide trends and event lists detailing what’s been recorded during a power survey, but users want results quickly. The Dranetz HDPQ reporting functions make analysis quick and easy by summarizing survey data and results in easy-to-use formats. When combined with the advanced remote control capabilities of Dranetz HDPQ, users can easily see their results from anywhere with connectivity to the instrument. Mini-Reports The Dranetz HDPQ Mini-Report is a fast and easy way to generate custom reports directly from the instrument’s front panel. Mini-Reports are a compilation of user snapshots of any screen shown on the local Dranetz HDPQ display. By simply pressing the Snapshot (camera) button on the front panel, a .bmp file containing a picture of the screen presently displayed is added to the Mini-Report. The Mini-Report is stored in an .xml format and can be uploaded to any computer, Tablet, or Smartphone for viewing in a web browser. Once uploaded, users can annotate the Mini-Report and add comments or make any changes using Microsoft Word or any other .html editor. Users can keep the file in a .xml format or “Save As” and convert to .doc, .rtf, or other formats. Also, each screen image displayed in the Mini-Report is a separate .bmp file, so
it can be treated individually for emailing, incorporating in other documents, or any other use. Mini-Reports can be sent to your colleagues or customers to easily share monitoring information, or sent to Dranetz Technical Support for assistance with the instrument setup, operation, interpretation of data or other questions.
Dashboard Alarm Panel The Dashboard alarm panel is a combination of real-time measurements and triggered data on one screen, summarizing your monitoring survey in one easy-to-use reporting screen. The Dashboard is an alarm panel with cells that represent real-time meters and recording status of parameters being measured. Cells are color-coded so the user can easily know if events have been recorded for the parameters displayed. For Power Quality, Voltage and Current cells are green or red indicating if HI or LOW trigger conditions have been met. Green cells indicate no alarms or events have been recorded for that parameter. A red cell indicates an alarm condition and that an event has been recorded for that parameter. By pressing the cell, the user can view details of the event(s). For Harmonics, Flicker, Power, Demand, Energy, and other parameters, HI/LO and VERY HI/VERY LO triggers are available to indicate both warning and severe conditions. For such parameters, HI/LO alarms are indicated by a yellow color and VERY HI/VERY LO alarms are indicted by a red color. Once the user has reviewed the Dashboard, the alarms can be cleared and all red and yellow cells will return to a green color until the next alarm condition occurs. A grey color indicates monitoring for that parameter is disabled.
Shop for Data Logging products online at: www.DataLoggerStore.com 1.888.610.7664
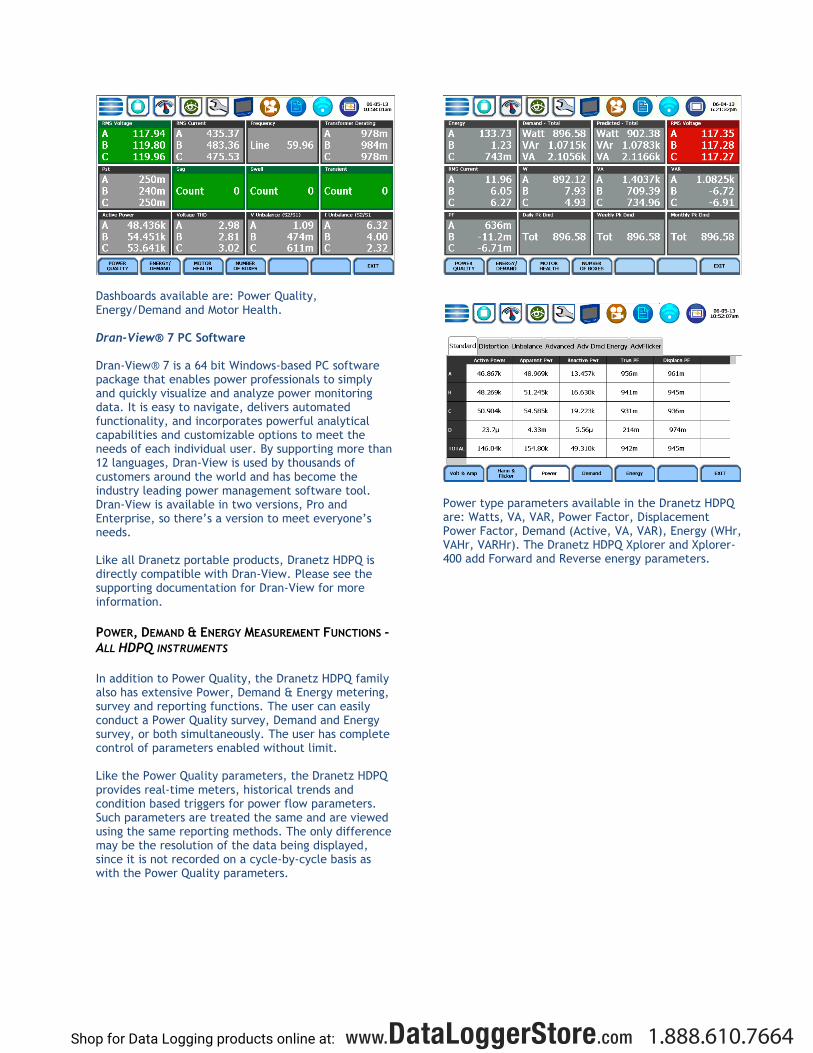
Dashboards available are: Power Quality, Energy/Demand and Motor Health. Dran-View® 7 PC Software Dran-View® 7 is a 64 bit Windows-based PC software package that enables power professionals to simply and quickly visualize and analyze power monitoring data. It is easy to navigate, delivers automated functionality, and incorporates powerful analytical capabilities and customizable options to meet the needs of each individual user. By supporting more than 12 languages, Dran-View is used by thousands of customers around the world and has become the industry leading power management software tool. Dran-View is available in two versions, Pro and Enterprise, so there’s a version to meet everyone’s needs. Like all Dranetz portable products, Dranetz HDPQ is directly compatible with Dran-View. Please see the supporting documentation for Dran-View for more information.
POWER, DEMAND & ENERGY MEASUREMENT FUNCTIONS - ALL HDPQ INSTRUMENTS
In addition to Power Quality, the Dranetz HDPQ family also has extensive Power, Demand & Energy metering, survey and reporting functions. The user can easily conduct a Power Quality survey, Demand and Energy survey, or both simultaneously. The user has complete control of parameters enabled without limit. Like the Power Quality parameters, the Dranetz HDPQ provides real-time meters, historical trends and condition based triggers for power flow parameters. Such parameters are treated the same and are viewed using the same reporting methods. The only difference may be the resolution of the data being displayed, since it is not recorded on a cycle-by-cycle basis as with the Power Quality parameters.
Power type parameters available in the Dranetz HDPQ are: Watts, VA, VAR, Power Factor, Displacement Power Factor, Demand (Active, VA, VAR), Energy (WHr, VAHr, VARHr). The Dranetz HDPQ Xplorer and Xplorer-400 add Forward and Reverse energy parameters.
Shop for Data Logging products online at: www.DataLoggerStore.com 1.888.610.7664
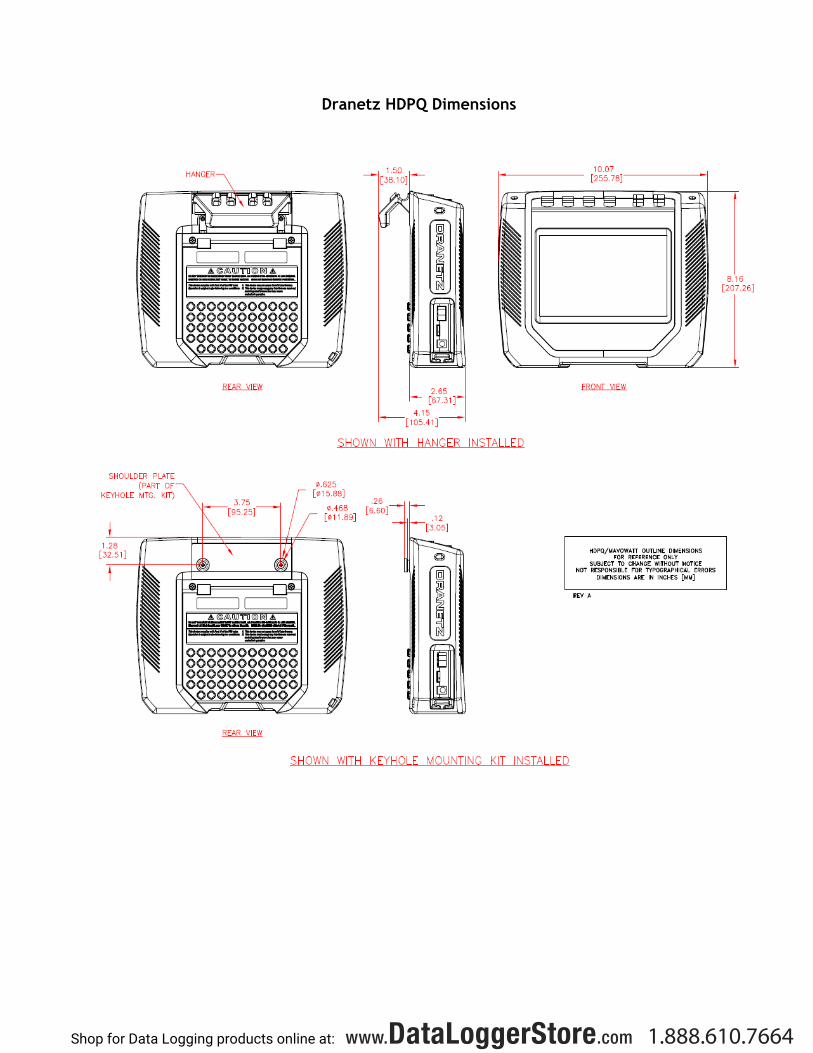
Dranetz HDPQ Dimensions
Shop for Data Logging products online at: www.DataLoggerStore.com 1.888.610.7664
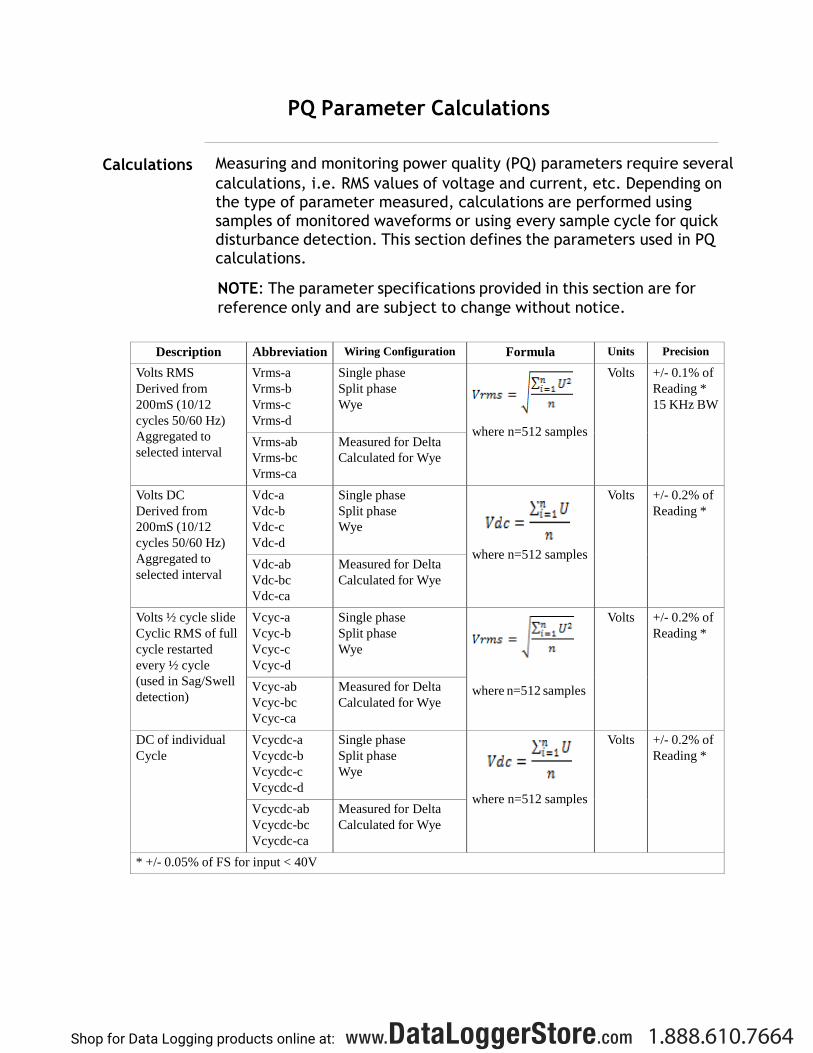
PQ Parameter Calculations
Calculations Measuring and monitoring power quality (PQ) parameters require several
calculations, i.e. RMS values of voltage and current, etc. Depending on the type of parameter measured, calculations are performed using
samples of monitored waveforms or using every sample cycle for quick disturbance detection. This section defines the parameters used in PQ calculations.
NOTE: The parameter specifications provided in this section are for
reference only and are subject to change without notice.
Description Abbreviation Wiring Configuration Formula Units Precision
Volts RMS
Derived from
200mS (10/12
cycles 50/60 Hz)
Aggregated to
selected interval
Vrms-a
Vrms-b
Vrms-c
Vrms-d
Single phase
Split phase
Wye
where n=512 samples
Volts +/- 0.1% of
Reading *
15 KHz BW
Vrms-ab
Vrms-bc
Vrms-ca
Measured for Delta
Calculated for Wye
Volts DC
Derived from
200mS (10/12
cycles 50/60 Hz)
Aggregated to
selected interval
Vdc-a
Vdc-b
Vdc-c
Vdc-d
Single phase
Split phase
Wye
where n=512 samples
Volts +/- 0.2% of
Reading *
Vdc-ab
Vdc-bc
Vdc-ca
Measured for Delta
Calculated for Wye
Volts ½ cycle slide
Cyclic RMS of full
cycle restarted
every ½ cycle
(used in Sag/Swell
detection)
Vcyc-a
Vcyc-b
Vcyc-c
Vcyc-d
Single phase
Split phase
Wye
where n=512 samples
Volts +/- 0.2% of
Reading *
Vcyc-ab
Vcyc-bc
Vcyc-ca
Measured for Delta
Calculated for Wye
DC of individual
Cycle
Vcycdc-a
Vcycdc-b
Vcycdc-c
Vcycdc-d
Single phase
Split phase
Wye
where n=512 samples
Volts +/- 0.2% of
Reading *
Vcycdc-ab
Vcycdc-bc
Vcycdc-ca
Measured for Delta
Calculated for Wye
* +/- 0.05% of FS for input < 40V
Shop for Data Logging products online at: www.DataLoggerStore.com 1.888.610.7664
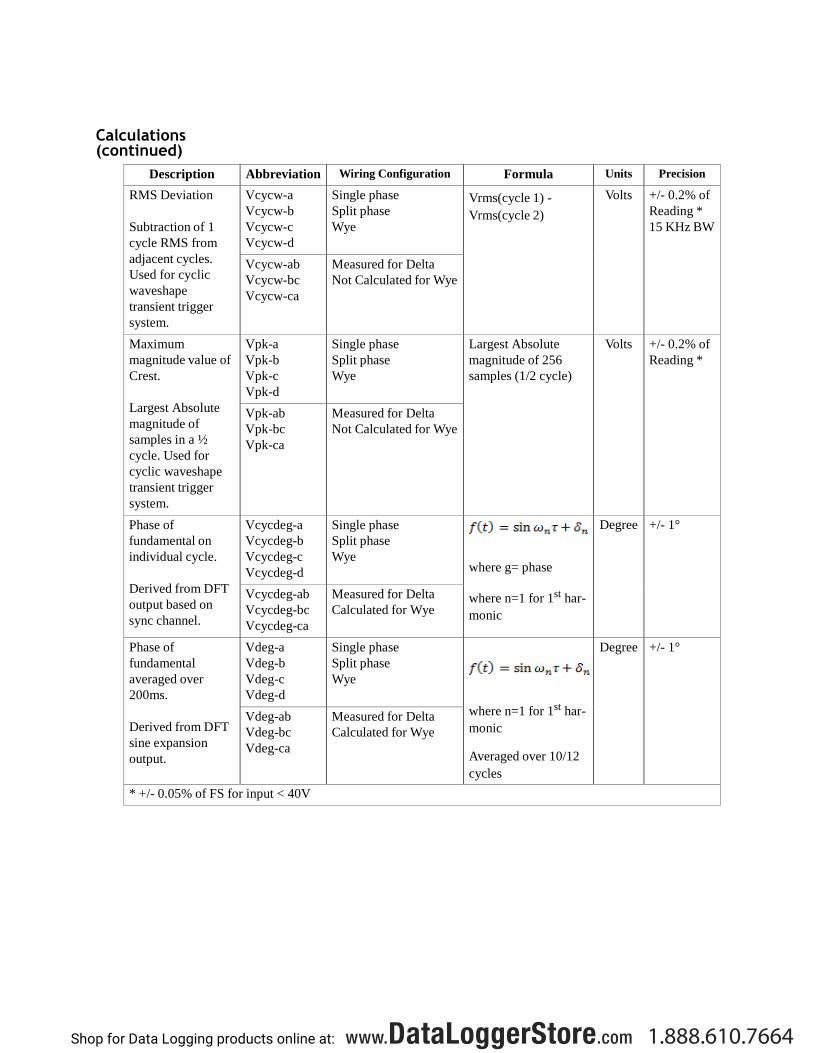
Calculations (continued)
Description Abbreviation Wiring Configuration Formula Units Precision
RMS Deviation
Subtraction of 1
cycle RMS from
adjacent cycles.
Used for cyclic
waveshape
transient trigger
system.
Vcycw-a
Vcycw-b
Vcycw-c
Vcycw-d
Single phase
Split phase
Wye
Vrms(cycle 1) -
Vrms(cycle 2)
Volts +/- 0.2% of
Reading *
15 KHz BW
Vcycw-ab
Vcycw-bc
Vcycw-ca
Measured for Delta
Not Calculated for Wye
Maximum
magnitude value of
Crest.
Largest Absolute
magnitude of
samples in a ½
cycle. Used for
cyclic waveshape
transient trigger
system.
Vpk-a
Vpk-b
Vpk-c
Vpk-d
Single phase
Split phase
Wye
Largest Absolute
magnitude of 256
samples (1/2 cycle)
Volts +/- 0.2% of
Reading *
Vpk-ab
Vpk-bc
Vpk-ca
Measured for Delta
Not Calculated for Wye
Phase of
fundamental on
individual cycle.
Derived from DFT
output based on
sync channel.
Vcycdeg-a
Vcycdeg-b
Vcycdeg-c
Vcycdeg-d
Single phase
Split phase
Wye
where g= phase
where n=1 for 1st har-
monic
Degree +/- 1°
Vcycdeg-ab
Vcycdeg-bc
Vcycdeg-ca
Measured for Delta
Calculated for Wye
Phase of
fundamental
averaged over
200ms.
Derived from DFT
sine expansion
output.
Vdeg-a
Vdeg-b
Vdeg-c
Vdeg-d
Single phase
Split phase
Wye
where n=1 for 1st har-
monic
Averaged over 10/12
cycles
Degree +/- 1°
Vdeg-ab
Vdeg-bc
Vdeg-ca
Measured for Delta
Calculated for Wye
* +/- 0.05% of FS for input < 40V
Shop for Data Logging products online at: www.DataLoggerStore.com 1.888.610.7664
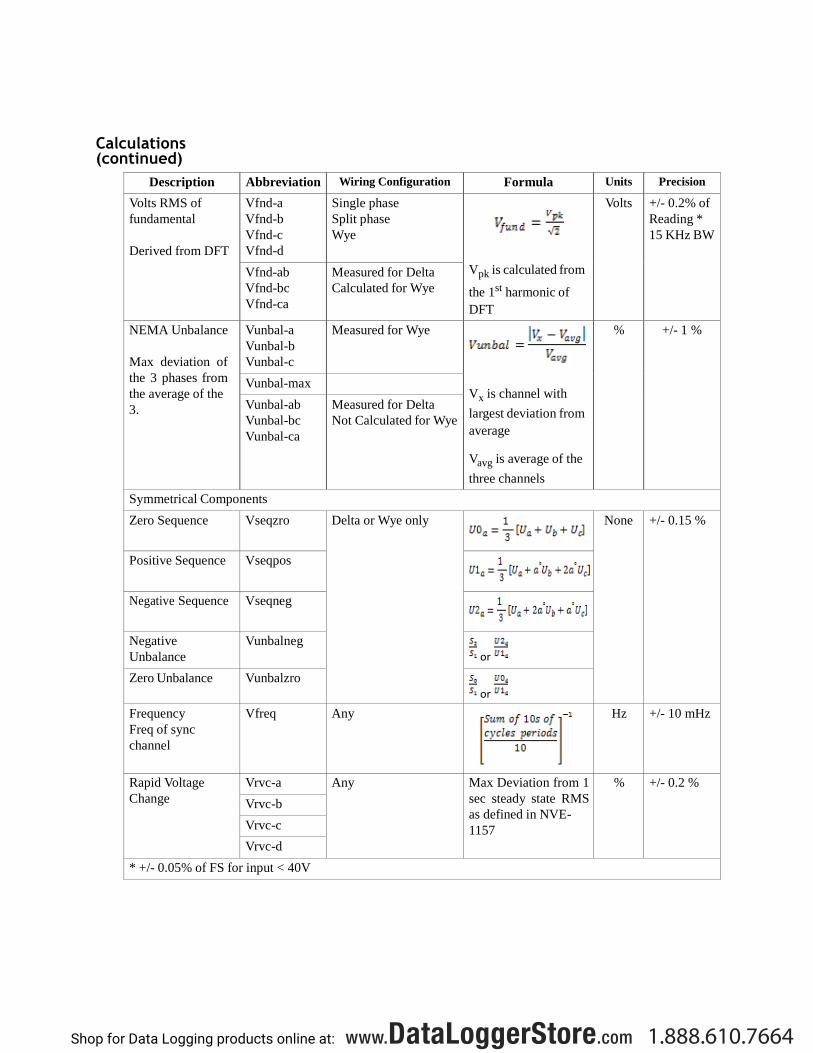
Calculations (continued)
Description Abbreviation Wiring Configuration Formula Units Precision
Volts RMS of
fundamental
Derived from DFT
Vfnd-a
Vfnd-b
Vfnd-c
Vfnd-d
Single phase
Split phase
Wye
Vpk is calculated from
the 1st harmonic of
DFT
Volts +/- 0.2% of
Reading *
15 KHz BW
Vfnd-ab
Vfnd-bc
Vfnd-ca
Measured for Delta
Calculated for Wye
NEMA Unbalance
Max deviation of
the 3 phases from
the average of the
3.
Vunbal-a
Vunbal-b
Vunbal-c
Measured for Wye
Vx is channel with
largest deviation from
average
Vavg is average of the
three channels
% +/- 1 %
Vunbal-max
Vunbal-ab
Vunbal-bc
Vunbal-ca
Measured for Delta
Not Calculated for Wye
Symmetrical Components
Zero Sequence Vseqzro Delta or Wye only
None +/- 0.15 %
Positive Sequence Vseqpos
Negative Sequence Vseqneg
Negative
Unbalance
Vunbalneg or
Zero Unbalance Vunbalzro or
Frequency
Freq of sync
channel
Vfreq Any
Hz +/- 10 mHz
Rapid Voltage
Change
Vrvc-a Any Max Deviation from 1
sec steady state RMS
as defined in NVE-
1157
% +/- 0.2 %
Vrvc-b
Vrvc-c
Vrvc-d
* +/- 0.05% of FS for input < 40V
Shop for Data Logging products online at: www.DataLoggerStore.com 1.888.610.7664
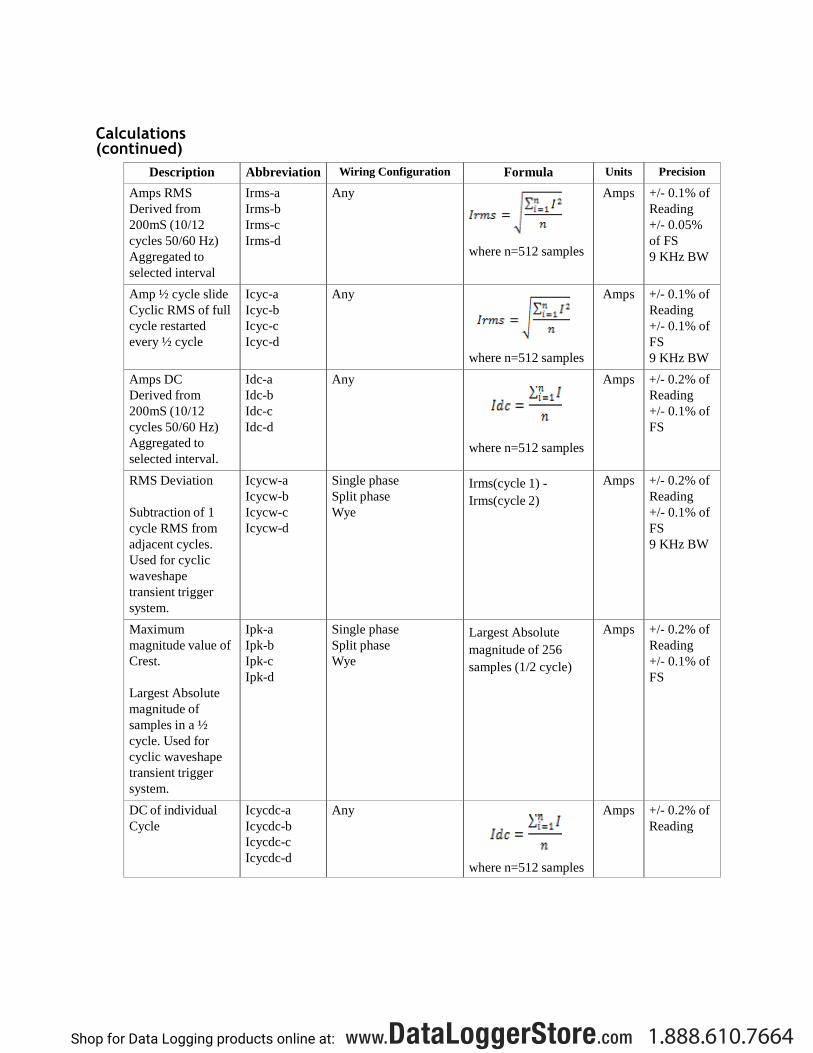
Calculations (continued)
Description Abbreviation Wiring Configuration Formula Units Precision
Amps RMS
Derived from
200mS (10/12
cycles 50/60 Hz)
Aggregated to
selected interval
Irms-a
Irms-b
Irms-c
Irms-d
Any
where n=512 samples
Amps +/- 0.1% of
Reading
+/- 0.05%
of FS
9 KHz BW
Amp ½ cycle slide
Cyclic RMS of full
cycle restarted
every ½ cycle
Icyc-a
Icyc-b
Icyc-c
Icyc-d
Any
where n=512 samples
Amps +/- 0.1% of
Reading
+/- 0.1% of
FS
9 KHz BW
Amps DC
Derived from
200mS (10/12
cycles 50/60 Hz)
Aggregated to
selected interval.
Idc-a
Idc-b
Idc-c
Idc-d
Any
where n=512 samples
Amps +/- 0.2% of
Reading
+/- 0.1% of
FS
RMS Deviation
Subtraction of 1
cycle RMS from
adjacent cycles.
Used for cyclic
waveshape
transient trigger
system.
Icycw-a
Icycw-b
Icycw-c
Icycw-d
Single phase
Split phase
Wye
Irms(cycle 1) -
Irms(cycle 2)
Amps +/- 0.2% of
Reading
+/- 0.1% of
FS
9 KHz BW
Maximum
magnitude value of
Crest.
Largest Absolute
magnitude of
samples in a ½
cycle. Used for
cyclic waveshape
transient trigger
system.
Ipk-a
Ipk-b
Ipk-c
Ipk-d
Single phase
Split phase
Wye
Largest Absolute
magnitude of 256
samples (1/2 cycle)
Amps +/- 0.2% of
Reading
+/- 0.1% of
FS
DC of individual
Cycle
Icycdc-a
Icycdc-b
Icycdc-c
Icycdc-d
Any
where n=512 samples
Amps +/- 0.2% of
Reading
Shop for Data Logging products online at: www.DataLoggerStore.com 1.888.610.7664
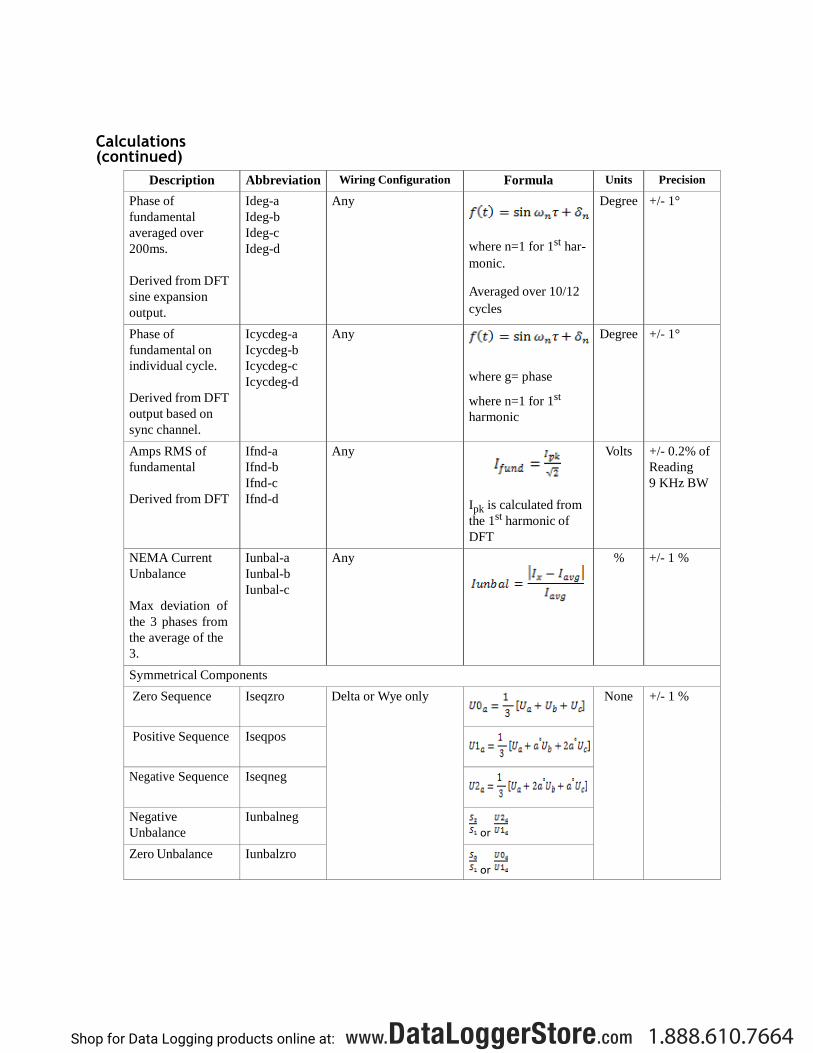
Calculations (continued)
Description Abbreviation Wiring Configuration Formula Units Precision
Phase of
fundamental
averaged over
200ms.
Derived from DFT
sine expansion
output.
Ideg-a
Ideg-b
Ideg-c
Ideg-d
Any
where n=1 for 1st har-
monic.
Averaged over 10/12
cycles
Degree +/- 1°
Phase of
fundamental on
individual cycle.
Derived from DFT
output based on
sync channel.
Icycdeg-a
Icycdeg-b
Icycdeg-c
Icycdeg-d
Any
where g= phase
where n=1 for 1st
harmonic
Degree +/- 1°
Amps RMS of
fundamental
Derived from DFT
Ifnd-a
Ifnd-b
Ifnd-c
Ifnd-d
Any
Ipk is calculated from
the 1st harmonic of
DFT
Volts +/- 0.2% of
Reading
9 KHz BW
NEMA Current
Unbalance
Max deviation of
the 3 phases from
the average of the
3.
Iunbal-a
Iunbal-b
Iunbal-c
Any
% +/- 1 %
Symmetrical Components
Zero Sequence Iseqzro Delta or Wye only
None +/- 1 %
Positive Sequence Iseqpos
Negative Sequence Iseqneg
Negative
Unbalance
Iunbalneg or
Zero Unbalance Iunbalzro or
Shop for Data Logging products online at: www.DataLoggerStore.com 1.888.610.7664
Calculations (continued)
Description Abbreviation Wiring Configuration Formula Units Precision
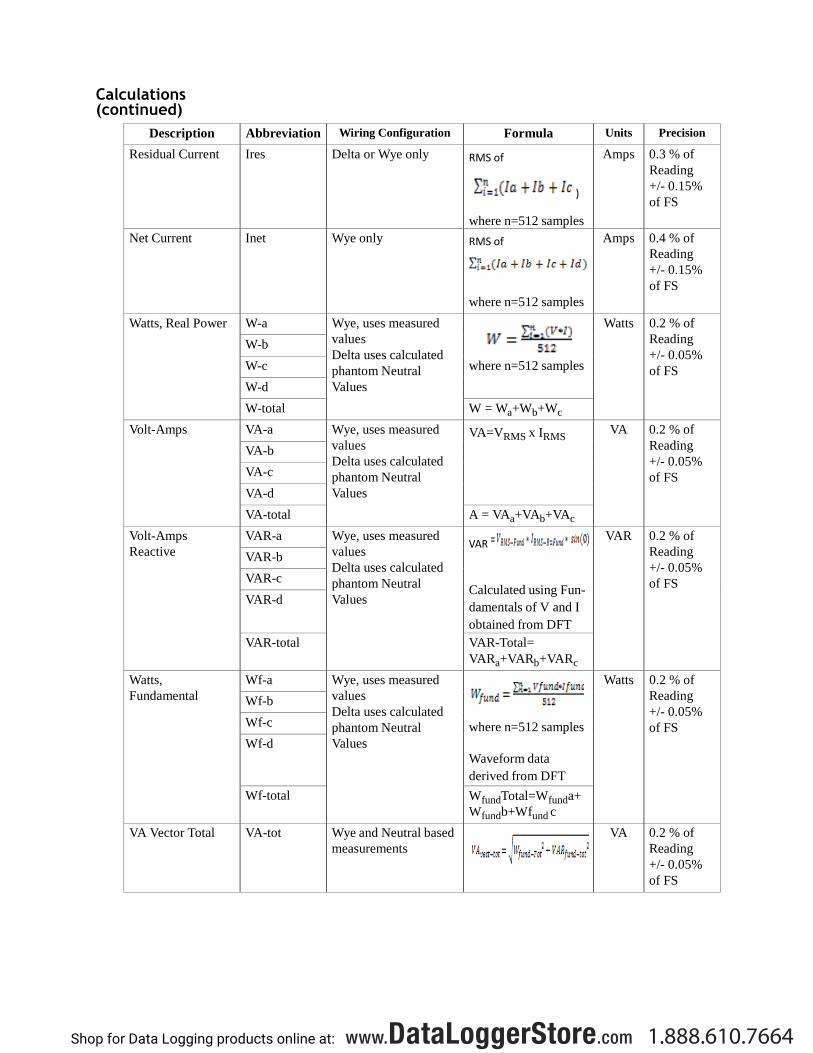
Residual Current Ires Delta or Wye only RMS of
)
where n=512 samples
Amps 0.3 % of
Reading
+/- 0.15%
of FS
Net Current Inet Wye only RMS of
where n=512 samples
Amps 0.4 % of
Reading
+/- 0.15%
of FS
Watts, Real Power W-a Wye, uses measured
values
Delta uses calculated
phantom Neutral
Values
where n=512 samples
Watts 0.2 % of
Reading
+/- 0.05%
of FS
W-b
W-c
W-d
W-total W = Wa+Wb+Wc
Volt-Amps VA-a Wye, uses measured
values
Delta uses calculated
phantom Neutral
Values
VA=VRMS x IRMS VA 0.2 % of
Reading
+/- 0.05%
of FS
VA-b
VA-c
VA-d
VA-total A = VAa+VAb+VAc
Volt-Amps
Reactive
VAR-a Wye, uses measured
values
Delta uses calculated
phantom Neutral
Values
VAR
Calculated using Fun-
damentals of V and I
obtained from DFT
VAR 0.2 % of
Reading
+/- 0.05%
of FS
VAR-b
VAR-c
VAR-d
VAR-total VAR-Total=
VARa+VARb+VARc
Watts,
Fundamental
Wf-a Wye, uses measured
values
Delta uses calculated
phantom Neutral
Values
where n=512 samples
Waveform data
derived from DFT
Watts 0.2 % of
Reading
+/- 0.05%
of FS
Wf-b
Wf-c
Wf-d
Wf-total WfundTotal=Wfunda+
Wfundb+Wfund c
VA Vector Total VA-tot Wye and Neutral based
measurements
VA 0.2 % of
Reading
+/- 0.05%
of FS
Shop for Data Logging products online at: www.DataLoggerStore.com 1.888.610.7664
Calculations (continued)
Description Abbreviation Wiring Configuration Formula Units Precision
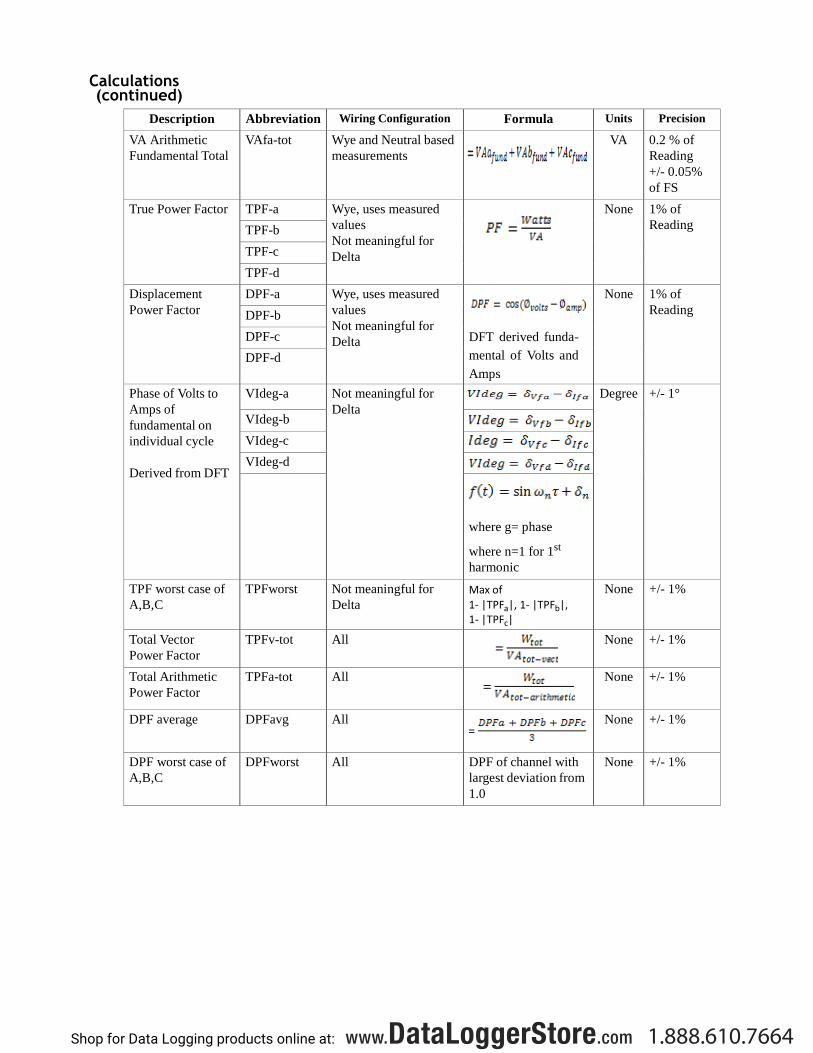
VA Arithmetic
Fundamental Total
VAfa-tot Wye and Neutral based
measurements
VA 0.2 % of
Reading
+/- 0.05%
of FS
True Power Factor TPF-a Wye, uses measured
values
Not meaningful for
Delta
None 1% of
Reading TPF-b
TPF-c
TPF-d
Displacement
Power Factor
DPF-a Wye, uses measured
values
Not meaningful for
Delta
DFT derived funda-
mental of Volts and
Amps
None 1% of
Reading DPF-b
DPF-c
DPF-d
Phase of Volts to
Amps of
fundamental on
individual cycle
Derived from DFT
VIdeg-a Not meaningful for
Delta
Degree +/- 1°
VIdeg-b
VIdeg-c
VIdeg-d
where g= phase
where n=1 for 1st
harmonic
TPF worst case of
A,B,C
TPFworst Not meaningful for
Delta
Max of
1- |TPFa|, 1- |TPFb|, 1- |TPFc|
None +/- 1%
Total Vector
Power Factor
TPFv-tot All
None +/- 1%
Total Arithmetic
Power Factor
TPFa-tot All
None +/- 1%
DPF average DPFavg All
None +/- 1%
DPF worst case of
A,B,C
DPFworst All DPF of channel with
largest deviation from
1.0
None +/- 1%
Shop for Data Logging products online at: www.DataLoggerStore.com 1.888.610.7664
Calculations (continued)
Description Abbreviation Wiring Configuration Formula Units Precision
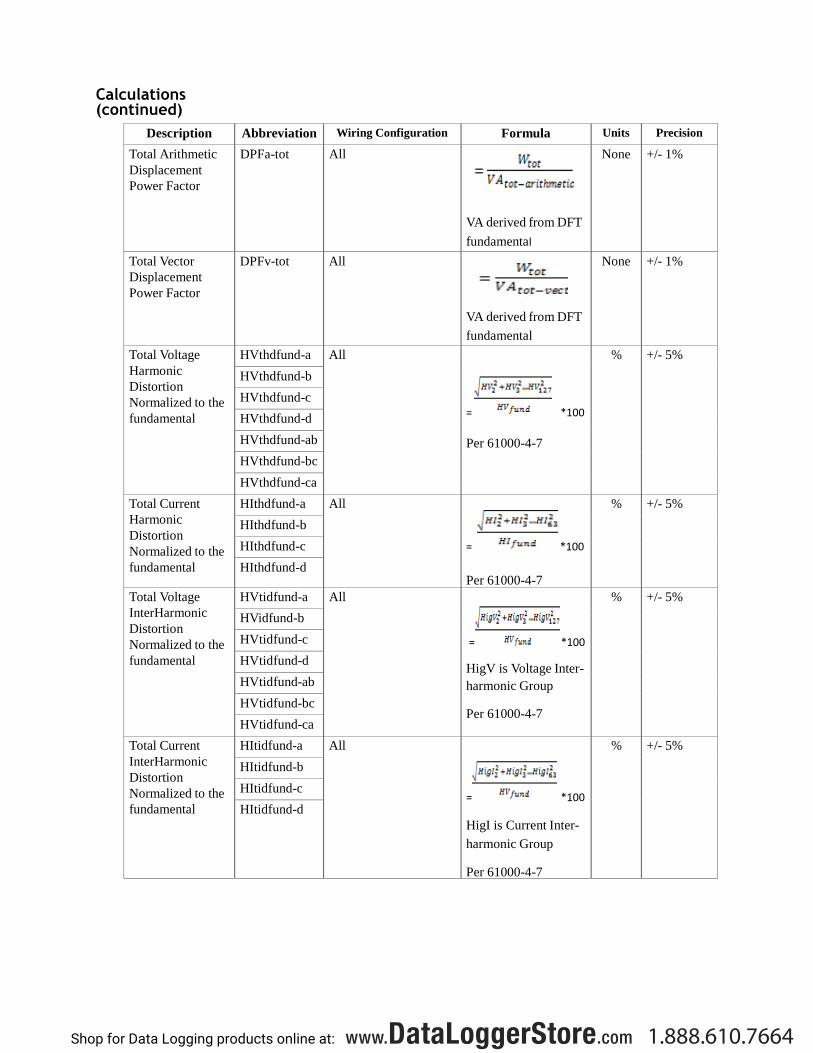
Total Arithmetic
Displacement
Power Factor
DPFa-tot All
VA derived from DFT
fundamental
None +/- 1%
Total Vector
Displacement
Power Factor
DPFv-tot All
VA derived from DFT
fundamental
None +/- 1%
Total Voltage
Harmonic
Distortion
Normalized to the
fundamental
HVthdfund-a All
= *100
Per 61000-4-7
% +/- 5%
HVthdfund-b
HVthdfund-c
HVthdfund-d
HVthdfund-ab
HVthdfund-bc
HVthdfund-ca
Total Current
Harmonic
Distortion
Normalized to the
fundamental
HIthdfund-a All
= *100
Per 61000-4-7
% +/- 5%
HIthdfund-b
HIthdfund-c
HIthdfund-d
Total Voltage
InterHarmonic
Distortion
Normalized to the
fundamental
HVtidfund-a All
= *100
HigV is Voltage Inter-
harmonic Group
Per 61000-4-7
% +/- 5%
HVidfund-b
HVtidfund-c
HVtidfund-d
HVtidfund-ab
HVtidfund-bc
HVtidfund-ca
Total Current
InterHarmonic
Distortion
Normalized to the
fundamental
HItidfund-a All
= *100
HigI is Current Inter-
harmonic Group
Per 61000-4-7
% +/- 5%
HItidfund-b
HItidfund-c
HItidfund-d
Shop for Data Logging products online at: www.DataLoggerStore.com 1.888.610.7664
Calculations (continued)
Description Abbreviation Wiring Configuration Formula Units Precision
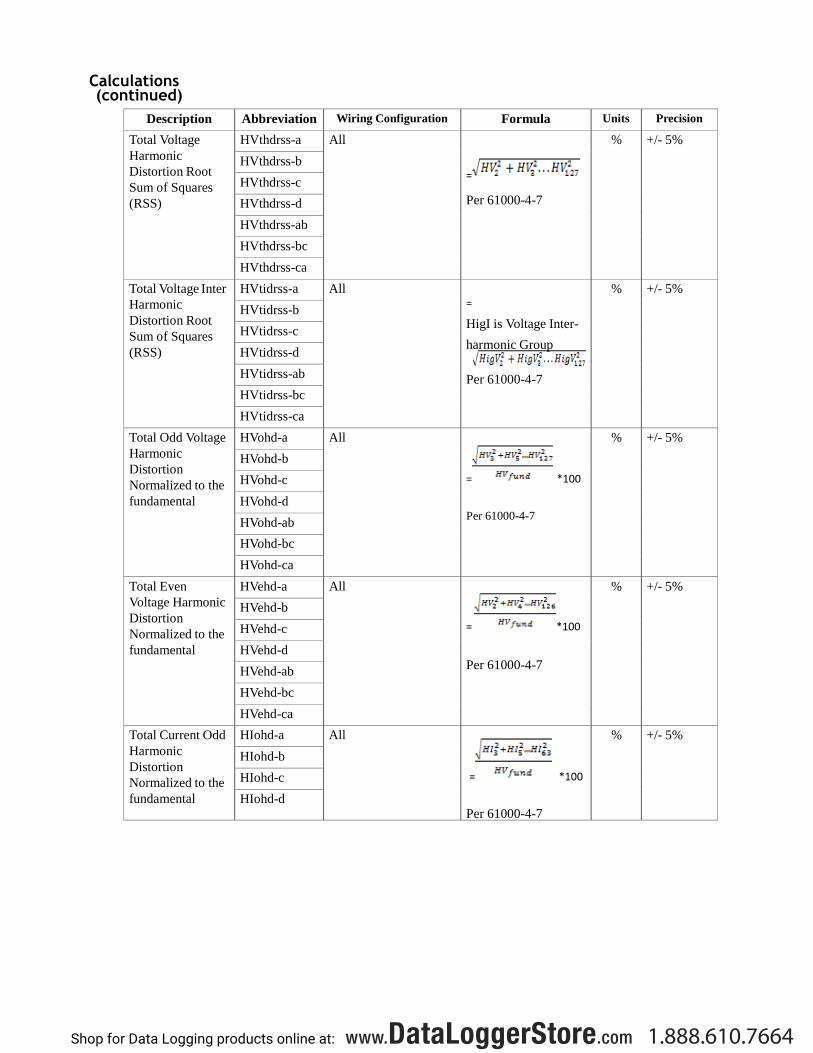
Total Voltage
Harmonic
Distortion Root
Sum of Squares
(RSS)
HVthdrss-a All
=
Per 61000-4-7
% +/- 5%
HVthdrss-b
HVthdrss-c
HVthdrss-d
HVthdrss-ab
HVthdrss-bc
HVthdrss-ca
Total Voltage Inter
Harmonic
Distortion Root
Sum of Squares
(RSS)
HVtidrss-a All =
HigI is Voltage Inter-
harmonic Group
Per 61000-4-7
% +/- 5%
HVtidrss-b
HVtidrss-c
HVtidrss-d
HVtidrss-ab
HVtidrss-bc
HVtidrss-ca
Total Odd Voltage
Harmonic
Distortion
Normalized to the
fundamental
HVohd-a All
= *100
Per 61000-4-7
% +/- 5%
HVohd-b
HVohd-c
HVohd-d
HVohd-ab
HVohd-bc
HVohd-ca
Total Even
Voltage Harmonic
Distortion
Normalized to the
fundamental
HVehd-a All
= *100
Per 61000-4-7
% +/- 5%
HVehd-b
HVehd-c
HVehd-d
HVehd-ab
HVehd-bc
HVehd-ca
Total Current Odd
Harmonic
Distortion
Normalized to the
fundamental
HIohd-a All
= *100
Per 61000-4-7
% +/- 5%
HIohd-b
HIohd-c
HIohd-d
Shop for Data Logging products online at: www.DataLoggerStore.com 1.888.610.7664
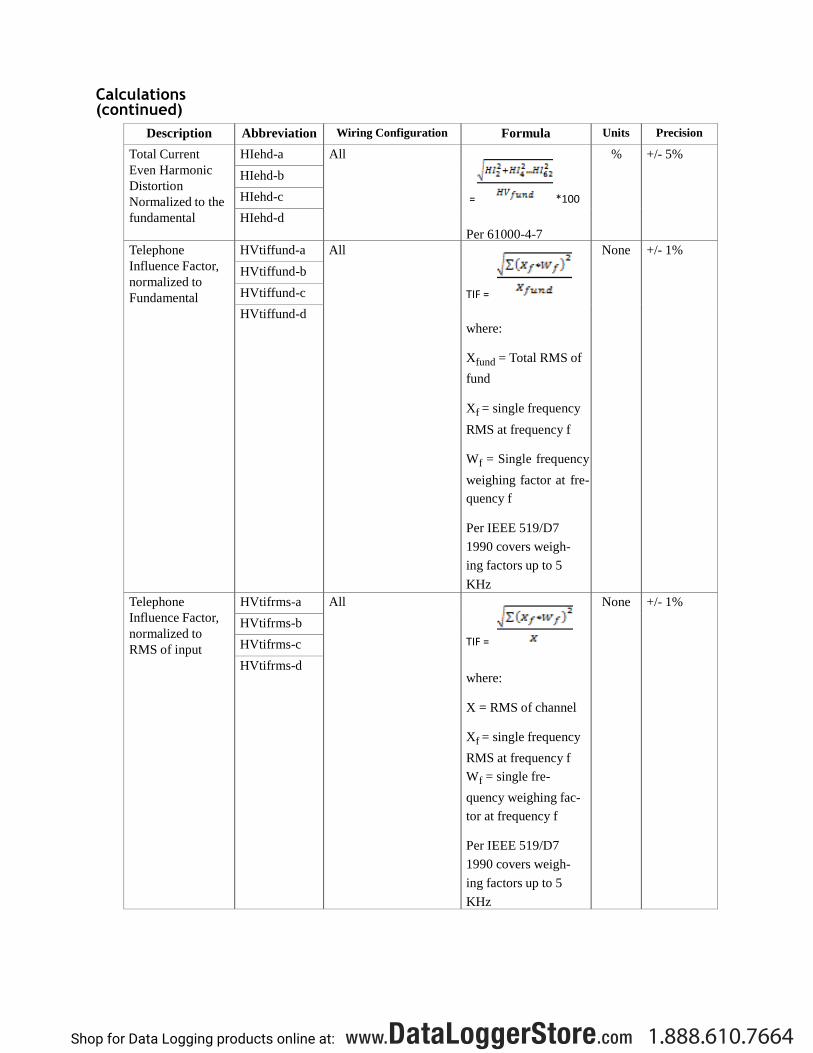
Calculations (continued)
Description Abbreviation Wiring Configuration Formula Units Precision
Total Current
Even Harmonic
Distortion
Normalized to the
fundamental
HIehd-a All
= *100
Per 61000-4-7
% +/- 5%
HIehd-b
HIehd-c
HIehd-d
Telephone
Influence Factor,
normalized to
Fundamental
HVtiffund-a All
TIF =
where:
Xfund = Total RMS of
fund
Xf = single frequency
RMS at frequency f Wf = Single frequency
weighing factor at fre-
quency f
Per IEEE 519/D7
1990 covers weigh-
ing factors up to 5
KHz
None +/- 1%
HVtiffund-b
HVtiffund-c
HVtiffund-d
Telephone
Influence Factor,
normalized to
RMS of input
HVtifrms-a All
TIF =
where:
X = RMS of channel
Xf = single frequency
RMS at frequency f
Wf = single fre-
quency weighing fac-
tor at frequency f
Per IEEE 519/D7
1990 covers weigh-
ing factors up to 5
KHz
None +/- 1%
HVtifrms-b
HVtifrms-c
HVtifrms-d
Shop for Data Logging products online at: www.DataLoggerStore.com 1.888.610.7664
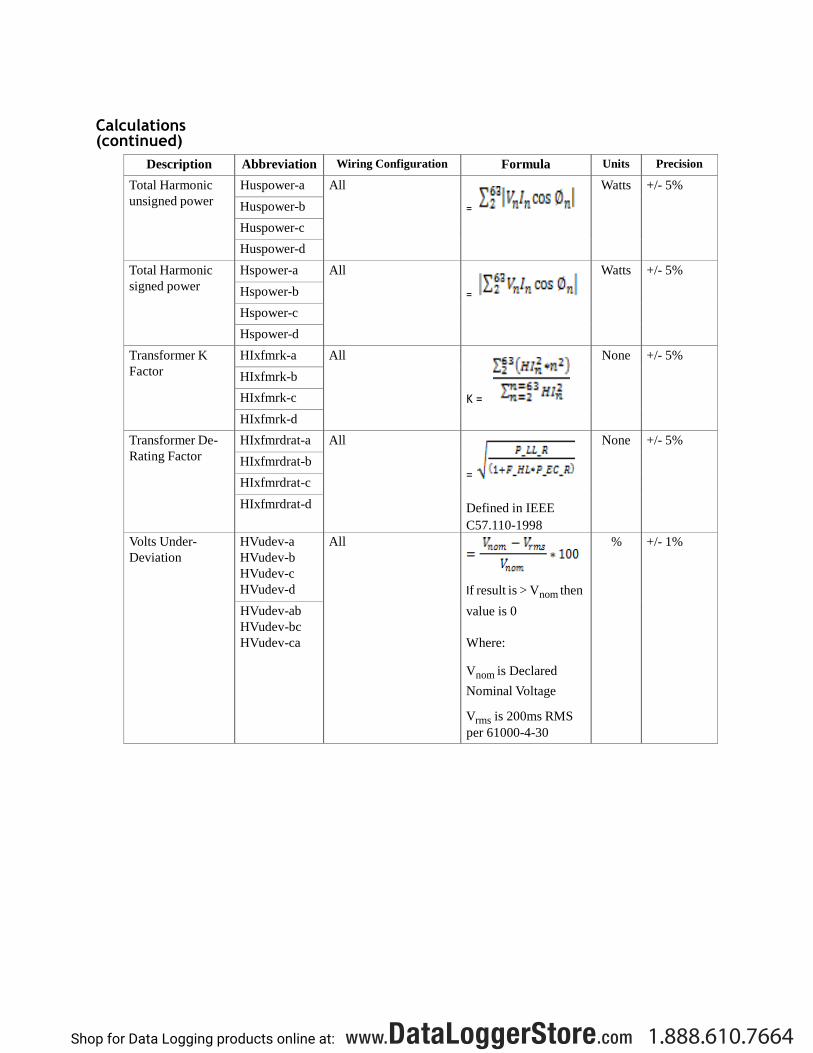
Calculations (continued)
Description Abbreviation Wiring Configuration Formula Units Precision
Total Harmonic
unsigned power
Huspower-a All
=
Watts +/- 5%
Huspower-b
Huspower-c
Huspower-d
Total Harmonic
signed power
Hspower-a All
=
Watts +/- 5%
Hspower-b
Hspower-c
Hspower-d
Transformer K
Factor
HIxfmrk-a All
K =
None +/- 5%
HIxfmrk-b
HIxfmrk-c
HIxfmrk-d
Transformer De-
Rating Factor
HIxfmrdrat-a All
=
Defined in IEEE
C57.110-1998
None +/- 5%
HIxfmrdrat-b
HIxfmrdrat-c
HIxfmrdrat-d
Volts Under-
Deviation
HVudev-a
HVudev-b
HVudev-c
HVudev-d
All
If result is > Vnom then
value is 0
Where:
Vnom is Declared
Nominal Voltage
Vrms is 200ms RMS per 61000-4-30
% +/- 1%
HVudev-ab
HVudev-bc
HVudev-ca
Shop for Data Logging products online at: www.DataLoggerStore.com 1.888.610.7664
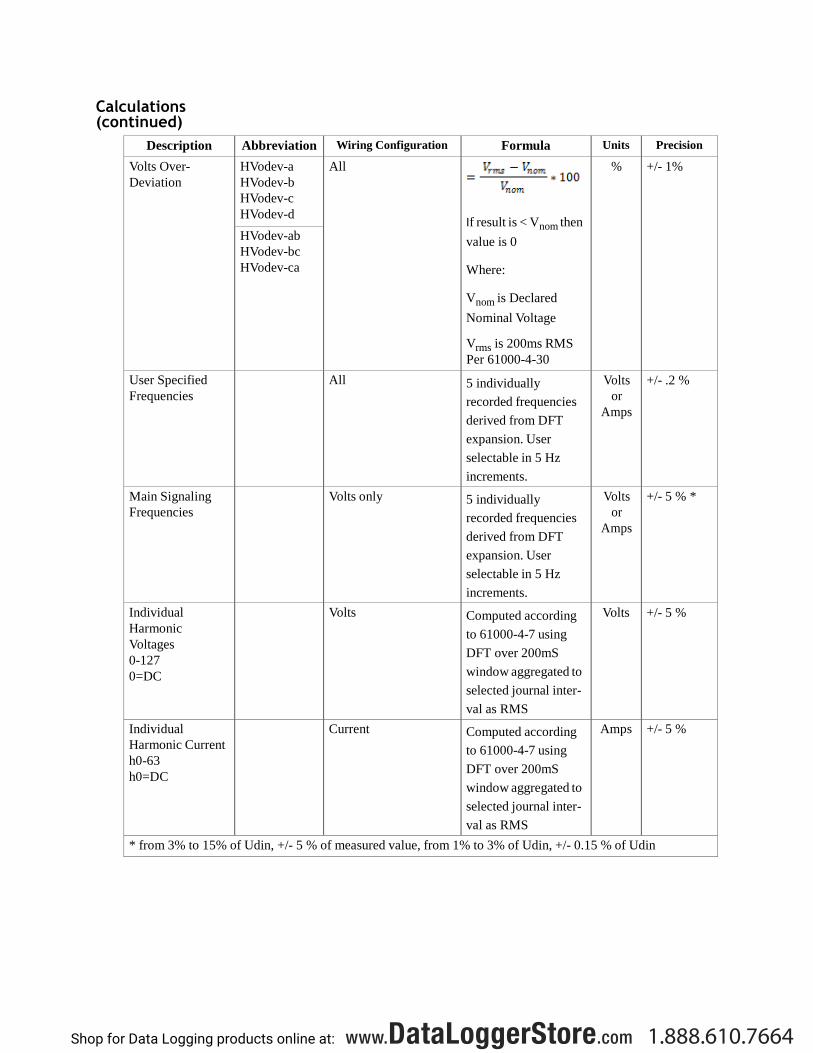
Calculations (continued)
Description Abbreviation Wiring Configuration Formula Units Precision
Volts Over-
Deviation
HVodev-a
HVodev-b
HVodev-c
HVodev-d
All
If result is < Vnom then
value is 0
Where:
Vnom is Declared
Nominal Voltage
Vrms is 200ms RMS
Per 61000-4-30
% +/- 1%
HVodev-ab
HVodev-bc
HVodev-ca
User Specified
Frequencies All 5 individually
recorded frequencies
derived from DFT
expansion. User
selectable in 5 Hz
increments.
Volts
or
Amps
+/- .2 %
Main Signaling
Frequencies Volts only 5 individually
recorded frequencies
derived from DFT
expansion. User
selectable in 5 Hz
increments.
Volts
or
Amps
+/- 5 % *
Individual
Harmonic
Voltages
0-127
0=DC
Volts Computed according
to 61000-4-7 using
DFT over 200mS
window aggregated to
selected journal inter-
val as RMS
Volts +/- 5 %
Individual
Harmonic Current
h0-63
h0=DC
Current Computed according
to 61000-4-7 using
DFT over 200mS
window aggregated to
selected journal inter-
val as RMS
Amps +/- 5 %
* from 3% to 15% of Udin, +/- 5 % of measured value, from 1% to 3% of Udin, +/- 0.15 % of Udin
Shop for Data Logging products online at: www.DataLoggerStore.com 1.888.610.7664
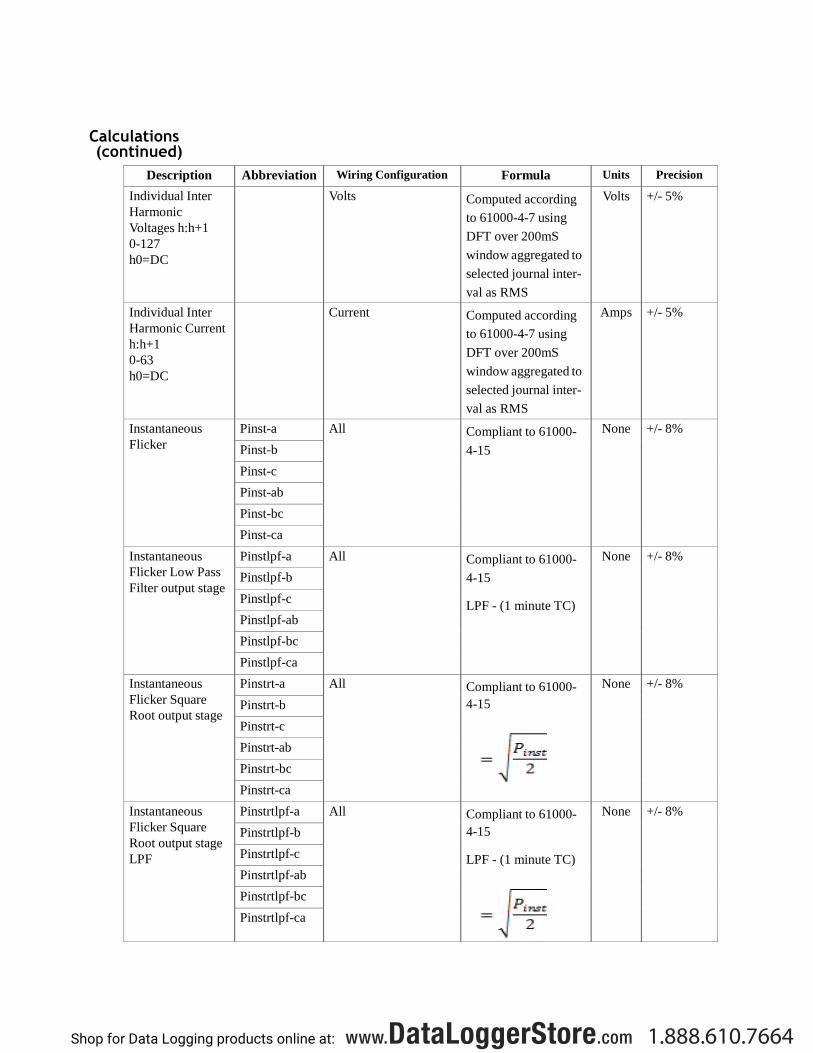
Calculations (continued)
Description Abbreviation Wiring Configuration Formula Units Precision
Individual Inter
Harmonic
Voltages h:h+1
0-127
h0=DC
Volts Computed according
to 61000-4-7 using
DFT over 200mS
window aggregated to
selected journal inter-
val as RMS
Volts +/- 5%
Individual Inter
Harmonic Current
h:h+1
0-63
h0=DC
Current Computed according
to 61000-4-7 using
DFT over 200mS
window aggregated to
selected journal inter-
val as RMS
Amps +/- 5%
Instantaneous
Flicker
Pinst-a All Compliant to 61000-
4-15
None +/- 8%
Pinst-b
Pinst-c
Pinst-ab
Pinst-bc
Pinst-ca
Instantaneous
Flicker Low Pass
Filter output stage
Pinstlpf-a All Compliant to 61000-
4-15
LPF - (1 minute TC)
None +/- 8%
Pinstlpf-b
Pinstlpf-c
Pinstlpf-ab
Pinstlpf-bc
Pinstlpf-ca
Instantaneous
Flicker Square
Root output stage
Pinstrt-a All Compliant to 61000-
4-15
None +/- 8%
Pinstrt-b
Pinstrt-c
Pinstrt-ab
Pinstrt-bc
Pinstrt-ca
Instantaneous
Flicker Square
Root output stage
LPF
Pinstrtlpf-a All Compliant to 61000-
4-15
LPF - (1 minute TC)
None +/- 8%
Pinstrtlpf-b
Pinstrtlpf-c
Pinstrtlpf-ab
Pinstrtlpf-bc
Pinstrtlpf-ca
Shop for Data Logging products online at: www.DataLoggerStore.com 1.888.610.7664
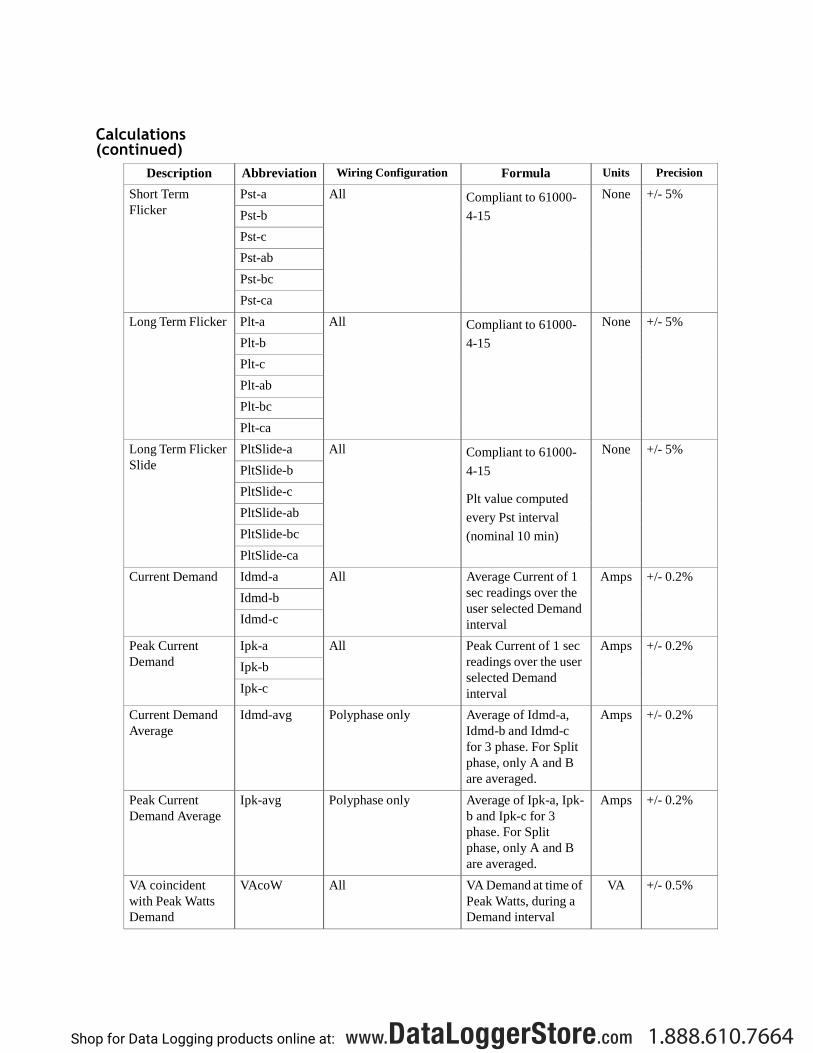
Calculations (continued)
Description Abbreviation Wiring Configuration Formula Units Precision
Short Term
Flicker
Pst-a All Compliant to 61000-
4-15
None +/- 5%
Pst-b
Pst-c
Pst-ab
Pst-bc
Pst-ca
Long Term Flicker Plt-a All Compliant to 61000-
4-15
None +/- 5%
Plt-b
Plt-c
Plt-ab
Plt-bc
Plt-ca
Long Term Flicker
Slide
PltSlide-a All Compliant to 61000-
4-15
Plt value computed
every Pst interval
(nominal 10 min)
None +/- 5%
PltSlide-b
PltSlide-c
PltSlide-ab
PltSlide-bc
PltSlide-ca
Current Demand Idmd-a All Average Current of 1
sec readings over the
user selected Demand
interval
Amps +/- 0.2%
Idmd-b
Idmd-c
Peak Current
Demand
Ipk-a All Peak Current of 1 sec
readings over the user
selected Demand
interval
Amps +/- 0.2%
Ipk-b
Ipk-c
Current Demand
Average
Idmd-avg Polyphase only Average of Idmd-a,
Idmd-b and Idmd-c
for 3 phase. For Split
phase, only A and B
are averaged.
Amps +/- 0.2%
Peak Current
Demand Average
Ipk-avg Polyphase only Average of Ipk-a, Ipk-
b and Ipk-c for 3
phase. For Split
phase, only A and B
are averaged.
Amps +/- 0.2%
VA coincident
with Peak Watts
Demand
VAcoW All VA Demand at time of
Peak Watts, during a
Demand interval
VA +/- 0.5%
Shop for Data Logging products online at: www.DataLoggerStore.com 1.888.610.7664
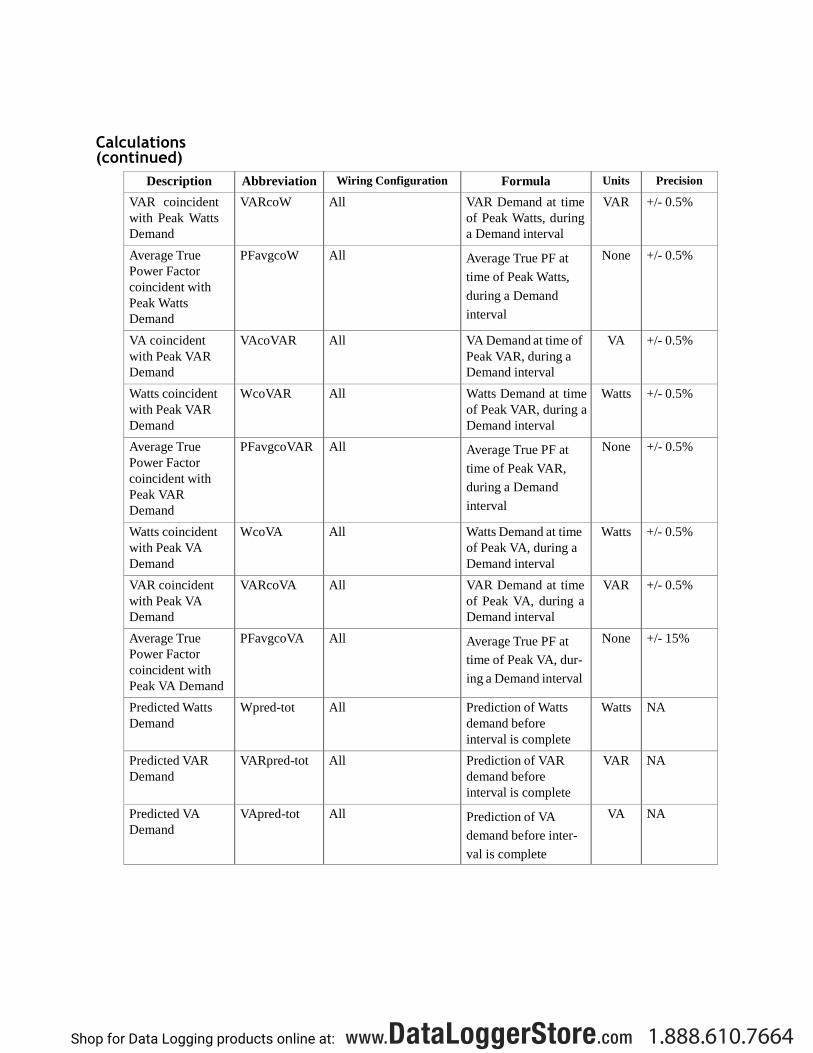
Calculations (continued)
Description Abbreviation Wiring Configuration Formula Units Precision
VAR coincident
with Peak Watts
Demand
VARcoW All VAR Demand at time
of Peak Watts, during
a Demand interval
VAR +/- 0.5%
Average True
Power Factor
coincident with
Peak Watts
Demand
PFavgcoW All Average True PF at
time of Peak Watts,
during a Demand
interval
None +/- 0.5%
VA coincident
with Peak VAR
Demand
VAcoVAR All VA Demand at time of
Peak VAR, during a
Demand interval
VA +/- 0.5%
Watts coincident
with Peak VAR
Demand
WcoVAR All Watts Demand at time
of Peak VAR, during a
Demand interval
Watts +/- 0.5%
Average True
Power Factor
coincident with
Peak VAR
Demand
PFavgcoVAR All Average True PF at
time of Peak VAR,
during a Demand
interval
None +/- 0.5%
Watts coincident
with Peak VA
Demand
WcoVA All Watts Demand at time
of Peak VA, during a
Demand interval
Watts +/- 0.5%
VAR coincident
with Peak VA
Demand
VARcoVA All VAR Demand at time
of Peak VA, during a
Demand interval
VAR +/- 0.5%
Average True
Power Factor
coincident with
Peak VA Demand
PFavgcoVA All Average True PF at
time of Peak VA, dur-
ing a Demand interval
None +/- 15%
Predicted Watts
Demand
Wpred-tot All Prediction of Watts
demand before
interval is complete
Watts NA
Predicted VAR
Demand
VARpred-tot All Prediction of VAR
demand before
interval is complete
VAR NA
Predicted VA
Demand
VApred-tot All Prediction of VA
demand before inter-
val is complete
VA NA
Shop for Data Logging products online at: www.DataLoggerStore.com 1.888.610.7664
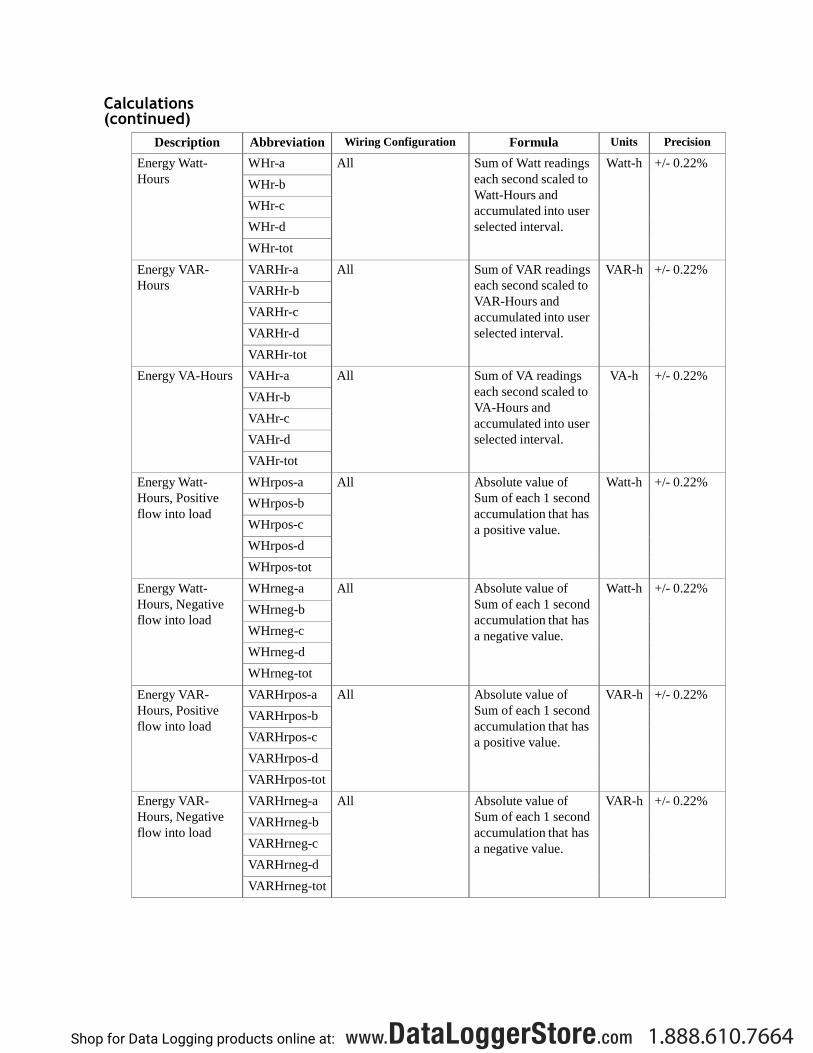
Calculations (continued)
Description Abbreviation Wiring Configuration Formula Units Precision
Energy Watt-
Hours
WHr-a All Sum of Watt readings
each second scaled to
Watt-Hours and
accumulated into user
selected interval.
Watt-h +/- 0.22%
WHr-b
WHr-c
WHr-d
WHr-tot
Energy VAR-
Hours
VARHr-a All Sum of VAR readings
each second scaled to
VAR-Hours and
accumulated into user
selected interval.
VAR-h +/- 0.22%
VARHr-b
VARHr-c
VARHr-d
VARHr-tot
Energy VA-Hours VAHr-a All Sum of VA readings
each second scaled to
VA-Hours and
accumulated into user
selected interval.
VA-h +/- 0.22%
VAHr-b
VAHr-c
VAHr-d
VAHr-tot
Energy Watt-
Hours, Positive
flow into load
WHrpos-a All Absolute value of
Sum of each 1 second
accumulation that has
a positive value.
Watt-h +/- 0.22%
WHrpos-b
WHrpos-c
WHrpos-d
WHrpos-tot
Energy Watt-
Hours, Negative
flow into load
WHrneg-a All Absolute value of
Sum of each 1 second
accumulation that has
a negative value.
Watt-h +/- 0.22%
WHrneg-b
WHrneg-c
WHrneg-d
WHrneg-tot
Energy VAR-
Hours, Positive
flow into load
VARHrpos-a All Absolute value of
Sum of each 1 second
accumulation that has
a positive value.
VAR-h +/- 0.22%
VARHrpos-b
VARHrpos-c
VARHrpos-d
VARHrpos-tot
Energy VAR-
Hours, Negative
flow into load
VARHrneg-a All Absolute value of
Sum of each 1 second
accumulation that has
a negative value.
VAR-h +/- 0.22%
VARHrneg-b
VARHrneg-c
VARHrneg-d
VARHrneg-tot
Shop for Data Logging products online at: www.DataLoggerStore.com 1.888.610.7664