hdp-align: hierarchical dirichlet process clustering for ... · hdp-align: hierarchical dirichlet...
TRANSCRIPT

HDP-Align: Hierarchical Dirichlet Process Clustering for Multiple PeakAlignment of Liquid Chromatography Mass Spectrometry Data.
Joe Wandy1,2,*, Ronan Daly1,2, Simon Rogers1,
1 School of Computing Science, University of Glasgow, United Kingdom2 Glasgow Polyomics, University of Glasgow, Glasgow, United Kingdom
Abstract
Matching peak features across multiple LC-MS runs (alignment) is an integral part of all LC-MS dataprocessing pipelines. Alignment is challenging due to variations in the retention time of peak featuresacross runs and the large number of peak features produced by a single compound in the analyte. Inthis paper, we propose a Bayesian non-parametric model that aligns peaks via a hierarchical clustermodel using both peak mass and retention time. Crucially, this method provides confidence values inthe form of posterior probabilities allowing the user to distinguish between aligned peaksets of highand low confidence. The results from our experiments on a diverse set of proteomic, glycomic andmetabolomic data show that the proposed model is able to produce alignment results competitive to otherwidely-used benchmark methods, while at the same time, provide a probabilistic measure of confidencein the alignment results, thus allowing the possibility to trade precision and recall.
Availability
Our method has been implemented as a stand-alone application in Java, available for download athttp://github.com/joewandy/HDP-Align.
1 Introduction
Liquid-chromatography coupled to mass-spectrometry (LC-MS) is a popular method for performinglarge-scale experiments and investigating the differential expression of compounds in LC-MS-based-omics(such as proteomics, metabolomics and glycomics). Large-scale untargeted LC-MS studies may involvethe analyses of potentially hundreds of runs [6]. Typical LC-MS data pre-processing pipelines operatein a serial manner with many intermediate steps. In untargeted LC-MS studies, the presence of evenrelatively small errors in any steps preceding the identification stage could potentially result in significantdifferences to the final analysis and biological conclusions. Alignment, where the correspondences betweenpeaks across runs are established, forms an integral part of the LC-MS data preprocessing pipelineand is a challenging problem due to the non-linear deviations in retention time (RT) of peak featuresacross runs [23] and the large number of ‘related-peaks’ derived from a single compound alone [9]. Theserelated-peaks include e.g. adducts, fragments and multiple ionisation forms, and often share similarchromatographic peak shape correlations and close RT values. In this paper, the term ‘run’ refers to theoutput from running any biological sample through the LC/MS instrument once, while the term ‘feature’refers to a tuple of minimally the (m/z,RT ) values derived from a single peak.
Alignment methods can be broadly divided into two categories [27]: (a) warping-based methodsthat perform RT correction of peak features before matching, and (b) direct-matching methods that
1/21
.CC-BY-NC-ND 4.0 International licensepeer-reviewed) is the author/funder. It is made available under aThe copyright holder for this preprint (which was not. http://dx.doi.org/10.1101/074831doi: bioRxiv preprint first posted online Sep. 12, 2016;

establish peak correspondence by performing matching on peak features directly, without performingRT correction, often by maximising some objective function. Warping methods attempt to correct theRT drifts present across runs, either using the full LC-MS profile data or the feature data alone. Oncethe time warping function has been established, finding the actual matching between peak features isstraightforward as both peak masses and RT values should be accurately conserved across runs. Incontrast, direct matching methods perform the alignment of peaks by directly matching the featuresacross runs, skipping the initial time-warping step. Direct matching methods can be preferred in certaincases due to their simplicity, while still offering good performance [14,22,33].
Alignment methods can also be categorised depending on whether they require a user-defined referencerun to be specified. When such reference is necessary, the full alignment of multiple runs is constructedthrough successive merging of pairwise runs towards the reference run (e.g. MZmine2’s Join alignerin [22]. Alternatively, methods that do not require a reference run can either operate in a hierarchicalfashion – where the final multiple alignment results are constructed in a greedy manner by merging ofsuccessive pairwise results following a guide tree (e.g. SIMA, described in [33]) – or by pooling featuresacross runs and grouping similar peaks in the combined input simultaneously (e.g. the group() functionof XCMS in [26]).
According to [27], the common shortcomings shared by many alignment methods include the incorrectmodelling assumption that elution order of peaks is preserved across runs and the abundance of user-defined parameters, which can dramatically influence alignment results. Further uncertainties can beintroduced due to the selection of a reference run and the construction of a guide tree in hierarchicalmethods. Since alignment is such an important part of the data preprocessing steps, it would beuseful to be able to robustly identify the uncertainty or confidence in the alignment results. Thesubject of identifying and quantifying uncertainty has been extensively investigated in the problem ofmultiple sequence alignment (MSA) for genomics and transcriptomics. [13] attempt to quantify thealignment uncertainty of the popular MSA tool ClustalW [30], based on evaluations using syntheticdata, and concludes that between half to all columns in their benchmark MSA results contain alignmenterrors. [19] construct a score that reflects the consensus between all possible pairwise alignments inT-COFFEE, while [20] propose GUIDANCE, a confidence measure obtained from pertubations of guidetrees. Statistical approaches that provide a measure of confidence in alignment results have also beenexplored by [24] and [2], where the MSA results and phylogeny are constructed simultaneously, thuseliminating the need for a guide tree.
Despite the clear benefits of alignment uncertainty quantification in the sequence domain, the challengeof quantifying alignment results remains relatively unaddressed for the alignment of multiple runs inLC-MS-based-omics. Bayesian methods operating on profile data [11, 16, 32] and feature-based alignmentmethods [7, 22, 33] exist to correct RT drift, but in such methods, uncertainties are not propagated fromthe RT regression stage to the necessary peak matching stage that follows. Several recent feature-basedalignment methods incorporate probabilistic modelling as part of their workflow, making it possible toextract some form of scores or probabilities on the alignment results. These methods are often limitedto the alignment of two runs, which is not a realistic assumption in actual LC-MS experiments. Forexample, [10] propose an empirical Bayes model for pairwise peak matching. Matching confidence canbe obtained from the model in form of posterior probability for any peak pair in two runs, howeverconstructing multiple alignment results in [10] still requires a greedy search to find candidate featureswithin m/z and RT-RT tolerances to a predetermined set of ‘landmark’ peaks. [8] describe PeakLink, aworkflow for alignment that performs an initial warping using a fourth-degree polynomial. PeakLinkposes the pairwise matching problem as a binary classification problem, where a Support Vector Machine(SVM) is trained based on an alignment ground truth derived from MS-MS information and used todifferentiate matching and non-matching candidate pairs to produce the actual alignment results. Whilenot explicitly included in the output of PeakLink, a matching score can be extracted from the SVM thatrepresents how far each candidate pair is from the decision boundary. Note that these scores are notwell-calibrated in the probabilistic sense, thus making comparisons of matching scores less straightforward.PeakLink is also not extended to the problem of aligning multiple runs, although [8] state that it wouldbe possible to do so with the choice of a suitable reference run.
2/21
.CC-BY-NC-ND 4.0 International licensepeer-reviewed) is the author/funder. It is made available under aThe copyright holder for this preprint (which was not. http://dx.doi.org/10.1101/074831doi: bioRxiv preprint first posted online Sep. 12, 2016;

The goal of establishing the matching of peaks across multiple runs at once can be viewed as aclustering problem, where a set of peaks can be grouped (by their m/z, RT and other suitable features)into local clusters within each run (representing all of the peaks from an individual compound), which arefurther grouped into global clusters shared across runs. A preliminary form of this idea has been exploredin [5], where hierarchical clustering is performed on the total ion chromatogram data to group peaks intowithin-run local clusters, which are further grouped into across-run super clusters. The highly accuratemass information available from modern LC-MS platforms is not used in [5], although it is highlighted asa possible future work. The choice of using a hierarchical clustering method in [5] also requires choosingvarious user-defined parameters, such as determining a suitable cut-off for the dendogram produced,deciding on a suitable linkage method and defining an appropriate distance measure between groups ofpeaks.
In this work, we expand upon the idea of viewing direct matching as a hierarchical clustering problemby proposing HDP-Align, a Bayesian non-parametric model that groups related-peaks within runs andassigns them to global clusters shared across runs. Within each global cluster, peaks are further groupedby their m/z values into mass clusters, which represent the various ionisation products (IPs) derivedfrom the global compound. The proposed model allows us to infer the matching of peaks across all runsat once, without the need for any intermediate merging of pairwise runs, and the resulting posteriorsummaries provide us with a confidence score in the matching quality of aligned peaksets. This introducesthe possibility of allowing the user to trade recall for precision from the alignment results by returning asmaller subset of the results having a higher confidence score of being correctly aligned. Figure 1 showsan illustration of the clustering process in HDP-Align. Additionally, the latent variables of clusteringstructure inferred in the model can potentially have physically meaningful identities that can be usedfor further analysis, and using a metabolomic dataset, we demonstrate the usefulness of such clusteringobjects by using the mass clusters derived from the model to perform putative annotations of featuresbased on their potential adduct types and metabolite identities.
2 Related Work
The goal of establishing the matching of peaks across multiple runs at once can be viewed as a clusteringproblem, where a set of peaks can be grouped (by their m/z, RT and other suitable features) into localclusters within each run (representing all of the peaks from an individual compound), which are furthergrouped into global clusters shared across runs. Hierarchical clustering has been used for the matching ofpeaks across runs [5,31]. In [31], peaks are hierarchically clustered based on their m/z values to constructmatching across runs, while in [5], peaks from the entire dataset are pooled and a hierarchical clusteringscheme based on RT only is used to group peaks into within-run local clusters, which are further groupedinto across-run super clusters. Both approaches require choosing various user-defined parameters, suchas determining a suitable cut-off for the dendogram produced, deciding on a suitable linkage methodand defining an appropriate distance measure between groups of peaks. In [31], no chromatographicseparation is performed, so only the m/z values of peaks are used. The nature of the gas chromatographydata used in [5], where retention time across runs is more reproducible, means that even without usingthe m/z information, good alignment performance can still be obtained. This will not be the case ofLC-MS data, where retention time drift is common and the highly accurate m/z information is crucialfor alignment. The proposed HDP-Align model fills this gap where both m/z and RT values, importantfor LC-MS peak alignment, are used for the hierarchical clustering process. The probabilistic approachemployed by HDP-Align also allows us to extract confidence values from aligned peaksets.
3 Hierarchical Dirichlet Process Mixture Model for Alignment
The proposed model for HDP-Align is framed as a Hierarchical Dirichlet Process (HDP) mixture model [29].Essential modifications to the basic HDP model were performed to suit the nature of the multiple peakalignment problem. Figure 2 shows the conditional dependencies between random variables in the
3/21
.CC-BY-NC-ND 4.0 International licensepeer-reviewed) is the author/funder. It is made available under aThe copyright holder for this preprint (which was not. http://dx.doi.org/10.1101/074831doi: bioRxiv preprint first posted online Sep. 12, 2016;

Figure 1. An illustrative example of how the proposed model in HDP-Align simultaneously (1) performsthe clustering of related peak features into within-run local clusters by their RT values, (2) assigns thepeak features to global RT clusters shared across runs, and (3) separates peak features into mass clusters,which correspond to aligned peaksets.
4/21
.CC-BY-NC-ND 4.0 International licensepeer-reviewed) is the author/funder. It is made available under aThe copyright holder for this preprint (which was not. http://dx.doi.org/10.1101/074831doi: bioRxiv preprint first posted online Sep. 12, 2016;

HDP-Align model.
Figure 2. Graphical model for HDP-Align. xjn is the observed RT value of peak n in file j, while yjn isthe observed m/z value.
Our input consists of J input files, indexed by j = 1, ..., J , corresponding to the J LC-MS runs to bealigned. Each j-th input file contains Nj peaks in total, which can be separated into Kj local clustersof related-peaks. In a j-th file, peaks are indexed by n = 1, ..., Nj and local clusters are indexed byk = 1, ...,Kj . Across all files, we assign each local cluster k in file j to a global cluster i = 1, ..., I, whereI is the total number of global clusters, using the indicator variable v, as described in the followingparagraph. A global cluster corresponds to the compound of interest during LC-MS analysis, e.g.metabolite or peptide fragment, that is present across runs, while local clusters are realisations of theglobal clusters in a specific run. Finally, within each global cluster i, we can further group peaks by theirm/z values into A mass clusters (indexed by a = 1, ..., A). Each mass cluster therefore corresponds to theionization product peaks coming from the different runs that are produced by a global compound duringmass spectrometry.
We use the indicator variable zjnk = 1 to denote the assignment of peak n in file j to local cluster kin that file. Similarly, vjni = 1 if peak n in file j is assigned to global cluster i, and vjnia = 1 if peakn in file j is assigned to mass cluster a linked to metabolite i. Let dj be the list of observed data ofpeaks in file j, dj = (dj1,dj2, ...,djn) where djn = (xjn, yjn) with xjn the RT value and yjn the log m/zvalue of the peak feature. The log of m/z value is here used as the m/z error is assumed to increaselinearly with the observed m/z value [21]. θ denotes the global mixing proportions and πj the localmixing proportions for file j. The global mixing proportions θ are distributed according to the Griffiths,Engen and McCloskey (GEM) distribution:
θ|α′ ∼ GEM(α′) (1)
5/21
.CC-BY-NC-ND 4.0 International licensepeer-reviewed) is the author/funder. It is made available under aThe copyright holder for this preprint (which was not. http://dx.doi.org/10.1101/074831doi: bioRxiv preprint first posted online Sep. 12, 2016;

where the GEM distribution over θ is described through the stick-breaking construction:
βi ∼ Beta(1, α′) (2)
θi = βi
i−1∏l=1
(1− βl) (3)
The local mixing proportions πj are distributed according to a Dirichlet Process (DP) prior with thebase measure θ and concentration parameter αt.
πj |αt,θ ∼ DP (αt,θ) (4)
Within each file j, the indicator variable zjnk = 1 denotes the assignment of peak n in file j to local RTcluster k in that file. This follows the local mixing proportions for that file.
zjnk = 1|πj ∼ πj (5)
The RT value ti of a global mixture component is drawn from a base Gaussian distribution with meanµ0 and precision (inverse variance) σ0.
ti|µ0, σ0 ∼ N (µ0, σ−10 ) (6)
The RT value tij of a local mixture component in file j is normally distributed with mean ti and precisionδ. The precision controls how much RT values of related-peak groups across runs are allowed to deviatefrom the parent global compound’s RT.
tjk|ti, δ ∼ N (ti, δ−1) (7)
Finally, the observed peak RT value is normally distributed with mean tjk and precision γ. The precisioncontrols how much RT values of peaks can deviate from their related-peak group.
xjn|zjnk = 1, tjk, γ ∼ N (tjk, γ−1) (8)
The m/z value produced through high-precision MS instrument is highly accurate, and its correspondenceis often preserved across runs. Once peaks have been assigned to their respective global clusters, we needto further separate peaks within each global cluster into mass clusters to obtain the actual alignment.These mass cluster corresponds to ionisation products. We do this by incorporating an internal DPmixture model on the m/z values (yjn) within each global cluster i. Let the indicator vjnia = 1 denotesthe assignment of peak n in file j to mass cluster a in the i-th global cluster. Then:
λi|αm ∼ GEM(αm) (9)
vjnia = 1|λi ∼ λi (10)
µia|ψ0, ρ0 ∼ N (µia|ψ0, ρ−10 ) (11)
yjn|vjnia = 1, µia ∼ N (µia, ρ−1) · I(djn) (12)
where the index ia refers to the a-th mass cluster of the i-th global cluster. λi is the mixing proportionsof the i-th internal DP mixture for the masses, with αm the concentration parameter. µia is the masscluster mean, drawn from the Gaussian base distribution with mean ψ0 and precision ρ0. The observedmass value is drawn from a Gaussian distribution with the component mean µia and precision ρ, forwhich the value is set based on the MS instrument’s resolution. Additionally, we add an additionalconstraint on the likelihood of yjn using the indicator function I(·) such that I(djn) = 1 if there are noother peaks inside the mass cluster that come from the same file as the current djn peak, and 0 otherwise.This constraint captures the restriction that a peak feature can only be matched to other peaks fromdifferent files, reflecting the assumption that within each LC-MS run, compounds produce ionisationproducts with distinct mass-to-charge fingerprints that can be used for matching to other runs.
6/21
.CC-BY-NC-ND 4.0 International licensepeer-reviewed) is the author/funder. It is made available under aThe copyright holder for this preprint (which was not. http://dx.doi.org/10.1101/074831doi: bioRxiv preprint first posted online Sep. 12, 2016;

4 Inference
Inference within the model is performed via a Gibbs sampling scheme, allowing us to compute thealignment probabilities through the proportion of posterior samples in which any sets of peaks are placedin the same mass component (a) in the same top-level cluster. In this manner, peaks coming fromdifferent runs that are in the same mass component are considered to be aligned as they have similarRT and m/z values. In each iteration of the sampling procedure, we instantiate the mixture componentparameters for the local RT cluster (tjk) and global RT cluster (ti) in the mixture model. In the internalDP mixture linked to each global cluster i, we marginalise out the mass cluster parameters (µia). Theinitialisation step of the sampler is performed by assigning all peaks in each run into a single local RTcluster. Across runs, these local clusters are assigned under a global cluster shared across runs. Within aglobal cluster, peaks coming from different runs are assigned to a single mass cluster. The sampler thaniterates through each peak feature, removing it from the model, updating the assignment of peaks toclusters and performing the necessary book-keeping on any instantiated mixture components. Furtherdetails on the specific Gibbs update statements can be found in following sections.
4.1 Updating peak assignments
We use the following variables to denote the count of items in any clustering object: cjk is the number ofpeaks in a local cluster k of file j. ci is the number of local clusters in a global cluster i, and cia is thenumber of peaks in a mass cluster a inside a global RT cluster i. To update the assignment of a peak djnto local RT cluster k during Gibbs sampling, we need the conditional probability of P (zjnk = 1) givenevery other parameters, denoted as P (zjnk = 1|djn, . . .).
(13)P (zjnk = 1|djn, ...) ∝
{cjk · p(djn|zjnk = 1, ...)
αt · p(djn|zjnk∗ = 1, ...)
We consider the top and bottom terms of eq. (13) separately in the following.
1. The likelihood of the peak djn to be in an existing local RT cluster k, p(djn|zjnk = 1, ...) isproportional to cjk. This is assumed to factorise across the RT (xjn) and mass (yjn) terms
(14)p(djn|zjnk = 1, ...) = p(xjn|zjnk = 1, ...) · p(yjn|zjnk = 1, ...)
The RT term p(xjn|zjnk = 1, ...) in eq. (14) is normally distributed with mean tjk and precision γ,while the mass term p(yjn|zjnk = 1, ...) is an internal DP mixture of mass components linked tothe parent global cluster i of an existing local cluster k. We then marginalise over all mass clustersin i to get p(yjn|zjnk = 1, vjni = 1...)
(15)p(yjn|zjnk = 1, vjni = 1...) =
∑a
ciaαm +
∑a cia
p(yjn|vjnia = 1, ...)
+αm
αm +∑a cia
p(yjn|vjnia∗ = 1, ...)
To compute the terms in eq. (15), first we consider the case for an existing mass cluster a in theglobal RT cluster i. Then,
(16)p(yjn|vjnia = 1, ...) = N (µia, ρ−1)
For a new mass cluster a∗ in the global RT cluster i, we marginalise out µia to obtain
(17)p(yjn|vjnia∗ = 1, ...) = N (ψ0, ρ−1 + ρ−10 )
7/21
.CC-BY-NC-ND 4.0 International licensepeer-reviewed) is the author/funder. It is made available under aThe copyright holder for this preprint (which was not. http://dx.doi.org/10.1101/074831doi: bioRxiv preprint first posted online Sep. 12, 2016;
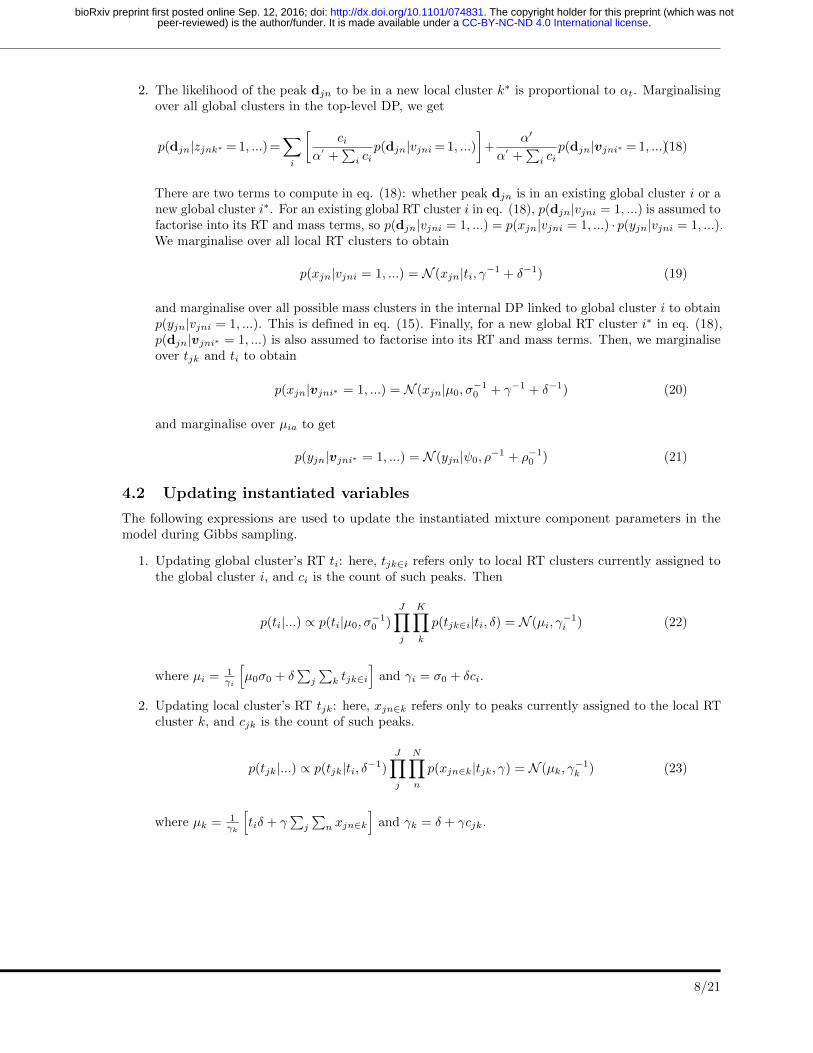
2. The likelihood of the peak djn to be in a new local cluster k∗ is proportional to αt. Marginalisingover all global clusters in the top-level DP, we get
(18)p(djn|zjnk∗ = 1, ...) =∑i
[ci
α′ +∑i ci
p(djn|vjni = 1, ...)
]+
α′
α′ +∑i ci
p(djn|vjni∗ = 1, ...)
There are two terms to compute in eq. (18): whether peak djn is in an existing global cluster i or anew global cluster i∗. For an existing global RT cluster i in eq. (18), p(djn|vjni = 1, ...) is assumed tofactorise into its RT and mass terms, so p(djn|vjni = 1, ...) = p(xjn|vjni = 1, ...) · p(yjn|vjni = 1, ...).We marginalise over all local RT clusters to obtain
(19)p(xjn|vjni = 1, ...) = N (xjn|ti, γ−1 + δ−1)
and marginalise over all possible mass clusters in the internal DP linked to global cluster i to obtainp(yjn|vjni = 1, ...). This is defined in eq. (15). Finally, for a new global RT cluster i∗ in eq. (18),p(djn|vjni∗ = 1, ...) is also assumed to factorise into its RT and mass terms. Then, we marginaliseover tjk and ti to obtain
(20)p(xjn|vjni∗ = 1, ...) = N (xjn|µ0, σ−10 + γ−1 + δ−1)
and marginalise over µia to get
(21)p(yjn|vjni∗ = 1, ...) = N (yjn|ψ0, ρ−1 + ρ−10 )
4.2 Updating instantiated variables
The following expressions are used to update the instantiated mixture component parameters in themodel during Gibbs sampling.
1. Updating global cluster’s RT ti: here, tjk∈i refers only to local RT clusters currently assigned tothe global cluster i, and ci is the count of such peaks. Then
(22)p(ti|...) ∝ p(ti|µ0, σ−10 )
J∏j
K∏k
p(tjk∈i|ti, δ) = N (µi, γ−1i )
where µi = 1γi
[µ0σ0 + δ
∑j
∑k tjk∈i
]and γi = σ0 + δci.
2. Updating local cluster’s RT tjk: here, xjn∈k refers only to peaks currently assigned to the local RTcluster k, and cjk is the count of such peaks.
(23)p(tjk|...) ∝ p(tjk|ti, δ−1)J∏j
N∏n
p(xjn∈k|tjk, γ) = N (µk, γ−1k )
where µk = 1γk
[tiδ + γ
∑j
∑n xjn∈k
]and γk = δ + γcjk.
8/21
.CC-BY-NC-ND 4.0 International licensepeer-reviewed) is the author/funder. It is made available under aThe copyright holder for this preprint (which was not. http://dx.doi.org/10.1101/074831doi: bioRxiv preprint first posted online Sep. 12, 2016;

4.3 Using the Inference Results
Using the posterior samples from Gibbs sampling, we can compute various posterior summaries and moreinterestingly, extract the alignment of peaks from the inference results (since features assigned into thesame mass cluster within the same global RT cluster are considered to be aligned). For each sample, werecord the aligned peaksets of peaks put into the same mass cluster. Averaging over all samples providesa distribution over these aligned peaksets. Note that across all the aligned peaksets from all samples, itis possible for the same peak to be matched to different partners with varying probabilities, dependingon how often they co-occur together in the same mass cluster. To allow the possibility of controllingprecision and recall from the results, we provide another user-defined threshold t, where aligned peaksetsare returned only when they occur with matching probability >t. Varying this threshold allows the userto use HDP-Align to trade precision for recall: a low value for t gives a larger set of results that arepotentially less precise, while conversely a high t provides a smaller, more precise set of aligned peaksets.This is an output not available from the other baseline alignment methods and can potentially be usefulin problem domains where high precision is required from the alignment results.
4.4 Isotopic Product and Metabolite Identity Annotations
In metabolomic studies using electrospray ionisation, a single metabolite can generate multiple ionisationproducts (IPs, such as isotopic variants, adducts, fragment peaks), alongside other peaks resulting fromnoise and artifacts introduced during mass spectrometry [15]. Determining and annotating these IPpeaks are desirable to remove extraneous peaks and reduce the burden of subsequent analysis in the dataprocessing pipeline. Additionally, deducing the precursor mass of the compound that generates the IPpeaks is necessary to query compound library databases in order to assign metabolite identities.
The resulting clustering objects inferred from HDP-Align lend themselves to further analysis in anatural fashion, as global RT clusters in HDP-Align may correspond to metabolites, while local RTclusters may correspond to the noisy realisations of these metabolites within each run. Mass clusters inthe internal mixture of each global cluster could correspond to the ionisation products of a metabolite.To demonstrate the possibility of obtaining additional information beyond alignment from the output ofHDP-Align, we follow the workflow in [15] that performs IPs and metabolite annotations of peaks. Thisworkflow is composed of multiple key steps: peak matching, ionisation product clustering and metabolitemass matching. A key difference of HDP-Align to the workflow in [15] lies in the fact that HDP-Align isable to perform the two separate steps of peak alignment and potential IP clustering simultaneously, asshown in Figure 3.
Given the set of potential IP clusters, we can perform IP annotations on the peaks. To do this usingthe metabolomic dataset, first we take the set of clustering objects produced in a posterior sample.For each mass cluster, we assign its m/z value to be the average m/z values of features assigned to it,denoted by m. The list of common adducts (Table 1) in positive ionisation mode is used to compute theinverse transformation for the precursor mass that generates the observed mass. Following [15], any twomass clusters sharing the same precursor mass (within tolerance) provide a vote on the presence of thatconsensus precursor mass. The mass clusters and peaks inside them can be annotated with the adducttype that produces the transformation type to the shared precursor mass. The set of precursor massesdeduced in this manner can also be used to query KEGG (a database of metabolite compounds) in orderto assign metabolite identities to the global compound.
5 EVALUATION STUDY
5.1 Evaluation Datasets
Performance of the proposed methods and other benchmark methods is evaluated on LC-MS datasets fromproteomic, glycomic and metabolomic experiments (Table 5 summarises the number of features in thedatasets). The Proteomic dataset is obtained from [14]. All 6 fractions from the Proteomic dataset in [14],each containing 2 runs of features having high RT variations across runs, are used in our experiments. The
9/21
.CC-BY-NC-ND 4.0 International licensepeer-reviewed) is the author/funder. It is made available under aThe copyright holder for this preprint (which was not. http://dx.doi.org/10.1101/074831doi: bioRxiv preprint first posted online Sep. 12, 2016;

Figure 3. Comparisons on the workflow to assign putative annotations on isotopic products andmetabolites described in Lee. et al. (2013) [15] and in HDP-Align.
Table 1. List of common adduct types in positive ionisation mode for ESI.
Adduct Types
M+2H M+H M+ACN+H M+H+NH4
M+NH4 M+ACN+Na 2M+ACN+H M+ACN+2H
M+Na M+2ACN+H M+2ACN+2H M+CH3OH+H
2M+H
Glycomic dataset is provided by [32]. We use the first 10 runs from the dataset in our experiment. Both ofthe Proteomic and Glycomic datasets provide alignment ground truth and have been used to benchmarkalignment performance in other studies [1, 14,22,32,33]. Additionally, we also introduce a metabolomicdataset generated from standard runs used for the calibration of chromatographic columns [3]. The runswere produced from different LC-MS analyses separated by weeks, representing a potentially challengingalignment scenario. 6 runs were used in the experiment. Alignment ground truth was constructed fromthe putative identification of peaks in each of the 6 runs separately at 3 ppm using the Identify module inmzMatch [25], taking as additional input a database of 104 compounds known to be present and a list ofcommon adducts in positive ionisation mode (Table 1). This is followed by matching of features sharingthe same annotations across runs to construct the alignment ground truth. Only peaks unambiguouslyidentified with exactly one annotation are used for this purpose; peaks with more than one annotationper run are discarded from the ground truth construction.
Table 2 summarises the different evaluation datasets and the number of features each dataset has.
5.2 Performance Measures
Performance of the evaluated methods in our results is quantified in terms of precision and recall. Thesetwo measures are also commonly used in information retrieval, where ‘precision’ refers the fraction ofretrieved items that are relevant, while ‘recall’ refers the fraction of relevant items that are retrieved [18].
10/21
.CC-BY-NC-ND 4.0 International licensepeer-reviewed) is the author/funder. It is made available under aThe copyright holder for this preprint (which was not. http://dx.doi.org/10.1101/074831doi: bioRxiv preprint first posted online Sep. 12, 2016;

Dataset No. runs Total Features
P1 Frac 000 2 10606P1 Frac 020 2 2135P1 Frac 040 2 2188P1 Frac 060 2 3342P1 Frac 080 2 2086P1 Frac 100 2 1326
Glycomic 10 9344Metabolomic 6 7477
Table 2. Total number of runs and features of the selected evaluation datasets.
To provide a definition of ‘precision’ and ‘recall’ suitable for evaluating alignment performance, wefirst enumerate all the possible q-size combinations for every aligned peakset in both the method’s outputand the ground truth list. For example, an alignment method returns a list of two aligned peaksets{a, b, c, d, }, {e, f, g} as output. When q = 2, this output can be enumerated into a list of 9 ‘alignmentitems’ of all the pairwise combinations of features: {a, b}, {a, c}, {a, d}, {b, c}, {b, d}, {c, d}, {e, f}, {e, g},{f, g}. Let M and G be the results from such enumeration from a method’s output and the groundtruth respectively. Each distinct combination of features in M and G can be considered as an itemduring performance evaluation. Intuitively, the choice of q reflects the strictness of what is considered tobe a true positive item, with larger values of q demanding an alignment method that produces resultsspanning more runs correctly.
For a given q, the following positive and negative instances of alignment item can now be defined forthe purpose of performance evaluation:
• True Positive (TP ): items that should be aligned (present in G) and are aligned (present in M).
• False Positive (FP ): items that should not be aligned (absent from G) but are aligned (present inM).
• True Negative (TN): items that should not be aligned (absent from G) and are not aligned (absentfrom M).
• False Negative (FN): items that should be aligned (present in G) but are not aligned (absent fromM).
In the context of alignment performance, precision ( TPTP+FP ) is therefore the fraction of items in M
that are correct with respect to G, while recall ( TPTP+FN ) is the fraction of items in G that are aligned in
M . A method with a perfect alignment output would have both precision and recall values of 1.0.
5.3 Benchmarking Method
We benchmark HDP-Align against two established alignment methods: SIMA [33] and MZmine2’s JoinAligner [22]. The performance of both methods have been evaluated in past studies [1, 14, 22, 32, 33].SIMA is a stand-alone program while Join aligner is an integral part of the MZmine2 suite widely usedfor the pre-processing of LC-MS data. The selection of SIMA and Join as the benchmark methodsis motivated by the fact that both methods are direct matching methods (thus easily comparable toHDP-Align) but still differ sufficiently in how they establish the final alignment results. This is primarilydue to the differences between both methods in the form of the distance/similarity function betweenpeak features, the actual matching algorithm itself and the merging order of pairwise results to constructthe full alignment results.
The two most important parameters to configure in both methods are the mass and RT toleranceparameters, used for thresholding and computing feature similarities during matching. We label thesecommon parameters as the T(m/z) and Trt parameters. Note that despite the common label, each method
11/21
.CC-BY-NC-ND 4.0 International licensepeer-reviewed) is the author/funder. It is made available under aThe copyright holder for this preprint (which was not. http://dx.doi.org/10.1101/074831doi: bioRxiv preprint first posted online Sep. 12, 2016;

may use the parameter values differently during the alignment process. In our experiments, we let T(m/z)and Trt vary within reasonable ranges (details in Section 5.4) and report all performance values generatedby each combination of the two parameters.
5.4 Parameter Optimisations
Tables 3 and 4 describe the parameter ranges of each method during performance evaluation. ForHDP-Align (Table 3), we perform the experiments based on our initial choices on the appropriateparameter values. These are almost certainly less than optimal and can be optimised further. Themass cluster standard deviation
√ρ−1 for HDP-ALign is set to the equivalent value in parts-per-million
(ppm). These are 500 ppm for the Proteomic dataset and 3 ppm for the Glycomic and Metabolomic
datasets. The local (within-run) cluster RT standard deviation√γ−1 is assumed to be fairly constant
and set to 2 seconds for all datasets, while the global cluster standard deviation√δ−1 is set in the
following dataset-specific manner: 50 seconds for the Proteomic dataset and 20 seconds for the remainingdatasets. The larger standard deviation value is required for the Proteomic dataset to accomodate forgreater RT drifts across runs. Other hyperparameters in HDP-Align are fixed to the following values:α′ = 10, αt = 10, αm = 100. The values of the precision hyperparameters for global cluster RT (σ0) andmass cluster (ρ0) are set to a broad value of 1/5E6. No significant changes were found to the resultswhen these hyperparameters for the DP concentrations and cluster precisions were varied. The meanhyperparameters µ0 and ψ0 are set to the means of the RT and m/z values of the input data respectively.During inference, 10000 posterior samples were obtained with the first 5000 used as burn-in, and takingevery 10-th sample after burn-in for the posterior probabilities of peaks to be matched.
Dataset HDP
P1 Frac 000
√ρ−1 = 500 ppm,
√γ−1 = 2 s,
√δ−1 = 50 s
P1 Frac 020P1 Frac 040P1 Frac 060P1 Frac 080P1 Frac 100
Glycomic√ρ−1 = 3 ppm,
√γ−1 = 2 s,
√δ−1 = 20 s
Metabolomic√ρ−1 = 3 ppm,
√γ−1 = 2 s,
√δ−1 = 20 s
Table 3. Parameters used for HDP-Align
For SIMA and Join, we report the results from all combinations of the mass and RT toleranceparameters within reasonable ranges listed in Table 4. The ranges of T(m/z) and Trt parameters usedare based values reported on [14] for the Proteomic dataset and [32] for the Glycomic dataset. For theMetabolomic dataset, they were chosen in light of the mass accuracy and RT deviations of the data.
Dataset Benchmark (SIMA, Join)
P1 Frac 000
T(m/z) = {1.0, 1.1, ..., 2.0}, T rt = {10, 20, ..., 180} s
P1 Frac 020P1 Frac 040P1 Frac 060P1 Frac 080P1 Frac 100
Glycomic T(m/z) = {0.05, 0.1, 0.25},T rt = {5, 10, ..., 120} sMetabolomic T(m/z) = {0.001, 0.01, 0.1}, T rt = {5, 10, ..., 120} s
Table 4. Parameters used for the benchmark methods (SIMA, Join).
In HDP-Align, the mass cluster standard deviation√ρ−1 is set to the equivalent value in parts-
per-million (ppm). These are 500 ppm for the Proteomic dataset and 3 ppm for the Glycomic and
12/21
.CC-BY-NC-ND 4.0 International licensepeer-reviewed) is the author/funder. It is made available under aThe copyright holder for this preprint (which was not. http://dx.doi.org/10.1101/074831doi: bioRxiv preprint first posted online Sep. 12, 2016;

Table 5. Dataset sizes and parameter optimisations.
Dataset # runs
(total
fea-
tures)
HDP-Align SIMA, Join
Proteomic √ρ−1 = 500
ppm,√γ−1 = 2 s,√δ−1 = 50 s
T(m/z) =
{1.0, 1.1, ..., 2.0},T rt =
{10, 20, ..., 180}s
Frac 000 2 (10606)
Frac 020 2 (2135)
Frac 040 2 (2188)
Frac 060 2 (3342)
Frac 080 2 (2086)
Frac 100 2 (1326)
Glycomic 10 (9344)√ρ−1 = 3
ppm,√γ−1 = 2 s,√δ−1 = 20 s
T(m/z) =
{0.05, 0.1, 0.25},T rt =
{5, 10, ..., 120} s
Metabolo-
mic
6 (7477)√ρ−1 = 3
ppm,√γ−1 = 2 s,√δ−1 = 20 s
T(m/z) =
{0.001, 0.01, 0.1},T rt =
{5, 10, ..., 120} s
Metabolomic datasets. The local (within-run) cluster RT standard deviation√γ−1 is assumed to be
fairly constant and set to 2 seconds for all datasets, while the global cluster standard deviation√δ−1 is
set in the following dataset-specific manner: 50 seconds for the Proteomic dataset and 20 seconds forthe remaining datasets. The larger standard deviation value is required for the Proteomic dataset toaccomodate for greater RT drifts across runs.
Other hyperparameters in HDP-Align are fixed to the following values: α′ = 10, αt = 10, αm = 100.The values of the precision hyperparameters for global cluster RT (σ0) and mass cluster (ρ0) are set toa broad value of 1/5E6. No significant changes were found to the results when these hyperparametersfor the DP concentrations and cluster precisions were varied. The mean hyperparameters µ0 and ψ0
are set to the means of the RT and m/z values of the input data respectively. During inference forthe Glycomic and Metabolomic datasets, 500 posterior samples were collected for the Gibbs samplingprocedure, discarding the first 500 during the burn-in period. For the Proteomic dataset with larger RTdeviations, 5000 posterior samples were obtained after discarding the first 5000 samples during burn-in.The number of samples is selected to ensure convergence during inference.
6 Results
Precision and recall values for the evaluated methods methods on the different datasets are shown inSections 6.1 and 6.2. Additionally, an example of the further annotations for the putative adduct typeand metabolite identity that can be produced by HDP-Align is also shown in Section 6.2. Running timeof the evaluated methods are reported in Section 6.3.
6.1 Proteomic Results
Figure 4 shows the results from performance evaluation on the Proteomic dataset. We see that bothbenchmark methods (SIMA and Join) produce a wide range of performance depending on the parametervalues for (T(m/z), Trt) chosen. Sensitivity to parameter values is expected on this dataset due to the lowmass accuracy in the MS instrument that produces the data and the high RT drifts present across runs(further details in [14]). HDP-Align performs well on several fractions (particularly fractions 040, 060,080, 100) with precision-recall performance close to the optimal performance attainable by the benchmark
13/21
.CC-BY-NC-ND 4.0 International licensepeer-reviewed) is the author/funder. It is made available under aThe copyright holder for this preprint (which was not. http://dx.doi.org/10.1101/074831doi: bioRxiv preprint first posted online Sep. 12, 2016;

Figure 4. Precision-recall values on the different fractions of the Proteomic dataset.
methods. On all fractions, HDP-Align is also able to produce higher-precision results compared to thebenchmark methods by reducing recall through setting the appropriate values for the threshold t. Theprimary benefits of quantifying alignment uncertainties is realised here as the well-calibrated probabilityscores on the matching confidence of aligned peak features produced HDP-Align allows the user to choosewhich point along the PR curve to operate on. It is less obvious how this can be accomplished in thebenchmark methods by varying the RT (Trt) and m/z (Tm/z) thresholding parameters, if at all possible.
6.2 Glycomic and Metabolomic Results
Figures 5 and 6 show the results from experiments on the Glycomic and Metabolomic datasets. Similarto the Proteomic dataset, a wide range of precision-recall values can be observed in the results forthe benchmark methods on the two datasets. The performance of HDP-Align, using the same set ofparameters on both datasets, come close to the optimal results from the benchmark methods, while stillallowing the user to control the desired point along the precision-recall curve to operate on.
The results for the Glycomic dataset (Figure 5) also show some additional results on how the measuredprecision-recall values might change depending on the strictness of what constitutes an ‘item’ duringperformance evaluation. This is accomplished by gradually increasing the value for q (described in detailin Section 5.2) that determines the size of the feature combinations enumerated from a method’s output.For example, q=2 considers all pairwise combinations of features from the method’s output duringperformance evaluation, while q = 4 considers all combinations of size 4, and so on. Figure 5 shows thatas q is increased, parameter sensitivity seems to become more of an issue for the benchmark methods,with more parameter sets having lower precisions in the results. Across all qs evaluated, parameter
14/21
.CC-BY-NC-ND 4.0 International licensepeer-reviewed) is the author/funder. It is made available under aThe copyright holder for this preprint (which was not. http://dx.doi.org/10.1101/074831doi: bioRxiv preprint first posted online Sep. 12, 2016;

Figure 5. Precision-recall values on the alignment of 10 runs from the Glycomic dataset when q (thestrictness of performance evaluation as described in Section 5.2) is gradually increased.
pairs that produce the best alignment performance (points with high precision and recall values) aregenerally small T(m/z) and large Trt values. Examples of parameter pairs that produce the best andworse performance for SIMA are shown in Figure 6. The results here appear to suggest the importanceof having high mass precision during matching. Importantly, we see from Figure 5 that the performanceof HDP-Align remains fairly consistent as q is increased.
The Metabolomic dataset also provides us with additional results in form of annotations of putativeadduct type and metabolite identities. A thorough evaluation on the quality of such annotations, incomparison to e.g. the workflow proposed in [15], is beyond the scope of this paper and would likelynecessitate using a different and more apppopriate evaluation dataset. Instead, we present an example ofthe further analysis performed by HDP-Align (as proposed in Section 4.4) on the resulting clusteringobjects after inference. Figure 7 shows a global RT cluster where peak features across runs have beengrouped by their RT and m/z values. Within this global cluster, peak features are further separatedinto 6 mass clusters – corresponding to ionisation products produced by the global cluster during massspectometry. In Figure 7, mass cluster A and B contain features aligned from several runs but theydo not have any other mass cluster sharing a possible precursor mass. Mass cluster C and D share acommon precursor mass (292.12696) and can thus be annotated by the adduct type that produce thetransformation. Similarly, mass cluster E and F share a common precursor mass at 383.14278. Queriesto a local KEGG database are issued based on the precursor mass values, producing several compoundidentities that can be putatively assigned to the global RT cluster. It is a great strength of our approachthat this putative identification step appears very naturally from the alignment results.
15/21
.CC-BY-NC-ND 4.0 International licensepeer-reviewed) is the author/funder. It is made available under aThe copyright holder for this preprint (which was not. http://dx.doi.org/10.1101/074831doi: bioRxiv preprint first posted online Sep. 12, 2016;

Figure 6. Precision-recall values on the alignment of 6 runs from the Metabolomic dataset. Theparameter values (Tm/z, Trt) that produce the best and worst performance in SIMA are also annotatedin the Figure (red boxes).
16/21
.CC-BY-NC-ND 4.0 International licensepeer-reviewed) is the author/funder. It is made available under aThe copyright holder for this preprint (which was not. http://dx.doi.org/10.1101/074831doi: bioRxiv preprint first posted online Sep. 12, 2016;

Figure 7. Example analysis that can be performed on the clustering objects inferred in a Gibbssample from HDP-Align. The outer black oval denotes a global RT cluster (generally corresponding toa metabolite compound), while the smaller dotted ovals within denote mass clusters (labelled as masscluster A,B,C,D,E, F ). Peak features are denoted by the filled circle, with the fill colour indicating theoriginating run of a peak. Green colours denote additional analysis steps that can be performed on themass cluster objects.
17/21
.CC-BY-NC-ND 4.0 International licensepeer-reviewed) is the author/funder. It is made available under aThe copyright holder for this preprint (which was not. http://dx.doi.org/10.1101/074831doi: bioRxiv preprint first posted online Sep. 12, 2016;

6.3 Running Time
The main factor affecting the running time of HDP-Align is the total number of peaks across all runs tobe processed and the number of samples produced during Gibbs sampling. In each iteration of Gibbssampling, HDP-Align removes a peak from the model, updates parameters of the model conditioned onevery other parameters, and reassigns a peak into RT and mass clusters. The time complexity of thisoperation is O(N), where N is the total number of peaks across all runs. In practice, additional time willalso be spent on various necessary book-keeping operations, such as deleting empty clusters that are nolonger required, updating internal data structures, etc.
A representative running time is given as N = 9344 for the Glycomic dataset. HDP-Align requiresapproximately 5 hours to collect 1000 samples. In comparison, both SIMA and Join perform alignmentwithin 5 to 10 seconds. Similarly, for N = 7477 for the Metabolomic dataset, HDP-Align produces theresults in approximately 4 hours after collecting 1000 samples, while SIMA and Join complete withinseconds. The running time of HDP-Align, while being significantly longer than these two benchmarkmethods, is comparable to other computationally-intensive steps (e.g. peak detection) in a typical LC-MSpipeline.
7 DISCUSSION AND CONCLUSION
We have presented a hierarchical non-parametric Bayesian model that performs direct matching of peakfeatures, a problem of significant importance in the data pre-processing pipeline of large untargetedLC-MS datasets. Unlike other direct matching methods, the novelty of our proposed approach lies inits ability of to produce well-calibrated probability scores on the matching confidence of aligned peakfeatures (evidenced by the increasing precision and decreasing recall as the threshold t is increased). Thisis accomplished by casting the multiple alignment problem of LC-MS peak features as a hierarchicalclustering problem. Matching confidence can then be obtained based on the probabilities of co-elutingpeak features to be assigned under the same mass component of the same global cluster. Experimentsbased on datasets from real proteomic, glycomic and metabolomic experiments show that HDP-Align isable to produce alignment results competitive to the benchmark alignment methods, with the addedbenefit of being able to provide a measure of confidence in the alignment quality. This can be useful inreal analytical situations, where neither the optimal parameters nor the alignment ground truth is knownto the user.
Through comparisons against benchmark methods, our studies have also investigated the effect ofsub-optimal parameter choices on alignment performance. While beyond the scope of our paper, weagree with [27,28] that thorough investigations into the influence of numerous configurable parameters(prevalent in nearly all LC-MS data processing pipeline) on the resulting biological conclusions are ofutmost importance. This should be followed by the development of methods to minimise or automatically-tune such configurable parameters. Despite the abundance of new methods proposed for LC-MS datapre-processing, relatively few studies have been done on the subject of quantifying uncertainties andalleviating the burden of parameter optimisations during actual data analysis. One way to minimise thenumber of parameters is through the integration of multiple steps in the typical LC-MS pipeline intofewer steps. Our proposed model in HDP-Align can potentially be extended in this manner, as evidencedby the metabolomic dataset results where we directly use the clustering objects inferred from the modelto perform further analysis on putative adduct and metabolite type annotations. While the proposedannotation approach in Section 4.4 is fairly simple, it can be easily extended to more sophisticatedannotation strategies, such as in CAMERA [12].
A primary weakness of HDP-Align lies in the long computational time required to produce results.Additional work will be required to reduce the computational burden of the model through variousoptimisation tricks and potentially by parallelising the Gibbs inference step using e.g. the methoddescribed in [17]. Another possibility is to adopt a different non-sampling-based inferential approachwhile still retaining the essence and benefits of the HDP model in this paper. The results presented inthe current paper suggest the method shows enough promise to warrant the effort to speed it up.
18/21
.CC-BY-NC-ND 4.0 International licensepeer-reviewed) is the author/funder. It is made available under aThe copyright holder for this preprint (which was not. http://dx.doi.org/10.1101/074831doi: bioRxiv preprint first posted online Sep. 12, 2016;
Another aspect worthy of investigation is determining the most effective way to present and visualisethe alignment probabilities produced by HDP-Align. Additional sources of information present in theLC-MS data, such as chromatographic peak shapes, can also be used to improve alignment performanceand subsequent analyses that follow.
Finally, replacing or enhancing the mixture of mass components used in HDP-Align with a moreappropriate mass model, such as that in MetAssign [4] that specifically takes into account the inter-dependency structure of peaks, is an avenue for future work. This will be particularly useful whenextending the proposed model in HDP-Align into a single inferential model that encompasses manyintermediate steps in a typical LC-MS data processing pipeline.
Acknowledgments
We would like to thank Glasgow Polyomics for providing us with the Standard and Beer data used forperformance evaluation. JW was funded by a PhD studentship from SICSA. JJJvdH was supported bythe Wellcome Trust [grant no. 105614/Z/14/Z]. SR was supported by the BBSRC (BB/L018616/1).
References
1. R. Ballardini, M. Benevento, G. Arrigoni, L. Pattini, and A. Roda. MassUntangler: A novelalignment tool for label-free liquid chromatography–mass spectrometry proteomic data. Journal ofChromatography A, 1218(49):8859–8868, 2011.
2. R. K. Bradley, A. Roberts, M. Smoot, S. Juvekar, J. Do, C. Dewey, I. Holmes, and L. Pachter.Fast statistical alignment. PLoS Comput. Biol., 5(5):e1000392, May 2009.
3. D. J. Creek, A. Jankevics, R. Breitling, D. G. Watson, M. P. Barrett, and K. E. V. Burgess.Toward global metabolomics analysis with hydrophilic interaction liquid chromatography–massspectrometry: improved metabolite identification by retention time prediction. Analytical Chemistry,83(22):8703–8710, 2011.
4. R. Daly, S. Rogers, J. Wandy, A. Jankevics, K. E. Burgess, and R. Breitling. Metassign: probabilisticannotation of metabolites from LC-MS data using a Bayesian clustering approach. Bioinformatics,30(19):2764–2771, 2014.
5. D. P. De Souza, E. C. Saunders, M. J. McConville, and V. a. Likic. Progressive peak clustering inGC-MS Metabolomic experiments applied to Leishmania parasites. Bioinformatics, 22(11):1391–6,June 2006.
6. R. C. H. De Vos, S. Moco, A. Lommen, J. J. B. Keurentjes, R. J. Bino, and R. D. Hall. Untargetedlarge-scale plant metabolomics using liquid chromatography coupled to mass spectrometry. Nat.Protoc., 2(4):778–91, Jan. 2007.
7. B. Fischer, J. Grossmann, V. Roth, W. Gruissem, S. Baginsky, and J. M. Buhmann. Semi-supervised LC/MS alignment for differential proteomics. Bioinformatics, 22(14):e132–40, July2006.
8. M. Ghanat Bari, X. Ma, and J. Zhang. PeakLink: a new peptide peak linking method in LC-MS/MSusing wavelet and SVM. Bioinformatics, 30(17):2464–70, Sept. 2014.
9. A. Jankevics, M. E. Merlo, M. de Vries, R. J. Vonk, E. Takano, and R. Breitling. Separatingthe wheat from the chaff: a prioritisation pipeline for the analysis of metabolomics datasets.Metabolomics, 8(1):29–36, 2012.
19/21
.CC-BY-NC-ND 4.0 International licensepeer-reviewed) is the author/funder. It is made available under aThe copyright holder for this preprint (which was not. http://dx.doi.org/10.1101/074831doi: bioRxiv preprint first posted online Sep. 12, 2016;

10. J. Jeong, X. Shi, X. Zhang, S. Kim, and C. Shen. Model-based peak alignment of metabolomicprofiling from comprehensive two-dimensional gas chromatography mass spectrometry. BMCBioinformatics, 13(1):27, Jan. 2012.
11. X. Kong and C. Reilly. A Bayesian approach to the alignment of mass spectra. Bioinformatics,25(24):3213–20, Dec. 2009.
12. C. Kuhl, R. Tautenhahn, C. Bottcher, T. R. Larson, and S. Neumann. CAMERA: an inte-grated strategy for compound spectra extraction and annotation of liquid chromatography/massspectrometry data sets. Anal. Chem., 84(1):283–9, Jan. 2012.
13. G. Landan and D. Graur. Characterization of pairwise and multiple sequence alignment errors.Gene, 441(1-2):141–7, July 2009.
14. E. Lange, R. Tautenhahn, S. Neumann, and C. Gropl. Critical assessment of alignment proceduresfor LC-MS proteomics and metabolomics measurements. BMC Bioinformatics, 9:375, 2008.
15. T. S. Lee, Y. S. Ho, H. C. Yeo, J. P. Y. Lin, and D.-Y. Lee. Precursor mass prediction by clusteringionization products in LC-MS-based metabolomics. Metabolomics, 9(6):1301–1310, Apr. 2013.
16. J. Listgarten, R. M. Neal, S. T. Roweis, and A. Emili. Multiple alignment of continuous timeseries. In Advances in neural information processing systems, pages 817–824, 2004.
17. D. Lovell, R. P. Adams, and V. Mansingka. Parallel markov chain monte carlo for dirichlet processmixtures. In Workshop on Big Learning, NIPS, 2012.
18. C. D. Manning, P. Raghavan, and H. Schutze. Introduction to information retrieval, volume 1.Cambridge University Press, Cambridge, 2008.
19. C. Notredame, D. G. Higgins, and J. Heringa. T-Coffee: A novel method for fast and accuratemultiple sequence alignment. J. Mol. Biol., 302(1):205–17, Sept. 2000.
20. O. Penn, E. Privman, G. Landan, D. Graur, and T. Pupko. An alignment confidence scorecapturing robustness to guide tree uncertainty. Mol. Biol. Evol., 27(8):1759–67, Aug. 2010.
21. V. Perera, M. D. T. Zabala, H. Florance, N. Smirnoff, M. Grant, and Z. R. Yang. Aligningextracted lc-ms peak lists via density maximization. Metabolomics, 8(1):175–185, 2012.
22. T. Pluskal, S. Castillo, A. Villar-Briones, and M. Oresic. MZmine 2: Modular framework forprocessing, visualizing, and analyzing mass spectrometry-based molecular profile data. BMCBioinformatics, 11(1):395, 2010.
23. K. Podwojski, A. Fritsch, D. C. Chamrad, W. Paul, B. Sitek, K. Stuhler, P. Mutzel, C. Stephan,H. E. Meyer, et al. Retention time alignment algorithms for LC/MS data must consider non-linearshifts. Bioinformatics, 25(6):758–764, 2009.
24. B. D. Redelings and M. a. Suchard. Joint Bayesian estimation of alignment and phylogeny. Syst.Biol., 54(3):401–18, June 2005.
25. R. a. Scheltema, A. Jankevics, R. C. Jansen, M. a. Swertz, and R. Breitling. PeakML/mzMatch:a file format, Java library, R library, and tool-chain for mass spectrometry data analysis. Anal.Chem., 83(7):2786–93, 2011.
26. C. a. Smith, E. J. Want, G. O’Maille, R. Abagyan, and G. Siuzdak. XCMS: processing mass spec-trometry data for metabolite profiling using nonlinear peak alignment, matching, and identification.Analytical chemistry, 78(3):779–87, Feb. 2006.
27. R. Smith, D. Ventura, and J. T. Prince. LC-MS alignment in theory and practice: a comprehensivealgorithmic review. Briefings in Bioinformatics, 2013. DOI:10.1093/bib/bbt080.
20/21
.CC-BY-NC-ND 4.0 International licensepeer-reviewed) is the author/funder. It is made available under aThe copyright holder for this preprint (which was not. http://dx.doi.org/10.1101/074831doi: bioRxiv preprint first posted online Sep. 12, 2016;

28. R. Smith, D. Ventura, and J. T. Prince. Novel algorithms and the benefits of comparative validation.Bioinformatics, 29(12):1583–5, June 2013.
29. Y. W. Teh, M. I. Jordan, M. J. Beal, and D. M. Blei. Hierarchical dirichlet processes. Journal ofthe American Statistical Association, 101(476):1566–1581, 2006.
30. J. D. Thompson, D. G. Higgins, and T. J. Gibson. CLUSTAL W: improving the sensitivity ofprogressive multiple sequence alignment through sequence weighting, position-specific gap penaltiesand weight matrix choice. Nucleic Acids Res., 22(22):4673–80, Nov. 1994.
31. R. Tibshirani, T. Hastie, B. Narasimhan, S. Soltys, G. Shi, A. Koong, and Q.-T. Le. Sampleclassification from protein mass spectrometry, by ‘peak probability contrasts’. Bioinformatics,20(17):3034–3044, 2004.
32. T.-H. Tsai, M. G. Tadesse, C. Di Poto, L. K. Pannell, Y. Mechref, Y. Wang, and H. W. Ressom.Multi-profile Bayesian alignment model for LC-MS data analysis with integration of internalstandards. Bioinformatics, 29(21):2774–2780, 2013.
33. B. Voss, M. Hanselmann, B. Y. Renard, M. S. Lindner, U. Kothe, M. Kirchner, and F. A. Hamprecht.SIMA: Simultaneous multiple alignment of LC/MS peak lists. Bioinformatics, 27(7):987–993, 2011.
21/21
.CC-BY-NC-ND 4.0 International licensepeer-reviewed) is the author/funder. It is made available under aThe copyright holder for this preprint (which was not. http://dx.doi.org/10.1101/074831doi: bioRxiv preprint first posted online Sep. 12, 2016;