hazards and disasters: risk assessment and response ... file · web viewsub-topic 1: the water...
TRANSCRIPT

Option A: Freshwater – Issues and ConflictsSub-topic 1: The water system
The hydrological cycle Examine the inputs, outputs, stores and transfers of the hydrological cycle. Discuss the causes and consequences of the changing balance between water stored in oceans and ice.
The water balance Explain the concept of maximum sustainable yield of freshwater in terms of a balance between inputs and outputs.
Hydrological Cycle (Water Cycle): The continuous movement of water on the land, in the atmosphere and in the oceans. The hydrological cycle is said to be a closed system because water cannot be added or lost, but can be found in different states and in different locations. Despite the planet being covered in water, the vast majority is seawater (97.5%). Of the remaining 2.5% the majority is held in glaciers and ice sheets. Only a very small amount of the world's water is easily accessible in rivers and lakes (0.00069%).
The water balance basically looks at the balance between inputs and outputs. You can look at the water balance at a global level (hydrological cycle), at a local level (drainage basin cycle) or even just a field. At a global level, oceans tend to experience greater outputs (evaporation) than inputs (precipitation). This is because oceans are large unshaded bodies of water that have regular winds blowing saturated air on land, allowing greater evaporation. In addition, oceans don't tend to suffer from the same amount of relief and convectional rainfall as land does. On land, inputs (precipitation) tend to be greater than outputs (evaporation). This is because lands suffers from larger amounts of frontal, relief and convectional rainfall, as well as much of the land’s water being protected underground or in shaded areas reducing evaporation. At a global level there obviously has to be equilibrium between inputs and outputs. The excess precipitation on land is returned to the oceans by channel flow, surface run-off and, to a lesser extent, groundwater flow. The excess of evaporation is returned to the land from the sea by winds blowing saturated air on land.
1

At a more local level, the following formula is usually used to calculate the water balance:
S = P - Q - ES = Stores and transfersP = PrecipitationQ = River dischargeE = Evapotranspiration
Because drainage basins are open systems, there can be an imbalance in inputs and outputs.At even more local level the balance between precipitation and evaporation is looked at using a soil moisture budget graph. Soil moisture graphs are useful because farmers, water providers, etc. can calculate when there will be surpluses and shortages. As such they can plan to when they have to rely on other sources like aquifers and reservoirs. However, they are limited because they look at yearly averages, so don't take into account months and years of above average or below average temperatures and rainfall.
Sub-topic 2: Drainage basins and flooding
Drainage basins Examine the functioning of a drainage basin as an open system with inputs, outputs, transfers, stores and feedback loops.
Discharge Define stream discharge. Examine its relationship to stream flow and channel shape.Hydrographs Describe the characteristics of hydrograph. Examine the reasons for spatial and
temporal (short-term and long-term) variations in hydrographs. Examine the role of hydrographs in forecasting the magnitude, spatial extent and timing of floods.
Floods Discuss the natural and human causes and consequences of a specific river flood.
- Drainage basin: The area drained by a river and its tributaries. A drainage basin is considered to be an open system because water can be added or lost from a drainage basin.
- Source: The beginning of a river. A river may have multiple sources. The source of a river is normally found in upland mountainous areas.
- Mouth: The end of a river. A river may end in a lake, but more normally in the sea.- Tributary: A small river that flows into a larger river.- Confluence: Where two rivers meet.- Watershed: The border between two drainage basins.- Estuary: The tidal section of a river near the mouth.- Channel: The physical confines of the river, encompassing two banks and a bed.- Bank: The sides of a river channel. A river channel has two banks.- Bed: The bottom of a river channel.
A drainage basin is considered to be an open system as it has inputs, outputs, stores and transfers.
Inputs: When water is added to a drainage basin. Precipitation: Any moisture that falls from the atmosphere. The main types of precipitation are rain, snow, sleet,
hail, fog and dew. Interbasin transfer: Water that either naturally (due to the alignment of the rock) or with human involvement
(pumps and pipes) moves from one drainage basin to another.
2

Outputs: When water leaves a drainage system. Evaporation: The process of water turning from a liquid into a vapour. Evaporation only takes place from a body
of water e.g. a lake, puddle or the sea. Transpiration: The evaporation of water from vegetation. Evapotranspiration: The combined action of evaporation and transpiration Interbasin transfer River discharge via channel flow: Water entering the sea and leaving a drainage basin. A very small amount of
water also enters the sea via throughflow and groundwater flow (baseflow).
Stores: When water is stationary and not moving in a drainage basin. Interception: When water is caught and held by
vegetation or man-made structures like buildings. Surface store: When water is held in the surface
of the earth. This may be a puddle, a lake or a garden pond.
Soil moisture store: When water is held in unsaturated soil.
Groundwater store: When water is held in saturated ground.
Transfers (flows): When water is moving within a drainage basin. Stem flow: When intercepted water runs down the trunks and stems of vegetation. Canopy drip: When intercepted water drips off the leaves of vegetation (drip tip leaves in rainforests are actually
designed to allow this to happen). Throughfall: Precipitation that falls directly through vegetation. Infiltration: Water that moves from the surface of the earth into the soil below. Throughflow: Water that travels through unsaturated ground. Pipeflow: Water that travels through holes left by root systems and animal burrows. Percolation: Water that travels from unsaturated into saturated ground. Groundwater flow (baseflow): Water that travels through saturated ground. Capillary action (or rise): Water that may move upwards towards the surface. Channel flow: Water that travels in a river. Surface run-off (overland flow): When water travels across the surface of the earth e.g. down a hill.
Saturated: Ground where the pores are full and can contain no more water.Unsaturated: Ground where there is still space between the pores.Water table: The border between saturated and unsaturated ground. The water table may go up or down.Permeable: Surfaces that allow water to pass through them.Impermeable: Surfaces that do not allow water to pass through them.Pores: Gaps between soil and gravel that water can fill.Aquifer: Rock that can hold water.Aquiclude: Rock that cannot hold water.Porous: Rock with pore spaces and cracks in it.Non-porous: Rock with no pore spaces or cracks in it.Condensation: When water vapour turn into water droplets. Water can only condense around condensation nuclei.
Feedback Loops: A system is always trying to maintain a balance (equilibrium). Feedback loops explain when a system (drainage basin) loses and attempts to regain its balance. Positive feedback causes instability by changing inputs (increase in precipitation). Negative feedback attempts to regain the equilibrium by reducing inputs or possibly increasing outputs. Humans can alter feedback loops by changing the amount of water released from dams, changing the amount of water used or even increasing run-off through deforestation.
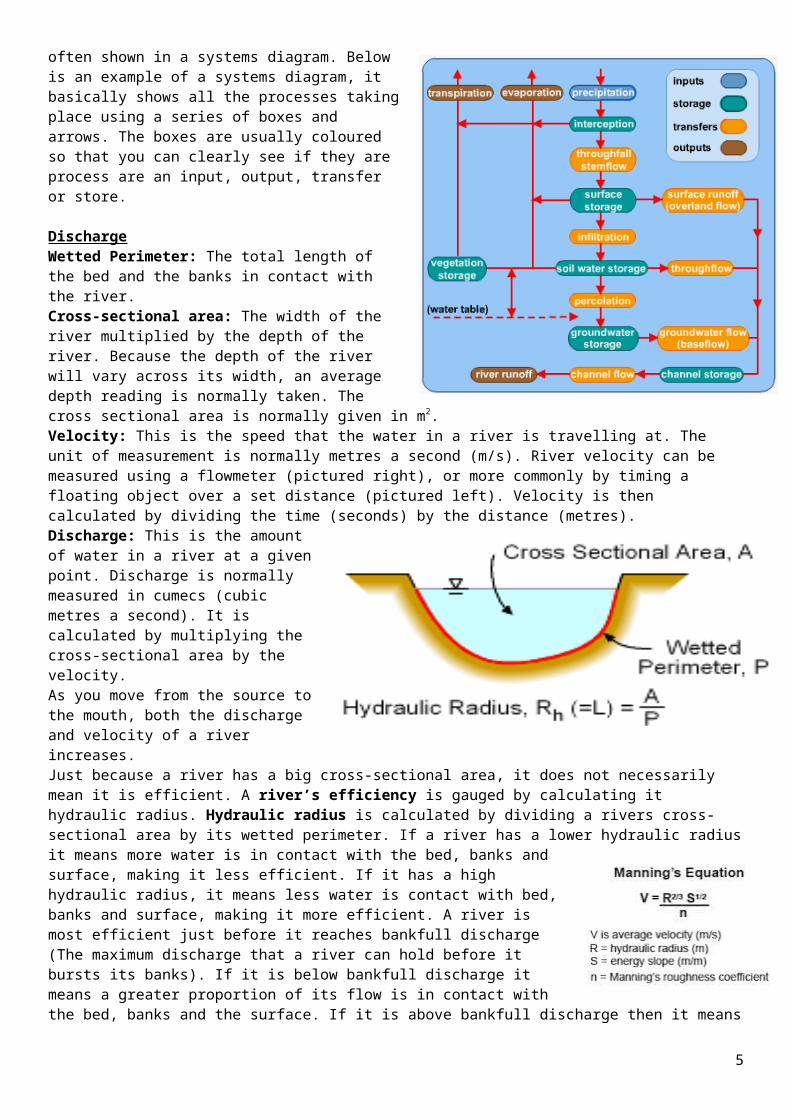
System Diagram: Because two-dimensional and three dimensional diagrams of drainage basins can be complicated to understand, drainage basin systems are often shown in a systems diagram. Below is an example of a systems
3

diagram, it basically shows all the processes taking place using a series of boxes and arrows. The boxes are usually coloured so that you can clearly see if they are process are an input, output, transfer or store.
DischargeWetted Perimeter: The total length of the bed and the banks in contact with the river.Cross-sectional area: The width of the river multiplied by the depth of the river. Because the depth of the river will vary across its width, an average depth reading is normally taken. The cross sectional area is normally given in m2.Velocity: This is the speed that the water in a river is travelling at. The unit of measurement is normally metres a second (m/s). River velocity can be measured using a flowmeter (pictured right), or more commonly by timing a floating object over a set distance (pictured left). Velocity is then calculated by dividing the time (seconds) by the distance (metres).Discharge: This is the amount of water in a river at a given point. Discharge is normally measured in cumecs (cubic metres a second). It is calculated by multiplying the cross-sectional area by the velocity.As you move from the source to the mouth, both the discharge and velocity of a river increases.Just because a river has a big cross-sectional area, it does not necessarily mean it is efficient. A river’s efficiency is gauged by calculating it hydraulic radius. Hydraulic radius is calculated by dividing a rivers cross-sectional area by its wetted perimeter. If a river has a lower hydraulic radius it means more water is in contact with the bed, banks and surface, making it less efficient. If it has a high hydraulic radius, it means less water is contact with bed, banks and surface, making it more efficient. A river is most efficient just before it reaches bankfull discharge (The maximum discharge that a river can hold before it bursts its banks). If it is below bankfull discharge it means a greater proportion of its flow is in contact with the bed, banks and the surface. If it is above bankfull discharge then it means the river is in flood and therefore in contact with the floodplain increasing friction.Hydraulic radius is a fairly simplified way at looking at a river's efficiency, a more detailed way is Manning's coefficient. Manning's coefficient uses hydraulic radius in its formula, as well as looking at bed roughness and gradient. A rough bed can increase the amount of friction. A steep river gradient can increase the amount of gravitational pull.When a river has less energy it tends to have a much more laminar flow. If a river has surplus energy it tends to have a more turbulent flow and is able to erode and transport more.
4
Long profile: The long profile looks at how a rivers' gradient changes from the source to the mouth. A rivers' gradient is much steeper near the source and a lot gentler near the mouth. Later in the topic we will look at how a rivers' features change as you move from the source to the mouth. We will also look at changes in erosion, transportation and deposition.
Base level: This is the lowest level that a river can erode its bed to. It is basically sea level. A river cannot erode its bed below sea level because rivers are unable to travel upwards.
Contrary to popular belief, average (mean) river velocity actually increases as you move from the source towards the mouth. Despite the river gradient and therefore gravity being much greater nearer the source, the poor efficiency of the river channel means it is less efficient. 95% of a river's energy is used overcoming friction. Therefore in a river's upper course (near the source) where a river's cross-sectional area is smaller and its hydraulic radius lower there is more friction and the river is slower.
Storm hydrographs: A hydrograph or storm hydrograph is a type of graph that shows how a rivers' discharge responds to a period of precipitation. Discharge is measured in one point (using the units cumecs), but precipitation is measured over the whole drainage basin. On the hydrograph, precipitation is shown using a bar graph and discharge is shown using a line graph.Peak rainfall: The largest volume of rainfall (usually measured in mm) during a storm.Peak discharge: The highest discharge as a result of a storm event.Lag time: The period of time between peak rainfall and peak dischargeResponse time: The time between the first rain falling and the first change in discharge.Rising limb: The period of time that the river is experiencing an increase in discharge.Falling or recessional limb: The period of time that a rivers' discharge is falling after a storm event and returning to its normal flow.Bankfull discharge: The maximum amount of discharge that a river can hold before it burst its banks and floods.As the period from the initial storm increases, throughflow and baseflow will become increasingly more important in contributing to a rivers' discharge. Initially surface run-off will be the most important factor in contributing to a rivers' discharge because this is the quickest way for rainfall to enter a river.
Factors Affecting Storm Hydrographs5

Permeable and Impermeable Rock: If a drainage basin has a large amount of impermeable rock, then there will be less infiltration and more surface run-off. This will greatly reduce both the response time and lag time. Alternatively if a drainage basin has a lot of permeable surfaces then there will be more infiltration and less surface run-off. This may not significantly change the response time, but will delay the lag time.
Deforestation and Reforestation: If a drainage basin has been deforested, then there will be less interception. Precipitation will fall directly on the ground. This will increase the speed that the ground becomes saturated and also increase surface run-off. This will reduce the response time and lag time. If any area is forested or been reforested then there will be more interception, root uptake and transpiration. These three factors will reduce the peak discharge as well as slowing the lag time.
Saturated and Unsaturated Soil: If there has been previous rainfall or the water table is high, then the ground will become saturated quickly. If the ground is saturated there will be limited infiltration and therefore much more surface run-off. The surface run-off will reduce response time and lag time and increase peak discharge.
Urbanisation: Settlement building can have varying effects. Urban areas usually result in deforestation and an increase in impermeable surfaces. This can increase surface run-off and reduce lag time and increase peak discharge. Urbanisation can, however, increase interception with the large number of buildings - this will slow the lag time. Artificial drains may control the flow of water or increase the flow of water into rivers.
Agriculture: Irrigation canals may increase the speed of surface run-off and therefore reduce the lag time and increase the peak discharge. Alternatively, terraces and contour (cross) ploughing may actually reduce surface run-off and therefore increase the lag time and reduce the peak discharge as more water will have time to infiltrate. If fields are bare or fallow, then there will be no interception allowing the ground to become saturated quicker and possibly increasing surface run-off. If fields are full of vegetation then there will be much more interception.
Valley gradient: If the valley sides are steep, precipitation is less likely to infiltrate, but instead more like to run-off into streams and rivers. If valley sides are gentler, then there will be more infiltration (if the ground is not saturated) and slower surface run-off, thus increasing the lag time.
Drainage basin size: In small drainage basins, it is more likely that precipitation will reach the river more quickly. In bigger drainage basins, surface run-off, throughflow and baseflow are all going to take longer.
Dams: Dams can hold water and regulate the discharge of water. Although some water will be released from dams during periods of heavy rain, it is very unlikely that the river will be allowed to exceed bankfull discharge. Therefore, this will reduce the peak discharge.
Drainage Density: Drainage density looks at the relationship between the total length of all the rivers and streams in a drainage basin (km) and the total area of a drainage basin (km2). If a drainage basin has a high density, it means that precipitation gets into streams quicker, If a drainage basin has a low drainage density, it means that more precipitation has to travel by surface run-off, throughflow and baseflow.Some factors effecting drainage density: Geology and soils: drainage densities are higher on impermeable
surfaces because there is less infiltration. Land use: vegetation increases interception and reduces drainage
density. Time: the number of tributaries and therefore the drainage density tend to
reduce overtime. Precipitation: areas of high precipitation tend to have higher drainage
densities. Relief: drainage densities are usually higher on steep land because there is
less infiltration and often less vegetation (depending on aspect). Stream ordering: There are many different ways to order streams, one of the
most common is Strahler stream ordering. The ordering system is fairly simple. All streams start off as order one. If two order one streams join (converge), then they become an order two stream. If then two order streams join, then they become and order three stream. The stream order will only increase if two streams of the same order join. If an order two stream and an order three stream join, then the resulting river will remain order three.
6

Flooding Case Study: Pakistan Floods, 2010 August 2010, worst flood since 1929. Water levels of River Indus highest in 110 years. Directly affected 1/9 of Pakistani population of 190 million. Government relief efforts criticised, international aid also inadequate.
Geographical background Land area 3 times the size of UK (800,000km2) High population density: 200 per km2
North-west of the Indian subcontinent Varied relief – mountain chains bordering Afghanistan and Kashmir, to low-lying plains of Punjab and Sind that
adjoin India in the South and East. Plains are part of the Indus valley, holding Indus river which rises in Tibet and flows 3,000km to the Arabian Sea
through the middle of Pakistan. These waters are an invaluable source of agricultural irrigation and power generation, derived from large
barrages built across the main channel of the Indus. Climate: seasonal reversal of winds known as Monsoon. Rainy season from late June to early October. Only
desert areas of SE and mountainous north do not experience rainfall. Cool season between October and February.
Causes of the flooding At the end of July 2010 the NW province of Khyber Pakhtunkhwa (KPK) was hit by a five-day period of
exceptional precipitation, including 60 hours of continuous rainfall, which exceeded the usual total for the three months of the monsoon season in this region by 30%. The National Weather Forecasting Centre in Islamabad described these as ‘once in a century’ levels of rainfall.
A highly destructive ‘tsunami-like’ wave of water tore through the mountain valleys that feed into the main channel of the Indus, creating floods that travelled southwards to affect the entire river course in the centre of Pakistan. This represents the most densely populated rural region of the country.
It took about a week for the floodwaters to pass down the Indus between the Swat valley in KPK, and Sukkur in the southern province of Sind, a distance of 1000 km. Sukkur is particularly vulnerable because it lies downstream of the convergence of the five major eastern tributaries with the Indus.
After this initial flood surge, the monsoon rains continued as normal to add to the river’s discharge. More heavy storms in the northwest and the far northeast province of Gilgit-Baltistan produced at least two further waves of flooding in mid-August that prolonged the inundation of affected areas and covered some previously untouched districts. At the gates of the one mile wide Sukkur barrage, river flow peaked at 32,000 cubic metres per second, falling back to 26,000 cumecs, before the later flood surges lifted it above 28,000 cumecs again later in the month.
The effects of the floodwaters were increased by several other factors: Deforestation in Swat valley while under control of the Taliban, before they were driven out by the Pakistani
army in 2009. The Taliban collaborated with timber smugglers to strip trees from the steep hillsides, leaving an unobstructed path for the torrential rains to flow straight into the river.
In Sind, construction of levees raised the river channel above the floodplain, leaving them vulnerable to extensive flooding in the event of the levee being breached.
Usually, the monsoon anticyclone over the Himalayas and Northern Pakistan prevents active weather systems from penetrating very far south. A rare meteorological pattern in the summer of 2010 allowed storms to spread into Pakistan, combining with the monsoon to produce record rainfall.
Repairs to the riverbanks and protective dykes were prevented by the heavy monsoon rains and successive waves of flooding.
Climate change has led to a rise in the occurrence of extremely warm temperatures globally, and an increased number of heavy rainfall events in many regions.
Flood impacts1. Environmental:
7

1.5 of Pakistan was submerged by floods (area roughly the size of England). In lowland Sind province, the Indus river was 24 km across – 25 times its normal width. Vast stretches of countryside became swamps. Over 11,000 villages were inundated and 1.2 million houses were damaged or destroyed. 7 million hectares of the most fertile arable land was obliterated.
2. Economic: In Punjab, Pakistan’s breadbasket, flooding of crops and loss of grain stores caused shortages, leading to a
hike in food prices. Cost to agriculture was at £1.5 billion.
3. Socio-political: To relieve the pressure of floodwaters on major dams and barrages, dykes were deliberately breached, to
release water onto surrounding farmland. When floods spread into the Jaffarabad district of Baluchistan it was alleged that they had been deliberately diverted by the Sind authorities.
The ancient ruins of the city of Mohenjo-Daro, dating back to 2500 BC, were at risk. Throughout Pakistan, bridges and roads were washed away, including significant damage to the Karakoram
Highway, built by the Chinese over 20 years, which links the capital Islamabad and the northern provinces with the far west of China.
4. Human: Death toll surprisingly low, at 1,600, mostly recorded in early stages, caused by violent walls of water in the
mountain valleys of KPK, sweeping people away as their remote villages were overwhelmed. UN estimate of overall number of people affected by the floods: 14 million. 6 million at risk from starvation if food aid failed to get through. Cholera in Sway valley in KPK, where 600k people cut off during initial flooding. Most victims were poor rural peasants. Their assets – houses, farmland, animals, all destroyed by
floodwaters, leaving them destitute and homeless refugees. 300k refugees gathered in city of Sukkur in Sind province. 20 relief camps full, people sleeping by roadside,
under bridges, on by-pass, in railways station. Hot & humid conditions encouraged mosquitoes. No reliable supplies of food or water.
Some villages marooned when their villages were isolated by the flood.
Sub-topic 3: Management issues and strategies
Dams & reservoirs Examine the hydrological changes resulting from the construction of dams and reservoirs. Examine the costs and benefits of dams and reservoirs as part of multi-purpose schemes.
Floodplain management
Explain the stream channel processes (erosion, transport, deposition) and explain the resultant landforms found on floodplains.Examine the human modifications of a floodplain and their effect on the size and probability of floods.Evaluate the costs and benefits of alternative stream management strategies.
Groundwater management
Explain the functioning and management of artesian basins and aquifers, distinguishing between natural and artificial recharge. Examine the environmental impacts of groundwater abstraction.
Freshwater wetland management
Describe the role of wetlands as a water resource. Evaluate the effectiveness of the management strategies that have been adopted in a major wetland.
Irrigation and agriculture
Examine the environmental impact of agriculture and irrigation on water quality: salinization, agro-chemical run-off, the pollution of groundwater and the eutrophication of lakes, rivers and wetlands.
Dam: A barrier placed across a river. A dam is usually made from reinforced concrete.Reservoir: The artificial store (lake) that develops behind a dam.Multipurpose scheme: Dam are often built not just to provide renewable energy, but also to prevent flooding and to create a store of water, hence they are multipurpose schemes.Locks: An enclosed area with gates at either end that allow boats to move up or down a dam. If a boat wishes to move down a dam, then it moves into the lock and the gates are closed. Water is then drained out of the lock and
8

the boat drops down to the height of the water at the bottom of the dam.HEP: Hydroelectric power. Electricity that is generated by the force of descending (falling) water.Navigation: The process of plotting a route up a river, across a sea, etc. Although the dams create an artificial barrier that makes navigation harder, if locks are built to pass the dam, then navigation for ships is usually much simpler in the reservoir behind the dam.
Case Study: Three Gorges Dam, China- HEP dam spanning the Yangtze River in Hubei province, China.- World’s largest power station in terms of installed capacity (22,500MW).
Advantages Increased Yangtze’s barge capacity sixfold, reducing carbon dioxide emissions by 630k tonnes. From 2004 to
2007, total of 198 million tonnes of goods passed through the ship locks. Compared to using trucking, barges reduced carbon dioxide emission by ten million tonnes and lowered costs by 25%.
Reduce potential for floods downstream by providing flood storage space. Flooding is a major problem for the seasonal river of the Yangtze. Millions of people live downstream of the dam, with many large, important cities like Wuhan, Nanjing, and Shanghai situated adjacent to the river. Plenty of farmland and China's most important industrial area are built beside the river.
Pride of Chinese government – symbol of historic engineering, social and economic success, design of state-of-the-art large turbines.
Renewable source of energy, limiting of greenhouse gas emissions. Shift away from coal as main source of power.
366g of coal produces 1kWh of electricity. Three Gorges reduces coal consumption by 31 million tonnes per year, avoiding 100 million tonnes of greenhouse gas emission, millions of tonnes of dust, one million tonnes of sulphur dioxide, 370k tonnes of nitric oxides, 10k tonnes of carbon monoxide and a significant amount of mercury.
Hydropower saves the energy needed to mine, wash and transport the coal from northern China.
Disadvantages The 600km long reservoir flooded some 1,300 archaeological and cultural sites and altered the appearance of
the Three Gorges as the water level rose over 91m. Displaced 1.3 million people. Causing significant ecological changes, including increased risk of landslides. Estimated cost of US$22.5 billion, spent of construction, relocation of residents and financing. Sedimentation projections are not agreed upon. 80% of the land in the area is experiencing erosion, depositing
40 million tons of sediment into the Yangtze annually. Because the flow is slower above the dam, much of this sediment will now settle there instead of flowing downstream, making the floodplains downstream less fertile.
Absence of silt downstream has caused biological damage and reduced aquatic biodiversity. Dam sits on a seismic fault. Could be blamed for increased seismic activity. Fear of dam bursting. Erosion in the reservoir, induced by rising water, causes frequent major landslides that have led to noticeable
disturbance in the reservoir surface, including two incidents in May 2009 when somewhere between 20,000 and 50,000m3 of material plunged into the reservoir. Also, in the first four months of 2010, there were 97 significant landslides.
Concerns about the potential wildlife impact. Region long known for its rich biodiversity. Home to 6,388 species of plants, 57% of which are endangered. Rare species used as ingredients in traditional Chinese medicines.
Percentage of forested area in the region dropped from 20% in 1950 to <10% in 2002, negatively affecting all plant species in the locality.
The region provides habitats to hundreds of freshwater and terrestrial animal species. Freshwater fish are especially affected by dams due to change in water temperature and flow regime. Many fish are hurt in the turbine blades of the HEP plants. Detrimental to the ecosystem as Yangtze River basin is home to 361 different fish species, 27% of all endangered freshwater fish in China.
Of the 3 to 4k remaining critically endangered Siberian Crane, a large number currently spend the winter in the wetlands that will be destroyed by the Three Gorges Dam.
Dam contributed to the extinction of the Yangtze River Dolphin, due to decreased habitat and increased ship travel.
Stream channel processesMethods of erosion:
9

Attrition: when rocks collide with & erode each other, till they become smaller, rounder & smoother. Abrasion: When bits of load crash into the bed and banks. This process causes the load, bed and banks to erode. Hydraulic action: sheer force of the water hitting against the rocks and riverbed. Solution: dissolving of mineral particles in water.
Factors Affecting the Rate of Erosion- Load: If the river has large angular load, then it is more likely to erode.- Velocity and Discharge: The faster the river is travelling and the greater its discharge the more likely the river is
to erode.- Gradient: The steeper a river is the more likely it is to erode.- Geology: Softer rock and particularly unconsolidated rock like sand are going to be more vulnerable to erosion.
Sedimentary rock with lots of cracks is going to be more vulnerable to hydraulic action.- pH: If water is more acidic it is obviously going to increase the rate of erosion (corrosion).- Human Impact: Humans can affect erosion in many ways; deforestation can increase run-off and therefore the
discharge of the river, pollution can increase the acidity of the river, dams can remove load and increase clear water erosion, irrigation may remove water and therefore reduce velocity.
- Clear water erosion: This happens in rivers with little load. It is simply the power of the water that is causing the banks and the bed to erode.
- Vertical Erosion: In a rivers upper course there tends to be more vertical erosion. The main reason for this is the river is above its base level and most of its load is big. Because the load is big, most is bed load, which means erosion is mainly concentrated on the bed, therefore eroding downwards.
- Horizontal (lateral) Erosion: In the middle and lower course, more of the rivers load is smaller and the river is near its base level. Because the load is lighter, more is suspended load so there is greater erosion on the riverbanks.
- Base level: This is the lowest level that a river can erode to. You can have artificial base levels e.g. a dam, but normally the base level of the river is sea level. It is impossible for a river to erode below its base level because water cannot travel up hill.
Transportation: When a river has surplus energy it may carry some of the material that it has eroded. Solution: dissolved particles of mineral carried in water. Suspension: silt & lighter particles floating in water. Flotation: Material transported on the surface of a river. Saltation: pebbles bouncing on riverbed. Traction: rocks rolled/dragged along riverbed.
- The larger pieces of material tend to be transported along a river’s bed. As they get smaller they can they be transported in the current (flow). Only the smallest bits may be dissolved.
- The processes of erosion and transportation tend to make a rivers' load smoother and rounder as you move from the source to the mouth.
- Load: Any material that is transported by a river. A rivers' load can be divided into bed load, suspended load and dissolved load.
- Deposition: When the velocity of a river falls, causing its energy to fall. Because the energy of the river is falling so does its capacity and competence, causing to put down its load. This process of putting down load is deposition.
- Hjulstrom Curve: A graph that shows the relationship between river velocity and particle size when looking at a rivers' ability to erode, transport and deposit.
- Competence: The maximum diameter of a piece of load that a river can transport.- Capacity: The maximum amount of load that a river can transport.
10

- Critical Erosion Velocity: The minimum velocity that a river needs to be traveling for it to start eroding and then transporting material.
- Settling (or fall) Velocity: The velocity that a river needs to fall below to start depositing its load.The apparent anomaly with the Hjulstrom curve is that it can erode sand at a much lower velocity than it can erode clay and silt. This is because that clay and silt are very cohesive (they stick together). This means that even though the particles sizes are small they have a very strong bond between them.
A river’s course is often divided into the upper course, the middle course and the lower course.- Upper Course: This is the section of the river nearest the source. This is where load is biggest and most erosion is
vertical. Most landforms are made by erosion and include: waterfalls, gorges, rapids, v-shaped valleys and interlocking spurs.
- Middle Course: This is the section when the river leaves the mountains and enters are more hilly environment. The valley floors starts to widen as you get more horizontal erosion. The landforms that you get in the middle course include alluvial fans and meanders.
- Lower Course: This is the section closest to the mouth. Here the river is travelling over much flatter land and the load is much smaller and smoother. This is more horizontal erosion here as the river nears its base level. The landforms you find in the lower course include meanders, oxbow lakes, braided rivers, levees and deltas.
Classification of Landforms: As well as classifying landforms as upper, middle and lower course landforms, it is also possible to classify them as erosional, depositional and erosional & depositional.- Alluvial River: An alluvial river is any river that
carries load. Nearly all rivers (except some rivers flowing over ice shelves and glaciers) carry load.
- Fluvial: Anything found on or made by a river. This includes all landforms.
- Meanders: Very simply a meander is a bend or a curve in a river. Why a river starts to bend is not fully understood, but one theory believes it is to do with riffles (shallow sections) and pools (deep sections). The river flows through the pools and around the riffles starting a meander.
- Slip-off Slope (point bar): A slip-off slope is found on the inside of a meander. This is where the flow is slowest and deposition takes place.
- River Cliff: A river cliff is found on the outside of a meander where the flow is fastest and erosion takes place.- Thalweg: Simply the fastest section of a river. Normally the section with least friction.- Sinuous: This means bend, if a river is sinuous then it is very bendy.- Levees: Levees are embankments found on the sides of a river channel. Levees can be made by or enlarged by
humans, but we are only interested in levees that are made naturally. Levees are made when a river exceeds bankfull discharge i.e. it is in flood. When a river floods onto its floodplain then the river immediately experiences greater friction. The friction causes the velocity of the river to fall. As the river’s velocity and energy falls it starts to deposit its load. The heaviest load is deposited first. The lighter load (alluvium) will be deposited further away from the river. As more and more load is deposited by the banks of the river levees start to develop. Levees actually increase the size of the river channel and can reduce the risk of flooding in the future.
- Alluvium: This is basically the river’s load that is deposited on floodplains in times of flood. Alluvium has a lot of minerals and nutrients so it helps fertilise the floodplain and benefits agriculture.
- River Terraces: A river terrace is an old floodplain separated from the new floodplain by a steep slope. It can be created by changes in a rivers load, changes in sea level, or human activity.
- Changes in sea level: If the sea levels drop then so does the river’s base level. This means that a river can now carry out more vertical erosion, creating a lower floodplain.
- River’s load: If the size or quantity of a rivers load increases (possibly because the river is traveling over different rock or deforestation has lead to more weathering) then there might more bed load and more vertical erosion.
- Human Activity: The building of a dam can cause more clear water vertical downstream, or deforestation can increase surface run-off and erosion increasing the amount of load in a river. Both human actions can cause the river and the floodplain to lower, leaving behind river terraces.
11

- Braided River: A braided river is a river with a number of smaller channels, separated by small and often temporary islands called eyots. Braided rivers usually form on rivers with variable flow (wet and dry season or snow melt season) and high quantities of load. When a river is at maximum discharge it is able to transport most of its load. However, when the discharge falls along with the velocity and energy of the river, deposition starts to take place, creating eyots.
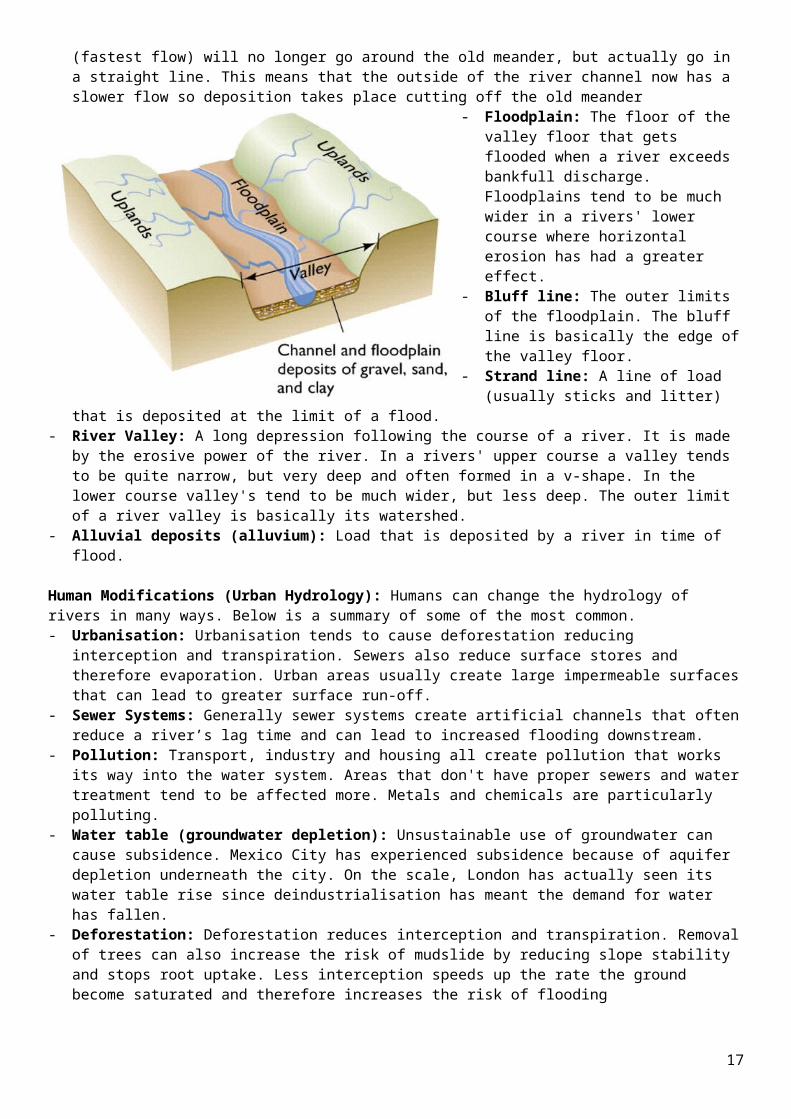
- Oxbow Lake: An oxbow lake is a meander that has become cut off from the main river channel. If you have the outside of two meanders near each other they will eventually connect. They connect because erosion is at its maximum on the outside of the meander. When they eventually connect the thalweg (fastest flow) will no longer go around the old meander, but actually go in a straight line. This means that the outside of the river channel now has a slower flow so deposition takes place cutting off the old meander
- Floodplain: The floor of the valley floor that gets flooded when a river exceeds bankfull discharge. Floodplains tend to be much wider in a rivers' lower course where horizontal erosion has had a greater effect.
- Bluff line: The outer limits of the floodplain. The bluff line is basically the edge of the valley floor.
- Strand line: A line of load (usually sticks and litter) that is deposited at the limit of a flood.
- River Valley: A long depression following the course of a river. It is made by the erosive power of the river. In a rivers' upper course a valley tends to be quite narrow, but very deep and often formed in a v-shape. In the lower course valley's tend
to be much wider, but less deep. The outer limit of a river valley is basically its watershed.- Alluvial deposits (alluvium): Load that is deposited by a river in time of flood.
Human Modifications (Urban Hydrology): Humans can change the hydrology of rivers in many ways. Below is a summary of some of the most common.- Urbanisation: Urbanisation tends to cause deforestation reducing interception and transpiration. Sewers also
reduce surface stores and therefore evaporation. Urban areas usually create large impermeable surfaces that can lead to greater surface run-off.
- Sewer Systems: Generally sewer systems create artificial channels that often reduce a river’s lag time and can lead to increased flooding downstream.
- Pollution: Transport, industry and housing all create pollution that works its way into the water system. Areas that don't have proper sewers and water treatment tend to be affected more. Metals and chemicals are particularly polluting.
- Water table (groundwater depletion): Unsustainable use of groundwater can cause subsidence. Mexico City has experienced subsidence because of aquifer depletion underneath the city. On the scale, London has actually seen its water table rise since deindustrialisation has meant the demand for water has fallen.
- Deforestation: Deforestation reduces interception and transpiration. Removal of trees can also increase the risk of mudslide by reducing slope stability and stops root uptake. Less interception speeds up the rate the ground become saturated and therefore increases the risk of flooding
- Micro-climate: Urban areas create heat islands which can increase convectional rainfall. Particulates released by industry and transport also make excellent condensation nuclei.
- Channelisation: Artificially smoothing channels may remove river discharge from one area, but areas downstream that haven't been smoothed are likely to experience an increased risk of flooding.
12

Flood Management Strategies- Channel Enlargement: Making the width and depth of the river wider and deeper to increase its cross-sectional
area. Advantages: By enlarging the cross-sectional area you are increasing the bankfull discharge of the river along
with its hydraulic radius. This will increase the velocity of the river and reduce the chances of it flooding in the immediate area by moving the floodwater further on downstream.
Disadvantages: If buildings are built up to the riverbank it might not be possible to enlarge the channel. Also the process can be expensive and can cause problems to areas downstream that are receiving more floodwater quicker, but with an un-enlarged channel.
- Channel Straightening: Removing meanders from a river to make the river straighter. Advantages: By removing meanders, the velocity of the water through a settlement will increase. This will
stop the backlog of water and should reduce the risk of flooding. It also improves navigation. Disadvantages: By changing the course of the river, you might remove flowing water from industries that
depend on it. There might also be buildings that have to be demolished to allow straightening. Again it is expensive and may cause flooding problems downstream.
- Flood Relief Channels: Building new artificial channels that are used when a river nears bankfull discharge. Advantages: They take pressure off the main channels when floods are likely therefore reduces flood risk. Disadvantages: It can be hard find land to build relief channels, they are expensive and when empty can
become areas to dump rubbish, etc. If river levels rise significantly it is also possible for relief channels to flood as well.
- Artificial Stores: Creating reservoirs or lakes that can store excess water in times of flood. Advantages: They can remove pressure of the main channel and can become new habitats and serve other
purposes e.g. leisure, drinking water. Disadvantages: Building dams, sluices, diversion channels are all expensive. They also involve flooding areas
of land which may be hard to find near large vulnerable urban populations.- Flood Embankments: Like levees, these increase the channel depth of a river, raising its bankfull discharge and
reducing the risk of flood. Advantages: They increase the cross-sectional area of the river and therefore its hydraulic radius. This
should reduce the risk of flooding. Disadvantages: Like in New Orleans under extreme conditions, embankments may fail causing even bigger
problems. They are expensive to build and again may cause problems downstream.- Controlled Flooding: Allowing low value land e.g. farmland to flood, therefore protecting higher value areas.
Advantages: By allowing the river to flood naturally, it is taking the pressure off high value areas and letting the river behave more naturally and it adds alluvium to the floodplain.
Disadvantages: You have to make the decision of what is worth protecting, which is always going to upset some people. You also have to protect areas that you don't want to flood which costs money (cost benefit analysis).
- Afforestation: Simply planting more trees in a drainage basin. Advantages: This is a natural process, increasing the amount of interception, transpiration and root uptake.
People would not normally protest against trees being planted.13

Disadvantages: It is not possible to cover the whole drainage basin in trees, so if it rains in an area with no trees, then there is no reduction in flooding. Also most trees lose their leaves in autumn and winter reducing interception in those months.
- Insurance: Although it doesn't prevent flooding, it can help individuals and industries to recover and protect against future flooding. Advantages: It helps individuals and settlements to recover after flood events and may help them protect
property and be less vulnerable in the future. Disadvantages: They do not actually prevent flooding. Not everyone can afford insurance and insurance
companies may not insure high-risk areas.- Land Use Planning: Mapping areas by looking at their likelihood to flood and then only building low value uses
on areas with high flood risk. Advantages: Very good at removing high value areas and high-density populations from hazardous areas. Disadvantages: It is not always possible to change land uses that already exist in an area. You have to decide
what size flood to map for e.g. a once in ten-year flood or once in one hundred year flood. Often poor will still choose to live on marginal land.
- Sluices: Gates that can be opened and closed to control the flow of water.- Cost Benefit Analysis: Cost benefit analysis can be done on almost anything. However, in geographical terms, it
is usually done to decide whether a location should be protected or not. The actual analysis can be very complicated, but put simply it compares the cost of protecting an area compared to the benefits that an ares creates.
Groundwater management- Groundwater: Water held under the surface of the earth.- Phreatic zone: The area of ground that is permanently saturated.- Aeration zone: The area of land that is only partially or seasonally saturated, or completely unsaturated.- Water table: The boundary between saturated and unsaturated ground. The water table can move up or down.- Groundwater flow or base flow: The movement of water in saturated ground.- Infiltration: When water moves from the surface into the ground below. The infiltration rate is the speed at
which water infiltrates and can be measured using an infiltrometer.- Percolation: The movement of water from unsaturated to saturated ground- Saturated: When all pore space is full and rocks or soil can hold no more water.- Unsaturated: Ground that can still hold more water i.e. there is still room in the pore spaces.- Aquifer: layers of permeable rock such as sandstones and limestones containing significant quantities of water.- Aquiclude: Rock that will not hold water or allow its movement. i.e. they are non-porous and impermeable.- Aquitard: less permeable bed of rock capable of transmitting some water but not in economic quantities. It may
be non-porous and has low hydraulic conductivity e.g. it is a clay that water finds it hard to pass through.- Abstraction: The removal or extraction (mining) of groundwater- Artesian basin: An artesian basin or aquifer is a
confined aquifer containing groundwater under positive pressure. This causes the water level in the well to rise to a point where hydrostatic equilibrium has been reached (balance between pressure on the aquifer and pressure from the aquifer). The diagram below shows an aquifer sandwiched between two aquitards. The aquifer is being recharged from the surface, but it is also been used by humans pumping water out through a well.
- Capillary action: The upwards movement of water.- Depletion: When something is reducing, aquifers can become depleted in dry periods or when they are managed
unsustainably.- Perennial discharge: water that flows all year round.- Water Balance: the balance between the amount of precipitation an area receives and the amount of water that
it loses through evapotranspiration.- Deficit: When evapotranspiration has exceeded precipitation for a long period. During these arid periods deep
groundwater will have to be used or artificial stores e.g. reservoirs.
14

- Recharge: When precipitation exceeds evapotranspiration and groundwater depleted in drier months can be refilled.
- Usage: When evapotranspiration is greater than precipitation. During this period groundwater will be used and the level of the water table will start to go down.
- Excess: When precipitation exceeds evaporation and groundwater is recharged. When there is excess water the ground will become saturated and the water table will move up.
CAUSES OF GROUNDWATER USAGE Evapotranspiration from shallow stores, capillary action will draw moisture up to near the surface. Natural discharge by springs and into lakes, rivers and oceans. Artificial abstraction (removal) for domestic, industrial and agricultural use. Leakage into nearby aquifers. Interbasin transfers.CAUSES OF GROUNDWATER RECHARGE Artificial recharge. Either leakage from irrigation channels and reservoirs or the pumping of water into aquifers. Infiltration and percolation after precipitation or snow melt. Seepage from river channels, lakes and oceans. Leakage from nearby aquifers. Interbasin transfers.
Groundwater Pollution Agriculture (fertilisers and pesticides) Industry (chemicals and metals) Landfill sites (decomposing rubbish e.g. batteries and mobile phones) Domestic households (non-biodegradable products e.g. shampoo, detergent) Sewage (open or broken sewers, lack of water treatment facilities) Natural (arsenic, calcium, magnesium and chloride can all occur naturally)
Problems of Depletion Saltwater intrusion: If aquifers near coastal areas are depleted enough, they may fill back up with saltwater.
Once an aquifer has become filled with saltwater, then it is useless for human consumption. Drought: Periods of drought can be worsened if groundwater has been depleted. Under normal circumstances
groundwater can be relied upon in times of drought. However, if groundwater has been managed unsustainably, then there might be no groundwater to rely on. This also increases the risk of crop failure, famine and ultimately death of livestock and humans.
Ground subsidence: If too much groundwater is removed, then the ground above the aquifer may sink (subside). This has happened in Mexico City, where its growing population has exploited groundwater unsustainably.
Salinisation: The increased concentration of water, increasing its levels of salinity.
Possible Solutions to Groundwater Depletion and Pollution Desalination: Remove the salt from seawater. At the moment, this technology is very expensive and uses a lot of
energy. This cannot be a solution for landlocked countries e.g. Afghanistan. Reduced leakage: A lot of water is lost through leaking pipes and leaking irrigation channels. If leaks are
repaired, less water will be needed. Trade in virtual water: Countries that have a lot of water, can grow and make products that need a lot of water
e.g. rice, cotton and beef. Countries that have a shortage of water can buy 'thirsty' products from these countries and specialise in industries that use less water.
Artificial stores: Create more reservoirs that can collect water during the wet season. The only problem is that some of the collected water will be lost through evapotranspiration and change the natural hydrology of the river.
Recycling of grey water: In homes it is possible to reuse some water if you use biodegradable products e.g. shower water can be used in the garden.
Drip irrigation: Irrigation can be very wasteful because water misses the vegetation it is intended for and a lot gets evaporated. Drip irrigation is a lot more targeted and only drips water directly onto the stem of the plant.
Cloud seeding: Experiments have been done by some countries to release chemicals and particles into the atmosphere that stimulates precipitation.
15

Water metering: By metering water instead of charging a flat rate, individuals and industries will be a lot more efficient in their use of water so that they get a smaller water bill.
Effluent controls and enforcement: By setting limits on what industries and households can release into rivers and the ground, you will improve the quality of the water. If you set effluent limits it is very important to monitor the limits and punish individuals and industries that are breaking the law.
Recycling of contaminated garbage: By recycling products like mobile phones and using rechargeable batteries less dangerous waste is going to be left in landfills.
Water treatment: Treating all water, by removing solid and chemical waste.
CASE STUDYRefer to example of Great Artesian Basin, Australia
Freshwater wetland managementA wetland is an area of land whose soil is saturated with moisture either permanently or seasonally. Such areas may also be covered partially or completely by shallow pools of water. Wetlands include swamps, marshes and bogs. The water found in wetlands can be saltwater, freshwater, or brackish (a mixture of fresh and salt water). The world's largest wetland is the Pantanal, which straddles Brazil, Bolivia and Paraguay in South America.- Brackish water: Water that has a higher salinity content than freshwater, but not as high as saltwater.- Ramsar Convention: The Ramsar Convention is an international treaty for the conservation and sustainable
utilisation of wetlands, i.e. to stem the progressive encroachment on and loss of wetlands now and in the future, recognising the fundamental ecological functions of wetlands and their economic, cultural, scientific, and recreational value. It is named after the town of Ramsar in Iran. The convention was developed and adopted by participating nations at a meeting in Ramsar on February 2, 1971, and came into force on December 21, 1975. The Ramsar List of Wetlands of International Importance now includes 1,888 sites (known as Ramsar Sites) covering around 1,853,000 km², up from 1,021 sites in 2000.
Wetlands now only cover 6% of the earth's surface. This is roughly half the amount of the planet that was covered in wetlands 100 years ago. The most important are:- Bogs (30%): A wetland area that accumulates acidic peat, a deposit of dead plant material. Bogs occur where the
water at the ground surface is acidic, either from acidic groundwater, or where water is derived entirely from precipitation. Water flowing out of bogs has a characteristic brown colour.
- Fens (26%): Lowland that is covered wholly or partly with water unless artificially drained and that usually has peaty alkaline soil.
- Swamps (20%): A swamp is a wetland with some flooding of large areas of land by shallow bodies of water. A swamp generally has a large number of dry-land areas, covered by aquatic vegetation or vegetation that tolerates periodical inundation (being covered by water).
16
- Floodplains (15%): All rivers have floodplains. They are the valley floors that get covered in water when a river exceeds bankfull discharge. However, with an increasing amount of rivers being managed e.g. levees and dams, floodplains are spending less time underwater.
- Lakes (2%): Lakes are surface stores that are fed by rivers. Some lakes e.g. Caspian Sea are being drained because of unsustainable use.
Importance of Wetlands- Flood control: Many wetlands are covered in vegetation that can intercept precipitation, absorb rainwater and
transpire water. Wetland vegetation can also reduce the velocity of rivers flowing into them or from them and act as natural stores of water. If you remove or drain areas of wetland, more pressure is placed upon the main river channel. Coastal and marine wetland areas can also absorb the energy of tropical storms, tsunamis etc.
- Groundwater recharge: Wetlands can collect large areas of precipitation and river discharge. As this water is held in storage it will infiltrate and percolate into the ground to recharge groundwater.
- Transport Network: Wetlands provide many natural waterways that people can move around on easily.- Tourism and Leisure: Some wetlands, like the everglades in Florida or the fens in East England become tourist
attractions. They also become popular locations to bird watch, fish and hunt.- Flora and Fauna: Many wetlands are unique habitats that support indigenous aquatic plants and animals. Many
wetlands support rare reptilian and amphibian species. Many migratory birds also rest in wetlands flying to and from nesting and breeding grounds.
- Fisheries: Wetlands can support large numbers of fish, which can support local populations. Wetlands are not normally viable commercial fisheries.
- Water purification: The soils, geology and vegetation of wetlands can help clean and purify water.- Storage of organic matter: Wetlands support large areas of organic matter that can hold large stores of methane
(greenhouse gas).- Coastal stabalisation: Wetlands that occur along the coastline and on riverbanks can prevent erosion from the
sea or by rivers.
Factors Causing Loss and Degradation of Wetlands- Increased demand for agricultural land: As the world population grows there is an increasing demand for food.
With the amount of viable agricultural land decreasing, increasingly areas of wetland are being artificially drained to make ways for agricultural land e.g. the draining of the fens in East England.
- Population growth: As the world's population grows, it demands more water, more food and more land. The increasing demand for water can mean wetlands are drained of their water or their source of water. This problem is made worse as the world's population develops and uses more water e.g. showers and toilets.
- Urbanisation: With the world population growing, there is a greater demand for housing. Increasingly this demand for housing is in urban areas. With urban areas growing more and more wetland areas are being drained or inhabited. Urbanisation on or near wetlands can cause pollution, changes in river flow and river channels and disturbance of wildlife. Land reclamation is the process of reclaiming land from the water.
- Sea level rises: Global warming is causing glaciers and ice sheets to melt causing sea levels to rise. These rising sea levels can flood coastal and marine wetland areas. Even if the whole wetland is not flooded, water conditions can be changed from fresh to brackish.
- River flow changes: Many rivers have been channelled and straightened, reducing the amount of wetlands. Others have been drained or dams have altered flow. Some have been polluted or redirected. All these natural changes are removing or changing the ecosystems of many wetland areas.
- Pollution: Any form of pollution, but particular chemicals and metals can change the delicate ecosystems of wetlands. Process like eutrophication, caused by fertiliser run-off can completely kill whole wetland areas by preventing the wetland oxygenating properly and receiving sunlight.
- Infrastructure projects: As populations grow and we become more mobile, there is an increasing demand for new roads, airports, railways. etc. Unfortunately wetlands are often drained or disrupted (bridges, dykes and causeways) to make way for these projects.
- Alien species invasion: Many alien species like the cane toad in Australia or the American mink in the UK have been introduced to wetlands and devastated indigenous species. The introduction of any alien, however small can disrupt food webs and ecosystems.
- Tropical storms: Although wetlands can be a natural defence against tsunamis and tropical storms, they can also been damaged by them. Freshwater wetlands in particular can be flooded by storms surges associated with tropical storms, changing the salinity of water and damaging vegetation
17

Case study: Kissimmee RiverLocation and Background- South central Florida; source at East Lake Tohopekaliga, mouth at Lake Okeechobee.- Drainage basin of 2,800km2 and 200km long.- Home to wetland plants, fish and wading birds.- Population on the 5km wide floodplain regularly affected by flooding.- River widened and channelized from 1962 to 1971 to prevent flooding.- Meandering river turned into a 90km long and 10m wide drainage canal.- Scheme was effective at reducing flooding, but had a devastating effect on the wetland ecosystem.
The Everglades- Everglades wetland area forms the lower part of the Kissimmee River Basin.- South Florida has high rainfall of 1000 – 1500mm a year, of which 80% was lost through evaporation and 20%
flowed through the Kissimmee River into Lake Okeechobee in Central Florida.- Each year when heavy rains came, the lake would overflow south into the Everglades. Water not deep enough to
cover the grass, which was why it was known as the River of Grass.- Rocks beneath the Everglades are limestone aquifer, soaking up fresh water from the surface.- Wildlife was specifically adapted to these living conditions.
Human Impact on the EvergladesIn the early 1900’s more and more people moved to the south of Florida. Many of these people came to start farms, as the soil in the area, when drained, was very fertile. The warm climate also enabled the growth of crops that could not be grown elsewhere. Large areas of the Everglades were cleared for farming. The farmers faced one serious problem, which was flooding.The channelisation was undertaken because of regular flooding. The flooding had been worsened by regular floods hitting the Florida peninsula. In an effort to solve the problem the following occurred: - River channelisation: This means artificially widening and lining a river channel. By increasing cross-sectional
area and smoothing the bed and the banks, the rivers discharge will flow quicker away from population areas.- River straightening: When meanders are removed from a river and the course is straightened. By removing
meanders the river is able to flow faster. The idea is to remove the river’s discharge more quickly from areas with high population densities or land with high value.
- Drainage canals: to carry the water away to the ocean.Even these did not stop a major flood occurring in the 1920’s, which killed over 2,000 people and led to farmers demanding further flood controls such as dams.
PROBLEMS CAUSED BY RIVER MANAGEMENT- The Kissimmee River floodplain dried up after channelization. The river no longer exceeded bankfull discharge.- The reduction of the floodplain reduced waterfowl habitat by 90%.- Egret, heron and wood stork populations declined by two-thirds.- Catches of largemouth bass (type of fish) reduced after channelization.- Pollution levels from the Kissimmee flowing into Lake Okeechobee after channelization. The Kissimmee after
channelization accounted for 25% of nitrogen pollution and 20% of phosphorous pollution.- Fishing, bird watching and hunting tourism declined after channelization.
THE RESTORATION AND ITS BENEFITS- The aim is to restore over 100km2 of river and wetland floodplain in the Everglades by 2015.- The restoration project started in 1999.- The river is being dechannelized by refilling the flood canal and re-establishing the old natural course of the
river.- Restored sections now flood naturally.- The nutrient loads in Lake Okeechobee should be reduced as more is absorbed in the wetland.- Wading birds have returned to the restored sections.- Dissolved oxygen levels have doubled in restored sections.- Increased revenue from tourism potential of restored river.- Reestablishment of natural ecosystem.
18

There are a few possible negative impacts from restoration: Greater evaporation because more surface stores. Increased risk of flooding. The river will be less navigable in dry periods. The restoration will cost $414 million.Other problems were caused by water usage for domestic purposes. Florida’s population has expanded massively since the 1920’s and Florida is also a popular tourist destination. Water was taken from the limestone aquifers that led to the water level declining and therefore contributing to the drying up of the wetland area.
The impact of human use of the Everglades- As freshwater has been pumped out of the aquifers, salt water from the nearby ocean has soaked in to replace
it, making groundwater more saline.- Construction of new roads and buildings seal off the surface so that water cannot seep down and replenish the
underground store.- Lack of water has disrupted the whole ecosystem, affecting much of the wildlife. Ground has dried out, and fires
are now a problem.- Soil exposed to the air oxidises and dissolves into the atmosphere at 2 – 3cm a year.- Conservationists forced government officials to allow some water to flow across the Everglades once again.
Water is released when it is not needed by farmers. Timing of release can be diferrent from the natural cycle,
The impact of tourism- Everglades was made a National Park in 1947. However, it is affected by actions outside it, e.g. farmers using
pesticides upstream, disrupting natural ecosystem and affecting food chains. Now only 30 Florida panthers left in the world.
- Tourism has led to better management such as creation of boardwalks, birdwatching towers, information boards and wildlife viewing trams, enabling visitors to see wildlife while causing little damage to plant and animal life.
- Visitors to the Everglades will understand the ecosystem better.- Visitors can be a negative factor as environmental change cannot be avoided completely.
Comprehensive Everglades Restoration Plan (CERP)- Restore the Everglades ecosystem, including natural flows of water and water quality.- Return sustainable situation, ensuring clean and reliable water supplies and providing flood protection.- Capture the billions of gallons of water that drain from the Everglades to coastal waters every day, and store it in
surface and underground storage areas until it is needed to supply the natural system as well as urban and agricultural needs.
- 240 miles of manmade levees and canals have been removed.- 80% of water created will benefit the environment, 20% will be used for agricultural and residential purposes.- Result: increasing numbers of a variety of wildlife species such as the snail kite, wood stork and American
alligator.
Irrigation & agriculture- Agriculture: Agriculture the artificial cultivation (growing or rearing) of plants or animals. Agriculture that grows
crops is known as arable agriculture, agriculture that involves rearing animals is known as pastoral agriculture.- Agricultural land: This simply refers to land that is suitable for farming. The amount of agricultural land can be
increased through irrigation and use of fertilisers. However, the amount of agricultural land may also decrease because of land degradation and desertification.
- Aquaculture: Aquaculture is the artificial farming of aquatic plants and animals. Aquaculture may take place in freshwater or seawater.
- Primary sector: Agriculture and aquaculture are both in the primary sector of the economy. The primary sector extracts or harvests resources from the surface of the earth.
- Irrigation: This means artificially watering the land. There are three main types of irrigation; gravity flow, sprinklers and drip systems.
- Land degradation: Land that is overused or misused can become degraded. This basically means that the quality of land has been reduced and it is less productive.
- Desertification: Very simply, this is the process of land turning into desert. This can happen because of natural factors like rising temperatures and drought, or human factors like overgrazing and deforestation.
19

- Eutrophication: This is the processing of artificially adding nitrates and phosphates (through fertilisers and sewage) to wetland areas e.g. rivers and lakes. The added nitrates and phosphates cause excessive growth of algae. The algae growth can reduce the oxygen content of the water as well as reduce the amount of sunlight that it receives. The nitrates and phosphates often come from agro-chemical run-off, but can also come from domestic sewage and industrial waste.
- Fertilisers: Fertilisers are substances that artificially supply the soil with nutrients. Fertilisers can increase the productivity of agricultural land, but can also cause eutrophication of nearby wetlands.
- Salinisation: This is the increase in the salt content of water. Salinisation can happen because of evaporation or unsustainable water extraction. If the water becomes too saline it becomes less fertile.
- World food prices: With growing demand and reducing supply, world food prices are at a high. It is usually the poor that are most impacted by rising food prices, because they spend a greater percentage of their income on food.
- Biofuels debate: Although biofuels are considered to be a renewable form of energy, they are causing deforestation in countries like Indonesia and Brazil and global increases in food prices.
- Desertification: China is seeing desertification on its northern border with the Gobi desert. With its growing population and rapid economic development, it is likely to be hit very hard by falling agricultural production.
- Hazards: The recent tsunami in Japan, will have effected Japan's agricultural production. This will not only put pressure on already high food prices, but has led to rationing in Japan.
GROWING DEMAND FOR AGRICULTURAL PRODUCTS The world's population is growing. The current population is about 7 billion, but it is expected to peak at nearer
to 9 billion. Because fossil fuels are finite, alternative forms of energy are being looked at. One form of renewable energy
being used are biofuels. Biofuels are made out of biological matter and therefore are increasing the demand for agricultural products.
Economic development. As more of the world's population is removed from poverty, their calorific intake increases. This increase in food consumption, is increasing the demand for agricultural products.
Pastoral farming. As the world population increase, the demand for meat also increases. Most farm animals are omnivores or herbivores so need agricultural products like corn to eat.
DECREASING SUPPLY OF AGRICULTURAL PRODUCTS OR LAND Urbanisation. As the world develops, urbanisation increases tends to happen increasing the size of urban areas.
As urban areas grow they eat into greenfield sites in rural areas, reducing the amount of agricultural land. Land degradation and desertification. Land that is overcultivated or overgrazed can become degraded (less
fertile). AS farmers try to react to demand by growing more intensively, more land is being degraded. In extreme circumstances, the land may turn to desert (desertification).
Rising sea levels. Some of the earth's most fertile agricultural areas are floodplains and deltas. As world sea levels (eustatic changes) increase much of this fertile land is lost.
Conversion to biofuels. Although not strictly reducing the amount of agricultural products (biofuels are agricultural products), this does decrease the supply of agricultural products available for human consumption. Biofuels are often favoured by farmers, because they demand a higher price.
Hazards. Natural hazards like tropical storms, volcanoes and tsunamis can reduce the amount of agricultural land available for cultivation.
Disease. There is an increasing amount of intensive monoculture (growing of one crop) taking place. Monoculture always runs the risk of been impacted by the outbreak of diseases or pests that attack the particular crop e.g. wheat leaf rust fungus.
The amount of agricultural land can be increased by:- Irrigation: By irrigation areas of land, areas that were previously too arid to support agriculture can be used for
agricultural production e.g. a long the banks of the River Nile in Egypt.- Drainage: Areas of wetlands can be drained, or that they can be used to grow agricultural products. The East of
England used to be largely covered in fens. The fens have now been drained and it is England's most productive agricultural area.
- Land reclamation: With land on the earth running out, more land is being reclaimed. This can be done by reclaiming land through drainage (above) or infilling coastal areas. Although this increases the amount of available land, the land can have a high water table with a high salt content. However, it does mean coastal reclaimed land can be used for urban growth, leaving more greenfield sites for agricultural production.
20

- Deforestation: By removing trees, this can increase the amount of agricultural land. However, areas that have been deforested tend to degrade very quickly. By removing trees you are removing the grounds source of humus and reducing its stability (tree root network). With the trees removed the ground becomes very vulnerable to wind and water erosion.
- Greenfield Protection: By protecting areas of greenfield from urban growth, you are not increasing the amount of agricultural land, but you are at least protecting what you already have.
- Fertilsers: Land that lacks nutrients can be brought into production by increasing the fertility of soil. This can be done by adding nutrients to the soil. It might also be possible to use previously unsuitable farm land by growing GM crops.
- Terracing: Terracing tends to happen on volcanic mountains, because the soil is so fertile. Terracing is simply cutting multiple layers into the mountainside to create small areas of agricultural land.
IrrigationIrrigation has taken place for nearly 6000 years and is simply the process of adding water to the land. Water to be irrigated can be taken from rivers, surfaces stores (natural and artificial) and groundwater stores (aquifers). Below is a summary of three main types of irrigation, as well at the impacts of irrigation and a case study of irrigation in Libya.
POSITIVE IMPACTS OF IRRIGATION- Irrigation increases the amount of agricultural land, by making arid areas more productive. Irrigation may
increase the number of harvests and the size of the yields.- Irrigation can reduce malnutrition and reduce countries’ dependency on food imports. It can also provide a
valuable source of foreign currency as agricultural exports can be sold.- By increasing the supply of agricultural products, the price of food can be reduced on the global market.- Irrigation can actually increase the water table of the area, because of infiltration. However, it must be
remembered that extra water cannot be created, so by raising the water table in one area, you must be reducing the amount of water in another area.
- Irrigation can increase precipitation. With the increased availability of water, evapotranspiration rates increase. This increases the humidity of the atmosphere and increases the chance of precipitation
NEGATIVE IMPACTS OF IRRIGATION- Irrigation can reduce the earth's albedo (the reflectivity). This is because sandy surfaces have a higher albedo
than dark green surfaces. If you reduce the earth's albedo then more incoming radiation is absorbed by the surface of the earth, furthering global warming. Obviously this change in albedo has to be offset by the increased amount of photosynthesis and also the increase in shaded areas.
- If groundwater is used unsustainably, irrigation can cause the water table to fall. In Texas, US, the water table has fallen by up to 50 metres.
- Irrigation has been blamed for creating tornadoes in Texas. Tornadoes are circulating columns of air in contact with the ground and cumulonimbus cloud. To develop they need high moisture content in the atmosphere.
- Irrigation often leads to an increase in salinisation. This can be because of increased evaporation from surface stores (reservoirs) and irrigation channels or water being drawn to the surface and evaporating.
- Because irrigation increases the amount of agricultural land, it is also blamed for the increase in the amount of fertilisers used. This in turn can lead to eutrophication of wetlands.
The Aral Sea - Irrigation and Salinisation Case Study- Inland lake on the border of Kazakhstan and Uzbekistan.- Used to be 4th largest inland lake in the world, surface area of 68,000km2.- Fed by two rivers – Amu Darya and Syr Darya.- Since 1960’s, sea has been shrinking because the two rivers have been diverted to irrigate the desert to increase
their production of melons, rice, wheat and cotton.- Rice & cotton need extremely high amounts of water to grow. Irrigation canals were built quickly and poorly
maintained; up to 75% of water gets lost through evaporation of leakage. Today, only 12% of Uzbekistan’s irrigation canals are lined to stop leakage.
21

- Between 1960 and 1988, surface area of the Aral Sea shrank by 60% and its volume by up to 80%. By 1998, its surface area was only 26,687km2, making it the 8th largest lake. In 2004, 17,160km2, 25% of original size. In 2007, 10% of original size.
- Salinity of the lake changed from 10g/L to 45g/L (1998), to 100g/L (2007). Normal sea salinity is at 35 g/L. - Increasing salinity has largely killed the sea’s ecosystem. Salt plains have appeared as more water is evaporated.
Salt whipped up in storms, killing crops, cooling winters and warming summers. Fish industry collapsed and residents’ health worsened due to inhalation of salt, a lack of clean water and food shortages.
Dianchi Lake (Kunming, China) - Eutrophication Case Study- Lake Dianchi is suffering from extreme eutrophication. Vast areas covered by dense algae blooms like green dye,
fish-breeding almost totally abandoned as there is no oxygen for them to breathe. Almost all native water plants and many fish species have been killed. Snails die from lack of oxygen in the bottom water.
- Poor water quality, difficult to supply water for domestic use that meets legal standards.- Eutrophication due to domestic sewage (urbanisation and population growth), industrial waste and reclamation
of wetlands around the lake to farm, leading to agro-chemical run-off.- Kunming has a population of over 1.2 million residents. First sewage treatment works opened in 1993, but only
10% of domestic waste gets treated.
Sub-topic 4: Competing demands for water
Conflicts at the local or national scale
Examine the competing demands for water in a specific river basin. Evaluate the strategies that have been adopted to meet these demands.
Conflicts at the international scale
Discuss an example of an international conflict related to freshwater.
This links to the case study about Marina Barrage. You need a case study of a river basin for this so your case study should be the Singapore River Basin. See Paper 1 revision guide for notes. Make sure that you focus on the competing demands, i.e.: Wildlife Domestic need for water Industrial Tourism
Water Security Risk Index: The Water Security Index is produced by the firm Maplecroft. Maplecroft are a company that monitor political, social, economic and environmental risk. They create over 100 indexes, the water security index being one of them. They look at four variables, when making their index:- Access to improved drinking water and sanitation.- Availability of renewable water and the reliance on external supplies- Relationship between available water and supply demands- Water dependency of each country's economy.
Two countries that the Nile flows through are considered to have an extreme water security risk: Egypt and Sudan.- Economic Water Scarcity: This is when the supply of water exists, but there is not enough money to extract,
treat and transport it.- Physical water Scarcity: This is when the demand for water exceeds the supply of water. Arid areas don't
necessarily have a physical water scarcity if the demands are low.- Water Stress: This is when there is a shortage
of water for economic reasons, physical reasons or both. If there is water stress then wetlands, ecosystems, agricultural land, industrial production and ultimately humans can all be affected.
According to the UN, there are more than 250 internationally shared rivers covering nearly half
22

the total land surface of the earth, as well as innumerable shared aquifers. Around 300 potential conflicts around the world have been identified.
Conflict over water is likely to increase because of:- Population Growth: The World's population currently stand at about 7 billion. Demographers argue about when
and how high the World population will peak at, but most agree that it will be at least 9 billion. Obviously as the World's population increases, so does the demand for water, for drinking, washing, cooking, etc.
- Economic Development: Generally, the more developed a country, the more water that it uses. Looking at the graph below, it is obvious that the biggest consumers per capita are all MEDCs. As the World's population increases, so will the demand for water. As people are richer they have flush toilets, showers and buy washing machines, dishwashers, etc.
- Increased Agriculture: As the World's population grows and gets richer, the demand for agricultural products will increase. As the demand increases so will the need to irrigate more arid areas. Also a populations develop, they tend to eat more meat, which needs even more water. It is estimated that it takes 10,000 litres of water to produce one beefsteak.
- Industrial Growth: Again as the World's population grows and becomes richer, the demand for industrial products grows. More people want cars and televisions, computers and cookers. Any industrial product or industrial process uses water, so as demand for the products goes up, so does the demand for water.
- Global Warming: Global warming is affecting different regions, in different ways. Although some areas will become wetter and possibly colder, areas that already are arid and suffer drought are likely to become more arid and suffer more drought. There will be less precipitation, but there will also be more evaporation. The areas that are likely to get drier include the Sahel and the Middle East. So not only is demand going up, but supply will be going down.
- Water Pollution: The supply of water is also being reduced by pollution. This might include natural groundwater pollution like in Bangladesh. Acid rain and an increase in salinisation will also make more water unsuitable for human consumption.
- Groundwater Depletion: Supply is also being reduced because groundwater is not only being polluted, but removed unsustainably. Over abstraction can cause subsidence and saltwater intrusion, but also conflict over reducing supplies e.g. Israel and the West Bank.
- Shared Resources: Many countries share rivers and lakes. As the demand for water increases and the supply decreases, countries are going to come increasingly into conflict about who the resources belong to. One of the best examples of this growing conflict is the River Nile.
River Nile- Longest river in the world with a total length of
6,650km.- Two main tributaries – White Nile and Blue Nile.
Confluence is in the Sudanese capital, Khartoum.- Source of White Nile in Burundi, source of Blue Nile in
Ethiopia. 85% of water comes from Blue Nile.- Flows through total of eleven countries; Burundi,
Rwanda, Democratic Republic of Congo, Uganda, Kenya, Tanzania, Eritrea, Ethiopia, Sudan, South Sudan, Egypt.
- Huge drainage basin of 3,254,555km2, roughly 10% of the whole of Africa.
- Civilisations have used the Nile for over 6,000 years to irrigate land. Only in recent years, as population and development levels of African countries increased, have disputes over the Nile’s use emerged.
Key Dates of the River Nile and its Territories (recent history)1888: Arrival of British East Africa Company in Kenya and Uganda, effectively beginning British colonisation of Kenya and Uganda.1899: Joint British and Egyptian rule begins in Sudan.1914: Egypt made official protectorate of UK.1929: Nile Water Agreement. The treaty signed between UK, Egypt and Sudan gave Egypt the ownership over the majority of the Nile's water (48 billion m3 a year), Sudan got 4 billion m3. Ethiopia, Kenya, Tanzania, Uganda and
23

other East African countries were not allowed to use any.1944: End of foreign interference from Italy and UK in Ethiopia (effectively independence).1954: The end of British military presence in Egypt.1956: Sudan independence from UK and Egypt.1959: While most of East Africa was still under British control, Egypt and Sudan signed another treaty. They estimated the Nile's annual flow to be 84 billion m3. Egypt gave itself 55.5 billion m3 and Sudan gave itself 18.5 m3. They estimated a further 10 billion m3 would be lost through evaporation, effectively giving all other countries no rights to any of the Nile's water.1961: Tanzania becomes independent from UK (before WWII, Tanzania was a German colony)1962: Uganda gains independence from UK. Rwanda and Burundi separate and gain independence from Belgium1963: Kenya becomes independent from UK and Democratic Republic of Congo becomes independent from Belgium1993: Eritrea becomes independent from Ethiopia1999: Nile Basin Initiative launched (All countries except Eritrea were members. It aimed to looked at sustainable usage of the NIle.2010: Kenya, Uganda, Rwanda, Ethiopia and Tanzania sign the "River Nile Basin Co-operative Framework"2011: Burundi becomes the sixth country allowing ratification of accord and possibly stripping Egypt of its historical claim over the NileOn numerous occasions Egypt has threatened to defend its historical claims over the Nile. It has even said that it will use air power against other countries to protect its flow of the River Nile. These tensions are going to rise with projects being carried out by countries along the Nile e.g.- HEP scheme on the White Nile in Uganda- Three HEP schemes on the Blue Nile in EthiopiaHEP projects may not be as controversial as irrigation schemes. This is because HEP projects don't actually remove water from the Nile, they just create artificial stores eventually allowing all the water to continue its journey down the Nile. However, it should be noted that evaporation from these artificial stores is going to be higher than evaporation directly from the river (it is estimated that 10% of the water gets evaporated from Lake Nasser).
Why is the River Nile Important?- Agriculture and Irrigation: We have already seen how Egypt depends on the Aswan Dam to irrigate the desert.
All other countries along the Nile's course would also like to increase agricultural production and possible increase agricultural exports. Ethiopia is meant to have the best coffee in the world and Kenya has a growing flower industry
- Tourism: The White Nile rapids in Uganda attracts thousands of tourists a year, as does Lake Victoria (fed by Nile) on the border of Kenya, Uganda and Tanzania and of course the River Nile in Egypt which is lined by ancient monuments.
- Transport: In countries that often lack good roads and railways, the lakes on the Nile and the Nile itself can make a vital transport link within and between countries. The waterways can help promote trade, particularly useful for landlocked countries like Burundi and Rwanda.
- Wildlife: The Nile is home to many species; including the Nile crocodile and hippopotamus. Many areas along the Nile have been protected as National Parks e.g. Murchison Falls NP in Uganda
- Drinking Water: Most African countries are experiencing growing population as well as increasing economic development. With bigger populations, more water is needed. With economic development the demand for washing machines, dishwashers, showers, etc. also increase
- HEP: Egypt currently generates much of its power from the Aswan High Dam. Other countries along the Nile's course would also like to be able to use the Nile's power and reduce their dependency on wood and other fossil fuel imports.
- Drought Control: East Africa regularly suffers from drought periods (northern Kenyan is suffering an ongoing drought). If the Nile's water can be stored in reservoirs, it might be able to reduce the effects of many of the regions droughts.
24