hawaii patient reward and incentives to support · pdf filehawaii patient reward and...
TRANSCRIPT
1 | Page Hawaii MIPCD - HI-PRAISE Final Report - December 2016
Hawaii Patient Reward And Incentives to Support Empowerment
Medicaid Incentives to Prevent Chronic Disease
September 2011 – September 2016
Funded by the Centers on Medicare & Medicaid Services
To the Hawai`i State Department of Human Services
Facilitated by the University of Hawai`i at Manoa
CDFA 93.536
FINAL REPORT
December 12, 2016
Contributors
Rebecca Rude Ozaki, PhD., Co-PI
Ritabelle Fernandes, MD, Co-PI
Chuan Chang Chinn, PhD.
Dongmei Li, PhD.
Timothy Frankland, MA
Zi Wang, MA
Myra Smith, MPH
Christina Beyers Wang, RN, MPH
Uyen Vu, MA
Tony Lam, MA
Timothy Halliday, PhD.

2 | Page Hawaii MIPCD - HI-PRAISE Final Report - December 2016
Table of Contents
Page
I. Introduction 3
II. Pre-Implementation – Evaluation Activities 3
III. Summary of Recruitment 4
a. The Recruitment of FQHC and Kaiser Permanente 4
b. The FQHC and Kaiser Teams and Building Capacity through Training 5
IV. Enrollment 5
a. Enrollment of Participants 5
b. Compact of Free Association 6
V. Incentives and Supplemental Services 8
a. Incentives 8
b. Incentive Schedule 9
c. Incentive Compensation for FQHCs 10
d. Incentive Compensation for Kaiser Permanente 11
e. Supplemental Services 13
f. Supplemental Services Compensation for FQHCs 15
g. Supplemental Services Compensation for Kaiser Permanente 15
VI. Overall Project Goals 16
VII. Evaluation 22
a. FQHC Pre- and Post- Design 25
b. FQHC Results 25
c. Kaiser Permanente RCT Study Design 42
d. Kaiser RCT Results 44
e. Survey Results 47
VIII. Cost Effectiveness of HI-PRAISE Program 57
IX. Lessons Learned and Limitations 58
X. Acknowledgements 59
XI. References 60
XII. Appendices (see attached HI-PRAISE Appendices)
3 | Page Hawaii MIPCD - HI-PRAISE Final Report - December 2016
I. Introduction
The Centers on Medicare and Medicaid Services (CMS) awarded the Medicaid Incentives for
the Prevention of Chronic Diseases to the State of Hawaii ~ Department of Human Services
(DHS) in September 2011. The Hawaii Patient Reward And Incentives to Support Empowerment
(HI-PRAISE) five-year project has been facilitated by the University of Hawaii, Center on
Disability Studies (UH-CDS) and the John A. Burns School of Medicine (JABSOM). This
comprehensive demonstration grant sought to determine if direct incentives provided to
participants with chronic disease(s) would improve biometric measures and reduce utilization of
acute health care services and related cost. The overarching project objective was to test
approaches that are widely available across the State, scalable, easy to access within the
community, and promote self-management of chronic diseases. The target population for the HI-
PRAISE project were individuals diagnosed with Type 1 or Type 2 diabetes, 18 years of age or
older, and a Medicaid beneficiary. The study excluded pregnant women.
The HI-PRAISE project was comprised of two study designs. The first was a quasi-
experimental design conducted statewide with nine Federally Qualified Health Centers (FQHC).
A within person, pre- and post-intervention with adjustment of baseline characteristics such as
age, race, and gender, comparing participant health outcomes was applied. This was augmented
with the use of an extant control group to compare changes over time between the intervention
and control groups. The second statewide study was conducted with patients from Kaiser
Permanente - Hawaii using a randomized controlled trial (RCT) design. The two main goals of
the HI-PRAISE project were to: (1) improve early detection of diabetes among individuals at
high risk for diabetes and (2) improve diabetes self-management among individuals with
diabetes. Each design will be further explained in the respective summaries.
II. Pre-Implementation Evaluation Activities
Hawaii serves a large ethnically and culturally diverse population. The HI-PRAISE project
focused on the inclusion of the entire system of Federal 330 community health centers in its
effort to affect healthcare delivery system change for underserved populations including the
uninsured and targeted Hawaii Kaiser Permanente for the low to moderate income individuals
that are privately insured. These sites were widely accessible and would allow the HI-PRAISE
project to learn about the effectiveness of incentive programs among ethnic groups that were
paired with evidence-based motivational interviewing techniques to support lifestyle changes
that are sustainable after the incentives are removed.
The HI-PRAISE project team was notified of the award in September 2011, but the final
contract between DHS and UH-CDS was not fully executed until June of 2012. This nine-month
delay significantly impacted the final execution of contracts with FQHCs and private contractors
and the hiring of personnel. However, while awaiting the fully executed contract and within the
first project year, the core HI-PRAISE team tackled multiple foundational tasks to set the stage
4 | Page Hawaii MIPCD - HI-PRAISE Final Report - December 2016
for the next four years.
Generally, the first year could be characterized as one of development. HI-PRAISE created
and received approvals for: the CMS Operational Protocol, specific domains for Hawaii
minimum data set (MDS), and the University of Hawaii Internal Review Board (IRB) application
to conduct research with human subjects. The team conducted initial meetings with Hawaii
Primary Care Association, FQHCs and Medicaid health plans. Those meetings helped define the
roles and responsibilities of FQHCs for the Service Agreements contracts and assisted the
FQHCs in development of implementation plans. The teams worked to establish the procedure
for HIPAA-compliant data sharing of claims, define needed biometric lab reports on patients,
develop informed consent forms (translated into 6 languages), and design collateral marketing
materials for recruitment and enrollment.
Operationally, the project created job descriptions and position numbers for hiring project
coordinators and IT specialists, and developed the HI-PRAISE registry, a statewide electronic IT
data collection system to assist with quarterly data set information reports. Additionally, we
developed codebooks for the Hawaii MDS that coincided with the HI-PRAISE registry for
FQHC use, hired a contractor to develop a HIPAA compliant accessible website, and defined
usage and interface for FQHC and the HI-PRAISE team to track and create reports. We
identified survey tools and began to develop the Satisfaction Survey. By December of 2012 we
had hired needed personnel to begin trainings of FQHC personnel and were pilot testing the HI-
PRAISE registry site to ensure it was as user friendly and seamless as possible.
III. Summary of Recruitment
The Recruitment of FQHCs and Kaiser Permanente
As the demonstration moved into year two, the HI-PRAISE project was at various stages of
discussion and completion of the Service Agreement contracts with five FQHCs. While this was
promising, recruitment efforts of service providers took from 3 to 8 months after an initial
introductory meeting. Once fully engaged, the completion of Service Agreements, training of
FQHC personnel and getting the FQHC ready for recruitment of participants in the project took
from 5 months to more than a year for each contract. The HI-PRAISE project used a rolling
enrollment model for both the engagement of service providers and participants in the project.
Ultimately, the project engaged nine of fourteen FQHCs and a private provider – Kaiser
Permanente; the first FQHC started enrollment on February 1, 2013 with the others staggered
thereafter and all were fully operational by April 2014. This allowed each FQHC participant
engagement for a minimum of 21 months ranging to 35 months in the HI-PRAISE project. For
the Kaiser Permanente, participants ranged from 20 to 12 months.
Acknowledging that participation in the HI-PRAISE project would take specific personnel
away from usual care activities, the FQHCs and Kaiser Permanente were offered supplemental
service funds to encourage participation in the statewide demonstration. The purpose was to
compensate for the time that would be devoted to training their team on the use of motivational

5 | Page Hawaii MIPCD - HI-PRAISE Final Report - December 2016
interviewing skills, goal setting, recruitment of participants, data collection and reporting, and
distribution of incentives. The undesignated funds were intended to support organizations to hire
designated staff or carve out time of existing staff to complete the mandatory tasks.
The FQHC and Kaiser Teams and Building Capacity through Training
Each site had a core team of 1-3 individuals that led the HI-PRAISE project. These
individuals were commonly Physicians, Registered Nurses, Diabetes Educators, and in one case
a Pharmacist. Their commitment and buy-in directly reflected the outcome of the project at the
sites. They met regularly with the HI-PRAISE coordinators and were responsible for the
implementation of the project, distribution of the incentives, and data collection of all reports in
the HI-PRAISE registry. The site project team’s efforts correlate with the high enrollment of
participants and participants’ overall satisfaction with the HI-PRAISE project.
To increase consistency between FQHCs, the HI-PRAISE team took a high-touch approach
through regular emails, site visits, one-on-one consultations, and group trainings. There was an
average of five group trainings conducted per site to: physicians, nurses, diabetes educators,
medical assistants, outreach workers, and others. These trainings were from one to three hours
depending on the topic and consisted of 8 to 65 medical attendees at any given session. Topics
included: general overview of the project, motivational interview skills (Part I-III), development
of patient centered SMART goals, how to provide brief diabetes information/education during
clinical visits, data collection, reporting, and use of the HI-PRAISE registry. Five all day bi-
annual Health Coach trainings provided in-depth information on critical topics, problem-solved
issues related to the project, afforded a learning collaborative between FQHCs, delivered
trainings on how to build a diabetes education program, and in general supported their personal
growth and sustainability of the HI-PRAISE project.
Project coordinators reported that these training enhanced the adoption of the Patient
Centered Medical Home model, allowing teams of physicians, nurses, community workers, and
others to gather and target the enrollment and follow up with HI-PRAISE participants. Another
sustainable outcome was the attainment of the American Diabetes Association (ADA)
certification by two FQHCs, allowing them to bill for the diabetes education classes they
provide. The trainings and support services aimed to help the FQHC and Kaiser teams to
motivate the HI-PRAISE participants to overcome possible challenges associated with lifestyle
changes and improve their self-management skills.
IV. Enrollment
Enrollment of Participants
The target population for the HI-PRAISE project were adults (18 years and greater)
diagnosed with either Type 1 or Type 2 diabetes who were receiving Medicaid benefits. The
project excluded women with gestational diabetes. Originally, based on projected numbers
6 | Page Hawaii MIPCD - HI-PRAISE Final Report - December 2016
provided by the Hawaii Provider Care Association, our target enrollment number was 4,521;
3,657 from FQHCs and 864 from private providers.
As stated above, the roll-out of the projects in the community was delayed. The first
participant was enrolled into the HI-PRAISE project on February 1, 2013, 17 months after the
grant was awarded. After discussion with the FQHCs it was determined that the projected
numbers were too high. Four sites negotiated their enrollment numbers down from the
anticipated goal while five maintained and exceeded the target number. However, the HI-
PRAISE project was only able to enroll 9 of 14 FQHCs. Additionally, it was determined that
trying to engage 20 private providers, get contracts executed and staff trained would be too time
intensive. The focus on Kaiser Permanente, the largest private provider, allowed the team to
conduct a RCT design within an independent health organization. Since it was apparent that the
HI-PRAISE project could not recruit 4,521 participants in the intervention, a meeting was
conducted with CMS and IMPAQ International and RTI, the national evaluation teams, to
renegotiate our target enrollment to 1,000 participants. Ultimately, we exceeded this number but
were unprepared for a federal ruling that impacted the overall HI-PRAISE study.
Compact of Free Association
Micronesia consists of over 2,000 islands stretched across 3,000 miles of Pacific Ocean.
These islands were under Spanish, German, and Japanese colonial rule for 400 years. Following
World War II, the islands in the Northern Marianas, Palau, Yap, Chuuk, Pohnpei, Kosrae, and
the Marshall Islands were held in trust by the United States through a 1947 United Nations
mandate as the “Trust Territory of the Pacific Islands.” The United States was entrusted to
protect the land, resources, and health of the Micronesians; while being charged with fostering
the development of political institutions, promoting economic, social and educational
advancement, and moving the Trust Territory towards self-governance. In 1977, they were
offered incorporation into the US as a commonwealth or territory; or independence with certain
privileges and restrictions. Starting in the late 1980s, the former Trust Territory split into the
Commonwealth of the Northern Marianas Islands and the three Freely Associated States through
separate Compacts of Free Association: 1. The Republic of Palau, 2. The Republic of the
Marshall Islands, and 3. The Federated States of Micronesia consisting of four states: Yap,
Chuuk, Pohnpei, and Kosrae. The compact granted these islands sovereignty in domestic and
foreign affairs in return for defense rights in the islands to the US. The citizens of these islands
could enter the US without visa requirements. Many chose to migrate to Hawaii in search of
better economic and healthcare opportunities.
In 1996, Congress passed the Welfare Reform Act also known as The Personal
Responsibility and Work Opportunity Reconciliation Act (PRWORA) that defined certain
noncitizens, including citizens from the island nations of the Compact of Free Association
(COFA) with the US, as ineligible for Medicaid. In response, and over the course of time,
legislation mandated the provision of (Children’s Health Insurance Program Reauthorization Act
2009; Basic Health Hawaii, 2010) Medicaid-like benefits to most lawful permanent COFA
7 | Page Hawaii MIPCD - HI-PRAISE Final Report - December 2016
residents using only Hawaii State funds. DHS in turn reported all health care costs of COFA
residents to Medicaid.
On November 15, 2014, the Ninth Circuit Court held that Hawaii was not required to provide
state-funded Medicaid-like services to non-citizens who are not eligible for Medicaid under
federal law effective March 1, 2015. Options for these individuals were provided but those who
were regarded as Medicaid eligible, albeit State-like were no longer eligible for the HI-PRAISE
project. This impacted the project significantly, with a loss of 38% of the HI-PRAISE
participants.
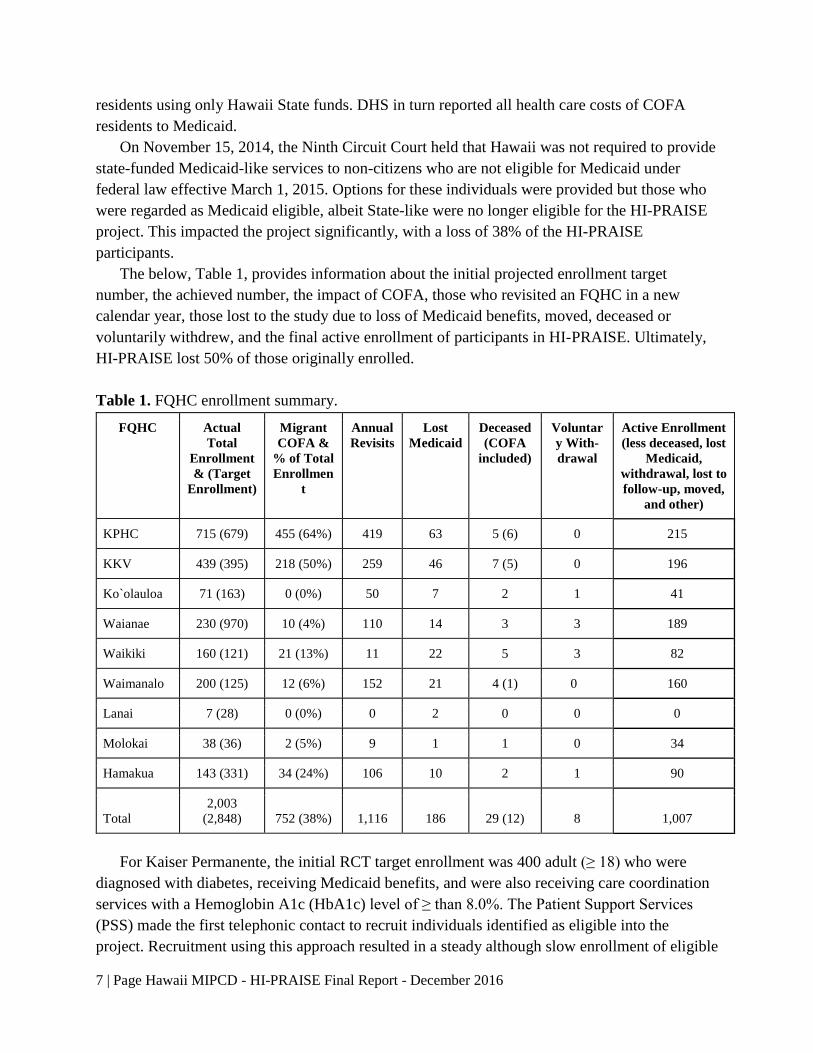
The below, Table 1, provides information about the initial projected enrollment target
number, the achieved number, the impact of COFA, those who revisited an FQHC in a new
calendar year, those lost to the study due to loss of Medicaid benefits, moved, deceased or
voluntarily withdrew, and the final active enrollment of participants in HI-PRAISE. Ultimately,
HI-PRAISE lost 50% of those originally enrolled.
Table 1. FQHC enrollment summary.
FQHC Actual
Total
Enrollment
& (Target
Enrollment)
Migrant
COFA &
% of Total
Enrollmen
t
Annual
Revisits
Lost
Medicaid
Deceased
(COFA
included)
Voluntar
y With-
drawal
Active Enrollment
(less deceased, lost
Medicaid,
withdrawal, lost to
follow-up, moved,
and other)
KPHC 715 (679) 455 (64%) 419 63 5 (6) 0 215
KKV 439 (395) 218 (50%) 259 46 7 (5) 0 196
Ko`olauloa 71 (163) 0 (0%) 50 7 2 1 41
Waianae 230 (970) 10 (4%) 110 14 3 3 189
Waikiki 160 (121) 21 (13%) 11 22 5 3 82
Waimanalo 200 (125) 12 (6%) 152 21 4 (1) 0 160
Lanai 7 (28) 0 (0%) 0 2 0 0 0
Molokai 38 (36) 2 (5%) 9 1 1 0 34
Hamakua 143 (331) 34 (24%) 106 10 2 1 90
Total
2,003
(2,848) 752 (38%) 1,116 186 29 (12) 8 1,007
For Kaiser Permanente, the initial RCT target enrollment was 400 adult (≥ 18) who were
diagnosed with diabetes, receiving Medicaid benefits, and were also receiving care coordination
services with a Hemoglobin A1c (HbA1c) level of ≥ than 8.0%. The Patient Support Services
(PSS) made the first telephonic contact to recruit individuals identified as eligible into the
project. Recruitment using this approach resulted in a steady although slow enrollment of eligible
8 | Page Hawaii MIPCD - HI-PRAISE Final Report - December 2016
patients. In November 2014, the target population was expanded to anyone with an HbA1c ≥
6.5% and an RN was designated to assist with recruitment efforts 20 hours per week.
Additionally, recruitment was extended to January 31, 2015 in an effort to attain the reduced
target goal of 360 participants. Since a minimum of 12 months in the project was desired to
determine the effectiveness of receiving incentives for demonstrating appropriate self-
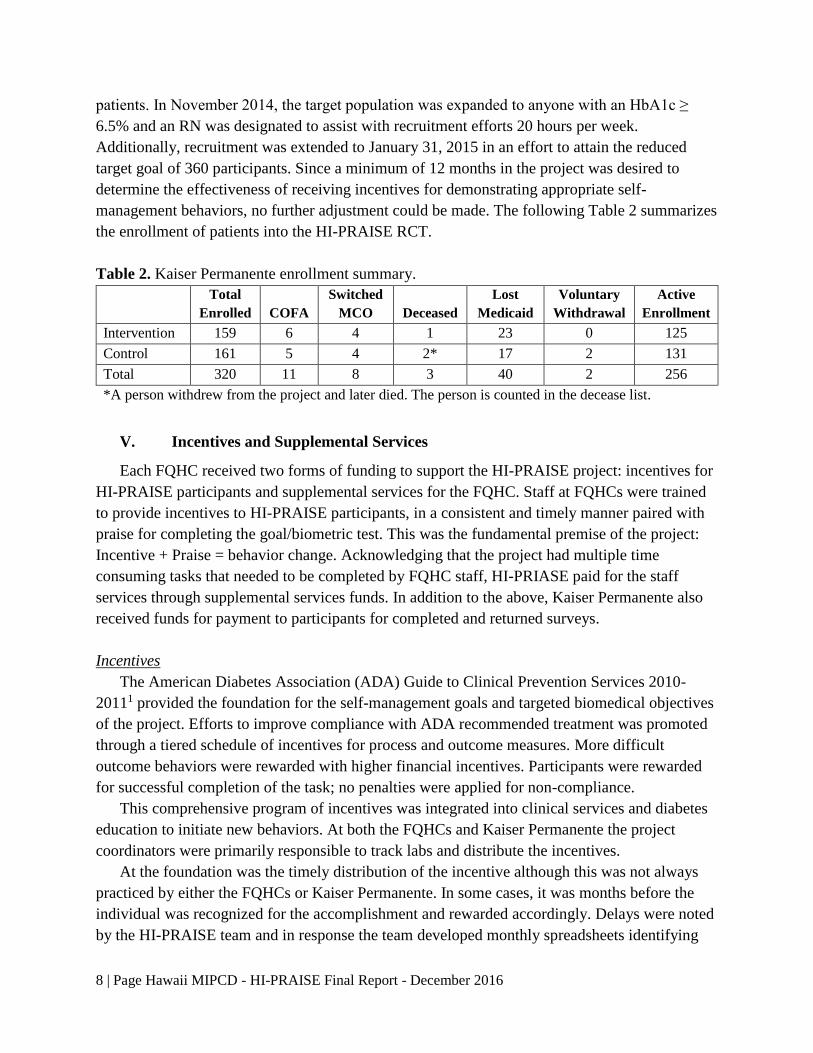
management behaviors, no further adjustment could be made. The following Table 2 summarizes
the enrollment of patients into the HI-PRAISE RCT.
Table 2. Kaiser Permanente enrollment summary.
Total
Enrolled COFA
Switched
MCO Deceased
Lost
Medicaid
Voluntary
Withdrawal
Active
Enrollment
Intervention 159 6 4 1 23 0 125
Control 161 5 4 2* 17 2 131
Total 320 11 8 3 40 2 256
*A person withdrew from the project and later died. The person is counted in the decease list.
V. Incentives and Supplemental Services
Each FQHC received two forms of funding to support the HI-PRAISE project: incentives for
HI-PRAISE participants and supplemental services for the FQHC. Staff at FQHCs were trained
to provide incentives to HI-PRAISE participants, in a consistent and timely manner paired with
praise for completing the goal/biometric test. This was the fundamental premise of the project:
Incentive + Praise = behavior change. Acknowledging that the project had multiple time
consuming tasks that needed to be completed by FQHC staff, HI-PRIASE paid for the staff
services through supplemental services funds. In addition to the above, Kaiser Permanente also
received funds for payment to participants for completed and returned surveys.
Incentives
The American Diabetes Association (ADA) Guide to Clinical Prevention Services 2010-
20111 provided the foundation for the self-management goals and targeted biomedical objectives
of the project. Efforts to improve compliance with ADA recommended treatment was promoted
through a tiered schedule of incentives for process and outcome measures. More difficult
outcome behaviors were rewarded with higher financial incentives. Participants were rewarded
for successful completion of the task; no penalties were applied for non-compliance.
This comprehensive program of incentives was integrated into clinical services and diabetes
education to initiate new behaviors. At both the FQHCs and Kaiser Permanente the project
coordinators were primarily responsible to track labs and distribute the incentives.
At the foundation was the timely distribution of the incentive although this was not always
practiced by either the FQHCs or Kaiser Permanente. In some cases, it was months before the
individual was recognized for the accomplishment and rewarded accordingly. Delays were noted
by the HI-PRAISE team and in response the team developed monthly spreadsheets identifying
9 | Page Hawaii MIPCD - HI-PRAISE Final Report - December 2016
the participant, task accomplished, and amount due so the FQHCs and Kaiser Permanente could
update and incentivize accordingly.
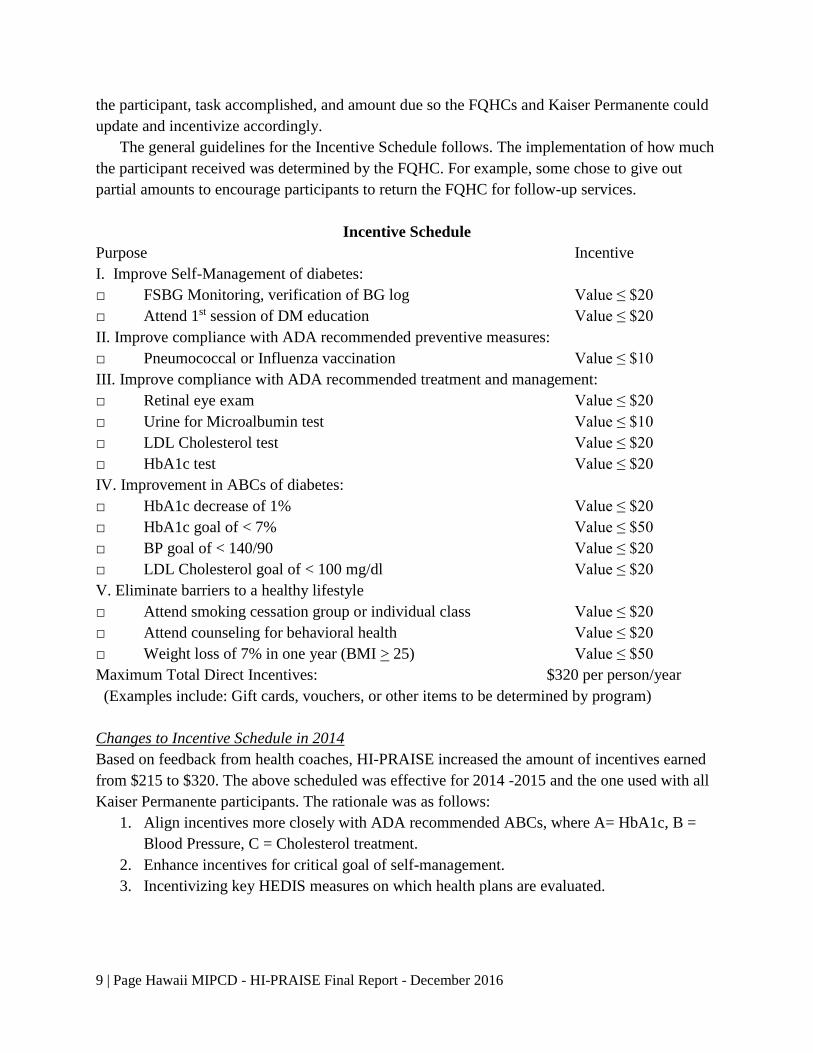
The general guidelines for the Incentive Schedule follows. The implementation of how much
the participant received was determined by the FQHC. For example, some chose to give out
partial amounts to encourage participants to return the FQHC for follow-up services.
Incentive Schedule
Purpose Incentive
I. Improve Self-Management of diabetes:
□ FSBG Monitoring, verification of BG log Value ≤ $20
□ Attend 1st session of DM education Value ≤ $20
II. Improve compliance with ADA recommended preventive measures:
□ Pneumococcal or Influenza vaccination Value ≤ $10
III. Improve compliance with ADA recommended treatment and management:
□ Retinal eye exam Value ≤ $20
□ Urine for Microalbumin test Value ≤ $10
□ LDL Cholesterol test Value ≤ $20
□ HbA1c test Value ≤ $20
IV. Improvement in ABCs of diabetes:
□ HbA1c decrease of 1% Value ≤ $20
□ HbA1c goal of < 7% Value ≤ $50
□ BP goal of < 140/90 Value ≤ $20
□ LDL Cholesterol goal of < 100 mg/dl Value ≤ $20
V. Eliminate barriers to a healthy lifestyle
□ Attend smoking cessation group or individual class Value ≤ $20
□ Attend counseling for behavioral health Value ≤ $20
□ Weight loss of 7% in one year (BMI > 25) Value ≤ $50
Maximum Total Direct Incentives: $320 per person/year
(Examples include: Gift cards, vouchers, or other items to be determined by program)
Changes to Incentive Schedule in 2014
Based on feedback from health coaches, HI-PRAISE increased the amount of incentives earned
from $215 to $320. The above scheduled was effective for 2014 -2015 and the one used with all
Kaiser Permanente participants. The rationale was as follows:
1. Align incentives more closely with ADA recommended ABCs, where A= HbA1c, B =
Blood Pressure, C = Cholesterol treatment.
2. Enhance incentives for critical goal of self-management.
3. Incentivizing key HEDIS measures on which health plans are evaluated.
10 | Page Hawaii MIPCD - HI-PRAISE Final Report - December 2016
Incentive Compensation for FQHCs
It was left to the discretion of the health center and health coaches to purchase the type of
incentive that would have the greatest appeal to their population. Incentives were in the form of
gift cards to local grocery (Times, Foodland, Safeway), pharmacy (CVS, Longs), and retail
(Walmart) vendors. Some chose to give gift certificates to local farmer’s markets or food
(Subway) vendors while others gave gas station cards and fitness center memberships.
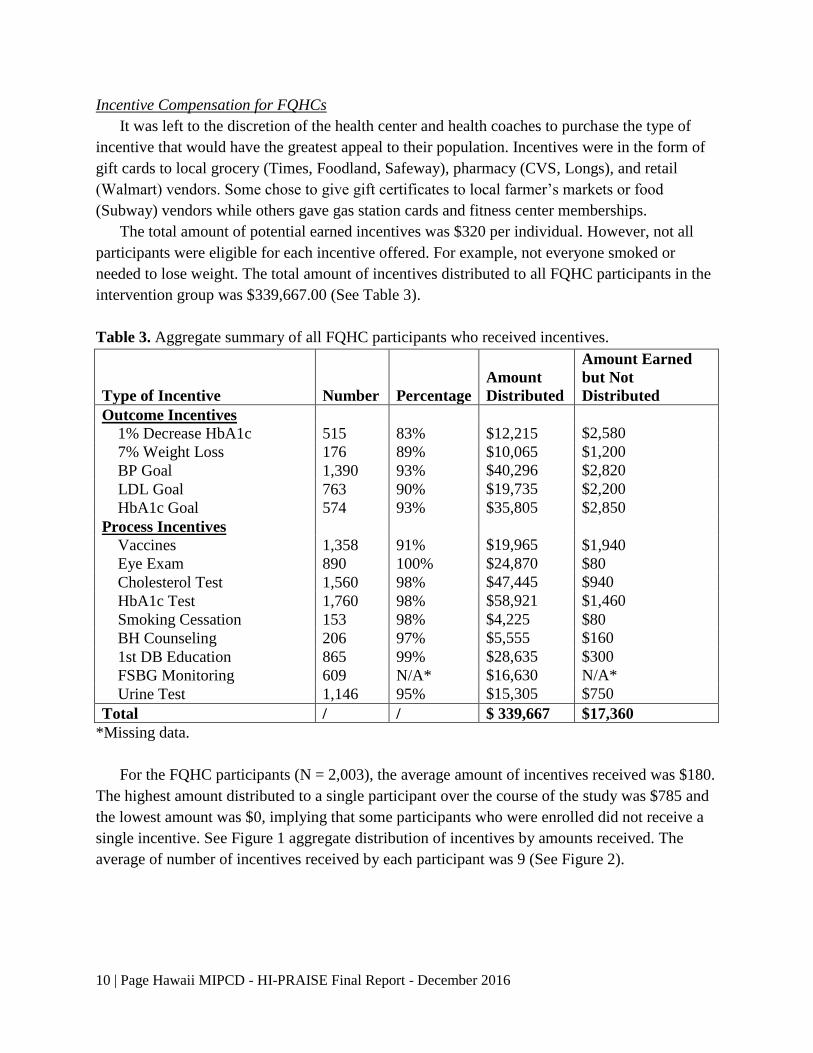
The total amount of potential earned incentives was $320 per individual. However, not all
participants were eligible for each incentive offered. For example, not everyone smoked or
needed to lose weight. The total amount of incentives distributed to all FQHC participants in the
intervention group was $339,667.00 (See Table 3).
Table 3. Aggregate summary of all FQHC participants who received incentives.
Type of Incentive Number Percentage
Amount
Distributed
Amount Earned
but Not
Distributed
Outcome Incentives
1% Decrease HbA1c 515 83% $12,215 $2,580
7% Weight Loss 176 89% $10,065 $1,200
BP Goal 1,390 93% $40,296 $2,820
LDL Goal 763 90% $19,735 $2,200
HbA1c Goal 574 93% $35,805 $2,850
Process Incentives
Vaccines 1,358 91% $19,965 $1,940
Eye Exam 890 100% $24,870 $80
Cholesterol Test 1,560 98% $47,445 $940
HbA1c Test 1,760 98% $58,921 $1,460
Smoking Cessation 153 98% $4,225 $80
BH Counseling 206 97% $5,555 $160
1st DB Education 865 99% $28,635 $300
FSBG Monitoring 609 N/A* $16,630 N/A*
Urine Test 1,146 95% $15,305 $750
Total / / $ 339,667 $17,360
*Missing data.
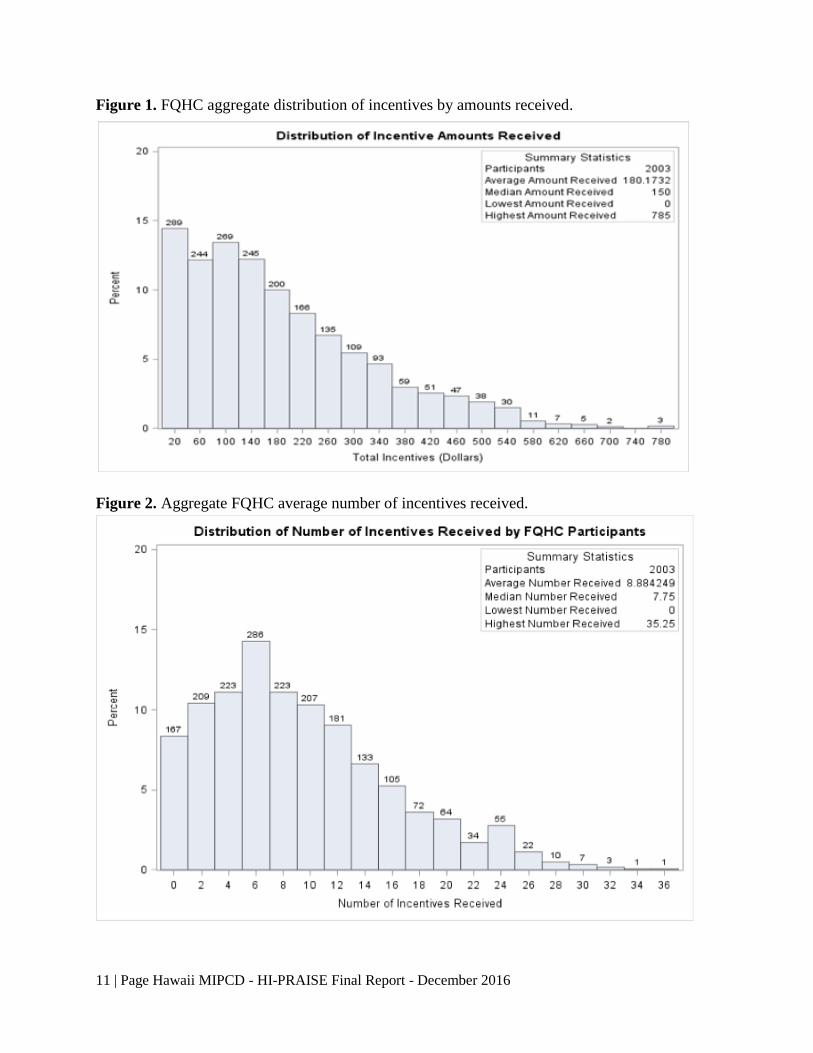
For the FQHC participants (N = 2,003), the average amount of incentives received was $180.
The highest amount distributed to a single participant over the course of the study was $785 and
the lowest amount was $0, implying that some participants who were enrolled did not receive a
single incentive. See Figure 1 aggregate distribution of incentives by amounts received. The
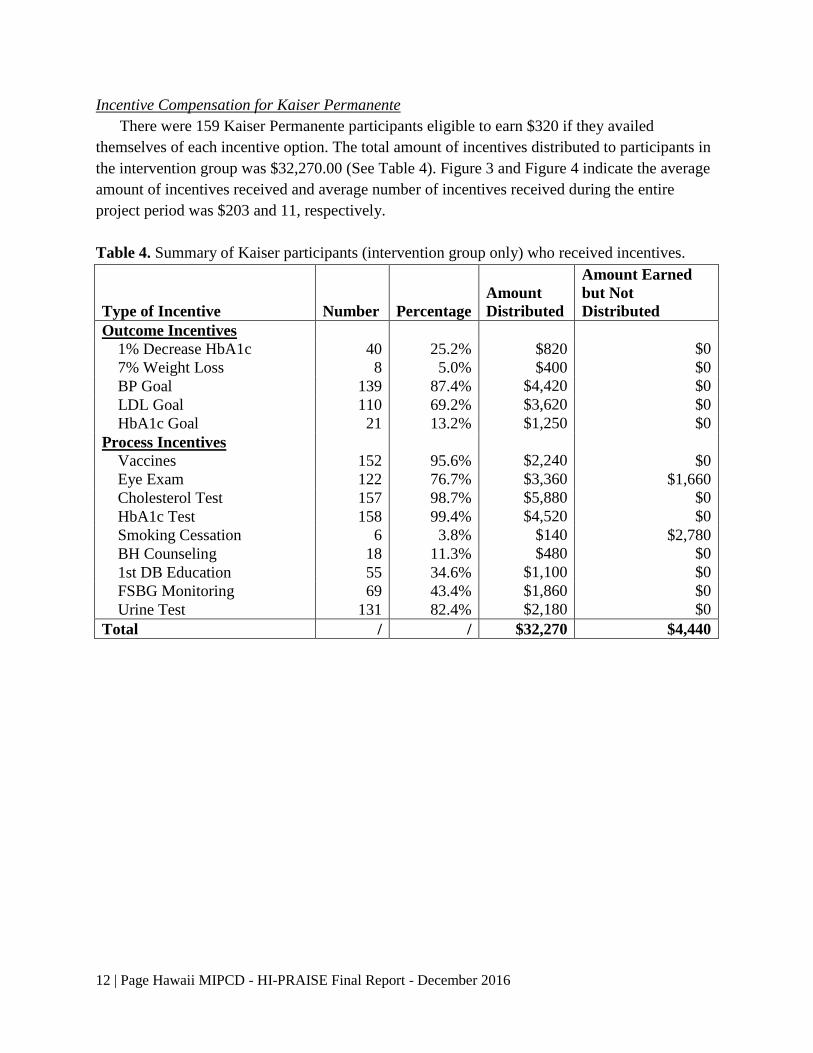
average of number of incentives received by each participant was 9 (See Figure 2).
11 | Page Hawaii MIPCD - HI-PRAISE Final Report - December 2016
Figure 1. FQHC aggregate distribution of incentives by amounts received.
Figure 2. Aggregate FQHC average number of incentives received.
12 | Page Hawaii MIPCD - HI-PRAISE Final Report - December 2016
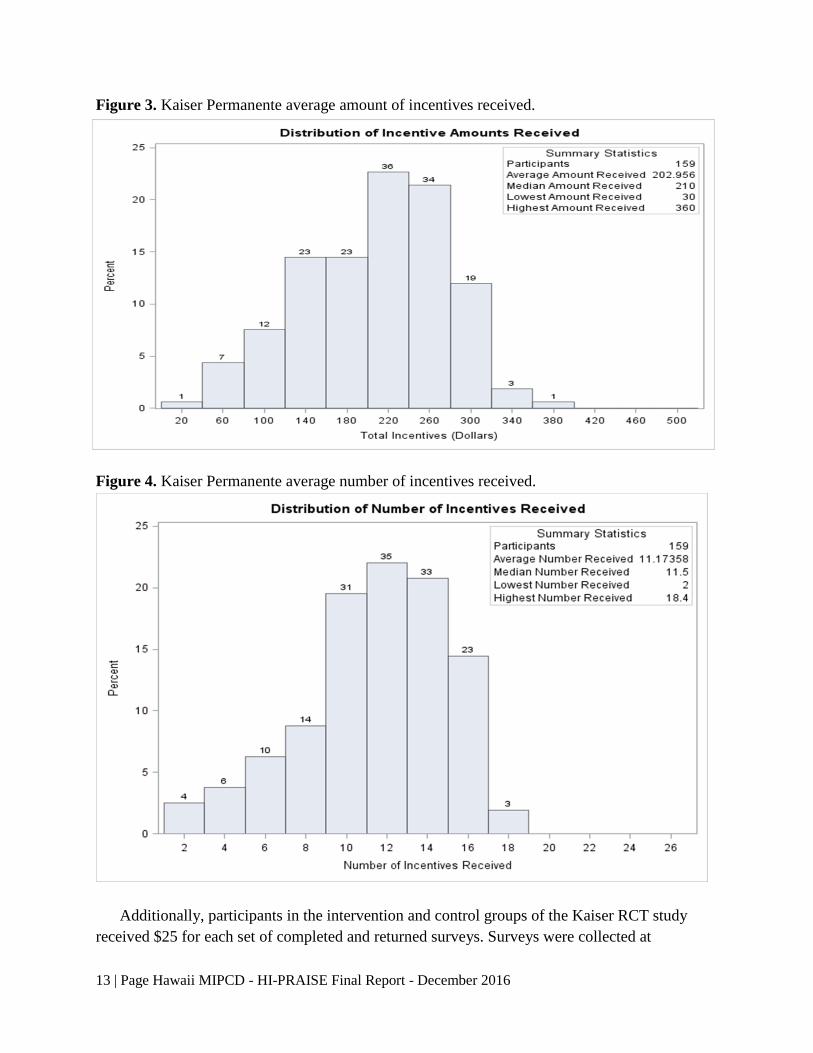
Incentive Compensation for Kaiser Permanente
There were 159 Kaiser Permanente participants eligible to earn $320 if they availed
themselves of each incentive option. The total amount of incentives distributed to participants in
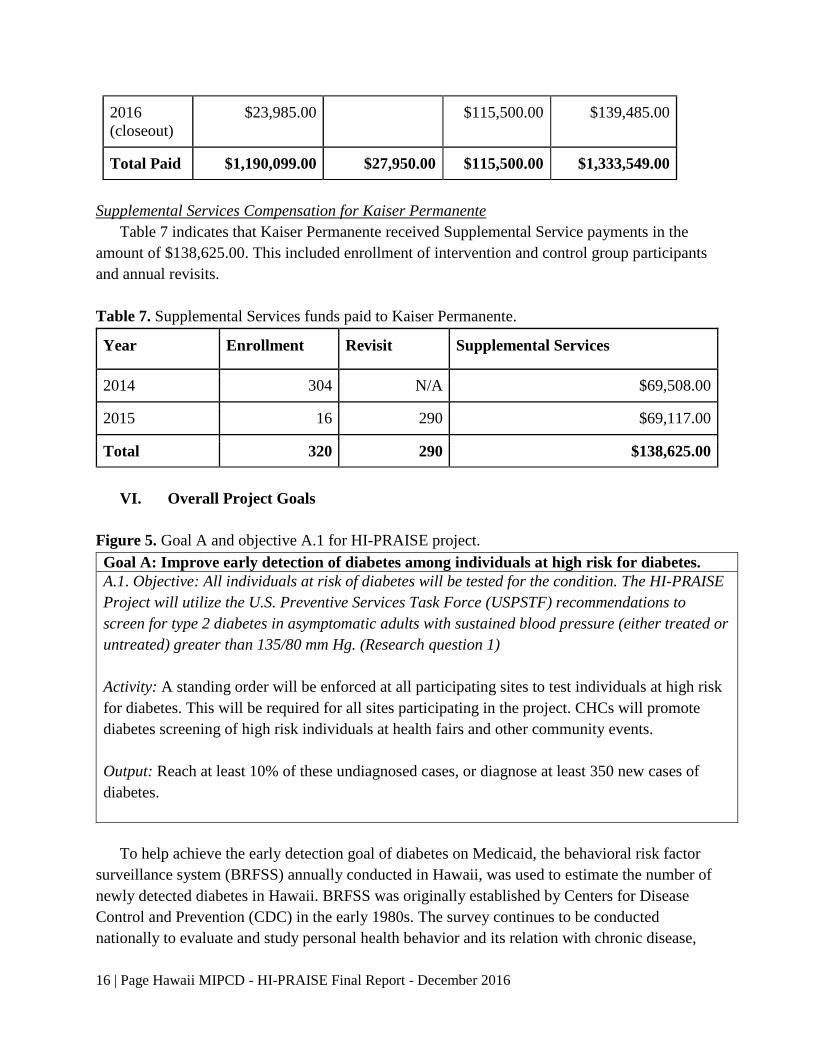
the intervention group was $32,270.00 (See Table 4). Figure 3 and Figure 4 indicate the average
amount of incentives received and average number of incentives received during the entire
project period was $203 and 11, respectively.
Table 4. Summary of Kaiser participants (intervention group only) who received incentives.
Type of Incentive Number Percentage
Amount
Distributed
Amount Earned
but Not
Distributed
Outcome Incentives
1% Decrease HbA1c 40 25.2% $820 $0
7% Weight Loss 8 5.0% $400 $0
BP Goal 139 87.4% $4,420 $0
LDL Goal 110 69.2% $3,620 $0
HbA1c Goal 21 13.2% $1,250 $0
Process Incentives
Vaccines 152 95.6% $2,240 $0
Eye Exam 122 76.7% $3,360 $1,660
Cholesterol Test 157 98.7% $5,880 $0
HbA1c Test 158 99.4% $4,520 $0
Smoking Cessation 6 3.8% $140 $2,780
BH Counseling 18 11.3% $480 $0
1st DB Education 55 34.6% $1,100 $0
FSBG Monitoring 69 43.4% $1,860 $0
Urine Test 131 82.4% $2,180 $0
Total / / $32,270 $4,440
13 | Page Hawaii MIPCD - HI-PRAISE Final Report - December 2016
Figure 3. Kaiser Permanente average amount of incentives received.
Figure 4. Kaiser Permanente average number of incentives received.
Additionally, participants in the intervention and control groups of the Kaiser RCT study
received $25 for each set of completed and returned surveys. Surveys were collected at

14 | Page Hawaii MIPCD - HI-PRAISE Final Report - December 2016
enrollment, mid and end of study for a possible total received of $75. Table 5 summarizes survey
compensation payments.
Table 5. Summary of surveys completed and compensation distributed.
Year Number of Surveys Completed
and Returned
Survey Compensation to Participants
2014 266 $6,650
2015 301 $7,525
Total $14,175
Supplemental Services
The purpose of the HI-PRAISE Project was to improve health outcomes of Hawaii’s
Medicaid population with diabetes through education, health coaching, and incentives. To
increase continuity between FQHCs and Kaiser Permanente, a service agreement was developed
defining a scope of services detailing required tasks to be completed. Ideally, HI-PRAISE hoped
for a designated full time person at each site. This was not achieved. Some sites had multiple
project coordinators and health coaches assigned to the project while others were pressed to keep
one person as the lead.
Supplemental Service payments were provided to both the FQHCs and Kaiser Permanente
for the recruitment, enrollment, tracking, and monthly/quarterly submission of participants’ data.
For the FQHCs, base payment was $175 for the completion of these tasks for each participant in
the intervention groups. Neighbor island (NI) FQHCs received an additional $25 per/person to
support the cost of travel to semi-annual meetings conducted on Oahu for health coaches. As
advised by the Executive Directors, to be fair and encourage participation, some NIs received a
rural compensation since the intensity of the work would be the same for a few or many. An
additional $108 was paid for approximately 2.25 hours of staff time for providing health
coaching using motivational interviewing skills, praise for goal attainment, and incentive
tracking and distribution. The total amount an FQHC could receive per person for enrollment in
the intervention group was $283 ($308 for NIs). Annual revisits netted the same amount per
participant. The FQHCs also received $50 per/person for participants who attended one or more
group education classes. This money was reimbursed annually and used to support giveaways
such as water bottles and food at the education classes. In addition, if an FQHC attained
American Diabetes Association certification for the development and implementation of diabetes
education classes they earned $6,780. Finally, four FQHCs were paid for providing extant
control data. The fee was based on the core funding amount of $175 per person.
Kaiser Permanente’s supplemental service funds included $283 per person in the intervention
group for initial enrollment and annual revisits and the base amount of $175 for each participant
in the control group. The guidelines for Supplemental Services compensation follows.

15 | Page Hawaii MIPCD - HI-PRAISE Final Report - December 2016
Supplemental Services Guidelines
Purpose Reimbursement
UNDUPLICATED
I. Assess, Refer, Track Patients to HI-PRAISE Value $175 p/p annually
$200 NI p/p annually
□ Project Manager – purchase incentives, overall coordination
□ Data Entry Personnel – enter data into HI-PRAISE Registry
□ Provide usual care to persons with diabetes, not limited to diabetes education, behavioral
health counseling, smoking cessation counseling if needed. Continue routine CHC
diabetes screening for high risk populations.
II. Health Coaches Value ≤ $108/p/p annually
□ 2.25 Hours per person of health coaching– goal setting, individual education, self-
management, care coordination, monitor and distribute incentives.
III. Diabetes Education
□ Group/Individual person diabetes education incentives $50 per person/year.
(TBD at the discretion of the diabetes educator e.g., pedometers, place mats, water bottles)
IV. Develop Diabetes Education Curriculum Value $28.21 per hour per person
(Non-ADA certified sites only) (not to exceed $339/p/p per year)
□ 12 Hours new education per person based on AADE diabetes education guidelines, with
cultural adaptation. Attendance required. Maximum 20 persons will be enrolled.
Supplemental Services Compensation for FQHCs
Table 6 shows the aggregate amount of supplemental service funds distributed to the FQHCs
over the course of the study totaling $1,333,549.00. This includes the payments to support the
enrollment, revisits, and education classes provided by each FQHC.
Table 6. Aggregate amount of funds to FQHCs as Supplemental Services.
Year Enrollment,
Revisits & Rural
Compensation
Group
Education
Classes
Control
Group
Supplemental
Services
2013 $187,747.00 $5,300.00 $193,047.00
2014 $575,452.00 $12,550.00 $588,002.00
2015 $402,915.00 $10,100.00 $413,015.00
16 | Page Hawaii MIPCD - HI-PRAISE Final Report - December 2016
2016
(closeout)
$23,985.00 $115,500.00 $139,485.00
Total Paid $1,190,099.00 $27,950.00 $115,500.00 $1,333,549.00
Supplemental Services Compensation for Kaiser Permanente
Table 7 indicates that Kaiser Permanente received Supplemental Service payments in the
amount of $138,625.00. This included enrollment of intervention and control group participants
and annual revisits.
Table 7. Supplemental Services funds paid to Kaiser Permanente.
Year Enrollment Revisit Supplemental Services
2014 304 N/A $69,508.00
2015 16 290 $69,117.00
Total 320 290 $138,625.00
VI. Overall Project Goals
Figure 5. Goal A and objective A.1 for HI-PRAISE project.
To help achieve the early detection goal of diabetes on Medicaid, the behavioral risk factor
surveillance system (BRFSS) annually conducted in Hawaii, was used to estimate the number of
newly detected diabetes in Hawaii. BRFSS was originally established by Centers for Disease
Control and Prevention (CDC) in the early 1980s. The survey continues to be conducted
nationally to evaluate and study personal health behavior and its relation with chronic disease,
Goal A: Improve early detection of diabetes among individuals at high risk for diabetes.
A.1. Objective: All individuals at risk of diabetes will be tested for the condition. The HI-PRAISE
Project will utilize the U.S. Preventive Services Task Force (USPSTF) recommendations to
screen for type 2 diabetes in asymptomatic adults with sustained blood pressure (either treated or
untreated) greater than 135/80 mm Hg. (Research question 1)
Activity: A standing order will be enforced at all participating sites to test individuals at high risk
for diabetes. This will be required for all sites participating in the project. CHCs will promote
diabetes screening of high risk individuals at health fairs and other community events.
Output: Reach at least 10% of these undiagnosed cases, or diagnose at least 350 new cases of
diabetes.

17 | Page Hawaii MIPCD - HI-PRAISE Final Report - December 2016
morbidity, and mortality. In 2011, there were more than 500,000 interviews included in BRFSS,
which made BRFSS the largest telephone survey in the world. Key in 2011, cellular phones were
first included in BRFSS, and a new weighting methodology named “raking” was used in the
2011 BRFSS data set, which differs from the post stratification weighting method used for
BRFSS data before 2011. The annual BRFSS survey conducted in Hawaii does not distinguish
Medicaid and non-Medicaid populations. To estimate the number of individuals with newly
diagnosed diabetes on Medicaid, we added a question - Do you have Medicaid or MedQuest? -
in 2013 and 2014 to the annual BRFSS survey asking for participant’s Medicaid status through
funding supported by the Center for Medicare and Medicaid. In the Hawaii BRFSS survey,
12.1% respondents who answered the question were on Medicaid. By taking the complex
sampling design into account, the estimated weighted number of Medicaid beneficiaries with
newly diagnosed diabetes was 608 among 8,080 total Medicaid beneficiaries with diabetes. The
percentage of newly diagnosed diabetes for Medicaid beneficiaries with diabetes was 7.5%
(608/8,080), which is much higher than the percentage of newly diagnosed diabetes for non-
Medicaid participants (2.6% = 1,233 newly diagnosed diabetes/47,589 total number of subjects
with diabetes). The overall percentage of newly diagnosed diabetes in Hawaii is 4.2%, which is
slightly lower compared to the national data of 6.5% (1.448 million/22.2 million) from Centers
for Disease Control and Prevention (CDC).
Figure 6. Goal B and objective B.1 for HI-PRAISE project.
A tiered incentive schedule was developed based on the ADA recommended guidelines (see
page 9). Incentives were provided for both process and outcome measures. Table 3 and Table 4
(see pages 10 and 12) provide a summary of the incentives distributed for each biometric
measure at the FQHCs and Kaiser Permanente, respectively.
Goal B: Individuals with diabetes will improve their self-management of the condition.
B.1 Objective: Individuals with diabetes will comply with the ADA recommended schedule of
annual diabetes management guidelines. (Research questions 2 and 3)
Activity: The HI-PRAISE Project will create a system of tiered incentives that address the ADA
recommended schedule of treatment activities. These will act as extrinsic motivators to change.
See Incentive Schedule page 8.
Output: All individuals with diabetes at 14 CHCs and at least 4 of the larger private provider
clinics will participate in HI-PRAISE, and will collectively enroll approximately 2,500
individuals over the course of the project. Per approval from CMS, this target number was
modified to 1,000 from FQHCs and 400 (200/200) from Kaiser Permanente. Total enrolled at
FQHCs was 2,003 and at Kaiser Permanente 320.
18 | Page Hawaii MIPCD - HI-PRAISE Final Report - December 2016
Only nine of fourteen FQHCs joined the HI-PRAISE project including three of the four
largest community health centers. Enrollment numbers were negotiated downward due to delays
relating to development of contracts, number of participants each FQHC was willing to commit
to enroll, and due to initial low enrollment numbers by close of 2013. The same issues were
relevant for Kaiser Permanente. Eventually five FQHCs exceeded their target enrollment
numbers with a total 2,003 enrolled by December 31, 2014. Kaiser did not reach the targeted
goal ending with a total of 320/360. Overall, 2,323 were enrolled in the project. Additionally,
640 patients who met the HI-PRAISE project eligibility but did not enroll in the HI-PRAISE
were identified by four of the nine participating FQHCs and used as a comparison for the
intervention group.
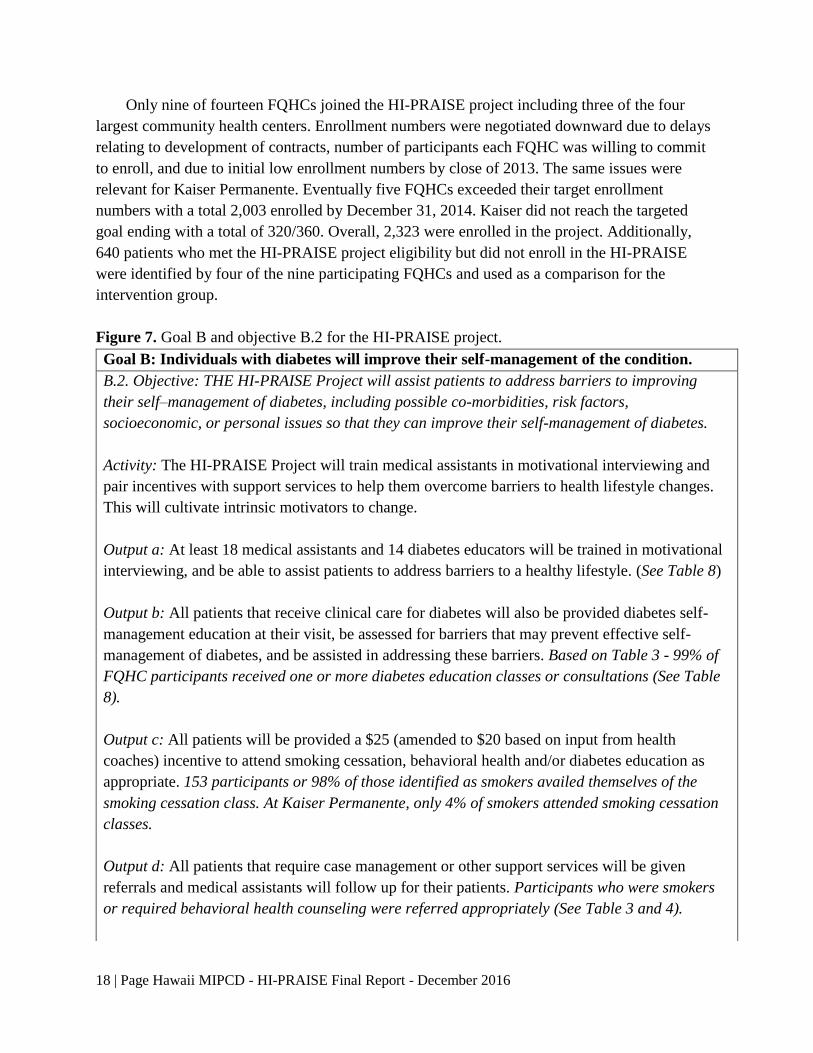
Figure 7. Goal B and objective B.2 for the HI-PRAISE project.
Goal B: Individuals with diabetes will improve their self-management of the condition.
B.2. Objective: THE HI-PRAISE Project will assist patients to address barriers to improving
their self–management of diabetes, including possible co-morbidities, risk factors,
socioeconomic, or personal issues so that they can improve their self-management of diabetes.
Activity: The HI-PRAISE Project will train medical assistants in motivational interviewing and
pair incentives with support services to help them overcome barriers to health lifestyle changes.
This will cultivate intrinsic motivators to change.
Output a: At least 18 medical assistants and 14 diabetes educators will be trained in motivational
interviewing, and be able to assist patients to address barriers to a healthy lifestyle. (See Table 8)
Output b: All patients that receive clinical care for diabetes will also be provided diabetes self-
management education at their visit, be assessed for barriers that may prevent effective self-
management of diabetes, and be assisted in addressing these barriers. Based on Table 3 - 99% of
FQHC participants received one or more diabetes education classes or consultations (See Table
8).
Output c: All patients will be provided a $25 (amended to $20 based on input from health
coaches) incentive to attend smoking cessation, behavioral health and/or diabetes education as
appropriate. 153 participants or 98% of those identified as smokers availed themselves of the
smoking cessation class. At Kaiser Permanente, only 4% of smokers attended smoking cessation
classes.
Output d: All patients that require case management or other support services will be given
referrals and medical assistants will follow up for their patients. Participants who were smokers
or required behavioral health counseling were referred appropriately (See Table 3 and 4).
19 | Page Hawaii MIPCD - HI-PRAISE Final Report - December 2016
HI-PRAISE team members conducted formal and informal trainings with each FQHC. Some
formal presentations to the FQHCs included: Getting Started, How to Use the HI-PRASIE
registry, Motivational Interviewing Skills, Goal Setting, Data Collection and Reporting, and
Building your Diabetes Education Program. In addition to these, the project coordinators
communicated via email, phone and met minimally monthly with the site coordinators to
problem solve issues, assist with inputting data and provide mini trainings when needed. More
than 450 people attended training sessions; these may reflect a duplication of the same person at
multiple trainings. Those trained included physicians, RNs, diabetes educators, a pharmacist,
medical assistants, and community workers.
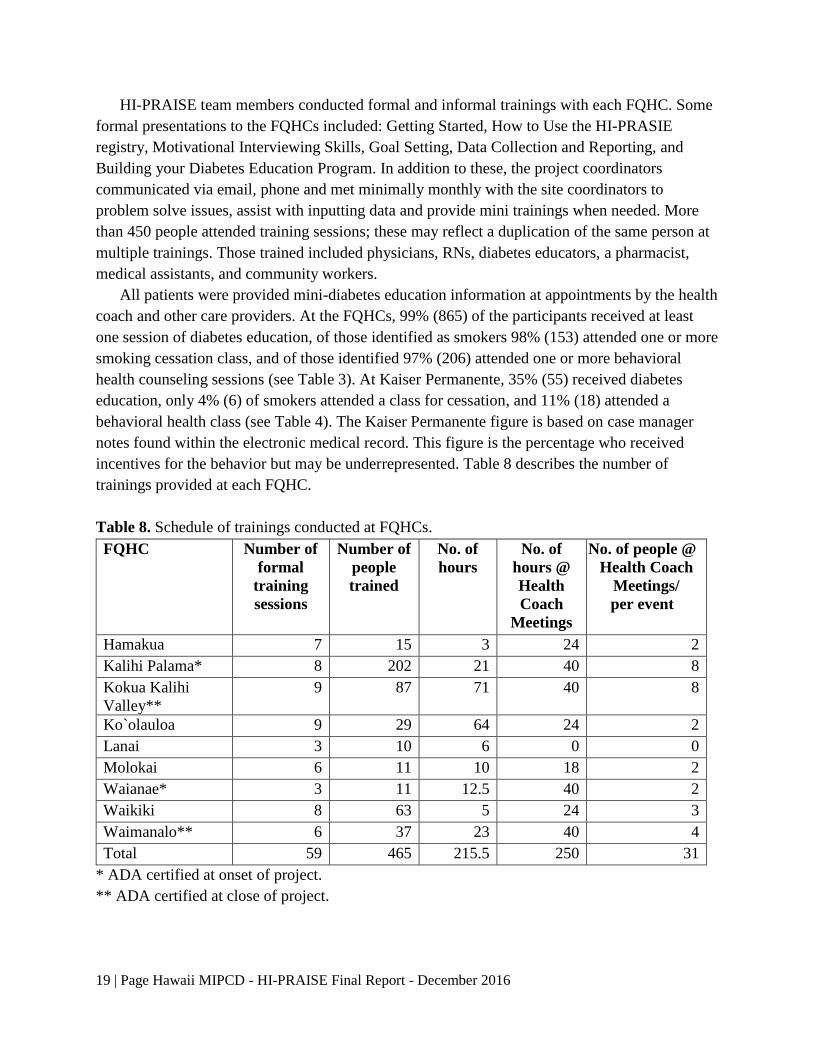
All patients were provided mini-diabetes education information at appointments by the health
coach and other care providers. At the FQHCs, 99% (865) of the participants received at least
one session of diabetes education, of those identified as smokers 98% (153) attended one or more
smoking cessation class, and of those identified 97% (206) attended one or more behavioral
health counseling sessions (see Table 3). At Kaiser Permanente, 35% (55) received diabetes
education, only 4% (6) of smokers attended a class for cessation, and 11% (18) attended a
behavioral health class (see Table 4). The Kaiser Permanente figure is based on case manager
notes found within the electronic medical record. This figure is the percentage who received
incentives for the behavior but may be underrepresented. Table 8 describes the number of
trainings provided at each FQHC.
Table 8. Schedule of trainings conducted at FQHCs.
FQHC Number of
formal
training
sessions
Number of
people
trained
No. of
hours
No. of
hours @
Health
Coach
Meetings
No. of people @
Health Coach
Meetings/
per event
Hamakua 7 15 3 24 2
Kalihi Palama* 8 202 21 40 8
Kokua Kalihi
Valley**
9 87 71 40 8
Ko`olauloa 9 29 64 24 2
Lanai 3 10 6 0 0
Molokai 6 11 10 18 2
Waianae* 3 11 12.5 40 2
Waikiki 8 63 5 24 3
Waimanalo** 6 37 23 40 4
Total 59 465 215.5 250 31
* ADA certified at onset of project.
** ADA certified at close of project.
20 | Page Hawaii MIPCD - HI-PRAISE Final Report - December 2016
Health Coach Meetings
Health coach meetings were conducted semi-annually. Since the enrollment of FQHCs was
staggered, some were unable to attend all sessions. A total of 40 hours of training was provided
to the project coordinators, nurses, diabetes educators, pharmacist, medical assistants, and
community workers. An average of 25 individuals attended all sessions. The dates and places
follow:
Aug. 21, 2013: Semi-annual Health Coach Meeting held at Japanese Cultural Center. 8 hours
in duration.
Nov. 20, 2013: Semi-annual Health Coach Meeting held at Japanese Cultural Center. 8 hours
in duration.
May 6, 2014: Semi-annual Health Coach Meeting held at HNL International Airport
Conference Center. 6 hours in duration.
Oct. 21, 2014: Semi-annual health coach meeting held at HNL International Airport
Conference Center. 6 hours in duration.
June 24, 2015: Semi-annual health coach meeting held at HNL International Airport
Conference Center. 4 hours in duration.
October 23, 2015: Semi-annual health coach meeting held at HNL International Airport
Conference Center. 4 hours in duration.
Finally, multiple other HI-PRAISE related presentations and posters were provided locally,
at national and international conferences, via national webinars, and at the MIPCD national
learning collaborative.
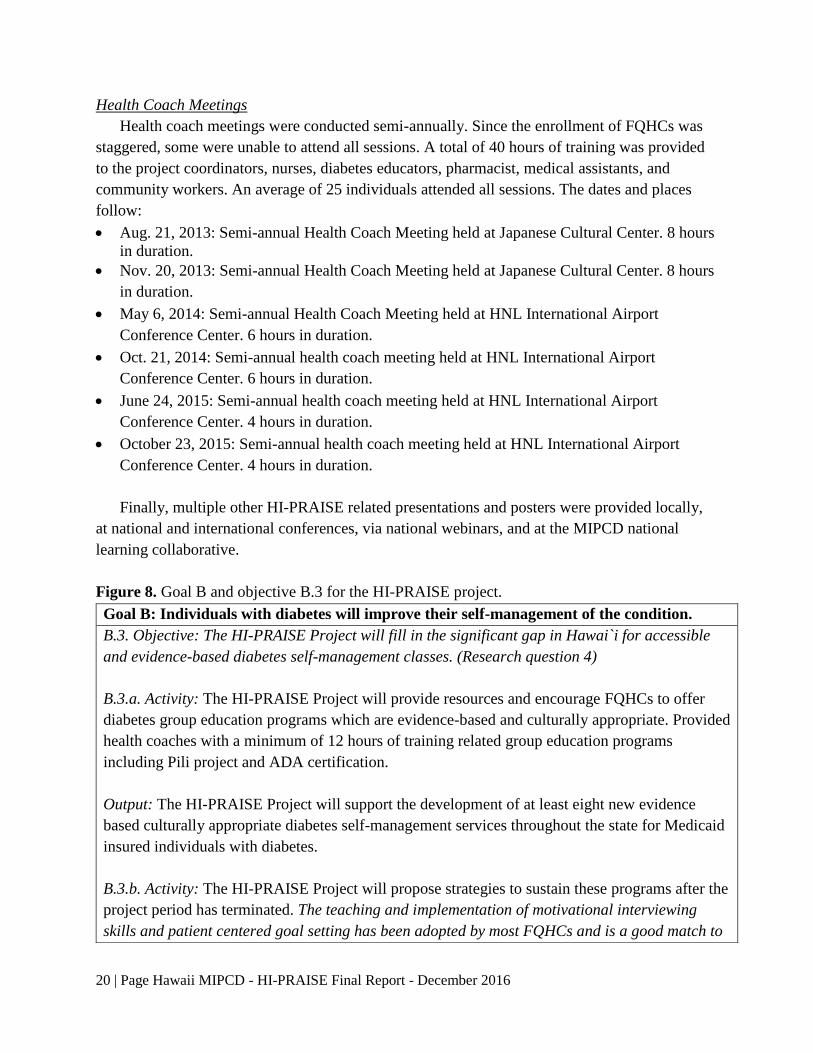
Figure 8. Goal B and objective B.3 for the HI-PRAISE project.
Goal B: Individuals with diabetes will improve their self-management of the condition.
B.3. Objective: The HI-PRAISE Project will fill in the significant gap in Hawai`i for accessible
and evidence-based diabetes self-management classes. (Research question 4)
B.3.a. Activity: The HI-PRAISE Project will provide resources and encourage FQHCs to offer
diabetes group education programs which are evidence-based and culturally appropriate. Provided
health coaches with a minimum of 12 hours of training related group education programs
including Pili project and ADA certification.
Output: The HI-PRAISE Project will support the development of at least eight new evidence
based culturally appropriate diabetes self-management services throughout the state for Medicaid
insured individuals with diabetes.
B.3.b. Activity: The HI-PRAISE Project will propose strategies to sustain these programs after the
project period has terminated. The teaching and implementation of motivational interviewing
skills and patient centered goal setting has been adopted by most FQHCs and is a good match to
21 | Page Hawaii MIPCD - HI-PRAISE Final Report - December 2016
Training towards goal of achieving ADA certification: One specific objective was to increase
the number of FQHCs that provide diabetes education classes that are ADA certified. At the
onset of the project, 2 FQHCs that enrolled in the project were certified. At the close two
additional FQHC diabetes education programs became certified totaling 4/9 FQHCs in the study
as certified. Trainings included:
Oct 21, 2014: Two-hour presentation by Dr. Jane Kadohiro, DrPH, APRN, CDE, FAADE
(Diabetes Education and Support Consulting Services) on ADA Certification 101. The 10
National Standards for diabetes self-management education were discussed.
Coordinated the enrollment and attendance of 17 health coaches to “Building Your Diabetes
Education Program: Everything You Need to Know and More” workshop on June 19, 2015.
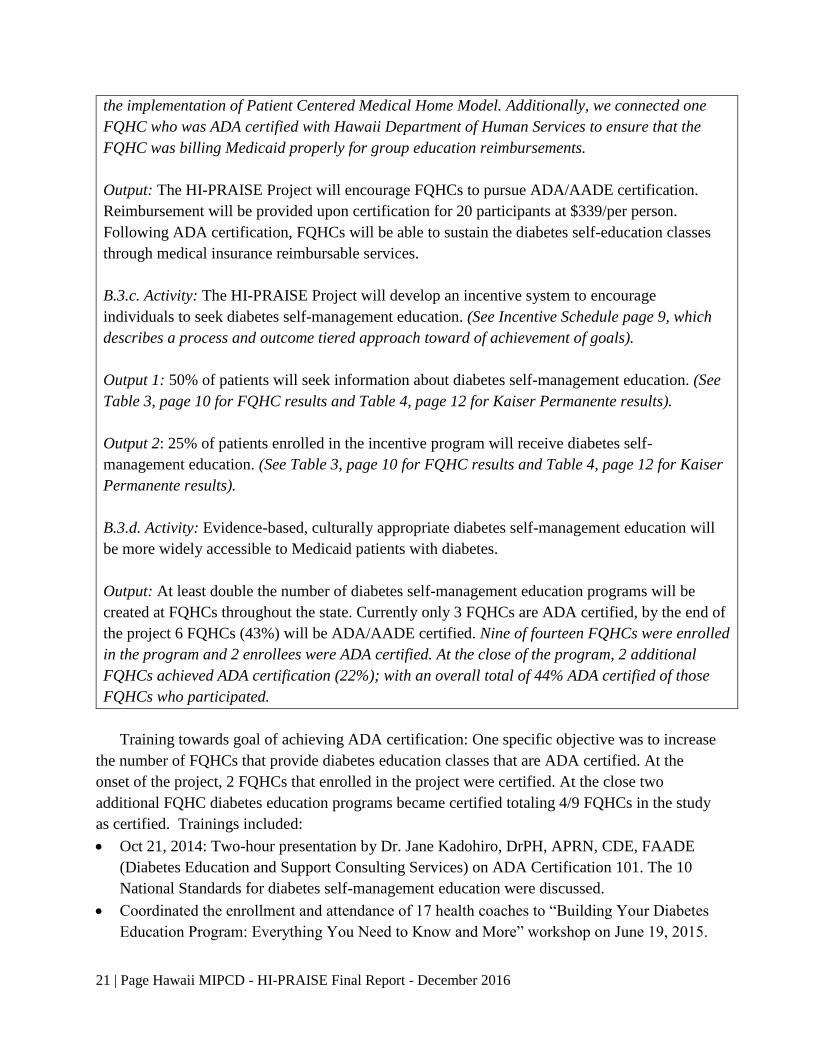
the implementation of Patient Centered Medical Home Model. Additionally, we connected one
FQHC who was ADA certified with Hawaii Department of Human Services to ensure that the
FQHC was billing Medicaid properly for group education reimbursements.
Output: The HI-PRAISE Project will encourage FQHCs to pursue ADA/AADE certification.
Reimbursement will be provided upon certification for 20 participants at $339/per person.
Following ADA certification, FQHCs will be able to sustain the diabetes self-education classes
through medical insurance reimbursable services.
B.3.c. Activity: The HI-PRAISE Project will develop an incentive system to encourage
individuals to seek diabetes self-management education. (See Incentive Schedule page 9, which
describes a process and outcome tiered approach toward of achievement of goals).
Output 1: 50% of patients will seek information about diabetes self-management education. (See
Table 3, page 10 for FQHC results and Table 4, page 12 for Kaiser Permanente results).
Output 2: 25% of patients enrolled in the incentive program will receive diabetes self-
management education. (See Table 3, page 10 for FQHC results and Table 4, page 12 for Kaiser
Permanente results).
B.3.d. Activity: Evidence-based, culturally appropriate diabetes self-management education will
be more widely accessible to Medicaid patients with diabetes.
Output: At least double the number of diabetes self-management education programs will be
created at FQHCs throughout the state. Currently only 3 FQHCs are ADA certified, by the end of
the project 6 FQHCs (43%) will be ADA/AADE certified. Nine of fourteen FQHCs were enrolled
in the program and 2 enrollees were ADA certified. At the close of the program, 2 additional
FQHCs achieved ADA certification (22%); with an overall total of 44% ADA certified of those
FQHCs who participated.
22 | Page Hawaii MIPCD - HI-PRAISE Final Report - December 2016
This workshop was organized by the Hawaii Department of Health and the Hawaii ADE
chapter.
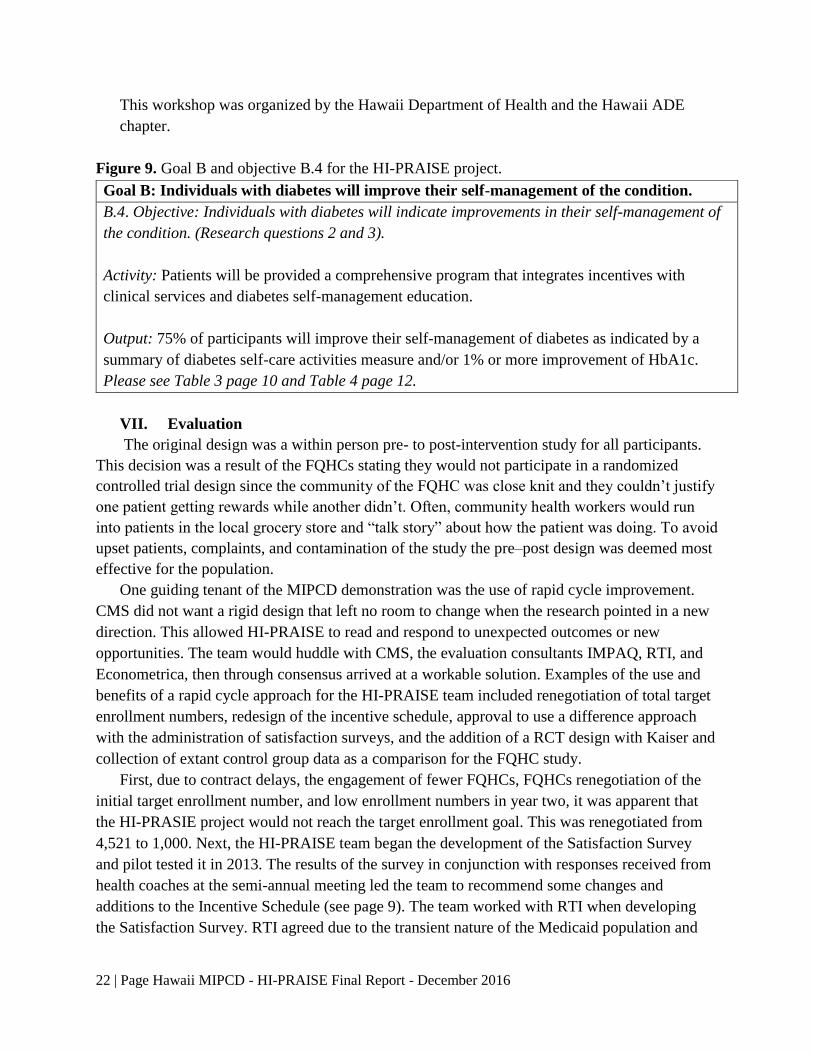
Figure 9. Goal B and objective B.4 for the HI-PRAISE project.
VII. Evaluation
The original design was a within person pre- to post-intervention study for all participants.
This decision was a result of the FQHCs stating they would not participate in a randomized
controlled trial design since the community of the FQHC was close knit and they couldn’t justify
one patient getting rewards while another didn’t. Often, community health workers would run
into patients in the local grocery store and “talk story” about how the patient was doing. To avoid
upset patients, complaints, and contamination of the study the pre–post design was deemed most
effective for the population.
One guiding tenant of the MIPCD demonstration was the use of rapid cycle improvement.
CMS did not want a rigid design that left no room to change when the research pointed in a new
direction. This allowed HI-PRAISE to read and respond to unexpected outcomes or new
opportunities. The team would huddle with CMS, the evaluation consultants IMPAQ, RTI, and
Econometrica, then through consensus arrived at a workable solution. Examples of the use and
benefits of a rapid cycle approach for the HI-PRAISE team included renegotiation of total target
enrollment numbers, redesign of the incentive schedule, approval to use a difference approach
with the administration of satisfaction surveys, and the addition of a RCT design with Kaiser and
collection of extant control group data as a comparison for the FQHC study.
First, due to contract delays, the engagement of fewer FQHCs, FQHCs renegotiation of the
initial target enrollment number, and low enrollment numbers in year two, it was apparent that
the HI-PRASIE project would not reach the target enrollment goal. This was renegotiated from
4,521 to 1,000. Next, the HI-PRAISE team began the development of the Satisfaction Survey
and pilot tested it in 2013. The results of the survey in conjunction with responses received from
health coaches at the semi-annual meeting led the team to recommend some changes and
additions to the Incentive Schedule (see page 9). The team worked with RTI when developing
the Satisfaction Survey. RTI agreed due to the transient nature of the Medicaid population and
Goal B: Individuals with diabetes will improve their self-management of the condition.
B.4. Objective: Individuals with diabetes will indicate improvements in their self-management of
the condition. (Research questions 2 and 3).
Activity: Patients will be provided a comprehensive program that integrates incentives with
clinical services and diabetes self-management education.
Output: 75% of participants will improve their self-management of diabetes as indicated by a
summary of diabetes self-care activities measure and/or 1% or more improvement of HbA1c.
Please see Table 3 page 10 and Table 4 page 12.

23 | Page Hawaii MIPCD - HI-PRAISE Final Report - December 2016
the need to translate the satisfaction survey into multiple languages that the HI-PRASIE team
could distribute surveys to the FQHCs where the surveys were administered to participants who
had an appointment within a two-week time-period in October /November of each year. If the
participant needed translation of the questions, staff were available to assist with the request.
More than 50% of the respondents needed reasonable accommodations. The last example of
rapid cycle improvement impacted the overall study design. To strengthen the research design,
two external control groups were added to the FQHC pre-post study with one control group used
as a comparison on biometric outcomes and the other on healthcare cost. These control groups
strengthened the FQHC study and enabled the team to conduct the cost-effective analysis (see
independent report in appendices). Furthermore, one RCT study was added and conducted in
collaboration with the Center for Health Research Hawaii Kaiser Permanente.
In addition to outcome evaluation, the HI-PRAISE team conducted focus groups with FQHC
project staff, participants, and collected qualitative data on project implementation through
frequent and regular site visits. Information was debriefed at weekly HI-PRAISE team meetings.
Trainings were scheduled accordingly. In response to the need of timely distribution of
incentives and minimizing missing data, HI-PRAISE team initiated monthly data validation
cycle with the FQHCs and provided data tracking documents to assist with data collection and
incentive distribution. One extremely useful document was a monthly updated list of participants
who have earned but have yet to receive incentives at each FQHC. The process of ongoing rapid
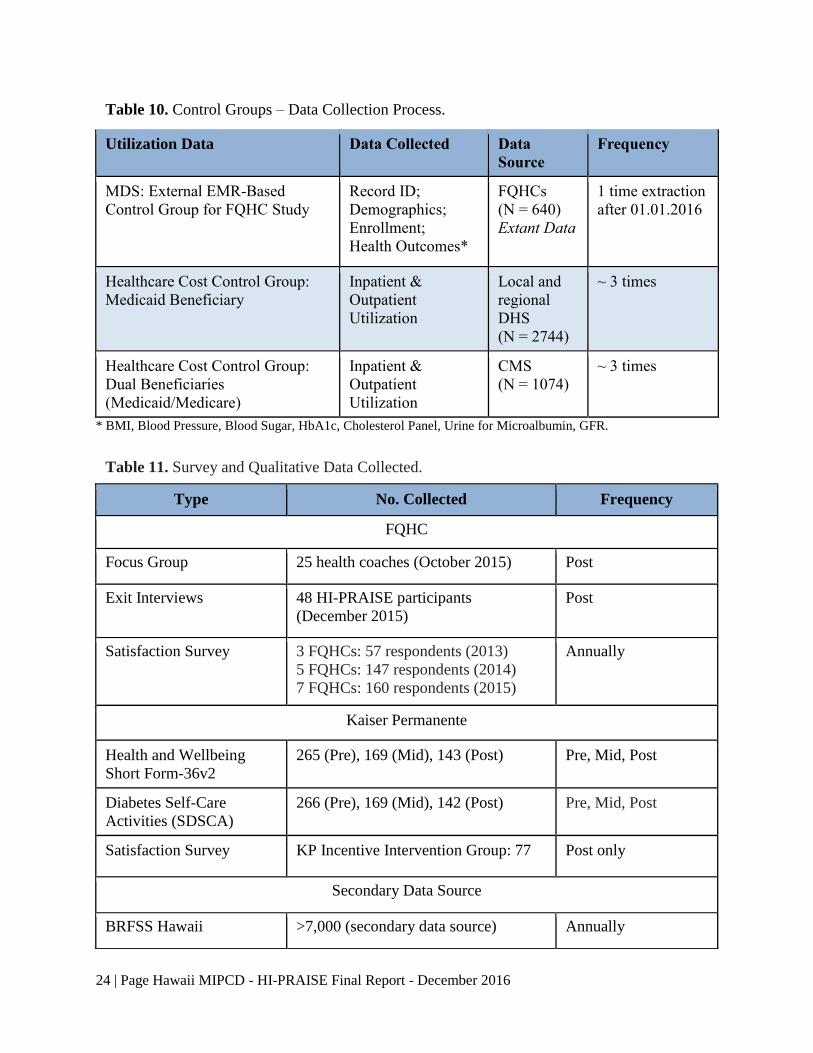
cycle improvements was instrumental to the success of the project. The following Tables 9 - 11
describe the data collection process.
Table 9. FQHC and Kaiser – Data Collection Process.
Outcome Data Data Collected Data Source Frequency
Minimum Data Set
(MDS)
Record ID;
Demographics;
Enrollment;
Service Utilization;
Incentives;
Health Outcomes*
FQHCs
(N=2003)
_________
KP (N=320)
Monthly Data
Extraction
__________
Quarterly Data
Extraction
Healthcare Cost Data:
Medicaid Beneficiaries
Enrolled in HI-PRAISE
Inpatient& Outpatient
Utilization
DHS
(N=2323)
~ 3 times
Healthcare Cost Data:
Dual Beneficiaries
(Medicaid/Medicare)
Enrolled in HI-PRAISE
Inpatient & Outpatient
Utilization
CMS (N=484) ~ 3 times
* BMI, Blood Pressure, Blood Sugar, HbA1c, Cholesterol Panel, Urine for Microalbumin, GFR, DM Retinopathy,
Smoking Cessation, Vaccination.
24 | Page Hawaii MIPCD - HI-PRAISE Final Report - December 2016
Table 10. Control Groups – Data Collection Process.
Utilization Data Data Collected Data
Source
Frequency
MDS: External EMR-Based
Control Group for FQHC Study
Record ID;
Demographics;
Enrollment;
Health Outcomes*
FQHCs
(N = 640)
Extant Data
1 time extraction
after 01.01.2016
Healthcare Cost Control Group:
Medicaid Beneficiary
Inpatient &
Outpatient
Utilization
Local and
regional
DHS
(N = 2744)
~ 3 times
Healthcare Cost Control Group:
Dual Beneficiaries
(Medicaid/Medicare)
Inpatient &
Outpatient
Utilization
CMS
(N = 1074)
~ 3 times
* BMI, Blood Pressure, Blood Sugar, HbA1c, Cholesterol Panel, Urine for Microalbumin, GFR.
Table 11. Survey and Qualitative Data Collected.
Type No. Collected Frequency
FQHC
Focus Group 25 health coaches (October 2015) Post
Exit Interviews 48 HI-PRAISE participants
(December 2015)
Post
Satisfaction Survey 3 FQHCs: 57 respondents (2013)
5 FQHCs: 147 respondents (2014)
7 FQHCs: 160 respondents (2015)
Annually
Kaiser Permanente
Health and Wellbeing
Short Form-36v2
265 (Pre), 169 (Mid), 143 (Post) Pre, Mid, Post
Diabetes Self-Care
Activities (SDSCA)
266 (Pre), 169 (Mid), 142 (Post) Pre, Mid, Post
Satisfaction Survey KP Incentive Intervention Group: 77 Post only
Secondary Data Source
BRFSS Hawaii >7,000 (secondary data source) Annually
25 | Page Hawaii MIPCD - HI-PRAISE Final Report - December 2016
FQHC Pre- and Post- Design
The HI-PRAISE project used a within person, pre- versus post-intervention study design
comparing health outcome changes over the study period with adjustment of baseline
characteristics such as age, race, and gender. The study recruited 2,003 adult Medicaid
beneficiaries diagnosed with diabetes from nine FQHCs with rolling enrollment from February
2013 to December 2014 and intervention from February 2013 to December 2015. Additionally,
we strengthened the study by utilizing a quasi-experimental design using an extant control group
to compare changes over time between the intervention and control groups. The extant control
group composed of 640 patients who met the HI-PRAISE project eligibility criteria but did not
enroll in the HI-PRAISE from four of the nine participating FQHCs. Available EMR data dated
from 2011 to 2015 was provided to the HI-PRAISE project within two months after the program
implementation completed on December 31, 2015.
FQHC Study Results
The results are presented in the following order: 1. Demographic characteristics, 2. Biometric
health outcomes overall and subgroup analysis, 3. Satisfaction survey results, and 4. Exit
interview results.
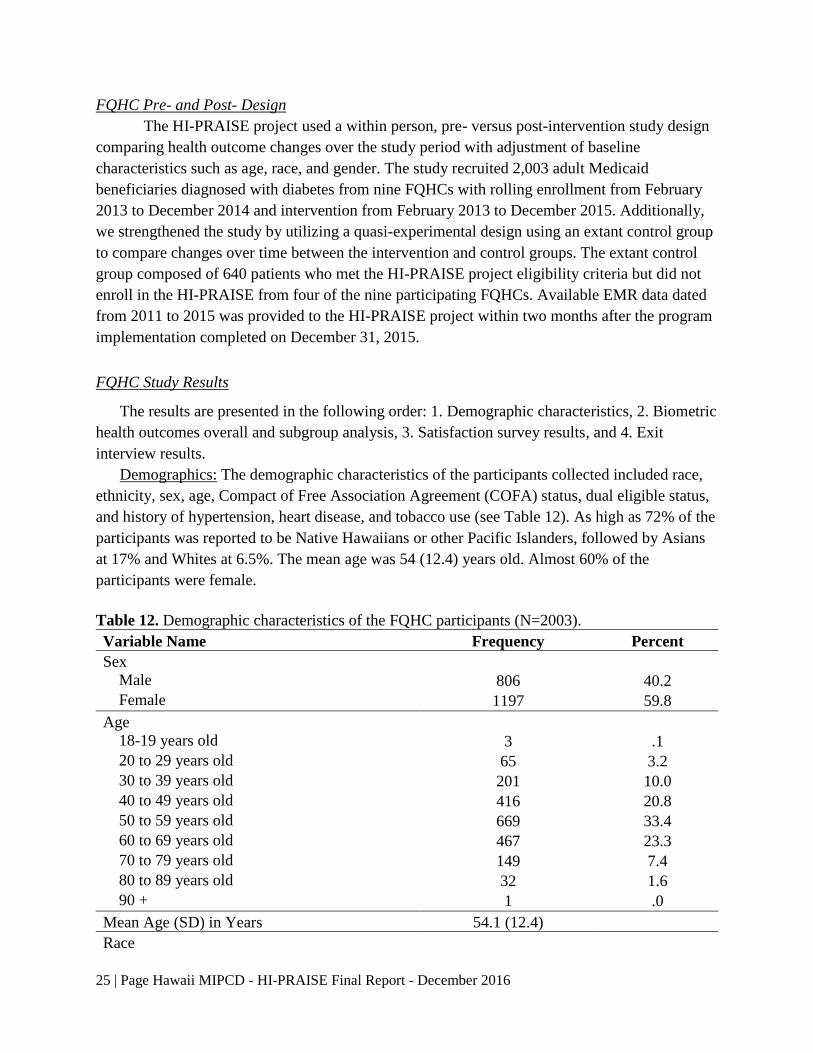
Demographics: The demographic characteristics of the participants collected included race,
ethnicity, sex, age, Compact of Free Association Agreement (COFA) status, dual eligible status,
and history of hypertension, heart disease, and tobacco use (see Table 12). As high as 72% of the
participants was reported to be Native Hawaiians or other Pacific Islanders, followed by Asians
at 17% and Whites at 6.5%. The mean age was 54 (12.4) years old. Almost 60% of the
participants were female.
Table 12. Demographic characteristics of the FQHC participants (N=2003).
Variable Name Frequency Percent
Sex Male 806 40.2
Female 1197 59.8
Age 18-19 years old 3 .1
20 to 29 years old 65 3.2
30 to 39 years old 201 10.0
40 to 49 years old 416 20.8
50 to 59 years old 669 33.4
60 to 69 years old 467 23.3
70 to 79 years old 149 7.4
80 to 89 years old 32 1.6
90 + 1 .0
Mean Age (SD) in Years 54.1 (12.4) Race

26 | Page Hawaii MIPCD - HI-PRAISE Final Report - December 2016
White 130 6.5
Black 9 .4
American Indian/Alaska Native 6 .3
Asian 335 16.7
Native Hawaiian or OPI 1435 71.6
Two or more races 84 4.2
Missing/unknown 4 .2
Asian Race Subcategory Chinese/Taiwanese 19 5.7
Filipino 196 58.5
Japanese/Okinawan 30 9.0
Korean 18 5.4
Other Asian 49 14.6
Missing/unknown 23 6.9
Total 335 100.1
Native Hawaiian and Other Pacific Islander Subcategory
Native Hawaiian/Part Native Hawaiian 380 26.5
Marshallese 224 15.6
Chuukese 461 32.1
Samoan 173 12.1
Micronesian 39 2.7
Other Pacific Islander 82 5.7
Missing/unknown 76 5.3
Total 1435 100.0
Ethnicity
Yes 67 3.3
No 1897 94.7
Missing 39 1.9
COFA Non-COFA 1251 62.5
COFA 752 37.5
Dual Eligible (Medicaid and Medicare) Yes 454 22.6
No 1549 77.4
History of Hypertension Yes 1290 64.4
No 712 35.5
Missing 1 .0
History of Heart Disease Yes 314 15.7
No 1687 84.2
Missing 2 .1

27 | Page Hawaii MIPCD - HI-PRAISE Final Report - December 2016
History of Smoking or Tobacco Dependence Yes 851 42.5
No or Ex-smoker 1149 57.4
Missing 3 .1
FQHC KPHC 714 35.6
KKV 440 22.0
Koolauloa Health Center 71 3.5
Waianae Coast Comprehensive Health Center 231 11.5
Waikiki Health Center 159 7.9
Waimanalo Health Center 200 10.0
Molokai Health Center 38 1.9
Lanai Community Health Center 7 .3
Hamakua Health Center 143 7.1
Biometric Outcomes: Generalized estimating equation (GEE) modeling techniques were
used to examine the pre- and post-intervention changes due to intervention in biometric
indicators for FQHC Medicaid beneficiaries with diabetes (n = 2003), after adjusting for age,
race, and gender. Table 13 showed the biometric changes important for diabetes management,
some of which include: HbA1c, SBP, DBP, Total Cholesterol, and LDL Cholesterol in the
intervention group. The HbA1c decreased -0.32% (95% CI: [-0.41%, -0.25%]) from baseline to
the end of the study in the intervention group. Both systolic blood pressure (difference = -0.98
mmHg, 95% CI: [-1.76, -0.20]) and diastolic blood pressure (difference = -0.76 mmHg, 95% CI:
[-1.20, -0.33]) decreased and were statistically significantly from baseline to the end of the study.
Similarly, total cholesterol (difference = -6.56 mg/dL, 95% CI: [-8.80, -4.32]) and LDL
cholesterol (difference = -7.62 mg/dL, 95% CI: [-9.34, -5.89]) also decreased and were
statistically significantly from baseline to the end of the study. There were no significant changes
in the other biometric measurements including body weight, BMI, triglycerides, and HDL.
Table 13. Aggregate changes in FQHC clinical measures for the observational study.
Variables
Baseline End of
Study Change 95% CI P-value
Weight (lb) 208.33 208.09 -0.24 -0.86 0.38 0.3782
BMI 33.98 33.95 -0.03 -0.14 0.08 0.5785
HbA1c (%) 8.56 8.24 -0.32 -0.41 -0.25 <.0001
SBP (mmHg) 125.16 124.18 -0.98 -1.76 -0.20 0.0137
28 | Page Hawaii MIPCD - HI-PRAISE Final Report - December 2016
DBP (mmHg) 75.54 74.78 -0.76 -1.20 -0.33 0.0005
Total
Cholesterol (mg/dL) 180.77 174.21 -6.56 -8.80 -4.32 <.0001
Triglycerides (mg/dL) 179.73 176.31 -3.42 -12.47 5.63 0.4586
LDL (mg/dL) 106.17 98.55 -7.62 -9.34 -5.89 <.0001
HDL (mg/dL) 43.50 43.59 0.09 -0.52 0.71 0.7650
Note: Adjusted for age, gender, and race.
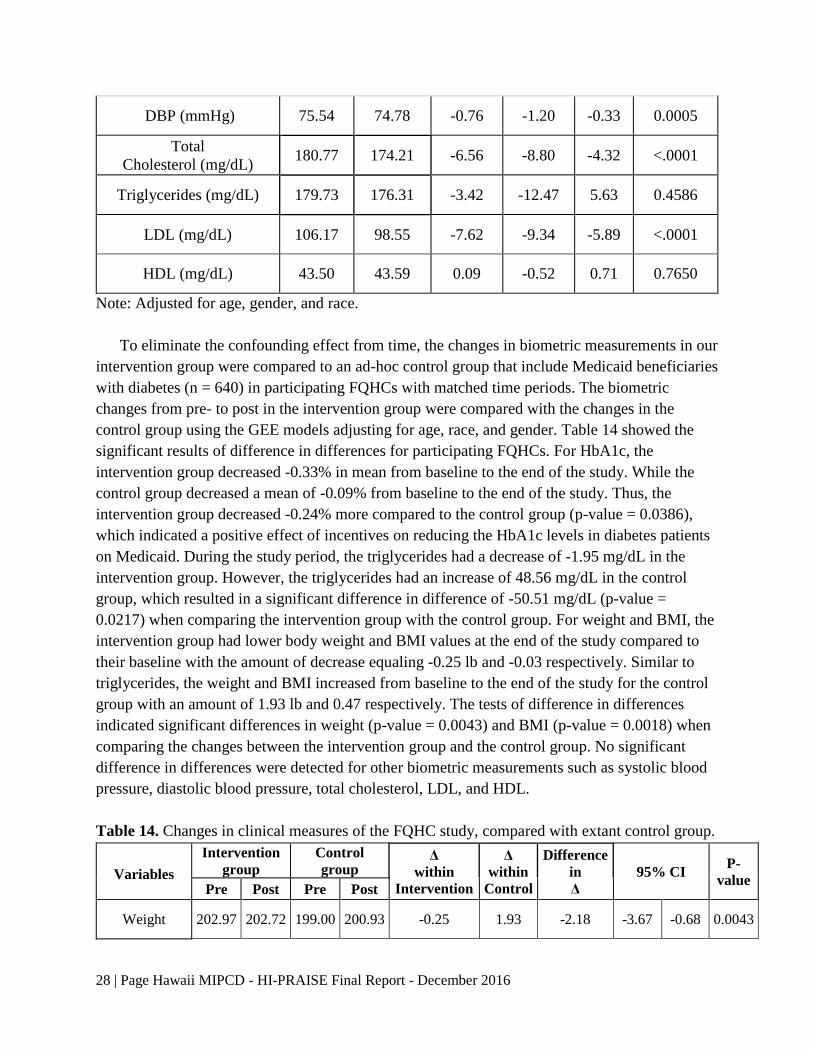
To eliminate the confounding effect from time, the changes in biometric measurements in our
intervention group were compared to an ad-hoc control group that include Medicaid beneficiaries
with diabetes (n = 640) in participating FQHCs with matched time periods. The biometric
changes from pre- to post in the intervention group were compared with the changes in the
control group using the GEE models adjusting for age, race, and gender. Table 14 showed the
significant results of difference in differences for participating FQHCs. For HbA1c, the
intervention group decreased -0.33% in mean from baseline to the end of the study. While the
control group decreased a mean of -0.09% from baseline to the end of the study. Thus, the
intervention group decreased -0.24% more compared to the control group (p-value = 0.0386),
which indicated a positive effect of incentives on reducing the HbA1c levels in diabetes patients
on Medicaid. During the study period, the triglycerides had a decrease of -1.95 mg/dL in the
intervention group. However, the triglycerides had an increase of 48.56 mg/dL in the control
group, which resulted in a significant difference in difference of -50.51 mg/dL (p-value =
0.0217) when comparing the intervention group with the control group. For weight and BMI, the
intervention group had lower body weight and BMI values at the end of the study compared to
their baseline with the amount of decrease equaling -0.25 lb and -0.03 respectively. Similar to
triglycerides, the weight and BMI increased from baseline to the end of the study for the control
group with an amount of 1.93 lb and 0.47 respectively. The tests of difference in differences
indicated significant differences in weight (p-value = 0.0043) and BMI (p-value = 0.0018) when
comparing the changes between the intervention group and the control group. No significant
difference in differences were detected for other biometric measurements such as systolic blood
pressure, diastolic blood pressure, total cholesterol, LDL, and HDL.
Table 14. Changes in clinical measures of the FQHC study, compared with extant control group.
Variables
Intervention
group
Control
group Δ
within
Intervention
Δ
within
Control
Difference
in
Δ
95% CI P-
value Pre Post Pre Post
Weight 202.97 202.72 199.00 200.93 -0.25 1.93 -2.18 -3.67 -0.68 0.0043
29 | Page Hawaii MIPCD - HI-PRAISE Final Report - December 2016
BMI 33.52 33.49 32.25 32.71 -0.03 0.47 -0.50 -0.81 -0.19 0.0018
SBP 125.77 124.82 126.99 125.23 -0.95 -1.76 0.81 -1.70 3.32 0.5281
DBP 75.29 74.54 75.73 73.56 -0.75 -2.17 1.42 -0.24 3.08 0.0932
HbA1c 8.70 8.37 8.12 8.03 -0.33 -0.09 -0.24 -0.47 -0.01 0.0386
Total
Cholesterol 179.71 173.10 180.87 179.93 -6.61 -0.94 -5.66 -13.14 1.82 0.138
Triglycerides 179.81 177.86 160.64 209.20 -1.95 48.56 -50.51 -93.62 -7.39 0.0217
LDL 102.99 95.41 108.12 99.60 -7.58 -8.52 0.95 -6.36 8.25 0.7994
HDL 44.95 45.08 46.46 46.05 0.13 -0.41 0.54 -0.83 1.92 0.4392
Note: Adjusted for age, gender, and race.
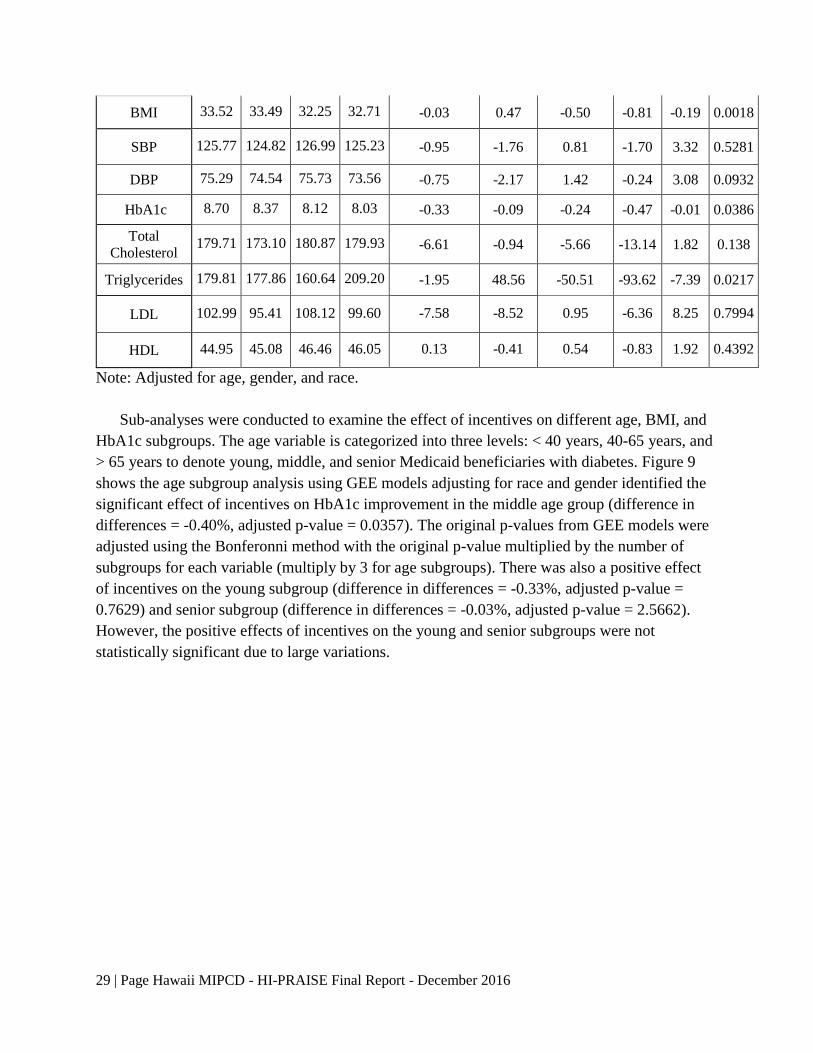
Sub-analyses were conducted to examine the effect of incentives on different age, BMI, and
HbA1c subgroups. The age variable is categorized into three levels: < 40 years, 40-65 years, and
> 65 years to denote young, middle, and senior Medicaid beneficiaries with diabetes. Figure 9
shows the age subgroup analysis using GEE models adjusting for race and gender identified the
significant effect of incentives on HbA1c improvement in the middle age group (difference in
differences = -0.40%, adjusted p-value = 0.0357). The original p-values from GEE models were
adjusted using the Bonferonni method with the original p-value multiplied by the number of
subgroups for each variable (multiply by 3 for age subgroups). There was also a positive effect
of incentives on the young subgroup (difference in differences = -0.33%, adjusted p-value =
0.7629) and senior subgroup (difference in differences = -0.03%, adjusted p-value = 2.5662).
However, the positive effects of incentives on the young and senior subgroups were not
statistically significant due to large variations.
30 | Page Hawaii MIPCD - HI-PRAISE Final Report - December 2016
Figure 9. HbA1c change by age subgroups.
^ = adjusted p.
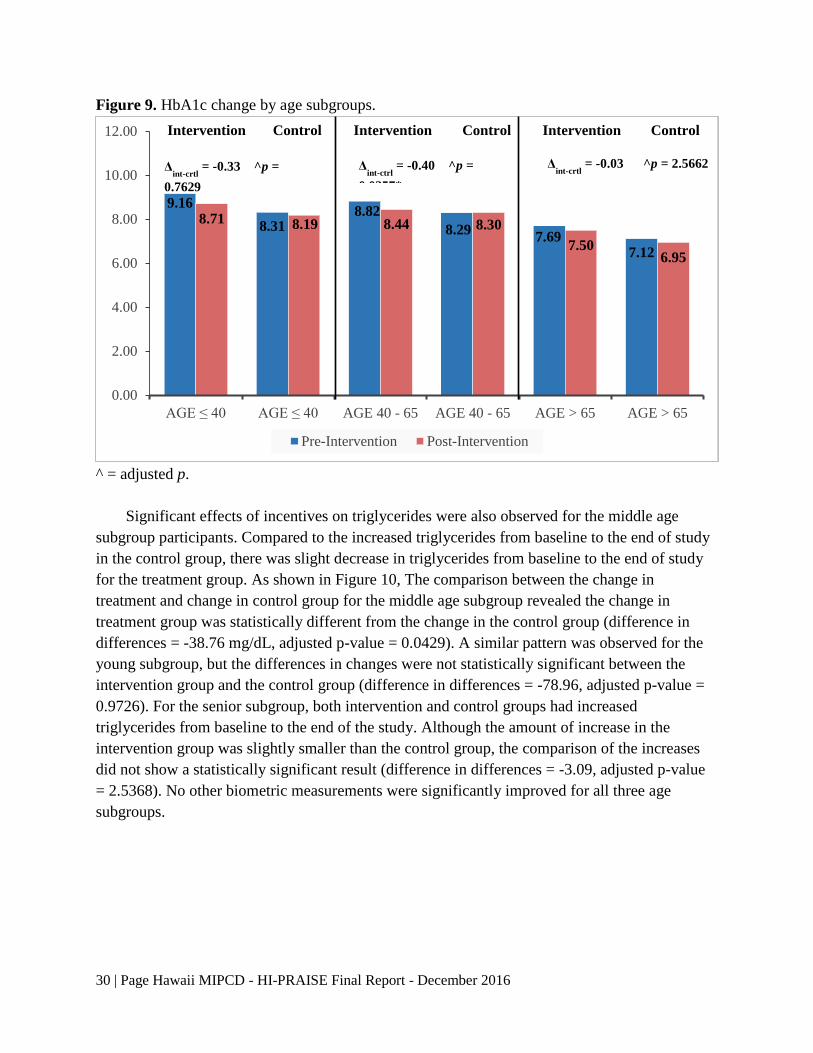
Significant effects of incentives on triglycerides were also observed for the middle age
subgroup participants. Compared to the increased triglycerides from baseline to the end of study
in the control group, there was slight decrease in triglycerides from baseline to the end of study
for the treatment group. As shown in Figure 10, The comparison between the change in
treatment and change in control group for the middle age subgroup revealed the change in
treatment group was statistically different from the change in the control group (difference in
differences = -38.76 mg/dL, adjusted p-value = 0.0429). A similar pattern was observed for the
young subgroup, but the differences in changes were not statistically significant between the
intervention group and the control group (difference in differences = -78.96, adjusted p-value =
0.9726). For the senior subgroup, both intervention and control groups had increased
triglycerides from baseline to the end of the study. Although the amount of increase in the
intervention group was slightly smaller than the control group, the comparison of the increases
did not show a statistically significant result (difference in differences = -3.09, adjusted p-value
= 2.5368). No other biometric measurements were significantly improved for all three age
subgroups.
9.16
8.318.82
8.297.69
7.12
8.71 8.19 8.44 8.30
7.506.95
0.00
2.00
4.00
6.00
8.00
10.00
12.00
AGE ≤ 40 AGE ≤ 40 AGE 40 - 65 AGE 40 - 65 AGE > 65 AGE > 65
Pre-Intervention Post-Intervention
ControlIntervention Intervention InterventionControl Control
Δint-crtl
= -0.33 ^p =
0.7629
Δint-ctrl
= -0.40 ^p =
0.0357*
Δint-crtl
= -0.03 ^p = 2.5662
31 | Page Hawaii MIPCD - HI-PRAISE Final Report - December 2016
Figure 10. Triglycerides change by age subgroups.
^ = adjusted p.
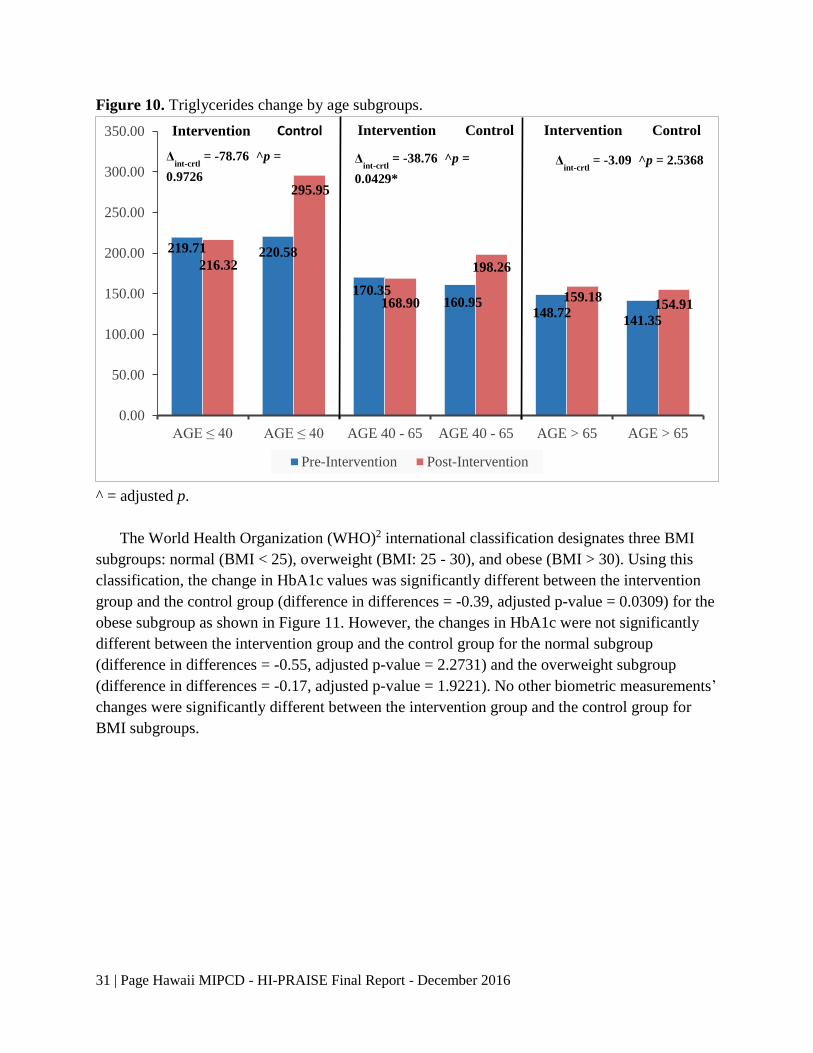
The World Health Organization (WHO)2 international classification designates three BMI
subgroups: normal (BMI < 25), overweight (BMI: 25 - 30), and obese (BMI > 30). Using this
classification, the change in HbA1c values was significantly different between the intervention
group and the control group (difference in differences = -0.39, adjusted p-value = 0.0309) for the
obese subgroup as shown in Figure 11. However, the changes in HbA1c were not significantly
different between the intervention group and the control group for the normal subgroup
(difference in differences = -0.55, adjusted p-value = 2.2731) and the overweight subgroup
(difference in differences = -0.17, adjusted p-value = 1.9221). No other biometric measurements’
changes were significantly different between the intervention group and the control group for
BMI subgroups.
219.71 220.58
170.35160.95
148.72141.35
216.32
295.95
168.90
198.26
159.18154.91
0.00
50.00
100.00
150.00
200.00
250.00
300.00
350.00
AGE ≤ 40 AGE ≤ 40 AGE 40 - 65 AGE 40 - 65 AGE > 65 AGE > 65
Pre-Intervention Post-Intervention
ControlIntervention Intervention InterventionControl Control
Δint-crtl
= -78.76 ^p =
0.9726
Δint-crtl
= -38.76 ^p =
0.0429*
Δint-crtl
= -3.09 ^p = 2.5368
32 | Page Hawaii MIPCD - HI-PRAISE Final Report - December 2016
Figure 11. HbA1c change by BMI subgroups.
^ = adjusted p.
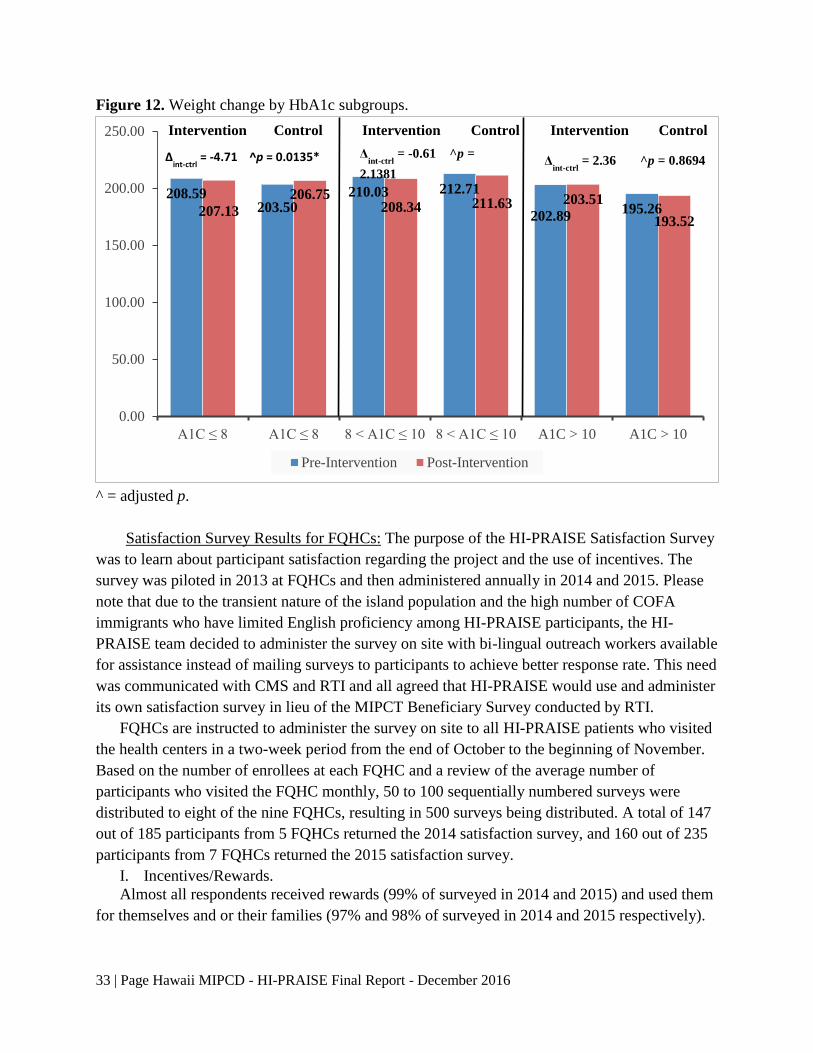
To examine the effect of incentives on biometric measurements in different HbA1c
subgroups, sub-analyses were conducted for each HbA1c subgroup (<= 8%, 8 – 10%, and >
10%) using GEE modeling adjusting for age, race, and gender. A significant weight change was
detected between the intervention group and the control group (difference in differences = -4.71
lb, adjusted p-value = 0.0135) for the HbA1c <= 8% subgroup as shown in Figure 12. The mean
weight slightly decreased in the intervention group, while the weight was slightly increased in
the control group for participants with HbA1c <= 8%. No significant weight changes were
observed for the HbA1c 8-10% subgroup (difference in differences = -0.61, adjusted p-value =
2.1381) or the HbA1c > 10% subgroup (difference in differences = 2.36, adjusted p-value =
0.8694).
8.998.36
8.908.67
8.69
7.92
8.66 8.59 8.35 8.29 8.01 8.01
0.00
2.00
4.00
6.00
8.00
10.00
12.00
Normal Normal Overweight Overweight Obese Obese
Pre-Intervention Post-Intervention
Intervention Control ControlControl InterventionIntervention
Δint-ctrl
= -0.55 ^p =
2.2731
Δint-ctrl
= -0.17 ^p =
1.9221 Δ
int-ctrl = -0.39 ^p = 0.0309*
33 | Page Hawaii MIPCD - HI-PRAISE Final Report - December 2016
Figure 12. Weight change by HbA1c subgroups.
^ = adjusted p.
Satisfaction Survey Results for FQHCs: The purpose of the HI-PRAISE Satisfaction Survey
was to learn about participant satisfaction regarding the project and the use of incentives. The
survey was piloted in 2013 at FQHCs and then administered annually in 2014 and 2015. Please
note that due to the transient nature of the island population and the high number of COFA
immigrants who have limited English proficiency among HI-PRAISE participants, the HI-
PRAISE team decided to administer the survey on site with bi-lingual outreach workers available
for assistance instead of mailing surveys to participants to achieve better response rate. This need
was communicated with CMS and RTI and all agreed that HI-PRAISE would use and administer
its own satisfaction survey in lieu of the MIPCT Beneficiary Survey conducted by RTI.
FQHCs are instructed to administer the survey on site to all HI-PRAISE patients who visited
the health centers in a two-week period from the end of October to the beginning of November.
Based on the number of enrollees at each FQHC and a review of the average number of
participants who visited the FQHC monthly, 50 to 100 sequentially numbered surveys were
distributed to eight of the nine FQHCs, resulting in 500 surveys being distributed. A total of 147
out of 185 participants from 5 FQHCs returned the 2014 satisfaction survey, and 160 out of 235
participants from 7 FQHCs returned the 2015 satisfaction survey.
I. Incentives/Rewards.
Almost all respondents received rewards (99% of surveyed in 2014 and 2015) and used them
for themselves and or their families (97% and 98% of surveyed in 2014 and 2015 respectively).
208.59203.50
210.03 212.71
202.89195.26207.13
206.75208.34 211.63 203.51
193.52
0.00
50.00
100.00
150.00
200.00
250.00
A1C ≤ 8 A1C ≤ 8 8 < A1C ≤ 10 8 < A1C ≤ 10 A1C > 10 A1C > 10
Pre-Intervention Post-Intervention
ControlIntervention Intervention InterventionControl Control
Δint-ctrl
= -4.71 ^p = 0.0135* Δint-ctrl
= -0.61 ^p =
2.1381 Δ
int-ctrl = 2.36 ^p = 0.8694

34 | Page Hawaii MIPCD - HI-PRAISE Final Report - December 2016
The satisfaction survey wanted to determine how participants felt about the rewards that he
or she might have received from the HI-PRAISE program (see Table 13). Participants were
asked to indicate how much he or she agreed or disagreed with each statement on a four- point
Likert scale with 1 being strongly disagree and 4 strongly agree. Table 15 and16 summarizes the
questions asked on the survey and the results from 2014 and 2015 respectively.
Table 15. Percentage of participants indicating levels of agreement with the statements and
average rating scores by year.
*: The overall mean was calculated using reversely coded Q6.
2014
n
%
Mean
(SD)
Strongly
Agree
(4)
Agree
(3)
Disagree
(2)
Strongly
Disagree
(1)
1. I am happy with the
rewards. 132 80.3 16.7 0.0 3.0 3.74 (.61)
2. Rewards were given to me
on time. 131 62.6 26.0 8.4 3.1 3.48 (.79)
3. Rewards have helped me set
goals and work towards
them.
130 66.2 29.2 2.3 2.3 3.59 (.66)
4. Rewards have helped me
make positive changes in
my life.
130 67.7 27.7 3.1 1.5 3.62 (.63)
5. I like getting rewards for
taking good care of my
diabetes.
130 70.8 25.4 1.5 2.3 3.65 (.63)
6. Rewards DO NOT help me
take care of my diabetes. 123 4.9 4.9 29.3 61.0 1.54 (.80)
7. I am happy with the dollar
amount of each reward. 130 60.8 34.6 3.1 1.5 3.55 (.64)
8. I am happy with how often I
got the rewards. 128 64.8 28.1 4.7 2.3 3.56 (.70)
9. It was easy for me to get the
rewards. 126 49.2 39.7 8.7 2.4 3.36 (.74)
10. It was easy for me to use the
rewards. 128 68.8 29.7 0.0 1.6 3.66 (.57)
11. The rewards were fair. 129 65.9 31.8 0.8 1.6 3.62 (.59)
*Overall 132 / / / / 3.57 (.51)
35 | Page Hawaii MIPCD - HI-PRAISE Final Report - December 2016
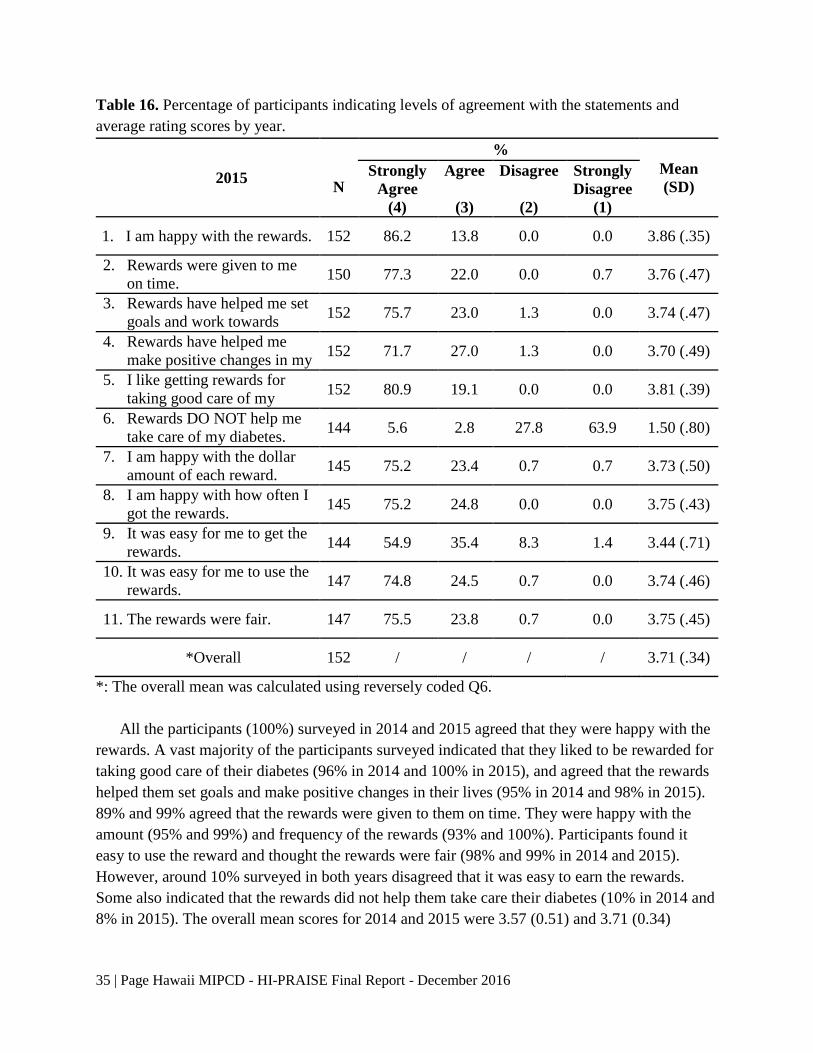
Table 16. Percentage of participants indicating levels of agreement with the statements and
average rating scores by year.
2015
N
%
Mean
(SD) Strongly
Agree
(4)
Agree
(3)
Disagree
(2)
Strongly
Disagree
(1)
1. I am happy with the rewards. 152 86.2 13.8 0.0 0.0 3.86 (.35)
2. Rewards were given to me
on time. 150 77.3 22.0 0.0 0.7 3.76 (.47)
3. Rewards have helped me set
goals and work towards
them.
152 75.7 23.0 1.3 0.0 3.74 (.47)
4. Rewards have helped me
make positive changes in my
life.
152 71.7 27.0 1.3 0.0 3.70 (.49)
5. I like getting rewards for
taking good care of my
diabetes.
152 80.9 19.1 0.0 0.0 3.81 (.39)
6. Rewards DO NOT help me
take care of my diabetes. 144 5.6 2.8 27.8 63.9 1.50 (.80)
7. I am happy with the dollar
amount of each reward. 145 75.2 23.4 0.7 0.7 3.73 (.50)
8. I am happy with how often I
got the rewards. 145 75.2 24.8 0.0 0.0 3.75 (.43)
9. It was easy for me to get the
rewards. 144 54.9 35.4 8.3 1.4 3.44 (.71)
10. It was easy for me to use the
rewards. 147 74.8 24.5 0.7 0.0 3.74 (.46)
11. The rewards were fair. 147 75.5 23.8 0.7 0.0 3.75 (.45)
*Overall 152 / / / / 3.71 (.34)
*: The overall mean was calculated using reversely coded Q6.
All the participants (100%) surveyed in 2014 and 2015 agreed that they were happy with the
rewards. A vast majority of the participants surveyed indicated that they liked to be rewarded for
taking good care of their diabetes (96% in 2014 and 100% in 2015), and agreed that the rewards
helped them set goals and make positive changes in their lives (95% in 2014 and 98% in 2015).
89% and 99% agreed that the rewards were given to them on time. They were happy with the
amount (95% and 99%) and frequency of the rewards (93% and 100%). Participants found it
easy to use the reward and thought the rewards were fair (98% and 99% in 2014 and 2015).
However, around 10% surveyed in both years disagreed that it was easy to earn the rewards.
Some also indicated that the rewards did not help them take care their diabetes (10% in 2014 and
8% in 2015). The overall mean scores for 2014 and 2015 were 3.57 (0.51) and 3.71 (0.34)

36 | Page Hawaii MIPCD - HI-PRAISE Final Report - December 2016
respectively with the higher score corresponding to more positive rating of the incentives,
indicating survey respondents were highly satisfied with the rewards they received.
II. Satisfaction with HI-PRAISE Program
Participants were also asked to indicate how they felt about the HI-PRAISE program on a
ten-point scale where 10 is the best program possible and 1 is the worst program possible (please
see Table 17 below). The respondents rated the HI-PRAISE program highly with an average
rating of 9.6 on a 10-point scale in both years. 74% and 76% of the participants surveyed in 2104
and 2015 considered HI-PRAISE the best program possible by rating it 10 out of 10.
Table 17. Overall program rating.
Survey
Year
Rating Scale
Mean
(SD)
Best
program
possible
10
9 8 7 6 5 4 3 2
Worst
program
possible
1
2014
(N=132) 73.5% 12.9% 10.6% 2.3% 0% 0.8% 0% 0% 0% 0%
9.55
(.87)
2015
(N=152) 76.3% 11.2% 8.6% 2.6% 1.3% 0% 0% 0% 0% 0%
9.59
(.86)
When asked about overall satisfaction with the HI-PRAISE program, 96% of the participants
indicated that they were very satisfied with the program in both years (see Table 18 below). 97%
and 98% of surveyed in 2014 and 2015 respectively indicated that they would definitely
recommend the program to their families and friends.
Table 18. Overall program satisfaction.
Survey
Year N
Very Satisfied
4
Somewhat
Satisfied
3
Somewhat
Dissatisfied
2
Very
Dissatisfied
1
2014 139 95.7% 4.3% 0% 0%
2015 155 95.5% 4.5% 0% 0%
III. Experiences with HI-PRAISE Program
A majority of the respondents, 84% in 2014 and 91% in 2015, indicated they were always or
usually able to contact the health center staff when they wanted to. As high as 92% of surveyed
in 2014 and 97% in 2015 were always or usually able to get the help they wanted from the staff.
Participants were also asked a series of questions related to their experience with the HI-
PRAISE program, providing information for overall programmatic improvement (See Table 19).
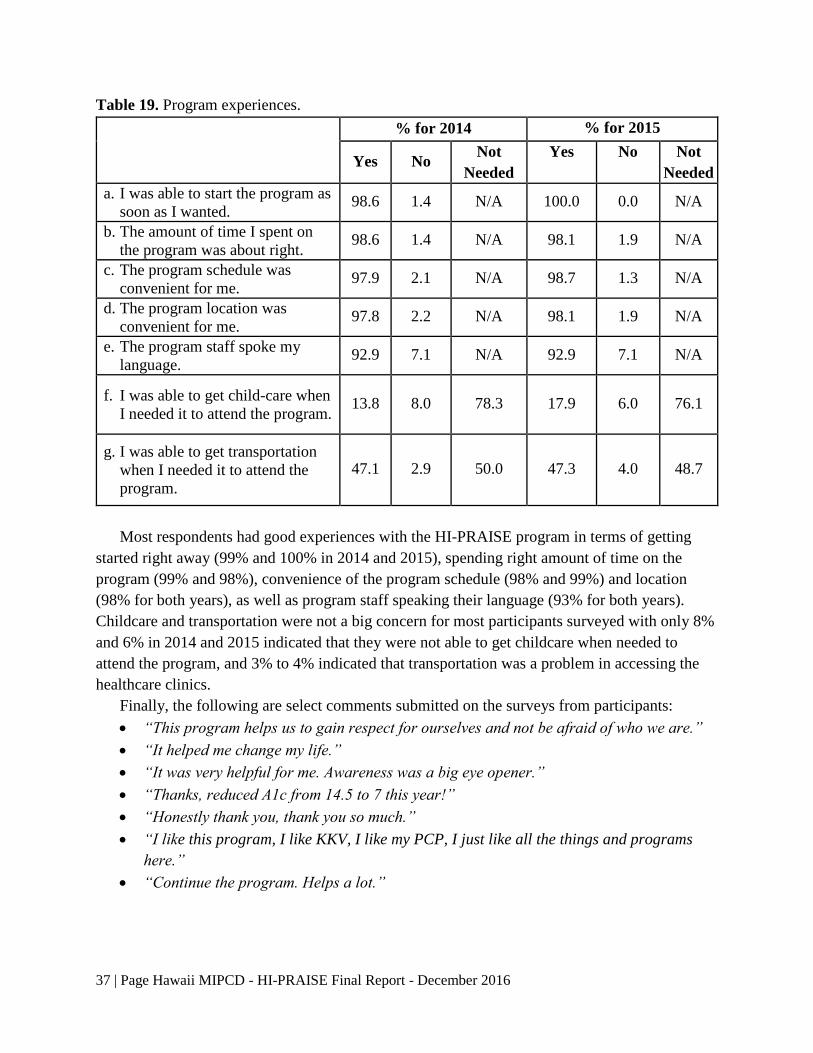
37 | Page Hawaii MIPCD - HI-PRAISE Final Report - December 2016
Table 19. Program experiences.
% for 2014 % for 2015
Yes No Not
Needed
Yes No Not
Needed
a. I was able to start the program as
soon as I wanted. 98.6 1.4 N/A 100.0 0.0 N/A
b. The amount of time I spent on
the program was about right. 98.6 1.4 N/A 98.1 1.9 N/A
c. The program schedule was
convenient for me. 97.9 2.1 N/A 98.7 1.3 N/A
d. The program location was
convenient for me. 97.8 2.2 N/A 98.1 1.9 N/A
e. The program staff spoke my
language. 92.9 7.1 N/A 92.9 7.1 N/A
f. I was able to get child-care when
I needed it to attend the program. 13.8 8.0 78.3 17.9 6.0 76.1
g. I was able to get transportation
when I needed it to attend the
program.
47.1 2.9 50.0 47.3 4.0 48.7
Most respondents had good experiences with the HI-PRAISE program in terms of getting
started right away (99% and 100% in 2014 and 2015), spending right amount of time on the
program (99% and 98%), convenience of the program schedule (98% and 99%) and location
(98% for both years), as well as program staff speaking their language (93% for both years).
Childcare and transportation were not a big concern for most participants surveyed with only 8%
and 6% in 2014 and 2015 indicated that they were not able to get childcare when needed to
attend the program, and 3% to 4% indicated that transportation was a problem in accessing the
healthcare clinics.
Finally, the following are select comments submitted on the surveys from participants:
“This program helps us to gain respect for ourselves and not be afraid of who we are.”
“It helped me change my life.”
“It was very helpful for me. Awareness was a big eye opener.”
“Thanks, reduced A1c from 14.5 to 7 this year!”
“Honestly thank you, thank you so much.”
“I like this program, I like KKV, I like my PCP, I just like all the things and programs
here.”
“Continue the program. Helps a lot.”
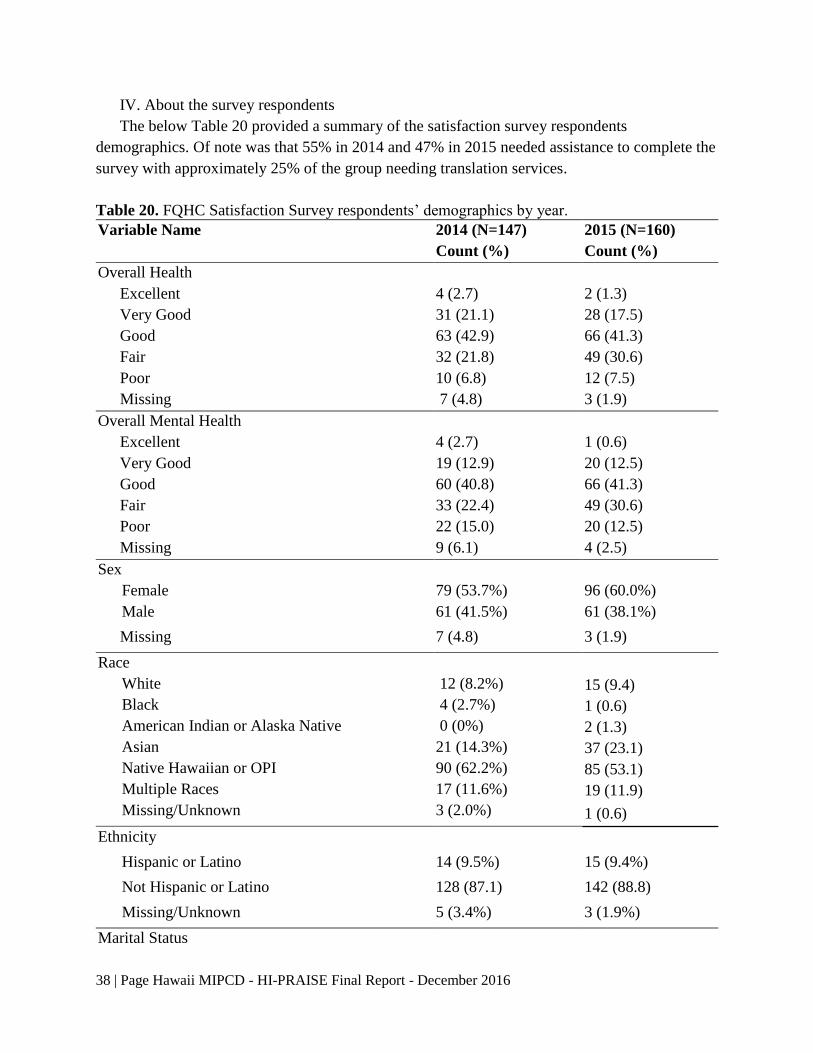
38 | Page Hawaii MIPCD - HI-PRAISE Final Report - December 2016
IV. About the survey respondents
The below Table 20 provided a summary of the satisfaction survey respondents
demographics. Of note was that 55% in 2014 and 47% in 2015 needed assistance to complete the
survey with approximately 25% of the group needing translation services.
Table 20. FQHC Satisfaction Survey respondents’ demographics by year.
Variable Name 2014 (N=147)
Count (%)
2015 (N=160)
Count (%)
Overall Health
Excellent 4 (2.7) 2 (1.3)
Very Good 31 (21.1) 28 (17.5)
Good 63 (42.9) 66 (41.3)
Fair 32 (21.8) 49 (30.6)
Poor 10 (6.8) 12 (7.5)
Missing 7 (4.8) 3 (1.9)
Overall Mental Health
Excellent 4 (2.7) 1 (0.6)
Very Good 19 (12.9) 20 (12.5)
Good 60 (40.8) 66 (41.3)
Fair 33 (22.4) 49 (30.6)
Poor 22 (15.0) 20 (12.5)
Missing 9 (6.1) 4 (2.5)
Sex
Female 79 (53.7%) 96 (60.0%)
Male 61 (41.5%) 61 (38.1%)
Missing 7 (4.8) 3 (1.9)
Race
White 12 (8.2%) 15 (9.4)
Black 4 (2.7%) 1 (0.6)
American Indian or Alaska Native 0 (0%) 2 (1.3)
Asian 21 (14.3%) 37 (23.1)
Native Hawaiian or OPI 90 (62.2%) 85 (53.1)
Multiple Races 17 (11.6%) 19 (11.9)
Missing/Unknown 3 (2.0%) 1 (0.6)
Ethnicity
Hispanic or Latino 14 (9.5%) 15 (9.4%)
Not Hispanic or Latino 128 (87.1) 142 (88.8)
Missing/Unknown 5 (3.4%) 3 (1.9%)
Marital Status
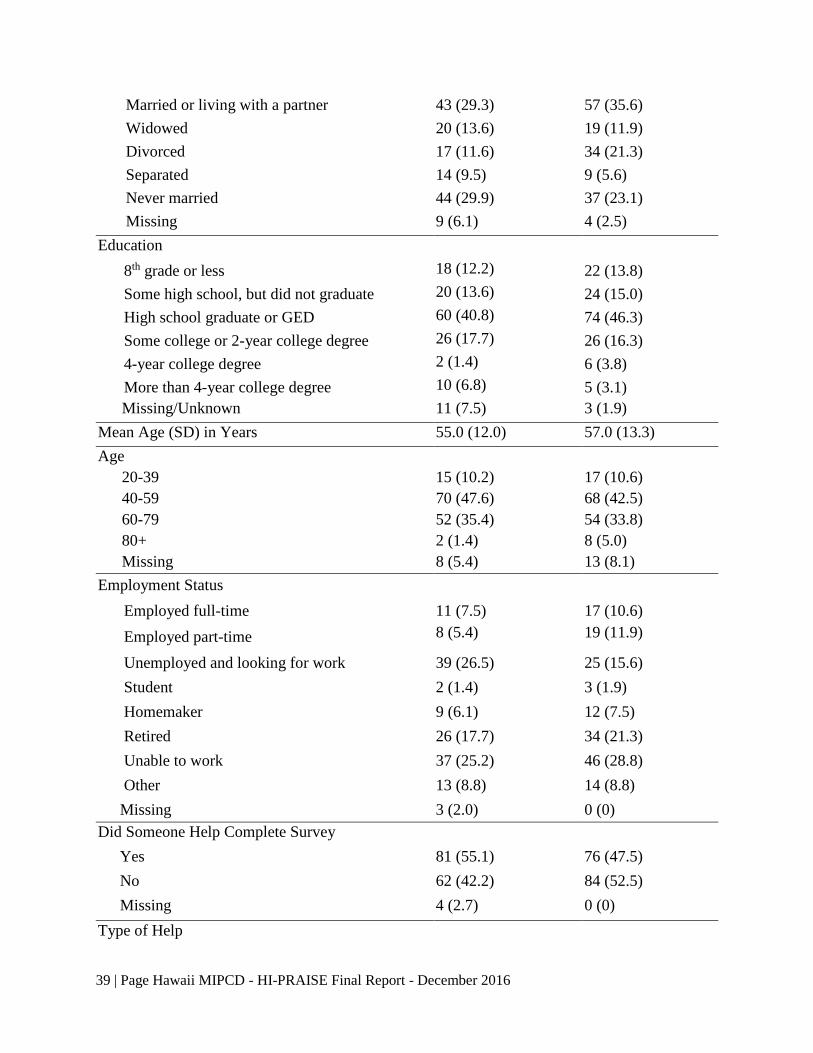
39 | Page Hawaii MIPCD - HI-PRAISE Final Report - December 2016
Married or living with a partner 43 (29.3) 57 (35.6)
Widowed 20 (13.6) 19 (11.9)
Divorced 17 (11.6) 34 (21.3)
Separated 14 (9.5) 9 (5.6)
Never married 44 (29.9) 37 (23.1)
Missing 9 (6.1) 4 (2.5)
Education
8th grade or less 18 (12.2) 22 (13.8)
Some high school, but did not graduate 20 (13.6) 24 (15.0)
High school graduate or GED 60 (40.8) 74 (46.3)
Some college or 2-year college degree 26 (17.7) 26 (16.3)
4-year college degree 2 (1.4) 6 (3.8)
More than 4-year college degree 10 (6.8) 5 (3.1)
Missing/Unknown 11 (7.5) 3 (1.9)
Mean Age (SD) in Years 55.0 (12.0) 57.0 (13.3)
Age
20-39 15 (10.2) 17 (10.6)
40-59 70 (47.6) 68 (42.5)
60-79 52 (35.4) 54 (33.8)
80+ 2 (1.4) 8 (5.0)
Missing 8 (5.4) 13 (8.1)
Employment Status
Employed full-time 11 (7.5) 17 (10.6)
Employed part-time 8 (5.4) 19 (11.9)
Unemployed and looking for work 39 (26.5) 25 (15.6)
Student 2 (1.4) 3 (1.9)
Homemaker 9 (6.1) 12 (7.5)
Retired 26 (17.7) 34 (21.3)
Unable to work 37 (25.2) 46 (28.8)
Other 13 (8.8) 14 (8.8)
Missing 3 (2.0) 0 (0)
Did Someone Help Complete Survey
Yes 81 (55.1) 76 (47.5)
No 62 (42.2) 84 (52.5)
Missing 4 (2.7) 0 (0)
Type of Help
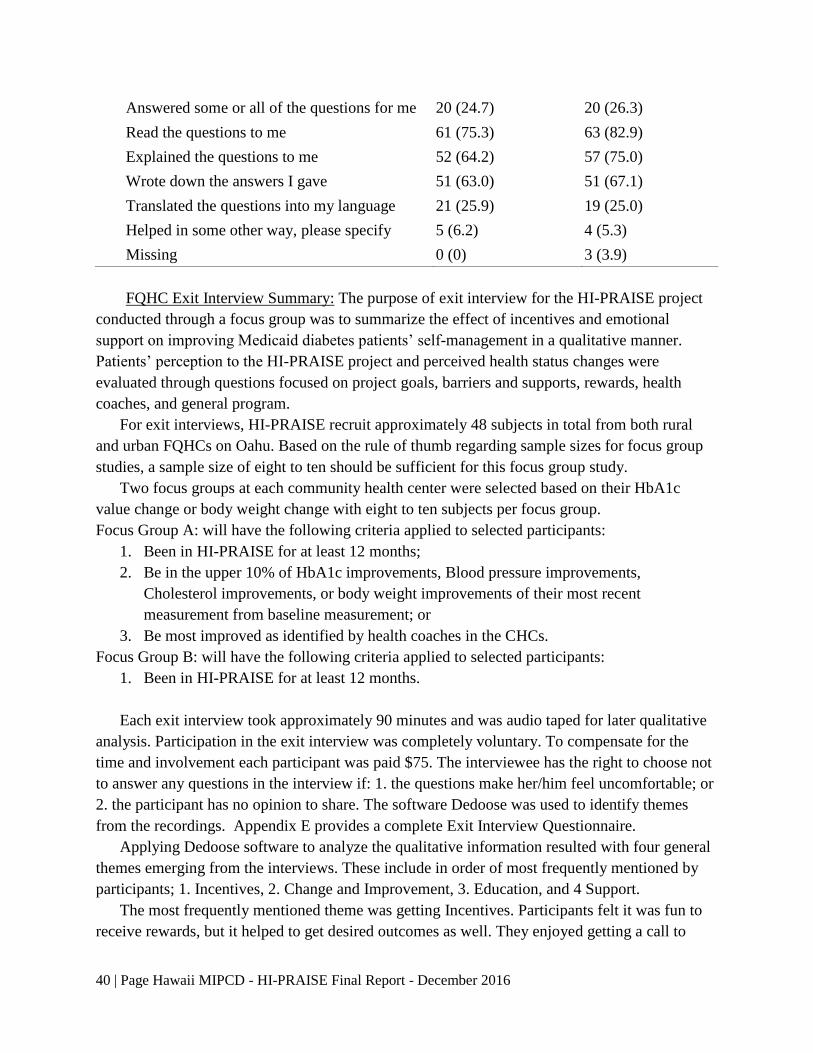
40 | Page Hawaii MIPCD - HI-PRAISE Final Report - December 2016
FQHC Exit Interview Summary: The purpose of exit interview for the HI-PRAISE project
conducted through a focus group was to summarize the effect of incentives and emotional
support on improving Medicaid diabetes patients’ self-management in a qualitative manner.
Patients’ perception to the HI-PRAISE project and perceived health status changes were
evaluated through questions focused on project goals, barriers and supports, rewards, health
coaches, and general program.
For exit interviews, HI-PRAISE recruit approximately 48 subjects in total from both rural
and urban FQHCs on Oahu. Based on the rule of thumb regarding sample sizes for focus group
studies, a sample size of eight to ten should be sufficient for this focus group study.
Two focus groups at each community health center were selected based on their HbA1c
value change or body weight change with eight to ten subjects per focus group.
Focus Group A: will have the following criteria applied to selected participants:
1. Been in HI-PRAISE for at least 12 months;
2. Be in the upper 10% of HbA1c improvements, Blood pressure improvements,
Cholesterol improvements, or body weight improvements of their most recent
measurement from baseline measurement; or
3. Be most improved as identified by health coaches in the CHCs.
Focus Group B: will have the following criteria applied to selected participants:
1. Been in HI-PRAISE for at least 12 months.
Each exit interview took approximately 90 minutes and was audio taped for later qualitative
analysis. Participation in the exit interview was completely voluntary. To compensate for the
time and involvement each participant was paid $75. The interviewee has the right to choose not
to answer any questions in the interview if: 1. the questions make her/him feel uncomfortable; or
2. the participant has no opinion to share. The software Dedoose was used to identify themes
from the recordings. Appendix E provides a complete Exit Interview Questionnaire.
Applying Dedoose software to analyze the qualitative information resulted with four general
themes emerging from the interviews. These include in order of most frequently mentioned by
participants; 1. Incentives, 2. Change and Improvement, 3. Education, and 4 Support.
The most frequently mentioned theme was getting Incentives. Participants felt it was fun to
receive rewards, but it helped to get desired outcomes as well. They enjoyed getting a call to
Answered some or all of the questions for me 20 (24.7) 20 (26.3)
Read the questions to me 61 (75.3) 63 (82.9)
Explained the questions to me 52 (64.2) 57 (75.0)
Wrote down the answers I gave 51 (63.0) 51 (67.1)
Translated the questions into my language 21 (25.9) 19 (25.0)
Helped in some other way, please specify 5 (6.2) 4 (5.3)
Missing 0 (0) 3 (3.9)

41 | Page Hawaii MIPCD - HI-PRAISE Final Report - December 2016
come into the health center to get a reward. For those unable to work, the gift card came in
handy. It allowed them to buy things they couldn’t buy with food stamps like shampoo and
toothpaste. Ultimately the participants felt it helped to progress faster in the right direction. One
participants stated:
“Incentives were great. They helped to support the programs that were offered to us and gave
a push to accept these programs and actually be accountable. Didn’t care as much before. It
opened our eyes to how much more is out there. The incentive was great, but the program
and the way it was run – it’s a strong part of the program.”
The next most identified theme was related to the Change and Improvement of their well-
being. The participants felt happy, had healthier diets, focused on portion control, meal planning,
everything in moderation while watching sodium intake and less fried foods. They felt better,
had better health, experience weight loss, and exercised. They stated they had more energy,
could do more, sleep better and were in general more committed to self-care. One participant
stated:
“You don’t know how bad you were until you feel better.”
Another theme of importance was Education. Participants stated they had a better
understanding of how to take care of themselves. Monitored their medication, eating, blood sugar
and were aware of consequences if they didn’t. One person stated the benefits of sharing with
their ohana or family:
“The knowledge and the education that they gave us that we can take with us and move on
and share with our ohana, that’s a plus.”
The last major theme that emerged was Support both from the FQHCs and family members.
They appreciated the one on one support from the health coaches mentioning encouragement,
motivation and monitoring of the individual. They said the group support, encouraging one
another felt like family. Participants appreciated all family members being supportive of their
efforts to improve their health. They thought HI-PRAISE supported their accountability, kept
them on track, allowed them to buy healthy food, and that they had failed before being on HI-
PRAISE. One person stated:
“CHC staff care, go beyond, work harder, always have someone for patients to talk to or they
call you back which they don’t have to. Motivation comes from there – they go beyond what
they have to do.”
Health Coach Focus Group: The HI-PRAISE team also conducted a final focus group
interview with 24 Health Coaches. They stated their favorite parts of the program included:
getting to know the patients more which enabled them to build a relationship, encouraging them
to come back, before they had to call the patient but now the patient was telling the health coach
they had an appointment, the patients were more willing to share about their experiences. The
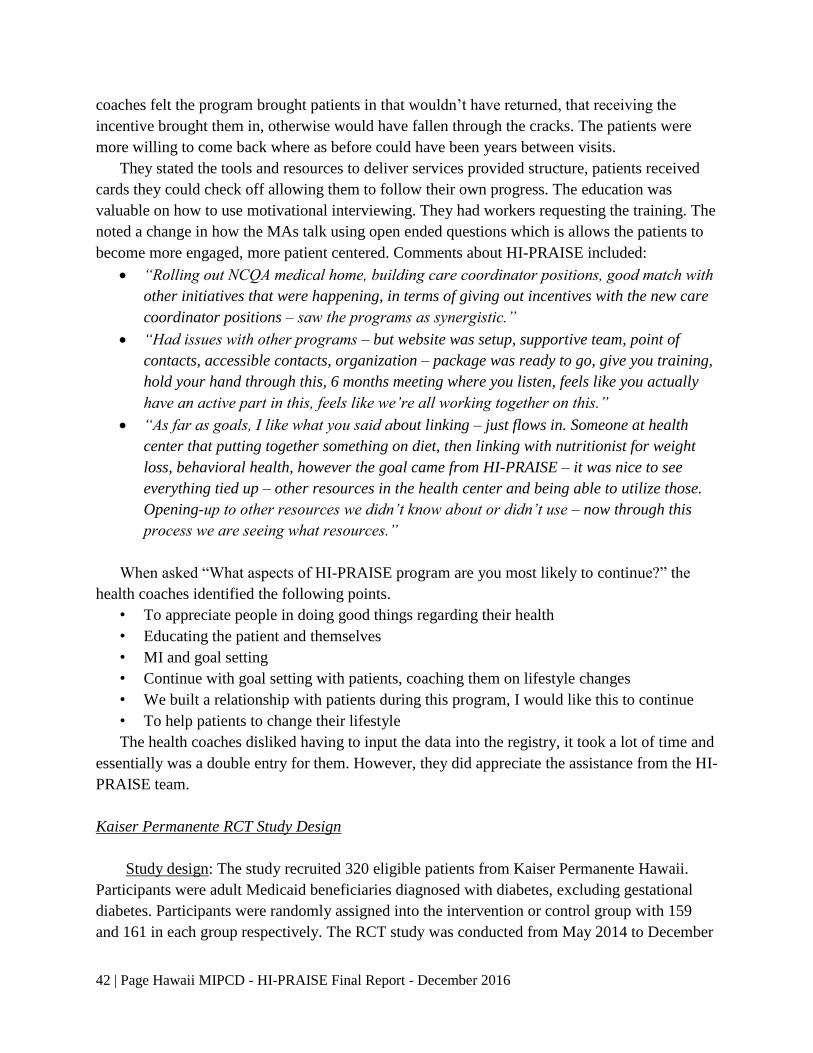
42 | Page Hawaii MIPCD - HI-PRAISE Final Report - December 2016
coaches felt the program brought patients in that wouldn’t have returned, that receiving the
incentive brought them in, otherwise would have fallen through the cracks. The patients were
more willing to come back where as before could have been years between visits.
They stated the tools and resources to deliver services provided structure, patients received
cards they could check off allowing them to follow their own progress. The education was
valuable on how to use motivational interviewing. They had workers requesting the training. The
noted a change in how the MAs talk using open ended questions which is allows the patients to
become more engaged, more patient centered. Comments about HI-PRAISE included:
“Rolling out NCQA medical home, building care coordinator positions, good match with
other initiatives that were happening, in terms of giving out incentives with the new care
coordinator positions – saw the programs as synergistic.”
“Had issues with other programs – but website was setup, supportive team, point of
contacts, accessible contacts, organization – package was ready to go, give you training,
hold your hand through this, 6 months meeting where you listen, feels like you actually
have an active part in this, feels like we’re all working together on this.”
“As far as goals, I like what you said about linking – just flows in. Someone at health
center that putting together something on diet, then linking with nutritionist for weight
loss, behavioral health, however the goal came from HI-PRAISE – it was nice to see
everything tied up – other resources in the health center and being able to utilize those.
Opening-up to other resources we didn’t know about or didn’t use – now through this
process we are seeing what resources.”
When asked “What aspects of HI-PRAISE program are you most likely to continue?” the
health coaches identified the following points.
• To appreciate people in doing good things regarding their health
• Educating the patient and themselves
• MI and goal setting
• Continue with goal setting with patients, coaching them on lifestyle changes
• We built a relationship with patients during this program, I would like this to continue
• To help patients to change their lifestyle
The health coaches disliked having to input the data into the registry, it took a lot of time and
essentially was a double entry for them. However, they did appreciate the assistance from the HI-
PRAISE team.
Kaiser Permanente RCT Study Design
Study design: The study recruited 320 eligible patients from Kaiser Permanente Hawaii.
Participants were adult Medicaid beneficiaries diagnosed with diabetes, excluding gestational
diabetes. Participants were randomly assigned into the intervention or control group with 159
and 161 in each group respectively. The RCT study was conducted from May 2014 to December

43 | Page Hawaii MIPCD - HI-PRAISE Final Report - December 2016
31, 2015 with rolling enrollment from May 2014 through January 2015. The diagram of Kaiser
RCT study design is as follows:
Figure 13. Kaiser RCT Study Design.
A power analysis was conducted to compute the sample size needed for the randomized
controlled trail design for at least 80% power at significant level of 5%. Based on Long, et al.,
(2012) study related to the effect of incentives on lowering HbA1c levels, the mean HbA1c
difference between the two groups was estimated at 0.45% with an estimated standard deviation
of 1.40%.1 Through the calculation using the proc power procedure in SAS 9.3, the RCT study
needed to recruit 360 subjects to obtain the required 306 subjects with a conservative attrition
rate of 15%. The actual recruitment was 320 participants.
Participants: The study recruited 320 patients 18 years of age or older, who have been
diagnosed with Type 1 or 2 diabetes with HbA1c ≥ 6.5% and are Medicaid beneficiaries at
Kaiser Permanente Hawaii. Pregnant women and women with gestational diabetes were
excluded. Kaiser has a standardized diabetes care program, and for those with an HbA1c of 8.0%
or higher, received additional diabetes care coordination service. Participants were randomized
into the intervention and control group with a final enrollment of 159 and 161 in each group
respectively. The demographics presented in the result section show that the two groups were
well matched on several key variables; implying randomization was carried out successfully.
Incentives: Financial incentives were distributed via a ClinCard, which is a card that is
loaded and managed electronically, and can be used like a debit card. These ClinCards were sent
to participants in the mail at the time of enrollment and consent. The ClinCard can be loaded
with money electronically by Kaiser Staff, upon the participant’s completion of certain tests or
achieving goals; as described in the incentive schedule (see page 9). Only Kaiser participants
who were randomized into the intervention group were eligible for incentives for tests and
achieving goals. Participants in the control group were not monetarily incentivized for obtaining
laboratory, biometric, or goal achievement except for receiving compensations for survey
completion.
02/2015 - 12/2015:
Incentive intervention period
05/2014 - 01/2015:
Enrollment
Control group
Intervention group

44 | Page Hawaii MIPCD - HI-PRAISE Final Report - December 2016
Data collection: The RCT study was carried out within Kaiser’s usual care setting with
minimum direct data collection from the participants. All participants’ biometric measures and
lab test results were collected from patients’ electronic medical records (EMR) as they became
available and reported quarterly by Kaiser Staff to the HI-PRAISE team. The primary outcome
measures included hemoglobin HbA1c, blood pressure, cholesterol levels, BMI weight, retinal
eye exam, influenza and pneumococcal vaccination, blood test, and urine test. The secondary
outcome measures included participant survey data on self-reported diabetes self-care activities
and health/wellbeing and healthcare utilization data.
Kaiser RCT Results
The results are presented in the following order: 1. Demographic characteristics of
participants, 2. Compliance with the American Diabetes Association (ADA) recommended tests
and routine checks, 3. Comparison of health outcomes between groups over time, and 4.
Summary of survey results.
Demographics: The demographic characteristics of the participants in the intervention and
the control group are shown in Table 21. In the intervention group, the mostly commonly
reported race was Native Hawaii or other Pacific Islander (34%). While participants in the
control group most commonly reported multiple races (32.9%). However, demographic
characteristics including race, ethnicity, age, Compact of Free Association Agreement (COFA)
status, history of hypertension, heart disease, and tobacco use were balanced between the
intervention and the control group. Sex between the intervention and control group was similarly
well balanced, but of note is that more than half of the participants in both the intervention
(55.3%) and control group (53.4%) were female.
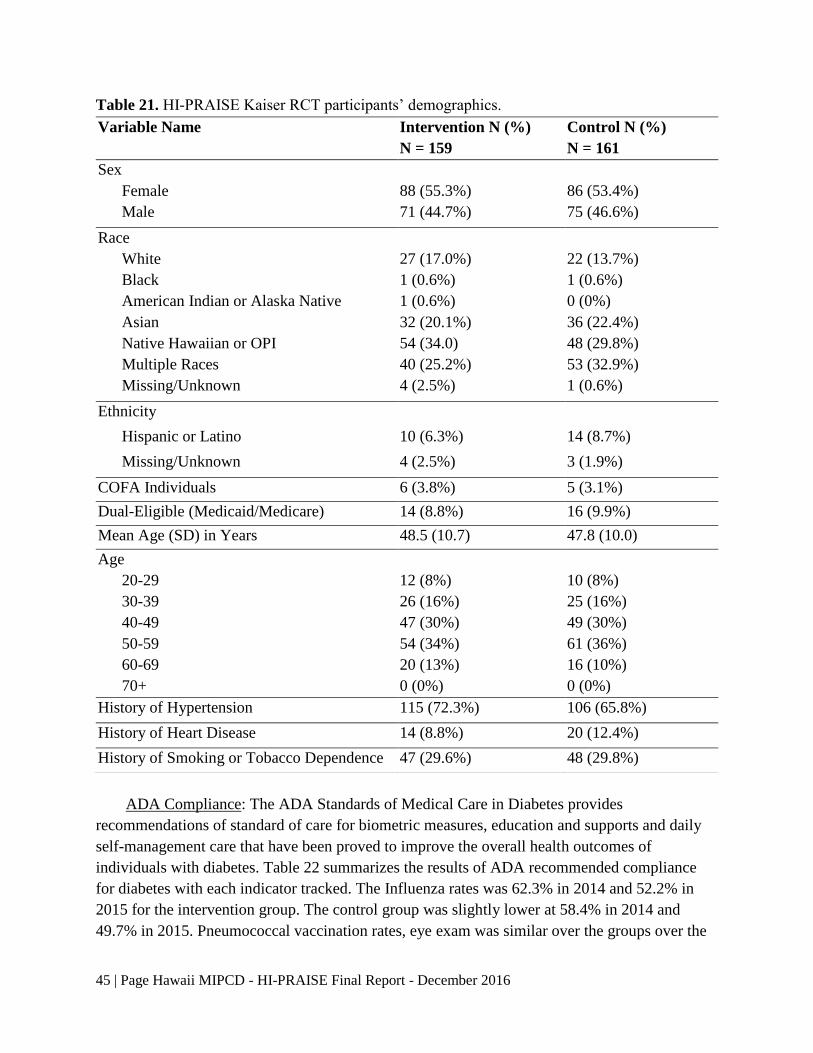
45 | Page Hawaii MIPCD - HI-PRAISE Final Report - December 2016
Table 21. HI-PRAISE Kaiser RCT participants’ demographics.
ADA Compliance: The ADA Standards of Medical Care in Diabetes provides
recommendations of standard of care for biometric measures, education and supports and daily
self-management care that have been proved to improve the overall health outcomes of
individuals with diabetes. Table 22 summarizes the results of ADA recommended compliance
for diabetes with each indicator tracked. The Influenza rates was 62.3% in 2014 and 52.2% in
2015 for the intervention group. The control group was slightly lower at 58.4% in 2014 and
49.7% in 2015. Pneumococcal vaccination rates, eye exam was similar over the groups over the
Variable Name Intervention N (%)
N = 159
Control N (%)
N = 161
Sex
Female 88 (55.3%) 86 (53.4%)
Male 71 (44.7%) 75 (46.6%)
Race
White 27 (17.0%) 22 (13.7%)
Black 1 (0.6%) 1 (0.6%)
American Indian or Alaska Native 1 (0.6%) 0 (0%)
Asian 32 (20.1%) 36 (22.4%)
Native Hawaiian or OPI 54 (34.0) 48 (29.8%)
Multiple Races 40 (25.2%) 53 (32.9%)
Missing/Unknown 4 (2.5%) 1 (0.6%)
Ethnicity
Hispanic or Latino 10 (6.3%) 14 (8.7%)
Missing/Unknown 4 (2.5%) 3 (1.9%)
COFA Individuals 6 (3.8%) 5 (3.1%)
Dual-Eligible (Medicaid/Medicare) 14 (8.8%) 16 (9.9%)
Mean Age (SD) in Years 48.5 (10.7) 47.8 (10.0)
Age
20-29 12 (8%) 10 (8%)
30-39 26 (16%) 25 (16%)
40-49 47 (30%) 49 (30%)
50-59 54 (34%) 61 (36%)
60-69 20 (13%) 16 (10%)
70+ 0 (0%) 0 (0%)
History of Hypertension 115 (72.3%) 106 (65.8%)
History of Heart Disease 14 (8.8%) 20 (12.4%)
History of Smoking or Tobacco Dependence 47 (29.6%) 48 (29.8%)

46 | Page Hawaii MIPCD - HI-PRAISE Final Report - December 2016
years. The control group received less smoking cessation counseling in 2014, which improved in
2015. Laboratory blood testing for HbA1c and LDL Cholesterol was similar in both groups over
both years. A significant difference was noted for diabetes education, which may be explained by
the fact that it was difficult to capture this data. Blood pressure under control rates were better
for both group in 2014 as compared to 2015 which may be due to drop outs and errors in data
collection.
Table 22. Compliance with ADA recommended self-management of diabetes during the study
period.
2014 2015
Intervention
(N=159)
Control
(N=161)
Intervention
(N=159)
Control
(N=161)
Flu Vaccination 99
(62.3%)
94
(58.4%)
83
(52.2%)
80
(49.7%)
Pneumococcal Vaccination 26
(16.4%)
24
(14.9%)
21
(13.2%)
20
(12.4%)
Retinal Eye Exam 94
(59.1%)
97
(60.2%)
87
(54.7%)
93
(57.8%)
Smoking Cessation
Counseling
32
(20.1%)
24
(14.9%)
44
(27.7%)
46
(28.6%)
DM Education* 5
(3.1%)
1
(0.6%)
89
(56.0%)
12
(7.5%)
Urine Test 115
(72.3%)
102
(63.4%)
107
(67.3%)
106
(65.8%)
HbA1c Test 157
(98.7%)
156
(96.9%)
147
(92.5%)
154
(95.7%)
LDL Test 156
(98.1%)
153
(95.0%)
145
(91.2%)
148
(91.9%)
BP under 140/90 132
(83.0%)
135
(83.9%)
124
(78.0%)
125
(77.6%)
Note: * Limited data on DM education.
Biometric Outcomes: Generalized estimating equation (GEE) modeling techniques were
used to examine the pre- and post-intervention difference in different changes between the
intervention group (n = 159) and the control group (n = 161) in biometric indicators for Kaiser
Medicaid beneficiaries with diabetes. The analysis adjusted for age, race, gender, and baseline
hypertension. The estimated coefficients and corresponding 95% confidence intervals (CI) was
used to quantify the pre- and post-intervention changes between the incentive group and the
control group. The results are presented in Table 23. Compared to the baseline; participants in
the intervention group had biometrics that remained relatively unchanged for each measure.
Similar patterns were observed for the control group. Although, there were trends of positive
incentive effects on systolic blood pressure (difference in differences = -2.29, adjusted p-value =

47 | Page Hawaii MIPCD - HI-PRAISE Final Report - December 2016
0.2416), diastolic blood pressure (difference in differences = -1.08, adjusted p-value = 0.3881),
and total cholesterol (difference in differences = -1.35, adjusted p-value = 0.8617), the effects
were not statistically significant due to lack of power. No evidence of positive effects of
incentives on A1c, LDL, triglycerides, weight, and BMI was noticed in the Kaiser study. Overall
there was no statistically significant difference-in-differences between groups for weight, blood
pressure, HbA1c, or cholesterol levels.
Table 23. Adjusted biometric outcomes of the Kaiser RCT study.
Intervention
group
Control
group Δ
within
Intervention
Δ
within
Control
Difference
in
Δ
95% CI P-value
Pre Post Pre Post
Weight 200.05 198.28 213.54 213.34 -1.77 -0.20 -1.57 -4.53 1.38 0.2972
BMI 32.12 31.85 33.91 33.99 -0.28 0.08 -0.36 -0.92 0.20 0.2091
SBP 126.61 125.25 125.13 126.06 -1.36 0.93 -2.29 -6.13 1.54 0.2416
DBP 76.11 73.93 75.46 74.36 -2.19 -1.10 -1.09 -3.56 1.38 0.3881
HbA1c 8.20 8.27 8.88 8.53 0.06 -0.34 0.41 -0.01 0.83 0.0553
Total
Cholesterol 176.04 172.12 183.96 181.39 -3.92 -2.57 -1.34 -16.45 13.77 0.8617
Triglycerides 182.72 183.21 137.09 155.36 0.49 18.27 -17.78 -73.75 38.17 0.5333
LDL 93.58 93.13 103.50 102.14 -0.45 -1.36 0.91 -9.35 11.17 0.8620
HDL 43.99 44.66 45.12 45.07 0.67 -0.05 0.72 -1.33 2.76 0.4915
*p < 0.05 considered statistically significant
Subanalysis was conducted to examine the effect of incentives on participants in different
age, BMI, and HbA1c subgroups. The age variable is categorized into three levels: < 40, 40-65,
and > 65 to denote young, middle, and senior Medicaid beneficiaries with diabetes. According to
the world health organization (WHO) international classification (2016), three BMI subgroups
were created: Normal (BMI < 25 Kg/m2), Overweight (BMI: 25 – 30 Kg/m2), and Obese (BMI >
30 Kg/m2).2 Three HbA1c subgroups were created: (<= 8%, 8 – 10%, and > 10%). For the obese
subgroup, the change in HbA1c values was significantly different between the intervention group
and the control group (difference in Δ = 0.67, 95% CI: 0.14 – 1.20, p = 0.0396), with an increase
in HbA1c values for the intervention group and a decrease in values for the control group. No
significant differences in blood pressure, HbA1c, or cholesterol levels were found for the normal
or overweight subgroups. No significant differences in weight, blood pressure, HbA1c, or
cholesterol levels were found for any of the age subgroups. No significant differences in weight,
blood pressure, or cholesterol levels were found for any of the HbA1c subgroups.
Survey Results
Survey data was collected from the participants in the intervention and control groups to
assess and monitor changes over time in the well-being and self-management activities of
diabetes. The surveys used include (a) the SF-36v2® Health Survey (SF-36), and (b) the
48 | Page Hawaii MIPCD - HI-PRAISE Final Report - December 2016
Summary of Diabetes Self-Care Activities Measure (SDSCA). Surveys were mailed to
participants at baseline, mid, and final time points of the study with a pre-stamped return
envelope included. Given that participants were on a rolling enrollment basis, the true baseline
ranged from June 2014 to January 2015 with the midpoint administered in July 2015 and final in
November 2015). In addition, participants in the intervention group also received the HI-
PRAISE Satisfaction Survey at the end of the study to assess their satisfaction with the
incentives and project. Participants were compensated with $25, loaded on ClinCard, for
completion and return of the mail-in surveys at each time point.
SF-36 Results: The SF-36v2 is a short-form health survey used to assess and monitor
changes over time in the well-being of participants. Of the 36 total items, 35 items were
transformed into a profile of functional health and well-being using eight health domain scales
and two component summary measures described below.
Health Domain Scales
The eight health domain scales include:
1. Physical Functioning (PF). The PF scale uses 10 items to assess any limitations on
performing physical activities such as climbing stairs or carrying groceries.
2. Role-Physical (RP). The RP scale uses 4 items to assess problems with work or other
daily activities, such as a reduction in the amount of time spent on activities or difficulty
performing usual activities, due to physical problems.
3. Bodily Pain (BP). The BP scale uses 2 items to assess intensity of bodily pain and
interference with normal activities due to bodily pain.
4. General Health (GH). The GH scale uses 5 items to assess the respondent’s current rating
as well as expectations about his or her own health.
5. Vitality (VT). The VT scale uses 4 items to assess levels of energy and fatigue.
6. Social Functioning (SF). The SF scale uses 2 items to assess any interference in the
amount or quality of social activities due to physical and emotional problems.
7. Role-Emotional (RE). The RE scale uses 3 items to assess problems with work or other
daily activities due to emotional problems.
8. Mental Health (MH). The MH scale uses 5 items to assess psychological well-being.
Component Summary Measures
The two component summary measures further summarize the eight health domain scales.
The Physical Component Summary (PCS) is derived from the PF, RP, BP, and GH scales while
the Mental Component Summary (MCS) is derived from the VT, SF, RE, and MH scales.
Overall, 277 participants completed a survey for at least one of the three time points while
115 participants completed surveys at all three time points. A total of 578 surveys were returned
over the three time points with 266 surveys returned at baseline, 169 at the midpoint, and 143 at
the final time point. Of the 277 participants who completed at least one survey, 145 (52%) were
in the intervention arm and 132 (48%) were in the control arm. Table 24 shows the mean score
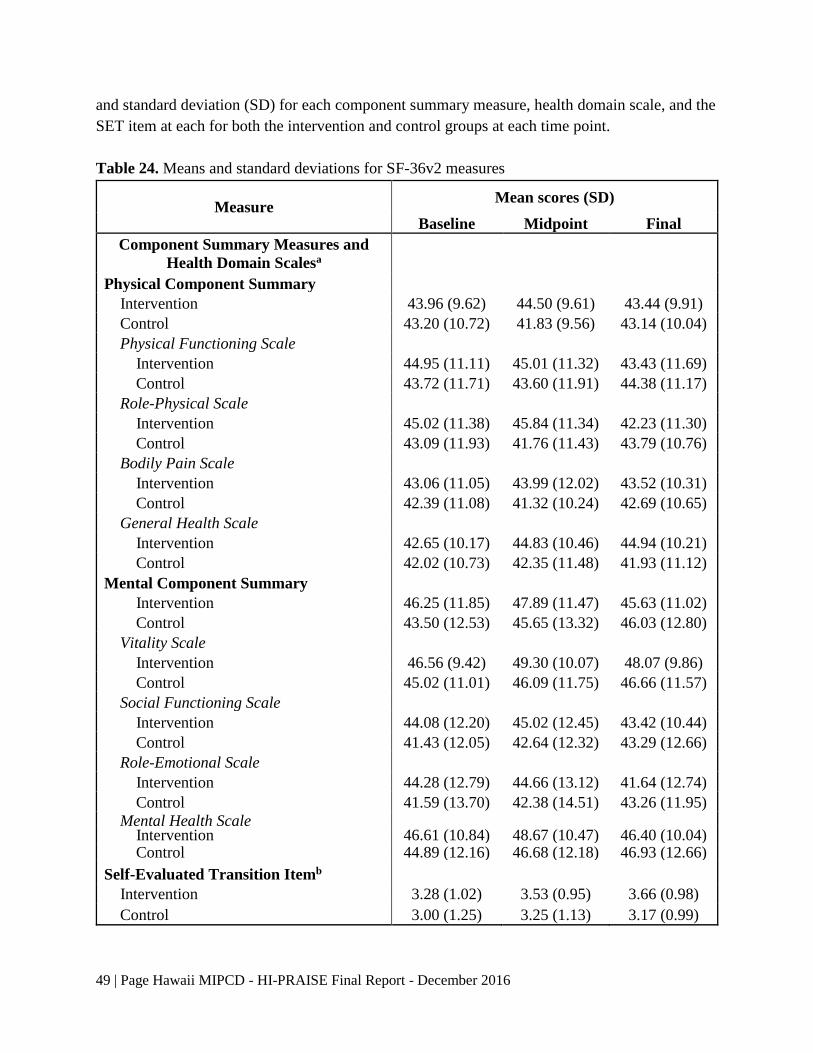
49 | Page Hawaii MIPCD - HI-PRAISE Final Report - December 2016
and standard deviation (SD) for each component summary measure, health domain scale, and the
SET item at each for both the intervention and control groups at each time point.
Table 24. Means and standard deviations for SF-36v2 measures
Measure Mean scores (SD)
Baseline Midpoint Final
Component Summary Measures and
Health Domain Scalesa
Physical Component Summary
Intervention 43.96 (9.62) 44.50 (9.61) 43.44 (9.91)
Control 43.20 (10.72) 41.83 (9.56) 43.14 (10.04)
Physical Functioning Scale
Intervention 44.95 (11.11) 45.01 (11.32) 43.43 (11.69)
Control 43.72 (11.71) 43.60 (11.91) 44.38 (11.17)
Role-Physical Scale
Intervention 45.02 (11.38) 45.84 (11.34) 42.23 (11.30)
Control 43.09 (11.93) 41.76 (11.43) 43.79 (10.76)
Bodily Pain Scale
Intervention 43.06 (11.05) 43.99 (12.02) 43.52 (10.31)
Control 42.39 (11.08) 41.32 (10.24) 42.69 (10.65)
General Health Scale
Intervention 42.65 (10.17) 44.83 (10.46) 44.94 (10.21)
Control 42.02 (10.73) 42.35 (11.48) 41.93 (11.12)
Mental Component Summary
Intervention 46.25 (11.85) 47.89 (11.47) 45.63 (11.02)
Control 43.50 (12.53) 45.65 (13.32) 46.03 (12.80)
Vitality Scale
Intervention 46.56 (9.42) 49.30 (10.07) 48.07 (9.86)
Control 45.02 (11.01) 46.09 (11.75) 46.66 (11.57)
Social Functioning Scale
Intervention 44.08 (12.20) 45.02 (12.45) 43.42 (10.44)
Control 41.43 (12.05) 42.64 (12.32) 43.29 (12.66)
Role-Emotional Scale
Intervention 44.28 (12.79) 44.66 (13.12) 41.64 (12.74)
Control 41.59 (13.70) 42.38 (14.51) 43.26 (11.95)
Mental Health Scale Intervention 46.61 (10.84) 48.67 (10.47) 46.40 (10.04) Control 44.89 (12.16) 46.68 (12.18) 46.93 (12.66)
Self-Evaluated Transition Itemb
Intervention 3.28 (1.02) 3.53 (0.95) 3.66 (0.98)
Control 3.00 (1.25) 3.25 (1.13) 3.17 (0.99)
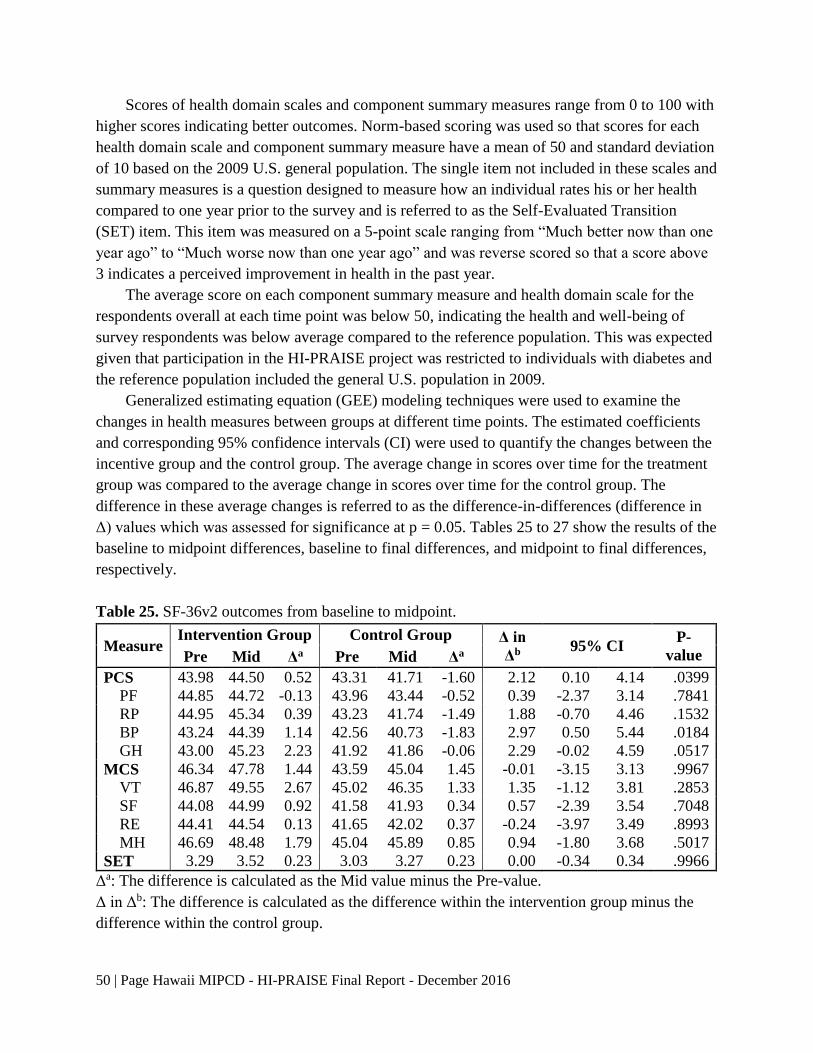
50 | Page Hawaii MIPCD - HI-PRAISE Final Report - December 2016
Scores of health domain scales and component summary measures range from 0 to 100 with
higher scores indicating better outcomes. Norm-based scoring was used so that scores for each
health domain scale and component summary measure have a mean of 50 and standard deviation
of 10 based on the 2009 U.S. general population. The single item not included in these scales and
summary measures is a question designed to measure how an individual rates his or her health
compared to one year prior to the survey and is referred to as the Self-Evaluated Transition
(SET) item. This item was measured on a 5-point scale ranging from “Much better now than one
year ago” to “Much worse now than one year ago” and was reverse scored so that a score above
3 indicates a perceived improvement in health in the past year.
The average score on each component summary measure and health domain scale for the
respondents overall at each time point was below 50, indicating the health and well-being of
survey respondents was below average compared to the reference population. This was expected
given that participation in the HI-PRAISE project was restricted to individuals with diabetes and
the reference population included the general U.S. population in 2009.
Generalized estimating equation (GEE) modeling techniques were used to examine the
changes in health measures between groups at different time points. The estimated coefficients
and corresponding 95% confidence intervals (CI) were used to quantify the changes between the
incentive group and the control group. The average change in scores over time for the treatment
group was compared to the average change in scores over time for the control group. The
difference in these average changes is referred to as the difference-in-differences (difference in
Δ) values which was assessed for significance at p = 0.05. Tables 25 to 27 show the results of the
baseline to midpoint differences, baseline to final differences, and midpoint to final differences,
respectively.
Table 25. SF-36v2 outcomes from baseline to midpoint.
Measure Intervention Group Control Group Δ in
Δb 95% CI
P-
value Pre Mid Δa Pre Mid Δa
PCS 43.98 44.50 0.52 43.31 41.71 -1.60 2.12 0.10 4.14 .0399
PF 44.85 44.72 -0.13 43.96 43.44 -0.52 0.39 -2.37 3.14 .7841
RP 44.95 45.34 0.39 43.23 41.74 -1.49 1.88 -0.70 4.46 .1532
BP 43.24 44.39 1.14 42.56 40.73 -1.83 2.97 0.50 5.44 .0184
GH 43.00 45.23 2.23 41.92 41.86 -0.06 2.29 -0.02 4.59 .0517
MCS 46.34 47.78 1.44 43.59 45.04 1.45 -0.01 -3.15 3.13 .9967
VT 46.87 49.55 2.67 45.02 46.35 1.33 1.35 -1.12 3.81 .2853
SF 44.08 44.99 0.92 41.58 41.93 0.34 0.57 -2.39 3.54 .7048
RE 44.41 44.54 0.13 41.65 42.02 0.37 -0.24 -3.97 3.49 .8993
MH 46.69 48.48 1.79 45.04 45.89 0.85 0.94 -1.80 3.68 .5017
SET 3.29 3.52 0.23 3.03 3.27 0.23 0.00 -0.34 0.34 .9966
Δa: The difference is calculated as the Mid value minus the Pre-value.
Δ in Δb: The difference is calculated as the difference within the intervention group minus the
difference within the control group.
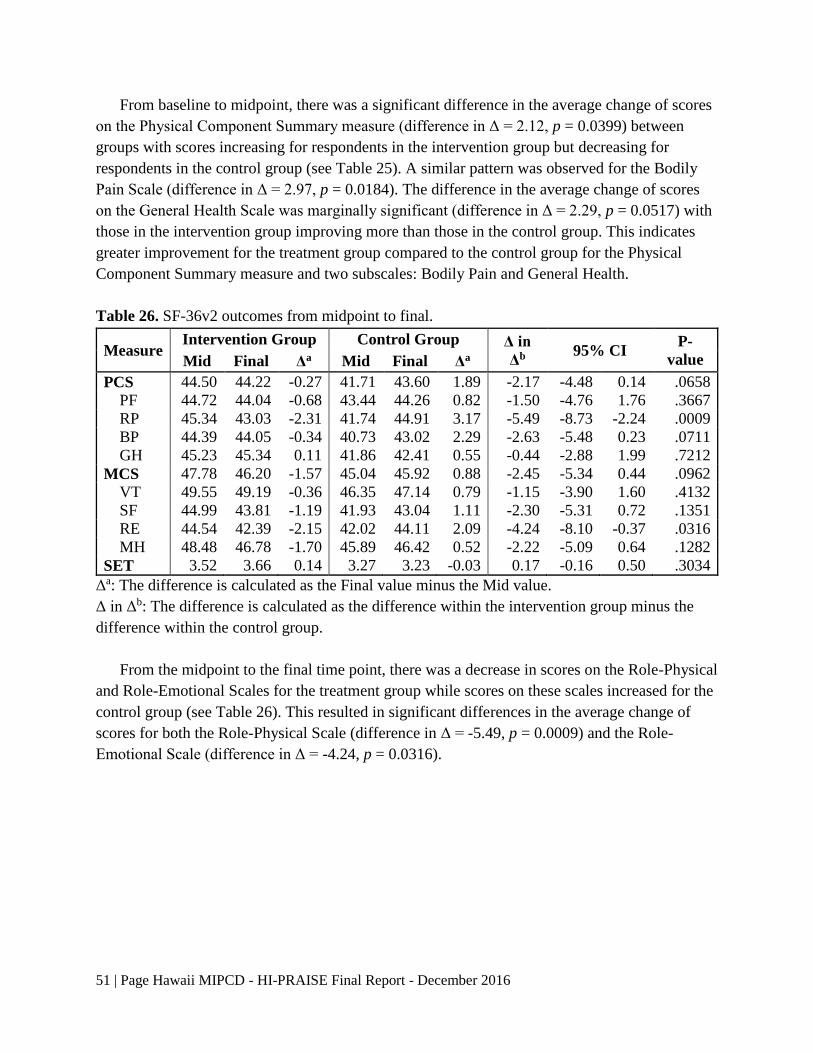
51 | Page Hawaii MIPCD - HI-PRAISE Final Report - December 2016
From baseline to midpoint, there was a significant difference in the average change of scores
on the Physical Component Summary measure (difference in Δ = 2.12, p = 0.0399) between
groups with scores increasing for respondents in the intervention group but decreasing for
respondents in the control group (see Table 25). A similar pattern was observed for the Bodily
Pain Scale (difference in Δ = 2.97, p = 0.0184). The difference in the average change of scores
on the General Health Scale was marginally significant (difference in Δ = 2.29, p = 0.0517) with
those in the intervention group improving more than those in the control group. This indicates
greater improvement for the treatment group compared to the control group for the Physical
Component Summary measure and two subscales: Bodily Pain and General Health.
Table 26. SF-36v2 outcomes from midpoint to final.
Measure Intervention Group Control Group Δ in
Δb 95% CI
P-
value Mid Final Δa Mid Final Δa
PCS 44.50 44.22 -0.27 41.71 43.60 1.89 -2.17 -4.48 0.14 .0658
PF 44.72 44.04 -0.68 43.44 44.26 0.82 -1.50 -4.76 1.76 .3667
RP 45.34 43.03 -2.31 41.74 44.91 3.17 -5.49 -8.73 -2.24 .0009
BP 44.39 44.05 -0.34 40.73 43.02 2.29 -2.63 -5.48 0.23 .0711
GH 45.23 45.34 0.11 41.86 42.41 0.55 -0.44 -2.88 1.99 .7212
MCS 47.78 46.20 -1.57 45.04 45.92 0.88 -2.45 -5.34 0.44 .0962
VT 49.55 49.19 -0.36 46.35 47.14 0.79 -1.15 -3.90 1.60 .4132
SF 44.99 43.81 -1.19 41.93 43.04 1.11 -2.30 -5.31 0.72 .1351
RE 44.54 42.39 -2.15 42.02 44.11 2.09 -4.24 -8.10 -0.37 .0316
MH 48.48 46.78 -1.70 45.89 46.42 0.52 -2.22 -5.09 0.64 .1282
SET 3.52 3.66 0.14 3.27 3.23 -0.03 0.17 -0.16 0.50 .3034
Δa: The difference is calculated as the Final value minus the Mid value.
Δ in Δb: The difference is calculated as the difference within the intervention group minus the
difference within the control group.
From the midpoint to the final time point, there was a decrease in scores on the Role-Physical
and Role-Emotional Scales for the treatment group while scores on these scales increased for the
control group (see Table 26). This resulted in significant differences in the average change of
scores for both the Role-Physical Scale (difference in Δ = -5.49, p = 0.0009) and the Role-
Emotional Scale (difference in Δ = -4.24, p = 0.0316).
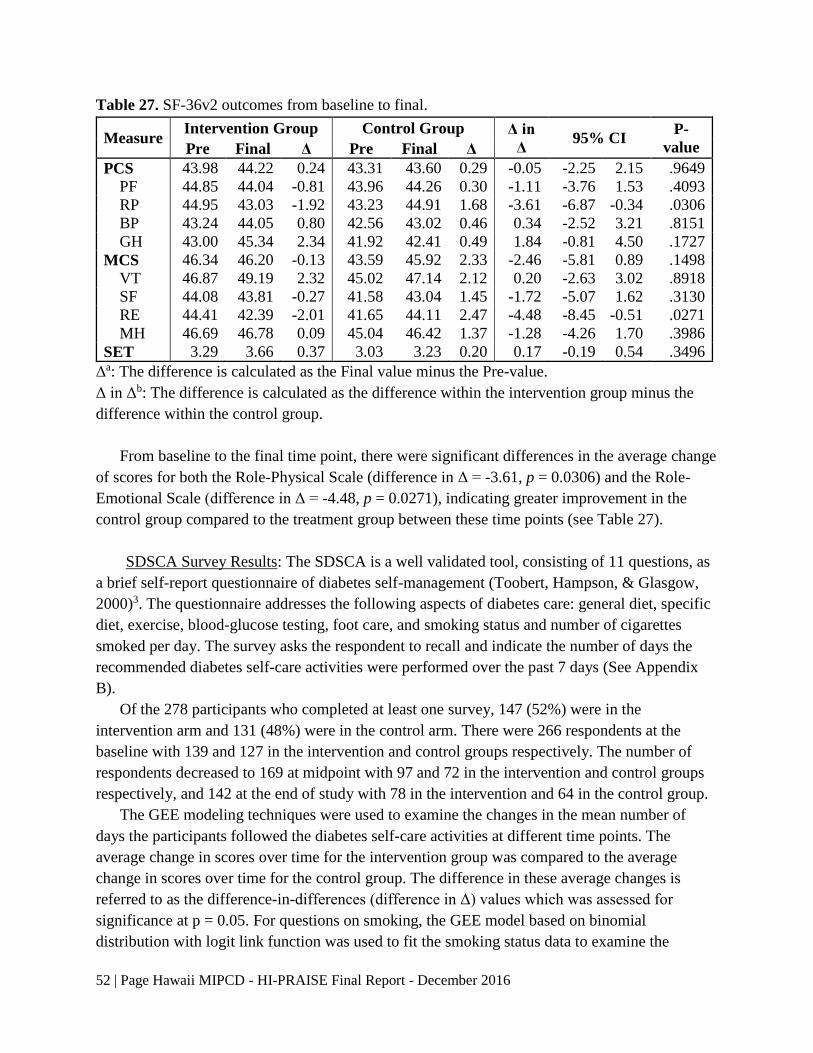
52 | Page Hawaii MIPCD - HI-PRAISE Final Report - December 2016
Table 27. SF-36v2 outcomes from baseline to final.
Measure Intervention Group Control Group Δ in
Δ 95% CI
P-
value Pre Final Δ Pre Final Δ
PCS 43.98 44.22 0.24 43.31 43.60 0.29 -0.05 -2.25 2.15 .9649
PF 44.85 44.04 -0.81 43.96 44.26 0.30 -1.11 -3.76 1.53 .4093
RP 44.95 43.03 -1.92 43.23 44.91 1.68 -3.61 -6.87 -0.34 .0306
BP 43.24 44.05 0.80 42.56 43.02 0.46 0.34 -2.52 3.21 .8151
GH 43.00 45.34 2.34 41.92 42.41 0.49 1.84 -0.81 4.50 .1727
MCS 46.34 46.20 -0.13 43.59 45.92 2.33 -2.46 -5.81 0.89 .1498
VT 46.87 49.19 2.32 45.02 47.14 2.12 0.20 -2.63 3.02 .8918
SF 44.08 43.81 -0.27 41.58 43.04 1.45 -1.72 -5.07 1.62 .3130
RE 44.41 42.39 -2.01 41.65 44.11 2.47 -4.48 -8.45 -0.51 .0271
MH 46.69 46.78 0.09 45.04 46.42 1.37 -1.28 -4.26 1.70 .3986
SET 3.29 3.66 0.37 3.03 3.23 0.20 0.17 -0.19 0.54 .3496
Δa: The difference is calculated as the Final value minus the Pre-value.
Δ in Δb: The difference is calculated as the difference within the intervention group minus the
difference within the control group.
From baseline to the final time point, there were significant differences in the average change
of scores for both the Role-Physical Scale (difference in Δ = -3.61, p = 0.0306) and the Role-
Emotional Scale (difference in Δ = -4.48, p = 0.0271), indicating greater improvement in the
control group compared to the treatment group between these time points (see Table 27).
SDSCA Survey Results: The SDSCA is a well validated tool, consisting of 11 questions, as
a brief self-report questionnaire of diabetes self-management (Toobert, Hampson, & Glasgow,
2000)3. The questionnaire addresses the following aspects of diabetes care: general diet, specific
diet, exercise, blood-glucose testing, foot care, and smoking status and number of cigarettes
smoked per day. The survey asks the respondent to recall and indicate the number of days the
recommended diabetes self-care activities were performed over the past 7 days (See Appendix
B).
Of the 278 participants who completed at least one survey, 147 (52%) were in the
intervention arm and 131 (48%) were in the control arm. There were 266 respondents at the
baseline with 139 and 127 in the intervention and control groups respectively. The number of
respondents decreased to 169 at midpoint with 97 and 72 in the intervention and control groups
respectively, and 142 at the end of study with 78 in the intervention and 64 in the control group.
The GEE modeling techniques were used to examine the changes in the mean number of
days the participants followed the diabetes self-care activities at different time points. The
average change in scores over time for the intervention group was compared to the average
change in scores over time for the control group. The difference in these average changes is
referred to as the difference-in-differences (difference in Δ) values which was assessed for
significance at p = 0.05. For questions on smoking, the GEE model based on binomial
distribution with logit link function was used to fit the smoking status data to examine the
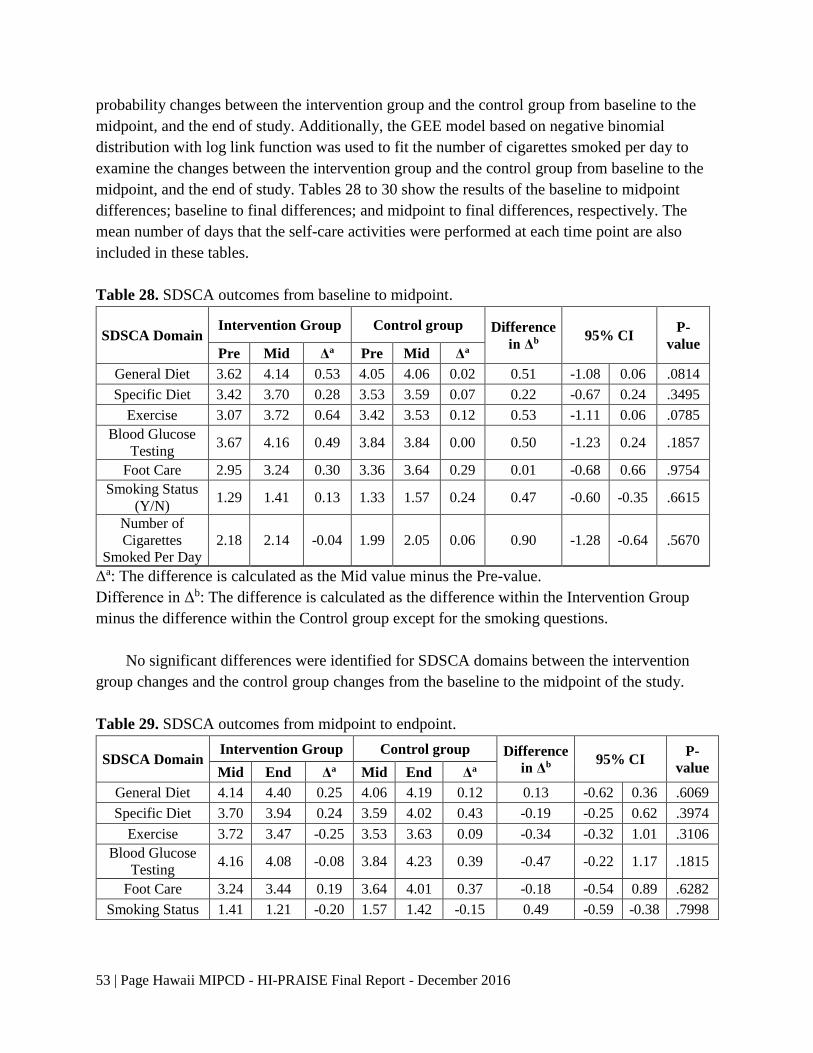
53 | Page Hawaii MIPCD - HI-PRAISE Final Report - December 2016
probability changes between the intervention group and the control group from baseline to the
midpoint, and the end of study. Additionally, the GEE model based on negative binomial
distribution with log link function was used to fit the number of cigarettes smoked per day to
examine the changes between the intervention group and the control group from baseline to the
midpoint, and the end of study. Tables 28 to 30 show the results of the baseline to midpoint
differences; baseline to final differences; and midpoint to final differences, respectively. The
mean number of days that the self-care activities were performed at each time point are also
included in these tables.
Table 28. SDSCA outcomes from baseline to midpoint.
SDSCA Domain Intervention Group Control group Difference
in Δb 95% CI
P-
value Pre Mid Δa Pre Mid Δa
General Diet 3.62 4.14 0.53 4.05 4.06 0.02 0.51 -1.08 0.06 .0814
Specific Diet 3.42 3.70 0.28 3.53 3.59 0.07 0.22 -0.67 0.24 .3495
Exercise 3.07 3.72 0.64 3.42 3.53 0.12 0.53 -1.11 0.06 .0785
Blood Glucose
Testing 3.67 4.16 0.49 3.84 3.84 0.00 0.50 -1.23 0.24 .1857
Foot Care 2.95 3.24 0.30 3.36 3.64 0.29 0.01 -0.68 0.66 .9754
Smoking Status
(Y/N) 1.29 1.41 0.13 1.33 1.57 0.24 0.47 -0.60 -0.35 .6615
Number of
Cigarettes
Smoked Per Day
2.18 2.14 -0.04 1.99 2.05 0.06 0.90 -1.28 -0.64 .5670
Δa: The difference is calculated as the Mid value minus the Pre-value.
Difference in Δb: The difference is calculated as the difference within the Intervention Group
minus the difference within the Control group except for the smoking questions.
No significant differences were identified for SDSCA domains between the intervention
group changes and the control group changes from the baseline to the midpoint of the study.
Table 29. SDSCA outcomes from midpoint to endpoint.
SDSCA Domain Intervention Group Control group Difference
in Δb 95% CI
P-
value Mid End Δa Mid End Δa
General Diet 4.14 4.40 0.25 4.06 4.19 0.12 0.13 -0.62 0.36 .6069
Specific Diet 3.70 3.94 0.24 3.59 4.02 0.43 -0.19 -0.25 0.62 .3974
Exercise 3.72 3.47 -0.25 3.53 3.63 0.09 -0.34 -0.32 1.01 .3106
Blood Glucose
Testing 4.16 4.08 -0.08 3.84 4.23 0.39 -0.47 -0.22 1.17 .1815
Foot Care 3.24 3.44 0.19 3.64 4.01 0.37 -0.18 -0.54 0.89 .6282
Smoking Status 1.41 1.21 -0.20 1.57 1.42 -0.15 0.49 -0.59 -0.38 .7998

54 | Page Hawaii MIPCD - HI-PRAISE Final Report - December 2016
SDSCA Domain Intervention Group Control group Difference
in Δb 95% CI
P-
value Mid End Δa Mid End Δa
Number of
Cigarettes
Smoked Per Day
2.14 2.22 0.08 2.05 2.37 0.32 0.78 -1.46 -0.42 .4397
Δa: The difference is calculated as the End value minus the Mid value.
Difference in Δb: The difference is calculated as the difference within the Intervention Group
minus the difference within the Control group except for the smoking questions.
Similarly, no significant differences were identified for SDSCA domains between the
intervention group changes and the control group changes from the midpoint of the study to the
end of the study.
Table 30. SDSCA outcomes from baseline to endpoint.
SDSCA Domain Intervention Group Control group Difference
in Δb 95% CI
P-
value Pre End Δa Pre End Δa
General Diet 3.62 4.40 0.78 4.05 4.19 0.14 0.64 -1.26 -0.02 .0420
Specific Diet 3.42 3.94 -0.52 3.53 4.02 0.49 0.03 -0.49 0.43 .9029
Exercise 3.07 3.47 -0.39 3.42 3.63 0.21 0.18 -0.77 0.41 .5429
Blood Glucose
Testing 3.67 4.08 -0.41 3.84 4.23 0.39 0.02 -0.84 0.80 .9609
Foot Care 2.95 3.44 -0.49 3.36 4.01 0.66 -0.17 -0.65 0.98 .6897
Smoking Status 1.29 1.21 0.08 1.33 1.42 0.09 0.46 -0.56 -0.36 .4321
Number of
Cigarettes
Smoked Per Day
2.18 2.22 -0.04 1.99 2.37 0.38 0.71 -1.33 -0.38 .2818
Δa: The difference is calculated as the End value minus the Pre-value.
Difference in Δb: The difference is calculated as the difference within the Intervention Group
minus the difference within the Control group except for the smoking questions.
From baseline to end-point, there was a significant difference in the change of average
number of days the recommended general diet was followed (difference in Δ = -0.64, p =
0.0420) when comparing the intervention with the control group, with the average number of
days increasing more dramatically for respondents in the intervention group (3.6 to 4.4 days) but
remaining the same for respondents in the control group (4.1 to 4.2 days).
Satisfaction Survey Results: The purpose of the HI-PRAISE Satisfaction Survey was to
learn about participant satisfaction regarding the project and the use of incentives. The survey
was mailed to the HI- PRAISE participants in the intervention arm by the Kaiser staff at the end
of the study. A total of 77 participants returned the 2015 satisfaction survey. Complete answers
on each survey item were used for analysis and findings are summarized below.

55 | Page Hawaii MIPCD - HI-PRAISE Final Report - December 2016
I. Incentives/Rewards.
All survey respondents in the Kaiser RCT intervention group received rewards. Almost half
of the respondents (46%) used the reward for themselves, 39% of respondents used the reward
for their family, and 12% of respondents indicated that they used the reward for both themselves
and their family. Also, 2 respondents (3%) indicated they wanted to save the reward for later use.
The satisfaction survey wanted to determine how participants felt about the rewards that he
or she might have received from the HI-PRAISE program. Participants were asked to indicate
how much he or she agreed or disagreed with each statement on a four- point Likert scale with 1
indicating strongly disagree and 4 strongly agree. Table 31 summarized the questions asked on
the survey and the results.
Table 31. Percentage of participants indicating levels of agreement and mean scores.
n
Strongly
Agree
(4)
Agree
(3)
Disagree
(2)
Strongly
Disagree
(1)
Mean
(SD)
1. Rewards were given to me
on time. 75 65.3 33.3 1.3 0 3.6 (0.5)
2. Rewards have helped me set
goals and work towards
them.
77 54.5 41.6 3.9 0 3.5 (0.6)
3. Rewards have helped me
make positive changes in
my life.
76 48.7 47.4 3.9 0 3.4 (0.6)
4. I like to be rewarded for
taking good care of my
diabetes.
76 60.5 34.2 5.3 0 3.6 (0.6)
5. Rewards have NOT helped
me keep up with my
diabetes care.
76 10.5 14.5 40.8 34.2 2.0 (1.0)
6. I am happy with the amount
of each reward. 76 53.9 43.4 2.6 0 3.5 (0.6)
7. I am happy with how often I
received the rewards. 76 53.9 39.5 6.6 0 3.5 (0.6)
8. It was easy for me to get the
rewards. 77 51.9 39.0 9.1 0 3.4 (0.7)
9. I was UNABLE to get some
of the rewards. 73 8.2 23.3 46.6 21.9 2.2 (0.9)
10. It was easy for me to use the
rewards. 75 62.7 36.0 1.3 0 3.6 (0.5)
11. The rewards were fair. 77 57.1 42.9 0 0 3.6 (0.5)
Overall 3.4 (0.4)

56 | Page Hawaii MIPCD - HI-PRAISE Final Report - December 2016
Over 90% of Kaiser participants agreed that rewards were given to them on time, helped
them set goals and helped make positive changes in their lives. They liked to be rewarded for
taking good care of their diabetes, and were happy with the amount and frequency of the reward.
Participants found it easy to obtain and use the reward. All participants agreed on the fairness of
the reward. However, nineteen people (25%) stated that the rewards did not help them to keep up
with their diabetes care, and 23 people (=31.5%) agreed that they were unable to earn some of
the rewards.
II. Satisfaction with HI-PRAISE Program
Participants were also asked to indicate their overall satisfaction with the HI-PRAISE
program on a ten-point scale where 10 is the best program possible and 1 is the worst program
possible.
The respondents rated the HI-PRAISE program highly with an average rating of 9.1 on a 10-
point scale. More than half of the respondents (58.7%) considered it the best program possible by
rating the program 10/10. About 78% of survey respondents were very satisfied with HI-PRAISE
program. Over 95% were always or usually able to get the help they wanted from Kaiser Clinic,
with over 77% indicating that they, always or usually were able to contact Kaiser Staff when
they wanted.
III. Program Improvement
Participants were also asked to indicate how strongly they agreed or disagreed with a series
of questions related to their experience with the HI-PRAISE program, providing information for
overall programmatic improvement (See Table 32).
Approximately 17% of the respondents indicated that transportation was a problem in
accessing the healthcare clinics. Approximately 10% of respondents indicated that the location
was not convenient and childcare was a concern.
Table 32. Percentage of participants rating the administration of the HI-PRAISE program.
n
Percentage (%)
Strongly
Agree (4)
Somewhat
Agree (3)
Somewhat
Disagree
(2)
Strongly
Disagree
(1)
1. I had to wait too long to start the
program. 75 1.3 5.3 22.7 70.7
2. The program took too much of my
time. 75 1.3 2.7 20.0 76.0
3. The schedule was not convenient for
me. 74 2.7 4.1 17.6 75.7
4. The location was not convenient for
me. 74 1.4 9.5 14.9 74.3
5. Child care was a problem for me. 63 1.6 7.9 11.1 79.4
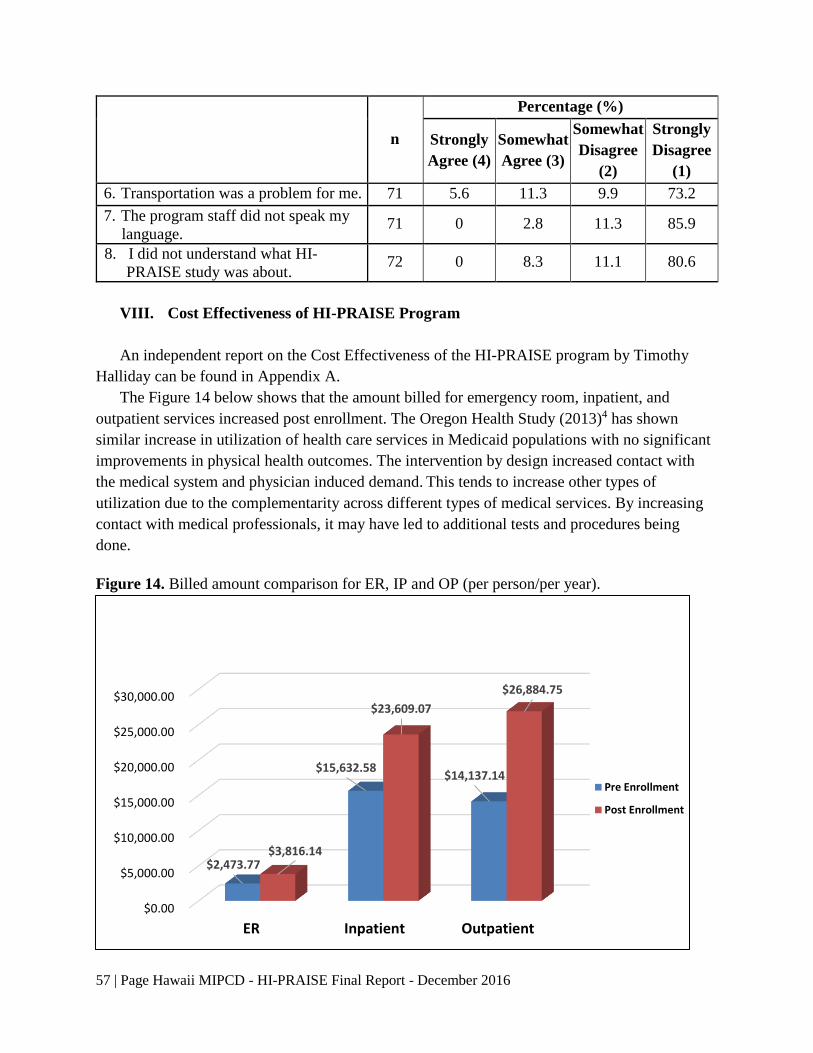
57 | Page Hawaii MIPCD - HI-PRAISE Final Report - December 2016
n
Percentage (%)
Strongly
Agree (4)
Somewhat
Agree (3)
Somewhat
Disagree
(2)
Strongly
Disagree
(1)
6. Transportation was a problem for me. 71 5.6 11.3 9.9 73.2
7. The program staff did not speak my
language. 71 0 2.8 11.3 85.9
8. I did not understand what HI-
PRAISE study was about. 72 0 8.3 11.1 80.6
VIII. Cost Effectiveness of HI-PRAISE Program
An independent report on the Cost Effectiveness of the HI-PRAISE program by Timothy
Halliday can be found in Appendix A.
The Figure 14 below shows that the amount billed for emergency room, inpatient, and
outpatient services increased post enrollment. The Oregon Health Study (2013)4 has shown
similar increase in utilization of health care services in Medicaid populations with no significant
improvements in physical health outcomes. The intervention by design increased contact with
the medical system and physician induced demand. This tends to increase other types of
utilization due to the complementarity across different types of medical services. By increasing
contact with medical professionals, it may have led to additional tests and procedures being
done.
Figure 14. Billed amount comparison for ER, IP and OP (per person/per year).
$0.00
$5,000.00
$10,000.00
$15,000.00
$20,000.00
$25,000.00
$30,000.00
ER Inpatient Outpatient
$2,473.77
$15,632.58 $14,137.14
$3,816.14
$23,609.07
$26,884.75
Pre Enrollment
Post Enrollment
58 | Page Hawaii MIPCD - HI-PRAISE Final Report - December 2016
IX. Lessons Learned and Limitations
HI-PRAISE faced delays in establishing fully executed contracts with DHS, the 9
participating FQHCs and Kaiser Permanente. This led to the further delay in enrollment of
participants into the study. Verification of Medicaid eligibility took additional staff time and
training. For reasons, such as change of address or recent travel, participants were cut off and
needed to reapply for Medicaid. Limited English proficiency and low health literacy were some
of the barriers to reapplying for Medicaid. Participants on and off Medicaid status was a barrier
to distribution of incentives in a timely manner. Compact of Free Association (COFA) migrants
lost their Medicaid eligibility March 1, 2015. This reduced the HI-PRAISE sample size by 38%.
Department of Human Services Medicaid database change of vendor affected the ability to
provide claims data file in a timely fashion.
Competing priorities from patient-centered medical home (PCMH) certification to the roll
out of electronic health records, FQHC staff found their plate overfull, limiting their ability to
fully participate in HI-PRAISE. FQHCs were reimbursed to provide supplemental services for
the project, hire staff, and provide data, health coaching and diabetes education classed.
However, these funds did not directly reimburse or incentivize the providers and health coaches
for their direct efforts. Additional roles and responsibilities on the health coaches besides their
normal duties were a barrier to the distribution of incentives. There were delays in timely
distribution to reinforce good behavior. High staff turnover at the FQHCs demanded ongoing
training on data collection, data entry, motivational interviewing and goal setting. HI-PRAISE
was conducted in the setting of usual care which meant that the providers were the ones to order
the necessary laboratory tests for diabetes based of the American Diabetes Association
guidelines. This led to a high number of missing orders and test results as there were no specific
study visits for HI-PRAISE.
Some of the limitations of our study included the following. The RCT was conducted at
Kaiser Permanente only, not at the FQHCs. Staff at these organizations were over worked and
made to take on another project. It is possible that if HI-PRAISE hired study staff and placed
them at each organization for the duration of the project, enrollment and distribution of the
incentives would have been more streamlined. Unequally spaced intervention period across
participants increased the variability of the outcomes and decreased the power of the study. Loss
of Medicaid eligibility, including managed care organization switch, led to smaller number of
data points analyzed.
Existing PCMH model for diabetes at the FQHCs facilitated the HI-PRAISE project and
conversely, HI-PRAISE project has facilitated the start-up of the PCMH model in some FQHCs.
Health coaching based on intrinsic motivation may facilitate and sustain positive behaviors.
Diabetes education programs and PCMH model for diabetes will continue at the FQHCs. Further
long term studies are needed to better assess the impact of financial incentives to improve
clinical outcomes of diabetes. Overall, the HI-PRAISE project demonstrated that financial
59 | Page Hawaii MIPCD - HI-PRAISE Final Report - December 2016
incentives and health coaching while statistically significant for some biometric measures, were
not effective at reducing costs.
X. Acknowledgements
We are grateful to the patients of the federally qualified health centers and Kaiser
Permanente in Hawaii for participating in HI-PRAISE. Many thanks to the executive teams,
management teams, research teams and health coaches at the federally qualified health centers
and Kaiser Permanente. We appreciate the guidance from our community partners and health
plans who served on the advisory council and evaluation council. We wish to acknowledge the
support received from Hawaii State Department of Human Services, IMPAQ, RTI, Econometrica
and the Centers on Medicaid & Medicare Services throughout the project. Mahalo nui loa to all
the consultants and faculty and staff at the University of Hawaii for your extraordinary time,
expertise and commitment to HI-PRAISE.
60 | Page Hawaii MIPCD - HI-PRAISE Final Report - December 2016
IX. References
1. American Diabetes Association Clinical Guidelines – 2009. Retrieved July 2010 from:
http://care.diabetesjournals.org/content/32/Supplement_1/S13
2. Clinical Guidelines and 2010 Supplement to 2009 clinical guidelines. Retrieved July
2010 from: http://care.diabetesjournals.org/content/33/Supplement_1/S11
3. World Health Organization (WHO). (2016). Body Mass Index- BMI. Retrieved July 2016
from: http://www.euro.who.int/en/health-topics/disease-prevention/nutrition/a-healthy-
lifestyle/body-mass-index-bmi
4. Toobert, DJ, Hampson SE, Glasgow RE. The summary of diabetes self-care activities
measure: results from 7 studies and a revised scale. Diabetes Care. 2000 Jul;23(7):
943-50.
5. Baicker K, Taubman SL, Allen HL, Bernstein M, Gruber JH, Newhouse JP, et al. The
Oregon experiment – effects of Medicaid on clinical outcomes. N Engl J Med. 2013
May;368(18): 1713-1722. [PubMed: 23635051]
XII. Appendices
Appendices are attached as a separate document.