havelock & neil islands – an overview
TRANSCRIPT

MASTER PLAN FOR HAVELOCK AND NEIL ISLANDS Town and Country Planning Unit, APWD
CHAPTER 1
HAVELOCK & NEIL ISLANDS – AN OVERVIEW 1.1 INTRODUCTION
Havelock and Neil are the two beautiful inhabited islands in the archipelago of 556 islands, constituting the Union Territory of Andaman & Nicobar (A & N) Islands. These two islands offer world class attractions for the tourists, which by and large, continue to survive till date in pristine state. Though, beach attraction in Andaman is not limited to these islands, the beaches here are unusual and spectacular, drawing tourists from far off regions of the globe. Popular beaches, abundance of coral deposits, and dense forests define the geographical setting of these islands. The dense forests and vast seas, house a variety of flora and fauna with significant number of species endemic to these islands.
Havelock and Neil Islands are situated at 39 and 36 km., away from Port Blair, the headquarters of the A & N Islands (Map 1). Daily ferry services are available to these islands. In addition, Sea Plane operates between Port Blair and Havelock Island on all days accepting Sundays in a week. As per the 2011 census, Havelock and Neil Islands account for a population of 6315 and 3040 persons respectively.Geographically Havelock Island is six times bigger than Neil Island. The total area of the Havelock Island is 113.93 sq. km., while the Neil Island extend only for 18.9 sq.km. Forests account for sizable extent of land area in both the islands; 95.6 sq. km., at Havelock Island constituting more than 84 % of land and 6.47 sq. km., at Neil Island constituting more than 34 % of the land. Agriculture is the mainstay of the local people both at Havelock and Neil Islands. Forest based activities also provide occupational support at Havelock Islands.
Havelock is emerging as a very popular destination since mid 90’s and about 1000 tourists visit this island every day. The private sector is seen active in Havelock providing accommodation, boarding and transport services. There is a steep increase in the number of lodging houses and resorts constructed in the recent years. Comparatively the tourists to Neil Island are only minimal; on an average only about 300 tourists are visiting this island in a day. Introduction of private cruise boats now bring more tourists to Havelock & Neil islands, and this has also resulted in the increase of lodging and boarding facilities.
Though the size of the local population is small, the growing popularity of these islands in Andaman tourism has brought significant physical development activities in the recent past. These activities if not channelized and regulated could adversely impact the tourism potential of these islands. This Master Plan is to be considered as a tool to promote sustainable tourism in Havelock and Neil Islands, which can benefit the local population and increase the share of tourism sector in the overall economy of the A & N Islands.
This Chapter highlights the existing scenario of Havelock and Neil Islands and analyses the emerging situation in order to arrive at a development strategy as well as a spatial development plan and regulations which are conducive to capitalize the potentials bestowed on these islands by the nature without infringing into the fragile ecological systems, which prevails over these islands.
1

MASTER PLAN FOR HAVELOCK AND NEIL ISLANDS Town and Country Planning Unit, APWD
1.2 LAND
1.2.1 Terrain
Havelock and Neil Islands are only 5 km. apart. However, one has to travel more than 20 km., to reach one island from the other, as boat jetties are located apart in such manner in view of the location of forest lands and coral deposits in the sea. The ferries take about 45 minutes to cover the distance between the islands.
In both the Havelock & Neil Islands, local administration is brought under three gram panchayats, two in Havelock and one in Neil Island. Mild rolling topography, dense mass of canopy trees abruptly raising in the coast to a height of 30 – 40 meters, humid climate and high intensity of rainfall are the characteristics generally associated with Havelock & Neil Islands. Hilly lands are more extensively seen at Havelock Islands, taking away 20 % of the land area in contrast to Neil Island, wherein only little over one percent of the land area is classified as hilly terrain. More than one third of the hilly lands at Havelock Island are situated at Krishnanagar. The land details pertaining to the revenue villages of Havelock and Neil Islands along with the population contained in these villages are presented in Table 1.1 & 1.2 respectively.
Table 1.1 Population and Land details - Havelock Island
Name of the Revenue Village
Population (2011)
Area (ha.)
Total Hilly Land% of Hilly
LandsGovindanagar 2904 359.67 68.15 18.95Vijaynagar 1099 292.06 40.47 13.86Krishnanagar 769 363.24 123.38 33.97Shyamnagar 906 311.14 71.82 23.08Radhanagar 637 391.24 34.81 8.90Havelock Island 6315 1717.35 338.63 19.72
Table 1.2 Population and Land details - Neil Island
Name of the Revenue Village
Population (2011)
Area (ha.) % of Hilly LandsTotal Hilly Land
Neil Kendra 1000 108.31 6.54 6.04Bharatpur 629 187.92 0.15 0.08Sitapur 274 555.44 0.98 0.18Lakshmanpur 382 172.64 7.20 4.17Ramnagar 755 192.07 0.39 0.20Neil Island 3040 1216.38 15.26 1.25
Both the islands are relatively narrow and long in form having vast tracts of forest lands on one side of the islands. The vegetation, coral reef formations surround these islands at many places. While the physiographic character enhances the value of tourism in these islands, it could also pose challenges to the land use planning.
2

MASTER PLAN FOR HAVELOCK AND NEIL ISLANDS Town and Country Planning Unit, APWD
1.2.2 Land Utilization
In addition to the hilly lands contained in the revenue villages of Havelock & Neil Islands, sizable extent of land is under forests. The characteristics of land utilization within the revenue villages of Havelock & Neil Islands are presented in this section. As seen in Table 1.1 & 1.2, the total land area under the jurisdiction of the revenue villages at Havelock & Neil Islands extent to 1717 hectares and 1216 hectares respectively. Despite tourism gaining momentum in these two islands, the land utilization still presents the character of typical agricultural dominant villages of our country.
Agriculture plays an important role occupying more than 70 % of lands both at Havelock and Neil Islands. Nearly 1300 hectares of lands at Havelock Island and 850 hectares of land at Neil Island remain under agriculture use. The proportion of agriculture lands in the revenue villages of Havelock Island vary between 67 % and 85 %. At Neil Island the same range is between 58 % and 89 %. The proportion of agriculture lands is the lowest at Govindanagar (67 %) in Havelock Island, which is mainly because of the presence of boat jetty here. Residential and commercial forms of development are more notable at this revenue village. At Neil Island, Sitapur record the least proportion of agriculture land (58 %), which is due to the fact that more than 40 % of the area at this revenue village is spread under the forest cover. Land use break up details of Havelock & Neil islands are shown Table 1.3 and 1.4 respectively.
In addition to the spread of reserve forests beyond the territories of revenue villages, forests occupy 9 %and 21 % of the land forming part of revenue villages at Havelock & Neil Islands. Thus, even within the revenue area, forests become the second largest occupant of land. However, more than 85 % of forests in the revenue villages of Neil Islands are concentrated only at Sitapur. In Havelock revenue villages, more than one third of the forests are grown at Vijayanagar.
Table 1.3 Land Use Classification for Havelock Island – 2014
Residential developments are limited to 5 % and 4 % only at Havelock and Neil Islands. Govindanagar at Havelock Island and Neil Kendra at Neil Island are the only two revenue villages to exceed 10 % of their land under residential use. The residential use is more prevalent at these places as these two settlements are the entry points for their respective islands, having the presence of boat jetties. It may be noted that
Land Use /Revenue Village
Govindanagar Vijaynagar Krishnanagar Shyamnagar Radhanagar Havelock Island
Area (ha) %
Area (ha) %
Area (ha) %
Area (ha) %
Area (ha) %
Area (ha) %
Residential 37.52 10.43 11.07 3.79 11.01 3.03 16.58 5.33 15.63 3.99 91.80 5.35
Commercial 21.19 5.89 24.43 8.36 0.54 0.15 1.13 0.36 15.78 4.03 63.07 3.67
Industrial 0.00 0.00 0.00 0.00 0.00 0.00 0.41 0.13 0 0.00 0.41 0.03
Public & Semi Pub.
7.04 1.96 7.89 2.70 1.93 0.53 3.07 0.99 4.96 1.27 24.90 1.45
Trans. & Comm. 8.52 2.37 4.57 1.56 5.31 1.46 6.16 1.98 9.30 2.38 33.86 1.97
Recreational 0.92 0.26 0.00 0.00 0.00 0.00 0.00 0.00 0 0.00 0.92 0.05
Agricultural 280.45 77.97 197.08 67.48 307.22 84.58 241.03 77.47 297.83 76.13 1323.61 77.07
Forest 0.00 0.00 46.94 16.07 29.44 8.10 37.81 12.15 43.41 11.09 157.59 9.17
Water Bodies 4.03 1.12 0.08 0.03 7.80 2.15 4.94 1.59 4.33 1.11 21.17 1.23
Total 359.67 100.00 292.06 100.00 363.24 100.00 311.14 100.00 391.24 100.00 1717.35 100.00
3

MASTER PLAN FOR HAVELOCK AND NEIL ISLANDS Town and Country Planning Unit, APWD
nearly half the population of Havelock Island and one third population of Neil Island are concentrated only in the above two settlements.
Table 1.4 Land Use Classification for Neil Island – 2014
Land Use /Revenue Village
Neil Kendra Bharatpur Sitapur Lakshmanpur Ramnagar Neil Island
Area (ha) %
Area (ha) %
Area (ha) %
Area (ha) %
Area (ha) %
Area (ha) %
Residential 15.55 14.35 8.19 4.36 5.34 0.96 2.67 1.55 16.21 8.44 47.95 3.94Commercial 8.79 8.12 0.68 0.36 1.30 0.23 7.94 4.60 2.60 1.35 21.31 1.75Public & Semi Pub. 7.64 7.05 0.79 0.42 0.00 0.00 1.49 0.86 0.38 0.20 10.30 0.85Trans. & Comm. 6.63 6.12 1.59 0.85 0.81 0.15 3.80 2.20 4.26 2.22 17.09 1.40Recreational 1.06 0.97 0.47 0.25 0.33 0.06 0.00 0.00 0.00 0.00 1.86 0.15Agricultural 68.62 63.36 167.86 89.33 324.01 58.33 138.40 80.17 163.12 84.93 862.01 70.87Forest 0.00 0.00 5.44 2.89 223.43 40.23 18.04 10.45 5.51 2.87 252.42 20.75Water Bodies 0.03 0.02 2.90 1.55 0.21 0.04 0.28 0.16 0.01 0.00 3.43 0.28Total 108.31 100.00 187.92 100.00 555.44 100.00 172.64 100.00 192.07 100.00 1216.38 100.00
On an average, about 4 % of the revenue lands at Havelock Island are under commercial use. This percentage is the highest, standing at 8 % in Vijaynagar, wherein most of the hotels and resorts are newly developed. Commercial use is almost negligible at Neil Island, except at Neil Kendra, where the percentage of commercial use is little over 8 %. (Map 2 and Map 3)
1.3 PEOPLE
1.3.1 Population Growth and Size
The population of Havelock Island which was 3681 in the year 1991, had grown upto 6315 by 2011, recording a phenomenal growth of 72 % in two decades. The increasing tourists’ flow to the island, which started in 1990s accelerated the population growth. Radhanagar village where the world famous beach is located, recorded a whopping population growth of 138 % during 1991-2001. The second highest growth (76 %) of population during 1991-2001 was recorded at Vijaynagar, where most of tourists’ accommodation facilities are developed by the private sector. Havelock Island, which experienced a high growth rate of 45 % during 1991-2001, stabilized in the growth in the subsequent decade (2001-11) recording 18 % of growth (Table 1.5). Shyamnagar is one revenue village to witnesshigh growth rates in decades, 1991-2001 and 2001-11. Nearness to Govindanagar and boat jetty, makes it a preferred location for more people to find their homes here. During 2001-11, 961 persons were added to Havelock population; out of this, 798 persons increase (constituting 83 %) was found only at Govindanagar and Shyamnagar.
The population of the Neil Island is 3040 as per the 2011 census (Table 1.6).The growth of tourism which began at Havelock during mid-1990s, was also seen to happen at Neil Island, but at a slower rate and smaller scale. Neil Island population increased by 23 % during the twenty year period 1991-2011, which was 72 % for the Havelock Island. The growth rate which was 16 % during 1991-2001, reduced to 6 % in the subsequent decade 2001-11. Neil Kendra is the revenue village to have more population in the Island, followed by Ramnagar and Bharatpur. 78 % of the Neil Island population is contained in these three villages.
4

MASTER PLAN FOR HAVELOCK AND NEIL ISLANDS Town and Country Planning Unit, APWD
Table 1.5 Population & Growth Rate at Havelock Island
Name of the Revenue Village
Population Growth Rate1991 2001 2011 1991-01 2001-2011 1991-2011
Govindanagar 1823 2419 2904 32.69 20.05 59.30Vijaynagar 564 992 1099 75.89 10.79 94.86Krishnanagar 618 735 769 18.93 4.63 24.43Shyamnagar 418 593 906 41.87 52.78 116.75Radhanagar 258 615 637 138.37 3.58 146.90Havelock Island 3681 5354 6315 45.45 17.95 71.56
Table 1.6 Population & Growth Rate at Neil Island
Name of the Revenue Village
Population Growth Rate1991 2001 2011 1991-01 2001-2011 1991-2011
Neil Kendra 866 1064 1000 22.86 -6.02 15.47Bharatpur 467 564 629 20.77 11.52 34.69Sitapur 248 267 274 7.66 2.62 10.48Lakshmanpur 331 372 382 12.39 2.69 15.41Ramnagar 551 601 755 9.07 25.62 37.02
Neil Island 2463 2868 3040 16.44 6.00 23.43
1.3.2 Density
Gross density of people will be a reflection, not only on the economic character, but also over the quality of life and the environment. But, again the measure of density could be misleading in gauging these elements when more than 85 % of the lands are either under agriculture or forests, as in Havelock & Neil Islands. Therefore, the pattern of concentration of people has been studied on the basis of net densities, arrived as the number of persons living per hectare of residential use lands.
Table 1.7 Net Densities at Havelock & Neil Island - 2014
Name of the Revenue VillageNet Density
(pph)Name of the Revenue Village
Net Density (pph)
Govindanagar 70 Neil Kendra 73Vijaynagar 120 Bharatpur 53Krishnanagar 69 Sitapur 57Shyam Nagar 54 Lakshmanpur 165Radha Nagar 27 Ramnagar 50Havelock Island 62 Neil Island 63
5

MASTER PLAN FOR HAVELOCK AND NEIL ISLANDS Town and Country Planning Unit, APWD
Overall, the net densities at Havelock and Neil are nearly the same. Vijaynagar at Havelock and Lakshmanpur at Neil Island are the two revenue villages, recording high levels of net densities, 120pph and 165 pph respectively. Excepting these two villages and Radhanagar the net densities range in all other places at Havelock and Neil Islands range between 50 pph to 73 pph.Radhanagar is the revenue village, where the net density is the lowest (27 pph).
1.3.3 Sex Ratio, Children Population& Literacy
As per the 2011 Census, the Sex Ratio of the Neil Island is 871, which is the same as the respective index for the South Andaman district. However, Havelock shows proportionately of more male population, recording sex ratio of just 807, mainly attributed to the functional character of the island. Increasing tourism activity add more of male migrants and it is to be noted that the sex ratio at Radhanagar and Vijaynagar, where tourists presence are more felt, areas low as 736 and 775 respectively.
The small villages at Neil Island, like Sitapur & Lakshmanpur where the population is still under 400, show higher sex ratios. At Lakshmanpur, where agriculture is predominant function, the ratio is so high standing at 1146. Details regarding the sex ratio are provided in Table 1.8 and 1.9.
Table 1.8 Details of Literacy, Child Population and Sex Ratio – Havelock Island 2011
Name of the Revenue VillagePercentage of
Sex RatioLiterates 0 – 6 Population
Govindanagar 79.55 10.54 798Vijaynagar 75.16 11.01 775Krishnanagar 69.65 12.36 894Shyam Nagar 81.92 10.92 857Radha Nagar 78.02 8.63 736Havelock Island 77.50 10.74 807
Table 1.9 Details of Literacy, Child Population and Sex Ratio – Neil Island 2011
Name of the Revenue VillagePercentage of
Sex RatioLiterates 0 – 6 Population
Sitapur 76.64 12.04 916Bharatpur 75.52 11.13 797Neil Kendra 76.70 10.90 812Lakshmanpur 74.87 13.61 1146Ram Nagar 75.89 12.58 878
Neil Island 76.02 11.81 871
6

MASTER PLAN FOR HAVELOCK AND NEIL ISLANDS Town and Country Planning Unit, APWD
The population in the age group of 0 -6 is considered as children population. In South Andaman district, the percentage of children population is 10 % while Havelock and Neil Islands account 11 % and 12 % respectively.
The level of literacy is also far below than the corresponding measure for South Andaman district. At South Andaman district 88 % of the population are literates while Havelock and Neil Islands can take the credit only for 78 % and 76 % of the population respectively.
1.4 ECONOMY
Extent of peoples’ participation in economic activities is a broad indicator showing the strength of economy. At Havelock, 37 % of the population is engaged in economic activities as main workers. This measure is one percent higher than percentage of main workers at South Andaman district, wherein both Havelock and Neil islands are located. During the census 2001 and 2011, percentage of main working population (37 %) remained nearly the same at Havelock Island. However, the percentage has significantly come down to 33 % from 40 % at Neil Island which is mainly due to the fact that notable number of workers did not find regular employment both in farm and service sectors, which has brought down the percentage of main workers but significantly increased the percentage of marginal workers.
Traditionally, agriculture & fishing had been the main source of livelihood at Havelock & Neil islands. However, the growth of tourism industry in general and more particular at Havelock Island has started attracting sizable number of tourist population to this picturesque island since late 90’s, which has resulted in gradual shift in the occupational pattern. In the period 2001-11, the number of ‘other workers’(includes mainly tourism related employment) has increased by 527 at Havelock Island. This is to be seen in parallel to the decline in the number of ‘cultivators’ by 160 persons during the same period. Notably Vijaynagar revenue village, where the most of tourist accommodations have been developed in the recent past alone had accounted for decline of 145 cultivators during 2001-11. In terms of percentage, the cultivators have come down from 41 to 28 % while the ‘other workers’ have increased from 55 to 69 % at Havelock Island. Increase in tourism activities has seen manifold increase in land value across Havelock Islands, and cultivators are prompted to discharge their lands for huge onetime benefit.
More than 80 % of employment at Govindanagar, (place of arrival of tourists) and Radhanagar (location of the world famous beach) is sustained only through services rendered to the tourist population. The agricultural dependence in these villages has come down to 17 and 19 % respectively by the year 2011.
Though the development and growth of tourism at Neil Island is visible, the intensity and scale of tourism is much lower in comparison with Havelock Island. Agriculture dependence is seen among 65 %of workers at Neil Island, while the respective measure for Havelock Island is only 30 %. However, it is observed that there is a fast reduction of cultivators is seen at Neil Island. During 2001-11, decline in number of cultivators is higher than Havelock Island, standing at 181. Growth of tourism sector is also not that intense here compared to Havelock Island, resulting in increase of agricultural labourers from 73
7

MASTER PLAN FOR HAVELOCK AND NEIL ISLANDS Town and Country Planning Unit, APWD
to 268. In terms of percentage, the cultivators have come down from 49 to 38 % while the ‘agricultural workers’ have increased from 6 to 27 %.
Table 1.10 Percentage Change in Employment Pattern
2
ParticularHavelock Island Neil Island
(2001) (2011) (2001) (2011)% of Main Workers in total population 36.55 36.80 40.24 33.03% of Cultivators among Main Workers 40.93 27.67 48.61 37.85% of Agri. Labourers among Main Workers 3.57 2.84 6.33 26.69% of Other Workers among Main Workers 55.05 69.15 44.37 35.06% of Marginal Workers in total population 15.63 5.51 4.39 16.84
Table 1.11 Changes in Employment Pattern
3
ParticularHavelock Island Neil Island
(2001) (2011) (2001) (2011)Total Population 5354 6315 2868 3040Main Workers in total population 1962 2324 1154 1004Cultivators among Main Workers 803 643 561 380Agri. Labourers among Main Workers 70 66 73 268Other Workers among Main Workers 1080 1607 512 352Marginal Workers in total population 837 348 126 512
Table 1.12 Occupational Pattern among Main Workers at Havelock Island
Name of the Village
Percentage of
Cultivators Agricultural Labourers
Workers in HouseholdIndustry
Other Workers
2001 2011 2001 2011 2001 2011 2001 2011Govindanagar 19.66 16.80 3.86 1.15 0.57 0.44 75.91 81.61Vijaynagar 69.45 46.34 3.74 4.88 0.88 0.00 25.93 48.78Krishnanagar 60.48 52.26 7.11 4.12 0.00 1.23 32.41 42.39Shyam Nagar 53.37 34.22 0.56 7.97 0.00 0.00 46.07 57.81Radha Nagar 33.67 18.57 0.00 0.36 0.00 0.00 66.33 81.07Havelock Island 40.92 27.67 3.57 2.84 0.46 0.34 55.05 69.15
8

MASTER PLAN FOR HAVELOCK AND NEIL ISLANDS Town and Country Planning Unit, APWD
Table 1.13 Occupational Pattern among Main Workers at Neil Island
Name of the Village
Percentage of
Cultivators Agricultural Labourers
Workers in Household Industry
Other Workers
2001 2011 2001 2011 2001 2011 2001 2011Sitapur 75.65 65.17 2.56 19.10 0.00 0.00 21.79 15.73Bharatpur 46.24 82.36 26.59 5.88 0.00 0.00 27.17 11.76Neil Kendra 17.16 6.86 4.51 38.73 0.00 0.24 78.33 54.17Lakshmanpur 70.86 59.68 2.29 8.87 0.00 0.81 26.85 30.64Ram Nagar 77.89 46.21 0.35 28.41 2.81 0.76 18.95 24.62Neil Island 48.61 37.85 6.33 26.69 0.69 0.40 44.37 35.06
Increase in the number of tourists in the recent years at Neil Island, is yet to create a significant impact in the composition of employment. Sitapur, Bharatpur and Ramnagar still continue to be largely agricultural dependent wherein 75 to 89 % of the main workers function as cultivators or agricultural labourers. Only at Neil Kendra, where the boat jetty is located has more than 50 % of the main workers are supported by non-agricultural activities.
The Study undertaken by the IL&FS on behalf of the Ministry of Tourism, Government of India has identified Port Blair – Neil – Havelock – Little Andaman as the Priority Circuit for development in the A & N Islands.
Havelock is, by far, the most popular island among foreign tourists closely followed by the Neil Island. There are three beach attractions bringing visitors to the island, each at Havelock and Neil Islands namely Kalapatthar, Elephanta and Radhanagar beaches at Havelock and Bharatpur, Lakshmanpur and Sitapur beaches at Neil. The beaches at Neil Island are equally absorbing as the ones at Havelock, as they are much quieter and feel secluded. The famous Radhanagar Beach at Havelock was voted by Time Magazine as one of the Asia’s most beautiful beaches in the year 2004.
1.5 SERVICES
1.5.1 Water Supply
Havelock and Neil Islands depend largely on rainwater. A check dam constructed across the Krishnanagar Nallah is the major source of water at Havelock Island with the total water availability of 0.59 MLD. Water from this source is pumped to treatment plant at Shyamnagar and then supplied to public through public taps. Radhanagar and Bamboo Nallah are the two other minor water sources with the capacities of 0.30 MLD and 0.12 MLD of water respectively. Hotels and Resorts use underground water. Water is supplied to the residents on alternate days. Dug wells are the only water resource for Neil Island with a yield of 0.18 MLD of water.
9
MASTER PLAN FOR HAVELOCK AND NEIL ISLANDS Town and Country Planning Unit, APWD
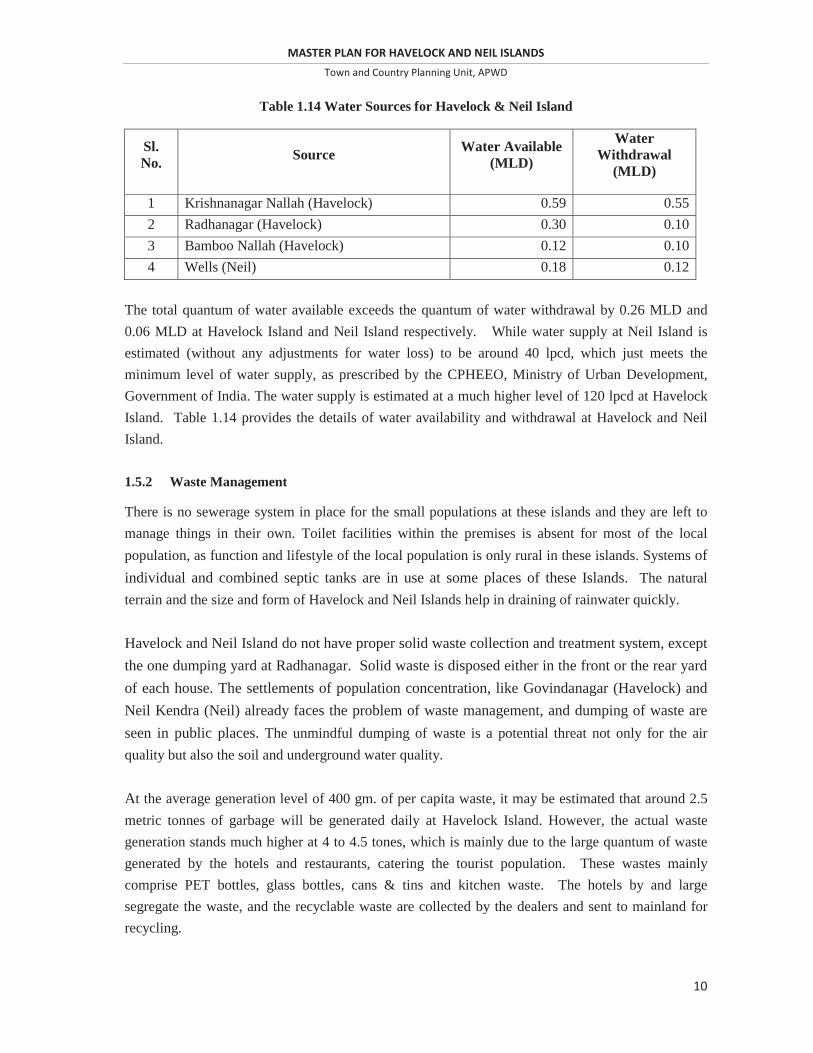
Table 1.14 Water Sources for Havelock & Neil Island
Sl. No. Source Water Available
(MLD)
Water Withdrawal
(MLD)
1 Krishnanagar Nallah (Havelock) 0.59 0.552 Radhanagar (Havelock) 0.30 0.103 Bamboo Nallah (Havelock) 0.12 0.104 Wells (Neil) 0.18 0.12
The total quantum of water available exceeds the quantum of water withdrawal by 0.26 MLD and 0.06 MLD at Havelock Island and Neil Island respectively. While water supply at Neil Island is estimated (without any adjustments for water loss) to be around 40 lpcd, which just meets the minimum level of water supply, as prescribed by the CPHEEO, Ministry of Urban Development, Government of India. The water supply is estimated at a much higher level of 120 lpcd at Havelock Island. Table 1.14 provides the details of water availability and withdrawal at Havelock and Neil Island.
1.5.2 Waste Management
There is no sewerage system in place for the small populations at these islands and they are left to manage things in their own. Toilet facilities within the premises is absent for most of the local population, as function and lifestyle of the local population is only rural in these islands. Systems of individual and combined septic tanks are in use at some places of these Islands. The natural terrain and the size and form of Havelock and Neil Islands help in draining of rainwater quickly.
Havelock and Neil Island do not have proper solid waste collection and treatment system, exceptthe one dumping yard at Radhanagar. Solid waste is disposed either in the front or the rear yardof each house. The settlements of population concentration, like Govindanagar (Havelock) and Neil Kendra (Neil) already faces the problem of waste management, and dumping of waste are seen in public places. The unmindful dumping of waste is a potential threat not only for the air quality but also the soil and underground water quality.
At the average generation level of 400 gm. of per capita waste, it may be estimated that around 2.5 metric tonnes of garbage will be generated daily at Havelock Island. However, the actual waste generation stands much higher at 4 to 4.5 tones, which is mainly due to the large quantum of waste generated by the hotels and restaurants, catering the tourist population. These wastes mainly comprise PET bottles, glass bottles, cans & tins and kitchen waste. The hotels by and large segregate the waste, and the recyclable waste are collected by the dealers and sent to mainland for recycling.
10

MASTER PLAN FOR HAVELOCK AND NEIL ISLANDS Town and Country Planning Unit, APWD
1.6 SOCIAL INFRASTRUCTURE & OTHER FACILITIES
Educational facilities are provided by the Administration upto the level of Higher Secondary education both at Havelock & Neil Islands. Only for higher education, the students need to move out of the islands. The detail of the educational institutions available is furnished in Table 1.15.
Table 1.15 Details of Educational Facilities at Havelock & Neil Island
Sl. No. Source Havelock Island Neil Island
1 Primary School 4 12 Middle School 1 13 Senior Secondary School 1 1
Table 1.16 Details of Health Facilities at Havelock & Neil Island
Sl. No. Source Havelock Island Neil Island
1 Primary Health Centre 1 12 Sub Centre 2 13 Doctors 1 14 Nurses / Midwives / LHVs 9 75 Para Medical Staff 21 176 Bed Strength 10 10
Table 1.17 Details of Other Facilities at Havelock & Neil Island
Sl. No. Source Havelock Island Neil Island
1 Sub Post Office 1 12 ED Branch Post Office 2 23 Co-operative Bank 1 14 Fire Station 1 15 Police Station 1 1
Basic health care facilities are also provided by the Administration satisfactorily. Generally, the accessibility & availability of the educational and health institutions are adequate. However, the emergency & specialized patient care facilities are totally absent, which acts as a deterrent for tourism development. The detail of healthcare facilities and other facilities available are provided in Table 1.16 and 1.17 respectively.
11


494000
494000
496000
496000
498000
498000
500000
500000
502000
502000
1322
000
1322
000
1324
000
1324
000
1326
000
1326
000
1328
000
1328
000
1330
000
1330
000
Shyamnagar
Radhanagar
Krishnanagar
Govindanagar
Vijayanagar
HAVELOCK AND NEIL ISLANDS
Andaman Public Works DepartmentA & N Administration, Port Blair
School of Architecture & PlanningAnna University Chennai
CONSULTANTS
CLIENT
HAVELOCK DATEJUNE 2014
0 400 800 1,200 1,600 2,000200Meters
HAVELOCK ISLAND
APWD
PROJECTION SYSTEM : UTMDATUM : WGS84SPHEROID : WGS84ZONE : 46
EXISTING LANDUSE 2014 - HAVELOCK ISLANDMASTER PLAN FOR HAVELOCK AND NEIL ISLANDS -2034
LEGEND
Transport & Communication
Industrial
Water bodies
Other Forest
LPA Boundary
Village Boundary
Survey Boundary
RoadsMangroves
Reserved Forest
AN
DA
MA
N S
EA
RESERVED FOREST
RESERVED FOREST
±
AN
DA
MA
N S
EA
Town and Country Planning Unit
Residential
Recreational
Agricultural
Commercial
Public & Semi-Public
ISLAND NAME


P
P
P
P
Hel ip ad
La xma n pu r Be ac h No 2
La xma n pu r Be ac h No 1
Sen io r Sec o nd a ry Sc h oo l
501500 .000000
501500 .000000
503000 .000000
503000 .000000
504500 .000000
504500 .000000
506000 .000000
506000 .000000
507500 .000000
507500 .000000
1304
500.0
0000
0
1304
500.0
0000
0
1306
000.0
0000
0
1306
000.0
0000
0
1307
500.0
0000
0
1307
500.0
0000
0
1309
000.0
0000
0
1309
000.0
0000
0
1310
500.0
0000
0
1310
500.0
0000
0
Sitanagar
Ramnagar
Bharathpur
Laxmanpur
Neilkendra
HAVELOCK AND NEIL ISLANDS
Andaman Public Works DepartmentA & N Administration, Port Blair
School of Architecture & PlanningAnna University Chennai
CONSULTANTS
CLIENT
ISLAND NAME
NEIL DATEJune 2014
0 290 580 870 1,160 1,450145Meters
NEIL ISLAND
APWD
PROJECTION SYSTEM : UTMDATUM : WGS84SPHEROID : WGS84ZONE : 46
EXISTING LANDUSE 2014 - NEIL ISLANDMASTER PLAN FOR HAVELOCK AND NEIL ISLANDS -2034
LEGEND
LPA Boundary
Village Boundary
Roads
Reserved Forest
ANDAMAN SEA
ANDAMAN SEA
±
ANDAMAN SEA
Residential
Recreational
Agricultural
Commercial
Public & Semi-Public
Transport & Communication
Water bodies
Other Forest
Mangroves
JETTY