hardwoods distribution inc. 2011...hardwoods distribution inc. (“hardwoods” or “the...
TRANSCRIPT
HARDWOODS DISTRIBUTION INC.
2011 Annual Report
To Shareholders
Hardwoods Distribution Inc. | 2011 | Annual Report 1
Hardwoods Distribution Inc.
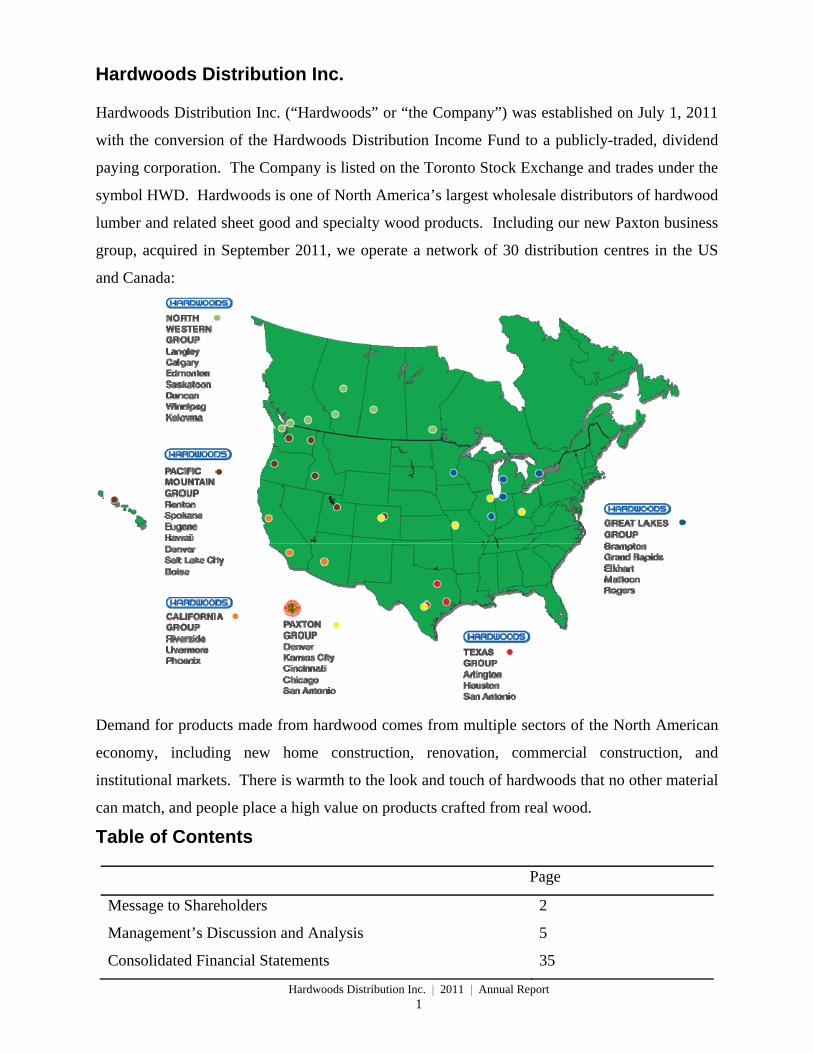
Hardwoods Distribution Inc. (“Hardwoods” or “the Company”) was established on July 1, 2011
with the conversion of the Hardwoods Distribution Income Fund to a publicly-traded, dividend
paying corporation. The Company is listed on the Toronto Stock Exchange and trades under the
symbol HWD. Hardwoods is one of North America’s largest wholesale distributors of hardwood
lumber and related sheet good and specialty wood products. Including our new Paxton business
group, acquired in September 2011, we operate a network of 30 distribution centres in the US
and Canada:
Demand for products made from hardwood comes from multiple sectors of the North American
economy, including new home construction, renovation, commercial construction, and
institutional markets. There is warmth to the look and touch of hardwoods that no other material
can match, and people place a high value on products crafted from real wood.
Table of Contents
Page
Message to Shareholders 2
Management’s Discussion and Analysis 5
Consolidated Financial Statements 35
Hardwoods Distribution Inc. | 2011 | Annual Report 2
To Our Shareholders
We achieved profitable growth in 2011 as we pursued our business strategy, investing in new
markets, products and sales personnel, and improving results from our existing operations.
Our acquisition of the Frank Paxton Lumber Company on September 19, 2011 was a highlight of
the year and is already proving accretive. Paxton is a respected remanufacturer and distributor of
premium hardwood lumber, millwork and architectural sheet goods, with five US branches located
in Chicago, Cincinnati, Denver, Kansas City and San Antonio. These branches also provide custom
architectural millwork predominantly to commercial and institutional customers. During the three
and a half months we operated this business in 2011, Paxton contributed revenues of $13.6 million
and a net positive EBITDA contribution of $0.2 million, even after accounting for $0.2 million of
transaction costs.
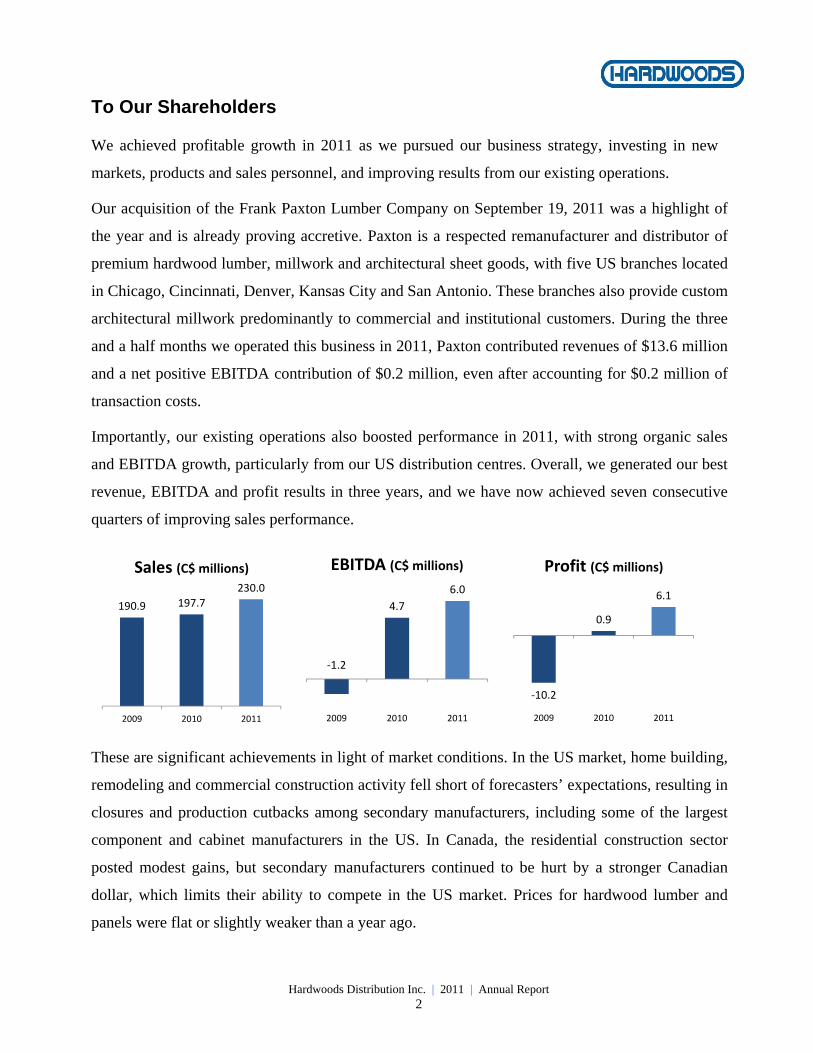
Importantly, our existing operations also boosted performance in 2011, with strong organic sales
and EBITDA growth, particularly from our US distribution centres. Overall, we generated our best
revenue, EBITDA and profit results in three years, and we have now achieved seven consecutive
quarters of improving sales performance.
These are significant achievements in light of market conditions. In the US market, home building,
remodeling and commercial construction activity fell short of forecasters’ expectations, resulting in
closures and production cutbacks among secondary manufacturers, including some of the largest
component and cabinet manufacturers in the US. In Canada, the residential construction sector
posted modest gains, but secondary manufacturers continued to be hurt by a stronger Canadian
dollar, which limits their ability to compete in the US market. Prices for hardwood lumber and
panels were flat or slightly weaker than a year ago.
190.9 197.7
230.0
2009 2010 2011
Sales (C$ millions)
‐1.2
4.7
6.0
2009 2010 2011
EBITDA (C$ millions)
‐10.2
0.9
6.1
2009 2010 2011
Profit (C$ millions)
Hardwoods Distribution Inc. | 2011 | Annual Report 3
Our improving financial performance in the midst of lackluster market conditions provides clear
evidence that our business strategy is working. Launched in late 2010, our strategy focuses on three
key objectives:
Increasing Our End-Market Diversification - We are actively targeting the commercial and
institutional construction markets as we work to achieve greater end-market diversification.
Customers in these sectors make significant use of hardwood in applications ranging from office,
restaurant, school and hospital interiors, to hotel lobbies, and retail point-of-purchase displays.
They have also been generally less affected by the economic downturn than residential
construction customers, reflecting the different dynamics in these markets.
During 2011, we fine-tuned our product offering and hired experienced sales representatives to
help us build our customer base. The Paxton acquisition provided further momentum by bringing
us an established base of commercial and institutional construction customers, along with a line
of architectural millwork products and capabilities targeted to them. As a result of our strategies,
commercial accounts represented the majority of new accounts opened during the year and were
an important contributor to our sales growth.
Leveraging Our Import Program - Hardwoods boasts one of the most successful lines of import
products in the industry thanks to a long-term strategy of identifying top-notch manufacturers,
working closely with them to create high-quality, differentiated products, branding these
products, and providing strong support for them. As an example, our line of Dragon Ply plywood
has built a reputation for quality, consistency and exceptional value, and attracts an ever-larger
following of customers each year. During 2011, we continued to grow our import sales as we
introduced our proprietary products to existing and new customers, including customers of the
Paxton business. We also continued to refine our import program with the addition of new
vendors and improved freight routes.
Expanding Into High-Potential Geographic Markets - We were successful in identifying and
making our move into larger North American markets that have significant growth potential, but
where we previously had little or no representation. Thanks to the Paxton acquisition we have
gained a strong presence in Kansas City, Cincinnati and Chicago, all of which have a sizeable base
of secondary manufacturers, and we have expanded our presence in San Antonio and Denver. In
other regions, our success in attracting industry experienced sales staff within high potential
geographic markets is also helping us win additional market share and contributing to our stronger
results.
Hardwoods Distribution Inc. | 2011 | Annual Report 4
Looking Ahead
Moving into 2012, we expect to continue improving our performance as we fully integrate the
Paxton business and begin to expand our presence in our new geographic and end-use markets.
While our outlook on market conditions remains cautious, we are confident of our ability to grow
our business with added market share.
Financially, the Company is in excellent shape with a conservative financial position at the end of
2011 and $21 million of unused debt capacity available to finance future growth. Having
completed our conversion to a corporation, we are also able to move forward under a more
simplified business structure.
Overall our future looks promising. We have demonstrated that we can grow and succeed in
challenging conditions and when a sustained economic recovery takes hold, we believe we will be
well positioned to capitalize on it.
Based on our improving performance and our positive outlook, our Directors initiated a quarterly
dividend in 2011, declaring total dividends of $0.04 per share in the second half of the year. Since
the year end we have declared an additional quarterly dividend of $0.02 per share to be paid on
April 30, 2012, to unitholders of record on April 20, 2012. It is a real pleasure to be providing this
tangible return to you, our investors. We thank you for your continued confidence in Hardwoods,
and we look forward to continuing to reward your trust in us in the year ahead.
Lance R. Blanco
President and Chief Executive Officer
Hardwoods Distribution Inc. | 2011 | Annual Report 5
Management’s Discussion and Analysis March 9, 2012
This management’s discussion and analysis (“MD&A”) has been prepared by Hardwoods
Distribution Inc. (“HDI” or the “Company”), formerly Hardwoods Distribution Income Fund
(the “Fund”), as of March 9, 2012. This MD&A should be read in conjunction with the audited
consolidated financial statements and accompanying notes (“Audited Financial Statements”) of
the Company for the years ended December 31, 2011 and 2010. Results are reported in
Canadian dollars unless otherwise stated, and have been prepared in accordance with
International Financial Reporting Standards (“IFRS”), including IFRS 1 “First Time Adoption of
IFRS.” For comparative purposes, all financial amounts related to the quarters ended March 31,
2010, June 30, 2010, September 30, 2010, and for the quarter and year ended December 31,
2010, have been restated in accordance with IFRS. For additional information, readers should
also refer to our Annual Information Form and other information filed on www.sedar.com.
In this MD&A, references to “EBITDA” are to earnings before interest, income taxes,
depreciation and amortization, where interest is defined as net finance costs as per the
consolidated statement of comprehensive income. In addition to profit or loss, we consider
EBITDA to be a useful supplemental measure of a company’s ability to meet debt service and
capital expenditure requirements, and we interpret trends in EBITDA as an indicator of relative
operating performance.
EBITDA is not an earnings measure recognized by IFRS and does not have a standardized
meaning prescribed by IFRS. Investors are cautioned that EBITDA should not replace profit or
loss or cash flows (as determined in accordance with IFRS) as an indicator of our performance.
Our method of calculating EBITDA may differ from the methods used by other issuers.
Therefore, our EBITDA may not be comparable to similar measures presented by other issuers.
For a reconciliation between EBITDA and profit or loss as determined in accordance with IFRS,
please refer to the discussion of Results of Operations described in section 3.0 of this report.
Hardwoods Distribution Inc. | 2011 | Annual Report 6
This MD&A includes the following sections:
1.0 Executive Summary
1.1 Overview
1.2 Outlook
2.0 Background
2.1 Company Overview
2.2 Business and Industry Overview
3.0 Results of Operations
3.1 Years Ended December 31, 2011 and December 31, 2010
3.2 Three Month Periods Ended December 31, 2011 and December 31, 2010
4.0 Selected Financial Information and Seasonality
4.1 Quarterly Financial Information
4.2 Annual Financial Information
5.0 Liquidity and Capital Resources
5.1 Cash Flows from Operating, Investing and Financing Activities
5.2 Working Capital
5.3 Revolving Credit Facilities and Debt Management Strategy
5.4 Contractual Obligations
5.5 Off-Balance Sheet Arrangements
5.6 Financial Instruments
5.7 Share Data
5.8 Dividends
6.0 Related Party Transactions
7.0 Critical Accounting Estimates and Adoption of Changes in Accounting Policies
7.1 Critical Accounting Estimates
7.2 Adoption of New Accounting Standards
8.0 Risks and Uncertainties
9.0 Disclosure Controls and Procedures and Internal Control over Financial Reporting
10.0 Note Regarding Forward Looking Information
Hardwoods Distribution Inc. | 2011 | Annual Report 7
1.0 Executive Summary
1.1 Overview
The 2011 fiscal year brought a number of significant developments for Hardwoods, including our
conversion from an income trust to a publicly traded corporation. The conversion was undertaken
in response to changes to the taxation of income trusts which became effective January 1, 2011
and which made the income trust form of structure less advantageous for us. Concurrent with this
move, we acquired the former non-controlling interest in our business at a discounted exchange
ratio of 0.3791 common shares per exchangeable unit held by the non-controlling interest.
Moving forward as Hardwoods Distribution Inc., we now own 100% of our underlying operating
businesses, compared to 80% previously, and we are now operating with a corporate structure we
believe is more beneficial for our shareholders in the long term.
Following our conversion to a corporation, our Directors instituted a quarterly dividend based on
our improving financial performance and our positive outlook for the business. We declared
dividends of $0.02 per share in the third and fourth quarters, and have since declared a dividend
of $0.02 per share to be paid on April 30, 2012, to unitholders of record on April 20, 2012.
On September 19, 2011 we acquired the assets of the Frank Paxton Lumber Company (“Paxton”)
for $13.7 million. Paxton is a leading remanufacturer and distributor of premium hardwood
lumber, millwork and architectural sheet goods, with five branches located in Chicago Illinois,
Cincinnati Ohio, Denver Colorado, Kansas City Missouri and San Antonio Texas. The
acquisition supported our business strategy by providing an immediate entry into three high-
potential geographic markets where we did not previously have a presence, and by increasing our
access to commercial and institutional markets through Paxton’s expertise in architectural
millwork. In addition, we have gained an expanded customer base for our existing lines of high-
quality import products.
We financed the Paxton acquisition entirely with debt, taking advantage of our strong balance
sheet to maximize accretion for our shareholders. Our financial position remains conservative
even after making these changes with $66.8 million of net current assets financed by just $19.8
million of bank indebtedness at December 31, 2011. In May 2011, we renewed and extended the
term of our revolving credit facility in the United States, and concurrent with the Paxton
acquisition we increased the maximum available borrowing to US$30 million. In December
Hardwoods Distribution Inc. | 2011 | Annual Report 8
2011, we renewed and extended the term of our $15 million revolving credit facility in Canada.
In both cases, we negotiated better rates and more flexible covenants.
Market conditions remained challenging in 2011 with a stronger Canadian dollar reducing the
value of our US sales and continued weakness in the US economy limiting growth in hardwood
demand. While combined single family and multi-family housing starts in the US climbed 3.4%
to 606,900 starts in 2011, this was below industry expectations. The US non-residential
construction sector had a weak start to the year, but ultimately posted modest gains on a year-
over-year basis. However, remodeling activity declined as persistently high unemployment and
concerns about the economy weakened consumer confidence. Secondary wood products
manufacturers continued to be impacted by the weakness in demand, and many cabinet and wood
component companies scaled back production during the year.
In Canada, market demand remained relatively flat in 2011, with modest growth in residential
housing starts partially offset by weak demand from secondary manufacturers
On the supply side, hardwood lumber production climbed approximately 7.1% in the first half of
2011 according to the Hardwood Lumber Review, before falling off in the second half as weak
demand failed to support the increased production levels. On average, pricing for hardwood
lumber was flat to slightly weaker in 2011 compared to 2010, while pricing for panel products
was predominantly flat.
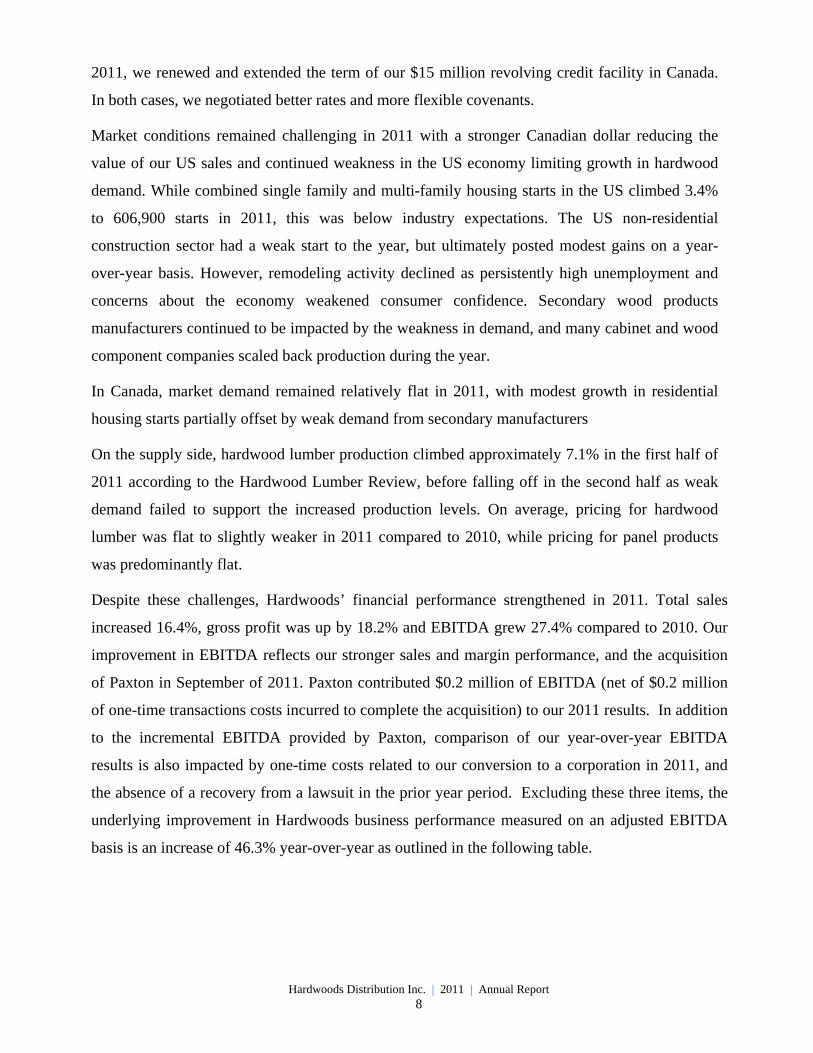
Despite these challenges, Hardwoods’ financial performance strengthened in 2011. Total sales
increased 16.4%, gross profit was up by 18.2% and EBITDA grew 27.4% compared to 2010. Our
improvement in EBITDA reflects our stronger sales and margin performance, and the acquisition
of Paxton in September of 2011. Paxton contributed $0.2 million of EBITDA (net of $0.2 million
of one-time transactions costs incurred to complete the acquisition) to our 2011 results. In addition
to the incremental EBITDA provided by Paxton, comparison of our year-over-year EBITDA
results is also impacted by one-time costs related to our conversion to a corporation in 2011, and
the absence of a recovery from a lawsuit in the prior year period. Excluding these three items, the
underlying improvement in Hardwoods business performance measured on an adjusted EBITDA
basis is an increase of 46.3% year-over-year as outlined in the following table.
Hardwoods Distribution Inc. | 2011 | Annual Report 9
Given the weakness in market conditions, we believe most of our sales and EBITDA gains can be
attributed to successful implementation of our business strategy. Our strategy focuses on
increasing our end-market diversification with a stronger focus on the commercial and institutional
construction markets; leveraging our import program to grow sales and build market share; and
increasing our market share in larger, high-potential geographic markets.
Consistent with our practice of continually reviewing and optimizing our branch network, we
closed our satellite branch in Red Deer, Alberta in December 2011. Sales personnel from the Red
Deer branch were reassigned to our other branches and we are continuing service to customers in
the Red Deer market through our existing branches in Edmonton and Calgary.
1.2 Outlook
Looking forward, we anticipate that the North American economy will continue to experience a
slow recovery with very gradual improvement in the US residential construction markets and
moderately stronger gains in non-residential construction markets. In Canada, growth in the
domestic economy shows signs of slowing as global economic events reduce consumer
confidence and the stronger Canadian dollar negatively impacts secondary manufacturers.
Accordingly we anticipate only modest improvement from this market in 2012.
Given our expectation of continuing weak market conditions, we will continue to rely on our
market expansion strategy to achieve growth and enhance profits. Specifically we will seek to:
Further strengthen our presence in the commercial and institutional construction
markets, including leveraging Paxton’s products and capabilities to make a broader
range of products available to customers in these sectors.
Leverage our successful import program by continuing to seek out attractive new
products and introducing our branded lines of import products to Paxton’s base of
customers.
Selected Unaudited Consolidated Financial Information Year ended Year ended
(in thousands of dollars) December 31, December 31, $ Increase % Increase
2011 2011 (Decrease) (Decrease)
EBITDA as reported 5,969$ 4,687$ 1,282$ 27.4%
Add (deduct):
Corporate conversion expenses 571 -
Proceeds received from litigation settlement - (320)
Paxton EBITDA, net of one-time acquisition transaction costs (151) -
Adjusted EBITDA 6,389$ 4,367$ 2,022$ 46.3%
Hardwoods Distribution Inc. | 2011 | Annual Report 10
Solidify and further expand our presence in the large and promising new geographic
markets we have entered via the Paxton acquisition, as well as target additional growth
in selected existing markets.
We anticipate that operating expenses will increase further in 2012 as we implement our market
expansion strategies, support increased sales activity and integrate the Paxton business. Key
priorities in 2012 will be to complete the integration of the Paxton operations and to continue
executing our business strategy, while tightly managing the business. We will also continue to
seek out acquisition opportunities that further increase shareholder value.
Hardwoods Distribution Inc. | 2011 | Annual Report 11
2.0 Background
2.1 Company Overview
Hardwoods Distribution Inc. is a publicly traded company that holds, indirectly, a 100%
ownership interest in Hardwoods Specialty Products LP and Hardwoods Specialty Products US
LP (collectively, “Hardwoods” or the “Business”). The Company was formed in order to
convert Hardwoods Distribution Income Fund (the “Fund”) from an income trust structure to a
corporation. The Fund was converted to a corporation by way of a plan of arrangement effective
July 1, 2011.
Pursuant to the conversion, all outstanding units of the Fund held by unitholders were exchanged
for common shares of Hardwoods Distribution Inc. on a one-for-one basis. All of the Class B
limited partner units in the Fund’s operating subsidiaries, which represented a 20% equity
interest in Hardwoods and were held by the former owners of the Business, were exchanged for
common shares of Hardwoods Distribution Inc. on the basis of 0.3793 common shares per Class
B limited partner unit. As a result of these arrangements, Hardwoods Distribution Inc. owns
100% of Hardwoods, whereas previously the Fund owned 80% of the Business. The Fund has
been wound up into HDI. Hardwoods Distribution Inc. is listed on the Toronto Stock Exchange
and trades under the symbol HWD.
2.2 Business and Industry Overview
Serving customers for over 50 years, Hardwoods is one of North America’s largest distributors
of high-grade hardwood lumber and specialty sheet goods to the cabinet, moulding, millwork,
furniture and specialty wood products industries. At December 31, 2011 we operated 30
distribution facilities located in 16 states and 5 provinces throughout North America. To
maximize inventory management, we utilize a hub and spoke distribution system, with major
hub distribution centres holding the bulk of our inventory and making regular truck transfers to
replenish stock in satellite distribution centres that are located in smaller markets.
Approximately 40% of our product mix is made up of high-grade hardwood lumber. The
balance is made up of sheet goods and other specialty products, including hardwood plywood
and non-structural sheet goods such as medium-density fiberboard, particleboard and melamine-
coated stock. Our sheet goods and lumber are complementary product lines that are key products
used by our customers in the manufacture of their end-use products.
Hardwoods Distribution Inc. | 2011 | Annual Report 12
Our role in the industry is to provide the critical link between mills that manufacture large
volumes of hardwood lumber and sheet goods, and industrial customers that require smaller
quantities of many different hardwood products for their own manufacturing processes. We
provide a means for hundreds of hardwood mills to get their product to thousands of small-to-
mid-sized industrial manufacturers. We add value to our suppliers by buying their product in
volume and paying them promptly, effectively acting as their third-party sales force. We add
value for our customers by providing them with the materials they need on a just-in-time basis,
remanufacturing materials to customer specifications where required, selling in smaller
quantities and offering a wider range of product selection than the customer would be able to
purchase directly from an individual mill. We also provide an important source of financing for
our customers by allowing them to buy material from us on approved credit.
Our customer base manufactures a range of end-use products, such as cabinetry, furniture and
custom millwork. These products in turn are sold into multiple sectors of the economy,
including new home construction, renovation, non-residential construction and institutional
markets. As a result of this diversity, it is difficult to determine with certainty what proportion of
our products ends up in each sector of the economy. We estimate at least 50% of our products
are used in new residential construction, in the form of cabinets, mouldings, custom finishing,
and home furniture. We believe the balance of our products end up in other sectors of the
economy not associated with new residential construction, such as home renovations, finishing
millwork for office buildings, restaurant and bar interiors, hotel lobbies, retail point-of-purchase
displays, schools, hospitals, custom motor coaches, yacht interiors and other specialty areas.
The majority of the hardwood lumber distributed in North America is harvested from North
American hardwood forests, located principally in the Eastern United States, and is milled by
hundreds of small mills. Imported hardwood lumber is largely limited to specialty species that
generally do not compete with domestic hardwood lumber. Sheet goods are generally produced
in North America by large manufacturers using domestic hardwoods and other materials,
although imported hardwood plywood volumes have been increasing. Both domestic and
imported hardwood lumber and plywood are distributed principally by third parties such as us.
Historically, balanced supply and demand conditions have resulted in a stable pricing
environment for hardwood lumber and hardwood plywood. More recently, global economic
conditions and weaker US housing markets have resulted in supply/demand imbalances and
greater variability in product pricing.
Hardwoods Distribution Inc. | 2011 | Annual Report 13
The North American economy is currently experiencing a sluggish recovery after a significant
economic downturn in housing and construction, which are key markets for the hardwood
products that we distribute. However, current levels of housing and construction activity in
North America are low relative to expected longer-term population and housing trends, and we
believe that when a sustained economic recovery takes hold, prospects for our industry are
attractive.
Hardwoods Distribution Inc. | 2011 | Annual Report 14
3.0 Results of Operations
3.1Years Ended December 31, 2011 and December 31, 2010
Sales
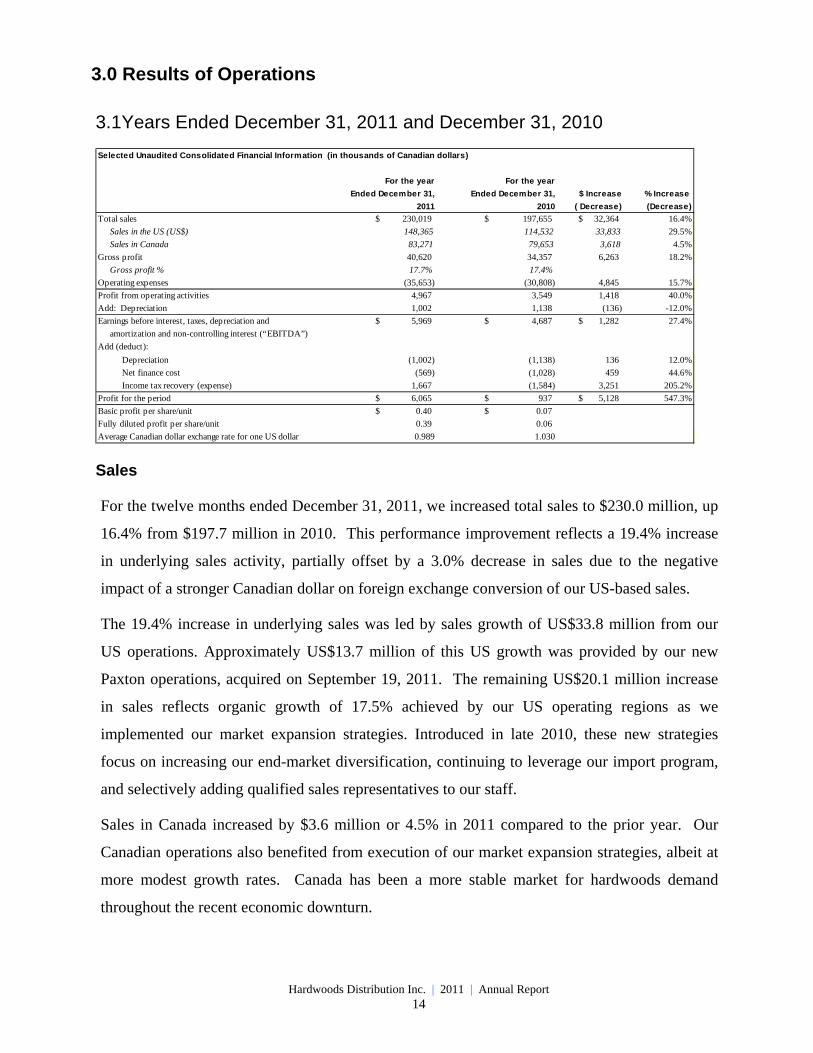
For the twelve months ended December 31, 2011, we increased total sales to $230.0 million, up
16.4% from $197.7 million in 2010. This performance improvement reflects a 19.4% increase
in underlying sales activity, partially offset by a 3.0% decrease in sales due to the negative
impact of a stronger Canadian dollar on foreign exchange conversion of our US-based sales.
The 19.4% increase in underlying sales was led by sales growth of US$33.8 million from our
US operations. Approximately US$13.7 million of this US growth was provided by our new
Paxton operations, acquired on September 19, 2011. The remaining US$20.1 million increase
in sales reflects organic growth of 17.5% achieved by our US operating regions as we
implemented our market expansion strategies. Introduced in late 2010, these new strategies
focus on increasing our end-market diversification, continuing to leverage our import program,
and selectively adding qualified sales representatives to our staff.
Sales in Canada increased by $3.6 million or 4.5% in 2011 compared to the prior year. Our
Canadian operations also benefited from execution of our market expansion strategies, albeit at
more modest growth rates. Canada has been a more stable market for hardwoods demand
throughout the recent economic downturn.
Selected Unaudited Consolidated Financial Information (in thousands of Canadian dollars)
$ Increase % Increase
2011 2010 ( Decrease) (Decrease)
Total sales 230,019$ 197,655$ 32,364$ 16.4%
Sales in the US (US$) 148,365 114,532 33,833 29.5%
Sales in Canada 83,271 79,653 3,618 4.5%
Gross profit 40,620 34,357 6,263 18.2%
Gross profit % 17.7% 17.4%
Operating expenses (35,653) (30,808) 4,845 15.7%
Profit from operating activities 4,967 3,549 1,418 40.0%
1,002 1,138 (136) -12.0%
5,969$ 4,687$ 1,282$ 27.4%
amortization and non-controlling interest (“EBITDA”)
Add (deduct):
Depreciation (1,002) (1,138) 136 12.0%
Net finance cost (569) (1,028) 459 44.6%
Income tax recovery (expense) 1,667 (1,584) 3,251 205.2%
Profit for the period 6,065$ 937$ 5,128$ 547.3%
Basic profit per share/unit 0.40$ 0.07$
Fully diluted profit per share/unit 0.39 0.06
Average Canadian dollar exchange rate for one US dollar 0.989 1.030
Earnings before interest, taxes, depreciation and
Add: Depreciation
For the year
Ended December 31,
For the year
Ended December 31,
Hardwoods Distribution Inc. | 2011 | Annual Report 15
Gross Profit
Gross profit for the year ended December 31, 2011 was $40.6 million, an increase of $6.3
million, or 18.2%, from $34.4 million in 2010. The improvement in gross profit primarily
reflects the higher sales, but also the achievement of a higher gross profit margin during 2011.
As a percentage of sales, gross profit increased to 17.7%, compared to 17.4% in 2010, reflecting
product mix changes and lower inventory writedowns in 2011 compared to 2010. We view a
gross profit margin of 17% to 18% as appropriate given competitive conditions at this point in
the business cycle.
Operating Expenses
Operating expenses were $35.7 million in 2011, compared to $30.8 million the prior year, an
increase of $4.8 million. The higher operating costs reflect an additional $2.6 million in
operating costs from the acquired Paxton operations, $1.9 million in increased personnel and
other operating costs incurred to support our market expansion strategies, and $0.8 million in
non-recurring transactions costs related to our conversion to a corporation and our acquisition of
Paxton. In addition, a $0.3 million litigation expense recovery that was received in the 2010
period was not repeated in the 2011 period. The increase in costs was partially offset by the $0.8
million positive impact of a stronger Canadian dollar on the conversion of expenses at our US
operations. As a percentage of sales, 2011 operating expenses were 15.5% of sales, compared to
15.6% in 2010.
EBITDA
For the year ended December 31, 2011, we recorded EBITDA of $6.0 million, an increase of
$1.3 million, or 27.4%, from $4.7 million in 2010. The increase in EBITDA reflects the $6.3
million increase in gross profit, partially offset by the $4.9 million increase in operating expenses
before depreciation.
Excluding the impact of the Paxton acquisition and some non-recurring items (as outlined in
section 1.1 of this report), adjusted EBITDA increased to $6.4 million in 2011 compared to $4.4
million in 2010, a 46.3% improvement in our underlying business performance.
Hardwoods Distribution Inc. | 2011 | Annual Report 16
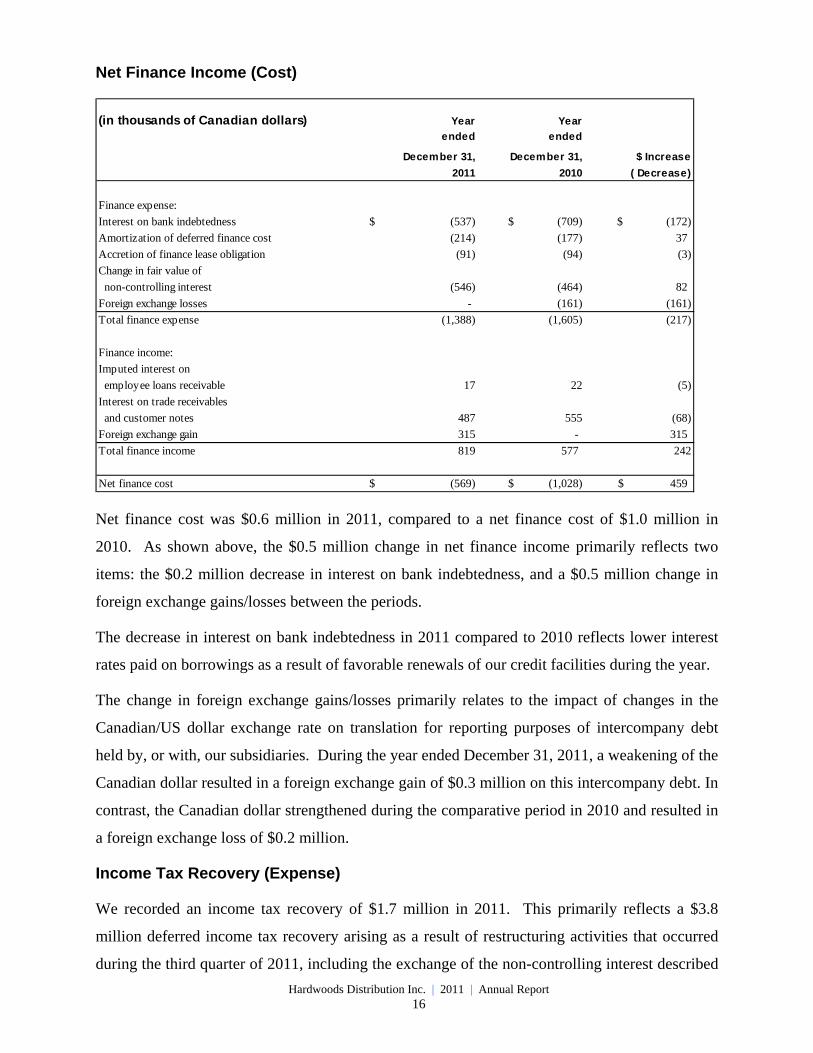
Net Finance Income (Cost)
Net finance cost was $0.6 million in 2011, compared to a net finance cost of $1.0 million in
2010. As shown above, the $0.5 million change in net finance income primarily reflects two
items: the $0.2 million decrease in interest on bank indebtedness, and a $0.5 million change in
foreign exchange gains/losses between the periods.
The decrease in interest on bank indebtedness in 2011 compared to 2010 reflects lower interest
rates paid on borrowings as a result of favorable renewals of our credit facilities during the year.
The change in foreign exchange gains/losses primarily relates to the impact of changes in the
Canadian/US dollar exchange rate on translation for reporting purposes of intercompany debt
held by, or with, our subsidiaries. During the year ended December 31, 2011, a weakening of the
Canadian dollar resulted in a foreign exchange gain of $0.3 million on this intercompany debt. In
contrast, the Canadian dollar strengthened during the comparative period in 2010 and resulted in
a foreign exchange loss of $0.2 million.
Income Tax Recovery (Expense)
We recorded an income tax recovery of $1.7 million in 2011. This primarily reflects a $3.8
million deferred income tax recovery arising as a result of restructuring activities that occurred
during the third quarter of 2011, including the exchange of the non-controlling interest described
(in thousands of Canadian dollars) Year Year
ended ended
December 31, December 31, $ Increase
2011 2010 ( Decrease)
Finance expense:
Interest on bank indebtedness (537)$ (709)$ (172)$
Amortization of deferred finance cost (214) (177) 37
Accretion of finance lease obligation (91) (94) (3)
Change in fair value of
non-controlling interest (546) (464) 82
Foreign exchange losses - (161) (161)
Total finance expense (1,388) (1,605) (217)
Finance income:
Imputed interest on
employee loans receivable 17 22 (5)
Interest on trade receivables
and customer notes 487 555 (68)
Foreign exchange gain 315 - 315
Total finance income 819 577 242
Net finance cost (569)$ (1,028)$ 459$
Hardwoods Distribution Inc. | 2011 | Annual Report 17
in section 2.1 of this report and financing transactions undertaken as part of the Paxton
acquisition. This was partially offset by a $1.9 million utilization of future tax assets to offset
taxable income generated during the period, and by $0.2 million of current income tax expense
incurred during the year.
In the comparative 2010 period, we recorded an income tax expense of $1.6 million, primarily
reflecting the use of future tax assets to offset taxable income generated during the period.
Profit for the Period
Profit increased to $6.1 million in 2011, from $0.9 million in 2010. This $5.1 million
improvement reflects the $1.3 million increase in EBITDA, a $0.1 million decrease in
depreciation, a $0.5 million decrease in net finance cost, and the $3.3 million increase in income
tax recovery.
Hardwoods Distribution Inc. | 2011 | Annual Report 18
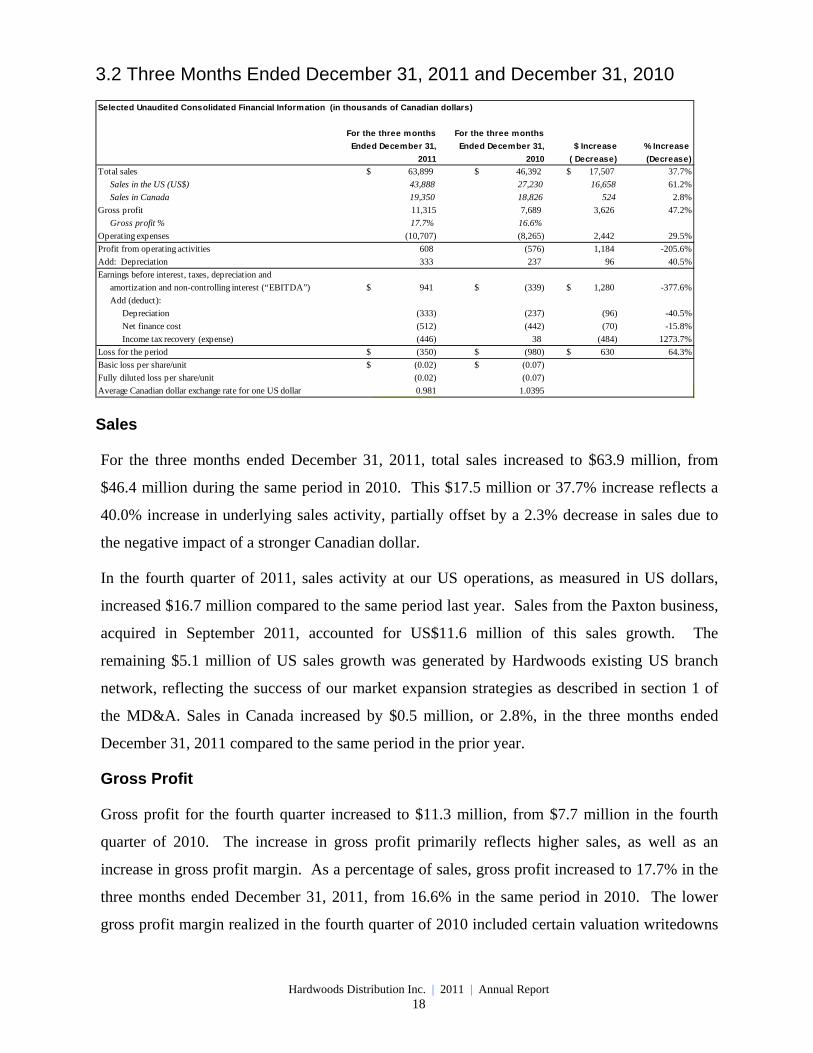
3.2 Three Months Ended December 31, 2011 and December 31, 2010
Sales
For the three months ended December 31, 2011, total sales increased to $63.9 million, from
$46.4 million during the same period in 2010. This $17.5 million or 37.7% increase reflects a
40.0% increase in underlying sales activity, partially offset by a 2.3% decrease in sales due to
the negative impact of a stronger Canadian dollar.
In the fourth quarter of 2011, sales activity at our US operations, as measured in US dollars,
increased $16.7 million compared to the same period last year. Sales from the Paxton business,
acquired in September 2011, accounted for US$11.6 million of this sales growth. The
remaining $5.1 million of US sales growth was generated by Hardwoods existing US branch
network, reflecting the success of our market expansion strategies as described in section 1 of
the MD&A. Sales in Canada increased by $0.5 million, or 2.8%, in the three months ended
December 31, 2011 compared to the same period in the prior year.
Gross Profit
Gross profit for the fourth quarter increased to $11.3 million, from $7.7 million in the fourth
quarter of 2010. The increase in gross profit primarily reflects higher sales, as well as an
increase in gross profit margin. As a percentage of sales, gross profit increased to 17.7% in the
three months ended December 31, 2011, from 16.6% in the same period in 2010. The lower
gross profit margin realized in the fourth quarter of 2010 included certain valuation writedowns
Selected Unaudited Consolidated Financial Information (in thousands of Canadian dollars)
$ Increase % Increase
2011 2010 ( Decrease) (Decrease)
Total sales $ 63,899 $ 46,392 17,507$ 37.7%
Sales in the US (US$) 43,888 27,230 16,658 61.2%
Sales in Canada 19,350 18,826 524 2.8%
Gross profit 11,315 7,689 3,626 47.2%
Gross profit % 17.7% 16.6%
Operating expenses (10,707) (8,265) 2,442 29.5%
Profit from operating activities 608 (576) 1,184 -205.6%
333 237 96 40.5%
amortization and non-controlling interest (“EBITDA”) $ 941 $ (339) 1,280$ -377.6%
Add (deduct):
Depreciation (333) (237) (96) -40.5%
Net finance cost (512) (442) (70) -15.8%
Income tax recovery (expense) (446) 38 (484) 1273.7%
Loss for the period $ (350) $ (980) 630$ 64.3%
Basic loss per share/unit $ (0.02) $ (0.07)
Fully diluted loss per share/unit (0.02) (0.07)
Average Canadian dollar exchange rate for one US dollar 0.981 1.0395
Earnings before interest, taxes, depreciation and
For the three months For the three months
Ended December 31, Ended December 31,
Add: Depreciation
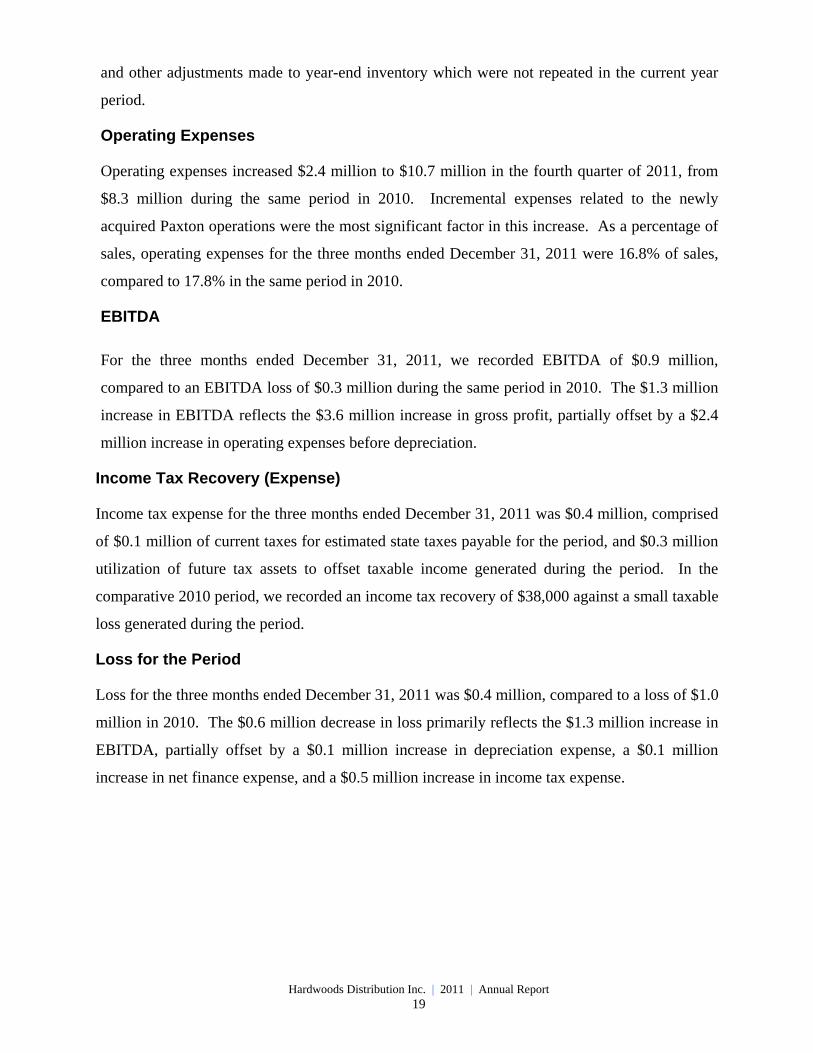
Hardwoods Distribution Inc. | 2011 | Annual Report 19
and other adjustments made to year-end inventory which were not repeated in the current year
period.
Operating Expenses
Operating expenses increased $2.4 million to $10.7 million in the fourth quarter of 2011, from
$8.3 million during the same period in 2010. Incremental expenses related to the newly
acquired Paxton operations were the most significant factor in this increase. As a percentage of
sales, operating expenses for the three months ended December 31, 2011 were 16.8% of sales,
compared to 17.8% in the same period in 2010.
EBITDA
For the three months ended December 31, 2011, we recorded EBITDA of $0.9 million,
compared to an EBITDA loss of $0.3 million during the same period in 2010. The $1.3 million
increase in EBITDA reflects the $3.6 million increase in gross profit, partially offset by a $2.4
million increase in operating expenses before depreciation.
Income Tax Recovery (Expense)
Income tax expense for the three months ended December 31, 2011 was $0.4 million, comprised
of $0.1 million of current taxes for estimated state taxes payable for the period, and $0.3 million
utilization of future tax assets to offset taxable income generated during the period. In the
comparative 2010 period, we recorded an income tax recovery of $38,000 against a small taxable
loss generated during the period.
Loss for the Period
Loss for the three months ended December 31, 2011 was $0.4 million, compared to a loss of $1.0
million in 2010. The $0.6 million decrease in loss primarily reflects the $1.3 million increase in
EBITDA, partially offset by a $0.1 million increase in depreciation expense, a $0.1 million
increase in net finance expense, and a $0.5 million increase in income tax expense.
Hardwoods Distribution Inc. | 2011 | Annual Report 20
4.0 Selected Financial Information and Seasonality
4.1 Quarterly Financial Information
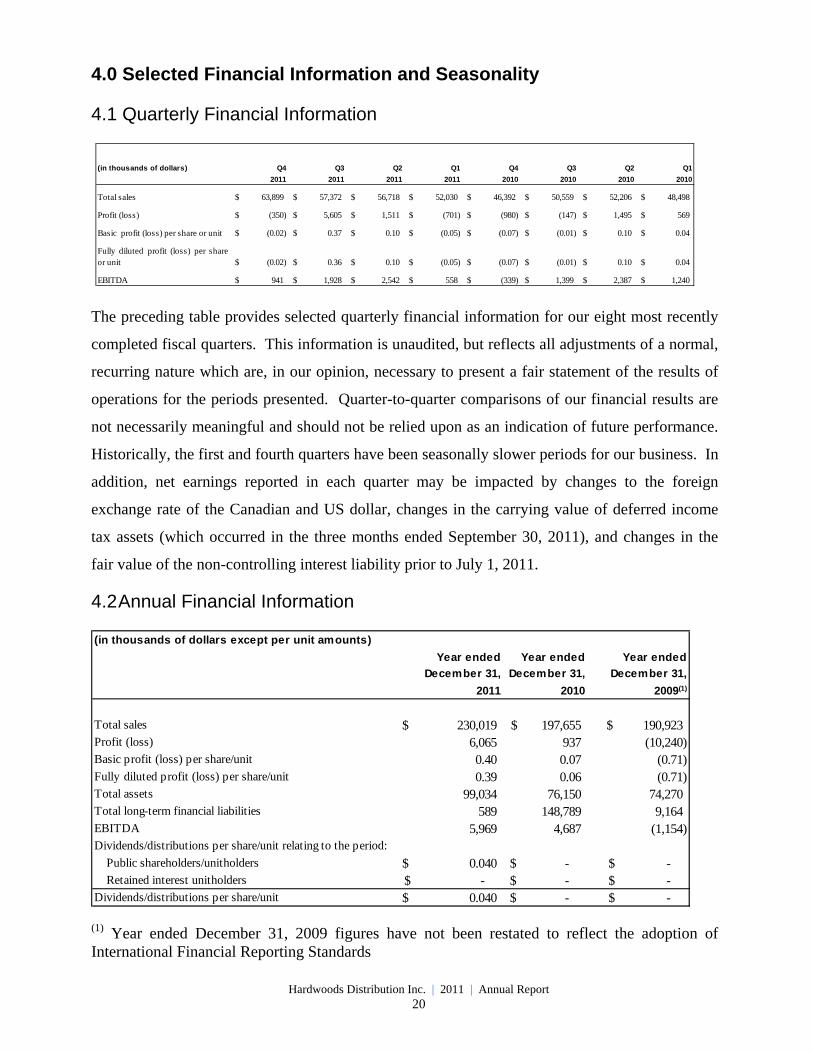
The preceding table provides selected quarterly financial information for our eight most recently
completed fiscal quarters. This information is unaudited, but reflects all adjustments of a normal,
recurring nature which are, in our opinion, necessary to present a fair statement of the results of
operations for the periods presented. Quarter-to-quarter comparisons of our financial results are
not necessarily meaningful and should not be relied upon as an indication of future performance.
Historically, the first and fourth quarters have been seasonally slower periods for our business. In
addition, net earnings reported in each quarter may be impacted by changes to the foreign
exchange rate of the Canadian and US dollar, changes in the carrying value of deferred income
tax assets (which occurred in the three months ended September 30, 2011), and changes in the
fair value of the non-controlling interest liability prior to July 1, 2011.
4.2 Annual Financial Information
(1) Year ended December 31, 2009 figures have not been restated to reflect the adoption of International Financial Reporting Standards
(in thousands of dollars) Q4 Q3 Q2 Q1 Q4 Q3 Q2 Q1
2011 2011 2011 2011 2010 2010 2010 2010
Total sales 63,899$ 57,372$ 56,718$ 52,030$ 46,392$ 50,559$ 52,206$ 48,498$
Profit (loss) (350)$ 5,605$ 1,511$ (701)$ (980)$ (147)$ 1,495$ 569$
Basic profit (loss) per share or unit (0.02)$ 0.37$ 0.10$ (0.05)$ (0.07)$ (0.01)$ 0.10$ 0.04$
Fully diluted profit (loss) per shareor unit (0.02)$ 0.36$ 0.10$ (0.05)$ (0.07)$ (0.01)$ 0.10$ 0.04$
EBITDA 941$ 1,928$ 2,542$ 558$ (339)$ 1,399$ 2,387$ 1,240$
(in thousands of dollars except per unit amounts)
Year ended Year ended Year ended
December 31, December 31, December 31,
2011 2010 2009(1)
Total sales 230,019$ 197,655$ 190,923$ Profit (loss) 6,065 937 (10,240) Basic profit (loss) per share/unit 0.40 0.07 (0.71) Fully diluted profit (loss) per share/unit 0.39 0.06 (0.71) Total assets 99,034 76,150 74,270 Total long-term financial liabilities 589 148,789 9,164 EBITDA 5,969 4,687 (1,154) Dividends/distributions per share/unit relating to the period:
Public shareholders/unitholders 0.040$ -$ -$ Retained interest unitholders -$ -$ -$ Dividends/distributions per share/unit 0.040$ -$ -$
Hardwoods Distribution Inc. | 2011 | Annual Report 21
5.0 Liquidity and Capital Resources
5.1 Cash Flows from Operating, Investing and Financing Activities
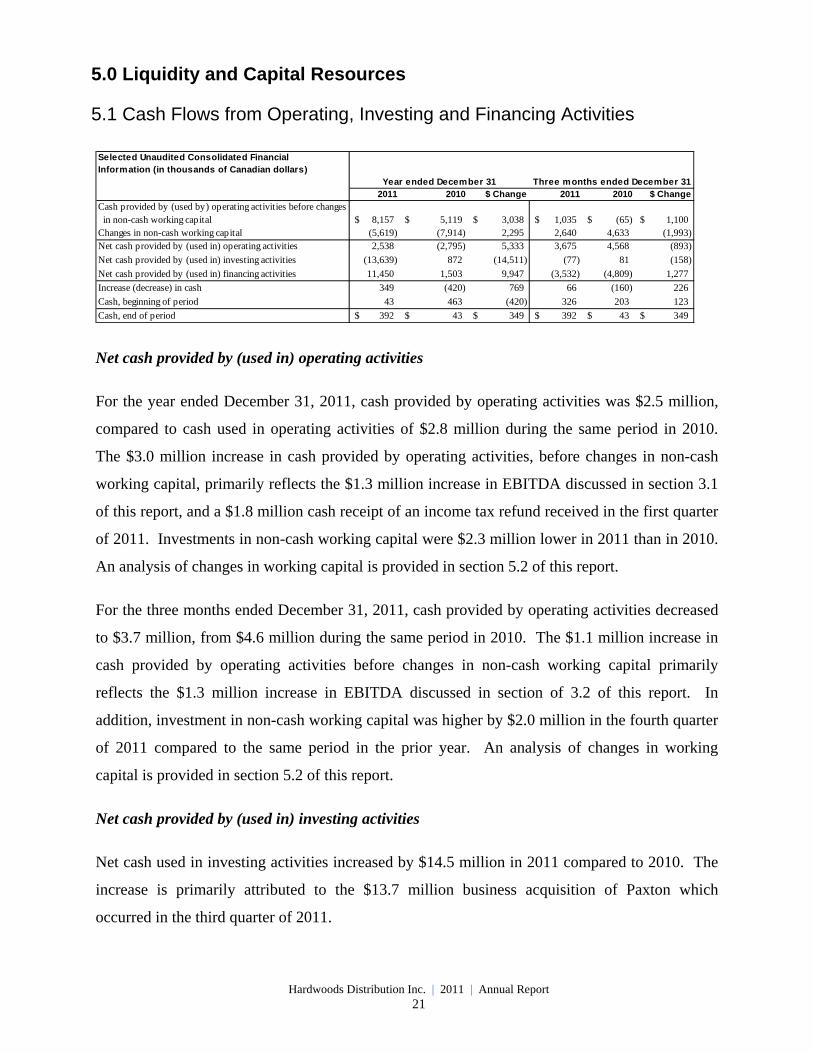
Net cash provided by (used in) operating activities
For the year ended December 31, 2011, cash provided by operating activities was $2.5 million,
compared to cash used in operating activities of $2.8 million during the same period in 2010.
The $3.0 million increase in cash provided by operating activities, before changes in non-cash
working capital, primarily reflects the $1.3 million increase in EBITDA discussed in section 3.1
of this report, and a $1.8 million cash receipt of an income tax refund received in the first quarter
of 2011. Investments in non-cash working capital were $2.3 million lower in 2011 than in 2010.
An analysis of changes in working capital is provided in section 5.2 of this report.
For the three months ended December 31, 2011, cash provided by operating activities decreased
to $3.7 million, from $4.6 million during the same period in 2010. The $1.1 million increase in
cash provided by operating activities before changes in non-cash working capital primarily
reflects the $1.3 million increase in EBITDA discussed in section of 3.2 of this report. In
addition, investment in non-cash working capital was higher by $2.0 million in the fourth quarter
of 2011 compared to the same period in the prior year. An analysis of changes in working
capital is provided in section 5.2 of this report.
Net cash provided by (used in) investing activities
Net cash used in investing activities increased by $14.5 million in 2011 compared to 2010. The
increase is primarily attributed to the $13.7 million business acquisition of Paxton which
occurred in the third quarter of 2011.
Selected Unaudited Consolidated Financial Information (in thousands of Canadian dollars)
2011 2010 $ Change 2011 2010 $ Change
Cash provided by (used by) operating activities before changes in non-cash working capital 8,157$ 5,119$ 3,038$ 1,035$ (65)$ 1,100$ Changes in non-cash working capital (5,619) (7,914) 2,295 2,640 4,633 (1,993) Net cash provided by (used in) operating activities 2,538 (2,795) 5,333 3,675 4,568 (893)
Net cash provided by (used in) investing activities (13,639) 872 (14,511) (77) 81 (158)
Net cash provided by (used in) financing activities 11,450 1,503 9,947 (3,532) (4,809) 1,277
Increase (decrease) in cash 349 (420) 769 66 (160) 226
Cash, beginning of period 43 463 (420) 326 203 123
Cash, end of period 392$ 43$ 349$ 392$ 43$ 349$
Three months ended December 31Year ended December 31
Hardwoods Distribution Inc. | 2011 | Annual Report 22
Prior to the Paxton acquisition, our capital expenditures were typically low as we leased all of
our buildings and contracted out all freight delivery services. Capital expenditures that were
made were principally for the replacement of forklifts, furniture and fixtures, leasehold
improvements and computer equipment. Between 2007 and 2011, capital expenditures were
lower than normal, reflecting the closure of 11 branch locations in response to weak economic
conditions. These closures freed up additional forklift capacity and reduced our need to purchase
replacement forklift equipment. We also decreased many of our discretionary cash outlays for
capital items during this period as we emphasized cost reduction and cash conservation. As a
result, our total capital expenditures amounted to just $0.1 million in the year ended December
31, 2010, and $0.4 million in 2011.
We also lease automobiles for the use of outside sales representatives and certain managers. For
the year ended December 31, 2011, principle payments on automobile finance lease obligation
were $0.7 million (2010 - $0.8 million).
Despite the reduced spending on capital expenditures, we believe we have made sufficient
expenditures to sustain productive capacity of our business as it relates to our needs for property,
plant and equipment.
Our acquisition of Paxton on September 19, 2011 will increase our future maintenance capital
expenditure needs. Unlike other Hardwoods distribution operations, the Paxton business
requires ongoing investment in moulders and other light remanufacturing equipment. Paxton
also buys trailers and leases tractor units for use in delivery of product to customers, whereas
other Hardwoods operations contract out this freight delivery service to third-party carriers. We
anticipate that additional annual capital expenditure requirements of approximately $0.5 million
will be associated with maintaining the productive capacity of the Paxton business.
Net cash provided by financing activities
Net cash provided by financing activities increased by $9.9 million and $1.3 million respectively
in the year and three months ended December 31, 2011, compared to the same periods in 2010.
These increases primarily reflect increased bank indebtedness as we supported sales growth with
higher working capital investment. We also increased borrowing to fund the Paxton acquisition
which occurred in the third quarter of 2011.
Hardwoods Distribution Inc. | 2011 | Annual Report 23
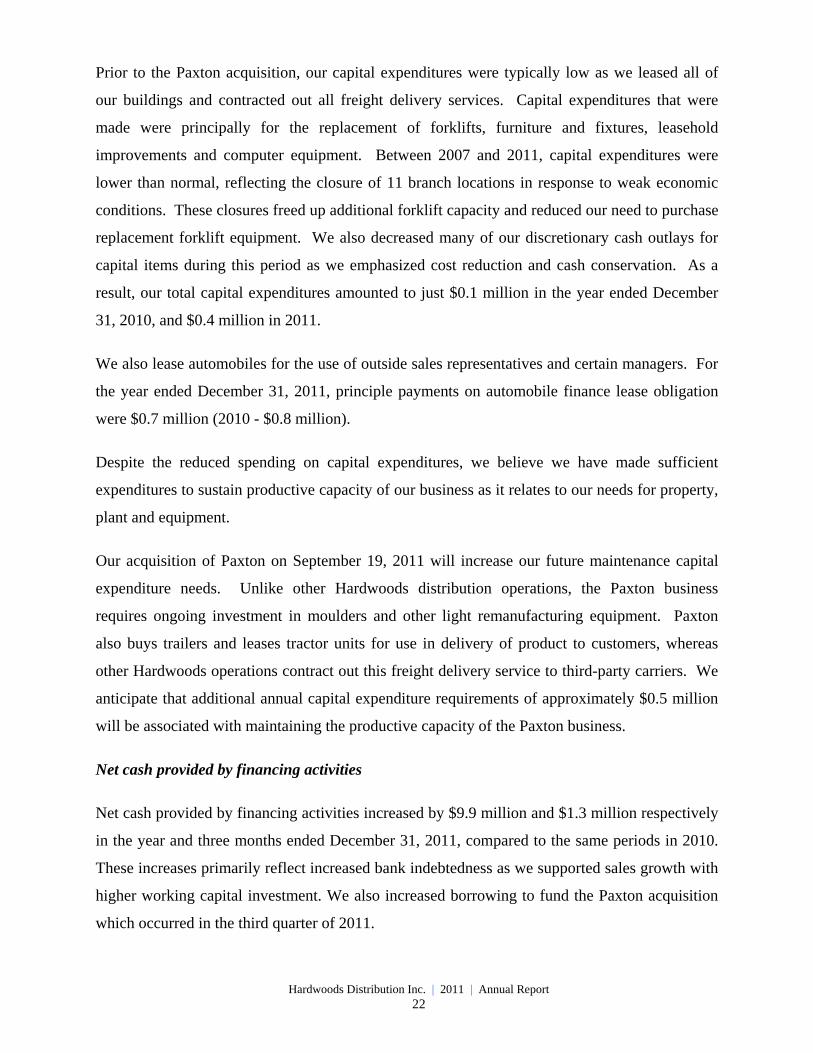
5.2 Working Capital
Our business requires an ongoing investment in working capital, which we consider to be
comprised of accounts receivable, inventory, and prepaid expenses, partially offset by provisions
and short-term credit provided by suppliers in the form of accounts payable and accrued
liabilities. We had working capital of $67.6 million at December 31, 2011, compared to $51.5 of
working capital at December 31, 2010, with most of the increase attributable to the value of
accounts receivable and inventory that we purchased with the Paxton acquisition, along with
increased investment in accounts receivable and inventory to support our growth in sales.
Our investment in working capital fluctuates from quarter-to-quarter based on factors such as
seasonal sales demand, strategic purchasing decisions taken by management, and the timing of
collections from customers and payments made to our suppliers. Historically the first and fourth
quarters are seasonally slower periods for construction activity and therefore demand for
hardwood products decreases. As a result, sales and working capital requirements may be lower
in these quarters. A summary of changes in our non-cash operating working capital during the
twelve months and three months ended December 31, 2011 and 2010 is provided below.
Continued compliance with financial covenants under our credit facilities is important to ensure
that we have adequate financing available to meet our working capital requirements. The terms
of our revolving credit facilities are addressed in section 5.3 of this report.
(in thousands of Canadian dollars)
Source (use) of funds
Year ended December 31,
2011
Year ended December 31,
2010
Three months ended
December 31, 2011
Three months ended
December 31, 2010
Accounts receivable $ (2,237) $ (2,457) $ 4,295 $ 3,552 Inventory (5,110) (4,436) 969 2,470 Prepaid expenses (121) (290) (67) (249)Provisions (444) 85 (360) 369 Accounts payable and accrued liabilities 2,293 (816) (2,197) (1,509)Decrease (increase) in non-cash operating working capital $ (5,619) $ (7,914) $ 2,640 $ 4,633
Hardwoods Distribution Inc. | 2011 | Annual Report 24
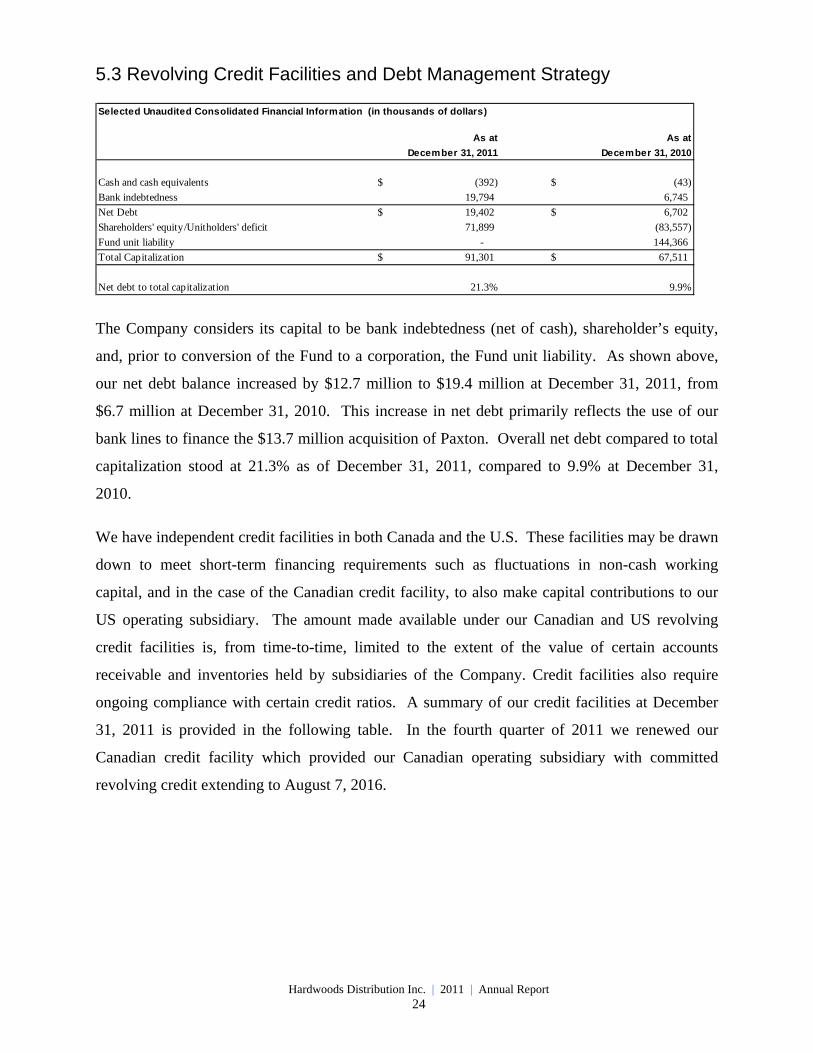
5.3 Revolving Credit Facilities and Debt Management Strategy
The Company considers its capital to be bank indebtedness (net of cash), shareholder’s equity,
and, prior to conversion of the Fund to a corporation, the Fund unit liability. As shown above,
our net debt balance increased by $12.7 million to $19.4 million at December 31, 2011, from
$6.7 million at December 31, 2010. This increase in net debt primarily reflects the use of our
bank lines to finance the $13.7 million acquisition of Paxton. Overall net debt compared to total
capitalization stood at 21.3% as of December 31, 2011, compared to 9.9% at December 31,
2010.
We have independent credit facilities in both Canada and the U.S. These facilities may be drawn
down to meet short-term financing requirements such as fluctuations in non-cash working
capital, and in the case of the Canadian credit facility, to also make capital contributions to our
US operating subsidiary. The amount made available under our Canadian and US revolving
credit facilities is, from time-to-time, limited to the extent of the value of certain accounts
receivable and inventories held by subsidiaries of the Company. Credit facilities also require
ongoing compliance with certain credit ratios. A summary of our credit facilities at December
31, 2011 is provided in the following table. In the fourth quarter of 2011 we renewed our
Canadian credit facility which provided our Canadian operating subsidiary with committed
revolving credit extending to August 7, 2016.
Selected Unaudited Consolidated Financial Information (in thousands of dollars)
As at As at
December 31, 2011 December 31, 2010
Cash and cash equivalents (392)$ (43)$
Bank indebtedness 19,794 6,745
Net Debt 19,402$ 6,702$
Shareholders' equity/Unitholders' deficit 71,899 (83,557)
Fund unit liability - 144,366
Total Capitalization 91,301$ 67,511$
Net debt to total capitalization 21.3% 9.9%
Hardwoods Distribution Inc. | 2011 | Annual Report 25
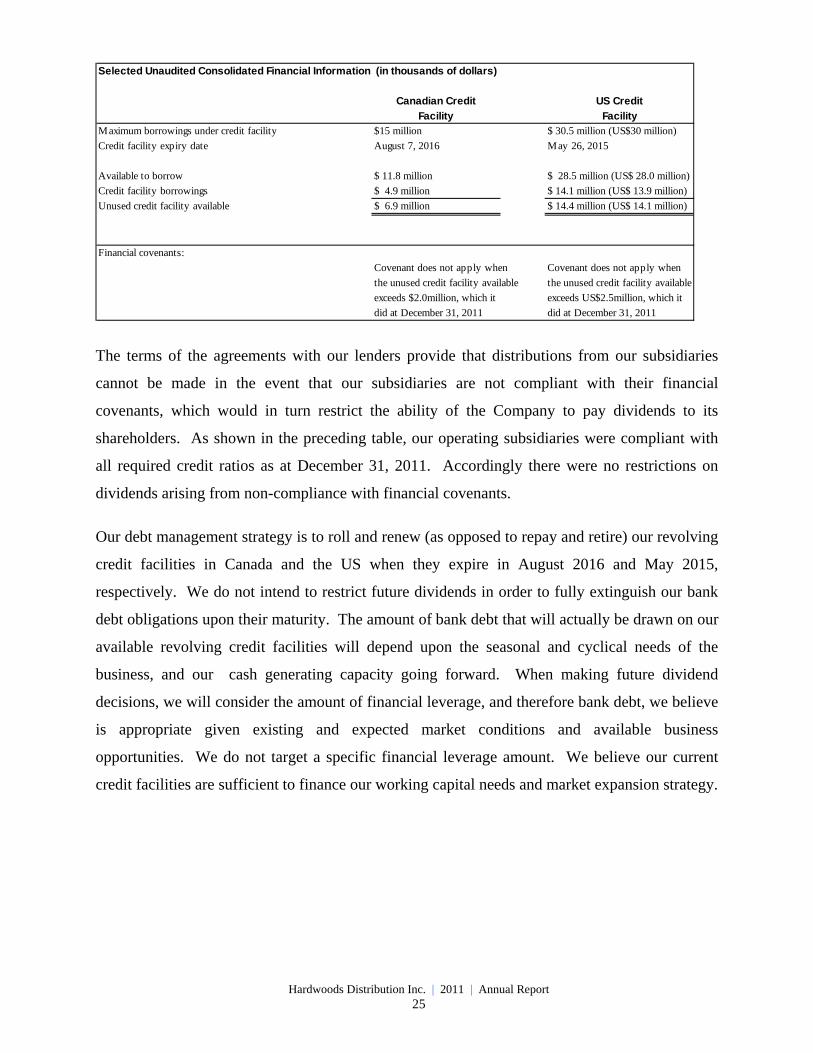
The terms of the agreements with our lenders provide that distributions from our subsidiaries
cannot be made in the event that our subsidiaries are not compliant with their financial
covenants, which would in turn restrict the ability of the Company to pay dividends to its
shareholders. As shown in the preceding table, our operating subsidiaries were compliant with
all required credit ratios as at December 31, 2011. Accordingly there were no restrictions on
dividends arising from non-compliance with financial covenants.
Our debt management strategy is to roll and renew (as opposed to repay and retire) our revolving
credit facilities in Canada and the US when they expire in August 2016 and May 2015,
respectively. We do not intend to restrict future dividends in order to fully extinguish our bank
debt obligations upon their maturity. The amount of bank debt that will actually be drawn on our
available revolving credit facilities will depend upon the seasonal and cyclical needs of the
business, and our cash generating capacity going forward. When making future dividend
decisions, we will consider the amount of financial leverage, and therefore bank debt, we believe
is appropriate given existing and expected market conditions and available business
opportunities. We do not target a specific financial leverage amount. We believe our current
credit facilities are sufficient to finance our working capital needs and market expansion strategy.
Selected Unaudited Consolidated Financial Information (in thousands of dollars)
Canadian Credit US Credit
Facility Facility Maximum borrowings under credit facility $15 million $ 30.5 million (US$30 million)
Credit facility expiry date August 7, 2016 May 26, 2015
Available to borrow $ 11.8 million $ 28.5 million (US$ 28.0 million)
Credit facility borrowings $ 4.9 million $ 14.1 million (US$ 13.9 million)
Unused credit facility available $ 6.9 million $ 14.4 million (US$ 14.1 million)
Financial covenants:
Covenant does not apply when Covenant does not apply when
the unused credit facility available the unused credit facility available
exceeds $2.0million, which it exceeds US$2.5million, which it
did at December 31, 2011 did at December 31, 2011
Hardwoods Distribution Inc. | 2011 | Annual Report 26
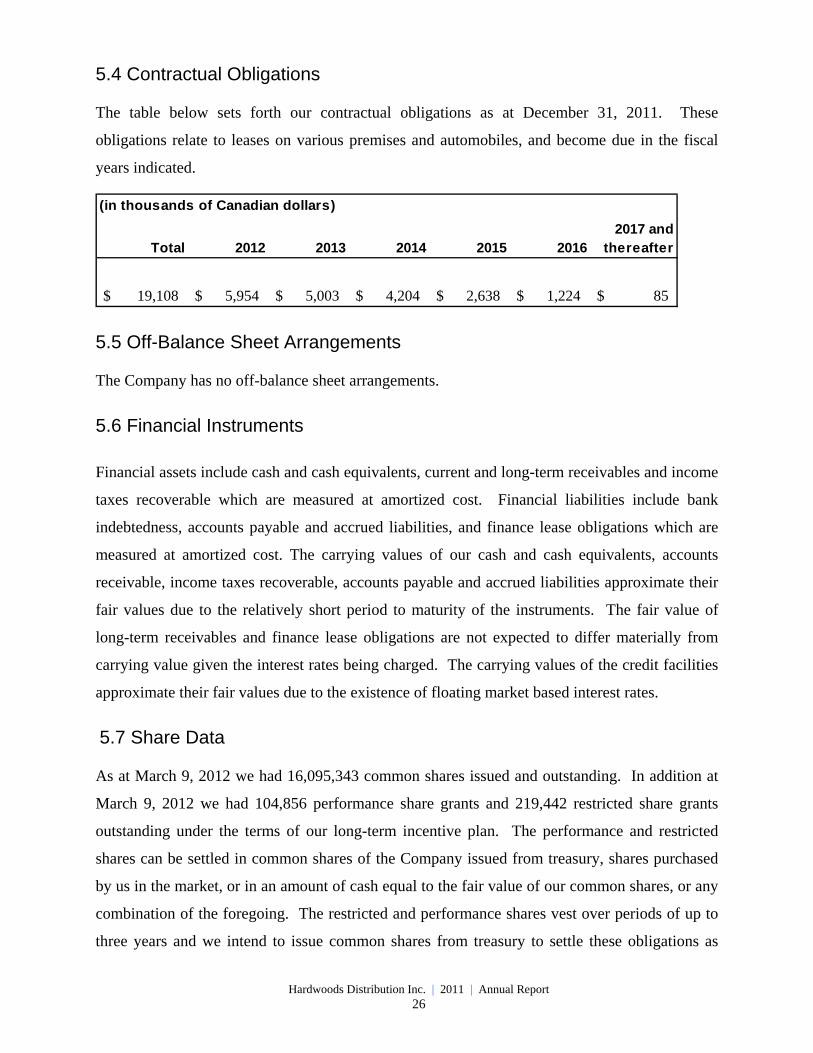
5.4 Contractual Obligations
The table below sets forth our contractual obligations as at December 31, 2011. These
obligations relate to leases on various premises and automobiles, and become due in the fiscal
years indicated.
5.5 Off-Balance Sheet Arrangements
The Company has no off-balance sheet arrangements.
5.6 Financial Instruments
Financial assets include cash and cash equivalents, current and long-term receivables and income
taxes recoverable which are measured at amortized cost. Financial liabilities include bank
indebtedness, accounts payable and accrued liabilities, and finance lease obligations which are
measured at amortized cost. The carrying values of our cash and cash equivalents, accounts
receivable, income taxes recoverable, accounts payable and accrued liabilities approximate their
fair values due to the relatively short period to maturity of the instruments. The fair value of
long-term receivables and finance lease obligations are not expected to differ materially from
carrying value given the interest rates being charged. The carrying values of the credit facilities
approximate their fair values due to the existence of floating market based interest rates.
5.7 Share Data
As at March 9, 2012 we had 16,095,343 common shares issued and outstanding. In addition at
March 9, 2012 we had 104,856 performance share grants and 219,442 restricted share grants
outstanding under the terms of our long-term incentive plan. The performance and restricted
shares can be settled in common shares of the Company issued from treasury, shares purchased
by us in the market, or in an amount of cash equal to the fair value of our common shares, or any
combination of the foregoing. The restricted and performance shares vest over periods of up to
three years and we intend to issue common shares from treasury to settle these obligations as
(in thousands of Canadian dollars)
Total 2012 2013 2014 2015 20162017 and
thereafter
$ 19,108 $ 5,954 $ 5,003 $ 4,204 $ 2,638 $ 1,224 $ 85
Hardwoods Distribution Inc. | 2011 | Annual Report 27
they vest. The number of common shares to be issued to settle the performance share grants will
be dependent upon the Company’s financial performance over the vesting period.
5.8 Dividends
In the fourth quarter of 2011, we declared a quarterly dividend of $0.02 per share, which was
paid on January 31, 2012 to shareholders of record as at January 20, 2012. On March 9, 2012 we
declared a quarterly dividend of $0.02 per share, payable on April 30, 2012 to shareholders of
record as at April 20, 2012.
6.0 Related Party Transactions
Related parties refers to affiliates of the previous owners of the Business who retained up until
July 1, 2011, a 20% interest in Hardwoods through ownership of Class B Hardwoods LP units
and Class B Hardwoods USLP units, respectively, and who subsequent to July 1, 2011 retain an
interest in the Company’s common shares and who continue to have representation on our board
of directors. For the year ended December 31, 2011, sales of $0.3 million were made to related
parties, and the subsidiaries of the Company purchased $0.1 million from related parties. These
sales and purchases took place at prevailing market prices.
7.0 Critical Accounting Estimates & Adoption of Changes in
Accounting Policies
7.1 Critical Accounting Estimates
The preparation of financial statements in accordance with IFRS requires that we make estimates
and assumptions that can have a material impact on our results of operations as reported on a
periodic basis. We base our estimates and assumptions on past experience and other factors that
are deemed reasonable under the circumstances. Actual results could differ from these estimates.
The critical estimates used in preparing our financial statements are:
Accounts Receivable Provision: Due to the nature of our business and the credit terms we
provide to our customers, we anticipate that a certain portion of required customer payments will
not be made, and we maintain an allowance for these doubtful accounts. The allowance is based
on our estimate of the potential of recovering our accounts receivable, and incorporates current
and expected collection trends.
Hardwoods Distribution Inc. | 2011 | Annual Report 28
Valuation of Inventories: We anticipate that the net realizable value of our inventory could be
affected by market shifts or damage to our products. Our inventory is valued at the lower of cost
and net realizable value.
Deferred income Taxes: We are required to make estimates and assumptions regarding future
business results, as well as the amount and timing of certain future discretionary tax deductions
available to us. These estimates and assumptions can have a material impact upon the amount of
deferred income tax assets and liabilities that we recognize.
Fair Value of Non-Controlling Interest: Prior to conversion of the Fund to a corporation, we
were required to estimate the fair value of the non-controlling interest liability at each reporting
date. Estimating the value of the non-controlling interest required significant judgment, and we
considered, amongst other things, the value of Fund Units as traded on the Toronto Stock
Exchange, and the relative economic interests of non-controlling interests compared with Fund
Units, including the terms of the subordination arrangements that were in place with the non-
controlling interest. As the changes in fair value determined at each reporting date were
recorded in profit or loss for the period, our estimates of fair value may have a material impact
upon the Fund’s reported profit or loss.
Allocation of Purchase Price related to the Acquisition of Paxton: The acquisition of Paxton is
accounted for as a business combination, which requires the consideration paid to be allocated to
the identifiable assets acquired at their relative fair values. The assumptions made in
determining the fair value of the assets acquired may impact the allocation of the purchase price
in the financial statements.
7.2 Adoption of New Accounting Standards
Effective January 1, 2011 Canadian publicly listed entities were required to prepare their
financial statements in accordance with IFRS. Due to the requirement to present comparative
financial information, the effective transition date is January 1, 2010. The Audited Financial
Statements include in Note 20 reconciliations of the previously disclosed comparative period
financial statements prepared in accordance with Canadian generally accepted accounting
principles reconciled to IFRS.
We note that the standard-setting bodies that determine IFRS have significant ongoing projects
that could impact the IFRS accounting policies that we have selected. The impact of any new
Hardwoods Distribution Inc. | 2011 | Annual Report 29
IFRS standards or interpretations will be evaluated as they are drafted and published. New
standards and interpretations that have been identified but have yet to be adopted are:
IFRS 9 - Financial Instruments
In November 2009, the IASB issued IFRS 9 - Financial Instruments, which is the first step in its
project to replace IAS 39 - Financial Instruments: Recognition and Measurement. IFRS 9
establishes the measurement and classification of financial assets. Under IFRS 9, financial
assets are measured either at fair value through earnings or at amortized cost if certain
conditions are met. The effective date of this standard is January 1, 2015, but early adoption is
permitted. We will apply this standard to our financial statements beginning on January 1,
2015. We are currently evaluating the impact of IFRS 9 on our financial statements.
IFRS 10 – Consolidated Financial Statements
In May 2011, the IASB issued IFRS 10 – Consolidated Financial Statements. The objective of
IFRS 10 is to establish principles for the presentation and preparation of consolidated financial
statements when an entity controls one or more other entities. The effective date of this
standard is January 1, 2013, but early adoption is permitted. We will apply this standard to our
financial statements beginning on January 1, 2013. The adoption of IFRS 10 is not expected to
have a significant impact on our consolidated financial statements.
IFRS 12 – Disclosure of Interests in Other Entities
In May 2011, the IASB issued IFRS 12 – Disclosure of Interests in Other Entities. The
objective of IFRS 12 is to require the disclosure of information that enables users of financial
statements to evaluate the nature of, and risks associated with, its interests in other entities and
the effects of those interests on its financial position, financial performance and cash flows. The
effective date of this standard is January 1, 2013, but early adoption is permitted. We will apply
this standard to our financial statements beginning on January 1, 2013. We are currently
evaluating the impact of IFRS 12 on our financial statements.
IFRS 13 – Fair Value Measurement
In May 2011, the IASB issued IFRS 13 – Fair Value Measurement. The objective of IFRS 13 is
to define fair value, set out in a single IFRS framework for measuring fair value, and establish
disclosure requirements regarding fair value measurements. The effective date of this standard
Hardwoods Distribution Inc. | 2011 | Annual Report 30
is January 1, 2013, but early adoption is permitted. We will apply this standard to our financial
statements beginning on January 1, 2013. We are currently evaluating the impact of IFRS 13 on
our financial statements.
8.0 Risks and Uncertainties
We are exposed to a number of risks and uncertainties in the normal course of business that
could have a negative effect on our financial condition or results of operations. We identified
significant risks that we were aware of in our Annual Information Form dated March 9, 2012
which is available to readers along with other disclosure information at www.sedar.com.
9.0 Disclosure Controls and Procedures and Internal Control over
Financial Reporting
Our management, under the supervision of the Chief Executive Officer (“CEO”) and Chief
Financial Officer (“CFO”), is responsible for establishing and maintaining adequate disclosure
controls and procedures (“DC&P”) and internal control over financial reporting (“ICFR”). Any
systems of DC&P and ICFR, no matter how well designed, have inherent limitations. Therefore,
even those systems determined to be effective can provide only reasonable assurance with
respect to information required to be disclosed and financial statement preparation and
presentation.
Our management has limited the scope of its design and testing of DC&P and ICFR to exclude
controls, policies and procedures of Paxton, which we acquired on September 19, 2011. For the
year ended December 31, 2011, Paxton accounted for $13.7 million of our consolidated
revenues. Paxton accounted for $0.2 million of our income before discontinued operations and
extraordinary items and $0.1 million of our net income for the year ended December 31, 2011,
net of transactions costs associated with completing the acquisition. As at December 31, 2011,
Paxton accounted for $10.1 million of our current assets, $4.0 million of our non-current assets,
$0.5 million of our current liabilities and nil of our non-current liabilities.
As required by Multilateral Instrument 52-109 issued by the Canadian Securities Administrators,
we carried out an evaluation of the effectiveness of our DC&P as of December 31, 2011. The
evaluation was carried out under the supervision of, and with the participation of the CEO and
Hardwoods Distribution Inc. | 2011 | Annual Report 31
CFO. Based on this evaluation, the CEO and CFO concluded that our DC&P were effective as
of December 31, 2011.
As required by Multilateral Instrument 52-109 issued by the Canadian Securities Administrators,
we carried out an evaluation of the effectiveness of our ICFR as of December 31, 2011. The
evaluation was carried out within the COSO framework and under the supervision of, and with
the participation of the CEO and the CFO. Based on this evaluation, the CEO and CFO
concluded that our ICFR were effective as of December 31, 2011.
There have been no changes in our ICFR during the quarter ended December 31, 2011 that have
materially affected, or are reasonably likely to materially affect, our ICFR.
10.0 Note Regarding Forward Looking Information
Certain statements in this MD&A contain forward-looking information within the meaning of
applicable securities laws in Canada (“forward-looking information”). The words “anticipates”,
“believes”, “budgets”, “could”, “estimates”, “expects”, “forecasts”, “intends”, “may”, “might”,
“plans”, “projects”, “schedule”, “should”, “will”, “would” and similar expressions are often
intended to identify forward-looking information, although not all forward-looking information
contains these identifying words.
The forward-looking information in this MD&A includes, but is not limited to: our belief that
given the weakness in market conditions, most of our sales and EBITDA gains can be attributed
to successful implementation of our business strategy; that we anticipate that the North
American economy will continue to experience a slow recovery with very gradual improvement
in the US residential construction markets and moderately stronger gains in non-residential
construction markets; our belief that in Canada, growth in the domestic economy shows signs of
slowing as global economic events reduce consumer confidence and the stronger Canadian
dollar negatively impacts secondary manufacturers, such that we anticipate only modest
improvement from this market in 2012; that given our expectation of continuing weak market
conditions, we will continue to rely on our market expansion strategy to achieve growth and
enhance profits; that we anticipate that operating expenses will increase further in 2012 as we
implement our market expansion strategies, support increased sales activity and integrate the
Paxton business; that our key priorities in 2012 will be to complete the integration of the Paxton
operations and to continue executing our business strategy, while tightly managing the business;
Hardwoods Distribution Inc. | 2011 | Annual Report 32
our intention to continue to seek out acquisition opportunities that further increase shareholder
value; our estimate that at least 50% of our products are used in new residential construction, in
the form of cabinets, mouldings, custom finishing, and home furniture, and that the balance of
our products end up in other sectors of the economy not associated with new residential
construction, such as home renovations, finishing millwork for office buildings, restaurant and
bar interiors, hotel lobbies, retail point-of-purchase displays, schools, hospitals, custom motor
coaches, yacht interiors and other specialty areas; our belief that current levels of housing and
construction activity in North America are low relative to expected longer-term population and
housing trends, and we believe that when a sustained economic recovery takes hold, prospects
for our industry are attractive; our belief we have made sufficient expenditures to sustain
productive capacity of our business as it relates to our needs for property, plant and equipment;
our perspective that our acquisition of Paxton will increase our future maintenance capital
expenditure needs; that we anticipate additional annual capital expenditure requirements of
approximately $0.5 million will be associated with maintaining the productive capacity of the
Paxton business; that our debt management strategy is to roll and renew (as opposed to repay
and retire) our revolving credit facilities in Canada and the US when they expire in August 2016
and May 2015, respectively; that we do not intend to restrict future dividends in order to fully
extinguish our bank debt obligations upon their maturity; that the amount of bank debt that will
actually be drawn on our available revolving credit facilities will depend upon the seasonal and
cyclical needs of the business, and our cash generating capacity going forward; that when
making future dividend decisions, we will consider the amount of financial leverage, and
therefore bank debt, we believe is appropriate given existing and expected market conditions
and available business opportunities; that we do not target a specific financial leverage amount;
and that we believe our current credit facilities are sufficient to finance our working capital
needs and market expansion strategy.
The forecasts and projections that make up the forward-looking information are based on
assumptions which include, but are not limited to: there are no material exchange rate
fluctuations between the Canadian and US dollar that affect our performance; the general state of
the economy does not worsen; we do not lose any key personnel; there are no decreases in the
supply of, demand for, or market values of hardwood lumber or sheet goods that harm our
business; we do not incur material losses related to credit provided to our customers; our
products are not subjected to negative trade outcomes; we are able to sustain our level of sales
and EBITDA margins; we are able to grow our business long term and to manage our growth;
Hardwoods Distribution Inc. | 2011 | Annual Report 33
there is no new competition in our markets that leads to reduced revenues and profitability; we
do not become subject to more stringent regulations; importation of products manufactured with
hardwood lumber or sheet goods does not increase and replace products manufactured in North
America; our management information systems upon which we are dependent are not impaired;
our insurance is sufficient to cover losses that may occur as a result of our operations; and, the
financial condition and results of operations of our business upon which we are dependent is not
impaired.
The forward-looking information is subject to risks, uncertainties and other factors that could
cause actual results to differ materially from historical results or results anticipated by the
forward-looking information. The factors which could cause results to differ from current
expectations include, but are not limited to: exchange rate fluctuations between the Canadian
and US dollar could affect our performance; our results are dependent upon the general state of
the economy; we depend on key personnel, the loss of which could harm our business; decreases
in the supply of, demand for, or market values of hardwood lumber or sheet goods could harm
our business; we may incur losses related to credit provided to our customers; our products may
be subject to negative trade outcomes; we may not be able to sustain our level of sales or
EBITDA margins; we may be unable to grow our business long term to manage any growth;
competition in our markets may lead to reduced revenues and profitability; we may become
subject to more stringent regulations; importation of products manufactured with hardwood
lumber or sheet goods may increase, and replace products manufactured in North America; we
are dependent upon our management information systems; our insurance may be insufficient to
cover losses that may occur as a result of our operations; we are dependent upon the financial
condition and results of operations of our business; our credit facilities affect our liquidity,
contain restrictions on our ability to borrow funds, and impose restrictions on distributions that
can be made by our operating limited partnerships; our future growth may be restricted by the
payout of substantially all of our operating cash flow; and, other risks described in our Annual
Information Form and this MD&A.
All forward-looking information in this MD&A is qualified in its entirety by this cautionary
statement and, except as may be required by law, we undertake no obligation to revise or update
any forward-looking information as a result of new information, future events or otherwise after
the date hereof.
Hardwoods Distribution Inc. | 2011 | Annual Report 34
Management’s Statement of Responsibilities
The accompanying consolidated financial statements are the responsibility of management and
have been reviewed and approved by the Boards of Directors. The consolidated financial
statements have been prepared by management, in accordance with Canadian generally accepted
accounting principles and, where appropriate, reflect management’s best estimates and
judgements. Management has also prepared financial and all other information in the annual
report and has ensured that this information is consistent with the consolidated financial
statements.
The Company maintains appropriate systems of internal control, policies and procedure, which
provide management with reasonable assurance that assets are safeguarded and the financial
records are reliable and form a proper basis for preparation of financial statements.
The Boards of Directors ensure that management fulfills its responsibilities for financial reporting
and internal control through an Audit Committee. This committee reviews the consolidated
financial statements and is comprised of independent Directors. The auditors have full and direct
access to the Audit Committee.
The consolidated financial statements have been independently audited by KPMG LLP, in
accordance with Canadian generally accepted auditing standards. Their report herewith expresses
their opinion on the consolidated financial statements of the Company.
Lance R. Blanco
President and Chief Executive Officer
Hardwoods Distribution Inc. | 2011 | Annual Report 35
Independent Auditor’s Report
To the Shareholders of Hardwoods Distribution Inc.
We have audited the accompanying consolidated financial statements of Hardwoods Distribution
Inc., which comprise the consolidated statements of financial position as at December 31, 2011,
December 31, 2010, and January 1, 2010, the consolidated statements of comprehensive income,
changes in shareholders’ equity and cash flows for the years ended December 31, 2011 and
December 31, 2010, and notes, comprising a summary of significant accounting policies and
other explanatory information.
Management's Responsibility for the Consolidated Financial Statements
Management is responsible for the preparation and fair presentation of these consolidated
financial statements in accordance with International Financial Reporting Standards, and for such
internal control as management determines is necessary to enable the preparation of consolidated
financial statements that are free from material misstatement, whether due to fraud or error.
Auditors’ Responsibility
Our responsibility is to express an opinion on these consolidated financial statements based on
our audits. We conducted our audits in accordance with Canadian generally accepted auditing
standards. Those standards require that we comply with ethical requirements and plan and
perform an audit to obtain reasonable assurance about whether the consolidated financial
statements are free from material misstatement.
An audit involves performing procedures to obtain audit evidence about the amounts and
disclosures in the consolidated financial statements. The procedures selected depend on our
judgment, including the assessment of the risks of material misstatement of the consolidated
financial statements, whether due to fraud or error. In making those risk assessments, we consider
internal control relevant to the entity's preparation and fair presentation of the consolidated
financial statements in order to design audit procedures that are appropriate in the circumstances,
but not for the purpose of expressing an opinion on the effectiveness of the entity's internal
control. An audit also includes evaluating the appropriateness of accounting policies used and the
reasonableness of accounting estimates made by management, as well as evaluating the overall
presentation of the consolidated financial statements.
Hardwoods Distribution Inc. | 2011 | Annual Report 36
We believe that the audit evidence we have obtained in our audits is sufficient and appropriate to
provide a basis for our audit opinion.
Opinion
In our opinion, the consolidated financial statements present fairly, in all material respects, the
consolidated financial position of Hardwoods Distribution Inc. as at December 31, 2011,
December 31, 2010, and January 1, 2010, and its consolidated financial performance and its
consolidated cash flows for the years ended December 31, 2011 and December 31, 2010 in
accordance with International Financial Reporting Standards.
Chartered Accountants March 9, 2012 Vancouver, Canada
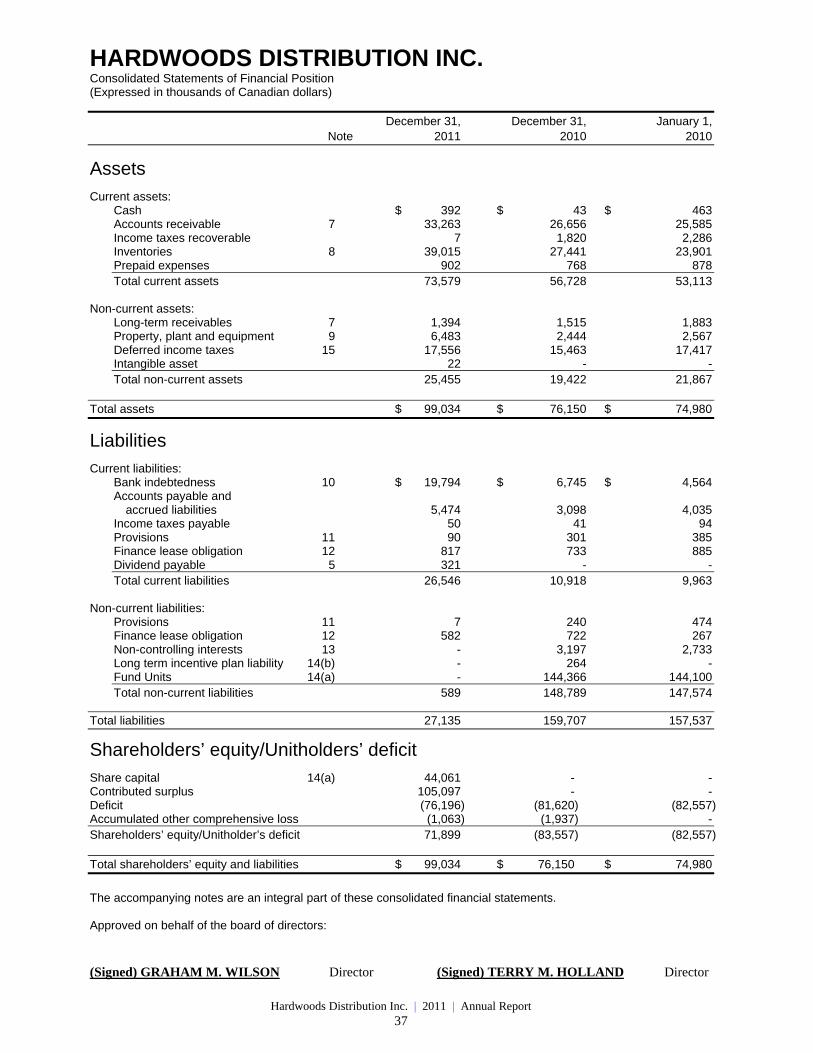
Hardwoods Distribution Inc. | 2011 | Annual Report 37
HARDWOODS DISTRIBUTION INC. Consolidated Statements of Financial Position (Expressed in thousands of Canadian dollars)
December 31, December 31, January 1, Note 2011 2010 2010
Assets
Current assets: Cash $ 392 $ 43 $ 463 Accounts receivable 7 33,263 26,656 25,585 Income taxes recoverable 7 1,820 2,286 Inventories 8 39,015 27,441 23,901 Prepaid expenses 902 768 878 Total current assets 73,579 56,728 53,113
Non-current assets:
Long-term receivables 7 1,394 1,515 1,883 Property, plant and equipment 9 6,483 2,444 2,567 Deferred income taxes 15 17,556 15,463 17,417 Intangible asset 22 - - Total non-current assets 25,455 19,422 21,867
Total assets $ 99,034 $ 76,150 $ 74,980
Liabilities
Current liabilities: Bank indebtedness 10 $ 19,794 $ 6,745 $ 4,564 Accounts payable and
accrued liabilities 5,474 3,098 4,035 Income taxes payable 50 41 94 Provisions 11 90 301 385 Finance lease obligation 12 817 733 885 Dividend payable 5 321 - - Total current liabilities 26,546 10,918 9,963
Non-current liabilities:
Provisions 11 7 240 474 Finance lease obligation 12 582 722 267 Non-controlling interests 13 - 3,197 2,733 Long term incentive plan liability 14(b) - 264 - Fund Units 14(a) - 144,366 144,100 Total non-current liabilities 589 148,789 147,574
Total liabilities 27,135 159,707 157,537
Shareholders’ equity/Unitholders’ deficit
Share capital 14(a) 44,061 - - Contributed surplus 105,097 - - Deficit (76,196) (81,620) (82,557) Accumulated other comprehensive loss (1,063) (1,937) - Shareholders’ equity/Unitholder’s deficit 71,899 (83,557) (82,557) Total shareholders’ equity and liabilities $ 99,034 $ 76,150 $ 74,980
The accompanying notes are an integral part of these consolidated financial statements. Approved on behalf of the board of directors:
(Signed) GRAHAM M. WILSON Director (Signed) TERRY M. HOLLAND Director
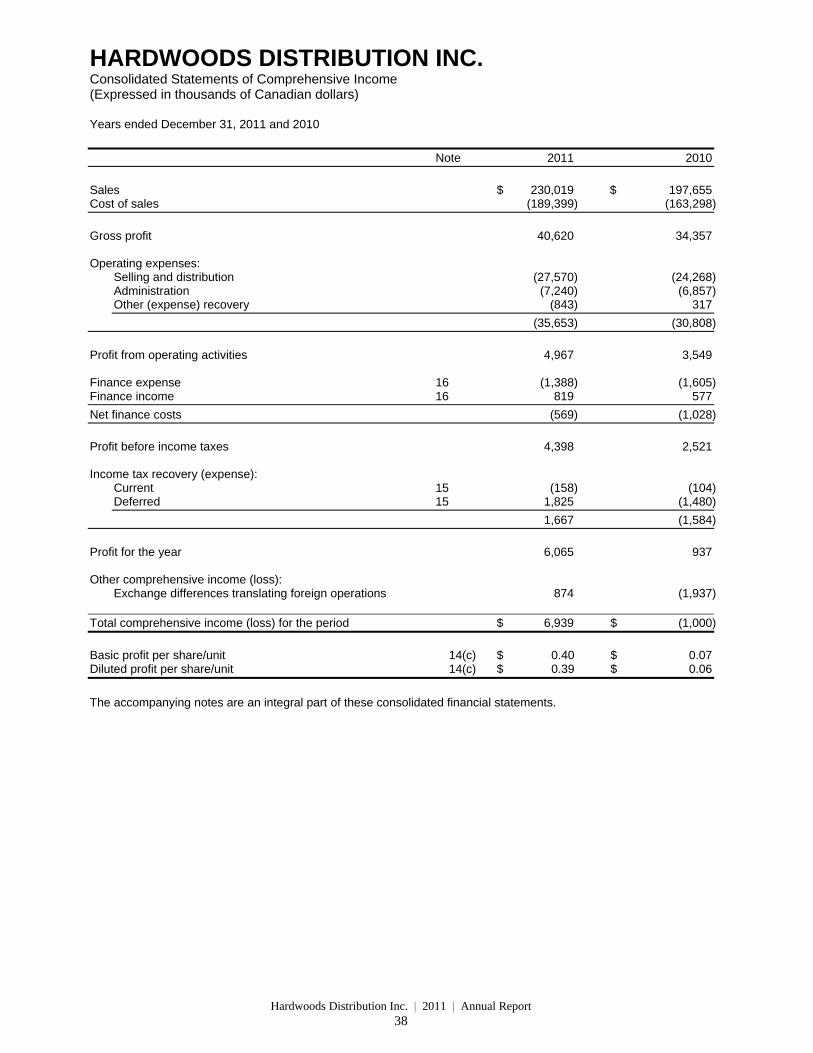
Hardwoods Distribution Inc. | 2011 | Annual Report 38
HARDWOODS DISTRIBUTION INC. Consolidated Statements of Comprehensive Income (Expressed in thousands of Canadian dollars) Years ended December 31, 2011 and 2010
Note 2011 2010
Sales $ 230,019 $ 197,655 Cost of sales (189,399) (163,298)
Gross profit 40,620 34,357 Operating expenses:
Selling and distribution (27,570) (24,268) Administration (7,240) (6,857) Other (expense) recovery (843) 317
(35,653) (30,808)
Profit from operating activities 4,967 3,549 Finance expense 16 (1,388) (1,605) Finance income 16 819 577
Net finance costs (569) (1,028)
Profit before income taxes 4,398 2,521 Income tax recovery (expense):
Current 15 (158) (104) Deferred 15 1,825 (1,480)
1,667 (1,584)
Profit for the year 6,065 937 Other comprehensive income (loss):
Exchange differences translating foreign operations 874 (1,937) Total comprehensive income (loss) for the period $ 6,939 $ (1,000)
Basic profit per share/unit 14(c) $ 0.40 $ 0.07 Diluted profit per share/unit 14(c) $ 0.39 $ 0.06
The accompanying notes are an integral part of these consolidated financial statements.
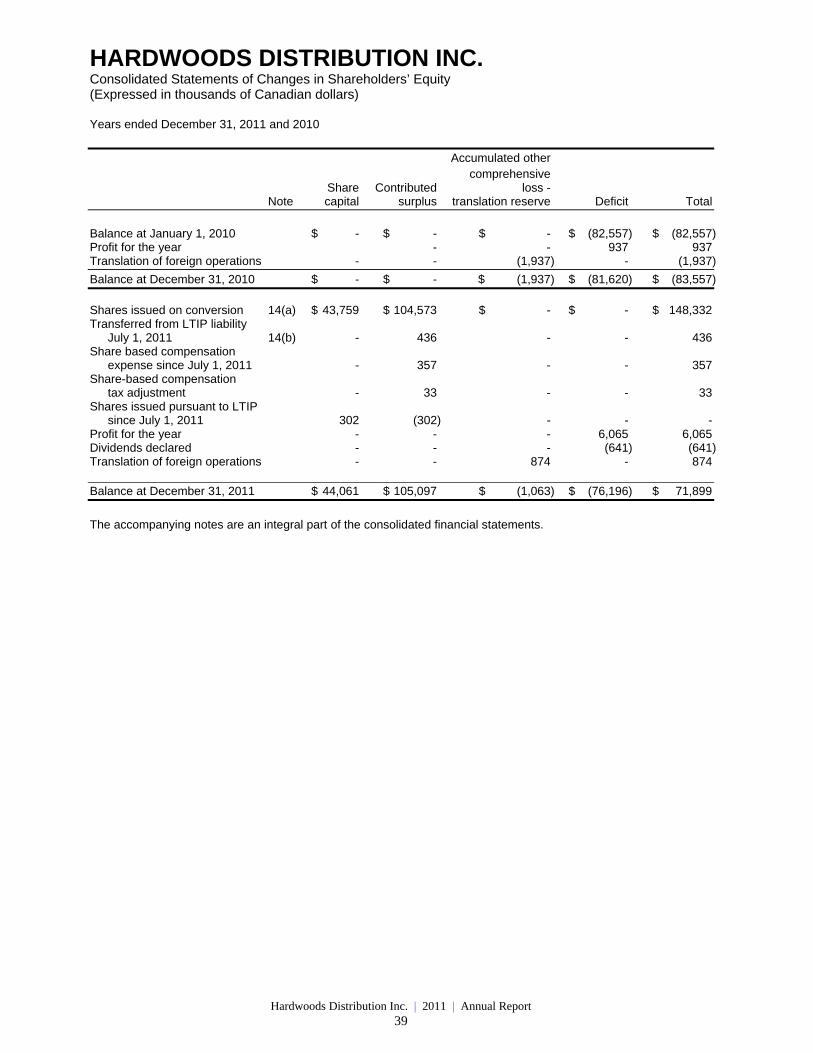
Hardwoods Distribution Inc. | 2011 | Annual Report 39
HARDWOODS DISTRIBUTION INC. Consolidated Statements of Changes in Shareholders’ Equity (Expressed in thousands of Canadian dollars) Years ended December 31, 2011 and 2010
Accumulated other comprehensive Share Contributed loss - Note capital surplus translation reserve Deficit Total
Balance at January 1, 2010 $ - $ - $ - $ (82,557) $ (82,557) Profit for the year - - 937 937 Translation of foreign operations - - (1,937) - (1,937)
Balance at December 31, 2010 $ - $ - $ (1,937) $ (81,620) $ (83,557)
Shares issued on conversion 14(a) $ 43,759 $ 104,573 $ - $ - $ 148,332 Transferred from LTIP liability
July 1, 2011 14(b) - 436 - - 436 Share based compensation
expense since July 1, 2011 - 357 - - 357 Share-based compensation
tax adjustment - 33 - - 33 Shares issued pursuant to LTIP
since July 1, 2011 302 (302) - - - Profit for the year - - - 6,065 6,065 Dividends declared - - - (641) (641) Translation of foreign operations - - 874 - 874 Balance at December 31, 2011 $ 44,061 $ 105,097 $ (1,063) $ (76,196) $ 71,899
The accompanying notes are an integral part of the consolidated financial statements.
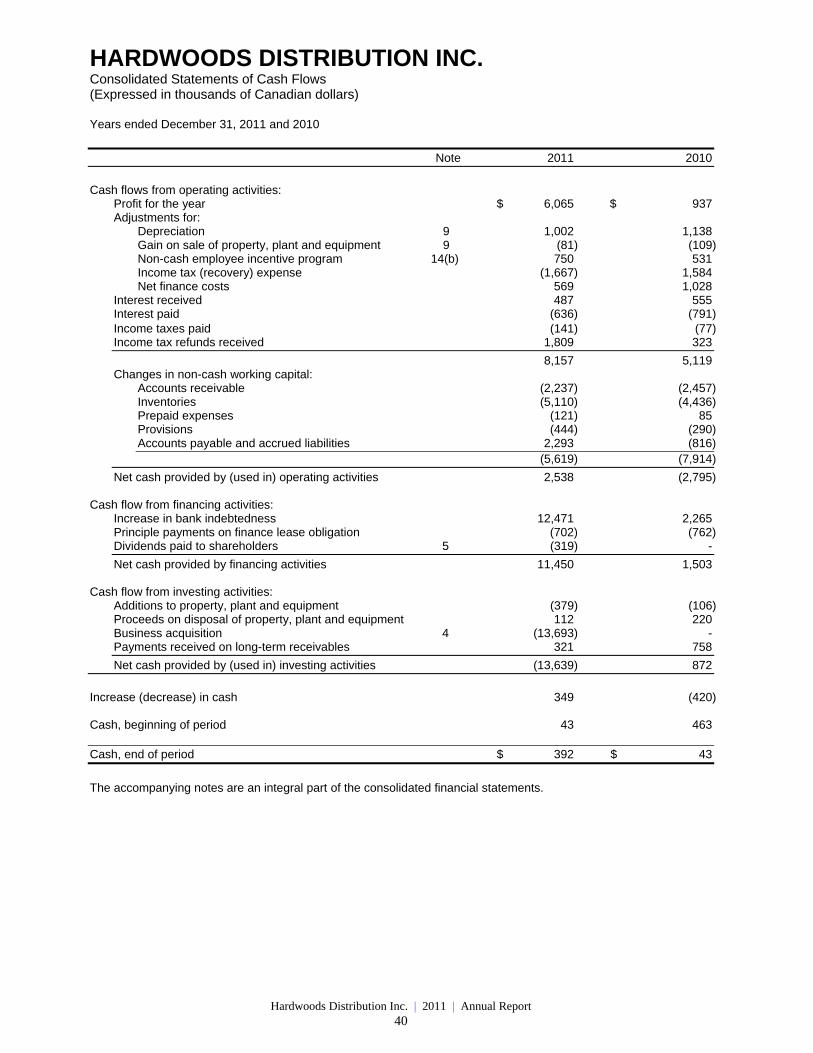
Hardwoods Distribution Inc. | 2011 | Annual Report 40
HARDWOODS DISTRIBUTION INC. Consolidated Statements of Cash Flows (Expressed in thousands of Canadian dollars) Years ended December 31, 2011 and 2010
Note 2011 2010
Cash flows from operating activities:
Profit for the year $ 6,065 $ 937 Adjustments for:
Depreciation 9 1,002 1,138 Gain on sale of property, plant and equipment 9 (81) (109) Non-cash employee incentive program 14(b) 750 531 Income tax (recovery) expense (1,667) 1,584 Net finance costs 569 1,028
Interest received 487 555 Interest paid (636) (791) Income taxes paid (141) (77)
Income tax refunds received 1,809 323
8,157 5,119 Changes in non-cash working capital:
Accounts receivable (2,237) (2,457) Inventories (5,110) (4,436) Prepaid expenses (121) 85 Provisions (444) (290) Accounts payable and accrued liabilities 2,293 (816) (5,619) (7,914)
Net cash provided by (used in) operating activities 2,538 (2,795) Cash flow from financing activities:
Increase in bank indebtedness 12,471 2,265 Principle payments on finance lease obligation (702) (762) Dividends paid to shareholders 5 (319) -
Net cash provided by financing activities 11,450 1,503 Cash flow from investing activities:
Additions to property, plant and equipment (379) (106) Proceeds on disposal of property, plant and equipment 112 220 Business acquisition 4 (13,693) - Payments received on long-term receivables 321 758
Net cash provided by (used in) investing activities (13,639) 872
Increase (decrease) in cash 349 (420) Cash, beginning of period 43 463 Cash, end of period $ 392 $ 43
The accompanying notes are an integral part of the consolidated financial statements.
HARDWOODS DISTRIBUTION INC. Notes to Consolidated Financial Statements (Tabular amounts expressed in thousands of Canadian dollars) Years ended December 31, 2011 and 2010
Hardwoods Distribution Inc. | 2011 | Annual Report 41
1. Nature of operations and the Arrangement:
Hardwoods Distribution Inc. (the “Company”) is incorporated under the Canada Business Corporations Act. The
Company is the successor to Hardwoods Distribution Income Fund (the “Fund”) following the completion of the
conversion of the Fund (the “Reorganization”) from an income trust structure by way of a court-approved plan of
arrangement under the Canada Business Corporation Act on July 1, 2011 (the “Arrangement”).
Pursuant to the Arrangement holders of units of the Fund received common shares (“Common Shares”) of the newly
created corporation, Hardwoods Distribution Inc., on a one-for-one basis. Concurrently with the Arrangement, holders
of the Special Voting Units of the Fund and corresponding Class B limited partner units of Hardwoods Specialty
Products LP and Hardwoods Specialty Products USLP (together the “Exchangeable Units”) directly or indirectly
exchanged each Exchangeable Unit for 0.3793 Common Shares of the Company. Upon completion of the
Arrangement, the Company holds all the assets previously held by the Fund and wholly owns Hardwoods Specialty
Products LP and Hardwoods Specialty Products USLP. Hardwoods Specialty Products LP and Hardwoods Specialty
Products USLP are the primary operating entities of the Company in Canada and the US, respectively. As a result of
the Arrangement, the Company became the sole unitholder of the Fund’s outstanding Units. On July 1, 2011 the
Fund was dissolved and all of its assets were transferred to, and all of its liabilities were assumed by, the Company
as the Fund’s sole unitholder on that date.
The Arrangement resulted in the Company having 15,970,514 Common Shares issued and outstanding as of July 1,
2011, and the Common Shares trading on the Toronto Stock Exchange under the symbol “HWD.” The Company’s
principal office is located at #306, 9440 202nd Street, Langley, British Columbia V1M 4A6. Taken together,
Hardwoods Specialty Products LP and Hardwoods Specialty Products USLP operate a network of 30 distribution
centers in Canada and the US engaged in the wholesale distribution of hardwood lumber and related sheet goods
and specialty products.
The Reorganization has been accounted for on a continuity of interest basis and accordingly, the consolidated
financial statements reflect the financial position, results of operations and cash flows as if the Company had always
carried on the business formerly carried on by the Fund, with all assets and liabilities transferring to the Company at
their respective carrying values on July 1, 2011. Costs of $0.6 million associated with the Reorganization have been
expensed as incurred and are included in other expenses in the statement of comprehensive income.
Information herein with respect to Hardwoods Distribution Inc. includes information in respect of the Fund prior to
completion of the Reorganization to the extent applicable unless the context otherwise requires. In addition,
references to “common shares” and “shares” should be read as references to “units” for periods prior to July 1, 2011.
HARDWOODS DISTRIBUTION INC. Notes to Consolidated Financial Statements (Tabular amounts expressed in thousands of Canadian dollars) Years ended December 31, 2011 and 2010
Hardwoods Distribution Inc. | 2011 | Annual Report 42
2. Basis of preparation:
(a) Statement of compliance:
These consolidated financial statements of the Company have been prepared in accordance with
International Financial Reporting Standards (“IFRS”) as issued by the International Accounting Standards
Board. These are the Company’s first consolidated annual financial statements prepared in accordance with
IFRS and IFRS 1, First Time Adoption of International Financial Reporting Standards (“IFRS 1”), has been
applied. The preparation of these consolidated financial statements resulted in changes to the accounting
policies adopted by the Company in its previous annual financial statements, which were prepared under
Canadian generally accepted accounting principals (“GAAP”) as issued by the Canadian Institute of
Chartered Accountants. An explanation of how the transition to IFRS has affected the reported financial
position and financial performance of the Company is explained in note 20 to these consolidated financial
statements.
The consolidated financial statements were authorized for issue by the Board of Directors on March 9, 2012.
(b) Basis of measurement:
The consolidated financial statements have been prepared on the historical cost basis, except for the non-
controlling interest’s exchangeable unit liability and long-term incentive plan liability which were recorded in
the statement of financial position at their estimated fair value until July 1, 2011.
(c) Functional and presentation currency:
These consolidated financial statements are presented in Canadian dollars, which is the Company’s
functional currency. All financial information presented in the financial statements, with the exception of per
share/unit amounts, has been rounded to the nearest thousand.
(d) Use of estimates and judgment:
The preparation of financial statements in accordance with IFRS requires management to make judgments,
estimates and assumptions that affect the application of accounting policies and the reported amounts of
assets and liabilities at the date of the financial statements and the reported amounts of revenue and
expenses during the reporting period. Actual amounts may differ from the estimates applied in the
preparation of these financial statements.
Estimates and underlying assumptions are reviewed on an ongoing basis. Revisions to accounting
estimates are recognized in the period in which the estimates are revised and in any future periods affected.
HARDWOODS DISTRIBUTION INC. Notes to Consolidated Financial Statements (Tabular amounts expressed in thousands of Canadian dollars) Years ended December 31, 2011 and 2010
Hardwoods Distribution Inc. | 2011 | Annual Report 43
2. Basis of preparation (continued):
(d) Use of estimates and judgment (continued)
Information about significant areas of estimation uncertainty and critical judgments in applying policies that
have the most significant effect on the amounts recognized in the consolidated financial statements is
included in the following notes:
Note 4 – the estimate of fair values and pro forma sales and profitability associated with the Frank
Paxton business acquisition;
Note 7 – the determination of the allowance for credit loss;
Note 11 – the determination and measurement of provisions and contingencies;
Note 12 – the determination and measurement of finance lease obligations;
Note 13 – the valuation of the non-controlling interest exchangeable units; and
Note 15 – the valuation of deferred income taxes and utilization of tax loss carry forwards.
3. Significant accounting policies:
The significant accounting policies that have been used in the preparation of these consolidated financial
statements are summarized below. These accounting policies have been applied consistently by the Company
and its subsidiaries to all periods presented in these financial statements and in preparing the opening IFRS
statement of financial position at January 1, 2010, as required by IFRS 1.
(a) Principles of consolidation:
These consolidated financial statements include the accounts of the Company and its subsidiaries. All
significant intercompany balances and transactions have been eliminated on consolidation.
Wholly owned subsidiaries of the Company are Hardwoods Specialty Products ULC, Hardwoods LP,
Hardwoods GP, Hardwoods USLP, Hardwoods USGP, Paxton Hardwoods LLC, and Hardwoods Specialty
Products (Washington) Corp.
On January 1, 2012 Hardwoods Specialty Products ULC amalgamated with the Company.
(b) Foreign currencies:
Foreign currency transactions
Foreign currency transactions are translated into the respective functional currencies of the Company and its
subsidiaries, using the exchange rates prevailing at the dates of the transactions. Monetary assets and
liabilities denominated in foreign currencies at the reporting date are translated to the functional currency at
the exchange rate in effect at the financial statement date. The foreign currency gain or loss on monetary
items is the difference between the amortized cost in the functional currency at the beginning of the period,
adjusted for effective interest and payments during the period, and the amortized cost in the foreign currency
translated at the exchange rate at the end of the period. Such exchange gains or losses arising from
translation are recognized in profit and loss for the reporting period.
HARDWOODS DISTRIBUTION INC. Notes to Consolidated Financial Statements (Tabular amounts expressed in thousands of Canadian dollars) Years ended December 31, 2011 and 2010
Hardwoods Distribution Inc. | 2011 | Annual Report 44
3. Significant accounting policies (continued):
(b) Foreign currencies (continued):
Translation of foreign operations for consolidation
For purposes of consolidation, the assets and liabilities of foreign operations with functional currencies other
than the Canadian dollar are translated to Canadian dollars using the rate of exchange in effect at the
financial statement date. Revenue and expenses of the foreign operations are translated to Canadian
dollars at exchange rates at the date of the transactions with the average exchange rate for the period being
used for practical purposes. Foreign currency differences resulting from translation of the accounts of
foreign operations are recognized directly in other comprehensive income and are accumulated in the
translation reserve as a separate component of shareholders equity.
Gains or losses arising from a monetary item receivable from or payable to a foreign operation, the
settlement of which is neither planned nor likely in the foreseeable future, are consider in substance to form
part of the net investment in a foreign operation and are recognized directly in other comprehensive income
in the cumulative amount of foreign currency translation differences.
When a foreign operation is disposed of, the amount of the associated translation reserve is fully transferred
to profit or loss.
(c) Segment reporting:
Operating segments are based on the information about the components of the entity that management
uses to make decisions about operating matters. The subsidiaries of the Company engage in one main
business activity, hence operating segment information is not provided. Geographical segment information
is provided by country of operations in note 17.
(d) Revenue recognition:
Revenue from the sale of hardwood lumber, sheet goods and specialty products is measured by reference
to the fair value of consideration received or receivable by the operating subsidiaries of the Company,
excluding taxes, rebates, and trade discounts. Revenue is recognized when persuasive evidence exists that
the Company has transferred to the buyer the significant risks and rewards of ownership of the goods
supplied, recovery of the consideration is probable and the revenue and associated costs can be measured
reliably. Significant risks and rewards are generally considered to be transferred when the customer has
taken undisputed delivery of the goods.
(e) Finance costs and income:
Finance cost is primarily comprised of interest of the Company’s operating line of credit, changes in the fair
value of the non-controlling interest’s exchangeable units prior to July 1, 2011, and the unwinding of the
discount on the Company’s finance lease obligations. Finance costs also include the amortization of costs
incurred to obtain credit facilities in Canada and the United States. Interest on bank indebtedness and
accretion of the lease obligation is expensed using the effective interest method. Deferred finance costs are
amortized on a straight-line basis over the term of the related credit facility as an effective interest rate
method is not practicable given the revolving debt balances. The change in fair value of the non-controlling
interest units was expensed in the period in which they were incurred.
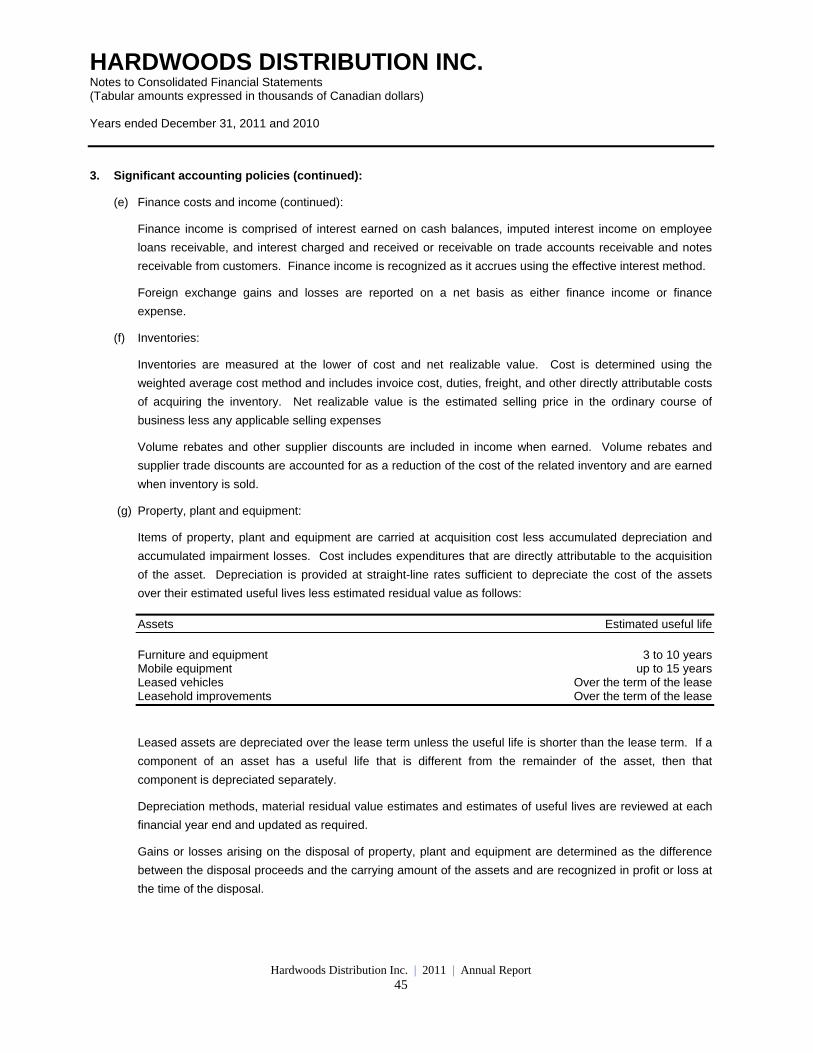
HARDWOODS DISTRIBUTION INC. Notes to Consolidated Financial Statements (Tabular amounts expressed in thousands of Canadian dollars) Years ended December 31, 2011 and 2010
Hardwoods Distribution Inc. | 2011 | Annual Report 45
3. Significant accounting policies (continued):
(e) Finance costs and income (continued):
Finance income is comprised of interest earned on cash balances, imputed interest income on employee
loans receivable, and interest charged and received or receivable on trade accounts receivable and notes
receivable from customers. Finance income is recognized as it accrues using the effective interest method.
Foreign exchange gains and losses are reported on a net basis as either finance income or finance
expense.
(f) Inventories:
Inventories are measured at the lower of cost and net realizable value. Cost is determined using the
weighted average cost method and includes invoice cost, duties, freight, and other directly attributable costs
of acquiring the inventory. Net realizable value is the estimated selling price in the ordinary course of
business less any applicable selling expenses
Volume rebates and other supplier discounts are included in income when earned. Volume rebates and
supplier trade discounts are accounted for as a reduction of the cost of the related inventory and are earned
when inventory is sold.
(g) Property, plant and equipment:
Items of property, plant and equipment are carried at acquisition cost less accumulated depreciation and
accumulated impairment losses. Cost includes expenditures that are directly attributable to the acquisition
of the asset. Depreciation is provided at straight-line rates sufficient to depreciate the cost of the assets
over their estimated useful lives less estimated residual value as follows:
Assets Estimated useful life
Furniture and equipment 3 to 10 years Mobile equipment up to 15 years Leased vehicles Over the term of the lease Leasehold improvements Over the term of the lease
Leased assets are depreciated over the lease term unless the useful life is shorter than the lease term. If a
component of an asset has a useful life that is different from the remainder of the asset, then that
component is depreciated separately.
Depreciation methods, material residual value estimates and estimates of useful lives are reviewed at each
financial year end and updated as required.
Gains or losses arising on the disposal of property, plant and equipment are determined as the difference
between the disposal proceeds and the carrying amount of the assets and are recognized in profit or loss at
the time of the disposal.
HARDWOODS DISTRIBUTION INC. Notes to Consolidated Financial Statements (Tabular amounts expressed in thousands of Canadian dollars) Years ended December 31, 2011 and 2010
Hardwoods Distribution Inc. | 2011 | Annual Report 46
3. Significant accounting policies (continued):
(h) Impairment:
Non-Financial assets
The carrying values of the Company’s non-financial assets are reviewed at each reporting date to assess
whether there is any indication of impairment. If any such indication is present, then the recoverable amount
of the assets is estimated.
The recoverable amount of an asset or cash-generating unit is the greater of its value in use and its fair
value less costs to sell. In assessing value in use, the estimated future cash flows are discounted to their
present value using a pre-tax discount rate that reflects current market assessments of the time value of
money and the risks specific to the asset. For the purposes of impairment testing, assets are grouped at the
lowest levels that generate cash inflows from continuing use that are largely independent of the cash inflows
of other assets or groups of assets (the “cash-generating unit”).
An impairment loss is recognized if the carrying amount of an asset or its cash-generating unit exceeds its
estimated recoverable amount. Impairment losses are recognized in profit and loss. Impairment losses
recognized in prior periods are assessed at each reporting date for any indications that the loss has
decreased or no longer exists. An impairment charge is reversed only to the extent that the asset’s carrying
amount does not exceed the carrying amount that would have been determined, net of depreciation or
amortization, if no impairment loss had been recognized.
Financial assets
A financial asset is assessed at each reporting date to determine whether there is any objective evidence
that it is impaired. A financial asset is considered to be impaired if objective evidence indicates that one or
more events have had a negative effect on the estimated future cash flows of that asset.
Objective evidence that financial assets are impaired can include default or delinquency by a debtor,
restructuring of an amount due to the Company on terms that the Company would not consider otherwise, or
indications that a debtor or issuer will enter bankruptcy.
The Company considers evidence of impairment for financial assets, and in particular receivables, at both a
specific asset and collective level.
All individually significant receivables are assessed for specific impairment. All individually significant
receivables found not to be specifically impaired are then collectively assessed for any impairment that has
been incurred but not yet identified. Receivables that are not individually significant are collectively
assessed for impairment by grouping together receivables with similar risk characteristics. In assessing
collective impairment of receivables, management considers the aging of receivables, the nature and extent
of security held, historical trends of default, and current economic and credit conditions to estimate
impairments.
An impairment loss in respect of a financial asset measured at amortized cost is calculated as the difference
between its carrying amount and the present value of the estimated future cash flows, discounted at the
original effective interest rate.
HARDWOODS DISTRIBUTION INC. Notes to Consolidated Financial Statements (Tabular amounts expressed in thousands of Canadian dollars) Years ended December 31, 2011 and 2010
Hardwoods Distribution Inc. | 2011 | Annual Report 47
3. Significant accounting policies (continued):
(h) Impairment (continued)
Financial assets (continued)
An impairment loss is reversed if the reversal can be related objectively to an event occurring after the
impairment loss is recognized. For financial assets measured at amortized cost, this reversal is recognized
in profit or loss.
(i) Financial instruments:
Financial assets and financial liabilities are recognized when the Company becomes a party to the
contractual provisions of the financial instrument. Financial assets are derecognized when the contractual
rights to the cash flows from the financial asset expire, or when the financial asset and all substantial risks
and rewards are transferred. A financial liability is derecognized when it is extinguished, discharged,
cancelled or expires.
Financial assets and financial liabilities are measured initially at fair value plus transactions cost, except for
financial assets and financial liabilities carried at fair value through profit or loss, which are measured initially
at fair value.
The classification and measurement of the Company’s financial instruments is disclosed in note 6 of these
consolidated financial statements.
Cash and cash equivalents
The Company considers deposits in banks, certificates of deposit and short-term investments with original
maturities of three months or less when acquired as cash and cash equivalents.
Receivables
Loans and receivables are non-derivative financial assets with fixed or determinable payments that are not
quoted in an active market. After initial recognition these are measured at amortized cost using the effective
interest method, less provision for impairment. Discounting is omitted where the effect of discounting is
immaterial.
Individual receivables are considered for impairment when they are past due or when other objective
evidence is received that a specific counterparty will default. Impairment of trade receivables are presented
within “selling and distribution expenses”.
Loans receivable consist of notes from customers discounted using the effective interest method, and loans
to employees for relocation costs, also discounted. Interest revenue on these loans is recognized within
“finance income”.
HARDWOODS DISTRIBUTION INC. Notes to Consolidated Financial Statements (Tabular amounts expressed in thousands of Canadian dollars) Years ended December 31, 2011 and 2010
Hardwoods Distribution Inc. | 2011 | Annual Report 48
3. Significant accounting policies (continued):
(i) Financial instruments (continued):
Financial liabilities
Loans and payables are non-derivative financial liabilities with fixed or determinable payments that are not
quoted in an active market. After initial recognition these liabilities are measured at amortized cost using the
effective interest method, less provision for impairment. Discounting is omitted where the effect of
discounting is immaterial. The revolving bank line of credit is not discounted; rather, actual interest accrued
based on the daily balances is recorded each month.
(j) Income taxes:
Income tax expense comprises current and deferred tax and is recognized in profit and loss. Current
income tax is the expected tax payable on the taxable income for the year, using tax rates enacted or
substantively enacted at the reporting date, and any adjustment to tax payable in respect of the previous
years.
Deferred tax is recognized by the Company and its subsidiaries in respect of temporary differences between
the carrying amount of assets and liabilities for financial reporting purposes and the amounts used for
taxation purposes. Deferred tax is not recognized for the initial recognition of assets or liabilities in a
transaction that is not a business combination and that affects neither accounting nor taxable profit or loss;
differences relating to investments in subsidiaries to the extent that it is probable that they will not reverse in
the foreseeable future; and taxable differences arising on the initial recognition of goodwill.
Deferred tax is measured at the tax rates that are expected to be applied to temporary differences when
they reverse, based on the laws that have been enacted or substantively enacted by the reporting date.
Deferred tax assets and liabilities are offset only when the Company has a legally enforceable right and
intention to set off current tax assets and liabilities from the same taxation authority.
A deferred tax asset is recognized for unused tax losses, tax credits and deductible temporary differences,
to the extent that it is probable that future taxable profits will be available against which they can be utilized.
Deferred tax assets are reviewed at each reporting date and are reduced to the extent that it is no longer
probable that the related tax benefit will be realized.
(k) Leases:
Automobile leases for which the Company assumes substantially all the risks and rewards of ownership are
classified as finance leases. Upon initial recognition the leased asset is measured at an amount equal to the
lower of its fair value and the present value of the minimum lease payments and a lease obligation is
recorded equal to the present value of the minimum lease payments.
Subsequent to initial recognition, the leased asset is accounted for in accordance with the accounting policy
applicable to that asset. Minimum lease payments made under finance leases are apportioned between
finance expense and the reduction of the outstanding liability. The finance expense is allocated to each
period during the lease term so as to produce a constant periodic rate of interest on the remaining balance
of the liability.
HARDWOODS DISTRIBUTION INC. Notes to Consolidated Financial Statements (Tabular amounts expressed in thousands of Canadian dollars) Years ended December 31, 2011 and 2010
Hardwoods Distribution Inc. | 2011 | Annual Report 49
3. Significant accounting policies (continued):
(k) Leases (continued):
Other leases are operating leases and as such the leased assets are not recognized in the Company’s
statement of financial position. Payments made under operating leases are recognized in profit or loss on a
straight-line basis over the term of the lease. Lease incentives received are recognized as an integral part
of the total lease expense, over the term of the lease.
(l) Provisions and contingent liabilities:
Provisions are recognized in the statement of financial position when the Company has a present legal or
constructive obligation as a result of a past event, it is probable that an outflow of economic benefits will be
required to settle the obligation, and a reliable estimate can be made of the amount of the obligation.
Provisions are determined by discounting the expected future cash flows at a pre-tax rate that reflects
current market assessments of the time value of money and the risks specific to the liability.
The Company’s provisions include amounts related to the settlement of litigation and onerous contracts
where the expected benefits to be derived from a contract are lower than the unavoidable cost of meeting
the obligations under the contract.
(m) Basic and diluted profit per Share/Unit:
The Company presents basic and diluted profit per share/unit data for its outstanding common shares/units.
Basic profit per share/unit attributable to shareholders is calculated by dividing profit by the weighted
average number of common shares/units outstanding during the reporting period. Diluted profit per unit is
determined by adjusting the profit attributable to common shareholders/unitholders and the weighted
average number of common shares/units outstanding for the effects of all dilutive potential common
shares/units.
(n) Share based compensation:
The Company has a share based long-term incentive plan as described in note 14(b). The Company is
accounting for the Restricted Shares and Performance Shares as employee equity settled awards whereby
the compensation cost is determined based on the grant date fair value and is recognized as an expense
with a corresponding increase to contributed surplus in equity over the period that the employees
unconditionally become entitled to payment. The amount recognized as an expense is adjusted to reflect
the number of awards for which the related service and non-market vesting conditions are expected to be
met.
Prior to July 1, 2011 the Fund accounted for Restricted Units and Performance Units as cash settled awards
with an expense and corresponding liability being recorded based on the fair value of the share-based
awards at each reporting date being recognized over the period that the employees unconditionally became
entitled to payment.
HARDWOODS DISTRIBUTION INC. Notes to Consolidated Financial Statements (Tabular amounts expressed in thousands of Canadian dollars) Years ended December 31, 2011 and 2010
Hardwoods Distribution Inc. | 2011 | Annual Report 50
3. Significant accounting policies (continued):
(o) New standards and interpretations yet to be adopted:
The following summarizes relevant new standards and interpretations that are effective for future annual
periods.
IFRS 9 - Financial Instruments
In November 2009, the IASB issued IFRS 9 - Financial Instruments, which is the first step in its project to
replace IAS 39 - Financial Instruments: Recognition and Measurement. IFRS 9 establishes the
measurement and classification of financial assets. Under IFRS 9, financial assets are measured either at
fair value through earnings or at amortized cost if certain conditions are met. The effective date of this
standard is January 1, 2015, but early adoption is permitted. The Company will apply this standard to its
financial statements beginning on January 1, 2015. The Company is currently evaluating the impact of IFRS
9 on its financial statements.
IFRS 10 – Consolidated Financial Statements
In May 2011, the IASB issued IFRS 10 – Consolidated Financial Statements. The objective of IFRS 10 is to
establish principles for the presentation and preparation of consolidated financial statements when an entity
controls one or more other entities. The effective date of this standard is January 1, 2013, but early
adoption is permitted. The Company will apply this standard to its financial statements beginning on
January 1, 2013. The adoption of IFRS 10 is not expected to have a significant impact on the Company’s
consolidated financial statements.
IFRS 12 – Disclosure of Interests in Other Entities
In May 2011, the IASB issued IFRS 12 – Disclosure of Interests in Other Entities. The objective of IFRS 12
is to require the disclosure of information that enables users of financial statements to evaluate the nature
of, and risks associated with, its interests in other entities and the effects of those interests on its financial
position, financial performance and cash flows. The effective date of this standard is January 1, 2013, but
early adoption is permitted. The Company will apply this standard to its financial statements beginning on
January 1, 2013. The Company is currently evaluating the impact of IFRS 12 on its financial statements..
IFRS 13 – Fair Value Measurement
In May 2011, the IASB issued IFRS 13 – Fair Value Measurement. The objective of IFRS 13 is to define fair
value, set out in a single IFRS framework for measuring fair value, and establish disclosure requirements
regarding fair value measurements. The effective date of this standard is January 1, 2013, but early
adoption is permitted. The Company will apply this standard to its financial statements beginning on
January 1, 2013. The Company is currently evaluating the impact of IFRS 13 on its financial statements.
HARDWOODS DISTRIBUTION INC. Notes to Consolidated Financial Statements (Tabular amounts expressed in thousands of Canadian dollars) Years ended December 31, 2011 and 2010
Hardwoods Distribution Inc. | 2011 | Annual Report 51
4. Business acquisition:
On September 19, 2011 a subsidiary of the Company purchased certain assets of Frank Paxton Lumber
Company (“Paxton”) with the intention to continue operations of the business. Paxton is a US based
remanufacturer and distributor of hardwood lumber, millwork and sheet goods, with branch operations in San
Antonio, Denver, Cincinnati, Kansas City and Chicago. The Company purchased the trade accounts receivable,
inventory, and property, plant and equipment of Paxton for cash consideration of $13.7 million (US$13.9 million)
and hired Paxton’s employees to continue operating the business. As part of the agreement certain accounts
receivable totaling $0.2 million not subsequently collected were returned to the seller with the amount recorded
at December 31, 2011 as a short term other receivable.
The acquisition has been accounted for as a business combination. The allocation of the purchase price to
identified assets acquired is as follows:
Trade accounts receivable $ 3,972 Inventory 5,769 Property, plant and equipment 3,931 Intangible asset 21 Cash paid 13,693 Receivable adjustment (179) Net investment $ 13,514
Costs associated with the acquisition of $0.2 million have been expensed as incurred and are included in other
expenses in the statement of comprehensive income.
As part of the acquisition, buildings have been leased from the previous owner at market rates. Liabilities were
not assumed with the exception of equipment and truck leases, which are classified as operating leases. The
lease obligations at the date of acquisition were as follows:
Within One to After Minimum lease payments due one year five years five years Total
Buildings $ 1,048 $ 4,193 $ - $ 5,241 Equipment and vehicles 86 67 - 153
Had the acquisition occurred on January 1, 2011 management estimates that the Company’s consolidated sales
would have been $280.2 million and profit would have been $7.1 million for the year ended December 31, 2011.
Included in these consolidated financial statements for the period from September 19 to December 31, 2011 for
Paxton are sales of $13.6 million and profit of $0.1 million.
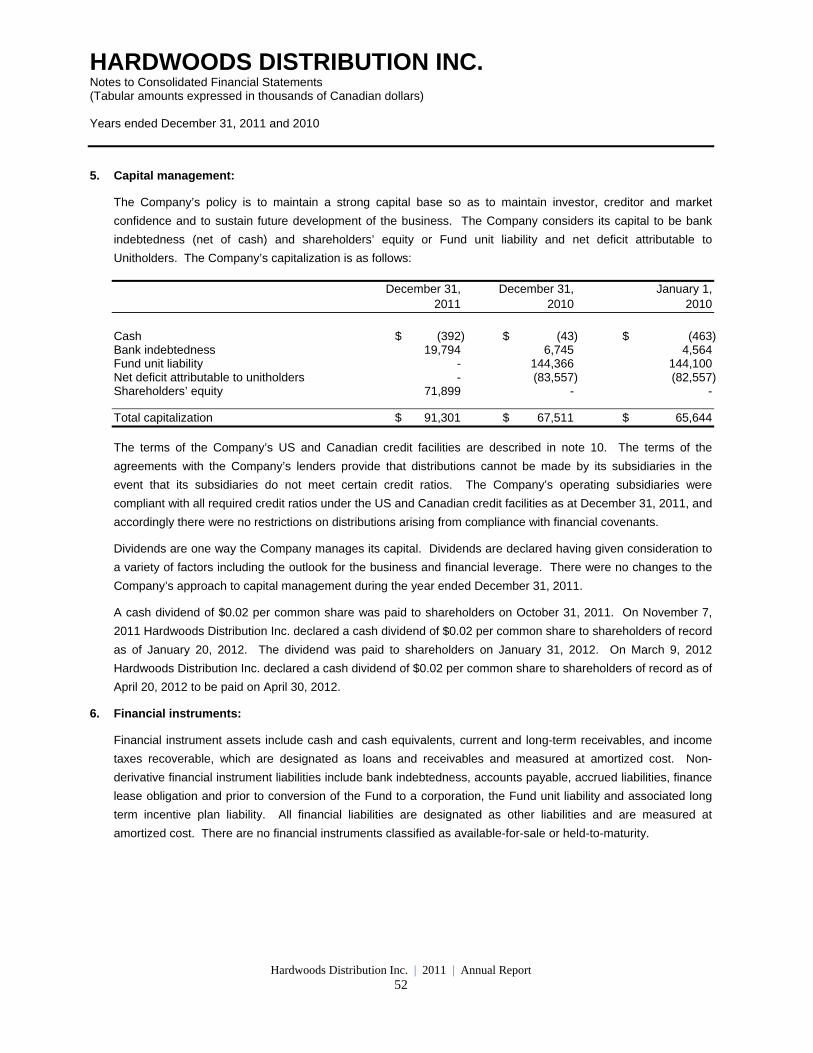
HARDWOODS DISTRIBUTION INC. Notes to Consolidated Financial Statements (Tabular amounts expressed in thousands of Canadian dollars) Years ended December 31, 2011 and 2010
Hardwoods Distribution Inc. | 2011 | Annual Report 52
5. Capital management:
The Company’s policy is to maintain a strong capital base so as to maintain investor, creditor and market
confidence and to sustain future development of the business. The Company considers its capital to be bank
indebtedness (net of cash) and shareholders’ equity or Fund unit liability and net deficit attributable to
Unitholders. The Company’s capitalization is as follows:
December 31, December 31, January 1, 2011 2010 2010
Cash $ (392) $ (43) $ (463) Bank indebtedness 19,794 6,745 4,564 Fund unit liability - 144,366 144,100 Net deficit attributable to unitholders - (83,557) (82,557) Shareholders’ equity 71,899 - -
Total capitalization $ 91,301 $ 67,511 $ 65,644
The terms of the Company’s US and Canadian credit facilities are described in note 10. The terms of the
agreements with the Company’s lenders provide that distributions cannot be made by its subsidiaries in the
event that its subsidiaries do not meet certain credit ratios. The Company’s operating subsidiaries were
compliant with all required credit ratios under the US and Canadian credit facilities as at December 31, 2011, and
accordingly there were no restrictions on distributions arising from compliance with financial covenants.
Dividends are one way the Company manages its capital. Dividends are declared having given consideration to
a variety of factors including the outlook for the business and financial leverage. There were no changes to the
Company’s approach to capital management during the year ended December 31, 2011.
A cash dividend of $0.02 per common share was paid to shareholders on October 31, 2011. On November 7,
2011 Hardwoods Distribution Inc. declared a cash dividend of $0.02 per common share to shareholders of record
as of January 20, 2012. The dividend was paid to shareholders on January 31, 2012. On March 9, 2012
Hardwoods Distribution Inc. declared a cash dividend of $0.02 per common share to shareholders of record as of
April 20, 2012 to be paid on April 30, 2012.
6. Financial instruments:
Financial instrument assets include cash and cash equivalents, current and long-term receivables, and income
taxes recoverable, which are designated as loans and receivables and measured at amortized cost. Non-
derivative financial instrument liabilities include bank indebtedness, accounts payable, accrued liabilities, finance
lease obligation and prior to conversion of the Fund to a corporation, the Fund unit liability and associated long
term incentive plan liability. All financial liabilities are designated as other liabilities and are measured at
amortized cost. There are no financial instruments classified as available-for-sale or held-to-maturity.
HARDWOODS DISTRIBUTION INC. Notes to Consolidated Financial Statements (Tabular amounts expressed in thousands of Canadian dollars) Years ended December 31, 2011 and 2010
Hardwoods Distribution Inc. | 2011 | Annual Report 53
6. Financial instruments (continued):
Fair values of financial instruments
The carrying values of cash and cash equivalents, accounts receivable, income tax recoverable, and accounts
payable accrued liabilities approximate their fair values due to the relatively short period to maturity of the
instruments. The fair value of long-term receivables and finance lease obligations are not expected to differ
materially from their respective carrying values, given the interest rates being charged. The carrying values of
the credit facilities approximate their fair values due to the existence of floating market based interest rates. The
fair value of these non-derivative financial assets and liabilities has been estimated based on the present value
of future cash flows, discounted at a market rate of interest at the reporting date.
The fair value of the Fund Unit liability at December 31, 2010, based on the quoted market price of the Fund
Units was $34.0 million (January 1, 2010 - $28.8 million).
Derivative financial instruments
The Fund’s non-controlling interest exchangeable unit liability (note 13) was recorded at fair value each reporting
period, until their conversion to shares of the Company on July 1, 2011 (notes 1 and 14). The fair value was
determined based on quoted market prices of the Fund’s units adjusted to reflect the impact of the subordination
arrangement in effect.
Financial risk management:
The Board of Directors of the Company and its subsidiaries has the overall responsibility for the establishment
and oversight of the Company’s risk management framework. The Company’s risk management policies are
established to identify and analyze the risks faced by the Company, to set appropriate risk limits and controls,
and to monitor risks and adherence to limits. Risk management policies and systems are reviewed regularly to
reflect changes in market conditions and in response to the Company’s activities. Through its standards and
procedures management has developed a disciplined and constructive control environment in which all
employees understand their roles and obligations. Management regularly monitors compliance with the
Company’s risk management policies and procedures and reviews the adequacy of the risk management
framework in relation to the risks faced by the Company.
The Company has exposure to credit, liquidity and market risks from its use of financial instruments.
(i) Credit risk:
Credit risk is the risk of financial loss to the Company if a customer or counterparty to a financial instrument
fails to meet its contractual obligations. Credit risk arises principally from the Company’s current and long-
term receivables from its customers. Cash held at banks, employee housing loans and security deposits
also present credit risk to the Company. The carrying value of these financial assets, which total $35.1
million at December 31, 2011, represents the Company’s maximum exposure to credit risk.
HARDWOODS DISTRIBUTION INC. Notes to Consolidated Financial Statements (Tabular amounts expressed in thousands of Canadian dollars) Years ended December 31, 2011 and 2010
Hardwoods Distribution Inc. | 2011 | Annual Report 54
6. Financial instruments (continued):
Financial risk management (continued):
(i) Credit risk (continued):
Trade accounts receivable:
The Company’s exposure to credit risk is influenced mainly by the individual characteristics of each
customer. The Company is exposed to credit risk in the event it is unable to collect in full amounts
receivable from its customers. The Company employs established credit approval practices and engages
credit attorneys when appropriate to mitigate credit risk. It is the Company’s policy to secure credit
advanced to customers whenever possible by registering security interests in the assets of the customer and
by obtaining personal guarantees. Credit limits are established for each customer and are regularly
reviewed. In some instances the Company may choose to transact with a customer on a cash-on-delivery
basis. The Company’s largest individual customer balance amounted to 7.4% (2010 – 8.1%) of trade
accounts receivable and customer notes receivable at December 31, 2011. No one customer represents
more than 2.5% of sales.
More detailed information regarding management of trade accounts receivable is found in note 7 to these
consolidated financial statements.
Employee housing loans:
Employee loans are non-interest bearing and are granted to employees who are relocated. Employee loans
are secured by a deed of trust or mortgage depending upon the jurisdiction. Employee loans are repaid in
accordance with the loan agreement. These loans are measured at their fair market value upon granting the
loan and subsequently measured at amortized cost.
Customer notes:
Customer notes are issued to certain customers to provide fixed repayment schedules for amounts owing
that have been agreed will be repaid over longer periods of time. The terms of each note are negotiated
with the customer. For notes issued the Company requires a fixed payment amount, personal guarantees,
general security agreements, and security over specific property or assets. Customer notes bear market
interest rates ranging from 5%-18%.
Security deposits:
Security deposits are recoverable on leased premises at the end of the related lease term. The Company
does not believe there is any material credit risk associated with its security deposits.
HARDWOODS DISTRIBUTION INC. Notes to Consolidated Financial Statements (Tabular amounts expressed in thousands of Canadian dollars) Years ended December 31, 2011 and 2010
Hardwoods Distribution Inc. | 2011 | Annual Report 55
6. Financial instruments (continued):
Financial risk management (continued):
(ii) Liquidity risk:
Liquidity risk is the risk that the Company will not be able to meet its financial obligations as they fall due.
The Company’s approach to managing liquidity is to ensure that it will have sufficient cash available to meet
its liabilities when due, under both normal and stressed conditions, without incurring unacceptable losses or
risking damage to the Company’s reputation. At December 31, 2011, in Canada, a subsidiary of the
Company had a revolving credit facility of up to $15.0 million. In the US, a subsidiary of the Company had a
revolving credit facility of up to $30.5 million (US$30.0 million). These credit facilities can be drawn down to
meet short-term financing requirements, including fluctuations in non-cash working capital. The amount
made available under the revolving credit facilities from time to time is limited to the extent of the value of
certain accounts receivable and inventories held by subsidiaries of the Company, as well as by continued
compliance with credit ratios and certain other terms under the credit facilities. At December 31, 2011 the
Canadian and U.S. credit facilities had $6.9 million and $14.4 million (US$14.1 million), respectively, of
additional borrowing capacity.
The Company’s accounts payable and accrued liabilities are subject to normal trade terms and have
contracted materialities that will result in payment in the following quarter. The undiscounted contractual
maturities of finance lease obligations is presented in note 12 to these financial statements.
(iii) Market risk:
Market risk is the risk that changes in market prices, such as interest rates, foreign exchange rates, and
commodity prices will affect the Company’s net earnings or value of its holdings of financial instruments.
Interest rate risk:
The Company is exposed to interest rate risk on its credit facilities which bear interest at floating market
rates.
Based upon December 31, 2011 bank indebtedness balance of $19.8 million, a 1% increase or decrease in
the interest rates charged would result in decrease or increase to annual net earnings by approximately
$198,000.
HARDWOODS DISTRIBUTION INC. Notes to Consolidated Financial Statements (Tabular amounts expressed in thousands of Canadian dollars) Years ended December 31, 2011 and 2010
Hardwoods Distribution Inc. | 2011 | Annual Report 56
6. Financial instruments (continued):
Financial risk management (continued):
(iii) Market risk (continued):
Currency risk:
As the Company conducts business in both Canada and the United States it is exposed to currency risk.
Most of the hardwood lumber sold by the Company in Canada is purchased in U.S. dollars from suppliers in
the United States. Although the Company reports its financial results in Canadian dollars, approximately
two-thirds of its sales are generated in the United States. Changes in the currency exchange rates of the
Canadian dollar against the U.S. dollar will affect the results presented in the Company’s financial
statements and cause its earnings to fluctuate. Changes in the costs of hardwood lumber purchased by the
Company in the United States as a result of the changing value of the Canadian dollar against the U.S.
dollar are usually absorbed by the Canadian market. When the hardwood lumber is resold in Canada it is
generally sold at a Canadian dollar equivalent selling price, and accordingly revenues in Canada are
effectively increased by decreases in value of the Canadian dollar and vice versa. Fluctuations in the value
of the Canadian dollar against the U.S. dollar will affect the amount of cash available to the Company for
distribution to its Shareholders.
At December 31, 2011 the Company’s Canadian subsidiaries primary exposure to foreign denominated
working capital financial instruments was in relation to accounts receivable from U.S. customers (2011 -
US$0.2 million, 2010 – US$0.2 million), income taxes recoverable (2011 - nil, 2010 – US$1.9 million), and
accounts payable to U.S. suppliers (2011 - $0.3 million, 2010 – US$0.2 million).
Based on the Company's exposure to foreign denominated financial instruments, the Company estimates a
$0.05 weakening in the Canadian dollar as compared to the U.S. dollar would have reduced the net income
for the year ended December 31, 2011 by approximately $0.1 million (2010 - $0.1 million). A $0.05
strengthening of the Canadian dollar as compared to the U.S. dollar would have had the equal but opposite
effect.
This foreign currency sensitivity is focused solely on the currency risk associated with the Company’s
Canadian subsidiaries exposure to foreign denominated financial instruments as at December 31, 2011 and
does not take into account the effect of a change in currency rates will have on the translation of the balance
sheet and operations of the Company’s U.S. subsidiaries nor is it intended to estimate the potential impact
changes in currency rates would have on the Company’s sales and purchases.
Commodity price risk:
The Company does not enter in to any commodity contracts. Inventory purchases are transacted at current
market rates based on expected usage and sale requirements and increases or decreases in prices are
reflected in the Company’s selling prices to customers.
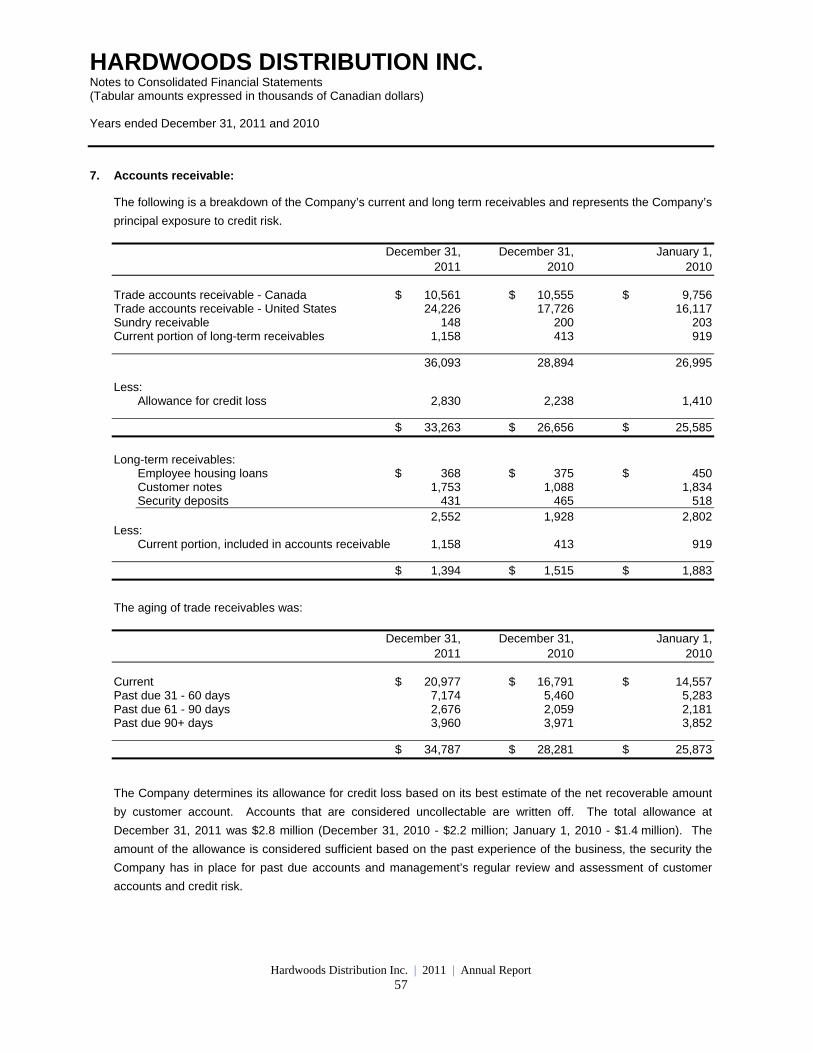
HARDWOODS DISTRIBUTION INC. Notes to Consolidated Financial Statements (Tabular amounts expressed in thousands of Canadian dollars) Years ended December 31, 2011 and 2010
Hardwoods Distribution Inc. | 2011 | Annual Report 57
7. Accounts receivable:
The following is a breakdown of the Company’s current and long term receivables and represents the Company’s
principal exposure to credit risk.
December 31, December 31, January 1, 2011 2010 2010
Trade accounts receivable - Canada $ 10,561 $ 10,555 $ 9,756 Trade accounts receivable - United States 24,226 17,726 16,117 Sundry receivable 148 200 203 Current portion of long-term receivables 1,158 413 919
36,093 28,894 26,995
Less: Allowance for credit loss 2,830 2,238 1,410
$ 33,263 $ 26,656 $ 25,585
Long-term receivables:
Employee housing loans $ 368 $ 375 $ 450 Customer notes 1,753 1,088 1,834 Security deposits 431 465 518 2,552 1,928 2,802
Less: Current portion, included in accounts receivable 1,158 413 919
$ 1,394 $ 1,515 $ 1,883
The aging of trade receivables was:
December 31, December 31, January 1, 2011 2010 2010
Current $ 20,977 $ 16,791 $ 14,557 Past due 31 - 60 days 7,174 5,460 5,283 Past due 61 - 90 days 2,676 2,059 2,181 Past due 90+ days 3,960 3,971 3,852
$ 34,787 $ 28,281 $ 25,873
The Company determines its allowance for credit loss based on its best estimate of the net recoverable amount
by customer account. Accounts that are considered uncollectable are written off. The total allowance at
December 31, 2011 was $2.8 million (December 31, 2010 - $2.2 million; January 1, 2010 - $1.4 million). The
amount of the allowance is considered sufficient based on the past experience of the business, the security the
Company has in place for past due accounts and management’s regular review and assessment of customer
accounts and credit risk.
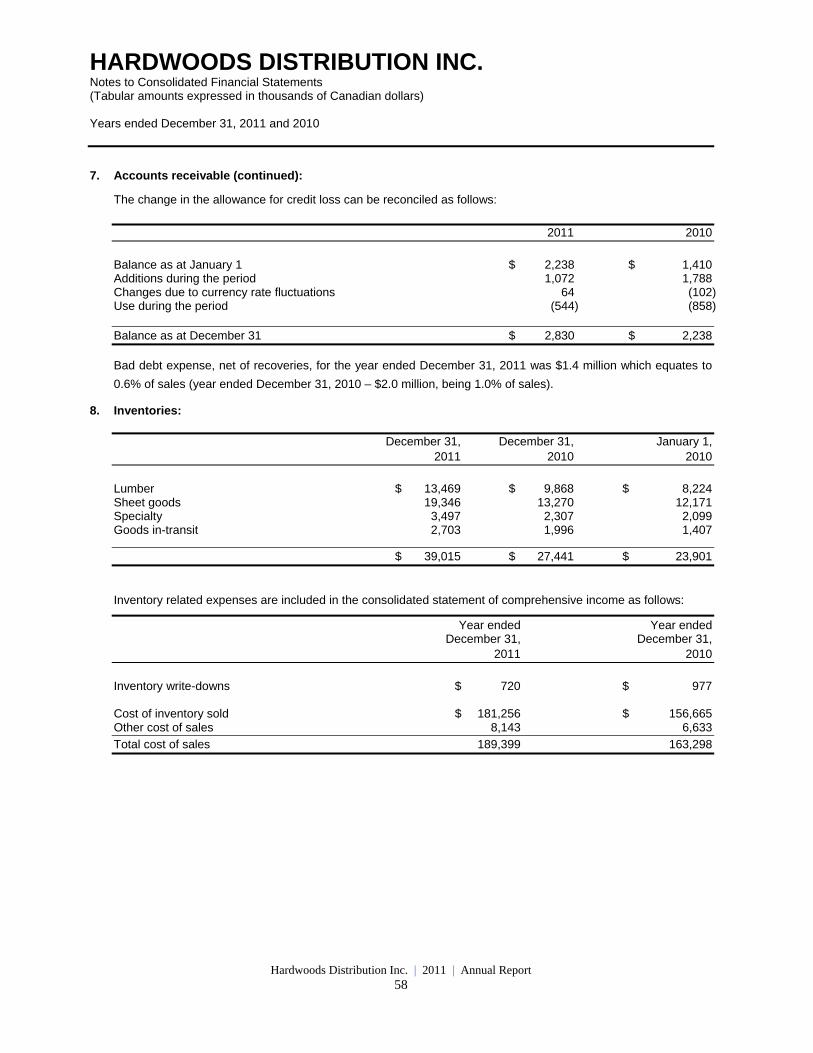
HARDWOODS DISTRIBUTION INC. Notes to Consolidated Financial Statements (Tabular amounts expressed in thousands of Canadian dollars) Years ended December 31, 2011 and 2010
Hardwoods Distribution Inc. | 2011 | Annual Report 58
7. Accounts receivable (continued):
The change in the allowance for credit loss can be reconciled as follows:
2011 2010
Balance as at January 1 $ 2,238 $ 1,410 Additions during the period 1,072 1,788 Changes due to currency rate fluctuations 64 (102) Use during the period (544) (858) Balance as at December 31 $ 2,830 $ 2,238
Bad debt expense, net of recoveries, for the year ended December 31, 2011 was $1.4 million which equates to
0.6% of sales (year ended December 31, 2010 – $2.0 million, being 1.0% of sales).
8. Inventories:
December 31, December 31, January 1, 2011 2010 2010
Lumber $ 13,469 $ 9,868 $ 8,224 Sheet goods 19,346 13,270 12,171 Specialty 3,497 2,307 2,099 Goods in-transit 2,703 1,996 1,407
$ 39,015 $ 27,441 $ 23,901
Inventory related expenses are included in the consolidated statement of comprehensive income as follows:
Year ended Year ended December 31, December 31, 2011 2010
Inventory write-downs $ 720 $ 977
Cost of inventory sold $ 181,256 $ 156,665 Other cost of sales 8,143 6,633
Total cost of sales 189,399 163,298
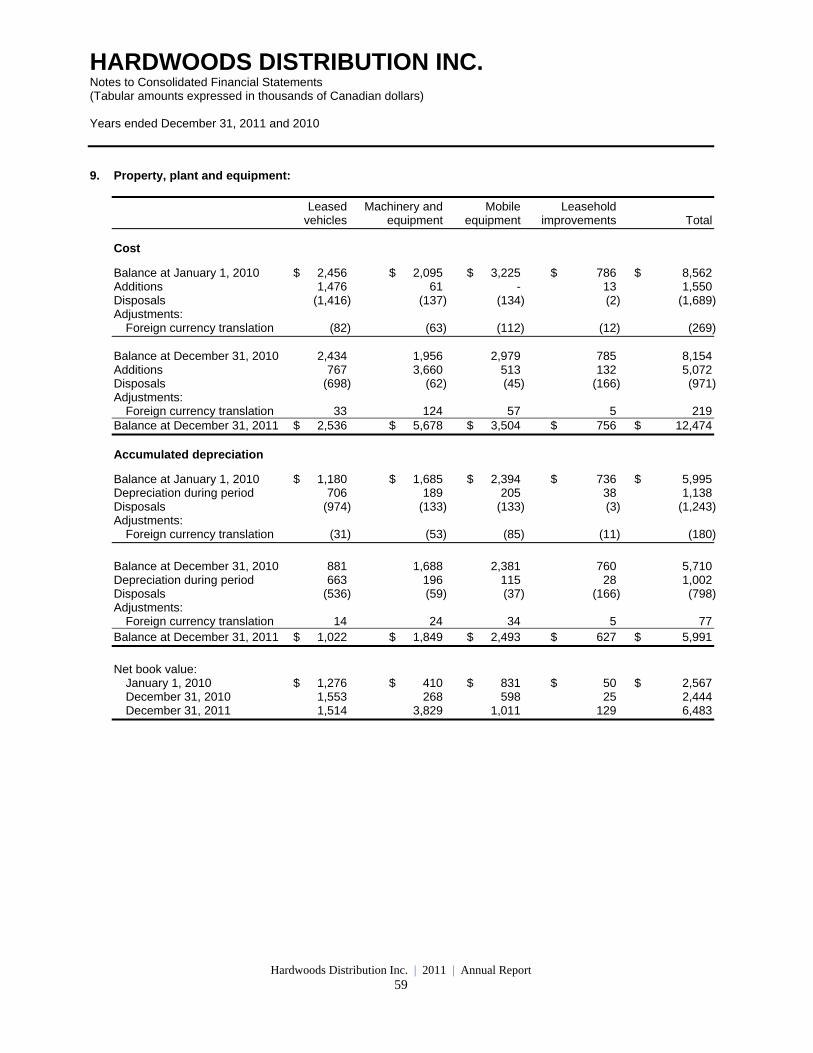
HARDWOODS DISTRIBUTION INC. Notes to Consolidated Financial Statements (Tabular amounts expressed in thousands of Canadian dollars) Years ended December 31, 2011 and 2010
Hardwoods Distribution Inc. | 2011 | Annual Report 59
9. Property, plant and equipment:
Leased Machinery and Mobile Leasehold vehicles equipment equipment improvements Total
Cost
Balance at January 1, 2010 $ 2,456 $ 2,095 $ 3,225 $ 786 $ 8,562 Additions 1,476 61 - 13 1,550 Disposals (1,416) (137) (134) (2) (1,689) Adjustments:
Foreign currency translation (82) (63) (112) (12) (269)
Balance at December 31, 2010 2,434 1,956 2,979 785 8,154 Additions 767 3,660 513 132 5,072 Disposals (698) (62) (45) (166) (971) Adjustments:
Foreign currency translation 33 124 57 5 219 Balance at December 31, 2011 $ 2,536 $ 5,678 $ 3,504 $ 756 $ 12,474
Accumulated depreciation
Balance at January 1, 2010 $ 1,180 $ 1,685 $ 2,394 $ 736 $ 5,995 Depreciation during period 706 189 205 38 1,138 Disposals (974) (133) (133) (3) (1,243) Adjustments:
Foreign currency translation (31) (53) (85) (11) (180)
Balance at December 31, 2010 881 1,688 2,381 760 5,710 Depreciation during period 663 196 115 28 1,002 Disposals (536) (59) (37) (166) (798) Adjustments:
Foreign currency translation 14 24 34 5 77 Balance at December 31, 2011 $ 1,022 $ 1,849 $ 2,493 $ 627 $ 5,991
Net book value:
January 1, 2010 $ 1,276 $ 410 $ 831 $ 50 $ 2,567 December 31, 2010 1,553 268 598 25 2,444 December 31, 2011 1,514 3,829 1,011 129 6,483
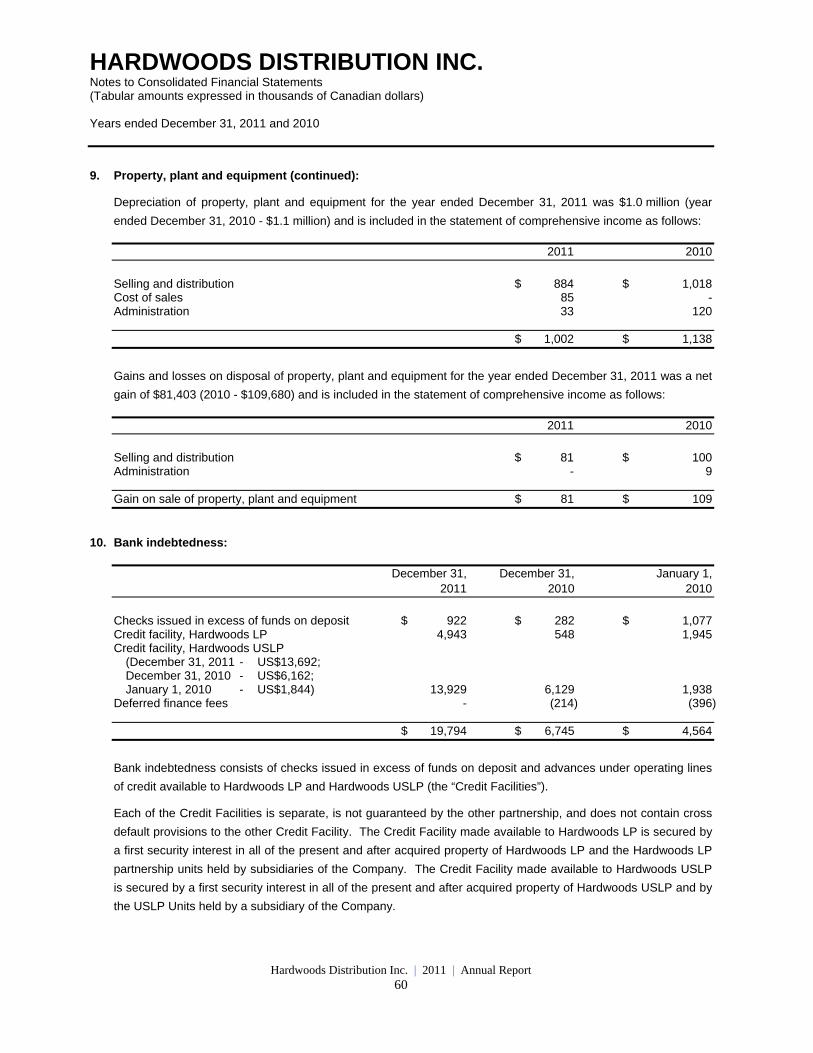
HARDWOODS DISTRIBUTION INC. Notes to Consolidated Financial Statements (Tabular amounts expressed in thousands of Canadian dollars) Years ended December 31, 2011 and 2010
Hardwoods Distribution Inc. | 2011 | Annual Report 60
9. Property, plant and equipment (continued):
Depreciation of property, plant and equipment for the year ended December 31, 2011 was $1.0 million (year
ended December 31, 2010 - $1.1 million) and is included in the statement of comprehensive income as follows:
2011 2010
Selling and distribution $ 884 $ 1,018 Cost of sales 85 - Administration 33 120
$ 1,002 $ 1,138
Gains and losses on disposal of property, plant and equipment for the year ended December 31, 2011 was a net
gain of $81,403 (2010 - $109,680) and is included in the statement of comprehensive income as follows:
2011 2010
Selling and distribution $ 81 $ 100 Administration - 9
Gain on sale of property, plant and equipment $ 81 $ 109
10. Bank indebtedness:
December 31, December 31, January 1, 2011 2010 2010
Checks issued in excess of funds on deposit $ 922 $ 282 $ 1,077 Credit facility, Hardwoods LP 4,943 548 1,945 Credit facility, Hardwoods USLP
(December 31, 2011 - US$13,692; December 31, 2010 - US$6,162; January 1, 2010 - US$1,844) 13,929 6,129 1,938
Deferred finance fees - (214) (396)
$ 19,794 $ 6,745 $ 4,564
Bank indebtedness consists of checks issued in excess of funds on deposit and advances under operating lines
of credit available to Hardwoods LP and Hardwoods USLP (the “Credit Facilities”).
Each of the Credit Facilities is separate, is not guaranteed by the other partnership, and does not contain cross
default provisions to the other Credit Facility. The Credit Facility made available to Hardwoods LP is secured by
a first security interest in all of the present and after acquired property of Hardwoods LP and the Hardwoods LP
partnership units held by subsidiaries of the Company. The Credit Facility made available to Hardwoods USLP
is secured by a first security interest in all of the present and after acquired property of Hardwoods USLP and by
the USLP Units held by a subsidiary of the Company.
HARDWOODS DISTRIBUTION INC. Notes to Consolidated Financial Statements (Tabular amounts expressed in thousands of Canadian dollars) Years ended December 31, 2011 and 2010
Hardwoods Distribution Inc. | 2011 | Annual Report 61
10. Bank indebtedness (continued):
The Hardwoods LP Credit Facility, which was extended to August 7, 2016 during the fourth quarter of 2011,
provides financing up to $15.0 million. During the three month period ended September 30, 2011, Hardwoods
USLP amended its credit facility in conjunction with the Paxton acquisition, increasing the maximum borrowing
available under the credit facility from US$25 million to US$30 million. The Hardwoods USLP credit facility has a
four year term with a maturity date of May 26, 2015. Each facility is payable in full at maturity. Both Hardwoods
Credit Facilities are revolving credit facilities which Hardwoods may terminate at any time without prepayment
penalty. The Credit Facilities bear interest at a floating rate based on the Canadian or US prime rate (as the
case may be), LIBOR or bankers acceptance rates plus, in each case, an applicable margin. Letters of credit are
also available under the Credit Facilities on customary terms for facilities of this nature. Commitment fees and
standby charges usual for borrowings of this nature were and are payable.
The amount made available under the Credit Facility to Hardwoods LP from time to time is limited to the extent of
85% of the book value of accounts receivable and the lesser of 60% of the book value or 85% of appraised value
of inventories with the amount based on inventories not to exceed 60% of the total amount to be available.
Certain identified accounts receivable and inventories are excluded from the calculation of the amount available
under the Credit Facility. Hardwoods LP is required to maintain a fixed charge coverage ratio (calculated as the
ratio of EBITDA less cash taxes less capital expenditures less distributions, divided by interest plus principal
payments on capital lease obligations) of not less than 1.1 to 1. However, this covenant does not apply so long
as the unused availability under the credit line is in excess of $2.0 million. At December 31, 2011, the
Hardwoods LP credit facility had $6.9 million of available borrowing capacity.
The amount to be made available under the Credit Facility to Hardwoods USLP from time to time is limited to the
extent of 85% of the book value of certain accounts receivable and 55% of the book value of inventories (with
certain accounts receivable and inventory being excluded). Hardwoods USLP is required to maintain a fixed
charge coverage ratio (calculated as EBITDA less cash taxes less capital expenditures, divided by interest plus
distributions) of 1.0 to 1. This covenant of the Hardwoods USLP Credit Facility does not need to be met however
when the unused availability under the credit facility is in excess of US$2.5 million. At December 31, 2011, the
Hardwoods USLP credit facility had unused availability of $14.4 million (US$14.1 million).
The average annual interest rates paid in respect of bank indebtedness for the year ended December 31, 2011
were 3.84% and 3.55% (2010 – 4.79% and 5.88%) for the Hardwoods LP and Hardwoods USLP credit facilities,
respectively. In addition, standby fees of 0.25% and 0.25% (2010 – 0.5% and 0.75%) related to the unused
portion of the credit facilities was charged by the banks for Hardwoods LP and Hardwoods USLP respectively.
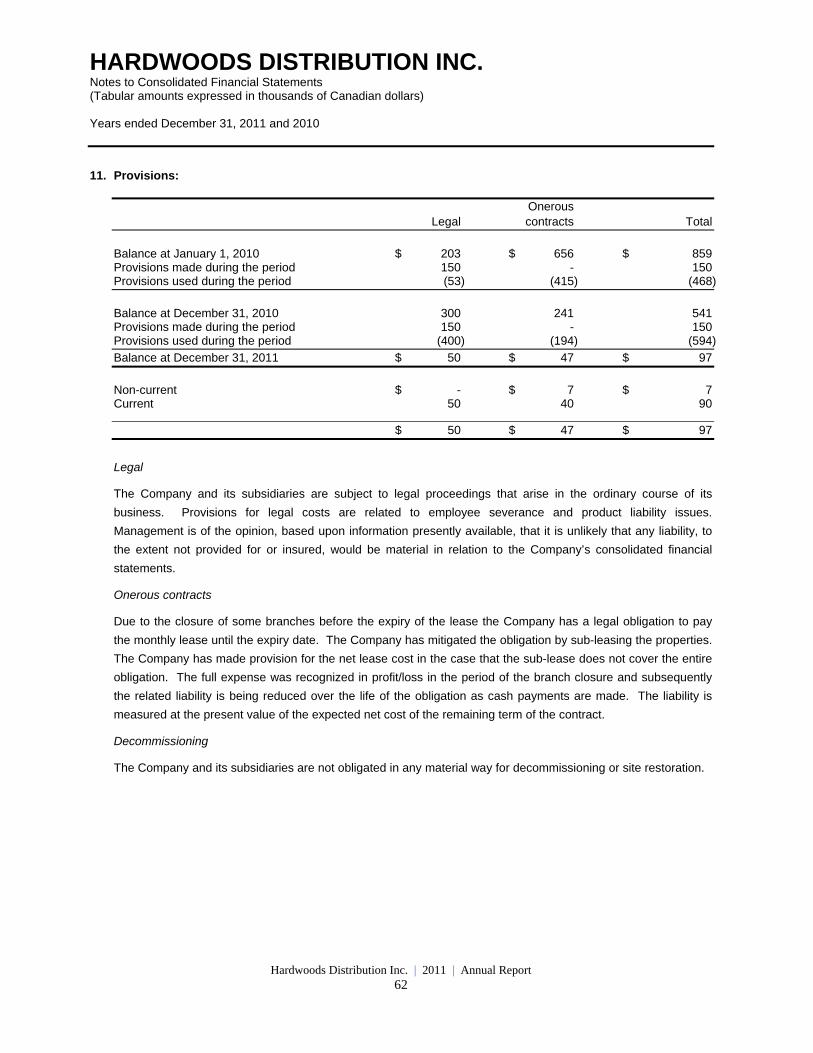
HARDWOODS DISTRIBUTION INC. Notes to Consolidated Financial Statements (Tabular amounts expressed in thousands of Canadian dollars) Years ended December 31, 2011 and 2010
Hardwoods Distribution Inc. | 2011 | Annual Report 62
11. Provisions:
Onerous Legal contracts Total
Balance at January 1, 2010 $ 203 $ 656 $ 859 Provisions made during the period 150 - 150 Provisions used during the period (53) (415) (468)
Balance at December 31, 2010 300 241 541 Provisions made during the period 150 - 150 Provisions used during the period (400) (194) (594)
Balance at December 31, 2011 $ 50 $ 47 $ 97
Non-current $ - $ 7 $ 7 Current 50 40 90
$ 50 $ 47 $ 97
Legal
The Company and its subsidiaries are subject to legal proceedings that arise in the ordinary course of its
business. Provisions for legal costs are related to employee severance and product liability issues.
Management is of the opinion, based upon information presently available, that it is unlikely that any liability, to
the extent not provided for or insured, would be material in relation to the Company’s consolidated financial
statements.
Onerous contracts
Due to the closure of some branches before the expiry of the lease the Company has a legal obligation to pay
the monthly lease until the expiry date. The Company has mitigated the obligation by sub-leasing the properties.
The Company has made provision for the net lease cost in the case that the sub-lease does not cover the entire
obligation. The full expense was recognized in profit/loss in the period of the branch closure and subsequently
the related liability is being reduced over the life of the obligation as cash payments are made. The liability is
measured at the present value of the expected net cost of the remaining term of the contract.
Decommissioning
The Company and its subsidiaries are not obligated in any material way for decommissioning or site restoration.
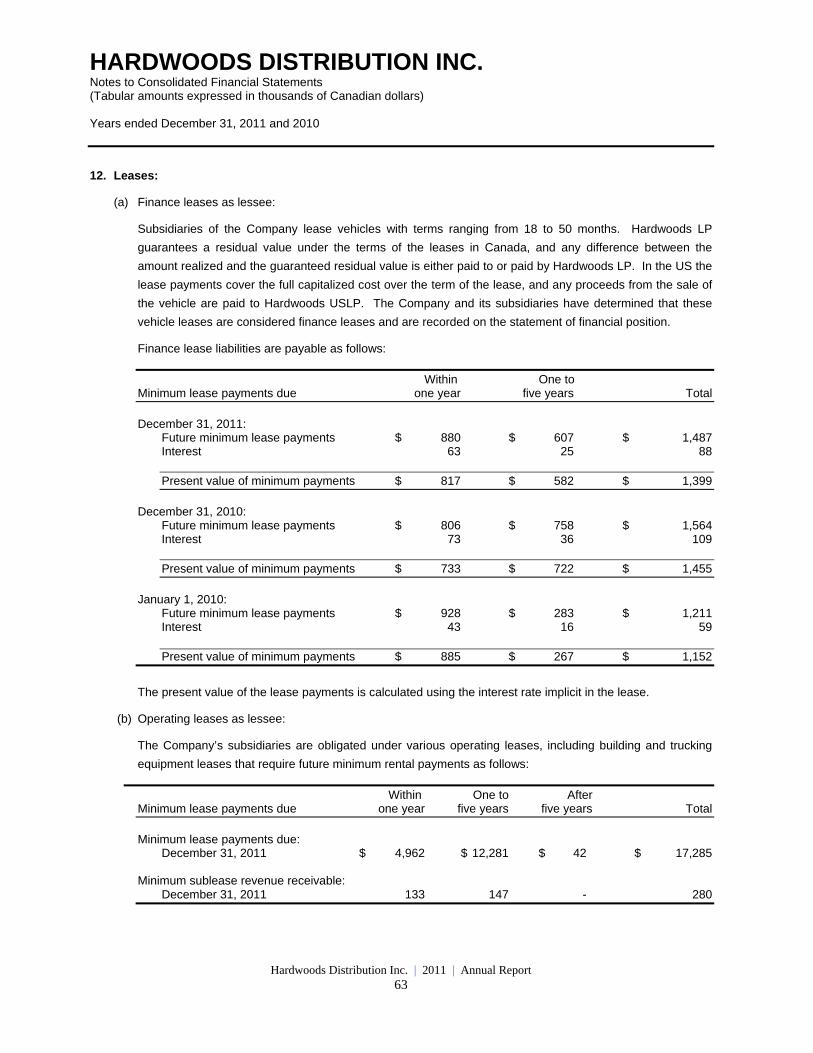
HARDWOODS DISTRIBUTION INC. Notes to Consolidated Financial Statements (Tabular amounts expressed in thousands of Canadian dollars) Years ended December 31, 2011 and 2010
Hardwoods Distribution Inc. | 2011 | Annual Report 63
12. Leases:
(a) Finance leases as lessee:
Subsidiaries of the Company lease vehicles with terms ranging from 18 to 50 months. Hardwoods LP
guarantees a residual value under the terms of the leases in Canada, and any difference between the
amount realized and the guaranteed residual value is either paid to or paid by Hardwoods LP. In the US the
lease payments cover the full capitalized cost over the term of the lease, and any proceeds from the sale of
the vehicle are paid to Hardwoods USLP. The Company and its subsidiaries have determined that these
vehicle leases are considered finance leases and are recorded on the statement of financial position.
Finance lease liabilities are payable as follows:
Within One to Minimum lease payments due one year five years Total
December 31, 2011:
Future minimum lease payments $ 880 $ 607 $ 1,487 Interest 63 25 88 Present value of minimum payments $ 817 $ 582 $ 1,399
December 31, 2010:
Future minimum lease payments $ 806 $ 758 $ 1,564 Interest 73 36 109 Present value of minimum payments $ 733 $ 722 $ 1,455
January 1, 2010:
Future minimum lease payments $ 928 $ 283 $ 1,211 Interest 43 16 59 Present value of minimum payments $ 885 $ 267 $ 1,152
The present value of the lease payments is calculated using the interest rate implicit in the lease.
(b) Operating leases as lessee:
The Company’s subsidiaries are obligated under various operating leases, including building and trucking
equipment leases that require future minimum rental payments as follows:
Within One to After Minimum lease payments due one year five years five years Total
Minimum lease payments due:
December 31, 2011 $ 4,962 $ 12,281 $ 42 $ 17,285 Minimum sublease revenue receivable:
December 31, 2011 133 147 - 280
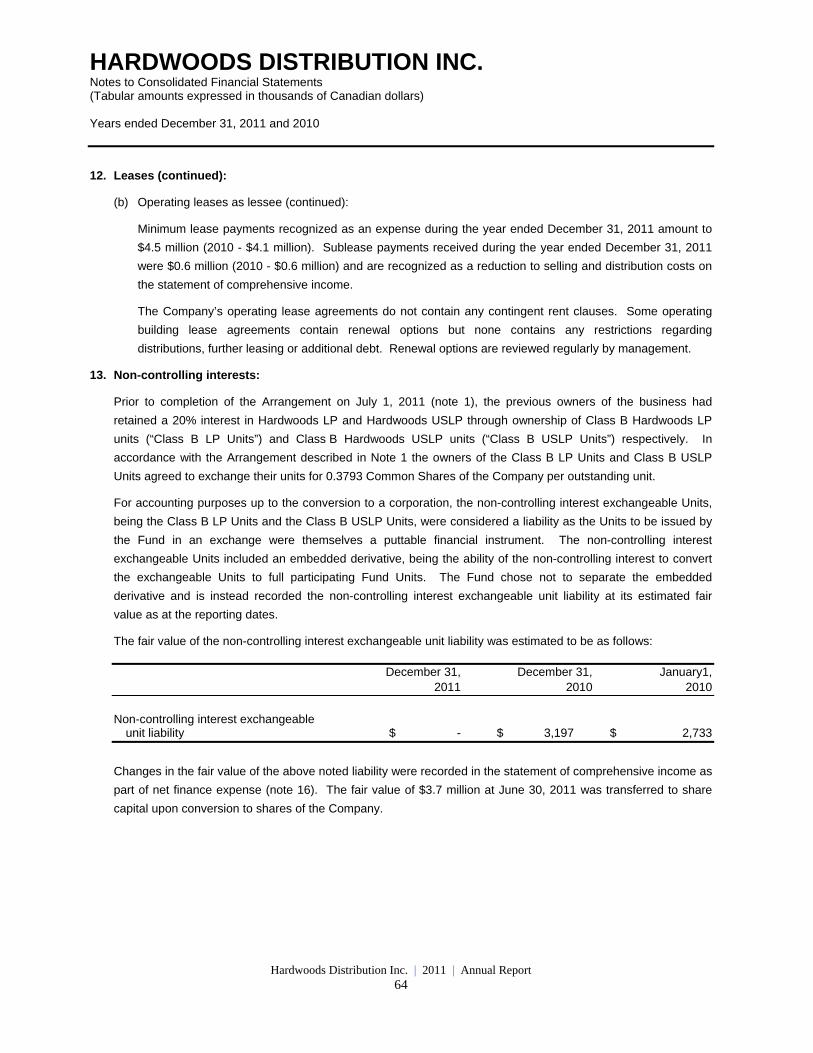
HARDWOODS DISTRIBUTION INC. Notes to Consolidated Financial Statements (Tabular amounts expressed in thousands of Canadian dollars) Years ended December 31, 2011 and 2010
Hardwoods Distribution Inc. | 2011 | Annual Report 64
12. Leases (continued):
(b) Operating leases as lessee (continued):
Minimum lease payments recognized as an expense during the year ended December 31, 2011 amount to
$4.5 million (2010 - $4.1 million). Sublease payments received during the year ended December 31, 2011
were $0.6 million (2010 - $0.6 million) and are recognized as a reduction to selling and distribution costs on
the statement of comprehensive income.
The Company’s operating lease agreements do not contain any contingent rent clauses. Some operating
building lease agreements contain renewal options but none contains any restrictions regarding
distributions, further leasing or additional debt. Renewal options are reviewed regularly by management.
13. Non-controlling interests:
Prior to completion of the Arrangement on July 1, 2011 (note 1), the previous owners of the business had
retained a 20% interest in Hardwoods LP and Hardwoods USLP through ownership of Class B Hardwoods LP
units (“Class B LP Units”) and Class B Hardwoods USLP units (“Class B USLP Units”) respectively. In
accordance with the Arrangement described in Note 1 the owners of the Class B LP Units and Class B USLP
Units agreed to exchange their units for 0.3793 Common Shares of the Company per outstanding unit.
For accounting purposes up to the conversion to a corporation, the non-controlling interest exchangeable Units,
being the Class B LP Units and the Class B USLP Units, were considered a liability as the Units to be issued by
the Fund in an exchange were themselves a puttable financial instrument. The non-controlling interest
exchangeable Units included an embedded derivative, being the ability of the non-controlling interest to convert
the exchangeable Units to full participating Fund Units. The Fund chose not to separate the embedded
derivative and is instead recorded the non-controlling interest exchangeable unit liability at its estimated fair
value as at the reporting dates.
The fair value of the non-controlling interest exchangeable unit liability was estimated to be as follows:
December 31, December 31, January1, 2011 2010 2010
Non-controlling interest exchangeable
unit liability $ - $ 3,197 $ 2,733
Changes in the fair value of the above noted liability were recorded in the statement of comprehensive income as
part of net finance expense (note 16). The fair value of $3.7 million at June 30, 2011 was transferred to share
capital upon conversion to shares of the Company.
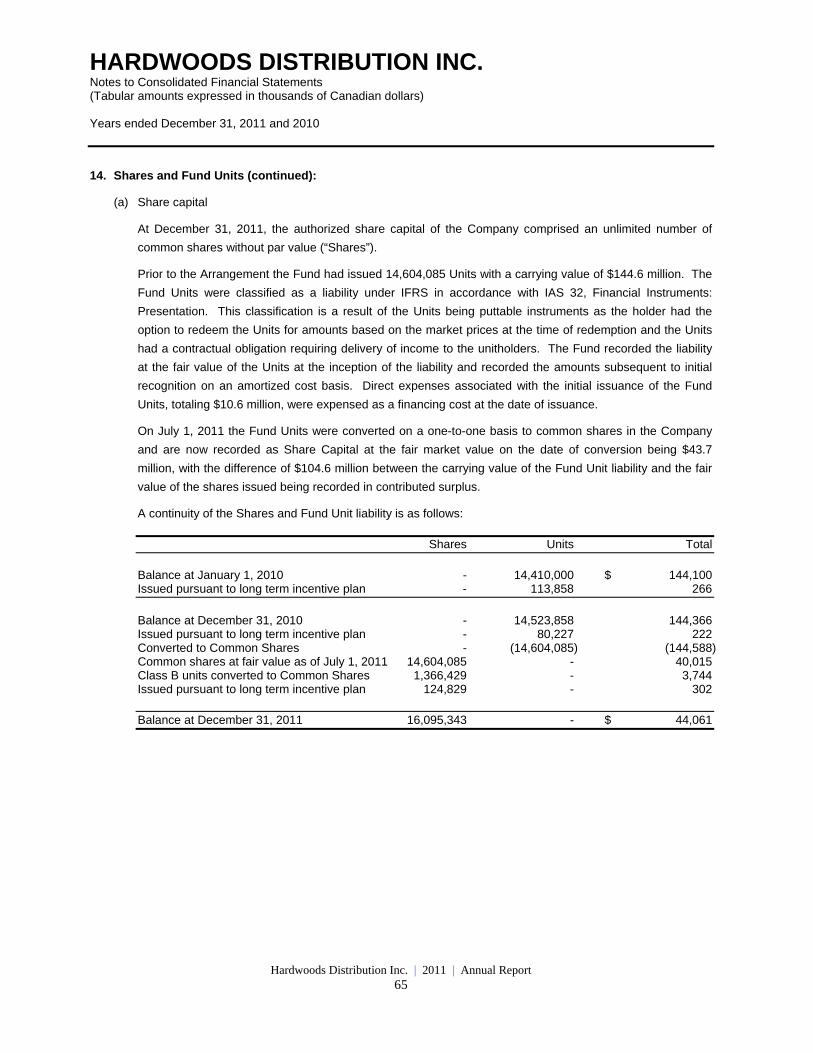
HARDWOODS DISTRIBUTION INC. Notes to Consolidated Financial Statements (Tabular amounts expressed in thousands of Canadian dollars) Years ended December 31, 2011 and 2010
Hardwoods Distribution Inc. | 2011 | Annual Report 65
14. Shares and Fund Units (continued):
(a) Share capital
At December 31, 2011, the authorized share capital of the Company comprised an unlimited number of
common shares without par value (“Shares”).
Prior to the Arrangement the Fund had issued 14,604,085 Units with a carrying value of $144.6 million. The
Fund Units were classified as a liability under IFRS in accordance with IAS 32, Financial Instruments:
Presentation. This classification is a result of the Units being puttable instruments as the holder had the
option to redeem the Units for amounts based on the market prices at the time of redemption and the Units
had a contractual obligation requiring delivery of income to the unitholders. The Fund recorded the liability
at the fair value of the Units at the inception of the liability and recorded the amounts subsequent to initial
recognition on an amortized cost basis. Direct expenses associated with the initial issuance of the Fund
Units, totaling $10.6 million, were expensed as a financing cost at the date of issuance.
On July 1, 2011 the Fund Units were converted on a one-to-one basis to common shares in the Company
and are now recorded as Share Capital at the fair market value on the date of conversion being $43.7
million, with the difference of $104.6 million between the carrying value of the Fund Unit liability and the fair
value of the shares issued being recorded in contributed surplus.
A continuity of the Shares and Fund Unit liability is as follows:
Shares Units Total
Balance at January 1, 2010 - 14,410,000 $ 144,100 Issued pursuant to long term incentive plan - 113,858 266
Balance at December 31, 2010 - 14,523,858 144,366 Issued pursuant to long term incentive plan - 80,227 222 Converted to Common Shares - (14,604,085) (144,588) Common shares at fair value as of July 1, 2011 14,604,085 - 40,015 Class B units converted to Common Shares 1,366,429 - 3,744 Issued pursuant to long term incentive plan 124,829 - 302
Balance at December 31, 2011 16,095,343 - $ 44,061
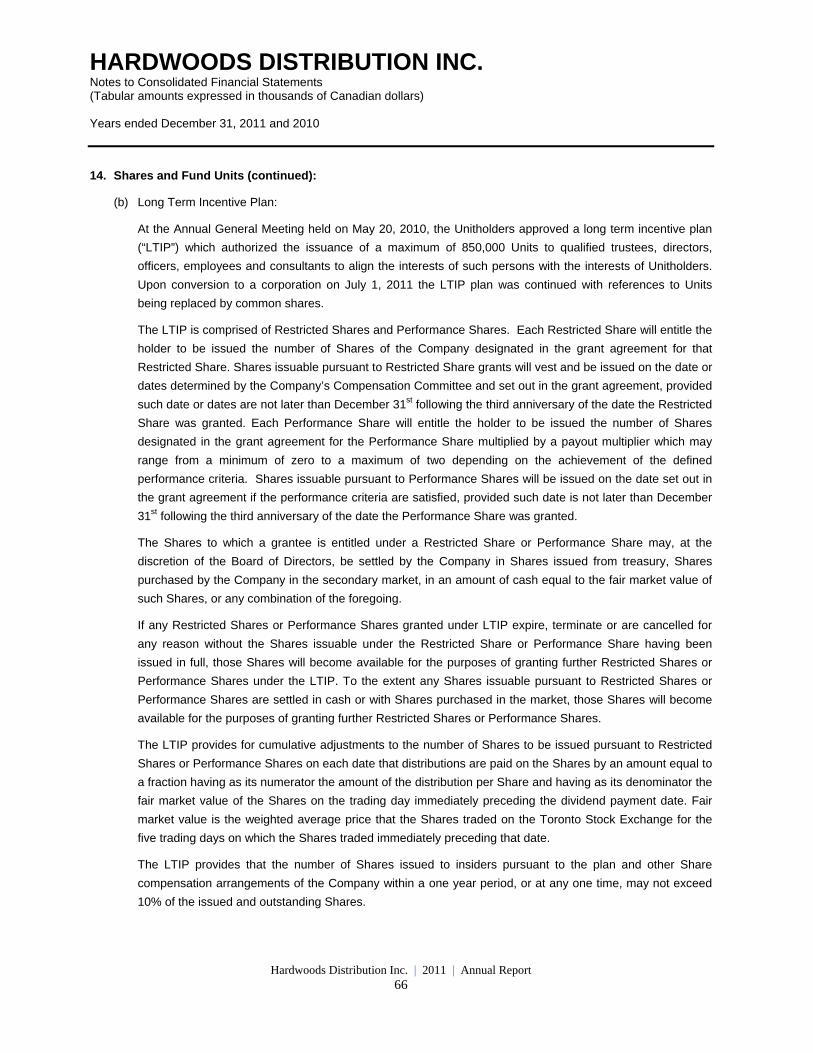
HARDWOODS DISTRIBUTION INC. Notes to Consolidated Financial Statements (Tabular amounts expressed in thousands of Canadian dollars) Years ended December 31, 2011 and 2010
Hardwoods Distribution Inc. | 2011 | Annual Report 66
14. Shares and Fund Units (continued):
(b) Long Term Incentive Plan:
At the Annual General Meeting held on May 20, 2010, the Unitholders approved a long term incentive plan
(“LTIP”) which authorized the issuance of a maximum of 850,000 Units to qualified trustees, directors,
officers, employees and consultants to align the interests of such persons with the interests of Unitholders.
Upon conversion to a corporation on July 1, 2011 the LTIP plan was continued with references to Units
being replaced by common shares.
The LTIP is comprised of Restricted Shares and Performance Shares. Each Restricted Share will entitle the
holder to be issued the number of Shares of the Company designated in the grant agreement for that
Restricted Share. Shares issuable pursuant to Restricted Share grants will vest and be issued on the date or
dates determined by the Company’s Compensation Committee and set out in the grant agreement, provided
such date or dates are not later than December 31st following the third anniversary of the date the Restricted
Share was granted. Each Performance Share will entitle the holder to be issued the number of Shares
designated in the grant agreement for the Performance Share multiplied by a payout multiplier which may
range from a minimum of zero to a maximum of two depending on the achievement of the defined
performance criteria. Shares issuable pursuant to Performance Shares will be issued on the date set out in
the grant agreement if the performance criteria are satisfied, provided such date is not later than December
31st following the third anniversary of the date the Performance Share was granted.
The Shares to which a grantee is entitled under a Restricted Share or Performance Share may, at the
discretion of the Board of Directors, be settled by the Company in Shares issued from treasury, Shares
purchased by the Company in the secondary market, in an amount of cash equal to the fair market value of
such Shares, or any combination of the foregoing.
If any Restricted Shares or Performance Shares granted under LTIP expire, terminate or are cancelled for
any reason without the Shares issuable under the Restricted Share or Performance Share having been
issued in full, those Shares will become available for the purposes of granting further Restricted Shares or
Performance Shares under the LTIP. To the extent any Shares issuable pursuant to Restricted Shares or
Performance Shares are settled in cash or with Shares purchased in the market, those Shares will become
available for the purposes of granting further Restricted Shares or Performance Shares.
The LTIP provides for cumulative adjustments to the number of Shares to be issued pursuant to Restricted
Shares or Performance Shares on each date that distributions are paid on the Shares by an amount equal to
a fraction having as its numerator the amount of the distribution per Share and having as its denominator the
fair market value of the Shares on the trading day immediately preceding the dividend payment date. Fair
market value is the weighted average price that the Shares traded on the Toronto Stock Exchange for the
five trading days on which the Shares traded immediately preceding that date.
The LTIP provides that the number of Shares issued to insiders pursuant to the plan and other Share
compensation arrangements of the Company within a one year period, or at any one time, may not exceed
10% of the issued and outstanding Shares.
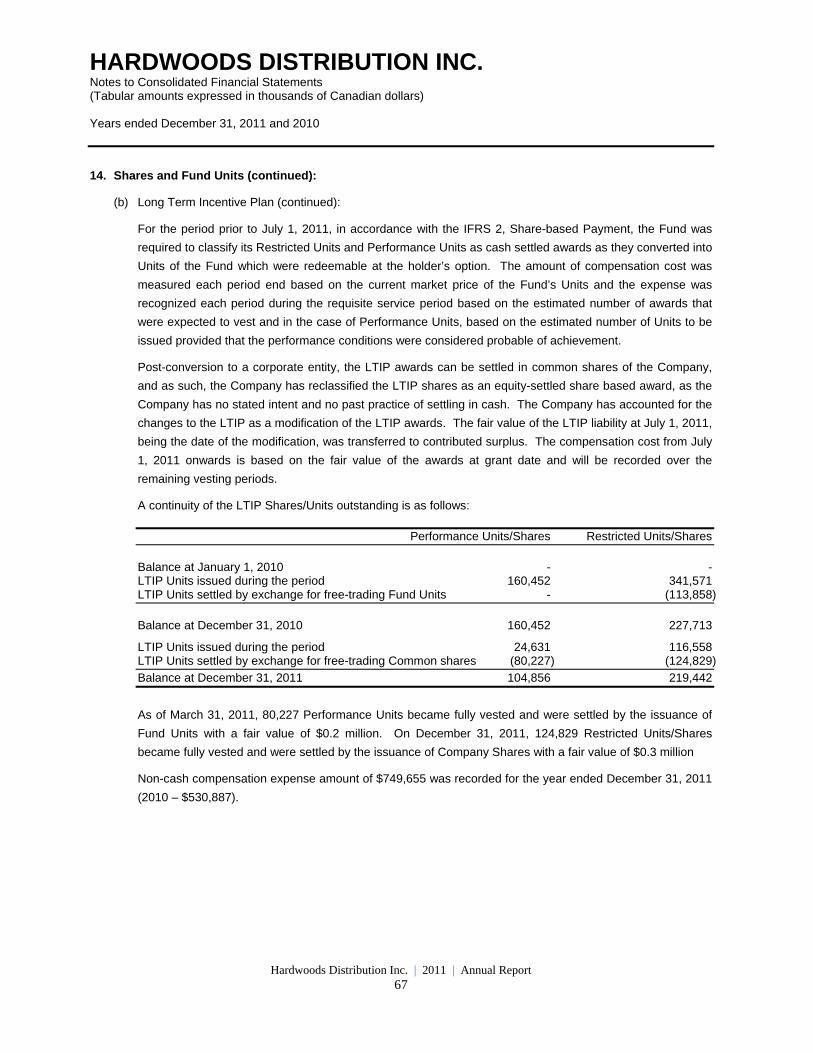
HARDWOODS DISTRIBUTION INC. Notes to Consolidated Financial Statements (Tabular amounts expressed in thousands of Canadian dollars) Years ended December 31, 2011 and 2010
Hardwoods Distribution Inc. | 2011 | Annual Report 67
14. Shares and Fund Units (continued):
(b) Long Term Incentive Plan (continued):
For the period prior to July 1, 2011, in accordance with the IFRS 2, Share-based Payment, the Fund was
required to classify its Restricted Units and Performance Units as cash settled awards as they converted into
Units of the Fund which were redeemable at the holder’s option. The amount of compensation cost was
measured each period end based on the current market price of the Fund’s Units and the expense was
recognized each period during the requisite service period based on the estimated number of awards that
were expected to vest and in the case of Performance Units, based on the estimated number of Units to be
issued provided that the performance conditions were considered probable of achievement.
Post-conversion to a corporate entity, the LTIP awards can be settled in common shares of the Company,
and as such, the Company has reclassified the LTIP shares as an equity-settled share based award, as the
Company has no stated intent and no past practice of settling in cash. The Company has accounted for the
changes to the LTIP as a modification of the LTIP awards. The fair value of the LTIP liability at July 1, 2011,
being the date of the modification, was transferred to contributed surplus. The compensation cost from July
1, 2011 onwards is based on the fair value of the awards at grant date and will be recorded over the
remaining vesting periods.
A continuity of the LTIP Shares/Units outstanding is as follows:
Performance Units/Shares Restricted Units/Shares
Balance at January 1, 2010 - - LTIP Units issued during the period 160,452 341,571 LTIP Units settled by exchange for free-trading Fund Units - (113,858)
Balance at December 31, 2010 160,452 227,713
LTIP Units issued during the period 24,631 116,558 LTIP Units settled by exchange for free-trading Common shares (80,227) (124,829)
Balance at December 31, 2011 104,856 219,442
As of March 31, 2011, 80,227 Performance Units became fully vested and were settled by the issuance of
Fund Units with a fair value of $0.2 million. On December 31, 2011, 124,829 Restricted Units/Shares
became fully vested and were settled by the issuance of Company Shares with a fair value of $0.3 million
Non-cash compensation expense amount of $749,655 was recorded for the year ended December 31, 2011
(2010 – $530,887).
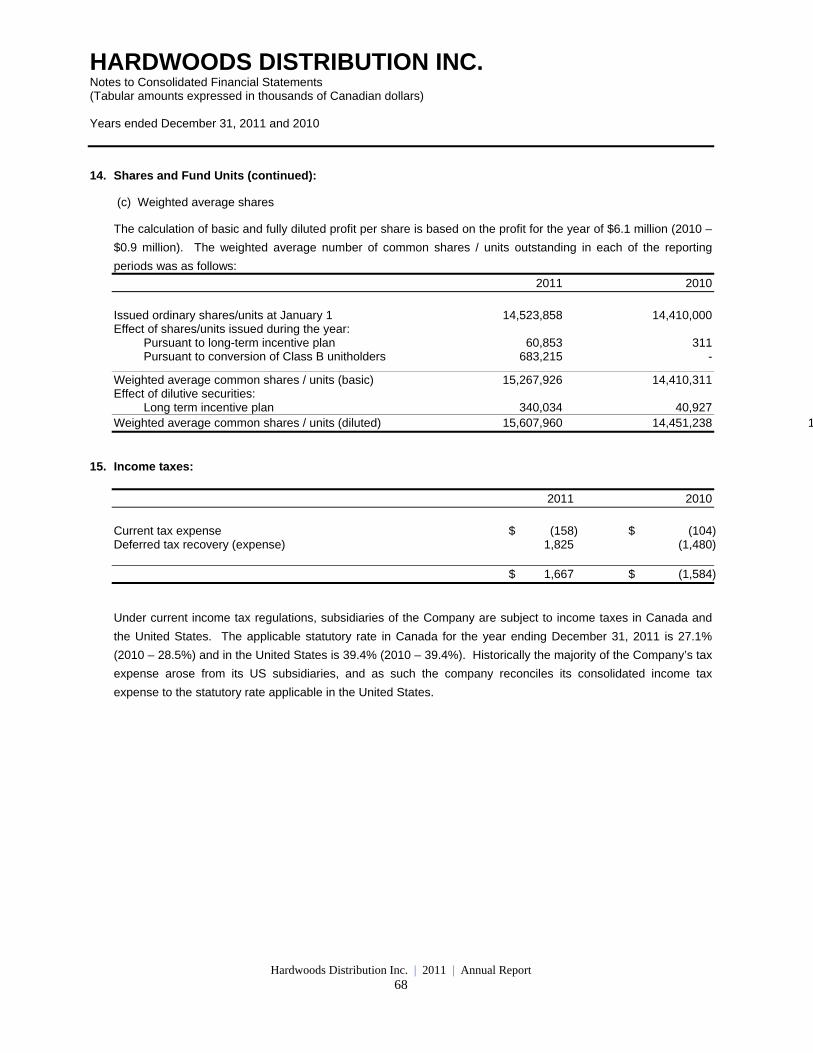
HARDWOODS DISTRIBUTION INC. Notes to Consolidated Financial Statements (Tabular amounts expressed in thousands of Canadian dollars) Years ended December 31, 2011 and 2010
Hardwoods Distribution Inc. | 2011 | Annual Report 68
14. Shares and Fund Units (continued):
(c) Weighted average shares
The calculation of basic and fully diluted profit per share is based on the profit for the year of $6.1 million (2010 –
$0.9 million). The weighted average number of common shares / units outstanding in each of the reporting
periods was as follows:
2011 2010
Issued ordinary shares/units at January 1 14,523,858 14,410,000 Effect of shares/units issued during the year:
Pursuant to long-term incentive plan 60,853 311 Pursuant to conversion of Class B unitholders 683,215 -
Weighted average common shares / units (basic) 15,267,926 14,410,311 Effect of dilutive securities:
Long term incentive plan 340,034 40,927 Weighted average common shares / units (diluted) 15,607,960 14,451,238 1
15. Income taxes:
2011 2010
Current tax expense $ (158) $ (104) Deferred tax recovery (expense) 1,825 (1,480) $ 1,667 $ (1,584)
Under current income tax regulations, subsidiaries of the Company are subject to income taxes in Canada and
the United States. The applicable statutory rate in Canada for the year ending December 31, 2011 is 27.1%
(2010 – 28.5%) and in the United States is 39.4% (2010 – 39.4%). Historically the majority of the Company’s tax
expense arose from its US subsidiaries, and as such the company reconciles its consolidated income tax
expense to the statutory rate applicable in the United States.
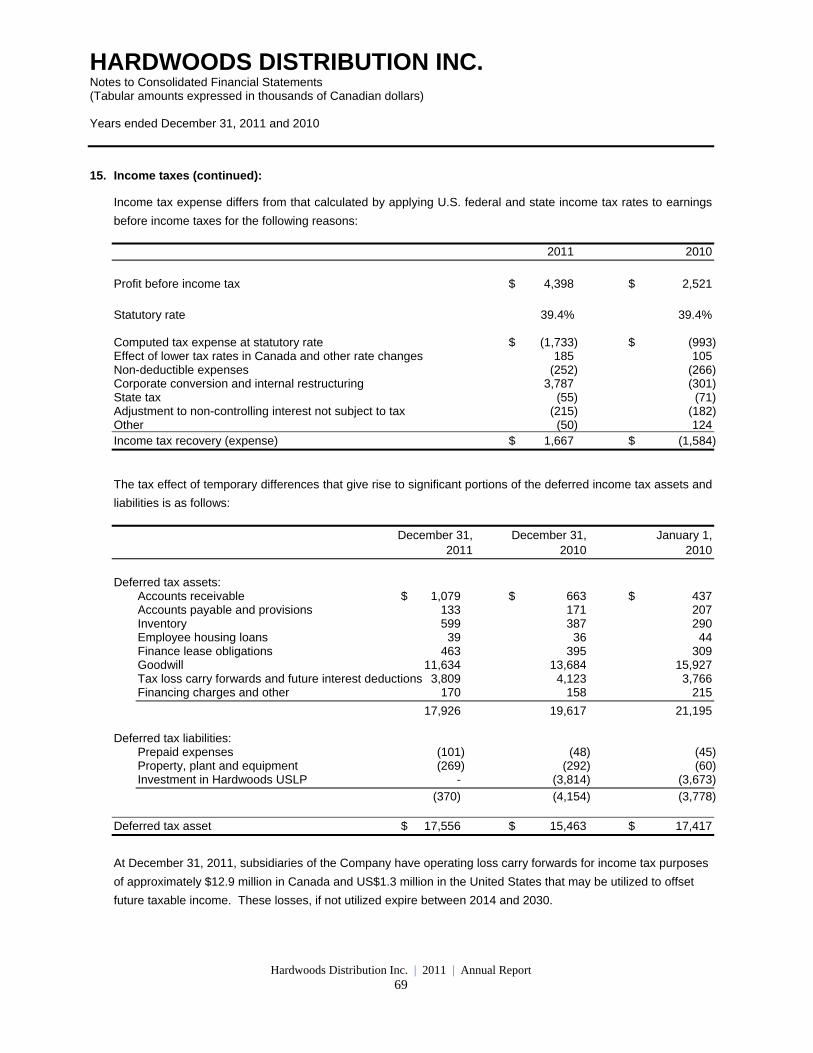
HARDWOODS DISTRIBUTION INC. Notes to Consolidated Financial Statements (Tabular amounts expressed in thousands of Canadian dollars) Years ended December 31, 2011 and 2010
Hardwoods Distribution Inc. | 2011 | Annual Report 69
15. Income taxes (continued):
Income tax expense differs from that calculated by applying U.S. federal and state income tax rates to earnings
before income taxes for the following reasons:
2011 2010
Profit before income tax $ 4,398 $ 2,521 Statutory rate 39.4% 39.4% Computed tax expense at statutory rate $ (1,733) $ (993) Effect of lower tax rates in Canada and other rate changes 185 105 Non-deductible expenses (252) (266) Corporate conversion and internal restructuring 3,787 (301) State tax (55) (71) Adjustment to non-controlling interest not subject to tax (215) (182) Other (50) 124 Income tax recovery (expense) $ 1,667 $ (1,584)
The tax effect of temporary differences that give rise to significant portions of the deferred income tax assets and
liabilities is as follows:
December 31, December 31, January 1, 2011 2010 2010
Deferred tax assets:
Accounts receivable $ 1,079 $ 663 $ 437 Accounts payable and provisions 133 171 207 Inventory 599 387 290 Employee housing loans 39 36 44 Finance lease obligations 463 395 309 Goodwill 11,634 13,684 15,927 Tax loss carry forwards and future interest deductions 3,809 4,123 3,766 Financing charges and other 170 158 215
17,926 19,617 21,195 Deferred tax liabilities:
Prepaid expenses (101) (48) (45) Property, plant and equipment (269) (292) (60) Investment in Hardwoods USLP - (3,814) (3,673)
(370) (4,154) (3,778) Deferred tax asset $ 17,556 $ 15,463 $ 17,417
At December 31, 2011, subsidiaries of the Company have operating loss carry forwards for income tax purposes
of approximately $12.9 million in Canada and US$1.3 million in the United States that may be utilized to offset
future taxable income. These losses, if not utilized expire between 2014 and 2030.
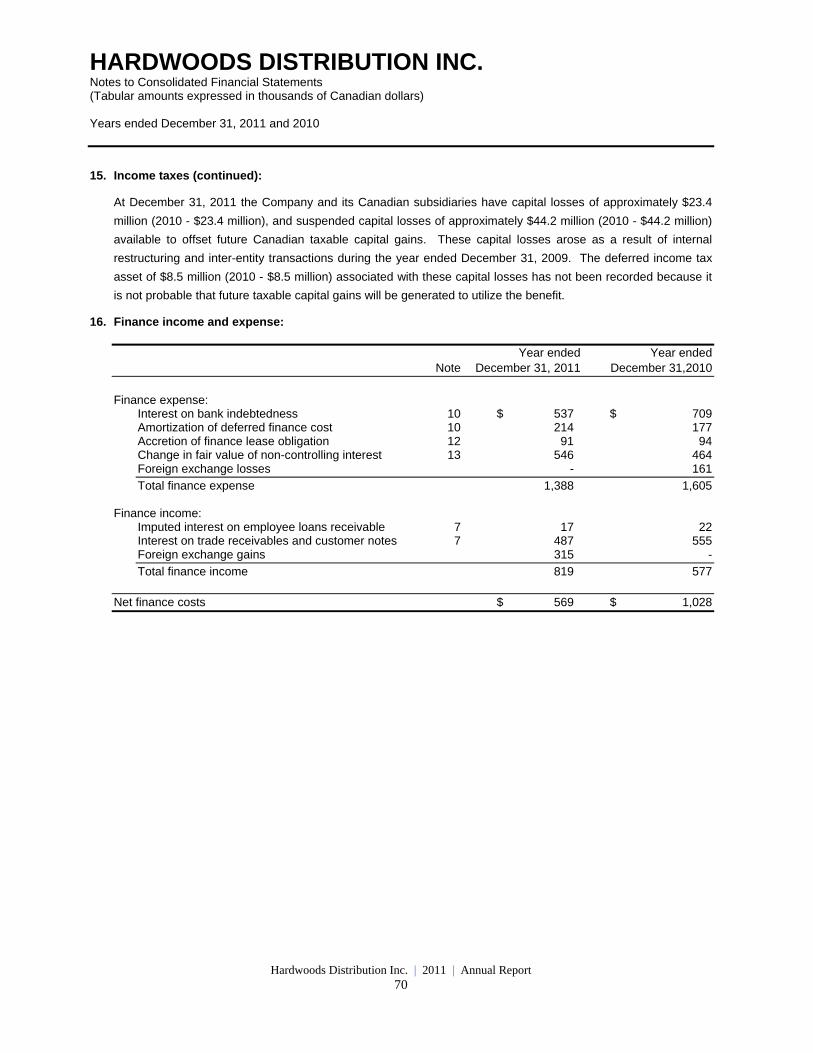
HARDWOODS DISTRIBUTION INC. Notes to Consolidated Financial Statements (Tabular amounts expressed in thousands of Canadian dollars) Years ended December 31, 2011 and 2010
Hardwoods Distribution Inc. | 2011 | Annual Report 70
15. Income taxes (continued):
At December 31, 2011 the Company and its Canadian subsidiaries have capital losses of approximately $23.4
million (2010 - $23.4 million), and suspended capital losses of approximately $44.2 million (2010 - $44.2 million)
available to offset future Canadian taxable capital gains. These capital losses arose as a result of internal
restructuring and inter-entity transactions during the year ended December 31, 2009. The deferred income tax
asset of $8.5 million (2010 - $8.5 million) associated with these capital losses has not been recorded because it
is not probable that future taxable capital gains will be generated to utilize the benefit.
16. Finance income and expense:
Year ended Year ended Note December 31, 2011 December 31,2010
Finance expense:
Interest on bank indebtedness 10 $ 537 $ 709 Amortization of deferred finance cost 10 214 177 Accretion of finance lease obligation 12 91 94 Change in fair value of non-controlling interest 13 546 464 Foreign exchange losses - 161
Total finance expense 1,388 1,605 Finance income:
Imputed interest on employee loans receivable 7 17 22 Interest on trade receivables and customer notes 7 487 555 Foreign exchange gains 315 -
Total finance income 819 577
Net finance costs $ 569 $ 1,028
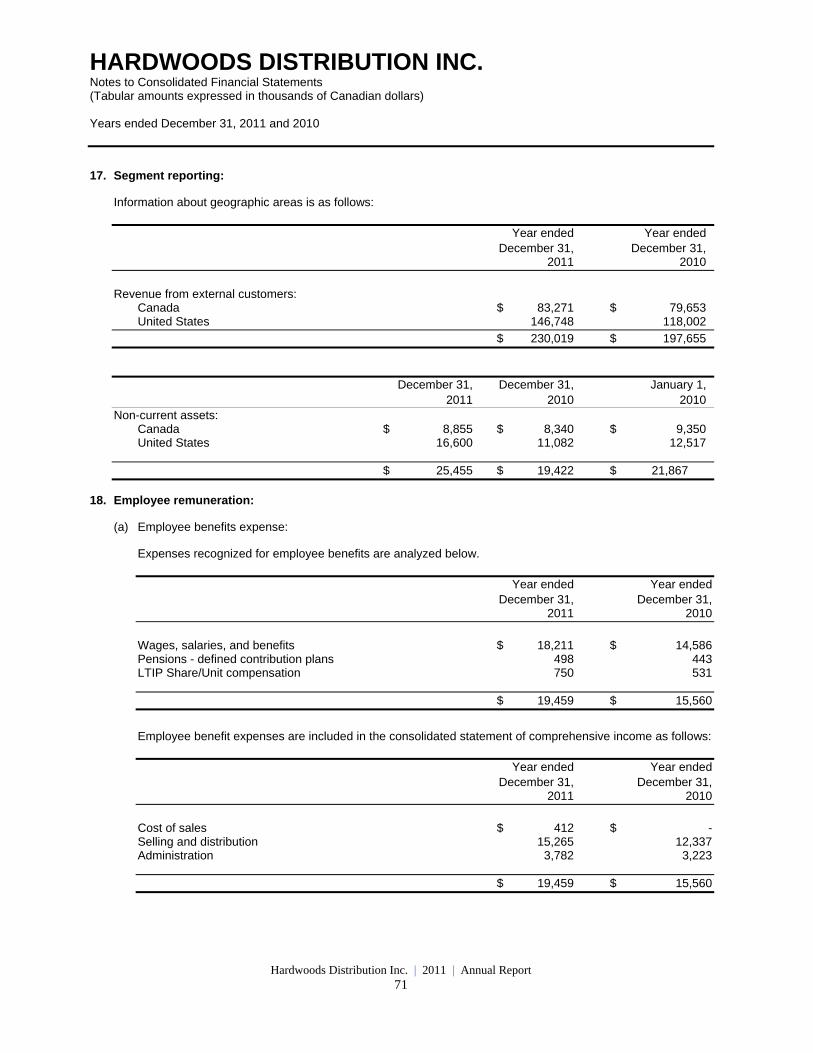
HARDWOODS DISTRIBUTION INC. Notes to Consolidated Financial Statements (Tabular amounts expressed in thousands of Canadian dollars) Years ended December 31, 2011 and 2010
Hardwoods Distribution Inc. | 2011 | Annual Report 71
17. Segment reporting:
Information about geographic areas is as follows:
Year ended Year ended December 31, December 31, 2011 2010
Revenue from external customers:
Canada $ 83,271 $ 79,653 United States 146,748 118,002
$ 230,019 $ 197,655
December 31, December 31, January 1, 2011 2010 2010 Non-current assets:
Canada $ 8,855 $ 8,340 $ 9,350 United States 16,600 11,082 12,517
$ 25,455 $ 19,422 $ 21,867
18. Employee remuneration:
(a) Employee benefits expense:
Expenses recognized for employee benefits are analyzed below.
Year ended Year ended December 31, December 31, 2011 2010
Wages, salaries, and benefits $ 18,211 $ 14,586 Pensions - defined contribution plans 498 443 LTIP Share/Unit compensation 750 531
$ 19,459 $ 15,560
Employee benefit expenses are included in the consolidated statement of comprehensive income as follows:
Year ended Year ended December 31, December 31, 2011 2010
Cost of sales $ 412 $ - Selling and distribution 15,265 12,337 Administration 3,782 3,223
$ 19,459 $ 15,560
HARDWOODS DISTRIBUTION INC. Notes to Consolidated Financial Statements (Tabular amounts expressed in thousands of Canadian dollars) Years ended December 31, 2011 and 2010
Hardwoods Distribution Inc. | 2011 | Annual Report 72
18. Employee remuneration (continued):
(b) Pensions:
Hardwoods USLP and Paxton Hardwoods LLC maintain defined contribution 401(k) retirement savings
plans (the “USLP Plan” and the “Paxton Plan”). The assets of the USLP Plan are held and related
investment transactions are executed by the Plan’s Trustee, ING National Trust, and, accordingly, are not
reflected in these consolidated financial statements. During the year ended December 31, 2011,
Hardwoods USLP contributed and expensed $237,934 (US$240,556) (year ended December 31, 2010 -
$218,345 (US$211,924)) in relation to the USLP Plan. The assets of the Paxton Plan are held and related
investment transactions are executed by the Plan’s Trustee, PNC Bank, and, accordingly, are not reflected
in these consolidated financial statements. During the year ended December 31, 2011, Hardwoods USLP
contributed and expensed $18,587(US$18,792) in relation to the Paxton Plan.
Hardwoods LP does not maintain a pension plan. Hardwoods LP does, however, administer a group
registered retirement savings plan (“LP Plan”) that has a matching component whereby Hardwoods LP
makes contributions to the LP Plan which match contributions made by employees up to a certain level. The
assets of the LP Plan are held and related investment transactions are executed by LP Plan’s Trustee, Sun
Life Financial Trust Inc., and, accordingly, are not reflected in these consolidated financial statements.
During the year ended December 31, 2011, Hardwoods LP contributed and expensed $241,177 (year ended
December 31, 2010 - $204,621) in relation to the LP Plan.
19. Related party transactions:
The Company’s related parties include Sauder Industries Limited (SIL) (note 13), key management, and post-
employment benefit plan for the employees of the Company’s subsidiaries.
(a) Transactions with SIL:
For the year ended December 31, 2011, sales of $271,389 (year ended December 31, 2010 - $435,792)
were made to affiliates of SIL, and the Company’s subsidiaries made purchases of $84,263 (year ended
December 31, 2010 - $120,107) from affiliates of SIL. All these sales and purchases took place at prevailing
market prices.
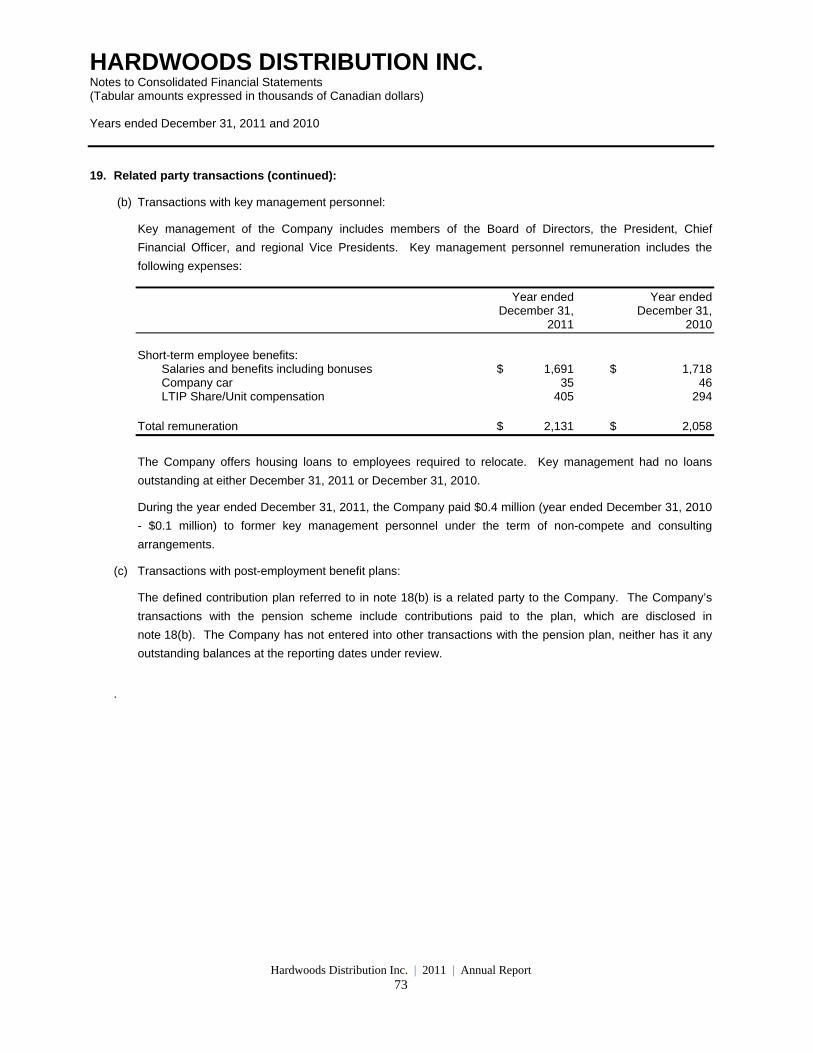
HARDWOODS DISTRIBUTION INC. Notes to Consolidated Financial Statements (Tabular amounts expressed in thousands of Canadian dollars) Years ended December 31, 2011 and 2010
Hardwoods Distribution Inc. | 2011 | Annual Report 73
19. Related party transactions (continued):
(b) Transactions with key management personnel:
Key management of the Company includes members of the Board of Directors, the President, Chief
Financial Officer, and regional Vice Presidents. Key management personnel remuneration includes the
following expenses:
Year ended Year ended December 31, December 31, 2011 2010
Short-term employee benefits:
Salaries and benefits including bonuses $ 1,691 $ 1,718 Company car 35 46 LTIP Share/Unit compensation 405 294
Total remuneration $ 2,131 $ 2,058
The Company offers housing loans to employees required to relocate. Key management had no loans
outstanding at either December 31, 2011 or December 31, 2010.
During the year ended December 31, 2011, the Company paid $0.4 million (year ended December 31, 2010
- $0.1 million) to former key management personnel under the term of non-compete and consulting
arrangements.
(c) Transactions with post-employment benefit plans:
The defined contribution plan referred to in note 18(b) is a related party to the Company. The Company’s
transactions with the pension scheme include contributions paid to the plan, which are disclosed in
note 18(b). The Company has not entered into other transactions with the pension plan, neither has it any
outstanding balances at the reporting dates under review.
.
HARDWOODS DISTRIBUTION INC. Notes to Consolidated Financial Statements (Tabular amounts expressed in thousands of Canadian dollars) Years ended December 31, 2011 and 2010
Hardwoods Distribution Inc. | 2011 | Annual Report 74
20. Explanation of transition to IFRS:
The accounting policies set out in note 3 have been consistently applied in preparing the financial statements for
year ended December 31, 2011 and the comparative year ended December 31, 2010 and in the preparation of
an opening IFRS statement of financial position at January 1, 2010 (the Company’s date of transition).
Adjustments on transition to IFRS
In preparing its opening IFRS statement of financial position and the comparative year ended December 31,
2010, the Company has adjusted amounts reported previously in financial statements prepared in accordance
with previous Canadian GAAP. An explanation of how the transition from previous Canadian GAAP to IFRS has
affected the Company’s financial position and financial performance is set out in the following tables and the
accompanying notes thereto.
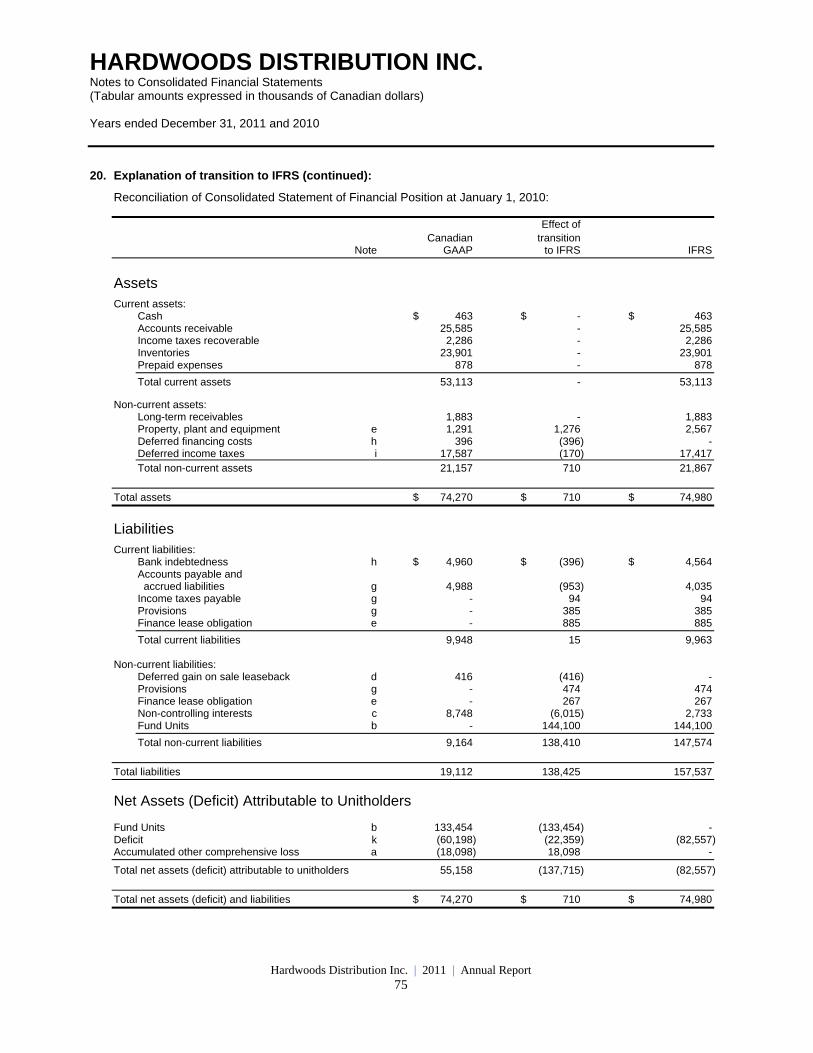
HARDWOODS DISTRIBUTION INC. Notes to Consolidated Financial Statements (Tabular amounts expressed in thousands of Canadian dollars) Years ended December 31, 2011 and 2010
Hardwoods Distribution Inc. | 2011 | Annual Report 75
20. Explanation of transition to IFRS (continued):
Reconciliation of Consolidated Statement of Financial Position at January 1, 2010:
Effect of Canadian transition Note GAAP to IFRS IFRS
Assets
Current assets: Cash $ 463 $ - $ 463 Accounts receivable 25,585 - 25,585 Income taxes recoverable 2,286 - 2,286 Inventories 23,901 - 23,901 Prepaid expenses 878 - 878
Total current assets 53,113 - 53,113
Non-current assets: Long-term receivables 1,883 - 1,883 Property, plant and equipment e 1,291 1,276 2,567 Deferred financing costs h 396 (396) - Deferred income taxes i 17,587 (170) 17,417 Total non-current assets 21,157 710 21,867
Total assets $ 74,270 $ 710 $ 74,980
Liabilities Current liabilities:
Bank indebtedness h $ 4,960 $ (396) $ 4,564 Accounts payable and
accrued liabilities g 4,988 (953) 4,035 Income taxes payable g - 94 94 Provisions g - 385 385 Finance lease obligation e - 885 885
Total current liabilities 9,948 15 9,963 Non-current liabilities:
Deferred gain on sale leaseback d 416 (416) - Provisions g - 474 474 Finance lease obligation e - 267 267 Non-controlling interests c 8,748 (6,015) 2,733 Fund Units b - 144,100 144,100
Total non-current liabilities 9,164 138,410 147,574
Total liabilities 19,112 138,425 157,537
Net Assets (Deficit) Attributable to Unitholders Fund Units b 133,454 (133,454) - Deficit k (60,198) (22,359) (82,557) Accumulated other comprehensive loss a (18,098) 18,098 -
Total net assets (deficit) attributable to unitholders 55,158 (137,715) (82,557)
Total net assets (deficit) and liabilities $ 74,270 $ 710 $ 74,980
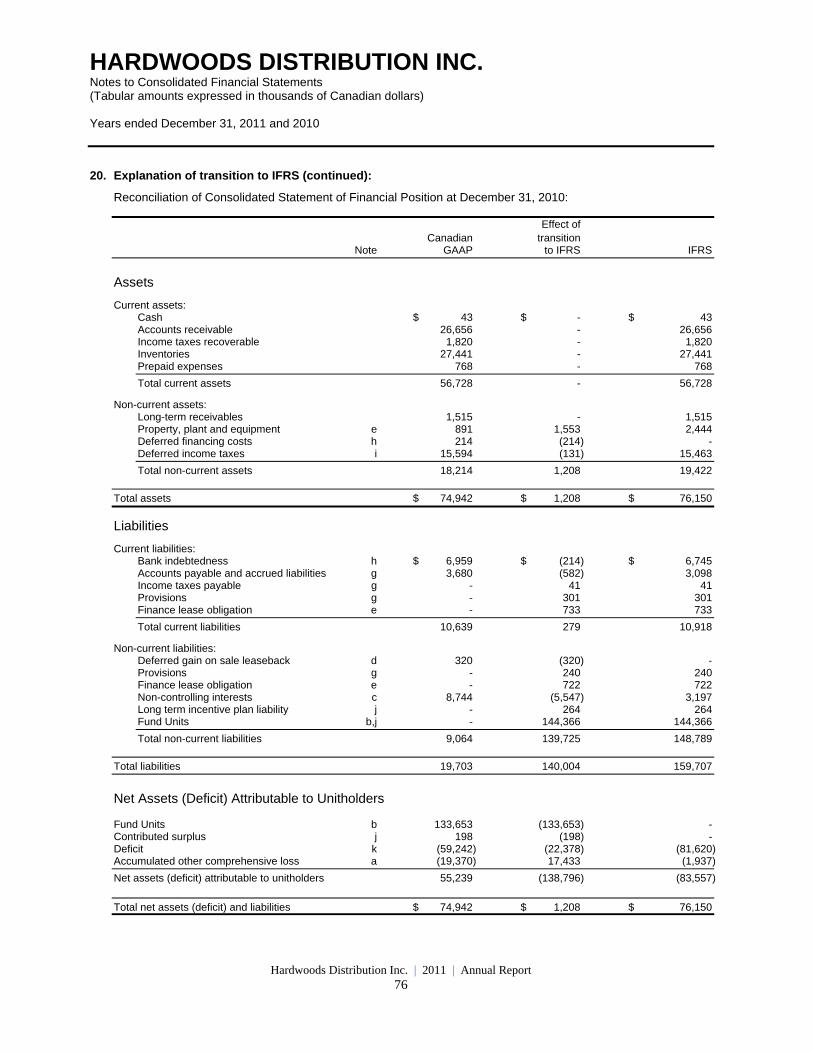
HARDWOODS DISTRIBUTION INC. Notes to Consolidated Financial Statements (Tabular amounts expressed in thousands of Canadian dollars) Years ended December 31, 2011 and 2010
Hardwoods Distribution Inc. | 2011 | Annual Report 76
20. Explanation of transition to IFRS (continued):
Reconciliation of Consolidated Statement of Financial Position at December 31, 2010:
Effect of Canadian transition Note GAAP to IFRS IFRS
Assets
Current assets: Cash $ 43 $ - $ 43 Accounts receivable 26,656 - 26,656 Income taxes recoverable 1,820 - 1,820 Inventories 27,441 - 27,441 Prepaid expenses 768 - 768
Total current assets 56,728 - 56,728
Non-current assets: Long-term receivables 1,515 - 1,515 Property, plant and equipment e 891 1,553 2,444 Deferred financing costs h 214 (214) - Deferred income taxes i 15,594 (131) 15,463
Total non-current assets 18,214 1,208 19,422
Total assets $ 74,942 $ 1,208 $ 76,150
Liabilities
Current liabilities: Bank indebtedness h $ 6,959 $ (214) $ 6,745 Accounts payable and accrued liabilities g 3,680 (582) 3,098 Income taxes payable g - 41 41 Provisions g - 301 301 Finance lease obligation e - 733 733
Total current liabilities 10,639 279 10,918
Non-current liabilities: Deferred gain on sale leaseback d 320 (320) - Provisions g - 240 240 Finance lease obligation e - 722 722 Non-controlling interests c 8,744 (5,547) 3,197 Long term incentive plan liability j - 264 264 Fund Units b,j - 144,366 144,366
Total non-current liabilities 9,064 139,725 148,789
Total liabilities 19,703 140,004 159,707
Net Assets (Deficit) Attributable to Unitholders Fund Units b 133,653 (133,653) - Contributed surplus j 198 (198) - Deficit k (59,242) (22,378) (81,620) Accumulated other comprehensive loss a (19,370) 17,433 (1,937)
Net assets (deficit) attributable to unitholders 55,239 (138,796) (83,557)
Total net assets (deficit) and liabilities $ 74,942 $ 1,208 $ 76,150
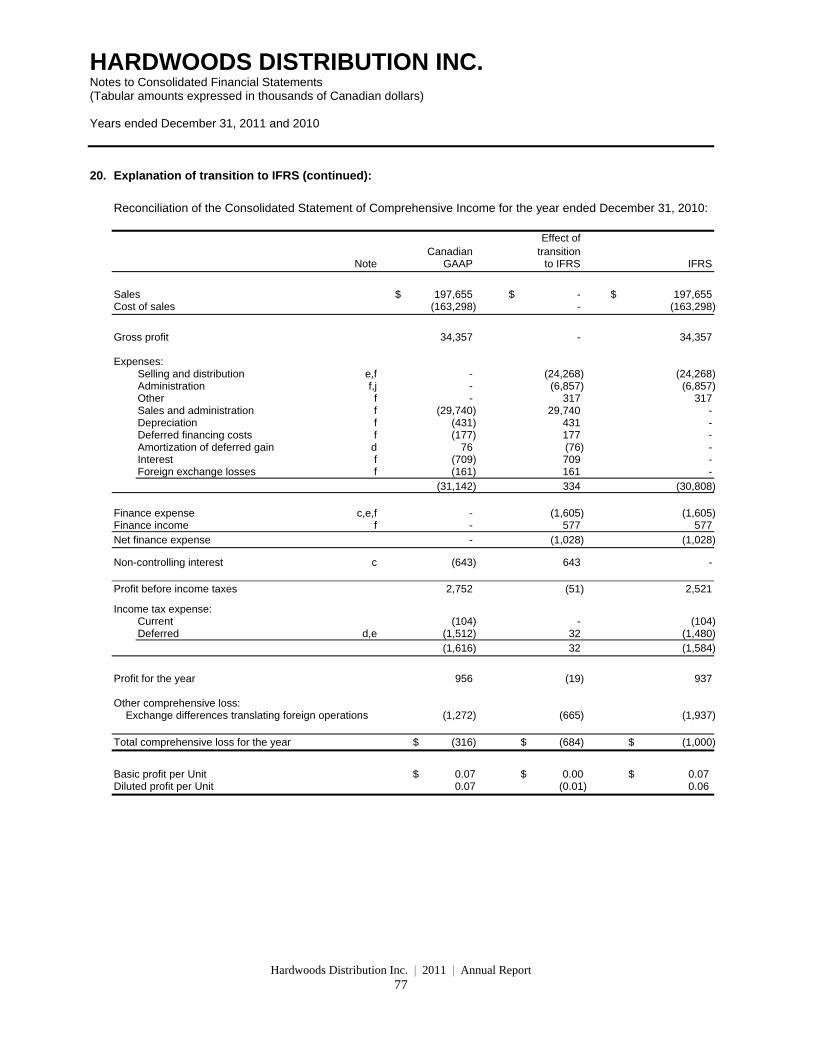
HARDWOODS DISTRIBUTION INC. Notes to Consolidated Financial Statements (Tabular amounts expressed in thousands of Canadian dollars) Years ended December 31, 2011 and 2010
Hardwoods Distribution Inc. | 2011 | Annual Report 77
20. Explanation of transition to IFRS (continued):
Reconciliation of the Consolidated Statement of Comprehensive Income for the year ended December 31, 2010: Effect of Canadian transition Note GAAP to IFRS IFRS
Sales $ 197,655 $ - $ 197,655 Cost of sales (163,298) - (163,298)
Gross profit 34,357 - 34,357 Expenses:
Selling and distribution e,f - (24,268) (24,268) Administration f,j - (6,857) (6,857) Other f - 317 317 Sales and administration f (29,740) 29,740 - Depreciation f (431) 431 - Deferred financing costs f (177) 177 - Amortization of deferred gain d 76 (76) - Interest f (709) 709 - Foreign exchange losses f (161) 161 - (31,142) 334 (30,808)
Finance expense c,e,f - (1,605) (1,605) Finance income f - 577 577 Net finance expense - (1,028) (1,028)
Non-controlling interest c (643) 643 - Profit before income taxes 2,752 (51) 2,521
Income tax expense: Current (104) - (104) Deferred d,e (1,512) 32 (1,480) (1,616) 32 (1,584)
Profit for the year 956 (19) 937 Other comprehensive loss:
Exchange differences translating foreign operations (1,272) (665) (1,937) Total comprehensive loss for the year $ (316) $ (684) $ (1,000)
Basic profit per Unit $ 0.07 $ 0.00 $ 0.07 Diluted profit per Unit 0.07 (0.01) 0.06
HARDWOODS DISTRIBUTION INC. Notes to Consolidated Financial Statements (Tabular amounts expressed in thousands of Canadian dollars) Years ended December 31, 2011 and 2010
Hardwoods Distribution Inc. | 2011 | Annual Report 78
20. Explanation of transition to IFRS (continued):
Notes to the reconciliation of net assets
(a) IFRS 1 “First-time Adoption of International Financial Reporting Standards” (“IFRS 1”):
IFRS 1 generally requires that first-time adopters retrospectively apply all effective IFRS standards and
interpretations in effect as at the reporting date. IFRS-1 also provides for certain optional exemptions and
mandatory exceptions to this general principle. The Fund has made the following elections under IFRS 1:
(i) The Company has elected under IFRS 1 not to apply IFRS 3 “Business Combinations” retrospectively to
business combinations that occurred prior to January 1, 2010 (the date of transition to IFRS).
Accordingly, the Company has continued with the same accounting treatment of previous business
combinations under Canadian GAAP.
(ii) The Company has elected under IFRS 1 not to apply IAS 21 “The Effects of Changes in Foreign
Exchange Rates” to the cumulative translation differences that arose prior to the date of transition to
IFRS. The cumulative translation differences that existed for foreign subsidiaries at the date of
transition to IFRS have been deemed to be nil and the amount recorded at December 31, 2009 under
Canadian GAAP was transferred to deficit. Gains or losses on a subsequent disposal of foreign
operations will exclude translation differences that arose before the date of transition to IFRS.
The effect of this election is to increase deficit and decrease accumulated other comprehensive loss by
$18.1 million at January 1, 2010 and December 31, 2010 as compared to amounts reported under
previous Canadian GAAP.
(b) Previously under Canadian GAAP, the Fund’s Units were classified as equity instruments. In Accordance
with IAS 32, “Financial Instruments: Presentation” (“IAS 32”), the Units are classified as a long-term liability
as the Units are considered puttable financial instruments as the holder has the option to redeem the Units
for amounts related to market prices at the time of the redemption and the Units impose an obligation
requiring delivery of income to the unitholders. Certain exceptions provided in IAS 32 allow some puttable
instruments to be classified as equity under IFRS, however these conditions are much more restrictive than
previous Canadian GAAP. The Units did not meet the exceptions in IAS 32 for equity presentation, as there
was a contractual obligation to distribute taxable income to unitholders on an annual basis.
The Company has made the following two accounting policy elections with respect to these Units:
(i) it has not separated the income distribution stream as an embedded derivative as it is considered to be
dependent on a non-financial variable specific to a party to the contract, and
(ii) it has elected to treat the distribution stream based on income as a floating rate financial instrument.
HARDWOODS DISTRIBUTION INC. Notes to Consolidated Financial Statements (Tabular amounts expressed in thousands of Canadian dollars) Years ended December 31, 2011 and 2010
Hardwoods Distribution Inc. | 2011 | Annual Report 79
20. Explanation of transition to IFRS (continued):
Notes to the reconciliation of net assets (continued)
(b) (continued):
As a result the Company has recorded the liability at the cash amount originally exchanged for the Units,
being $144.4 million. The effect of classification of the Units as a long-term liability is to reduce Unitholders’
equity and increase long-term liabilities by $144.1 million at January 1, 2010 and at December 31, 2010 as
compared to amounts reported under previous Canadian GAAP. The Company has transferred $10.6
million of related Unit issuance costs previously netted against the Unitholders’ equity balance to deficit as a
financing cost expensed prior to the IFRS adoption date.
Consistent with the classification of the units as a liability, distributions paid to Unitholders are considered a
financing cost in the statement of comprehensive income. As no distributions were paid during the year
ended December 31, 2010, there is no impact to the comparative statement of comprehensive income. As
the Units are treated as a floating rate liability, any changes in the distributions based on changes to income
levels are expensed in the period in which they occur.
(c) Prior to July 1, 2011, the Company’s non-controlling interest was in the form of exchangeable Class B units
that, under certain conditions, could be converted into Units of the Fund. In accordance with IAS 32, if the
instruments to be received on exchange are themselves puttable instruments, or instruments that impose an
obligation to deliver a pro rata share of the net assets of the entity on liquidation, the exchangeable
instruments are themselves considered a financial liability. As the Units were themselves considered a
liability, the non-controlling interest’s exchangeable units were also considered a liability. As the non-
controlling interest was previously presented in the statement of financial position as a liability there is no
difference in classification arising from the transition to IFRS.
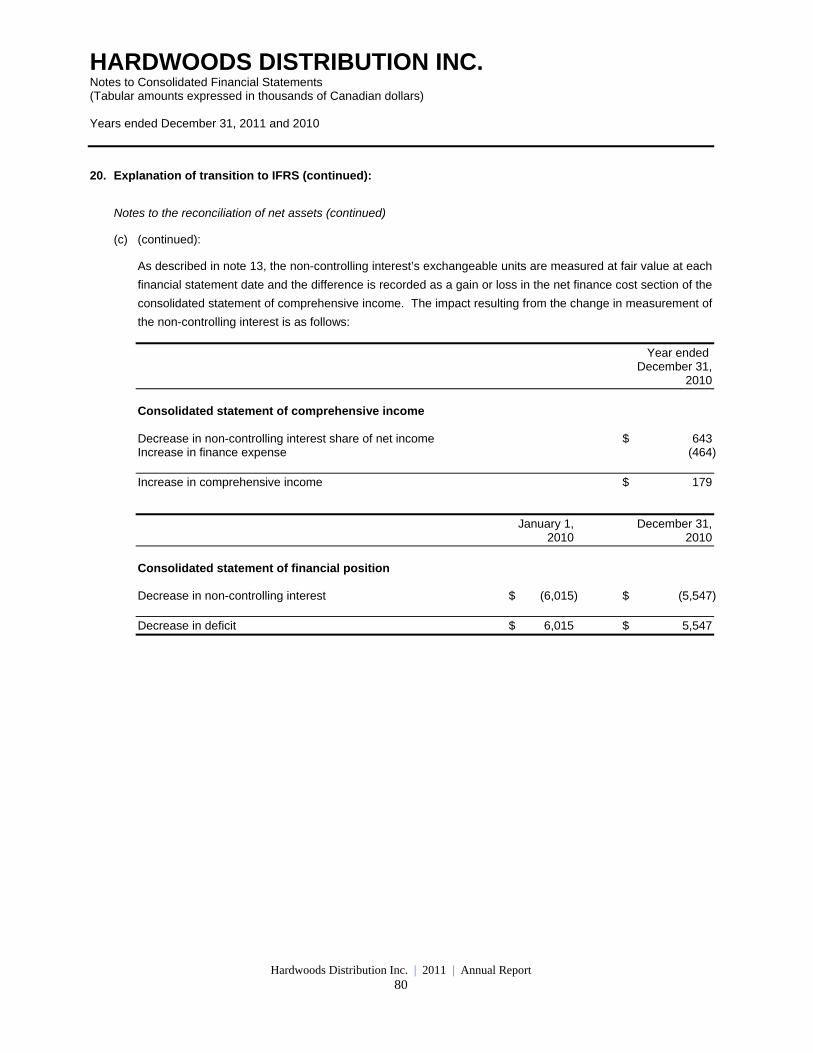
HARDWOODS DISTRIBUTION INC. Notes to Consolidated Financial Statements (Tabular amounts expressed in thousands of Canadian dollars) Years ended December 31, 2011 and 2010
Hardwoods Distribution Inc. | 2011 | Annual Report 80
20. Explanation of transition to IFRS (continued):
Notes to the reconciliation of net assets (continued)
(c) (continued):
As described in note 13, the non-controlling interest’s exchangeable units are measured at fair value at each
financial statement date and the difference is recorded as a gain or loss in the net finance cost section of the
consolidated statement of comprehensive income. The impact resulting from the change in measurement of
the non-controlling interest is as follows:
Year ended December 31, 2010
Consolidated statement of comprehensive income Decrease in non-controlling interest share of net income $ 643 Increase in finance expense (464) Increase in comprehensive income $ 179
January 1, December 31, 2010 2010
Consolidated statement of financial position Decrease in non-controlling interest $ (6,015) $ (5,547) Decrease in deficit $ 6,015 $ 5,547
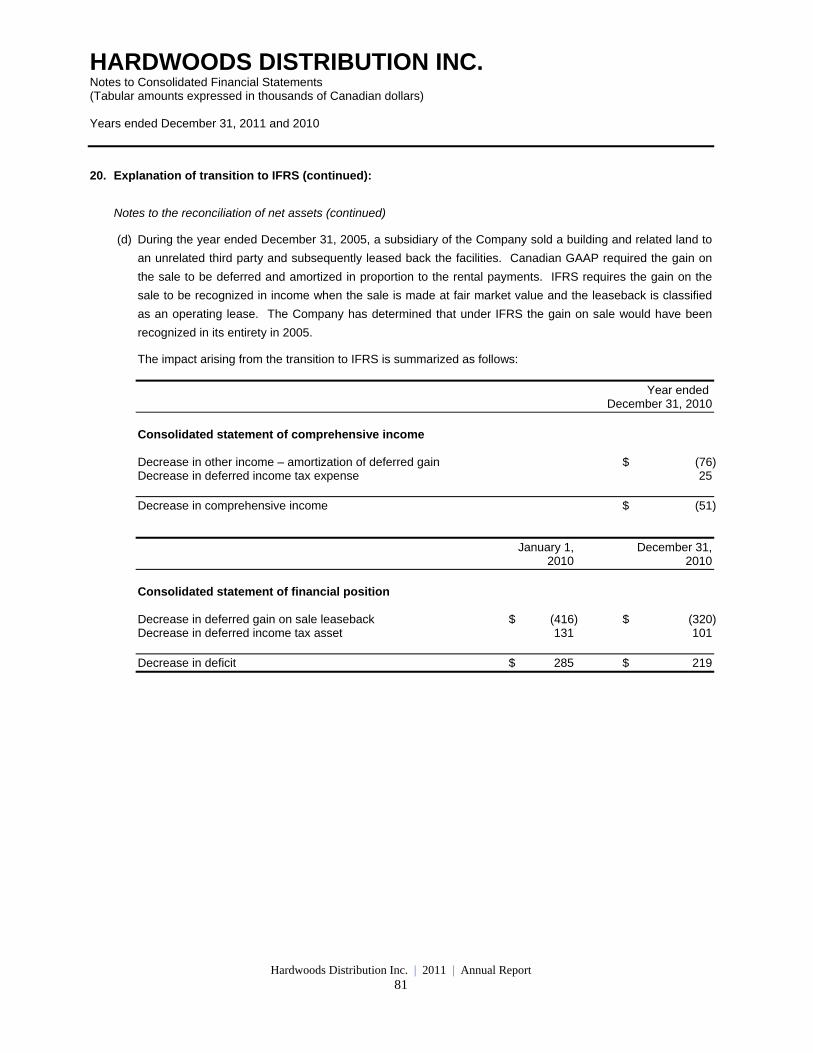
HARDWOODS DISTRIBUTION INC. Notes to Consolidated Financial Statements (Tabular amounts expressed in thousands of Canadian dollars) Years ended December 31, 2011 and 2010
Hardwoods Distribution Inc. | 2011 | Annual Report 81
20. Explanation of transition to IFRS (continued):
Notes to the reconciliation of net assets (continued)
(d) During the year ended December 31, 2005, a subsidiary of the Company sold a building and related land to
an unrelated third party and subsequently leased back the facilities. Canadian GAAP required the gain on
the sale to be deferred and amortized in proportion to the rental payments. IFRS requires the gain on the
sale to be recognized in income when the sale is made at fair market value and the leaseback is classified
as an operating lease. The Company has determined that under IFRS the gain on sale would have been
recognized in its entirety in 2005.
The impact arising from the transition to IFRS is summarized as follows:
Year ended December 31, 2010
Consolidated statement of comprehensive income Decrease in other income – amortization of deferred gain $ (76) Decrease in deferred income tax expense 25 Decrease in comprehensive income $ (51)
January 1, December 31, 2010 2010
Consolidated statement of financial position Decrease in deferred gain on sale leaseback $ (416) $ (320) Decrease in deferred income tax asset 131 101 Decrease in deficit $ 285 $ 219
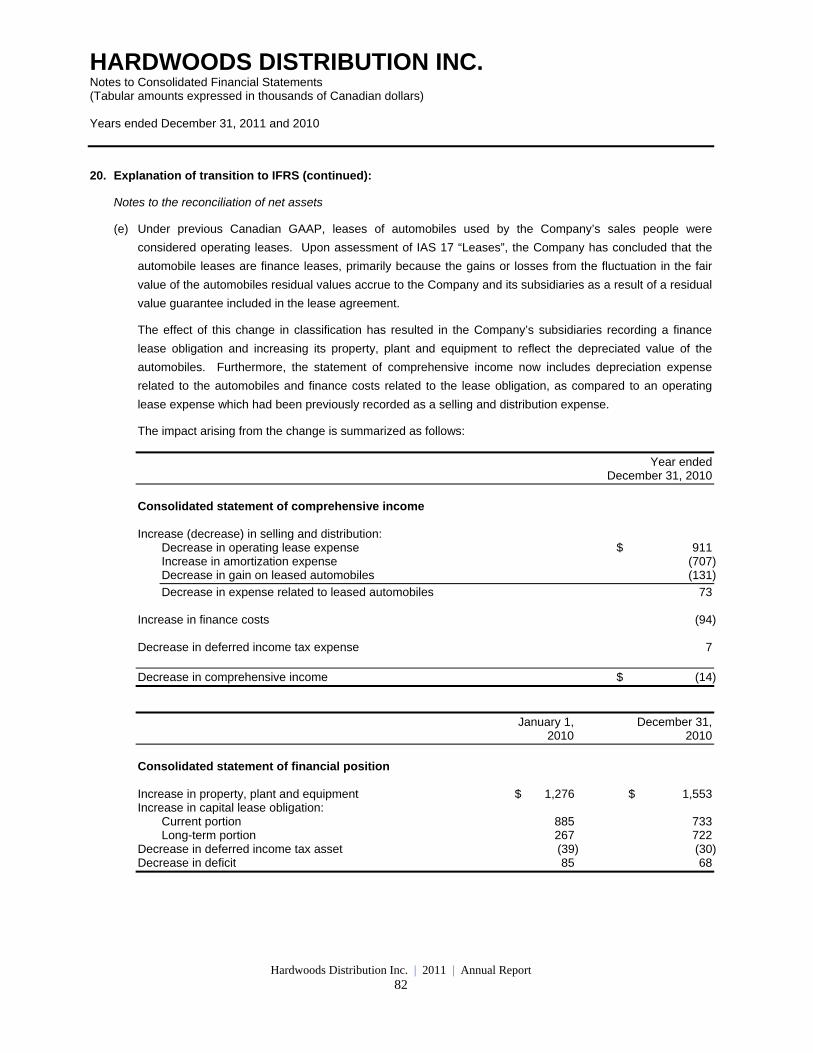
HARDWOODS DISTRIBUTION INC. Notes to Consolidated Financial Statements (Tabular amounts expressed in thousands of Canadian dollars) Years ended December 31, 2011 and 2010
Hardwoods Distribution Inc. | 2011 | Annual Report 82
20. Explanation of transition to IFRS (continued):
Notes to the reconciliation of net assets
(e) Under previous Canadian GAAP, leases of automobiles used by the Company’s sales people were
considered operating leases. Upon assessment of IAS 17 “Leases”, the Company has concluded that the
automobile leases are finance leases, primarily because the gains or losses from the fluctuation in the fair
value of the automobiles residual values accrue to the Company and its subsidiaries as a result of a residual
value guarantee included in the lease agreement.
The effect of this change in classification has resulted in the Company’s subsidiaries recording a finance
lease obligation and increasing its property, plant and equipment to reflect the depreciated value of the
automobiles. Furthermore, the statement of comprehensive income now includes depreciation expense
related to the automobiles and finance costs related to the lease obligation, as compared to an operating
lease expense which had been previously recorded as a selling and distribution expense.
The impact arising from the change is summarized as follows:
Year ended December 31, 2010
Consolidated statement of comprehensive income Increase (decrease) in selling and distribution:
Decrease in operating lease expense $ 911 Increase in amortization expense (707) Decrease in gain on leased automobiles (131)
Decrease in expense related to leased automobiles 73 Increase in finance costs (94) Decrease in deferred income tax expense 7 Decrease in comprehensive income $ (14)
January 1, December 31, 2010 2010
Consolidated statement of financial position Increase in property, plant and equipment $ 1,276 $ 1,553 Increase in capital lease obligation:
Current portion 885 733 Long-term portion 267 722
Decrease in deferred income tax asset (39) (30) Decrease in deficit 85 68
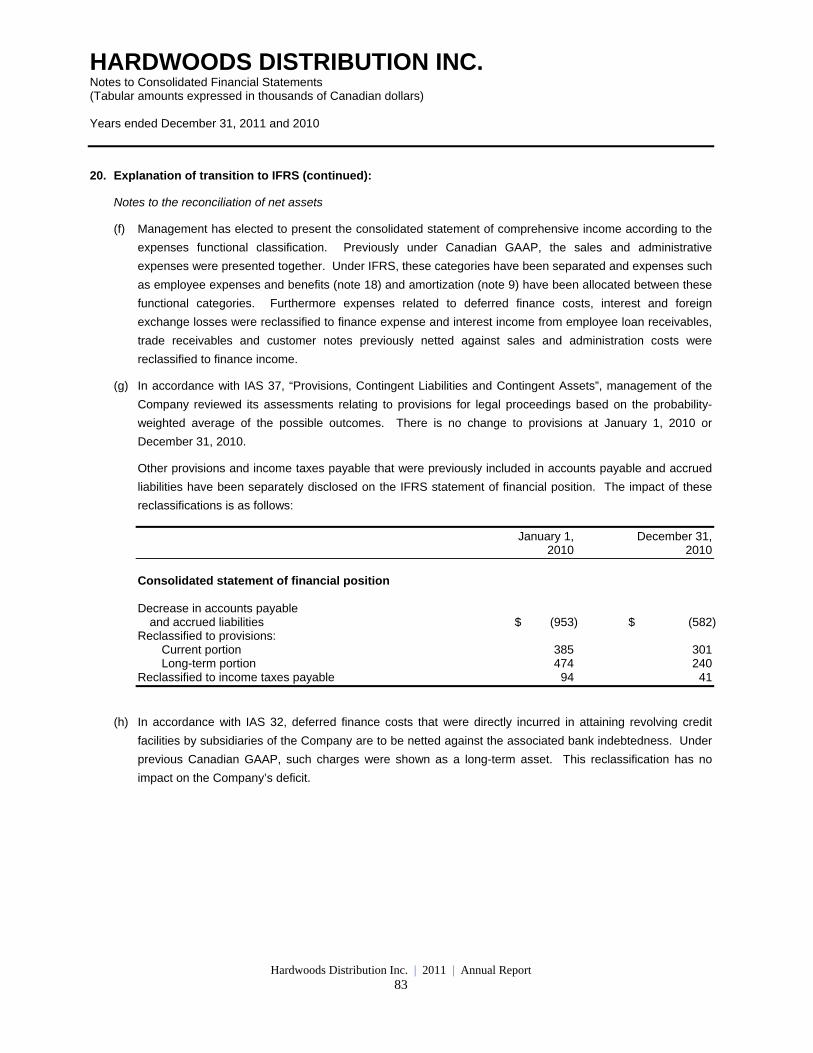
HARDWOODS DISTRIBUTION INC. Notes to Consolidated Financial Statements (Tabular amounts expressed in thousands of Canadian dollars) Years ended December 31, 2011 and 2010
Hardwoods Distribution Inc. | 2011 | Annual Report 83
20. Explanation of transition to IFRS (continued):
Notes to the reconciliation of net assets
(f) Management has elected to present the consolidated statement of comprehensive income according to the
expenses functional classification. Previously under Canadian GAAP, the sales and administrative
expenses were presented together. Under IFRS, these categories have been separated and expenses such
as employee expenses and benefits (note 18) and amortization (note 9) have been allocated between these
functional categories. Furthermore expenses related to deferred finance costs, interest and foreign
exchange losses were reclassified to finance expense and interest income from employee loan receivables,
trade receivables and customer notes previously netted against sales and administration costs were
reclassified to finance income.
(g) In accordance with IAS 37, “Provisions, Contingent Liabilities and Contingent Assets”, management of the
Company reviewed its assessments relating to provisions for legal proceedings based on the probability-
weighted average of the possible outcomes. There is no change to provisions at January 1, 2010 or
December 31, 2010.
Other provisions and income taxes payable that were previously included in accounts payable and accrued
liabilities have been separately disclosed on the IFRS statement of financial position. The impact of these
reclassifications is as follows:
January 1, December 31, 2010 2010
Consolidated statement of financial position Decrease in accounts payable
and accrued liabilities $ (953) $ (582) Reclassified to provisions:
Current portion 385 301 Long-term portion 474 240
Reclassified to income taxes payable 94 41
(h) In accordance with IAS 32, deferred finance costs that were directly incurred in attaining revolving credit
facilities by subsidiaries of the Company are to be netted against the associated bank indebtedness. Under
previous Canadian GAAP, such charges were shown as a long-term asset. This reclassification has no
impact on the Company’s deficit.
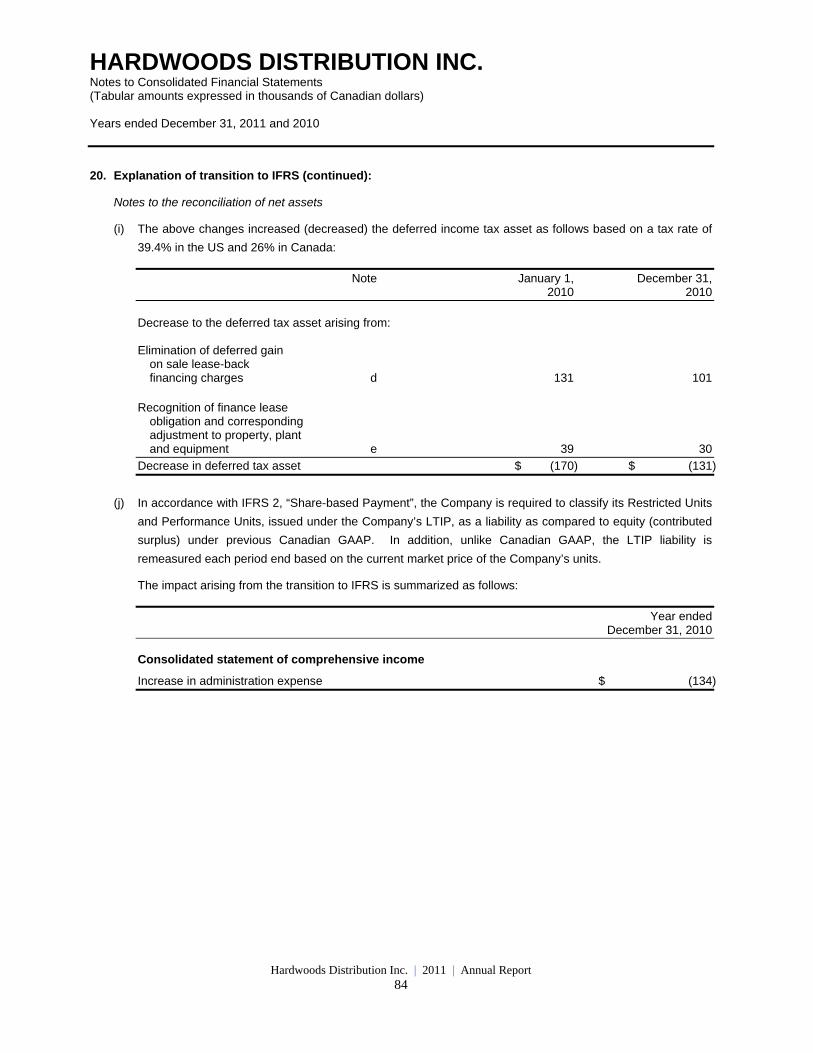
HARDWOODS DISTRIBUTION INC. Notes to Consolidated Financial Statements (Tabular amounts expressed in thousands of Canadian dollars) Years ended December 31, 2011 and 2010
Hardwoods Distribution Inc. | 2011 | Annual Report 84
20. Explanation of transition to IFRS (continued):
Notes to the reconciliation of net assets
(i) The above changes increased (decreased) the deferred income tax asset as follows based on a tax rate of
39.4% in the US and 26% in Canada:
Note January 1, December 31, 2010 2010
Decrease to the deferred tax asset arising from: Elimination of deferred gain
on sale lease-back financing charges d 131 101
Recognition of finance lease
obligation and corresponding adjustment to property, plant and equipment e 39 30
Decrease in deferred tax asset $ (170) $ (131)
(j) In accordance with IFRS 2, “Share-based Payment”, the Company is required to classify its Restricted Units
and Performance Units, issued under the Company’s LTIP, as a liability as compared to equity (contributed
surplus) under previous Canadian GAAP. In addition, unlike Canadian GAAP, the LTIP liability is
remeasured each period end based on the current market price of the Company’s units.
The impact arising from the transition to IFRS is summarized as follows:
Year ended December 31, 2010 Consolidated statement of comprehensive income
Increase in administration expense $ (134)
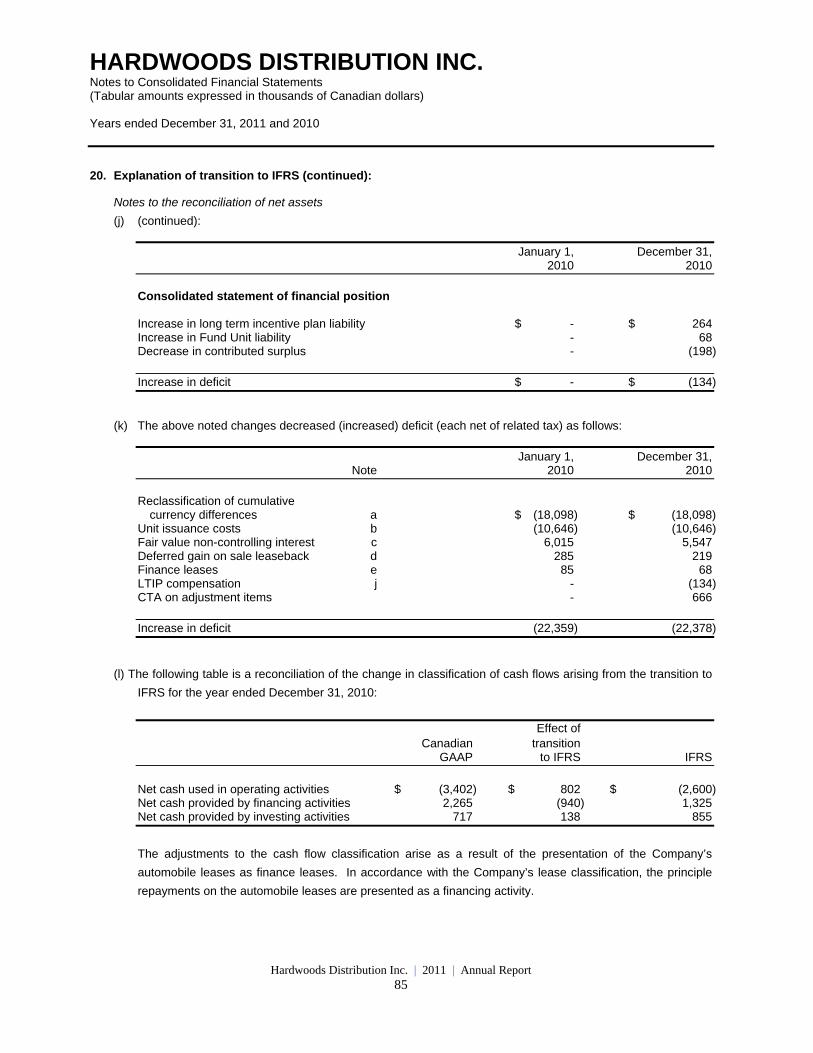
HARDWOODS DISTRIBUTION INC. Notes to Consolidated Financial Statements (Tabular amounts expressed in thousands of Canadian dollars) Years ended December 31, 2011 and 2010
Hardwoods Distribution Inc. | 2011 | Annual Report 85
20. Explanation of transition to IFRS (continued):
Notes to the reconciliation of net assets
(j) (continued):
January 1, December 31, 2010 2010
Consolidated statement of financial position Increase in long term incentive plan liability $ - $ 264 Increase in Fund Unit liability - 68 Decrease in contributed surplus - (198)
Increase in deficit $ - $ (134)
(k) The above noted changes decreased (increased) deficit (each net of related tax) as follows:
January 1, December 31, Note 2010 2010
Reclassification of cumulative
currency differences a $ (18,098) $ (18,098) Unit issuance costs b (10,646) (10,646) Fair value non-controlling interest c 6,015 5,547 Deferred gain on sale leaseback d 285 219 Finance leases e 85 68 LTIP compensation j - (134) CTA on adjustment items - 666
Increase in deficit (22,359) (22,378)
(l) The following table is a reconciliation of the change in classification of cash flows arising from the transition to
IFRS for the year ended December 31, 2010:
Effect of Canadian transition
GAAP to IFRS IFRS
Net cash used in operating activities $ (3,402) $ 802 $ (2,600) Net cash provided by financing activities 2,265 (940) 1,325 Net cash provided by investing activities 717 138 855
The adjustments to the cash flow classification arise as a result of the presentation of the Company’s
automobile leases as finance leases. In accordance with the Company’s lease classification, the principle
repayments on the automobile leases are presented as a financing activity.
Corporate Information Directors Officers
R. Keith Purchase Lance R. Blanco Director President & Chief Executive Officer Terry M. Holland Robert J. Brown President, Krystal Financial Corp. Vice President & CFO Graham M. Wilson Daniel A. Besen President, Grawil Consultants Inc. Vice President, California E. Lawrence Sauder Garry W. Warner Chair & CEO, Sauder Industries Vice President, Canada William Sauder Executive VP, Sauder Industries Head Office Auditors Investor Relations #306 – 9440 202nd Street KPMG LLP Rob Brown Langley, BC Canada V1M 4A6 Vancouver, British Columbia Chief Financial Officer Telephone: 604-881-1988 Telephone:604-881-1990 Facsimile: 604-881-1995 Email: [email protected] Listings Transfer Agent The Toronto Stock Exchange Computershare Trust Trading under HWD Company of Canada