happy birthday to you !!! yes…..happy birthday to … · fredrick t. wollman, fp® mpas ® april...
TRANSCRIPT

Fredrick T. Wollman, CFP® MPAS ®
APRIL 2017
Happy Birthday to You !!!
Yes…..Happy Birthday to Each of Us !!! Each and every one of us had a birthday on
March 9….so break out the cake, candles and
balloons. I am serious and no I am not crazy.
March 9 was the day the current Bull Market
was born in 2009. So, every year on March 9
we should celebrate --- or at least we should
celebrate until this Bull Cycle ends. On this
date in 2009 the S&P 500 closed at 676. As of
March 17, 2017, the S&P 500 is at 2378. That
is an increase of 251%.
But did you know that within this Bull Market,
the S&P has experienced two major market
declines? Quiz? When were they? And why
did they occur? Look to the end of this news-
letter for the answer.
But now the huge question is when will the
Bull die and become a Bear? “Aren’t we
‘overdue’ for a correction?” “I remember
reading….or they say….that Bull markets tend
to last about three years.” “I am worried
about domestic politics.” “How will a change
in US trade policy affect our economy?” “The
economy seems to have grown so slowly, how
long can it continue?” “What about Brexit?
Greece? Brazil? China? North Korea? Mid-
dle East? ISIS? And the biggest bear of all,
Russia?”
OK… Slow down and allow me to address
these issues. But before I do, you need to un-
derstand some basic facts of life regarding
your money.
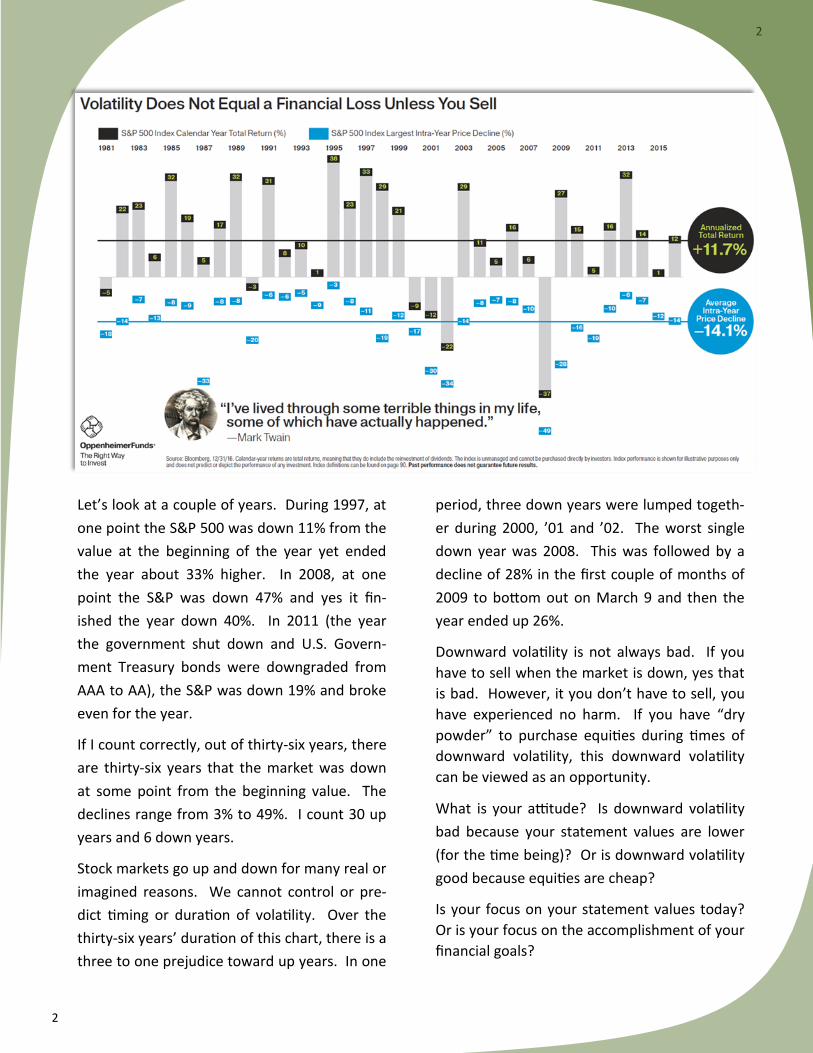
The chart below is the last thirty-six years of
the S&P 500. The grey bars represent the
performance for the calendar year. The blue
squares illustrate the mid-year decline the
S&P had during that year from the value at
the beginning of the year.
Securities and Investment Advisory Services offered through Voya Financial Advisors, Inc. Member SIPC
144 S Grape St, Escondido, CA, 92025 / E-mail: [email protected]
Phone: 760-737-2246 — www.fwollman.com
2
2
Let’s look at a couple of years. During 1997, at
one point the S&P 500 was down 11% from the
value at the beginning of the year yet ended
the year about 33% higher. In 2008, at one
point the S&P was down 47% and yes it fin-
ished the year down 40%. In 2011 (the year
the government shut down and U.S. Govern-
ment Treasury bonds were downgraded from
AAA to AA), the S&P was down 19% and broke
even for the year.
If I count correctly, out of thirty-six years, there
are thirty-six years that the market was down
at some point from the beginning value. The
declines range from 3% to 49%. I count 30 up
years and 6 down years.
Stock markets go up and down for many real or
imagined reasons. We cannot control or pre-
dict timing or duration of volatility. Over the
thirty-six years’ duration of this chart, there is a
three to one prejudice toward up years. In one
period, three down years were lumped togeth-
er during 2000, ’01 and ’02. The worst single
down year was 2008. This was followed by a
decline of 28% in the first couple of months of
2009 to bottom out on March 9 and then the
year ended up 26%.
Downward volatility is not always bad. If you
have to sell when the market is down, yes that
is bad. However, it you don’t have to sell, you
have experienced no harm. If you have “dry
powder” to purchase equities during times of
downward volatility, this downward volatility
can be viewed as an opportunity.
What is your attitude? Is downward volatility
bad because your statement values are lower
(for the time being)? Or is downward volatility
good because equities are cheap?
Is your focus on your statement values today?
Or is your focus on the accomplishment of your
financial goals?
3
3
“The Key is not to predict the future but to prepare for it.” Pericles
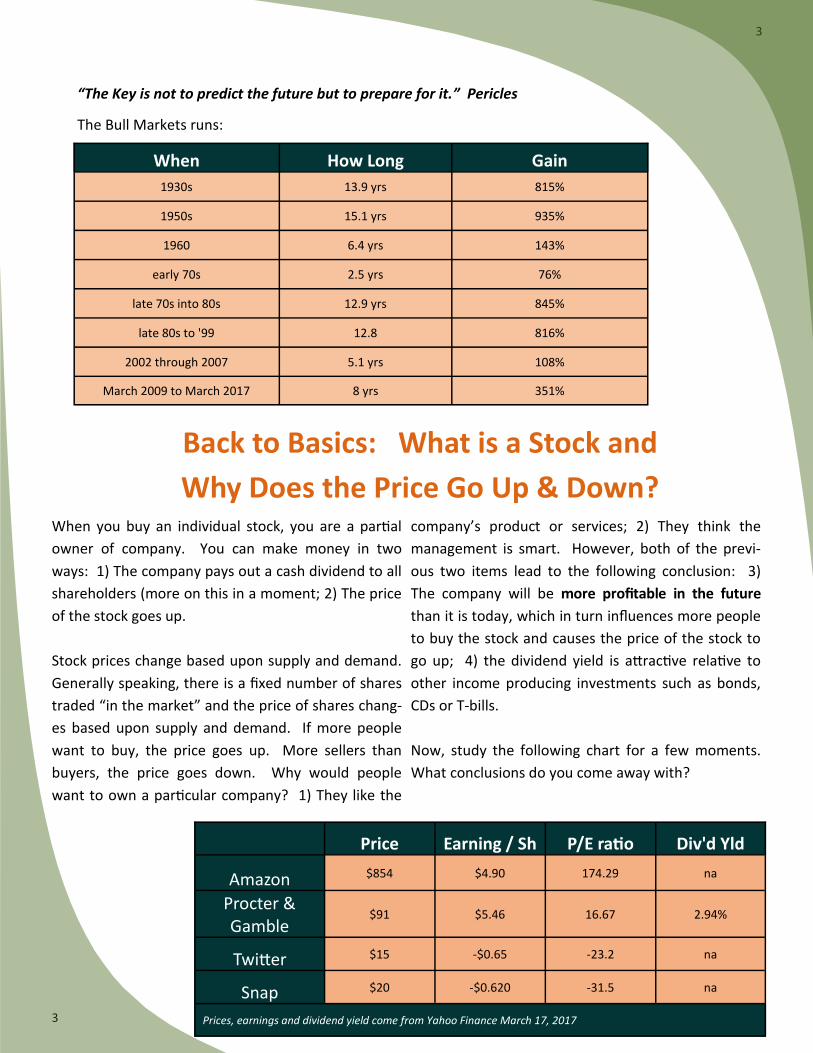
The Bull Markets runs:
When How Long Gain
1930s 13.9 yrs 815%
1950s 15.1 yrs 935%
1960 6.4 yrs 143%
early 70s 2.5 yrs 76%
late 70s into 80s 12.9 yrs 845%
late 80s to '99 12.8 816%
2002 through 2007 5.1 yrs 108%
March 2009 to March 2017 8 yrs 351%
Back to Basics: What is a Stock and
Why Does the Price Go Up & Down? When you buy an individual stock, you are a partial
owner of company. You can make money in two
ways: 1) The company pays out a cash dividend to all
shareholders (more on this in a moment; 2) The price
of the stock goes up.
Stock prices change based upon supply and demand.
Generally speaking, there is a fixed number of shares
traded “in the market” and the price of shares chang-
es based upon supply and demand. If more people
want to buy, the price goes up. More sellers than
buyers, the price goes down. Why would people
want to own a particular company? 1) They like the
company’s product or services; 2) They think the
management is smart. However, both of the previ-
ous two items lead to the following conclusion: 3)
The company will be more profitable in the future
than it is today, which in turn influences more people
to buy the stock and causes the price of the stock to
go up; 4) the dividend yield is attractive relative to
other income producing investments such as bonds,
CDs or T-bills.
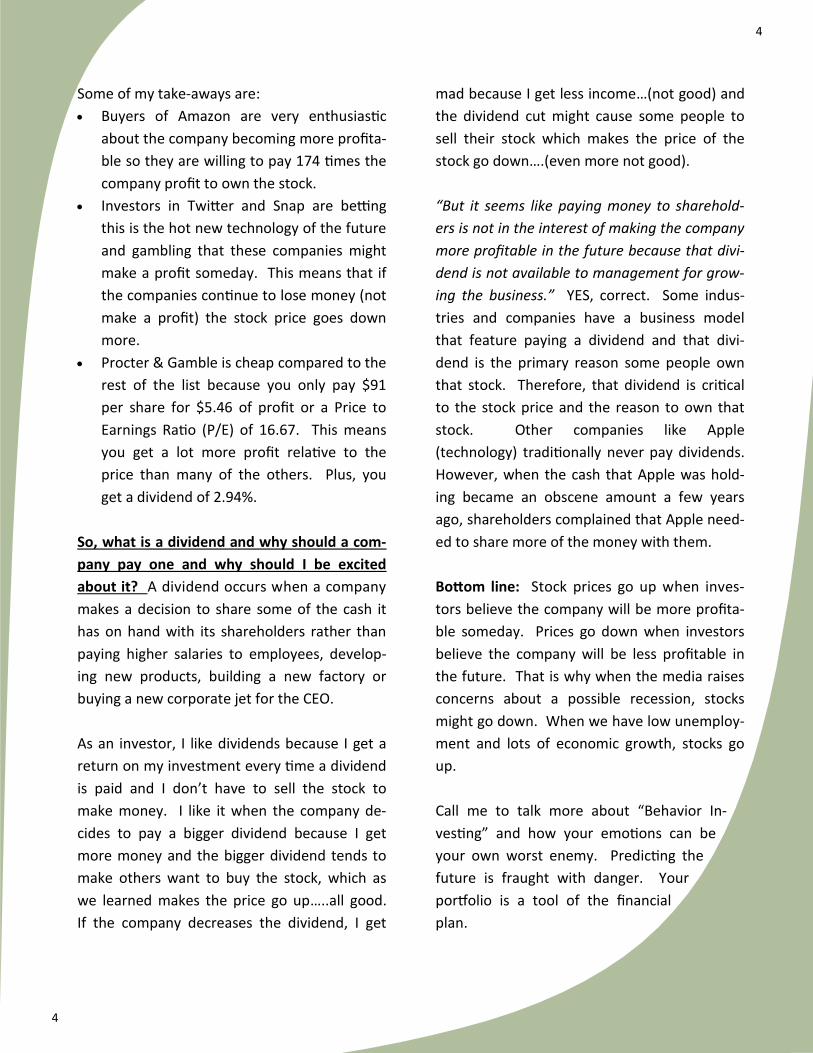
Now, study the following chart for a few moments.
What conclusions do you come away with?
Price Earning / Sh P/E ratio Div'd Yld
Amazon $854 $4.90 174.29 na
Procter & Gamble
$91 $5.46 16.67 2.94%
Twitter $15 -$0.65 -23.2 na
Snap $20 -$0.620 -31.5 na
Prices, earnings and dividend yield come from Yahoo Finance March 17, 2017
4
4
Some of my take-aways are:
Buyers of Amazon are very enthusiastic
about the company becoming more profita-
ble so they are willing to pay 174 times the
company profit to own the stock.
Investors in Twitter and Snap are betting
this is the hot new technology of the future
and gambling that these companies might
make a profit someday. This means that if
the companies continue to lose money (not
make a profit) the stock price goes down
more.
Procter & Gamble is cheap compared to the
rest of the list because you only pay $91
per share for $5.46 of profit or a Price to
Earnings Ratio (P/E) of 16.67. This means
you get a lot more profit relative to the
price than many of the others. Plus, you
get a dividend of 2.94%.
So, what is a dividend and why should a com-
pany pay one and why should I be excited
about it? A dividend occurs when a company
makes a decision to share some of the cash it
has on hand with its shareholders rather than
paying higher salaries to employees, develop-
ing new products, building a new factory or
buying a new corporate jet for the CEO.
As an investor, I like dividends because I get a
return on my investment every time a dividend
is paid and I don’t have to sell the stock to
make money. I like it when the company de-
cides to pay a bigger dividend because I get
more money and the bigger dividend tends to
make others want to buy the stock, which as
we learned makes the price go up…..all good.
If the company decreases the dividend, I get
mad because I get less income…(not good) and
the dividend cut might cause some people to
sell their stock which makes the price of the
stock go down….(even more not good).
“But it seems like paying money to sharehold-
ers is not in the interest of making the company
more profitable in the future because that divi-
dend is not available to management for grow-
ing the business.” YES, correct. Some indus-
tries and companies have a business model
that feature paying a dividend and that divi-
dend is the primary reason some people own
that stock. Therefore, that dividend is critical
to the stock price and the reason to own that
stock. Other companies like Apple
(technology) traditionally never pay dividends.
However, when the cash that Apple was hold-
ing became an obscene amount a few years
ago, shareholders complained that Apple need-
ed to share more of the money with them.
Bottom line: Stock prices go up when inves-
tors believe the company will be more profita-
ble someday. Prices go down when investors
believe the company will be less profitable in
the future. That is why when the media raises
concerns about a possible recession, stocks
might go down. When we have low unemploy-
ment and lots of economic growth, stocks go
up.
Call me to talk more about “Behavior In-
vesting” and how your emotions can be
your own worst enemy. Predicting the
future is fraught with danger. Your
portfolio is a tool of the financial
plan.

5
5
This information was prepared by and express the opinions/views of Fredrick Wollman and has been made available to distribute to the public for informational pur-
pose only. The opinions/views expressed within do not necessarily re-flect those of Voya Financial Advisors, Inc. or its representatives. In addition, they are not intend-
ed to provide specific advice or recommendations for any individual. Neither Voya Financial Advisors, Inc. nor Fredrick Wollman provides tax or legal advice. You
should consult with your attorney, accountant or tax advisor regarding your individual situation prior to making any investment decisions.
Securities and Investment Advisory Services offered through Voya Financial Advisors, Inc. Member SIPC
Wollman Wealth Designs, Inc is not a subsidiary of nor controlled by Voya Financial Advisors.
#31485992_IAR_0418
Fred Wollman earned his Certified Finan-
cial Planner “CFP®” professional creden-
tial in 1984 and the Master Planner Ad-
vanced Studies “MPAS®” designation in
2015. He holds securities registrations 7,
63 and 24. He is registered in California,
Arizona, South Dakota, Colorado, Minne-
sota, Texas, Virginia, Washington, Ore-
gon, Florida, Tennessee and Pennsylvania
in addition to holding a California life and
disability insurance license. From 1987
through 1990 Fred taught the CFP classes
to aspiring financial professionals at San
Diego State University.
He is on the board of the Valley Center
Trails Association, ECOLife Conservation,
and the Hidden Valley Kiwanis Club.
Fred and his wife of thirty-six years,
Kathy, live in Valley Center, CA with two
cats, a dog and two horses.
Fred spends his down time relaxing with
yoga, tai chi, riding horses and when he
can get really away, backpacking the Anza
Borrego Desert, Mt. San Jacinto or the
California Sierra Nevada Mountains .
Question from front page --- Market declines within the Bull:
April 2011 to September 2011 the S&P declined 15.3%. Why?
Congress failed to extend the debt ceiling resulting in the down-
grading of U.S. government debt from AAA to AA, the Federal
Government shut down resulting in the closing of National Parks
among other government departments, all leading to fear of an-
other recession. What fixed it? Congress enacted the legislation
to extend the debt ceiling, the economy continued to slowly get
better and fears subsided.
May 2015 to February 2016 the S&P declined 12.3%. Why? Cor-
porate earnings stopped growing (less profitable than a year earli-
er) and the price of commodities especially oil began significant
declines which resulted in fear of a recession. Plus, the Bull Mar-
ket was over six years old, so the Bull is old, tired and should be
dying…right? What fixed it? Honestly, I don’t know. The market
just started to go up in February 2016. Corporate Earnings contin-
ued negative until the fourth quarter of 2016 when they turned
positive after five quarters.
As I type this, earnings continue positive, housing starts are good, cor-
porations are hiring and appear to have a difficult time finding quali-
fied applicants. Does any of this guarantee markets will continue to
grow. Heck no. Does this mean the Bull will die soon. Heck no. You
cannot predict when, why, what or where.
Remember, the financial plan drives the portfolio. Investing based
upon “feeling, predictions, or emotions” is a dangerous thing.
“The key is not to predict the future but to prepare
for it.”
--- Pericles