halocarbons in the ttl: the roles of oceanic emissions … in the ttl: the roles of oceanic...
TRANSCRIPT
Halocarbons in the TTL: the roles of oceanic emissions and
atmospheric transport
S. Tegtmeier1
K. Krüger2, B. Quack1, E. Atlas3, F. Ziska1
1GEOMAR Helmholtz Centre for Ocean Research Kiel, Kiel, Germany 2Department of Geosciences, University of Oslo, Oslo, Norway
3Rosenstiel School of Marine and Atmospheric Science, University of Miami, Florida, USA
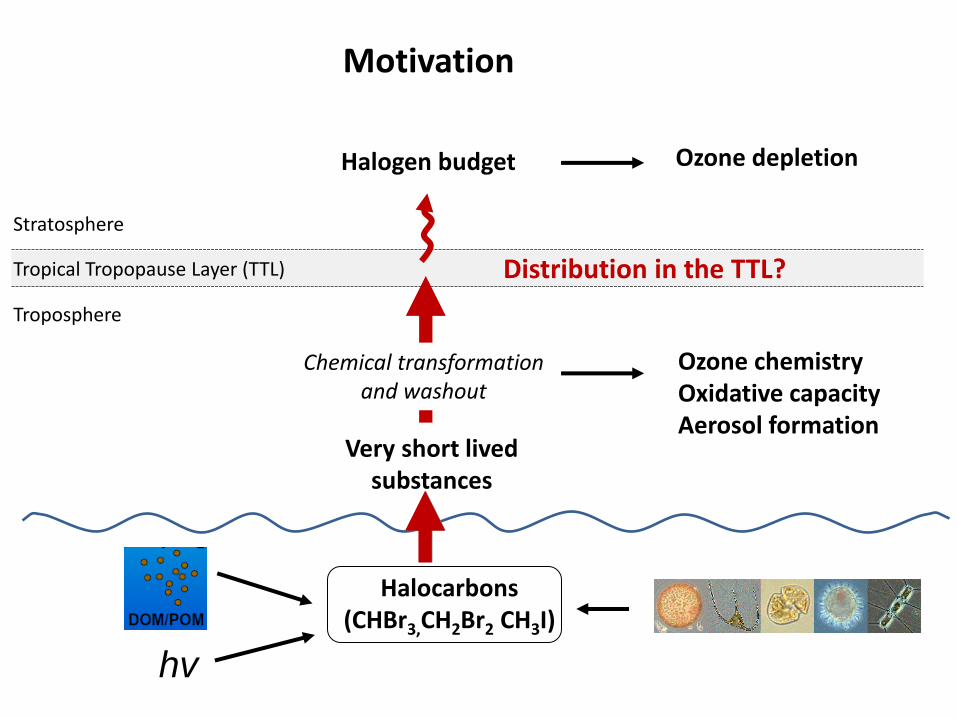
Halocarbons (CHBr3,CH2Br2 CH3I)
Troposphere
Halogen budget
Very short lived substances
Stratosphere
Tropical Tropopause Layer (TTL)
Ozone depletion
Ozone chemistry Oxidative capacity Aerosol formation
Troposphere
hv
Motivation
Distribution in the TTL?
Chemical transformation and washout
Halocarbons (CHBr3,CH2Br2 CH3I)
Troposphere
Very short lived substances
Stratosphere
Tropical Tropopause Layer (TTL)
Chemical transformation and washout
Ozone chemistry Oxidative capacity Aerosol formation
Troposphere
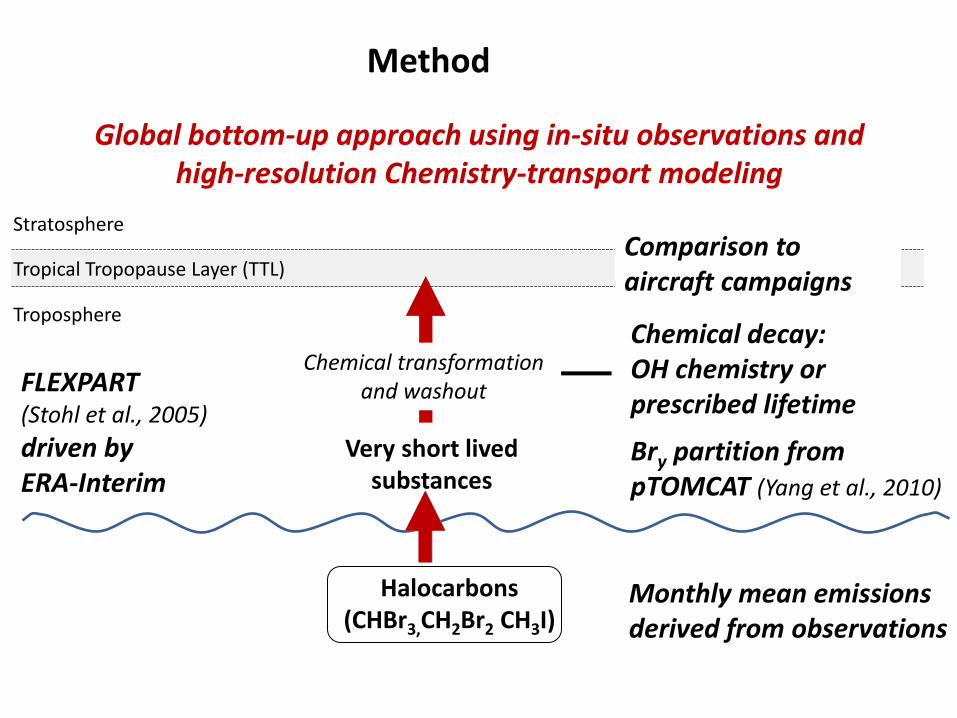
Method
Global bottom-up approach using in-situ observations and high-resolution Chemistry-transport modeling
FLEXPART (Stohl et al., 2005)
driven by ERA-Interim
Monthly mean emissions derived from observations
Chemical decay: OH chemistry or prescribed lifetime
Bry partition from pTOMCAT (Yang et al., 2010)
Comparison to aircraft campaigns
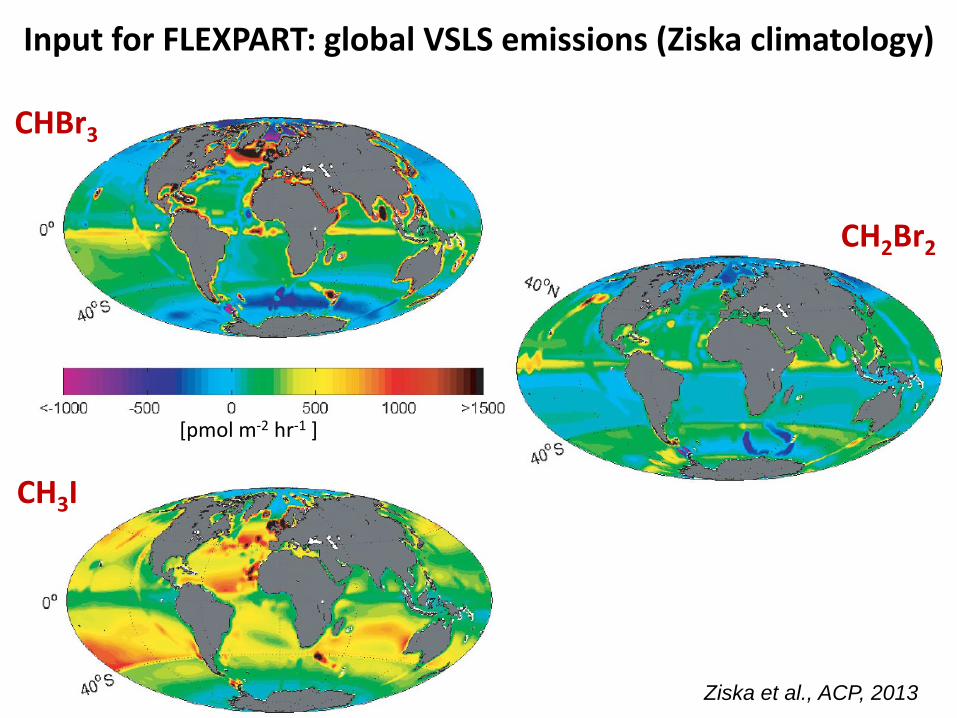
Input for FLEXPART: global VSLS emissions (Ziska climatology)
CH2Br2
[pmol m-2 hr-1 ]
Ziska et al., ACP, 2013
CHBr3
CH3I
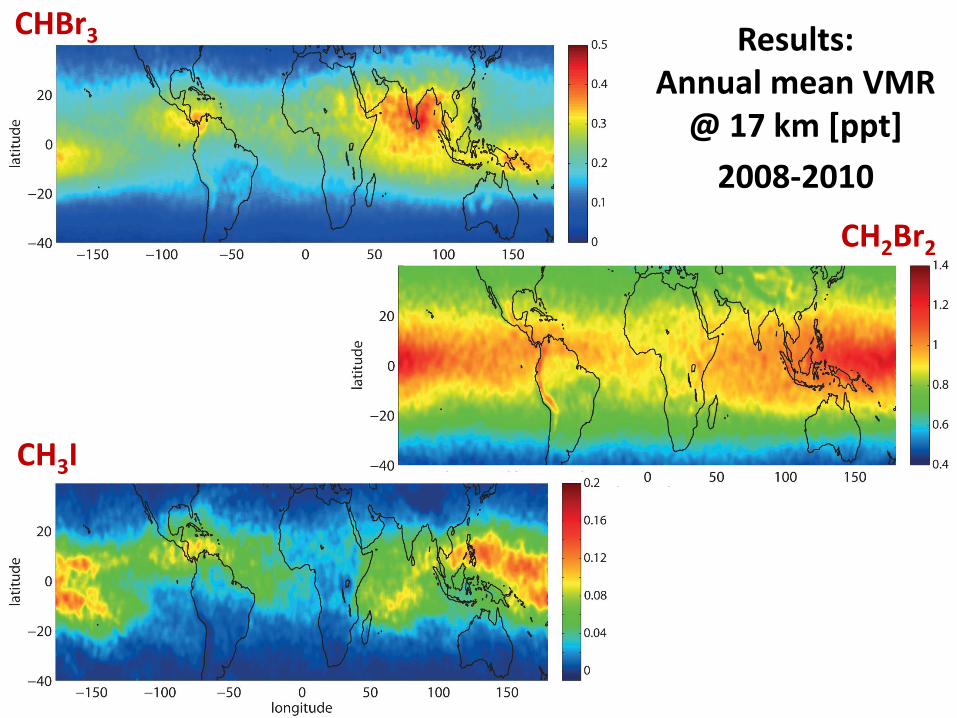
Results: Annual mean VMR
@ 17 km [ppt]
2008-2010
CH3I
CH2Br2
CHBr3
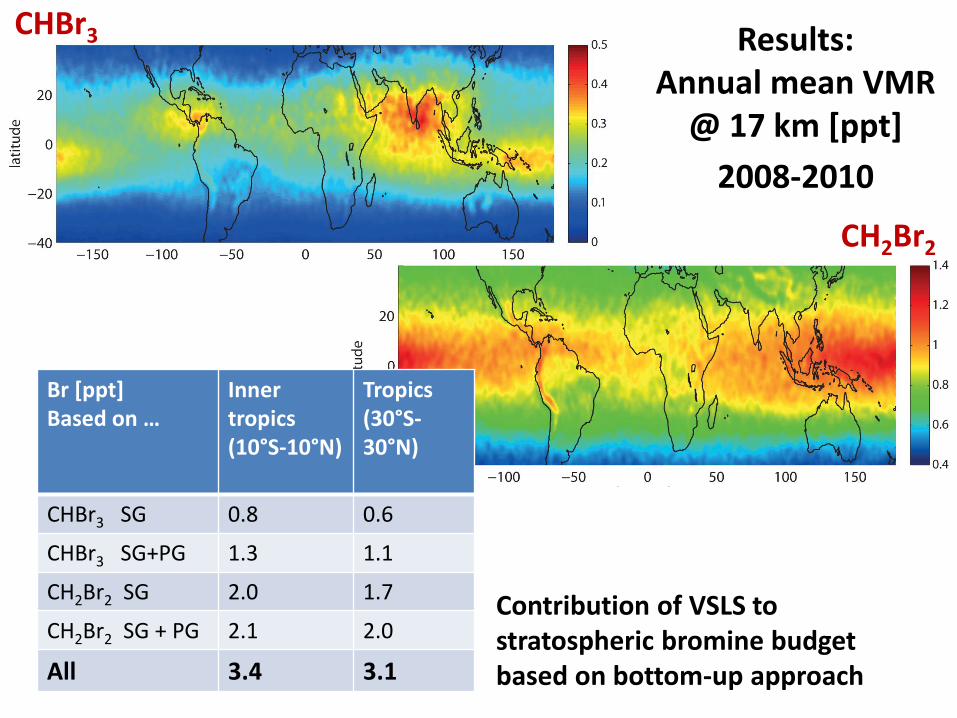
Results: Annual mean VMR
@ 17 km [ppt]
2008-2010
CH2Br2
CHBr3
Br [ppt] Based on …
Inner tropics (10°S-10°N)
Tropics (30°S-30°N)
CHBr3 SG 0.8 0.6
CHBr3 SG+PG 1.3 1.1
CH2Br2 SG 2.0 1.7
CH2Br2 SG + PG 2.1 2.0
All 3.4 3.1
Contribution of VSLS to stratospheric bromine budget based on bottom-up approach
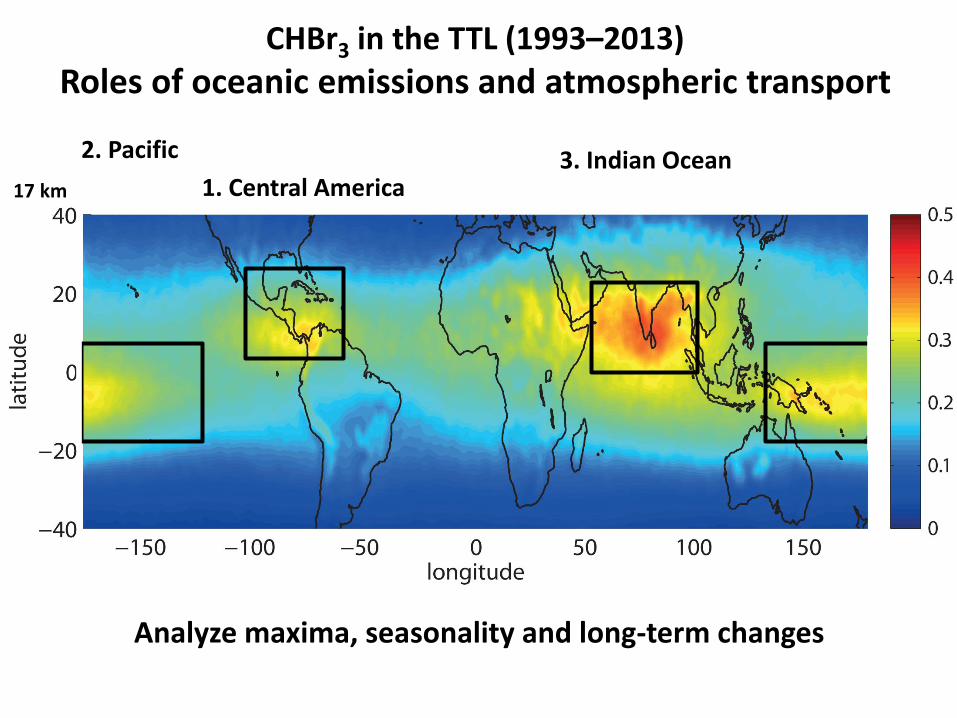
CHBr3 in the TTL (1993–2013)
Roles of oceanic emissions and atmospheric transport
1. Central America
2. Pacific 3. Indian Ocean
Analyze maxima, seasonality and long-term changes
17 km
FLEXPART vs. ACCENT, September 1999
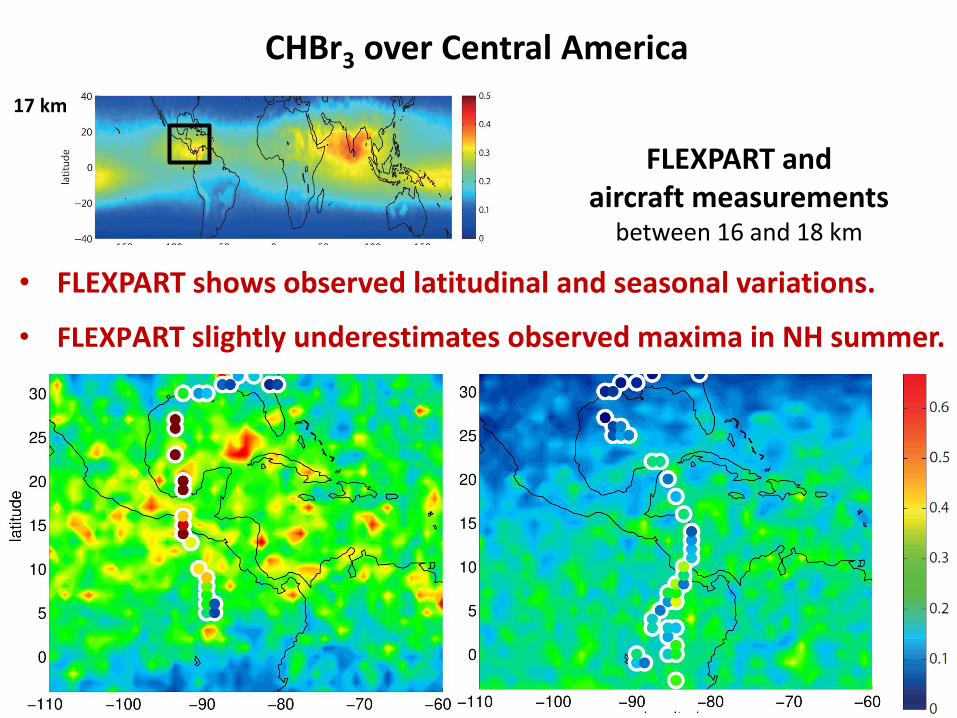
FLEXPART and aircraft measurements
between 16 and 18 km
CHBr3 over Central America
FLEXPART vs. PRE-AVE, January 2004
17 km
• FLEXPART shows observed latitudinal and seasonal variations.
• FLEXPART slightly underestimates observed maxima in NH summer.
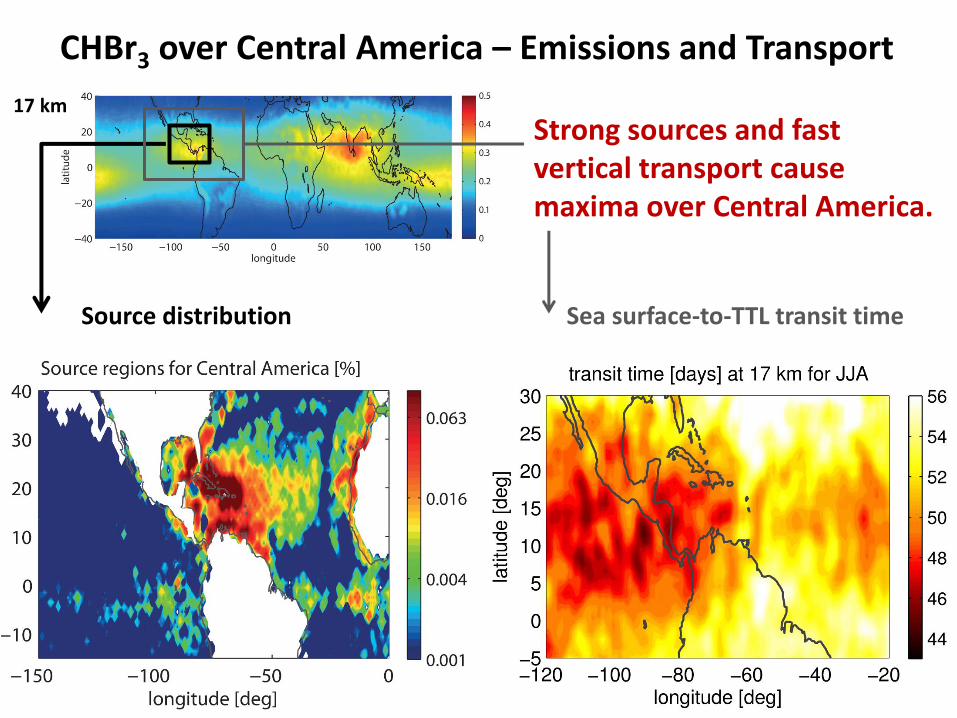
CHBr3 over Central America – Emissions and Transport
17 km
Source distribution Sea surface-to-TTL transit time
Strong sources and fast vertical transport cause maxima over Central America.
17 km
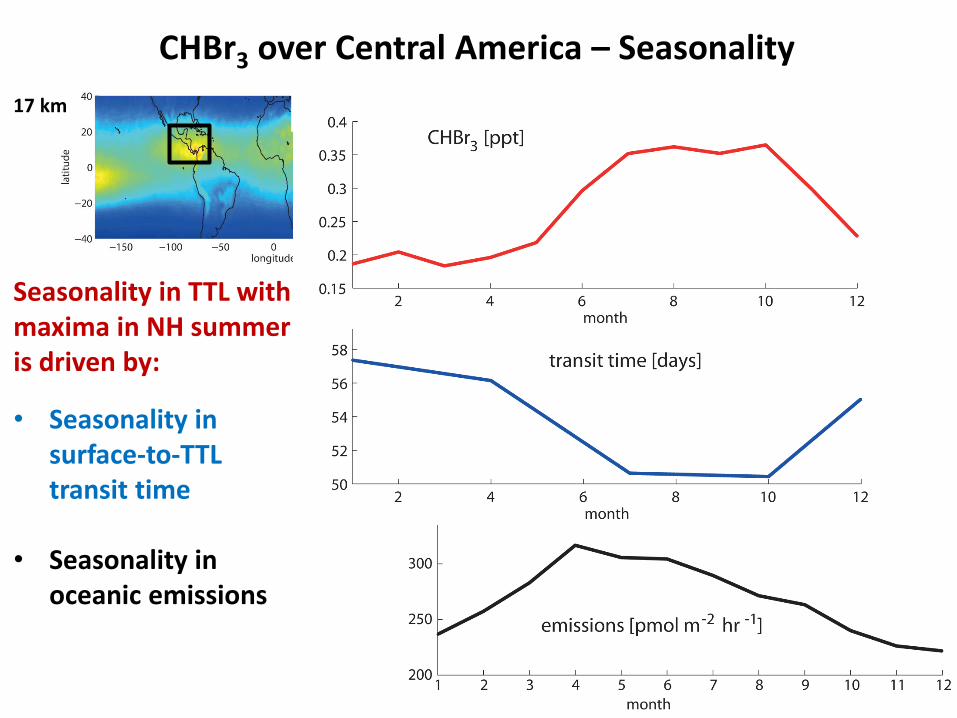
CHBr3 over Central America – Seasonality
Seasonality in TTL with maxima in NH summer is driven by:
• Seasonality in surface-to-TTL transit time
• Seasonality in oceanic emissions
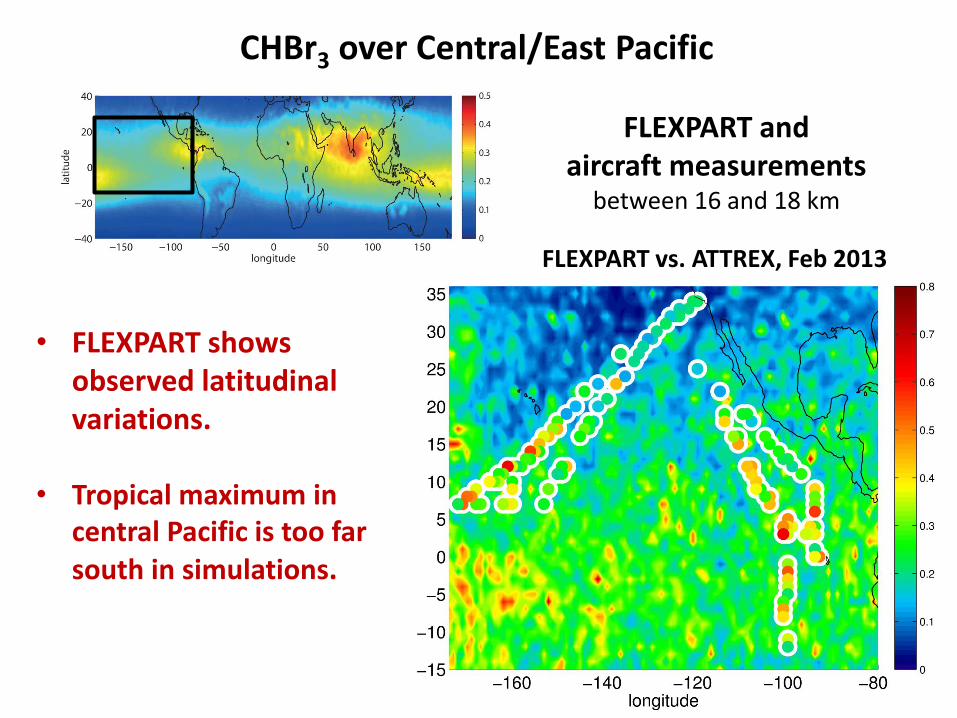
CHBr3 over Central/East Pacific
FLEXPART and aircraft measurements
between 16 and 18 km
FLEXPART vs. ATTREX, Feb 2013
• FLEXPART shows observed latitudinal variations.
• Tropical maximum in central Pacific is too far south in simulations.
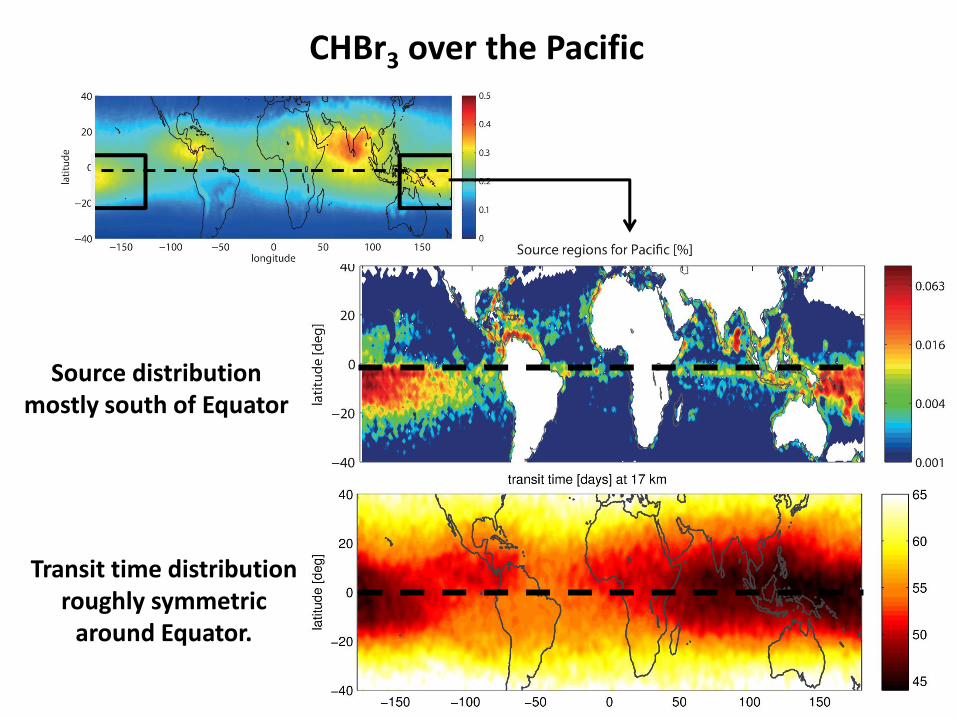
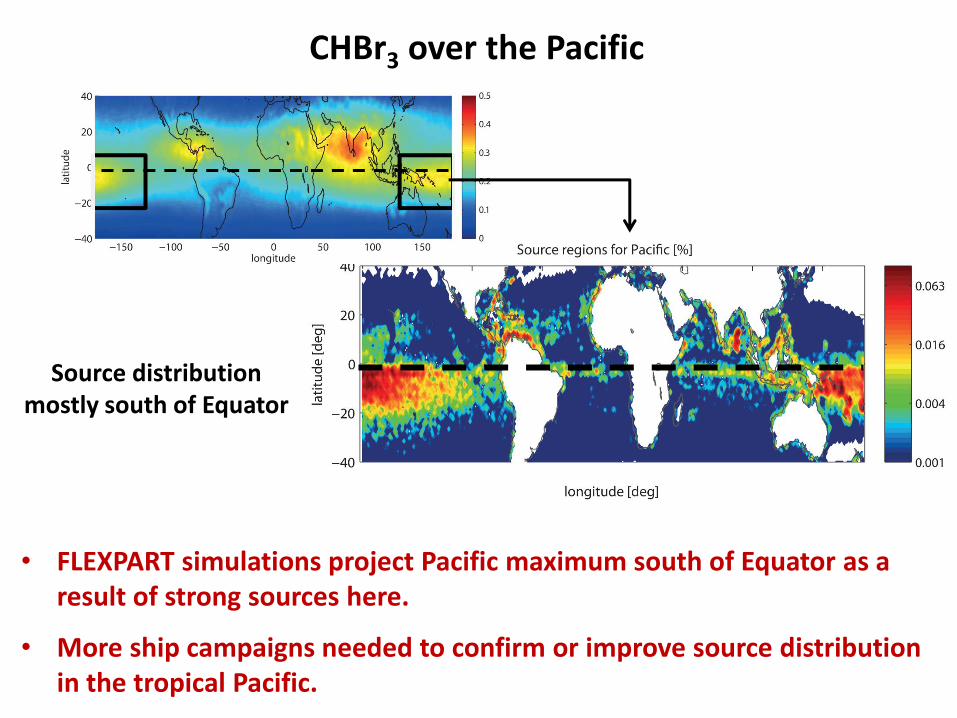
CHBr3 over the Pacific
Source distribution mostly south of Equator
Transit time distribution roughly symmetric
around Equator.
CHBr3 over the Pacific
Source distribution mostly south of Equator
• FLEXPART simulations project Pacific maximum south of Equator as a result of strong sources here.
• More ship campaigns needed to confirm or improve source distribution in the tropical Pacific.
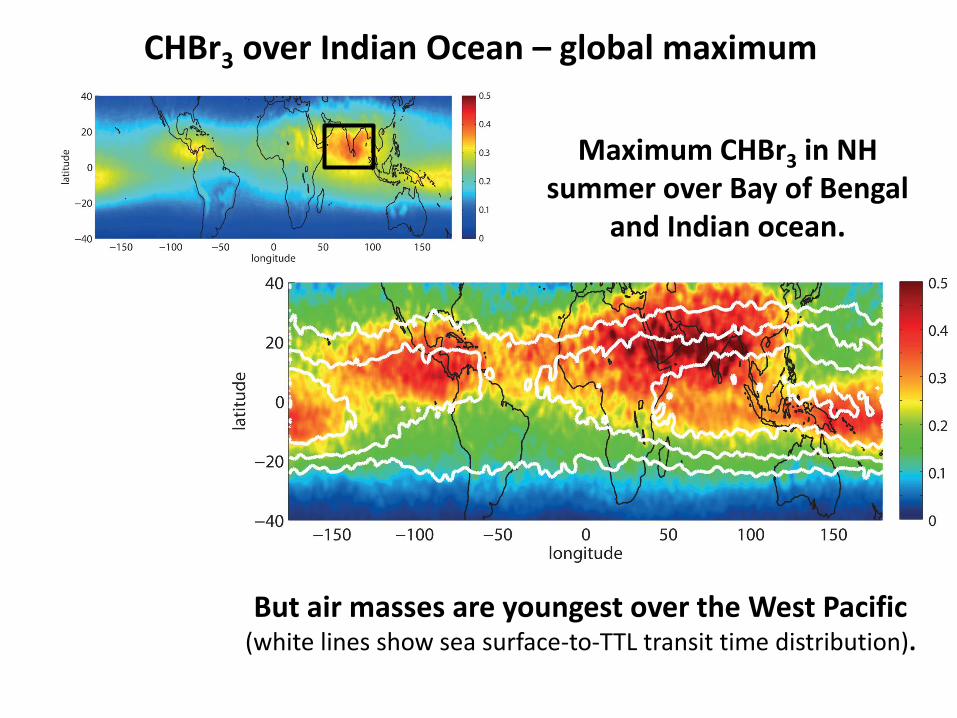
CHBr3 over Indian Ocean – global maximum
Maximum CHBr3 in NH summer over Bay of Bengal
and Indian ocean.
But air masses are youngest over the West Pacific (white lines show sea surface-to-TTL transit time distribution).
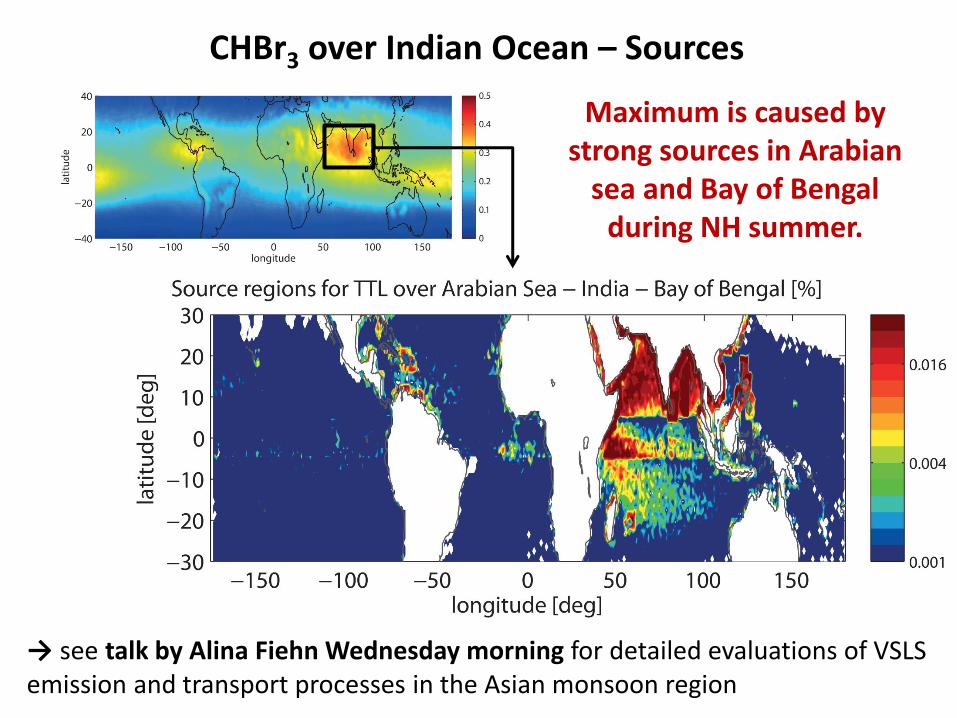
CHBr3 over Indian Ocean – Sources
→ see talk by Alina Fiehn Wednesday morning for detailed evaluations of VSLS emission and transport processes in the Asian monsoon region
Maximum is caused by strong sources in Arabian
sea and Bay of Bengal during NH summer.
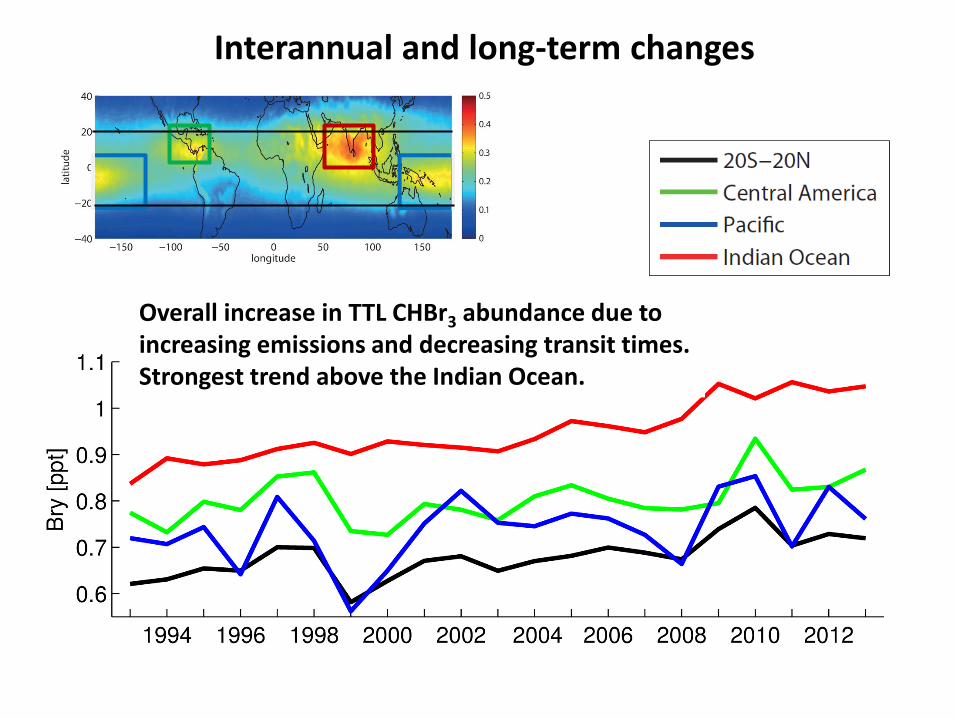
Interannual and long-term changes
Overall increase in TTL CHBr3 abundance due to increasing emissions and decreasing transit times. Strongest trend above the Indian Ocean.
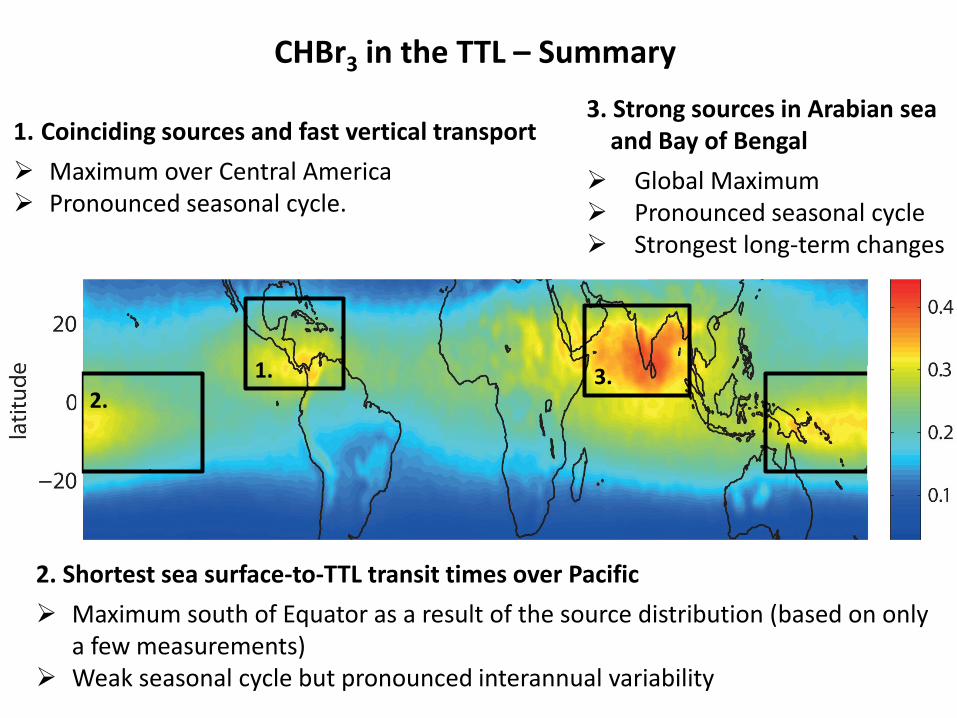
CHBr3 in the TTL – Summary
2. Shortest sea surface-to-TTL transit times over Pacific
Maximum south of Equator as a result of the source distribution (based on only a few measurements)
Weak seasonal cycle but pronounced interannual variability
1. Coinciding sources and fast vertical transport
Maximum over Central America Pronounced seasonal cycle.
3. Strong sources in Arabian sea and Bay of Bengal
Global Maximum Pronounced seasonal cycle Strongest long-term changes
3. 2.
1.