half-yearly monetary and financial stability report ... · half-yearly monetary and financial...
TRANSCRIPT

HALF-YEARLY MONETARY ANDFINANCIAL STABILITY REPORT
September 2017
This Report reviews statistical information between the end of February 2017 and the end of August 2017.


Half-Yearly Monetary and Financial Stability Report
September 2017
Table of Contents
1. Summary and overview 4
2. Global setting and outlook 10
2.1 External environment 10
2.2 Mainland China 21
3. Domestic economy 36
3.1 Real activities 36
3.2 Inflation and unemployment 37
4. Monetary and financial conditions 40
4.1 Exchange rate and capital flows 40
4.2 Money and credit 42
4.3 Equity market 58
4.4 Debt market 60
4.5 Property markets 62
5. Banking sector performance 66
5.1 Profitability and capitalisation 66
5.2 Liquidity and interest rate risks 68
5.3 Credit risk 70
5.4 Systemic risk 75
Box 1. Identifying the latest stage of the US business cycle with 15
cluster analysis
Box 2. Real estate prices and corporate borrowing in 31
Mainland China
Box 3. Analysis on the determinants of HIBOR-LIBOR spreads 49
Box 4. Safehavenness of the Chinese renminbi 54
Box 5. Inward monetary policy spillover and implications for 79
US dollar lending of foreign banks in Hong Kong
Glossary of terms
Abbreviations
Page 3

1. Summary and overview
Global economic conditions improved with a synchronous cyclical rebound in real activities.
Nevertheless, optimism about the global economic outlook has driven asset market
valuations to elevated levels as well as a pick-up in credit growth in many Asian economies,
thereby increasing the vulnerability of global and regional economies to financial stability
risks. In particular, the global economy is still subject to numerous uncertainties, including
the sustainability of global growth momentum, the impact of monetary policy normalisation
by the US Federal Reserve and possibly other major central banks, as well as heightened
geopolitical tensions.
The Hong Kong dollar exchange rate eased gradually reflecting increased interest rate
arbitrage activities amid widened negative spreads between the Hong Kong dollar interbank
interest rates and their US dollar counterparts. Despite the US interest rate hikes in March
and June, local interest rates remained soft in part reflecting ample liquidity, and there was
broad-based growth in total loans. Housing affordability remained stretched, although the
residential property market showed tentative signs of moderation after the prudential
measures introduced in May.
Looking ahead, in view of the widened interest rate differential between Hong Kong and the
US, banks should stay vigilant about the risks of significant capital outflows and their
impact on local interest rates amid the Fed’s ongoing rate hikes and the forthcoming balance
sheet normalisation. Banks should also maintain prudent credit risk management as sharp
rises in interest rates could test banks’ asset quality given the rising levels of corporate
leverage and increasing household debt-servicing burdens.
The external environment
The cyclical rebound in global economic activity,
which emerged in the latter part of 2016 amid a
synchronous upturn in global trade and
production, has extended into the first half of
2017. Economic and political uncertainty in
major advanced economies has also receded
along with easing concerns over the rise of
populist and anti-establishment sentiments in
the run-up to elections in Europe. Against this
background, global equity markets maintained
their post US election rallies, propelling
valuations to elevated levels in some markets,
especially in the US.
Nonetheless, the current benign global
macro-economic and financial market
environment is still subject to numerous
uncertainties, including the sustainability of
Page 4

global growth momentum, the impact of
monetary policy normalisation by the US Federal
Reserve (Fed) and possibly other major central
banks, trade-off between containing financial
risks and sustaining growth in Mainland China,
and the recent escalation of geopolitical risks.
The US economy is showing signs of a maturing
expansion. While the modest inflationary
pressures and a pickup in growth in the second
quarter are suggestive of an early-to-intermediate
stage of recovery, developments in several other
aspects of the economy more closely resemble
the situation of a maturing expansion. Indeed,
recent movements in financial market and
labour market indicators, such as the flattening
of the Treasury yield curve slope and the
sustained drop in the unemployment rate, are
indicative of the US economy entering the
late-cycle phase of expansion. If this were indeed
the case, the presently rich equity market
valuation and the current cyclical recovery in
global demand would likely be called into
question. In this connection, Box 1 (see page 15)
assesses the latest stage of the US economy’s
business cycle, by examining how various
economic indicators behaved during different
stages of the business cycles using a statistical
classification technique known as cluster
analysis.
Another development of significance is the Fed’s
intention to implement balance sheet
normalisation in the near term. Given the
measured pace of balance sheet reduction, it is
likely the resulting rise in longer-term yields
would be gradual. Yet, it remains to be seen how
it would affect the US Treasury market and its
spillover effects on domestic and international
financial conditions.
In East Asia, although most economies seem to
be benefitting from the synchronous
improvement in global trade activities and
renewed capital inflows for now, risk exists that
tighter global financial conditions stemming
from on-going interest rate hikes and balance
sheet normalisation by the Fed could lead to
capital flow reversals in the region going forward.
Meanwhile, weaker-than-expected growth in the
US could lead to a disruption of the region’s
recovery, and the recent pick-up in credit growth
as well as the increasingly stretched financial
asset valuation amid resumed portfolio inflows
are increasing the vulnerability of the regional
economies to shocks, particularly given the rise
in Sino-US trade tensions amid protectionist
sentiment and the heightening geopolitical
tensions in the Korean Peninsula.
In Mainland China, growth momentum
improved further in the first half of 2017. The
better-than-expected economic performance was
in part underpinned by better export
performance amid greater external demand and a
rebound in private investment growth amid
buoyant property market conditions. While the
near-term growth outlook for the Mainland
economy remains positive, it also hinges on how
the authorities strike a balance between
supporting the economy and preventing
systemic risks, such as those potentially
associated with the exuberance in the property
market and the increased exposure of banks to
non-bank institutions. On the external front,
capital outflow pressures continued to ease in
tandem with improved economic conditions, but
the uncertainties in monetary conditions among
major economies as well as global market
sentiment would still play an important role in
shaping the near-term outlook for cross-border
fund flows.
The soaring property prices in Mainland China
have raised concerns, given the strong link
between real estate cycles and financial stability.
While the direct exposure of Mainland banks to
the property market should be manageable, bank
exposure to the property market through the
collateral channel should not be ignored, given
the key role played by the property market in the
collateral-based lending system. Box 2
(see page 31) discusses the risk associated with
banks’ exposure to the property market by
Page 5

examining the effect of property prices on
corporate borrowing through the collateral
channel. Our analysis shows that property price
changes have a positive effect on firms’ debt
growth, especially for financially constrained
firms such as smaller and non-state-owned
companies, suggesting that banks’ heavy reliance
on properties and land as collateral may lead to a
pro-cyclical swing in the indebtedness of these
firms.
The domestic economy
The Hong Kong economy maintained its
sequential growth momentum during the first
half of 2017. The quarter-on-quarter real Gross
Domestic Product (GDP) growth was 0.7% in the
first quarter and 1.0% in the second, similar to
the average growth rate of 1% over the preceding
two quarters. Compared with the second half of
2016, private consumption held up alongside
favourable labour market conditions, and overall
investment spending revived on improving
business sentiment towards mid-2017.
Externally, Hong Kong’s exports of goods
recorded four consecutive quarters of brisk
growth before moderating somewhat in the
second quarter. Exports of services fell back due
in part to reduced demand for tourism-related
services. Meanwhile, growth in imports of
services continued amid strong travel interest
among residents. Overall, net exports
contributed positively to GDP growth in the first
quarter but turned into a drag on growth in the
second.
In the second half of the year, domestic
economic growth is expected to sustain
momentum, albeit at a slightly softer but still
solid pace amid a higher comparison base in the
first half. For 2017 as a whole, the Government
has revised upward its range forecast of real GDP
growth to 3–4% from 2–3% as announced earlier
in February. That said, this growth outlook is
subject to various uncertainties in the external
environment as mentioned above, as well as
Mainland’s economic performance and the pace
of recovery in inbound tourism.
Local inflationary pressures stayed moderate in
the first half of 2017 despite a drop of
unemployment rate to 3.2% from 3.4% in 2016.
However, the sequential momentum has
accelerated in recent months, mainly driven by
the increases in the prices of tradables. Looking
ahead, inflationary pressures are likely to be
limited on the back of benign imported inflation
and moderate rises in local costs.
Monetary conditions and capital flows
The Hong Kong dollar spot exchange rate has
eased gradually since early 2017 driven by
increased interest rate arbitrage activities amid
widened negative spread between the Hong Kong
dollar Interbank Offered Rate (HIBOR) and the
US dollar London Interbank Offered Rate (LIBOR)
after the two US rate hikes in March and June.
The Convertibility Undertaking (CU) was not
triggered during the review period, and the pace
of Hong Kong dollar depreciation has been
orderly so far.
Going forward, the ongoing US monetary policy
normalisation process could widen the negative
HIBOR-LIBOR spreads further. Interest rate
arbitrage activities are expected to lead to the
further easing of the Hong Kong dollar exchange
rate. The possibility of triggering the weak-side
CU, which is a normal process under the
Currency Board system, should not be ruled out.
Despite the US interest rate hikes, the Hong Kong
dollar interest rates remained soft in part
reflecting ample liquidity in the banking system.
Contrary to the increases in LIBOR, HIBOR
decreased across-the-board over the first eight
months of 2017, with the overnight and the
three-month HIBOR fixings declining by 36 and
26 basis points respectively. Against the
background of the widened negative HIBOR-
LIBOR spreads, Box 3 (see page 49) discusses the
Page 6

fundamental drivers of the Hong Kong dollar-
US dollar interest rate spreads. Meanwhile, in
the mortgage market, intensifying competition
among banks amid low funding costs also
lowered the average mortgage rate to around
1.8% recently.
Amid the accommodative domestic liquidity
conditions and the improved economic
environment, growth in total loans accelerated
to 10.2% in the first half of 2017. The faster
expansion was underpinned by broad-based
increases in domestic loans to most economic
sectors, as well as loans for use outside Hong
Kong to both domestic and multinational
corporations.
Despite the strong credit growth, banks’ funding
conditions were broadly stable underpinned by a
large deposit base. The Hong Kong dollar
loan-to-deposit (LTD) ratio stayed unchanged at
77.1% at the end of June as Hong Kong dollar
loans and deposits grew at a similar pace. The
foreign-currency LTD ratio increased to 65.5%
due to faster growth in loans than deposits.
The onshore (CNY) and offshore (CNH) renminbi
exchange rates reversed their weakening trend to
appreciate against the US dollar. This partly
reflected the improved Mainland economy and a
general weakening of the US dollar against other
major currencies. Along with the renminbi
exchange rate movements, there were signs of
stabilisation in Hong Kong’s offshore renminbi
liquidity pool (including outstanding customer
deposits and certificates of deposits), as renminbi
customer deposits reverted to a modest increase
in the second quarter. However, in the first half
of 2017 as a whole, the renminbi liquidity pool
still recorded a mild decrease. As for other
renminbi banking business, the outstanding
amount of renminbi bank loans and the
renminbi trade settlements handled by banks in
Hong Kong declined somewhat, while the
average daily turnover of the renminbi real time
gross settlement system remained high. Against
the background of continuing
internationalisation of the renminbi, Box 4
(see page 54) analyses the extent to which the
renminbi has been perceived as a safe-haven
currency over the past few years. The empirical
results found that the CNY and CNH ranked
consistently quite high on the safe-haven
currency scale by both dollar-based and euro-
based investors. Within the Special Drawing
Rights basket, they are regarded as riskier than
the Japanese yen and the US dollar but safer than
the euro and British pound.
Asset markets
The domestic equity market staged a strong rally
alongside other major markets over the past six
months, as a result of better-than-expected
macroeconomic performances and corporate
earnings. The review period saw a considerable
net inflow of funds following two consecutive
years of net outflow. Market volatility remained
subdued despite geopolitical risk events, for
example more frequent terrorist attacks in
Europe and increasing tensions over the Korean
Peninsula. Against this backdrop, the price-
earnings ratio of local stocks climbed to a six-
year high, although it remained attractive in
relative terms both globally and within the
region. Nevertheless, this renders the market
more vulnerable to shocks, especially since the
current levels of the US SKEW index reflect a
high level of tail risk.
The Hong Kong dollar debt market registered a
steady expansion in the first half of the year,
with credit spreads over US Treasury yields
generally trending downwards. Like the stock
market, it also experienced a net inflow of funds,
partly attributable to the fact that the two US
interest rate hikes were well anticipated. In
contrast, the offshore renminbi debt market in
Hong Kong shrank further, amid continued lower
funding costs onshore. However, the uncertainty
over the exchange rate and onshore-offshore
funding cost gap is likely to cast a shadow over
Page 7

near-term market development. Over the longer
term, the development will hinge on future
offshore-onshore market interactions in view of
more policy initiatives, such as the recent Bond
Connect, and continuing market evolution with,
for example, the inclusion of onshore bonds into
benchmark global indices.
The residential property market has become
buoyant again since March, with property prices
in the secondary market surpassing the peak in
September 2015. Transactions in the primary
and secondary markets also picked up. The
rising property prices stretched housing
affordability further. Partly as a result, it is more
common for recent homebuyers to receive
financial support from their parents or to take up
high-LTV mortgages provided by property
developers. In response to the latter, on 12 May
the HKMA introduced prudential measures to
strengthen banks’ credit risk management for
exposures to property developers offering
mortgages. On 19 May, the HKMA further
announced the eighth round of prudential
measures for property mortgage loans in view of
rising property prices and intensifying
competition for mortgage loan business among
banks. Housing price growth showed signs of
moderation following the prudential measures in
May, while average transactions declined in July
and August compared with the first half of the
year.
Looking ahead, the residential property market
outlook remains highly uncertain. Low interest
rates, perceived housing shortage, aggressive
promotion and financing plans provided by
property developers may continue to boost the
demand for properties in the near term, but the
expected increase in housing supply would
narrow the housing supply-demand gaps and
normalisation of domestic interest rates would
raise the debt servicing cost of mortgage loans to
contain property price appreciation pressure over
a longer time horizon.
Banking sector performance
The profitability of retail banks improved, with
the return on assets increasing to 1.17% in the
first half of 2017 compared to 1.07% in the first
half of 2016. The improvement was due to
higher net interest income and non-interest
income. The net interest margin of retail banks
also widened to 1.43% in the second quarter of
2017 from 1.33% in the same period of 2016.
Banks maintained strong capital positions, with
the consolidated capital adequacy ratio (CAR) of
locally incorporated authorized institutions (AIs)
staying at a high level of 18.7%. Although the
CAR fell slightly by 0.5 percentage points, it
remained well above the minimum international
standards. To reinforce banks’ resilience to
systemic risks, the countercyclical capital buffer
ratio for Hong Kong will rise to 1.875% with
effect from 1 January 2018 from the current
1.25%.
Notwithstanding US interest rate hikes, the Hong
Kong dollar interbank interest rates remained
soft, reflecting ample liquidity in the banking
sector. The Hong Kong dollar funding costs of
retail banks, as reflected by the composite
interest rate, also remained low and stable.
Meanwhile, liquidity positions of AIs were
generally sound as measured by Basel III
standards. Both the average Liquidity Coverage
Ratio for category 1 institutions and the average
Liquidity Maintenance Ratio of category 2
institutions remained high at 144.2% and 49.7%
respectively in the second quarter of 2017, which
were significantly higher than their statutory
minimums of 80% and 25% respectively.
While bank lending grew more rapidly by a rate
of 10.2% in the first half of 2017 compared to
4.2% in the preceding six months, asset quality
remained sound by historical standards and
improved further during the review period.
Page 8

However, the banking sector is expected to face
various challenges ahead. In particular, policy
uncertainties in major advanced economies are
one important risk factor affecting the Hong
Kong banking sector. Box 5 (see page 79)
examines how changes in monetary policies by
major central banks may affect foreign banks in
Hong Kong. Our findings suggest that the
negative spillover effects arising from the joint
tightening of monetary policies in major
advanced economies could exert significant
pressure on US dollar credit availability in Hong
Kong. Nevertheless, continuing regulatory
reforms and prudential measures that encourage
banks to develop more resilient capital and
liquidity positions will help mitigate the adverse
impact.
In view of the widened interest rate differential
between Hong Kong and the US, banks should
stay vigilant against the risks of significant
capital outflows and their impact on local
interest rates amid the Fed’s ongoing rate hikes
and the forthcoming balance sheet
normalisation. Banks should also maintain
prudent credit risk management as sharp rises in
interest rates could put banks’ asset quality under
the test, given the rising levels of corporate
leverage and increasing household debt-servicing
burdens.
The Half-yearly Report on Monetary and Financial
Stability is prepared by the staff of the Research
Department of the Hong Kong Monetary
Authority.
Page 9

2. Global setting and outlook
Global economic conditions improved with a synchronous cyclical rebound in real activities,
diminished political and policy uncertainties in major advanced economies, and a more
favourable macroeconomic backdrop for emerging market economies (EMEs). The improved
prospects, in turn, drove up asset market valuations. Nonetheless, the global economy is still
subject to numerous uncertainties, including the sustainability of global growth momentum,
the impact of monetary policy normalisation by the US Federal Reserve and possibly other
major central banks, as well as heightened geopolitical tensions.
Benefiting from stronger external demand, growth momentum in East Asia remained stable
in the first half of 2017. However, the region faces multiple headwinds. While
weaker-than-expected growth in the US could disrupt East Asia’s export recovery, the recent
pick up in credit growth and the increasingly stretched financial asset valuation amid
resumed portfolio inflows are amplifying the region’s vulnerability to shocks, particularly
given the rise in Sino-US trade tensions amid protectionist sentiment and the ongoing
situation on the Korean Peninsula.
In Mainland China, growth momentum improved further in the first half of 2017. While
the near-term growth outlook remains positive, it also hinges on how the authorities strike a
balance between supporting the economy and preventing systemic risks. During the review
period, Mainland authorities stepped up measures to curb speculative activities in the
property market and pushed ahead with financial and corporate deleveraging. Externally,
capital outflow pressures continued to ease in tandem with improved economic conditions,
but the uncertainties in global monetary conditions and market sentiment would still play an
important role in shaping the near-term outlook of cross-border fund flows.
2.1 External environment
Global growth experienced a cyclical rebound
from the latter part of 2016 along with a pickup
in world trade and industrial production
(Chart 2.1). The previously uneven pace of
global recovery, characterised by the
outperformance of US growth vis-à-vis other
advanced economies, has also converged amid
stronger performance in Japan and the euro area.
The diminishing political and policy
uncertainties in the US and Europe since early
2017 were also conducive to the improvement,
partly reflecting easing concerns over the rise of
populist and anti-establishment sentiments in
the run-up to elections in Europe (Chart 2.2).
Outside the major advanced economies, EMEs
enjoyed a more favourable macro-economic
backdrop, benefiting from stronger global trade
flows and a softening of the US dollar. The softer
US dollar, in turn, was fostered by reduced
market expectations of a near-term US fiscal
Page 10

stimulus that led to a retreat in US inflation
expectations and weighed on the prospects of
interest rate hikes (Chart 2.3), as well as market
expectations of a tapering in asset purchases by
the European Central Bank (ECB) that lent
support to the euro exchange rate at the expense
of the US dollar. These developments helped
insulate EMEs from capital outflow pressures,
notwithstanding two additional Fed rate hikes in
the first half of 2017. In July, the International
Monetary Fund (IMF) projected global output
growth to accelerate from an estimated 3.2% in
2016 to 3.5% in 2017.
Chart 2.1
World trade and industrial production in
volume terms
Note: Figures shown are 3-month moving averages.
Source: CPB Netherlands Bureau for Economic Policy Analysis.
Chart 2.2
Policy uncertainty index in the US and Europe
Source: Economic Policy Uncertainty.
Chart 2.3
US dollar index and market-based US inflation
expectations
Sources: Bloomberg and St. Louis Fed.
Supported by the recent improvements in global
economic conditions and a more dovish US
interest rate expectation, global equity markets
sustained their post US election rallies, with the
S&P 500 index hitting an all-time high in August
2017. Accordingly, despite the recent corrections
amid escalating geopolitical tensions between the
US and North Korea, equity market valuations
rose to elevated levels. Indeed, the latest
cyclically adjusted price earnings (PE) ratio of the
S&P 500 index surpassed its peak reached just
prior to the global financial crisis (GFC) and was
not far from the level seen in the run-up to the
1929 stock market crash (Chart 2.4).
Chart 2.4
Cyclically adjusted PE ratio of the S&P 500
Note: The cyclically adjusted PE ratio is calculated by dividing the price of the S&P 500 by the average inflation-adjusted earnings from the previous 10 years.
Source: Multpl.com.
Page 11

Notwithstanding the current benign global
macroeconomic and financial market
environment, two major developments in the
US – emergent signs of a maturing economic
expansion and the Fed’s impending balance sheet
normalisation, could pose downside risks to the
global economic outlook and financial market
stability. In the US, core consumer price index
(CPI) inflation decelerated from 2.2%
year-on-year (yoy) in the first quarter to 1.8% yoy
in the second quarter, partly attributable to
one-off factors such as a sharp fall in the prices of
wireless telephone services and used vehicles.
Meanwhile, real Gross Domestic Product (GDP)
growth accelerated from 1.2% to 3.0% on a
quarter-on-quarter annualised (qoqa) comparison
over the same period, supported by a rebound in
consumer spending and a reduced drag from
inventory destocking. While the combination of
modest inflation and firming growth is generally
observed during an early-to-intermediate stage of
recovery, developments in several other segments
of the economy nonetheless are suggestive of a
more advanced stage of expansion. For example,
the recent flattening in the US Treasury yield
curve and compressed corporate bond spreads
resembled financial conditions usually observed
during the late-cycle stage of economic
expansion, while the increasingly tight labour
market conditions (with the unemployment rate
falling to 4.4% in August, below the Fed’s
estimated natural rate of 4.6%) also point to a
maturing economic expansion. Box 1 assesses
the latest stage in the US economy’s business
cycle, by examining how various economic
indicators behaved during different stages of
business cycles using a statistical classification
technique known as cluster analysis.
Another development of significance is the Fed’s
intention to implement balance sheet
normalisation in the near term. Following the
June Federal Open Market Committee (FOMC)
meeting, the Fed described in detail the strategy
for reducing the size of its balance sheet by
gradually raising the limits beyond which
principal payments from its securities holdings
would be reinvested going forward. More
specifically, the Fed expects that eventually only
payments of principal in excess of US$30 billion
(for Treasury securities) and US$20 billion (for
agency debt and mortgage-backed securities) will
be reinvested every month. As noted by Fed
Chair Yellen’s remarks in the July semi-annual
Monetary Policy Report to the Congress, the
FOMC expected the long-run level of the reserve
balance to be “appreciably below recent levels
but larger than before the financial crisis”
(Chart 2.5). Given the measured pace of balance
sheet reduction, it is likely that the resulting rise
in longer-term yields would be gradual. Yet, it
remains to be seen how it would affect the US
Treasury market and its spillover effects on
domestic and international financial conditions.
Chart 2.5
Size of Fed’s balance sheet
Source: CEIC.
Outside the US, the monetary policy outlook in
other major advanced economies also remains
uncertain. In the euro area, the economy
enjoyed a broad-based recovery underpinned by
both domestic demand and exports, with real
GDP expanding by 0.6% on a quarter-on-quarter
Page 12

(qoq) comparison in the second quarter of 2017,
up from 0.5% in the preceding quarter. Labour
market slack continued to diminish, with the
unemployment rate edging down to 9.1% in July,
the lowest since February 2009. At the same
time, the political situation stabilised following
the victory of Emmanuel Macron, a pro-Europe
candidate, in France’s presidential election in
May, mitigating concerns about the rise in
Eurosceptic sentiment that prevailed in the
run-up to the election. In spite of the stronger
growth momentum, however, inflation remained
subdued across member countries and stayed
well below the ECB’s 2% target (Chart 2.6), partly
constrained by weak wage growth amid the
still-substantial labour market slack. Against this
background, the ECB is likely to face a delicate
balancing act in its future monetary
policymaking, in the midst of a strengthening
growth momentum on one hand but below-
target inflation on the other.
Chart 2.6
Core CPI inflation in selected member countries
of the euro area
Source: Datastream.
In Japan, the economic outlook also improved,
with real GDP expanding for the sixth straight
quarter by a solid 0.6% qoq in the second quarter
of 2017, supported by growth in private
consumption and public spending. The
economic and labour market slack has also been
dwindling, with the closing of the output gap
according to estimates by the Bank of Japan (BoJ)
and the unemployment rate falling to a 23-year
low of 2.8% in July. Nonetheless, the problem of
dual labour market, characterised by an
increasing share of part-time workers, is likely to
continue to constrain wage growth and
complicate the BoJ’s effort in achieving its 2%
inflation target.
For the rest of the world, especially EMEs, the
synchronous improvement in global activities
and the recent unwinding of the post US election
strength of the US dollar is likely to continue to
provide a favourable macro-economic backdrop
in the near term. Indeed, in spite of two
additional Fed rate hikes in the first half of 2017,
EMEs continued to enjoy portfolio capital
inflows (Chart 2.7), partly reflecting investor
optimism over their economic prospects. That
said, as discussed before, the risks of tighter
global financial conditions stemming from the
Fed’s balance sheet normalisation plan could
heighten the risks of capital flow reversals in
EMEs in the period ahead.
Chart 2.7
Portfolio capital flows into EMEs
Source: EPFR.
In addition, despite the diminished economic
policy and political risks in advanced economies,
there has been a recent escalation in geopolitical
tensions. In particular, elevated tensions
between North Korea and the US could cloud the
Asian and global economic outlook, and the risks
Page 13

of military conflicts, while still deemed low at
present, cannot be ruled out. At the same time,
there is a risk that the rise in Sino-US trade
tensions amid US investigations into Mainland’s
trade practices could fuel protectionist sentiment
and pose downside risks to the nascent recovery
in global trade flows. In the presence of rising
geopolitical tensions, market perceptions of tail
risks have recently risen sharply above the
long-run average (Chart 2.8).
Chart 2.8
SKEW index by the Chicago Board Option
Exchange (CBOE)
Note: The SKEW index, derived from prices of the S&P 500 out-of-money options, is a measure of market perceptions of tail risks, with a higher value indicating a greater perceived probability of tail events.
Source: Bloomberg.
Page 14

Box 1Identifying the latest stage of the US business cycle with
cluster analysis
Introduction
According to the National Bureau of Economic
Research (NBER), the US economy has remained
in expansion since June 2009, making it the
third longest recovery episode in post-World War
II history (Chart B1.1), although it is also much
shallower than past recoveries (Chart B1.2).
While a prolonged expansion does not
necessarily imply imminent risks of recession, it
nonetheless raises concerns that the US
expansion may have already entered the late-
cycle stage.
Chart B1.1
Length of post-World War II recovery episodes
in the US
Source: NBER.
Chart B1.2
Changes in real GDP from end of recessions
Note: (*) Excluding the 1970, 1974 and 1980 double-dip recessions.
Sources: US Bureau of Economic Analysis and HKMA staff calculations.
Determining whether the US economy is in the
late-cycle stage of expansion is important. If this
were indeed the case, the optimistic earnings
prospects on which the presently rich US equity
market valuation is predicated would likely be
called into question. A maturing expansion
could also have profound implications for the
future pace of US monetary policy normalisation.
To identify the latest stage of the US business
cycle, this analysis applies a statistical
classification technique known as k-medians
clustering to partition the post-1960 period into
four distinct classes that correspond to four
different stages of a business cycle: (1) early
expansion, (2) mid-cycle expansion, (3) late-cycle
expansion and (4) recession. Based on the
classification results, we then calculate the
average duration of each of these four stages to
gain an idea of how long the US economy can be
expected to stay in the current stage before
progressing to the next one.
Page 15

Dating of US business cycle stages using
k-medians clustering
Conceptually, k-medians clustering is a statistical
classification technique that divides a set of
uncategorised data into a predetermined number
of groups or clusters (k), in such a way that
observations in the same cluster are more
“similar” (in terms of a given metric, usually
Euclidean distance) to each other than to those
in other clusters.
Adopting the ideas from Theis and Weihs (2000)
and Dawsey (2014), we apply k-medians
clustering to a set of 20 US economic indicators
between January 1960 and March 2017, with the
aim of partitioning this time interval into four
clusters that can be associated with the four
stages of a business cycle. These 20 indicators,
listed in Table B1.A, relate to five key aspects of
the US economy and are assumed to jointly
determine the stage of the US business cycle.
By themselves, the four clusters obtained from
k-medians clustering do not carry any economic
meaning. Nonetheless, they can be associated
with the notions of early expansion, mid-cycle
expansion, late-cycle expansion and recession,
based on their temporal proximity to NBER
recessions. More specifically, clusters that
include observations immediately before, during
and after NBER recessions can be taken to
represent late-cycle expansions, recessions and
early expansions respectively, while the
remaining cluster, which happens to straddle
early and late-cycle expansions, is taken to
represent mid-cycle expansions.
Table B1.A
Economic indicators used in cluster analysis
Aspects of the
US economy Economic indicators
• Treasury yield curve slope (difference between 10-year and 3-month Treasury yields)
• 12-month change in real Fed funds rate
Financialconditions
• Realised monthly volatility of S&P 500 index
• Yield spread between Baa-rated and Aaa-rated US corporate bonds
• 12-month change in real commercial and industrial loans
• Employment gap (as defined in Erceg and Levin (2013))
Labour market • Unemployment rateconditions • Average weekly hours worked in manufacturing sector
• Real average hourly earnings*
• 12-month change in real GDP
Growth• Difference between actual and potential real GDP growth
• ISM manufacturing PMI
• 12-month change in industrial production
• Core CPI inflation index*
• Unit labour cost index*Inflation • 12-month change in GDP deflator
• 12-month change in import prices of goods and services
Businessconditions
• Industrial utilisation rate
• Manufacturing inventory-to-shipping ratio*
• Corporate profits
Note: All data series are standardised to have zero mean and one standard deviation. Quarterly data are converted into monthly data by interpolation. Indicators marked with (*) are detrended using Hodrick-Prescott filter prior to standardisation.
Results and discussions
The classification results from k-medians
clustering are illustrated in Chart B1.3, which
shows the model-based chronology of the US
business cycles between January 1960 and March
2017. Our results appear to be reasonable, being
able to capture all but one of the NBER recessions
since 1960 and showing generally smooth
transitions of the US economy from recession to
early, mid and late stages of expansion over time
(except the mid-1980s with relatively erratic
results). Of particular interest is that, based on
the model results, the US economy could still be
classified as in the mid-cycle stage of expansion
at the end of the sample period (i.e. March 2017).
Page 16

Chart B1.3
Chronology of US business cycles based on
k-medians clustering
Note: Periods shaded in grey are recessions as defined by NBER.
Sources: NBER and HKMA staff calculations.
Next, we perform out-of-sample classification of
the latest US economic situation using partially
available data for the second quarter of 20171. To
do so, we compute the centroids of the four
clusters, followed by a comparison of the
Euclidean distances between the latest data
vector and the four centroids, with a shorter
distance implying a closer match2. The results
(Table B1.B) show that the US economy has since
transitioned to the late-cycle stage of expansion,
based on partially available data for the second
quarter.
Table B1.B
Distances between the vector of latest
observations and the four cluster centroids
Recession Early Mid Late
Financial conditions 2.3 3.8 1.6 1.3Labour market 2.4 4.1 2.3 1.0Growth 1.8 3.6 0.4 0.9Inflation 3.5 3.4 0.7 0.8Business conditions 1.3 3.1 0.7 1.5
Overall 5.3 8.1 3.0 2.6
Note: Cells highlighted in green refer to the closest match to the latest observations.
Source: HKMA staff calculations.
The classification results are broadly in line with
intuition. In terms of financial conditions, the
recent flattening of the Treasury yield curve,
subdued equity market volatility and compressed
corporate bond spreads are common indicators
of a late-stage expansion. Meanwhile, the
progressive tightening of labour market
conditions (with the unemployment rate falling
to 4.4% in August, below the Fed’s estimated
natural rate of 4.6%) and above-average real wage
growth are also suggestive of a late-stage
expansion of the employment cycle. On the
other hand, the unusually weak pickup in GDP
growth compared with previous recoveries, the
recent softening of inflation and the
still-below-average industrial utilisation rate have
led the model to classify the latest growth,
inflation and business conditions sub-cycles as in
the mid-stage expansion. Taking the 20
economic indicators together, their latest values
are closest in distance to the cluster representing
the late-cycle stage of expansion.
Next, we calculate the historical average length
of each of the four stages of the business cycle,
based on results from the classification exercise
(Table B1.C). Of particular interest is that the
late-cycle expansion stage in the US typically
lasted for four years on average, with a range
between two and eight years. These results
suggest that the current US economic expansion,
while likely just having entered the late-cycle
stage, could still last for some time before
transitioning to a recession.
Table B1.C
Summary statistics on the past length of the four
business cycle stages (in years)
Recession Early Mid Late
Average length 0.9 0.8 3.0 4.2Range 0.3 – 2.3 0.2 – 1.8 0.6 – 7.6 1.8 – 8.3
Source: HKMA staff calculations.
1 Missing values are not allowed in cluster analysis algorithms.
2 In our case, a centroid is a 20-dimensional vector of the individual means of the 20 economic data series within a cluster. The Euclidean distance between the centroid of a cluster (x) and the data vector (y) is given by
The distances between the centroids and the vector of latest data for each of the five sub-sets are calculated analogously.
Page 17

Limitations of methodology
As a statistical technique, clustering algorithms
solely rely on patterns of historical data to
classify current observations. Nonetheless, due
to structural changes in the US economy since
the GFC, economic indicators may behave
differently from the past, thereby introducing
the risk of misclassification. In particular, the
latest signal of a late financial cycle from the
flattening of the yield curve could simply be the
result of distortions by the Fed’s quantitative
easing, which could potentially be reversed when
the Fed implements balance sheet normalisation.
Moreover, the notable post-GFC decline in the
labour force participation rate, if turned out to be
temporary, could imply a larger-than-expected
degree of labour market slack and hence a
lower-than-envisaged natural rate of
unemployment. These possibilities could help
prolong the current expansion relative to
historical norms, and suggest that it should be
classified as in the mid-cycle, rather than late-
cycle, stage.
Conclusion
In summary, our empirical results suggest that
the US economy has just transitioned to the
late-cycle stage of expansion, although it could
be expected to last for a certain period based on
past experience. Yet, structural changes in the
US economy since the GFC may prolong the
current expansion relative to historical norms
and introduce risks of misclassification due to
the backward-looking nature of clustering
analysis.
References
Dawsey, K. (2014), “Don’t call the expansion
old”, Goldman Sachs client note.
Erceg, C. J., & Levin, A. T. (2013), “Labor force
participation and monetary policy in the wake of
the great recession”, IMF Working Paper 13/245.
Theis, W. & Weihs, C. (2000), “Clustering
techniques for the detection of business cycles”,
In Classification and Information Processing at the
Turn of the Millennium (pp. 127 – 134). Springer,
Berlin, Heidelberg.
Page 18
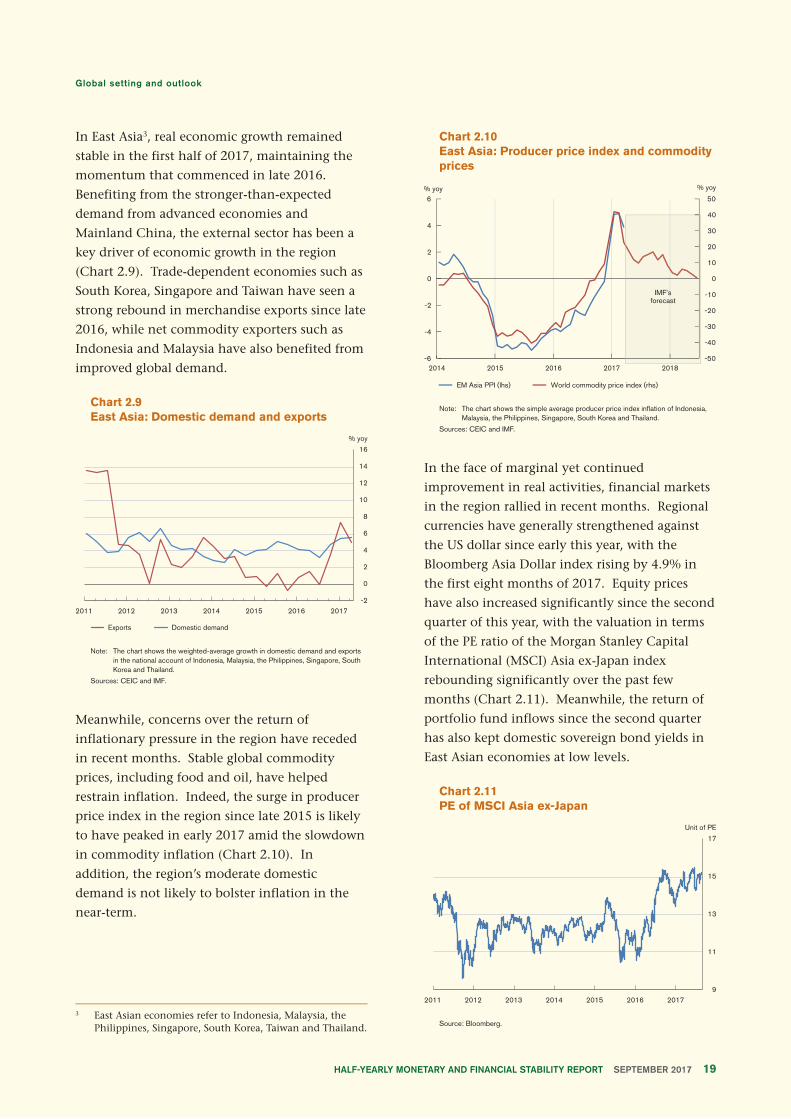
In East Asia3, real economic growth remained
stable in the first half of 2017, maintaining the
momentum that commenced in late 2016.
Benefiting from the stronger-than-expected
demand from advanced economies and
Mainland China, the external sector has been a
key driver of economic growth in the region
(Chart 2.9). Trade-dependent economies such as
South Korea, Singapore and Taiwan have seen a
strong rebound in merchandise exports since late
2016, while net commodity exporters such as
Indonesia and Malaysia have also benefited from
improved global demand.
Chart 2.9
East Asia: Domestic demand and exports
Note: The chart shows the weighted-average growth in domestic demand and exports in the national account of Indonesia, Malaysia, the Philippines, Singapore, South Korea and Thailand.
Sources: CEIC and IMF.
Meanwhile, concerns over the return of
inflationary pressure in the region have receded
in recent months. Stable global commodity
prices, including food and oil, have helped
restrain inflation. Indeed, the surge in producer
price index in the region since late 2015 is likely
to have peaked in early 2017 amid the slowdown
in commodity inflation (Chart 2.10). In
addition, the region’s moderate domestic
demand is not likely to bolster inflation in the
near-term.
Chart 2.10
East Asia: Producer price index and commodity
prices
Note: The chart shows the simple average producer price index inflation of Indonesia, Malaysia, the Philippines, Singapore, South Korea and Thailand.
Sources: CEIC and IMF.
In the face of marginal yet continued
improvement in real activities, financial markets
in the region rallied in recent months. Regional
currencies have generally strengthened against
the US dollar since early this year, with the
Bloomberg Asia Dollar index rising by 4.9% in
the first eight months of 2017. Equity prices
have also increased significantly since the second
quarter of this year, with the valuation in terms
of the PE ratio of the Morgan Stanley Capital
International (MSCI) Asia ex-Japan index
rebounding significantly over the past few
months (Chart 2.11). Meanwhile, the return of
portfolio fund inflows since the second quarter
has also kept domestic sovereign bond yields in
East Asian economies at low levels.
Chart 2.11
PE of MSCI Asia ex-Japan
Source: Bloomberg.3 East Asian economies refer to Indonesia, Malaysia, the
Philippines, Singapore, South Korea, Taiwan and Thailand.
Page 19

Although the real sectors and financial markets
have stayed on a positive note recently, East
Asian economies still face multiple headwinds:
– Firstly, on the trade front, concerns over a
trade war between the US and Mainland
China have been intensifying as the US
government is planning to impose stronger
trade restrictions on Mainland China. A
deteriorating Sino-US trade relationship
might have a large negative spill over effect
on other East Asian economies amid the high
degree of regional trade integration. The
weaker-than-expected economic performance
in the US in recent months could also put a
brake on the region’s export recovery.
– Secondly, on the domestic front, the pace of
private sector credit growth in many regional
economies has picked up recently after a brief
period of deleveraging in 2015-2016, with the
total outstanding private credit rebounding to
a relatively high level (Chart 2.12). Against
this background, any tightening in financial
conditions could put pressure on the debt
repayment capability of those heavily
indebted companies and households. In that
case, as credit growth has been providing
significant support to the region’s domestic
demand over the past few years, any
deleveraging triggered by financial tightening
could weigh on Asian economic growth.
Chart 2.12
East Asia: Credit to private sector
Sources: CEIC and HKMA staff calculations.
– Thirdly, on the financial market front, while
the valuation of the region’s financial assets
is still relatively attractive and continues to
induce more portfolio inflows, a further
stretch in valuation would narrow the gap
with advanced economies and thus increase
the risk of fund flow reversals and price
corrections.
In addition to these challenges, the recent
intensifying geopolitical tensions on the Korean
Peninsula have cast a great shadow over the
stability of the region. Should any tail-risk
events materialise, including military conflicts,
the corresponding shock could abruptly
destabilise the region’s economy and financial
markets.
Given the challenges ahead and the still subdued
inflationary pressure, most regional central banks
are likely to keep their policy interest rates
unchanged in the near-term, maintaining an
accommodative monetary policy stance to
support growth.
Page 20
2.2 Mainland China
Real sector
Growth momentum in Mainland China
improved further in the first half of 2017
underpinned by solid consumption, a rebound in
investment growth and better export
performance. In particular, real GDP expanded
by 6.9% year on year in the first and second
quarters from 6.8% in the fourth quarter of 2016
(Chart 2.13).
Chart 2.13
Mainland China: contribution to GDP growth by
demand component
Sources: CEIC, NBS and HKMA staff estimates.
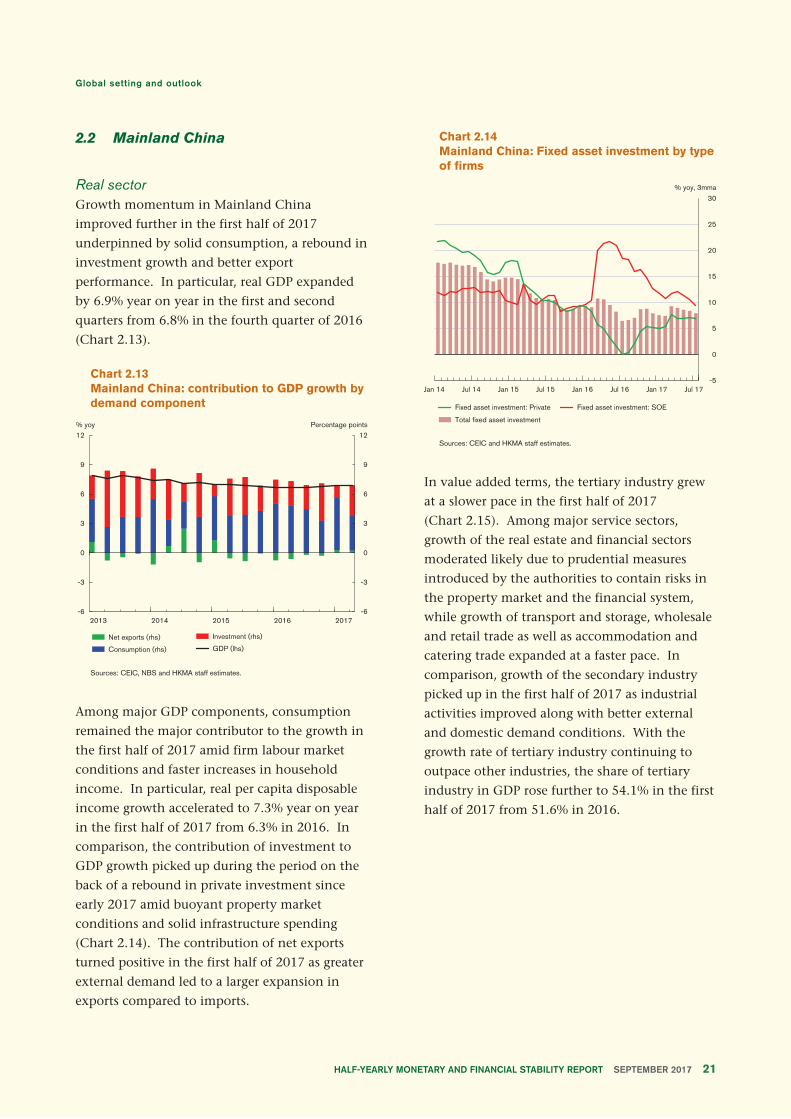
Among major GDP components, consumption
remained the major contributor to the growth in
the first half of 2017 amid firm labour market
conditions and faster increases in household
income. In particular, real per capita disposable
income growth accelerated to 7.3% year on year
in the first half of 2017 from 6.3% in 2016. In
comparison, the contribution of investment to
GDP growth picked up during the period on the
back of a rebound in private investment since
early 2017 amid buoyant property market
conditions and solid infrastructure spending
(Chart 2.14). The contribution of net exports
turned positive in the first half of 2017 as greater
external demand led to a larger expansion in
exports compared to imports.
Chart 2.14
Mainland China: Fixed asset investment by type
of firms
Sources: CEIC and HKMA staff estimates.
In value added terms, the tertiary industry grew
at a slower pace in the first half of 2017
(Chart 2.15). Among major service sectors,
growth of the real estate and financial sectors
moderated likely due to prudential measures
introduced by the authorities to contain risks in
the property market and the financial system,
while growth of transport and storage, wholesale
and retail trade as well as accommodation and
catering trade expanded at a faster pace. In
comparison, growth of the secondary industry
picked up in the first half of 2017 as industrial
activities improved along with better external
and domestic demand conditions. With the
growth rate of tertiary industry continuing to
outpace other industries, the share of tertiary
industry in GDP rose further to 54.1% in the first
half of 2017 from 51.6% in 2016.
Page 21

Chart 2.15
Mainland China: GDP growth by industry
Sources: CEIC, NBS and HKMA staff estimates.
The near-term growth outlook for the Mainland
economy remains positive. On the external
front, further improvement in the advanced
economies may continue to underpin export
performance. On the domestic front, stabilised
economic environment and recovery in business
confidence should render support to private
investment. Meanwhile, tight labour market
conditions and solid household income growth
should also bode well for private consumption.
Nonetheless, the future outlook also hinges on
how the authorities strike a balance between
supporting the economy and preventing the
build-up of financial risks. During the review
period, the authorities further introduced
tightening measures amid the house price rally
and pushed ahead with financial deleveraging in
view of increased bank exposure to off-balance
sheet activities, while having lowered the growth
target for 2017 to the level around 6.5% from
6.5%–7% for 2016. The better-than-expected
economic performance in recent quarters may
give more room for the authorities to bring
forward the tightening measures on the property
market as well as financial deleveraging, which
would in turn weigh on growth especially
through the investment channel. Latest
consensus forecasts by market analysts expected
that real GDP would grow by 6.7% for 2017,
slightly higher than the government target of
around 6.5%.
While overall economic conditions continued to
improve, consumer price inflation remained
benign during the review period. Headline
consumer price inflation eased from 2.2% year
on year in the last quarter of 2016 to an average
of 1.4% in the first half of 2017 (Chart 2.16), as
food prices declined during the period. However,
core inflation, after excluding food and energy
prices, inched up from 1.9% year on year to 2.1%
during the same period on the back of faster
increases in service prices. At the wholesale level,
producer price inflation tapered from the recent
peak of 7.8% year on year in February to 5.5% in
June, as upstream prices such as raw material
costs came down somewhat in the second
quarter.
Going forward, upside risks to inflation may
remain in the near term should growth
momentum show further improvement.
However, the tightening policies in place aimed
at containing systemic risks may, to some extent,
provide an offset. In addition, the renminbi
exchange rate may also affect import prices and
thus the near-term inflation outlook.
Chart 2.16
Mainland China: Consumer price and producer
price inflation
Sources: NBS and HKMA staff estimates.
Page 22

Asset Markets
During the review period, the tightening
measures introduced by the authorities to
contain systemic risks continued to affect the
asset market performance in Mainland China.
For instance, Mainland commodity prices came
down early this year amid tightening liquidity
conditions associated with financial deleveraging
but rebounded afterwards, likely due to improved
market sentiment amid better-than-expected
economic conditions in recent periods.
In the equity market, investors’ sentiment
remained benign, with leveraged trading having
subsided. Tightened liquidity conditions
appeared to have suppressed market risk appetite,
increasingly shifting the preference of investors
from growth to value during the review period.
As a result, the prices of large-cap stocks inched
up on the Shanghai Stock Exchange, while the
small-cap stocks with rich valuation continued to
report losses on the Shenzhen Stock Exchange,
especially on the start-ups board (ChiNext)
(Chart 2.17). In fact, the ChiNext index in the
Shenzhen Stock Exchange fell by around 5.1%
on 17 July right after the announcement by
policy makers to further contain financial risks
by establishing the Financial Stability and
Development Committee.
Chart 2.17
Mainland China: Major stock market indices
Sources: CEIC and HKMA staff estimates.
Tightened interbank liquidity conditions also
drove up the issuance costs in the bond market,
with both government and enterprise bond
yields picking up during the review period
(Chart 2.18). The yield spread between corporate
bonds and government bonds also increased,
despite improved corporate financial positions
amid better-than-expected economic
performance. Increased corporate bond yield
spread might have in part reflected stronger
financing needs of Mainland firms during this
round of tightening in bank lending as well as
suppressed risk appetite of investors.
Chart 2.18
Mainland China: 10-year enterprise and
government bond yields
Sources: WIND and HKMA staff estimates.
Mainland property markets remained buoyant,
with both house prices and transactions
continuing to pick up in the first half of 2017.
While buoyant property market conditions
provided some support to the economy, a
prolonged period of exuberance would likely sow
the seeds for future instability in the financial
system. In view of this, the authorities further
stepped up tightening measures including
tightened down-payment requirements and
linking land supply to housing inventory in
different cities.
Page 23

As a result, property market performance
exhibited signs of divergence in different tiers of
cities in recent periods, after house price growth
accelerated somewhat in the first quarter of 2017
(Chart 2.19). In tandem with declined
transactions, house price growth moderated on a
sequential basis recently in higher-tier cities
where the property market was overheating. In
first-tier cities, house prices even fell on a
sequential basis for a second consecutive month
in July. In comparison, both house price growth
and transactions, during the same period, inched
up in lower-tier cities where house stock
overhang issues prevailed. That said, more time
is needed to discern whether such trend may
sustain.
Chart 2.19
Mainland China: Residential prices by tier of
cities and floor space sold
Sources: CEIC and HKMA staff estimates.
Bank lending and asset quality
Amid improved economic activities, corporate
loan demand improved during the review period.
According to a quarterly survey by the People’s
Bank of China (PBoC), for instance, loan demand
from both the manufacturing and
non-manufacturing sectors rebounded notably in
the first half of 2017 (Chart 2.20).
Chart 2.20
Mainland China: Loan demand index by industry
Sources: PBoC and HKMA staff estimates.
Despite improved loan demand, growth in
renminbi bank loans remained largely stable
during the review period amid the tightening
measures aimed at corporate deleveraging. In
particular, banks continued to tighten their loan
underwriting standards to vulnerable borrowers,
such as inefficient state-owned enterprises (SOEs)
and firms in overcapacity sectors. As a result, the
leverage of firms in the overcapacity sectors
further declined in the first half of 2017, while
that of SOEs rose slightly (Chart 2.21).
Chart 2.21
Mainland China: Corporate leverage: SOEs and
overcapacity sectors
Sources: Bloomberg and HKMA staff estimates.
Page 24

In view of the potential risks associated with the
exuberance in the property market, Mainland
banks also tightened their loan underwriting
standards to property developers. As a result, the
growth of developer loans stayed subdued albeit
picking up slightly to 9.8% year on year at the
end of June 2017 from 8.4% at the end of 2016
(Chart 2.22).
Chart 2.22
Mainland China: Loan growth for property
development and housing mortgage
Sources: PBoC and HKMA staff estimates.
In comparison, after having accelerated for more
than one year, mortgage loan growth started to
moderate in the first half of 2017 amid the
tightening measures on the property market. For
now, the risk associated with the fast growth in
mortgage loans should be manageable. In
particular, the leverage of Mainland households
remained relatively low, as the outstanding size
of mortgage loans was only equivalent to about
35% of household deposits in June, thanks to
macro-prudential measures in place, such as the
tightened down-payment requirements.
While the direct exposure of banks to the
property market should be manageable, bank
exposure to the property market through the
collateral channel should not be ignored, given
the key role played by the property market in the
collateral-based lending system in Mainland
China. Box 2 discusses the risk associated with
banks’ exposure to the property market by
examining the effect of property prices on
corporate borrowing through the collateral
channel. Our analysis shows that property price
changes have a positive effect on firms’ debt
growth, especially for financially constrained
firms such as smaller and non-state-owned
companies. Our findings therefore suggest that
while collateral-based lending may help alleviate
the financing difficulties facing smaller or private
Mainland firms, banks’ heavy reliance on
properties and land as collateral may also lead to
a pro-cyclical swing in the indebtedness of these
firms.
As tightened bank lending may not be able to
fulfil the increased financing needs of Mainland
corporates, signs of resurgence in shadow
banking activities emerged in recent quarters. In
particular, trust loan growth increased from
15.8% year on year at the end of 2016 to 33.5%
in July 2017, notably outpacing the growth in
bank lending (Chart 2.23). Despite the fast
increase in trust loan growth, the outstanding
size of trust loans has so far remained relatively
small. By July 2017, the outstanding size of trust
loans stood at RMB7.7 trillion, equivalent to
6.6% of total bank loans.
Chart 2.23
Mainland China: Bank loans and trust loans
growth
Sources: CEIC and HKMA staff estimates.
Page 25

Although there is little information about which
sectors have received loans from trust companies,
breakdown by trust funds allocation suggests that
in total about 25% of trust funds had been
invested in vulnerable sectors such as real estate
and basic industries as of June 2017 (Chart 2.24).
That said, given the complex and opaque nature
of shadow banking products, the overall
exposure of trust companies to these vulnerable
sectors could be larger through the holdings of
financial instruments such as equities, bonds and
investment funds.
Chart 2.24
Mainland China: Trust funds by sector at the
end of June 2017
Sources: CEIC and HKMA staff estimates.
In view of the risk associated with expanding
shadow banking activities, the China Banking
Regulatory Commission (CBRC) has stepped up
supervision of banks’ lending to non-bank
financial institutions in the interbank market as
this was deemed to be an important funding
source for shadow banking activities. As a result,
the growth in banks’ claims on non-bank
financial institutions came down significantly in
the first half of 2017 (Chart 2.25). In addition,
the growth in the outstanding size of Wealth
Management Products (WMPs), another
important funding source of shadow banking
activities, also declined following the inclusion
of off-balance sheet WMPs into the Macro
Prudential Assessment (MPA) for Mainland banks
by the authorities which started from the first
quarter of 2017.
Chart 2.25
Mainland China: Banks’ claims on non-bank
financial institutions and outstanding wealth
management products
Sources: CEIC, WIND and HKMA staff estimates.
In addition to the tightening measures in place,
the policy makers also announced at the
Financial Work Conference in July to establish
the Financial Stability and Development
Committee. The set-up of the new committee
highlighted the ongoing drive by the authority
to deepen financial reform and formulate a
coordinated supervision framework to better
contain financial risks, especially those associated
with corporate leverage and local government
debt.
Thanks to the improved business and financial
conditions of Mainland corporates and the
stricter loan underwriting standards, the asset
quality of Mainland banks showed signs of
improvement during the review period. While
the non-performing loans (NPL) ratio remained
stable at a relatively low level of 1.74% in the
second quarter of 2017, the share of special
mention loans in total loans further declined to
around 3.6% from about 3.9% at the end of 2016
(Chart 2.26).
Page 26

Chart 2.26
Mainland China: NPL ratio and share of special
mention loans in total loans
Sources: CBRC and HKMA staff estimates.
Exchange rate and cross-border capital flows
Against the backdrop of improved economic
conditions and market sentiment, as well as the
weakening of the US dollar, the renminbi
exchange rate strengthened against the US dollar
recently. In particular, during the period March
to August 2017, the renminbi appreciated by
4.1% against the US dollar (Chart 2.27). In
comparison, the China Foreign Exchange Trade
System (CFETS) RMB index, a trade-weighted
index capturing the movement of the renminbi
against a basket of currencies, edged down
slightly by 0.1% during the review period.
Chart 2.27
Mainland China: The CFETS RMB index and the
renminbi exchange rate against the US dollar
* Index before December 2015 is estimated according to the weight of the CFETS RMB basket.
Sources: CEIC and HKMA staff estimates.
The recent stabilisation in the CFETS RMB index
was also due in part to the refinement of the
onshore renminbi (CNY) fixing formation
formula. According to the authorities, a counter-
cyclical factor was added into the CNY fixing
formation formula in May in order to help offset
the pro-cyclical movements in the CNY exchange
rate driven by market sentiment and herd
behaviour in the forex market, and therefore to
maintain the renminbi largely stable against the
currency basket.
Amid improved market sentiment, capital
outflow pressures continued to ease. The
declines in both the PBoC’s forex purchase
position and Mainland’s foreign reserves,
excluding valuation effects, have narrowed
notably since early 2017 (Chart 2.28). As a
result, foreign reserves in Mainland China had
been standing above US$3,000 billion for the
sixth consecutive month in July.
Chart 2.28
Mainland China: Changes in PBoC’s foreign
exchange purchase position and foreign
reserves
Sources: CEIC, SAFE and HKMA staff estimates.
Page 27
The latest statistics on the balance of payments
also pointed to reduced capital outflow pressures,
with cross-border capital flows turning to a net
inflow in the first quarter of 2017, the first time
since the first quarter of 2014. The turnaround
in net cross-border fund flows was mainly driven
by a reversal in capital outflows through other
investment in the first quarter of 2017
(Chart 2.29). In particular, trade credit saw a
seasonal net inflow in the first quarter due to
greater repayments of trade credit by non-
residents. Meanwhile, external borrowing by
Mainland banks and corporates also picked up
during the period amid tightened liquidity
conditions in the onshore credit market.
Chart 2.29
Mainland China: Net cross-border capital flows
by type of flows
Sources: CEIC, SAFE and HKMA staff estimates.
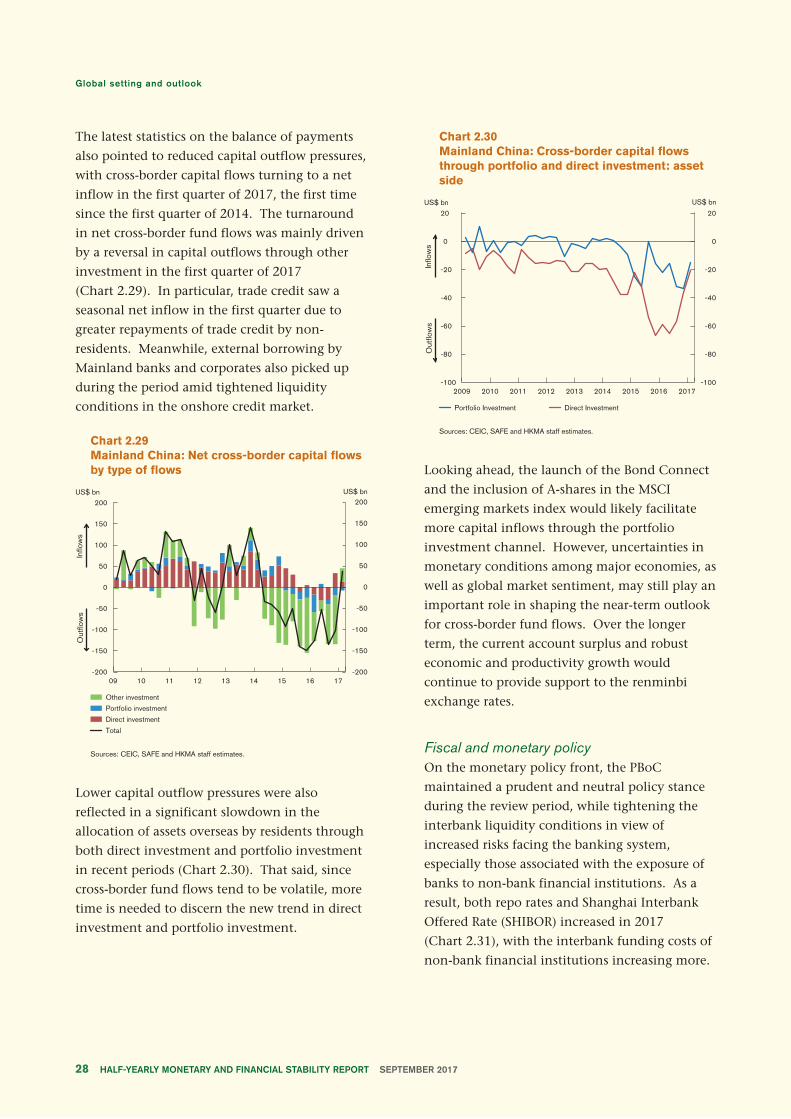
Lower capital outflow pressures were also
reflected in a significant slowdown in the
allocation of assets overseas by residents through
both direct investment and portfolio investment
in recent periods (Chart 2.30). That said, since
cross-border fund flows tend to be volatile, more
time is needed to discern the new trend in direct
investment and portfolio investment.
Chart 2.30
Mainland China: Cross-border capital flows
through portfolio and direct investment: asset
side
Sources: CEIC, SAFE and HKMA staff estimates.
Looking ahead, the launch of the Bond Connect
and the inclusion of A-shares in the MSCI
emerging markets index would likely facilitate
more capital inflows through the portfolio
investment channel. However, uncertainties in
monetary conditions among major economies, as
well as global market sentiment, may still play an
important role in shaping the near-term outlook
for cross-border fund flows. Over the longer
term, the current account surplus and robust
economic and productivity growth would
continue to provide support to the renminbi
exchange rates.
Fiscal and monetary policy
On the monetary policy front, the PBoC
maintained a prudent and neutral policy stance
during the review period, while tightening the
interbank liquidity conditions in view of
increased risks facing the banking system,
especially those associated with the exposure of
banks to non-bank financial institutions. As a
result, both repo rates and Shanghai Interbank
Offered Rate (SHIBOR) increased in 2017
(Chart 2.31), with the interbank funding costs of
non-bank financial institutions increasing more.
Page 28

Chart 2.31
Mainland China: 7-day repo rate and 3-month
SHIBOR
Sources: CEIC and HKMA staff estimates.
Higher interbank funding costs seemed to have
passed through to the end users, though the
PBoC utilized targeted measures such as the
Medium-term Lending Facility (MLF) to support
the funding needs of financial institutions and
kept the benchmark lending and deposit rates
unchanged. In particular, the weighted average
interest rate of loans offered to non-financial
enterprises and other sectors increased to around
5.7% in the second quarter of 2017 from about
5.3% in the last quarter of 2016. As a result, an
increasing number of banks reported to see a
tightening in monetary policy in the first and
second quarters of 2017, according to the
monetary policy sentiment index compiled by
the PBoC (Chart 2.32).
Chart 2.32
Mainland China: Banks’ monetary policy
sentiment index
Source: CEIC.
On the fiscal policy front, the authorities
continued to adopt a more proactive policy
stance. In particular, in order to facilitate private
spending, the government announced to further
cut taxes and fees for business owners by RMB
283 billion in June in addition to the measures
rolled out early this year which have already led
to a cut of RMB718 billion.
On the spending side, to facilitate infrastructure
investment at the local level, the authorities
encouraged the participation of private capital in
local infrastructure projects. For instance, the
scale of registered infrastructure projects under
the public-private partnership program increased
markedly by 54.3% year on year in the second
quarter of 2017 to RMB16.4 trillion. In
comparison, the size of projects at the
implementation phase also increased to RMB3.3
trillion from RMB1.1 trillion a year earlier.
Reflecting the proactive fiscal policy stance,
public expenditure of Mainland China continued
to expand at a faster pace than public revenue
during the first half of 2017. As a result, the gap
between public expenditure and revenue over
the past 12 months widened from 3.8% of GDP
at the end of 2016 to 4.3% in June 2017
(Chart 2.33).
Chart 2.33
Mainland China: Difference between public
spending and public revenue
Sources: WIND and HKMA staff estimates.
Page 29

The widened budget deficit might have led to a
further expansion in government debt, especially
at the local level. According to the latest report
by the National Audit Office issued in June 2017
covering 16 provinces, 16 cities and 14 counties,
government debt indeed expanded at a relatively
fast pace for some local governments. The report
also emphasised that the overall risk of local
government debt remained manageable.
To better contain the risks associated with local
government debt, the authorities strengthened
the management of local government debt
issuance. For instance, in June the authorities
introduced a pilot scheme of local land reserve
bond issuance, to lower the incentives of local
governments to borrow from unregulated
channels. In addition, the authorities
announced, at the Financial Work Conference, to
impose fiscal discipline for local governments
and curb ballooning debt by establishing a
lifetime responsibility mechanism for local
government officials.
Page 30

Box 2Real estate prices and corporate borrowing in Mainland China
Introduction
Property prices in Mainland China have picked
up notably since 2015. In first-tier cities
including Beijing, Shanghai, Guangzhou and
Shenzhen, property prices have, on average,
jumped by nearly 60% in the past two years
(Chart B2.1). Following the price rally in first-
tier cities, second-tier cities have also recorded
solid increases in property prices since 2016. The
soaring property prices have raised concerns,
given the strong link between real estate cycles
and financial stability.
Chart B2.1
Residential prices in Mainland China by tier of
cities
Sources: CEIC and HKMA staff estimates.
For now, the direct exposure of banks to the
property market should be manageable. First,
the size of the direct exposure of banks to the
property market is not very large. By June 2017,
only 6% of bank loans had been extended to
developers. The share of mortgages in total bank
loans was a little higher at around 18%. Second,
or more importantly, in view of the potential
risks associated with overheated property
markets, Mainland authorities had already rolled
out prudential measures. For instance, banks had
tightened their loan underwriting standards to
developers, especially the smaller and more
vulnerable ones. For mortgage borrowers, their
leverage level remained low thanks to macro-
prudential measures in place, such as the
tightened down-payment requirements. By June
2017, the outstanding size of mortgages was only
equivalent to around 35% of the total household
deposits.
While the direct exposure of banks to the
property market should be manageable, the bank
exposure to the property market through the
collateral channel should not be ignored, given
the key role played by the property market in the
collateral-based lending system in Mainland
China.
In particular, to access credit in financial markets,
most borrowers in Mainland China are required
to hold collateral4, the majority of which seemed
to be properties and land following the
development of the real estate markets.
According to the statistics compiled by the
Ministry of Land and Resources, the total area of
land being used as collateral in 84 major cities
increased notably by about 120% from 2009 to
2015 (Chart B2.2). The amount of loans backed
by land also rose from RMB2.6 trillion to
RMB11.3 trillion during the same period.
4 According to the latest World Bank Enterprise Survey, collateral was required for around 80% of corporate loans in Mainland China in 2012, and on average, the value of collateral was around 200% of the loan borrowed. In comparison, in some economies, such as the US and Italy where bank lending is risk-based, most borrowers can still access credit, even if they do not hold collateral (Kunieda and Shibata (2011) and Fabbri and Padula (2004)).
Page 31

Chart B2.2
Land area pledged as collateral in 84 major
cities and size of collateralised loans
Source: Ministry of Land and Resources.
The amount of bank loans secured by land and
properties together could be even larger, but
there is little publicly available information on
this. Some anecdotal evidence, for instance, a
report by the IMF issued in 2011, pointed out
that 30-45% of loans in the five biggest Mainland
banks were found to be backed by collateral, the
majority of which was real estate.
Given the key role played by the property market
in the collateral-based lending system in
Mainland China, it is not surprising that
property prices, or the value of collateral, will
affect firms’ borrowing behaviour and therefore
banks’ exposure to the property market as well as
loan quality. However, there have been few
studies on this issue, most likely due to data
limitation. To fill this gap and shed some light
on the risk associated with banks’ exposure to
the property market, this study looks at the effect
of property prices on corporate borrowing
through the collateral channel.
Empirical framework
To estimate how property prices, or the value of
collateral, could affect firms’ borrowing
behaviour, we employ the approach of Banerjee
and Blickle (2016), and Adelino et. al. (2015) to
explain the growth of corporate debt by a set of
variables as follows,
where is firms’ annual debt growth
proxied by annual changes in firms’ total
liabilities and is the change in
the average property prices in the province where
the head office of a firm is located.
Apart from the changes in property prices, firm
characteristics such as cash position, leverage,
profitability and total sales that can reflect a
firm’s financial positions or operating conditions
are also included in the specification, as these
factors are relevant to the firm’s demand for
funds as well as the availability of funds for the
firm.
To single out the collateral effect of property
prices on corporate borrowing, we also include
some controlling variables. For instance,
industrial sales growth is included to control for
the fact that firms borrow more not because of
increased collateral value, but because these firms
are in the property-related industries and
therefore borrow more to expand when the
property market booms. Provincial GDP growth
is also included as higher GDP growth may lead
to both higher property prices and faster loan
growth in a particular province. In addition,
time dummy is added to the specification to
control for other common factors such as
monetary conditions that may drive both overall
debt growth and property prices.
Page 32

Data and results
Using a firm-level panel dataset covering around
2,600 non-financial listed Mainland companies
from 2007 to 20155, matched with provincial
property price changes, our results suggest that
on average the debt growth of Mainland
corporates seemed to have increasingly reacted to
housing prices. Specifically, property prices
appeared to have little impact on corporate debt
growth in an earlier sample period from 2007 to
2010, as the coefficient is not significant
(Table B2.A). In more recent years, however,
Mainland corporate debt growth seemed to have
positively reacted to property prices. In
particular, our results show that for the sample
period 2011–2015, on average a one percentage
point increase in housing price growth would
lead to around a 0.9 percentage point increase in
corporate debt growth.
One interesting question is whether borrowings
by financially constrained firms in Mainland
China would have reacted differently to housing
prices compared with large or SOEs which
usually have better access to credit markets. By
financially constrained firms, we refer to either
firms with the smallest 30% of asset size in the
sample, or firms that are not SOEs. To answer
this question, we introduce the interaction term
between the dummy variable for financially
constrained firms and the changes in housing
prices into the specification6. If property prices
matter more for financially constrained firms, a
statistically significantly positive coefficient of
the interaction term should be detected.
Table B2.A
Estimated impact of property prices on corporate
borrowing
Benchmark Smaller firms Non-SOEs
as financially as financially
constrained constrained
firms firms
Full sample
ΔHouse price (t) 0.363 0.392 0.597*
ΔHouse price (t)*
dummy for financially -0.139 -0.422
constrained firms
Total effect of Δhouse price (t) 0.363 0.253 0.175
2007-2010
ΔHouse price (t) -0.021 -0.066 -0.331
ΔHouse price (t)*
dummy for financially 0.271 0.661*
constrained firms
Total effect of Δhouse price (t) -0.021 0.206 0.330
2011-2015
ΔHouse price (t) 0.927** 0.414 0.644
ΔHouse price (t)*
dummy for financially 1.970** 0.462
constrained firms
Total effect of Δhouse price (t) 0.927** 2.384*** 1.106 **
Note: ***, ** and * denote the estimated coefficient is statistically significant at 1%, 5% and
10% respectively. The significance of Total effect of Δhouse price reports the p-value of
the joint significance of the interaction term and Δhouse price. Independent variables
include liquidity, leverage, profitability and total sales of a firm, industry sales growth, and
provincial GDP growth. Time and firm dummies are also included in the panel model.
Our results indeed pointed to a positive and
statistically significant coefficient for the
interaction term between smaller firms and
housing price growth for the sample period
2011–2015 (Table B2.A), suggesting that house
prices were more relevant for smaller firms to get
access to credit markets in recent periods.
However, the coefficient of the interaction term
between non-SOEs and housing price growth is
found to be positive, but not statistically
significant for the sample period 2011–2015. In
comparison, the borrowing by larger firms or
SOEs in Mainland China is found, in general, to
be little affected by property price changes.
In a robustness check, we divide our sample by
smaller versus larger firms and non-SOEs versus
SOEs, and then re-estimate our model for each
sub-sample for the period of 2011–2015. The
results of the split sample analyses are reported
in Table B2.B. The coefficients of housing price
growth for the sub-samples of smaller firms and
non-SOEs are found to be statistically
significantly positive, while the coefficients of
housing price growth for larger firms and SOEs
5 To focus on the exposure of banks to property markets through the collateral channel, property developers are therefore excluded from our sample.
6 There is no need to include the dummy variable for financially constrained firms into the specification as firm-level dummies have already been included in the panel regression.
Page 33

are found to be statistically insignificant. This
suggests that the strong correlation between
housing price changes and corporate debt growth
for the full sample is likely driven by smaller or
private firms, which are deemed to have
difficulty in gaining access to financial markets.
Table B2.B
Estimated impact of property prices on corporate
borrowing during 2011–2015: split sample analyses
Smaller vs larger firms Non-SOEs vs SOEs
Smaller Larger Non-SOEs SOEs
ΔHouse price (t) 2.689*** 0.227 1.664*** 0.395
Note: ***, ** and * denote the estimated coefficient is statistically significant at 1%, 5% and
10% respectively. Independent variables include liquidity, leverage, profitability and total
sales of a firm, industry sales growth, and provincial GDP growth. Time and firm
dummies are also included in the panel model.
These findings actually help alleviate the concern
that our results are driven by reverse causality,
that is, firms borrow to invest in property
markets and thus drive up property prices. If this
is the case, we should have observed a much
stronger correlation between the debt growth of
financially less constrained firms and property
prices. Instead, we find the opposite.
Conclusion
Using data of non-financial listed companies and
provincial property prices in Mainland China,
this study finds that collateral value matters for
corporate borrowing in recent years. In
particular, we find that property price changes
have a positive effect on firms’ debt growth,
especially for financially constrained firms such
as smaller and non-state-owned companies.
Our findings, therefore, suggest that collateral-
based lending may help alleviate financing
difficulties facing smaller or private Mainland
firms, given that the Mainland financial sector
remains under-developed and information
asymmetries prevail.
However, the use of properties and land as
collateral may lead to a pro-cyclical swing in the
indebtedness of smaller or private firms. For
instance, a property market boom may result in
faster accumulation of corporate debt, which
may in turn exacerbate the vulnerability facing
the financial system. A property market bust, on
the other hand, may lead to a sudden decline or
even a stop in bank lending to corporates, which
would, in turn, cause refinancing problems for
firms, or even jeopardise firms’ business
operations and therefore their repayment ability.
Meanwhile, the declines in collateral value would
also result in a deterioration in loan quality.
In this sense, the exposure of banks to property
markets through the collateral channel also
warrants close monitoring together with banks’
direct exposure.
Our study, however, has some caveats. First, the
sample period is relatively short due to data
limitation. Secondly, this study tried to link
property prices to corporate borrowing in
Mainland China. However, Mainland property
markets have barely experienced meaningful
busts during our sample period. Lastly, this study
focuses only on banks’ exposure to the property
market through the collateral channel, although
property markets can indirectly affect financial
stability through many other ways. For instance,
property prices can affect the revenue of local
governments as well as the profitability of local
government financing vehicles and, in turn,
their repayment ability. Also, the wealth of
households and the growth in upstream and
downstream industries of the property sector can
also be affected by property market performance,
which would also have a feedback effect on
banks’ asset quality and therefore financial
stability. These indirect effects of the property
market on financial stability are not covered in
this study, which therefore warrant further
research.
Page 34

References
Adelino, Manuel, Schoar, Antoinette, and
Severino, Felipe. 2015. “House Prices, Collateral,
and Self-employment”, Journal of Financial
Economics, 117, pp. 288–306.
Banerjee, Ryan N., and Blickle, Kristian S. 2016.
“Housing Collateral and Small Firm Activity in
Europe”, BIS Working Papers, no. 575.
Fabbri, Daniela and Padula, Mario. 2004. “Does
poor legal enforcement make households credit-
constrained?” Journal of Banking and Finance,
28(10): 2369–2397.
Kunieda, Takuma and Shibata, Akihisa. 2011.
“Collateral Constraints and Legal Protection of
Lenders: A Macroeconomic Perspective,” MPRA
Paper 35356, University Library of Munich,
Germany.
Page 35

3. Domestic economy
The Hong Kong economy sustained its growth momentum during the first half of 2017
underpinned by the strength in domestic demand. Growth momentum in the second half is
expected to be slightly slower but still solid amid a higher comparison base. This outlook is
subject to various uncertainties including those from US monetary policy normalisation and
heightened geopolitical tensions. Local inflationary pressures are likely to stay moderate with
soft imported inflation and a stable increase in local costs in the near term.
3.1 Real activities
The Hong Kong economy maintained its
sequential growth in the first half of 2017. On a
seasonally adjusted quarter-on-quarter basis, real
Gross Domestic Product (GDP) grew by 0.7% in
the first quarter and 1.0% in the second, similar
to the average growth rate of 1% over the
preceding two quarters (Chart 3.1). Compared
with the second half of 2016, private
consumption held up well and continued to be
one of the major contributors to GDP growth.
The resilience in private consumption was partly
attributable to robust job and income conditions
as well as sanguine consumer sentiment. As
building and construction activities remained
active and capital expenditure picked up on
improving business sentiment, overall
investment spending revived towards mid-2017.
On the external front, Hong Kong’s exports of
goods recorded four successive quarters of brisk
growth before moderating somewhat in the
second quarter (Chart 3.2). Exports of services
fell back due in part to reduced demand for
tourism-related services. Growth in imports of
services continued amid strong travel interest
among residents. Overall, net exports
contributed positively to GDP growth in the first
quarter, but turned into a drag on growth in the
second.
Chart 3.1
Real GDP growth and contribution by major
expenditure components
Sources: C&SD and HKMA staff estimates.
Chart 3.2
Exports and imports in real terms
Source: C&SD.
Page 36

The favourable economic growth created more
jobs in the first half of the year. Total
employment rose by around 0.9% during the
period, to over 3,800,000, led by increases in
public administration, the social and personal
services sector, and the retail, accommodation
and food services sector. As real output growth
outweighed employment growth, labour
productivity improved cyclically as a result.
In the second half of the year, the Hong Kong
economy is expected to sustain its growth
momentum, albeit at a slightly softer, but still
solid pace, amid a higher comparison base in the
first half. Externally, the gradual recovery in
world economic growth, international trade
flows, global manufacturing activities and visitor
arrivals in Hong Kong should continue to benefit
Hong Kong’s export performance. Domestically,
private consumption is likely to hold up,
underpinned by the resilient labour market. As
for fixed investment, improved economic
conditions will stimulate capital spending, while
rising private housing supply in the primary
market will support building and construction
activities. For 2017 as a whole, the Government,
taking into account the solid data in the first
half, has revised upwards its range forecast of real
GDP growth to 3–4% from 2–3% as announced
earlier in February. Private-sector analysts have
also recently adjusted upwards their growth
forecasts to an average of 3.3%. That said, this
growth outlook is subject to various uncertainties
in the external environment as highlighted in
the previous chapter, as well as Mainland’s
economic performance and the pace of recovery
in inbound tourism.
3.2 Inflation and unemployment
Local inflationary pressures stayed moderate in
the first half of 2017, although the sequential
momentum has been accelerating in recent
months. On a year-on-year comparison, the
underlying composite consumer price index
(CCPI) picked up to 2.0% in the second quarter
from 1.4% in the first quarter (Chart 3.3).
Inflation momentum, as measured by the
annualised three-month-on-three-month
underlying inflation rate, also rose from 0.8% in
April to 2.2% in July. The stronger inflation
momentum was mainly driven by price increases
in tradables (Chart 3.4) as their price inflation
turned positive to 2.4% in the three months
ending July from a negative territory in the
preceding three-month period. Growth in the
housing rental component of the CCPI remained
soft in the first half of 2017 amid the feed-
through of the earlier moderation in private
residential rentals (Chart 3.5).
Chart 3.3
Different measures of consumer price inflation
Sources: C&SD and HKMA staff estimates.
Page 37
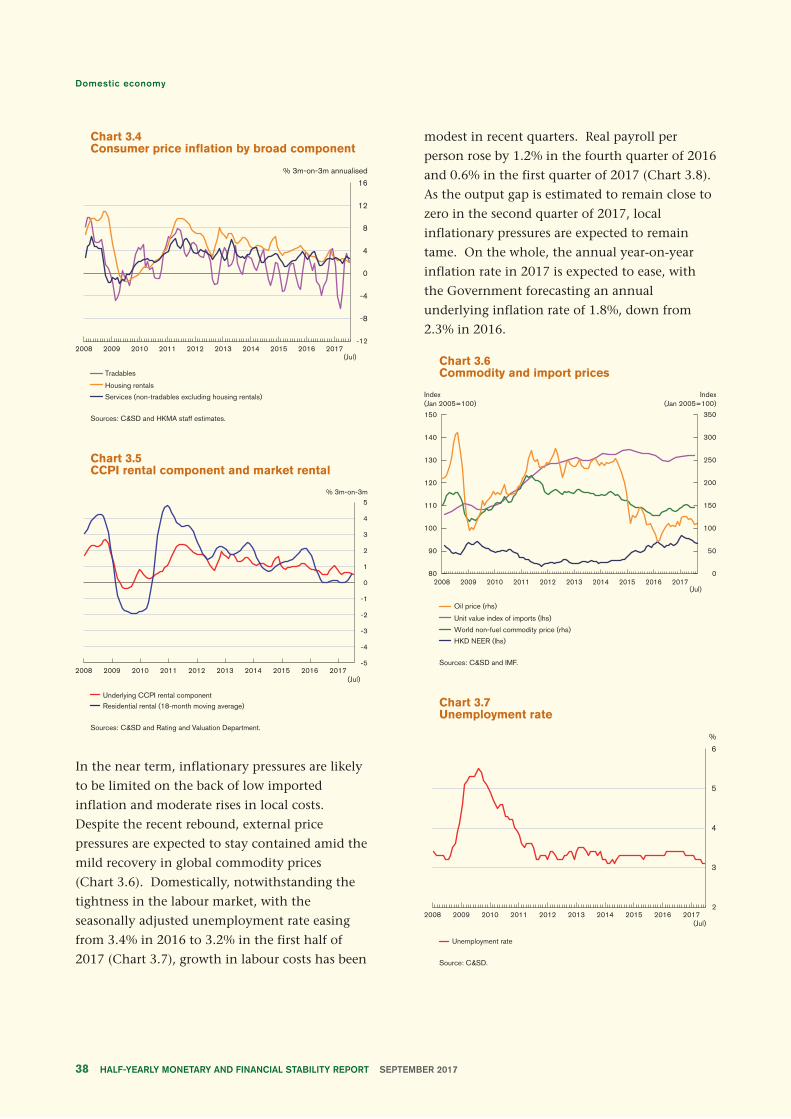
Chart 3.4 Consumer price inflation by broad component
Sources: C&SD and HKMA staff estimates.
Chart 3.5 CCPI rental component and market rental
Sources: C&SD and Rating and Valuation Department.
In the near term, inflationary pressures are likely
to be limited on the back of low imported
inflation and moderate rises in local costs.
Despite the recent rebound, external price
pressures are expected to stay contained amid the
mild recovery in global commodity prices
(Chart 3.6). Domestically, notwithstanding the
tightness in the labour market, with the
seasonally adjusted unemployment rate easing
from 3.4% in 2016 to 3.2% in the first half of
2017 (Chart 3.7), growth in labour costs has been
modest in recent quarters. Real payroll per
person rose by 1.2% in the fourth quarter of 2016
and 0.6% in the first quarter of 2017 (Chart 3.8).
As the output gap is estimated to remain close to
zero in the second quarter of 2017, local
inflationary pressures are expected to remain
tame. On the whole, the annual year-on-year
inflation rate in 2017 is expected to ease, with
the Government forecasting an annual
underlying inflation rate of 1.8%, down from
2.3% in 2016.
Chart 3.6 Commodity and import prices
Sources: C&SD and IMF.
Chart 3.7 Unemployment rate
Source: C&SD.
Page 38

Chart 3.8Unit labour cost and payroll per person
Sources: C&SD and HKMA staff estimates.
The risks to inflation outlook are tilted to the
upside. The recent recovery in inbound tourism,
if strengthened further, could render extra
support to business performance and wage
growth in retail-related industries in the period
ahead. Although the upward momentum in
residential property prices has shown some signs
of softening since early July, the still low
mortgage interest rates and stable labour market
conditions could continue to support the
property market and rentals in the near term. All
these factors, if materialised, could bolster
inflation momentum in the near term.
Page 39
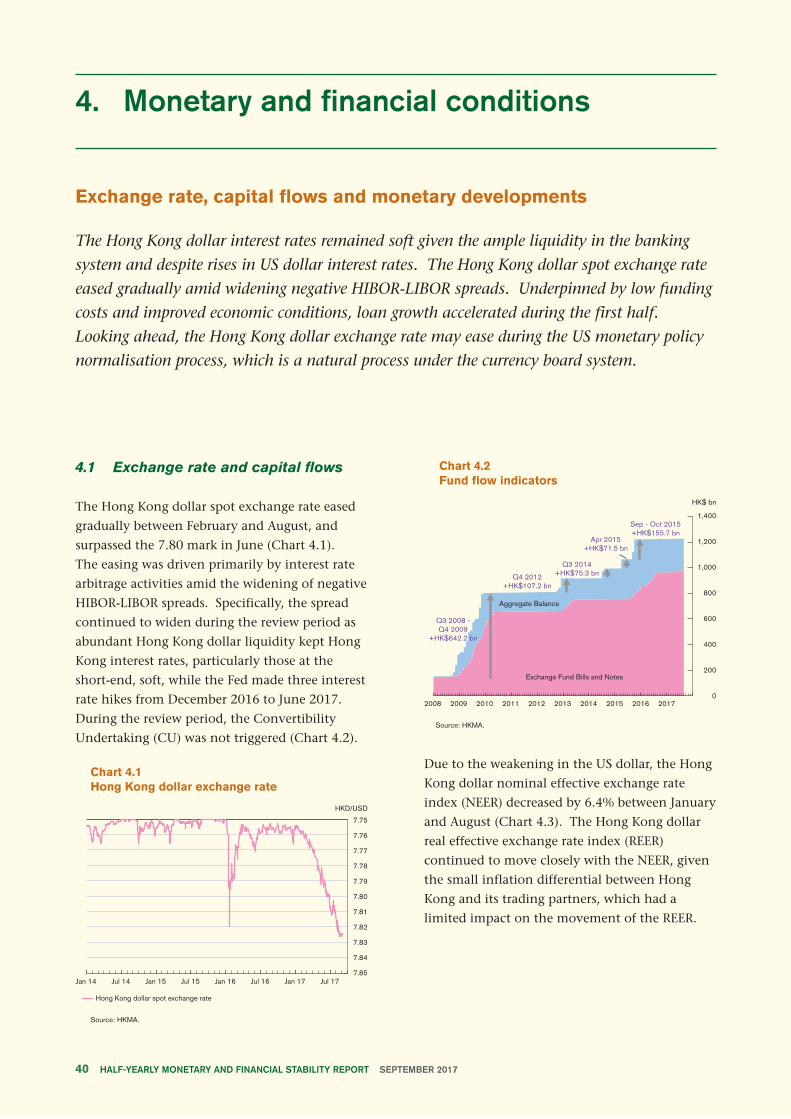
4. Monetary and financial conditions
Exchange rate, capital flows and monetary developments
The Hong Kong dollar interest rates remained soft given the ample liquidity in the banking
system and despite rises in US dollar interest rates. The Hong Kong dollar spot exchange rate
eased gradually amid widening negative HIBOR-LIBOR spreads. Underpinned by low funding
costs and improved economic conditions, loan growth accelerated during the first half.
Looking ahead, the Hong Kong dollar exchange rate may ease during the US monetary policy
normalisation process, which is a natural process under the currency board system.
4.1 Exchange rate and capital flows
The Hong Kong dollar spot exchange rate eased
gradually between February and August, and
surpassed the 7.80 mark in June (Chart 4.1).
The easing was driven primarily by interest rate
arbitrage activities amid the widening of negative
HIBOR-LIBOR spreads. Specifically, the spread
continued to widen during the review period as
abundant Hong Kong dollar liquidity kept Hong
Kong interest rates, particularly those at the
short-end, soft, while the Fed made three interest
rate hikes from December 2016 to June 2017.
During the review period, the Convertibility
Undertaking (CU) was not triggered (Chart 4.2).
Chart 4.1
Hong Kong dollar exchange rate
Source: HKMA.
Chart 4.2
Fund flow indicators
Source: HKMA.
Due to the weakening in the US dollar, the Hong
Kong dollar nominal effective exchange rate
index (NEER) decreased by 6.4% between January
and August (Chart 4.3). The Hong Kong dollar
real effective exchange rate index (REER)
continued to move closely with the NEER, given
the small inflation differential between Hong
Kong and its trading partners, which had a
limited impact on the movement of the REER.
Page 40
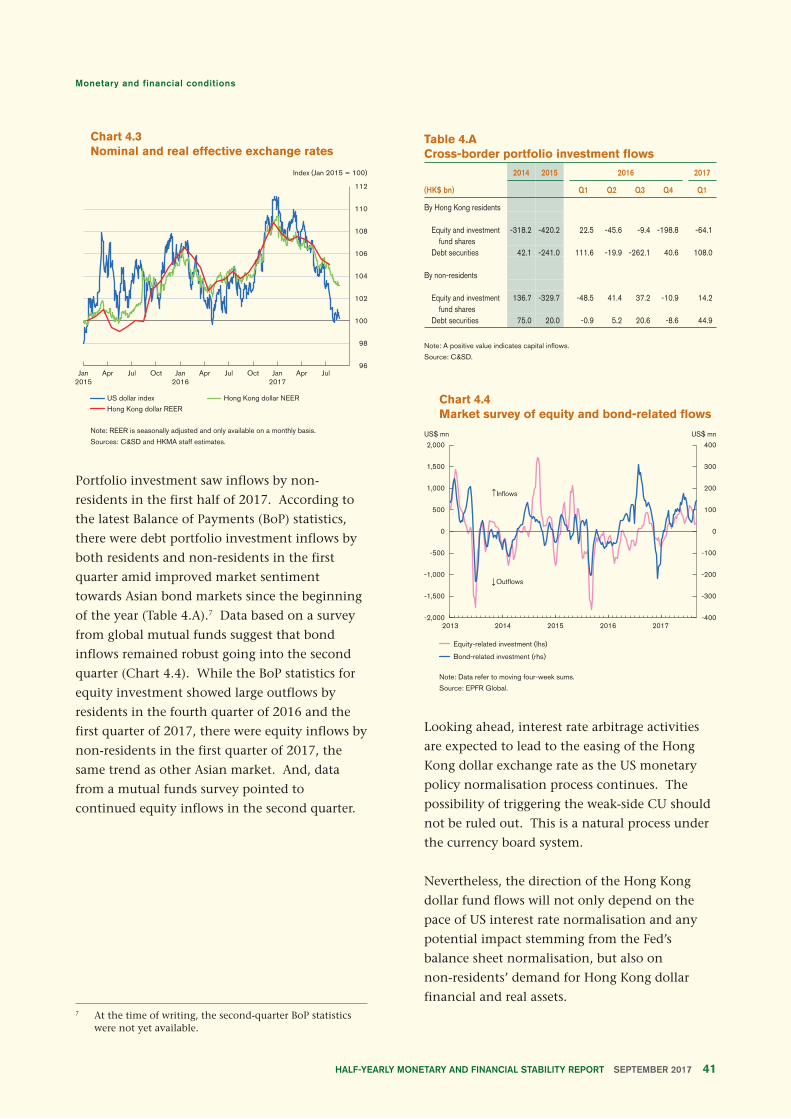
Chart 4.3
Nominal and real effective exchange rates
Note: REER is seasonally adjusted and only available on a monthly basis.
Sources: C&SD and HKMA staff estimates.
Portfolio investment saw inflows by non-
residents in the first half of 2017. According to
the latest Balance of Payments (BoP) statistics,
there were debt portfolio investment inflows by
both residents and non-residents in the first
quarter amid improved market sentiment
towards Asian bond markets since the beginning
of the year (Table 4.A).7 Data based on a survey
from global mutual funds suggest that bond
inflows remained robust going into the second
quarter (Chart 4.4). While the BoP statistics for
equity investment showed large outflows by
residents in the fourth quarter of 2016 and the
first quarter of 2017, there were equity inflows by
non-residents in the first quarter of 2017, the
same trend as other Asian market. And, data
from a mutual funds survey pointed to
continued equity inflows in the second quarter.
Table 4.A
Cross-border portfolio investment flows
2014 2015 2016 2017
(HK$ bn) Q1 Q2 Q3 Q4 Q1
By Hong Kong residents
Equity and investment -318.2 -420.2 22.5 -45.6 -9.4 -198.8 -64.1 fund shares Debt securities 42.1 -241.0 111.6 -19.9 -262.1 40.6 108.0
By non-residents
Equity and investment 136.7 -329.7 -48.5 41.4 37.2 -10.9 14.2 fund shares Debt securities 75.0 20.0 -0.9 5.2 20.6 -8.6 44.9
Note: A positive value indicates capital inflows.
Source: C&SD.
Chart 4.4
Market survey of equity and bond-related flows
Note: Data refer to moving four-week sums.
Source: EPFR Global.
Looking ahead, interest rate arbitrage activities
are expected to lead to the easing of the Hong
Kong dollar exchange rate as the US monetary
policy normalisation process continues. The
possibility of triggering the weak-side CU should
not be ruled out. This is a natural process under
the currency board system.
Nevertheless, the direction of the Hong Kong
dollar fund flows will not only depend on the
pace of US interest rate normalisation and any
potential impact stemming from the Fed’s
balance sheet normalisation, but also on
non-residents’ demand for Hong Kong dollar
financial and real assets.7 At the time of writing, the second-quarter BoP statistics
were not yet available.
Page 41

4.2 Money and credit
Hong Kong’s monetary environment remained
accommodative in the first half of 2017, despite
concerns about the US interest rate hikes and the
Fed’s plan to reduce its balance sheet. The Hong
Kong dollar Monetary Base increased modestly
by 1.7% during the first half, mainly due to the
increases in Certificates of Indebtedness for
banknote issuances (Chart 4.5). While the Hong
Kong dollar eased gradually against the US dollar,
the weak-side CU was not triggered. As a result,
the total of the Aggregate Balance and the
outstanding Exchange Fund Bills and Notes
(EFBNs) remained stable, closing at
HK$1,225.6 billion at the end of June.8
Chart 4.5
Monetary Base components
Source: HKMA.
Notwithstanding the slight increase in the
Monetary Base, the Hong Kong dollar monetary
aggregate expanded at a relatively fast pace. In
particular, growth in the Hong Kong dollar broad
money supply (HK$M3) accelerated further to
8.9% in the first half of 2017 from 6.5% in the
second half of 2016. As the major component of
HK$M3, Hong Kong dollar deposits grew faster
by 9.2% in the first half (Chart 4.7) on the back
of strengthened economic activities as well as
equity-related money demand amid improved
market sentiment. Analysis by the asset-side
counterparts suggests the growth in HK$M3 was
mainly due to money creation through credit
expansion and net Hong Kong dollar inflows
into the non-bank private sector. This was
reflected by the growth in Hong Kong dollar
lending and banks’ net foreign currency assets
respectively (Chart 4.6).
Chart 4.6Changes in the HK$M3 and the asset-side counterparts
Note: The HK$M3 in the monetary survey has been adjusted to include foreign currency swap deposits and to exclude government deposits and Exchange Fund deposits with licensed banks.
Source: HKMA staff estimates.
By contrast, growth in foreign currency deposits
decelerated, mainly through slower growth in
US dollar deposits. In the first half, US dollar
deposits grew by 3.0% compared with a stronger
increase of 12.8% in the preceding half-year
period (Chart 4.7), along with the US dollar
depreciation against most major currencies.
Other foreign currency deposits continued to
decline but at a slower pace of 1.2%, reflecting
signs of stabilisation in renminbi deposits,
8 On 9 August, the HKMA announced issuances of additional Exchange Fund Bills in August and September, totalling HK$40 billion to meet banks’ increased demand for liquidity management. This is consistent with Currency Board Principles, representing a change in the composition of the Monetary Base from the Aggregate Balance to the outstanding EFBNs. The interbank liquidity remained abundant after the additional issuances of the Exchange Fund Bills.
Page 42

particularly during the second quarter. On the
whole, total deposits with authorized institutions
(AIs) grew at a roughly steady pace of 5.6% in the
first half, compared with 6.2% in the second half
of 2016.
Chart 4.7
Deposit growth
Source: HKMA.
Despite the rise in US dollar interbank interest
rates and the upward adjustment of the HKMA
Base Rate9, the Hong Kong dollar interbank
interest rates trended downwards partly
reflecting ample liquidity in the banking system.
For instance, the overnight and three-month
HIBOR fixings decreased by 36 and 26 basis
points over the first eight months, closing at
0.30% and 0.76% respectively at the end of
August (Chart 4.8). As such, the negative spreads
between the Hong Kong dollar and the US dollar
interbank rates widened. Against this
background, Box 3 analyses the fundamental
drivers of the Hong Kong dollar-US dollar
interbank interest rate spreads and how they can
explain the recent widening of the negative
spreads.
9 During the first half of 2017, the HKMA Base Rate was adjusted upwards by 50 basis points from 1.00% at the end of 2016 to 1.50% at the end of June. The increase in the Base Rate followed an upward shift totalling 50 basis points in the target range for the US federal funds rate during the period, in accordance with the revised formula announced on 26 March 2009.
Meanwhile, the long-term Hong Kong
Government Bond yields experienced bigger
drops in comparison with their US counterparts,
with yield of the 10-year Hong Kong
Government Bond falling by 56 basis points to
1.38% at the end of August (Chart 4.9).10
Chart 4.8
Hong Kong dollar and US dollar interbank
interest rates
Sources: CEIC and HKMA.
Chart 4.9
Yield of the 10-year Government Bond, the
composite interest rate, and the average
lending rate for new mortgages
Sources: HKMA and staff estimates.
10 During the same period, the 10-year US Treasury yield declined slightly by 33 basis points to 2.12% at the end of August.
Page 43

As the Hong Kong dollar interbank rates
continued to stay low and the deposit base
remained sizeable, there was no noticeable
upward pressure on retail-level interest rates. The
composite interest rate, as an indicator of retail
banks’ Hong Kong dollar funding cost, remained
steady at a low level of around 0.31% over the
first seven months of 2017 (Chart 4.9). As for
mortgage interest rate, banks’ average lending
rate for new mortgages gradually declined from
2.01% in December 2016 to 1.76% in May amid
low funding costs and fierce competition in the
mortgage market. The average mortgage rate
edged up to 1.85% in July as some banks
increased the pricing spreads of HIBOR-based
mortgages after the eighth round of prudential
measures for mortgage lending was announced
on 19 May.
Looking ahead, Hong Kong dollar interest rates
will eventually face more significant upward
pressure as US monetary policy normalisation
continues. The pace and magnitude of rises in
the Hong Kong dollar interest rates would hinge
on the pace of US monetary policy
normalisation, the pattern of fund flows and the
tightness in domestic liquidity conditions.
Bank credit grew rapidly, underpinned by the
low funding costs and improved economic
environment. Total loan growth accelerated to
10.2% (or an annualised 20.5%) in the first half
of 2017 from 4.2% in the preceding half-year
period (Chart 4.10), with Chinese banks being
particularly active in the loan business. The
strong growth in total loans was broad-based,
with both loans for use in and outside Hong
Kong registering strong growth. Analysed by
currency, both Hong Kong dollar and foreign
currency loans picked up strongly by 9.3% and
11.5% respectively.
Chart 4.10
Loan growth
Source: HKMA.
Specifically, loans for use in Hong Kong
(including trade finance) expanded by an
accelerated 9.4% in the first half, with loans to
most of the major business sectors witnessing
faster growth (Chart 4.11). Loans to financial
concerns registered a notable 25.2% rise in the
first half, in part reflecting increased funding
demand for business expansion amid better
prospects in the local financial services industry.
Loans to building, construction and property
development also expanded faster, partly
reflecting strong financing activities for land
acquisitions and property development
projects.11 Growth in trade finance and loans to
manufacturing, wholesale and retail trade
reverted to positive territory along with the
continued improvement in the value of
merchandise trade and retail sales.
11 In view of recent development that some property developers used high gearing to finance land acquisition and development projects, the HKMA announced on 12 May measures to strengthen banks’ credit risk management for loans to property developers. For construction financing, since 1 June, AIs are required to lower the financing caps respectively to 40% of the site value and 80% of the construction cost, with an overall cap lowered to 50% of the expected value of the completed properties.
Page 44

Chart 4.11
Growth in domestic loans by selected sectors
Source: HKMA.
Despite seeing a moderate expansion relative to
loans to business sectors, household debt grew by
an accelerated 5.0% in the first half following a
4.3% increase in the preceding half-year period.
Within the household debt, personal loans
(which comprise credit card advances and loans
for other private purposes) continued to record
robust growth of 7.2%, partly reflecting better
economic and financial environment
(Chart 4.11). With mortgage interest rates still at
low levels and strong property market sentiment
particularly since March, growth in residential
mortgage loans quickened from 3.1% in the
second half last year to 4.1% in the first half of
2017. Reflecting the fast growth in household
loans, the household debt-to-GDP ratio climbed
higher to 68.3% in the second quarter of 2017
from 67.1% in the fourth quarter of 2016
(Chart 4.12).
Chart 4.12
Household debt-to-GDP ratio and its
components
Note: Only borrowings from AIs are covered.
Source: HKMA.
Loans for use outside Hong Kong rose notably
faster by 12.3% during the first half due to
increases in funding demand from domestic and
multinational corporations amid the improved
external environment.
Funding demand from Mainland enterprises
picked up significantly during the review period.
For the banking sector as a whole12,
Mainland-related lending grew faster by 11.9% in
the first half compared with 3.6% in the
preceding half-year period. Despite the concerns
about rapid credit growth, the credit risk
associated with Mainland-related lending should
be manageable as 76% of borrowers were
Mainland state-owned enterprises and
non-Mainland multinational companies.
Although lending to Mainland private entities
rose significantly during the first half of 2017,
the majority of loans were secured by collaterals
and/or guarantees. Nevertheless, in view of the
fast credit growth, banks should continue to
maintain prudent underwriting standards and
strengthen risk management for their Mainland-
related lending.
12 Including AIs’ Hong Kong offices, Mainland branches and subsidiary banks in Mainland China.
Page 45

Banks’ funding conditions were broadly stable
underpinned by a large deposit base, despite the
strong credit growth. As Hong Kong dollar loans
and deposits expanded roughly at the same pace,
the Hong Kong dollar loan-to-deposit (LTD) ratio
stayed virtually unchanged at 77.1% at the end
of June compared to six months ago (Chart 4.13).
On the other hand, the overall foreign currency
LTD ratio moved up from 59.9% at the end of
2016 to 65.5% at the end of June as foreign
currency loans grew faster than deposits.
Although the US dollar LTD ratio picked up from
63.8% to 68.8% during the same period, the level
remained low compared with the high of over
90% in 2014.
Chart 4.13
LTD ratios
Source: HKMA.
Looking ahead, loan growth momentum may
continue to be supported by the improving
domestic and external environment as well as
potential funding needs for infrastructure
investments. According to the HKMA Opinion
Survey on Credit Condition Outlook, banks
expect to be more neutral on the growth of credit
demand in the near term (see Table 5.A in
Chapter 5).
Offshore renminbi banking business
The offshore (CNH) and the onshore (CNY)
renminbi exchange rate strengthened against the
US dollar (Chart 4.14), in part reflecting the
improved economic conditions in Mainland
China and the weakening of the US dollar
against most major currencies. However, with
some momentary tightening of liquidity in the
offshore market, the CNH strengthened more
than the CNY in late May, as indicated by
notable positive CNY-CNH spreads. The tight
liquidity conditions largely eased moving into
the third quarter and the spread narrowed
significantly.
Consistent with the recent improvement in
liquidity in the offshore market, the three-month
CNH HIBOR fixings fell from the high of 7.00%
in June to 3.97% at the end of August. Some
retail banks also reduced their preferential
renminbi deposit rates.
Chart 4.14
CNY and CNH exchange rates and interbank
interest rates
Sources: Bloomberg and CEIC.
Page 46

Clouded by cautious sentiment in the renminbi
exchange rate movements earlier, the offshore
renminbi liquidity pool in Hong Kong continued
to face downward pressure in early period of
2017, although some signs of stabilisation were
seen in the second quarter. Compared with the
preceding half-year period, the total outstanding
amount of renminbi customer deposits and
certificates of deposit (CDs) declined at a slower
pace of 5.8% in the first half of 2017 to
RMB588.7 billion at the end of June (Chart 4.15
and Table 4.B). Among the total, after falling by
7.2% in the first quarter, renminbi customer
deposits reverted to a modest 3.7% increase in
the second quarter along with the stabilisation of
the renminbi exchange rate, with both personal
and corporate customer deposits picking up in
the second quarter. On the other hand,
outstanding CDs dropped by 20.1% for the first
half as a whole, mainly attributable to a relatively
large amount of CDs reaching maturity towards
the end of June.
Chart 4.15
Renminbi deposits and CDs in Hong Kong
Source: HKMA.
Other renminbi banking business also
consolidated during the first half of 2017. The
outstanding amount of renminbi bank loans
declined significantly by 30.0% to
RMB206.3 billion at the end of June. Renminbi
trade settlement handled by banks in Hong Kong
declined to RMB1,749.3 billion in the first half,
down 19.6% from the second half of 2016, with
outward trade remittances to Mainland China
dropping more than inward trade remittances to
Hong Kong (Chart 4.16).
Chart 4.16
Flows of renminbi trade settlement payments
Source: HKMA.
Nevertheless, the size of the renminbi liquidity
pool remained adequate to support a large
amount of renminbi payments and financial
transactions. The average daily turnover of the
renminbi real time gross settlement system
continued to stay high at RMB886.2 billion in
the first half of 2017, compared with
RMB869.0 billion in the same period in 2016.
Page 47

The development of offshore renminbi business
in the period ahead will continue to depend on
market expectations of the renminbi exchange
rate movements and Mainland’s economic
prospects, amongst other factors. Hong Kong’s
offshore renminbi business will likely be
supported by the increasing use of
renminbi-denominated assets through the
ongoing initiatives of Mainland’s capital account
liberalisation.13 In addition, with increasing
regional and international co-operation under
the Belt and Road Strategy, it is expected that
Hong Kong could benefit from the international
use of the renminbi through renminbi business
links with other regions. Against the background
of continued renminbi internationalisation, Box
4 analyses to what extent the renminbi has been
perceived as a safe-haven currency over the past
few years.
Table 4.B
Offshore renminbi banking statistics
Dec 2016 Jun 2017
Renminbi deposits & certificates of deposit (CDs) (RMB bn) 625.1 588.7 Of which: Renminbi deposits (RMB bn) 546.7 526.1 Share of renminbi deposits in total deposits (%) 5.2 4.9 Renminbi certificates of deposit (CDs) (RMB bn) 78.3 62.6
Renminbi outstanding loans (RMB bn) 294.8 206.3Number of participating banks in Hong Kong’s renminbi 210 207 clearing platformAmount due to overseas banks (RMB bn) 69.0 87.8Amount due from overseas banks (RMB bn) 91.6 132.8
Jan - Jun 2017
Renminbi trade settlement in Hong Kong (RMB bn) 1,749.3 Of which: Inward remittances to Hong Kong (RMB bn) 859.5 Outward remittances to Mainland China (RMB bn) 590.3 Turnover in Hong Kong’s RMB RTGS system 886.2 (Daily average during the period; RMB bn)
Source: HKMA.
13 These include the recent launch of Bond Connect and the expansion of Hong Kong’s RQFII quota, which facilitate overseas investors to participate in the Mainland financial markets through Hong Kong’s platforms.
Page 48

Box 3Analysis on the determinants of HIBOR-LIBOR spreads
The US Fed has increased the target range for the
federal funds rate since 2015, but HIBORs have
not closely followed. As a result, the HIBOR-
LIBOR spreads have generally widened. The
overnight HIBOR in particular stayed close to
zero, resulting in a much wider negative
HIBOR-LIBOR spread than its longer-tenor
counterparts. Against this backdrop, this Box
studies the determinants of the HIBOR-LIBOR
spreads and helps provide a conceptual
understanding of the underlying mechanism.14
Determinants of HIBOR-LIBOR spreads
Conceptually, HIBOR-LIBOR spreads are affected
by four categories of interacting factors as shown
in Chart B3.1. A larger interest rate gap may
induce arbitrage activities consistent with the
automatic interest rate adjustment mechanism
under the Linked Exchange Rate System (LERS)
to subsequently narrow the interest rate gap.
During the process, if the Hong Kong dollar
exchange rate touches the CU and banks trigger
the CU, there will be changes in the Aggregate
Balance and hence interbank liquidity
conditions. Since the Aggregate Balance is a key
determinant of the level of HIBORs, arbitrage
activities will provide a fundamental force that
drives the HIBOR-LIBOR spreads.
Even without arbitrage activities, the interest rate
spread could fluctuate due to several transient
factors. Specifically, the spread could be affected
by variations in domestic interbank liquidity
conditions alone. For instance, a higher Hong
Kong dollar LTD ratio could raise liquidity
pressure in the interbank market and affect
HIBORs.
14 A longer version of the analysis can be found in the paper by Cheung et al. (2017), “Analysis on the determinants of HIBOR-LIBOR spreads”, Research Memorandum 07/2017, Hong Kong Monetary Authority.
The Hong Kong dollar exchange rate or fund
flows could also influence the HIBOR-LIBOR
spreads. Under the uncovered interest rate parity
conditions, the spreads should be linked to the
expectation of the movement in the Hong Kong
dollar exchange rate against the US dollar.
Besides this direct channel, more Hong Kong
dollar inflows could lead to a triggering of the
strong-side CU, resulting in looser domestic
interbank liquidity conditions. This, in turn,
drives the HIBORs down and temporarily widens
their spreads with the LIBORs.
Finally, risks that are specific to Hong Kong could
also lead to higher HIBORs and larger HIBOR-
LIBOR differentials both directly and indirectly
through their impact on interbank liquidity
conditions and the Hong Kong dollar exchange
rate and fund flows. For example, negative
shocks leading to a loss in confidence in the
Hong Kong dollar would raise the risk premium
and result in a rise in the HIBORs directly. At the
same time, it could also lead to the selling of
Hong Kong dollars and a tightening of interbank
liquidity, thereby increasing the HIBOR-LIBOR
spreads.
Chart B3.1
Theoretical determinants of HIBOR-LIBOR
spreads
Source: HKMA staff illustration.
Page 49

Table B3.A lists the indicators of the
determinants of the HIBOR-LIBOR spreads that
we employ in our empirical analysis. Based on
this table, we review some of these indicators and
their relationship with the interest rate spreads in
greater detail below.
Table B3.A
Indicators of the theoretical determinants
Underlying determinants Indicators
1. Interest rate arbitrage HIBOR-LIBOR spread (lagged values)
2. Interbank liquidity Hong Kong dollar LTD ratio
conditions
HKMA’s (net) foreign exchange operations
3. Hong Kong dollar Monthly equity returns differential
exchange rate and fund – Hang Seng Index vs S&P 500 Index
flows HKD/USD exchange rate expectation
– information from option prices
4. Risk factorsStandard deviation of daily equity returns – Hang Seng Index vs S&P 500 Index
Source: HKMA staff.
Interest rate arbitrage
Under the automatic interest rate adjustment
mechanism of the LERS, a larger HIBOR-LIBOR
spread can subsequently induce interest rate
arbitrage activities that are conducive to the
narrowing of the spreads. Such activities, in a
narrow sense, feature the triggering of the CU
with a corresponding change in the Aggregate
Balance. Nevertheless, experience during
2006–2007 showed that when interest carry trade
occurred, the negative HIBOR-LIBOR spreads had
a tendency to narrow (Chart B3.2). However, the
Hong Kong dollar spot exchange rate would
weaken, but not necessarily touch the weak-side
CU in the short run.
In light of the experience, our empirical analysis
defines interest rate arbitrage activities in a
broader sense which does not necessarily involve
the triggering of the CU. Specifically, we capture
the impact of arbitrage activities on the current
HIBOR-LIBOR spreads by including the lagged
values of the spreads in our empirical model. If
arbitrage activities are present, the coefficient
should lie between zero and one, meaning that
the spreads have a tendency to narrow over time,
other things being equal. That said, our model
may not fully capture the arbitrage dynamics.
For example, regulatory changes that limit the
risk-taking capacity of banks after the global
financial crisis may have increased the level of
HIBOR-LIBOR spreads required for the same level
of arbitrage activities to take place.
Chart B3.2
Reported episodes of interest carry trade in
2006–2007
Note: The highlighted areas represent periods of reported interest carry trade.
Sources: CEIC and HKMA.
Hong Kong dollar loan-to-deposit ratio
Interbank liquidity conditions, as measured by
the Hong Kong dollar LTD ratio, appear to be
positively correlated with the HIBOR-LIBOR
spreads. For example, even though the US dollar
interest rate is unchanged, tighter domestic
interbank liquidity – due perhaps to increased
funding needs arising from bank clients’ loan
demand – will exert upward pressure on local
interbank rates to increase the HIBOR-LIBOR
spreads.
Foreign exchange operations by the HKMA
With the strengthening of the currency board
arrangements over the years, the foreign
exchange operation by the HKMA has become
largely passive, mainly in response to banks’
triggering of the CU. These operations could
affect the HIBOR-LIBOR spreads through their
influence on the supply of domestic interbank
Page 50

liquidity. An increase in the supply of domestic
interbank liquidity caused by the HKMA’s foreign
exchange operation could have a knock-on effect
on HIBORs and therefore decrease the HIBOR-
LIBOR spreads (Chart B3.3). However, the
negative relationship between the foreign
exchange operation and the HIBOR-LIBOR
spread has become much weaker following the
global financial crisis due to abundant interbank
liquidity and interest rates heading towards zero.
Chart B3.3
Interest rate spreads and HKMA’s foreign
exchange operations
Sources: CEIC and HKMA.
Equity return differences between Hong Kong
and the US
The difference in the performances of the Hong
Kong and US equity markets could generate
short-term Hong Kong dollar flows of funds that
temporarily affect HIBOR-LIBOR spreads. More
specifically, a strong appetite for Hong Kong
dollar assets tends to induce Hong Kong dollar
inflows into the non-bank private sector and
helps keep the HIBORs relatively low. Indeed,
the HIBOR-LIBOR spreads and the difference
between the monthly returns of the Hang Seng
Index and the S&P 500 Index are negatively
correlated.
Hong Kong dollar exchange rate expectation
Historical evidence indicates that the Hong Kong
dollar-US dollar exchange rate expectations
appear to be highly correlated with the
HIBOR-LIBOR gaps (Chart B3.4). Theoretically,
the uncovered interest rate parity postulates that,
at equilibrium, the interest rate differential
reflects the expected exchange rate movement.
In reality, the expectation that the Hong Kong
dollar would be allowed to follow the renminbi
to appreciate against the US dollar was an
important contributor to the large negative
HIBOR-LIBOR spreads that emerged between
2003 and 2005.
Chart B3.4
Interest rate spreads and Hong Kong dollar
exchange rate expectations
Sources: CEIC, JP Morgan and HKMA.
Risk factors
A large risk premium specific to the Hong Kong
economy (e.g. macro-financial risks, etc.) could
lead to a surge in HIBORs relative to LIBORs. The
Asian financial crisis was a case in point. Taking
into account coverage and data availability, we
use the realised volatility (i.e. standard deviation
of daily equity returns) of the Hang Seng Index
relative to the S&P 500 Index as a proxy for the
risk premium.
Page 51

Empirical models
We estimate an autoregressive model to examine
empirically the effect of different drivers on the
HIBOR-LIBOR spreads for different tenors.15
Estimation results show that the above-mentioned
variables (or indicators) have explanatory power
over the HIBOR-LIBOR spreads. Their
coefficients generally have the expected signs
and many of them are statistically significant
(Table B3.B). In particular, the estimated
coefficients on the lag term of the HIBOR-LIBOR
spread (between zero and one) suggest that the
interest rate spread had a tendency to narrow
over time, partly reflecting the force of arbitrage.
Tighter interbank liquidity conditions as
indicated by a higher Hong Kong dollar LTD
ratio as well as a higher risk premium are found
to be associated with an increase in the HIBOR-
LIBOR spreads. More Hong Kong dollar inflows
as suggested by higher equity market return in
Hong Kong relative to the US, as well as Hong
Kong dollar exchange rate appreciation
expectations tend to decrease the spreads. The
foreign exchange operation by the HKMA could
also decrease the spreads, but this relationship
became much weaker after the global financial
crisis. This result lends support to the claim that
in the interbank money market, the supply curve
now intersects the demand curve on the flat
portion of the demand curve so that changes in
the supply (e.g. the Aggregate Balance) exert little
impact on the HIBOR-LIBOR spreads.
15 For more details on the autoregressive models and estimation results, see Cheung et al. (2017).
Table B3.B
Estimation results from the autoregressive models
Model: spread(t) = average spread + α spread(t-1) + β variables(t) + ε(t)
Overnight 1-month 3-month 12-month
Explanatory variables model model model model
HIBOR-LIBOR spread (lag) 0.43 0.38 0.54 0.74
Net FX operation by HKMA
(Jan 1996 – Oct 2003) – – – –
(Nov 2003 – Sep 2008) ≈ 0 – – –
(Oct 2008 – Now) ≈ 0 ≈ 0 ≈ 0 ≈ 0
HKD LTD ratio + + + +
HK-US stock return diff. – – – –
HKD/USD expectation – – – –
Risk premium + + + +
Note: Grey entries indicate statistically insignificant estimates.
Source: HKMA staff estimates.
Our model can help explain why the HIBOR-
LIBOR spreads could fluctuate in the absence of
any change in the Aggregate Balance or foreign
exchange operations by the HKMA. For example,
decomposition results from our models suggest
that the fluctuations in term HIBOR-LIBOR
spreads following the US rate hikes in late-2015
and late-2016 were driven by swings in the Hong
Kong dollar-US dollar exchange rate expectations
amid a stable Aggregate Balance (Chart B3.5). In
particular, this expectation variable explained
over 70% of the predicted increase in the
3-month HIBOR-LIBOR spread in the first two
months of 2016. Similar decomposition results
were found in the December 2016 episode when
the HIBOR-LIBOR spreads also increased rapidly,
although anecdotal evidence suggests that ad hoc
factors including the anticipation of US money
market reform and year-end funding demands
also had an impact.
Page 52

Chart B3.5
The impact of Hong Kong dollar expectations
on the recent movements in the HIBOR-LIBOR
spreads
Sources: CEIC, JP Morgan and HKMA.
Concluding remarks
This Box provides a conceptual understanding of
the fundamental drivers of the HIBOR-LIBOR
spreads. The size of the HIBOR-LIBOR spreads is
found to be affected not only by interest rate
arbitrage activities, but also interbank liquidity
conditions, the Hong Kong dollar exchange rate
and fund flows, and risk factors. In particular,
although arbitrage activities could narrow the
HIBOR-LIBOR spreads, such a process does not
necessarily involve triggering the CU in the short
run and hence the foreign exchange operations
by the HKMA. We then apply the model to
explain the recent fluctuations of HIBORs despite
a stable Aggregate Balance, and illustrate that
movements in the term HIBOR-LIBOR spreads
during 2016 were, in part, driven by swings in
the Hong Kong dollar-US dollar exchange rate
expectations.
Page 53

Box 4Safehavenness of the Chinese renminbi16
Introduction
Following a quarter of phenomenal growth,
Mainland China has become the world’s largest
trading nation, accounting for more than 12% of
world exports and 10% of imports. This, coupled
with a more-than-twofold expansion of foreign
direct investment in Mainland China from 2005
to 2015, has made the renminbi one of the most
commonly used currencies for international
payments.17 With its inclusion in the IMF’s
Special Drawing Right (SDR) basket in October
2016, the renminbi is now widely recognised as
an international currency. Against this backdrop,
we assess how safe this currency is as a financial
asset.
What is safehavenness and how is it
measured?
By “safehavenness”, we refer to the extent to
which a currency plays the role of a safe haven
from the perspective of the investor. A safe
haven usually relates to a place or shelter which
can provide protection from being hurt in
disastrous or catastrophic situations, such as wars
and natural calamities. A safe-haven currency
generally means one that retains its purchasing
power in times of financial turmoil.
We use the currency option market to gauge the
safehavenness of a currency, as it can provide the
investor with a fast and efficient means of taking
a position in a currency or hedging against the
exchange rate risk of a foreign investment.
However, it is imperative to note that the price of
a call or put option alone cannot indicate
16 The box is based on Fong and Wong (2017) “Safehavenness of the Chinese Renminbi”, HKMA Research Memorandum No.10/2017.
17 Based on the Society for Worldwide Interbank Financial Telecommunication (SWIFT)’s December 2015 report, the renminbi ranks as the world’s fifth most-used payment currency.
whether a currency is safe or risky. The reason is
that in times of turbulence the prices of both the
call and the put are likely to increase, as volatility
rises. Therefore, we focus on the price difference
between a call and a put option, which is known
as the risk reversal of a currency. The risk
reversal increases if there is heavier betting for
the currency to rise, and vice versa. We argue that
a currency is regarded as a safe haven when the
risk reversal of the currency increases in market
turmoil.
Methodology
When risk in global financial markets increases,
investors will flee currencies regarded as risky to
those perceived to be safe havens; and when risk
reduces, investors will find it relatively more
comfortable in holding assets denominated in
riskier currencies. Therefore, the risk reversal of a
currency should bear a positive relationship with
risk aversion if the currency is thought to be safe
(or its downside risk is lower) or a negative
relationship if it is considered risky (or its
downside risk is higher). We estimate this
relationship by quantile regression, which can
capture the relationship under extreme market
conditions, i.e., a scenario of tail risk.18
Specifically, the empirical model is defined as:
where is the risk reversal of currency i at
time t, RiskAversion is the index of risk aversion,
coefficient measures the responsiveness of
investors to an index of risk aversion, const and
18 Specifically, the quantile level q is chosen to be either 0.95 or 0.05, depending on the sign of estimated additionally by the ordinary least squares (OLS) method. If the sign of the OLS coefficient is significantly positive (negative), q will be set to be 0.95 (0.05). In the case of insignificance, q will be chosen to be the one giving a larger in absolute value when estimating the quantile regression.
Page 54

denote the constant and error term respectively.
The Δ is the first difference operator, and the lag
of Δ is used to control for serial correlation.
Data
Our data consist of the risk reversal for the
twenty most-traded currencies (and gold for
reference).19 These currencies include the five in
the SDR basket, i.e., US dollar, euro, British
pound, Japanese yen, and Chinese renminbi
CNY as well as CNH.20
The index of risk aversion is constructed by
taking the first principal component of nine
major stock market volatility indices for the S&P
500, Dow Jones Industrial Average, NASDAQ,
Euro Stoxx 50, DAX, CAC 40, FTSE 100, NIKKEI
225, and Hang Seng index (Chart B4.1).
This study covers the sample period from
27 July 2011 (constrained by data availability) to
31 March 2017.21
19 We use the three-month 25-delta risk reversal of each currency. An option with 25-delta moneyness level means that its price will move 25% for a 100% movement in the exchange rate of the underlying currency.
20 Others include African rand, Australian dollar, Brazilian real, Canadian dollar, Hong Kong dollar, Indian rupee, Korean won, Mexico peso, New Zealand dollar, Norwegian krone, Russian ruble, Singapore dollar, Sweden krona, Swiss franc, and Turkish lira. The selection of these currencies is based on the currencies’ daily average turnover in the 2016 Triennial Central Bank Survey of FX and Over-the-counter Derivatives Markets published by the Bank for International Settlements.
21 Within this period, the renminbi was broadly on an appreciating trend until the end of 2013, but since about the beginning of 2014, it has been on a depreciating trend. Fong and Wong (2017) also divide the sample period into two but the results are very similar.
Chart B4.1
Stock market volatility indices
Source: Bloomberg.
Empirical results
Chart B4.2 sums up the empirical results about
the responsiveness of risk reversal (vis-à-vis the
US dollar) to the risk aversion index for the
whole sample period. With the notable
exception of the Japanese yen, all currencies are
regarded as riskier than the US dollar by dollar-
based investors, as their estimated coefficients are
negative.22 The Chinese renminbi is the safest
among the riskier currencies for the whole
period.
22 The estimated coefficient of the Hong Kong dollar is very close to zero, suggesting that the currency is perceived to have similar safehavenness as the US dollar. This could be attributable to the Linked Exchange Rate System. Meanwhile, the Swiss franc ranked lower than the British pound and Canadian dollar in terms of safehavenness during our sample period. This could be due to the turmoil triggered by the Swiss National Bank’s unexpected decision to abolish the franc’s peg to the euro in early 2015.
Page 55

Chart B4.2
Responsiveness of risk reversal (vis-à-vis the
US dollar) to risk aversion index
Source: HKMA staff estimates.
Of the risk reversals vis-à-vis the euro for the
whole sample period, there are comparatively
more positive coefficients, with that of the
Japanese yen being the largest, followed by those
of the US dollar, Swiss franc, and a few Asian
currencies (Chart B4.3). This suggests that, in
times of market turmoil, these currencies are
regarded as safe havens by euro-based investors.
Again, the Chinese renminbi is generally
regarded as safer than the euro and also among
the safest.
Chart B4.3
Responsiveness of risk reversal (vis-à-vis the
euro) to risk aversion index
Source: HKMA staff estimates.
In addition, the CNY and CNH register very
similar levels of safehavenness from the
perspectives of both dollar-based and euro-based
investors, despite the fragmented markets. The
CNH consistently enjoys a higher safe-haven
status than the CNY, albeit only marginally,
which may be due to the stronger price discovery
process of the offshore market.23
Finally, in order to compare the perception of
dollar-based and euro-based investors regarding
the safe-haven status of the currencies, we have a
scatter plot of their respective safehavenness for
the whole sample period (Chart B4.4). As can be
seen, the slope of the best-fitted regression line is
very close to one, suggesting that the
safehavenness of a currency is, on average,
viewed to be about the same by both groups of
investors.24
Chart B4.4Currency safehavenness vis-à-vis the US dollar against that vis-à-vis the euro
Source: HKMA staff estimates.
23 For details, see Cheung et al.(2016), “The Renminbi Central Parity: An Empirical Investigation”, HKIMR Working Paper No.10/2016, and Cheung et al. (2017) “The RMB Central Parity Formation Mechanism after August 2015: A Statistical Analysis”, HKIMR Working Paper No.06/2017.
24 The fact that the best-fitted regression line has a positive intercept suggests that the US dollar is regarded as safer than the euro.
Page 56

Concluding Remarks
The study estimates the safehavenness of the
Chinese renminbi in its onshore and offshore
markets along with other most traded currencies,
including those in the SDR basket, based on the
behavior of their risk reversals under extreme
market conditions. The empirical results found
that the CNY and CNH rank consistently quite
high on the scale of currency safehavenness by
both dollar-based and euro-based investors.
Within the SDR basket, they are regarded as
riskier than the Japanese yen and US dollar, but
safer than the euro and British pound.
Page 57

Asset markets
Hong Kong equity prices rose further on the back of optimism about the global economy and
corporate earnings. However, while volatilities hovered near all-time low levels, there are
signs that investors have become more cautious about the possibility of a “black swan”
event. The Hong Kong dollar debt market expanded steadily amid fund inflows, while the
offshore renminbi debt market experienced further contraction. The residential property
market became buoyant again, although housing price growth showed signs of moderation
following the macro-prudential measures introduced in May.
4.3 Equity market
The Hong Kong equity market rose further in the
review period, with the Hang Seng Index (HSI)
advancing to a 27-month high in late August
(Chart 4.17). The rally reflected optimism that
the global economy and corporate earnings
remained on track for sustained growth. In line
with the bullish sentiment, the local market
registered net fund inflows since February, in
contrast with the preceding two years when net
fund flow was largely negative (Chart 4.18).
Meanwhile, the decision by the Morgan Stanley
Capital International (MSCI) to include Shanghai
and Shenzhen listed A-shares into its Emerging
Markets Index was a milestone for global
participation in Mainland stocks, although
market reaction to the long-awaited news was
muted.25
25 MSCI Inc. announced on 20 June 2017 that it would include China A shares in the MSCI Emerging Markets Index beginning in June 2018. The 222 China A Large Cap stocks to be included would represent approximately 0.73% of the weight of the index on a pro forma basis.
Against the backdrop of the strong rally, market
volatilities remained relatively subdued despite
geopolitical risk events, such as tension on the
Korean Peninsula and more frequent terrorist
attacks in Europe, with the option implied
volatility of the HSI (VHSI) hovering near its
all-time low (Chart 4.19). However, the SKEW
Index (also known as the “Black Swan Index”, a
measure of the tail risk for the US market)
remained well above its long-term historical
average, suggesting that downside protection was
in high demand.26 This, in turn, implies that a
tangible possibility of a black swan event has
been priced into the US market. Should a shock
occur, the spillover to the local market could be
substantial given Hong Kong’s high degree of
openness.
Overall, the HSI and the Hang Seng China
Enterprises Index (HSCEI), also known as the
H-share index, increased by 17.8% and 10.1%
respectively between March and August, with the
VHSI staying in a relatively low range of 10% to
20%.
26 The SKEW Index is calculated by the Chicago Board Options Exchange from the prices of S&P 500 out-of-the-money options. A SKEW value of 100 means that the probability of outlier negative returns at a 30-day horizon is negligible. As SKEW rises above 100, the left tail of the S&P 500 returns distribution acquires more weight, suggesting that the probability of outlier negative returns become more significant. For details, see https://www.cboe.com/products/vix-index-volatility/volatility-indicators/skew.
Page 58

Chart 4.17
Equity prices in Hong Kong
Source: Bloomberg.
Chart 4.18
Equity fund flows into Hong Kong
Source: EPFR Global.
Chart 4.19
Option-implied volatilities of the HSI and S&P
500, and the SKEW Index
Sources: Bloomberg and HKMA staff estimates.
The price discrepancy between stocks listed on
the Mainland and Hong Kong markets widened
moderately during the review period. By the end
of August, the Hang Seng China AH Premium
Index had increased by around 8.7% from the
level at the end of February (Chart 4.20). The
widening of the price discrepancy could be
attributable to disparities in the equity valuation
between Mainland and Hong Kong investors,
possibly because of lingering uncertainties
surrounding the Mainland economy.27
Chart 4.20
Hang Seng China AH Premium Index
Source: Bloomberg.
27 See Chung, Hui and Li (2013) “Explaining share price disparity with parameter uncertainty: Evidence from Chinese A- and H-shares”, Journal of Banking and Finance, 37 (2013) pp1073–1083.
Page 59

Driven by optimism over the economic outlook,
the price-earnings ratio of Hong Kong stocks has
climbed to a six-year high. However, the
valuations of the Hong Kong market as measured
by the cyclically-adjusted price-to-earnings
(CAPE) ratio are still attractive compared with
other major markets (Chart 4.21).28 Looking
ahead, the local equity market is expected to
remain susceptible to external market conditions.
In particular, in view of the SKEW index for the
US, the tail risk is high for all stock markets,
including Hong Kong.
Chart 4.21
Cyclically-adjusted price-earnings ratios of Asia
Pacific and other major markets
Sources: Bloomberg, CEIC and HKMA staff estimates.
4.4 Debt market
The Hong Kong dollar debt market registered a
steady expansion in the first half of 2017, amid
narrowing yield spreads and continued fund
inflows since the beginning of the year. As the
two hikes in the US federal funds rate target
range so far this year were well anticipated by the
market, the Hong Kong dollar bond market
remained calm with the credit spread over US
28 The CAPE ratio is based on Campbell and Shiller (1988) “Stock prices, earnings, and expected dividends”, Journal of Finance, 43(3), pp661–676. Unlike the conventional price-to-earnings ratio, the CAPE ratio uses a 10-year moving average of real earnings in the denominator to smooth out the cyclical effect on corporate earnings and provides a more consistent estimate on stock valuations over time.
Treasury yields generally trending downwards
(Chart 4.22). Against this backdrop, the Hong
Kong bond market saw continued fund inflows
during the first half of this year (Chart 4.23).
Chart 4.22
Hong Kong dollar yield spreads with the US
10-year Treasury yield
Sources: HKMA, Bank of America Merrill Lynch and Bloomberg.
Chart 4.23
Bond fund flows into Hong Kong
Source: EPFR Global.
In view of the narrowing yield spreads and
continued inflows, total Hong Kong dollar debt
issuance increased by 7.4% year on year to
HK$1,621.4 billion. The 9.2% growth registered
by the public sector and the 4.0% growth by
overseas borrowers (including MDBs), more than
offset the 11.3% decline by the domestic private
Page 60

sector (Chart 4.24). On the back of the
continued increase in issuance, the total amount
of Hong Kong dollar debt outstanding rose by
5.9% to HK$1,751.6 billion at the end of June
2017, equivalent to 25.6% of Hong Kong dollar
M3 or 22.1% of Hong Kong dollar denominated
assets of the entire banking sector (Chart 4.25).
The Exchange Fund remains the largest
contributor to the growth, with debt outstanding
rising by 5.8% to HK$965.6 billion.
Chart 4.24
New issuance of non-Exchange Fund Bills and
Notes Hong Kong dollar debt
Source: HKMA.
Chart 4.25
Outstanding Hong Kong dollar debt
Source: HKMA.
The offshore renminbi debt market in Hong
Kong continued to shrink, amid sizable decreases
in CD issuance, and non-CD debt issuance by
overseas issuers. In the first half of 2017, total
offshore renminbi debt issuance amounted to
RMB74.3 billion, declining by 40.1% year on
year (Chart 4.26). Within the total, new non-CD
debts issued by Mainland private issuers, Hong
Kong issuers and overseas issuers dropped by
58.3%, 24.0% and 47.4% to RMB0.3 billion,
RMB7.4 billion and RMB27.6 billion respectively.
This was partly due to the persistently lower
funding costs onshore (Chart 4.27).
Chart 4.26
New Issuance of offshore renminbi debt
securities
Sources: Newswires and HKMA staff estimates.
Page 61

Chart 4.27
Average yields of onshore vs. offshore renminbi
bond indices
Sources: Bloomberg, Hang Seng Indexes Company Ltd, and China Central Depository & Clearing Co., Ltd.
As a result of the decline in new debt issuance,
offshore renminbi debt securities outstanding in
Hong Kong contracted by 8.1% year on year to
RMB502.2 billion at the end of June 2017
(Chart 4.28). The decrease in non-CD debt
outstanding by private Mainland issuers and
Hong Kong issuers together with the reduction in
CDs outstanding more than offset the increase in
outstanding debt by overseas issuers and the
Mainland Government.
Chart 4.28
Outstanding amount of offshore renminbi debt
securities by remaining tenor
Sources: Newswires and HKMA staff estimates.
Looking ahead, the near term development of
the offshore renminbi bond market will be
subject to the uncertainty of the renminbi
exchange rate and the onshore-offshore funding
cost gap. In the longer term, the offshore
renminbi bond market is expected to interact
more closely with the onshore market through
various channels, including the Bond Connect
launched in July, the first offshore futures market
on Chinese sovereign bonds,29 and the inclusion
of onshore bonds into global indices.30
4.5 Property markets
Residential property market
The residential property market turned buoyant
again from March after a brief period of
moderation at the beginning of the year. Amid
strong market sentiment and intensifying
competition for mortgage business among banks,
average monthly housing transactions increased
to about 6,200 units during March to June 2017,
from 3,700 units in the first two months
(Chart 4.29). In particular, transactions in the
primary market increased to a level similar to
that in the second half of 2016, while
transactions in the secondary market also rose.
Indeed, housing prices in the secondary market
continued to climb, and in June surpassed the
peak recorded in September 2015 by 9.9%. Prices
of small and medium-sized flats (with a saleable
area of less than 100m2) increased faster than
that of large flats (with a saleable area of at least
100m2).
29 On 24 March 2017, Hong Kong Futures Exchange Limited announced the introduction of the 5-year China Ministry of Finance Treasury Bond futures contract. The product is the first of its kind that introduces an offshore interest rate risk management tool in the renminbi fixed income market based on onshore Chinese government bonds.
30 On 1 March 2017, Bloomberg launched the “Global Aggregate + China Index” and the “Emerging Market Local Currency Government + China Index” to include renminbi-denominated bonds into the global fixed income indices. On 7 March 2017, Citigroup announced that China’s onshore bonds would be included in its Emerging Markets Government Bond Index, Asian Government Bond Index, and Asia Pacific Government Bond Index.
Page 62

As a result of the rising property prices and the
intensifying competition for mortgage business
among banks, the HKMA introduced the eighth
round of prudential measures for property
mortgage loans on 19 May to strengthen banks’
risk management and safeguard banking
stability.31 Following these measures, housing
price growth showed signs of moderation, while
average transaction volume declined in July and
August compared with the first half of the year.
Chart 4.29
Residential property prices and transaction
volume
Sources: R&VD and Land Registry.
The recent market buoyancy renewed concerns
about household affordability. The housing
price-to-income ratio stood at 16.6 in the second
quarter, higher than the 1997 peak of 14.6, while
the income-gearing ratio reached 75.5%, much
higher than the long-term average of about 50%
(Chart 4.30).32 The buy-rent gap as a measure of
31 For details, see “Circular on Prudential Measures for Property Mortgage Loans” issued by the HKMA on 19 May.
32 The price-to-income ratio measures the average price of a typical 50m2 flat relative to the median income of households living in private housing. Alternately, the income-gearing ratio compares the amount of mortgage payment for a typical 50m2 flat (under a 20-year mortgage scheme with a 70% loan-to-value (LTV) ratio to the median income of households living in private housing. The income-gearing ratio is not the same as a borrower’s actual debt-servicing ratio (DSR), which is subject to a maximum cap by the HKMA’s prudential measures.
relative user costs remained at a high level of
176.1% as the residential rental yields remained
low at 2.0–2.8% in June (Chart 4.31).33
Chart 4.30
Indicators of housing affordability
Sources: R&VD, C&SD and HKMA staff estimates.
Chart 4.31
Buy-rent gap
Note: This indicator is calculated as the ratio of the cost of purchasing and maintaining a 50m2 flat with that of renting it.
Sources: R&VD, C&SD and HKMA staff estimates.
33 The buy-rent gap estimates the cost of owner-occupied housing (under a 20-year mortgage scheme with a 70% LTV ratio) relative to rentals.
Page 63

In general, although the stretched housing
affordability environment implies a higher
systemic risk arising from the excessive leverage
of homebuyers, the eight rounds of
macro-prudential measures for mortgage loans
introduced by the HKMA since 2009 have
effectively dampened such risks and
strengthened banks’ risk management and
resilience. The average LTV ratio for new
mortgages approved declined to 48% in July
from 64% before the measures were first
introduced, while the DSR also decreased to
34.0%.
Nevertheless, recent developments in new
sources of home financing deserve careful
monitoring as they could have implications
when viewed from a broader financial stability
perspective. Anecdotal evidence suggests that
support to young homebuyers from parents has
become more popular. Some young homebuyers
have financed their purchases partially by the
proceeds of re-mortgages or top-up mortgages of
their parents’ properties. While data on the
number of property transactions with parental
support are not available, this method of home
financing is likely to have become more common
because of the high property prices and the high
share of owner-occupied properties without
mortgages (Chart 4.32).
Chart 4.32
Share of owner-occupier with and without
mortgages
Source: C&SD.
Property developers have also been active in
providing high-LTV first mortgages in the
primary market. While the banking system is
not directly exposed to such lending, there are
concerns about the potential risk stemming from
bank lending to these property developers. As a
result, on 12 May the HKMA announced new
measures to require banks to set aside adequate
capital for exposures to property developers
offering mortgages, by increasing the risk-weights
for credit exposures to property developers
offering mortgages.34 While the market share of
mortgages extended by property developers is
currently small, the trend deserves close
monitoring.
The outlook for the residential property market
remains highly uncertain. In the near term,
given that the expectation of low interest rates
and housing shortage remain, positive market
sentiment may continue to support property
market. In addition, the strategies of property
developers to promote sales, including offering
mortgage plans for new launches with mortgage
rates below the prevailing market rates, may also
boost the demand. That said, the gradual
improvement in housing supply might narrow
the housing supply-demand gap which would
contain property price growth. The potential
impact of the Fed’s balance sheet reduction and
further US rate hikes on global and domestic
financial conditions could also have a significant
impact on the housing market further down the
road.
34 For details, see “Circular on Risk management for lending to property developers” issued by the HKMA on 12 May.
Page 64

Non-residential property market
The non-residential property market saw robust
activity in the first half of 2017. The average
monthly transaction volume stayed at around
1,800 units, while speculative activities as
indicated by confirmor transactions remained
low (Chart 4.33). Analysed by segments, the
price of office space increased at a fast pace of
8.8% in the first half amid strong demand for
prime office locations, particularly on Hong
Kong Island (Chart 4.34). Factory-space prices
also picked up by 7.6% amid upbeat market
sentiment in this segment, and the demand
driven by private sector re-development plans.
However, prices for retail premises grew slowly
and fell in June despite retail sales and inbound
tourism stabilising. Meanwhile, rentals of flatted
factories kept pace with the respective price
increase, although this was not the case with
rentals of office space which lagged behind.
The overall rental yields across segments declined
somewhat to 2.5–2.9%.
Chart 4.33
Transactions in non-residential properties
Sources: Land Registry and Centaline Property Agency Limited.
Chart 4.34
Non-residential property price indices
Source: R&VD.
In the near future, the non-residential property
market may grow steadily amid investors’
continued interest in office space and flatted
factories, while the attractiveness of prime retail
locations may improve given the better outlook
for retail sales and inbound tourism. Yet, the risk
of rising domestic interest rates, uncertainties
surrounding global financial conditions and
capital flows could put downward pressure on
the investment demand for non-residential
properties. In addition, the supply of shopping
centres is expected to increase in the coming two
years, which could have an impact on the retail
segment.
Page 65

5. Banking sector performance
The profitability of retail banks improved in the first half of 2017 over the same period last
year, mainly due to higher net interest income and non-interest income. Banks maintained
strong capital and liquidity positions, while lending grew more rapidly in the first half of
2017 amid the improved economic environment. Asset quality remained sound. Despite the
US interest rate hikes, banks’ funding costs remained low and stable, underpinned by a large
retail deposit base. Nevertheless, with the widened interest rate differential between Hong
Kong and the US, banks should remain vigilant about the risk of significant capital outflows
and their impact on local interest rates amid the ongoing US monetary policy normalisation.
Banks should also maintain prudent credit risk management as sharp rises in interest rates
could test their asset quality given the rising levels of corporate leverage and increasing
household debt-servicing burdens.
5.1 Profitability and capitalisation
Profitability
The aggregate pre-tax profit of retail banks35 rose
notably by 18.2% in the first half of 2017
compared with the same period last year. The
improvement was broad-based, with increases in
both net interest income and non-interest
income. As a result, the return on assets36
increased to 1.17% in the first half of 2017 from
1.07% in the same period of 2016 (the red line in
Chart 5.1).
35 Throughout this chapter, figures for the banking sector relate to Hong Kong offices only unless otherwise stated.
36 Return on assets is calculated based on aggregate pre-tax operating profits.
Chart 5.1
Profitability of retail banks
Note: Semi-annually annualised figures.
Source: HKMA.
Page 66

The net interest margin (NIM) of retail banks
widened to 1.43% in the second quarter of 2017
from 1.33% in the same period of 2016
(Chart 5.2). The improvement in NIM was in
line with anecdotal evidence of a rising average
spread of Hong Kong dollar corporate loans that
emerged from the syndicated loan market in
Hong Kong (Chart 5.3).
Chart 5.2
NIM of retail banks
Note: Quarterly annualised figures.
Source: HKMA.
Chart 5.3
Average spread of Hong Kong dollar syndicated
loans
Note: The spread refers to the average spread over HIBOR for HIBOR-based Hong Kong dollar loans syndicated in Hong Kong, weighted by loan amounts.
Source: HKMA staff estimates based on data from LoanConnector.
Despite the two interest rate hikes by the Fed in
March and June 2017, wholesale funding costs in
Hong Kong have trended down from the recent
peak, largely due to ample liquidity in the Hong
Kong banking sector. The three-month HIBOR
has declined to 0.78% from the post-crisis high
of 1% recorded in December 2016 (the blue line
in Chart 5.4). The Hong Kong dollar retail
deposit rates remained low and stable in the
review period. The composite interest rate, a
measure of the average cost of Hong Kong dollar
funds for retail banks, hovered at 0.31% at the
end of June 2017.
Chart 5.4
Interest rates
Notes:
(a) End of period figures.
(b) Period-average figures for newly approved loans.
Sources: HKMA and staff estimates.
More broadly, although the funding costs for
licensed banks in Hong Kong as a whole began
trending up since the Fed started its rate hike
cycle in December 2015, the upward pace slowed
somewhat in the review period. Specifically, the
average overall Hong Kong and US dollar
funding cost increased by 13 basis points in the
first half of 2017 (the red line in Chart 5.5),
compared with a 17-basis-point increase in the
second half of 2016.
Page 67
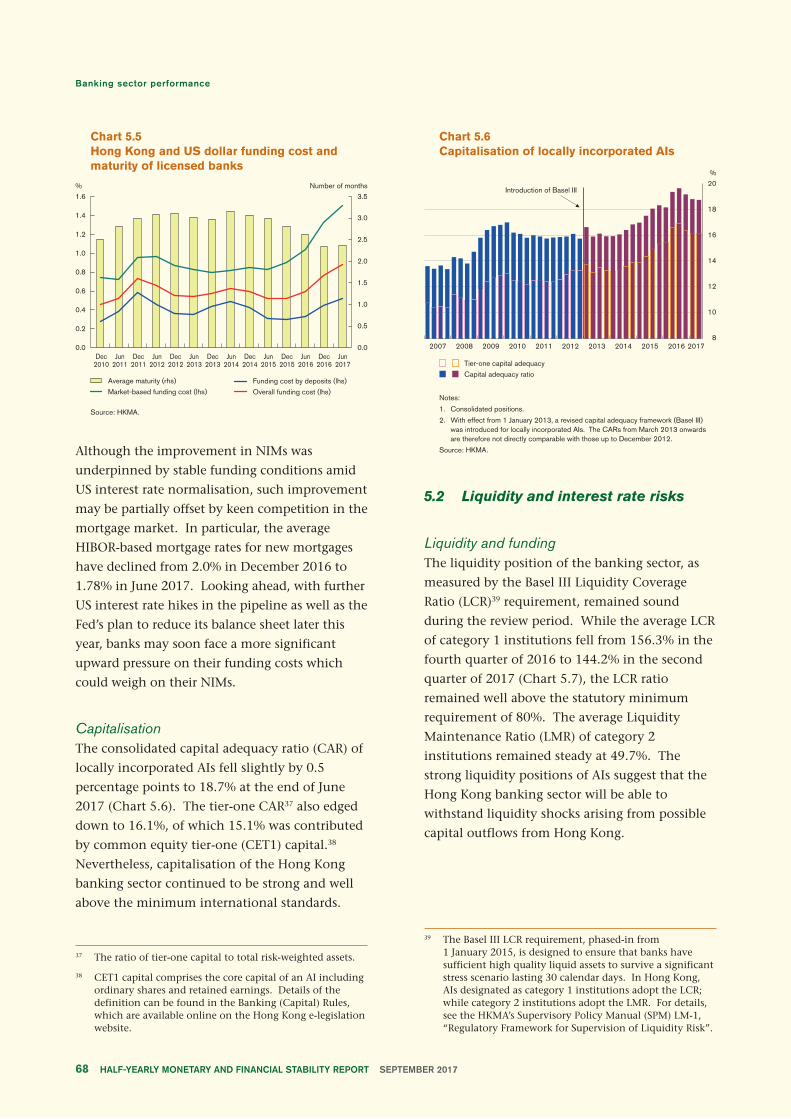
Chart 5.5
Hong Kong and US dollar funding cost and
maturity of licensed banks
Source: HKMA.
Although the improvement in NIMs was
underpinned by stable funding conditions amid
US interest rate normalisation, such improvement
may be partially offset by keen competition in the
mortgage market. In particular, the average
HIBOR-based mortgage rates for new mortgages
have declined from 2.0% in December 2016 to
1.78% in June 2017. Looking ahead, with further
US interest rate hikes in the pipeline as well as the
Fed’s plan to reduce its balance sheet later this
year, banks may soon face a more significant
upward pressure on their funding costs which
could weigh on their NIMs.
Capitalisation
The consolidated capital adequacy ratio (CAR) of
locally incorporated AIs fell slightly by 0.5
percentage points to 18.7% at the end of June
2017 (Chart 5.6). The tier-one CAR37 also edged
down to 16.1%, of which 15.1% was contributed
by common equity tier-one (CET1) capital.38
Nevertheless, capitalisation of the Hong Kong
banking sector continued to be strong and well
above the minimum international standards.
37 The ratio of tier-one capital to total risk-weighted assets.
38 CET1 capital comprises the core capital of an AI including ordinary shares and retained earnings. Details of the definition can be found in the Banking (Capital) Rules, which are available online on the Hong Kong e-legislation website.
Chart 5.6
Capitalisation of locally incorporated AIs
Notes:
1. Consolidated positions.
2. With effect from 1 January 2013, a revised capital adequacy framework (Basel III) was introduced for locally incorporated AIs. The CARs from March 2013 onwards are therefore not directly comparable with those up to December 2012.
Source: HKMA.
5.2 Liquidity and interest rate risks
Liquidity and funding
The liquidity position of the banking sector, as
measured by the Basel III Liquidity Coverage
Ratio (LCR)39 requirement, remained sound
during the review period. While the average LCR
of category 1 institutions fell from 156.3% in the
fourth quarter of 2016 to 144.2% in the second
quarter of 2017 (Chart 5.7), the LCR ratio
remained well above the statutory minimum
requirement of 80%. The average Liquidity
Maintenance Ratio (LMR) of category 2
institutions remained steady at 49.7%. The
strong liquidity positions of AIs suggest that the
Hong Kong banking sector will be able to
withstand liquidity shocks arising from possible
capital outflows from Hong Kong.
39 The Basel III LCR requirement, phased-in from 1 January 2015, is designed to ensure that banks have sufficient high quality liquid assets to survive a significant stress scenario lasting 30 calendar days. In Hong Kong, AIs designated as category 1 institutions adopt the LCR; while category 2 institutions adopt the LMR. For details, see the HKMA’s Supervisory Policy Manual (SPM) LM-1, “Regulatory Framework for Supervision of Liquidity Risk”.
Page 68

Chart 5.7
LCR
Notes:
1. Consolidated positions.
2. Quarterly average figures.
Source: HKMA.
Customer deposits continued to be the primary funding source for AIs, underpinning a stable funding structure. At the end of June 2017, the share of customer deposits to banks’ total liabilities40 remained unchanged at 56.8% from six months ago (Chart 5.8).
Chart 5.8
The liability structure of all AIs
Notes:
1. Figures may not add up to total due to rounding.
2. Figures refer to the percentage of total liabilities (including capital and reserves).
3. Debt securities comprise negotiable certificates of deposit and all other negotiable debt instruments.
Source: HKMA.
Reflecting the faster growth in foreign
currency-denominated loans and advances than
deposits during the review period, the foreign
40 The figures reported here are not comparable to those published in previous issues of this Report due to the different coverage of banks.
currency loan-to-deposit (LTD) ratio41 of all AIs
increased to 65.5% in June 2017 from 59.9% in
December (Chart 5.9). Meanwhile, as Hong
Kong dollar loans and deposits grew at a similar
pace during the review period, the Hong Kong
dollar LTD ratio remained unchanged at 77.1%
in June 2017. Overall, the all-currency LTD ratio
increased to 71.4% from 68.4% six months ago.
Chart 5.9
Average LTD ratios of all AIs
Source: HKMA.
Interest rate risk
The interest rate risk exposures of locally
incorporated licensed banks remained stable at low
levels. It is estimated that under a hypothetical
shock of an across-the-board 200-basis-point
increase in interest rates, the economic value of
locally incorporated licensed banks’ interest rate
positions could be subject to a decline equivalent
to 3.69% of their total capital base at the end of
June 2017 (Chart 5.10).42 Nevertheless, with
expected US interest rate hikes and the Fed’s
forthcoming balance sheet normalisation, banks
should assess the implications for their interest
rate risk management.
41 The LTD figures reported here are not comparable to those published in previous issues of this Report due to the different coverage of banks.
42 This estimation does not take into account for the effects of any mitigating actions by banks in response to the shock. The impact would be smaller if mitigating actions is taken.
Page 69

Chart 5.10
Impact of an interest rate shock on locally
incorporated licensed banks
Notes:
1. Interest rate shock refers to a standardised 200-basis-point parallel rate shock to institutions’ interest rate risk exposure.
2. The impact of the interest rate shock refers to its impact on the economic value of the banking and trading book43, expressed as a percentage of the total capital base of banks.
Source: HKMA.
5.3 Credit risk
Overview
There was a slight improvement in the asset
quality of banks’ loan portfolios during the
review period. The gross classified loan ratio and
the ratio of overdue and rescheduled loans of all
AIs reduced to 0.83% and 0.61% at the end of
June 2017 respectively, compared with 0.85%
and 0.67% at the end of 2016. For retail banks,
both the gross classified loan ratio and the ratio
of overdue and rescheduled loans edged down to
0.68% and 0.46% respectively (Chart 5.11).
43 Locally incorporated AIs subject to the market risk capital adequacy regime are required to report positions in the banking book only. Other locally incorporated AIs exempted from the market risk capital adequacy regime are required to report aggregate positions in the banking book and trading book.
Chart 5.11
Asset quality of retail banks
Notes:
1. Classified loans are those loans graded as “sub-standard”, “doubtful” or “loss”.
2. Figures prior to December 2015 are related to retail banks’ Hong Kong offices and overseas branches. Starting from December 2015, the coverage was expanded to include the banks’ major overseas subsidiaries as well.
Source: HKMA.
Credit growth continued to accelerate, largely
supported by the improved domestic and
external environments. On a half-year basis,
total lending of AIs grew rapidly by a rate of
10.2% in the first half of 2017 compared with
4.2% in the second half of 2016.
However, expectations of credit growth in the
near term have become more neutral. The results
of the HKMA Opinion Survey on Credit
Condition Outlook in June 2017 showed that the
share of surveyed AIs expecting loan demand to
remain the same in the next three months had
increased notably to 86% from 62% in December
2016, while the share of AIs expecting higher
loan demand had decreased to 5% (Table 5.A).
Table 5.A
Expectation of loan demand in the next three
months
% of total respondents Sep-16 Dec-16 Mar-17 Jun-17
Considerably higher
Somewhat higher
Same
0
5
71
0
14
62
0
5
81
0
5
86
Somewhat lower 24 24 14 10
Considerably lower 0 0 0 0
Total 100 100 100 100
Note: Figures may not add up to total due to rounding.
Source: HKMA.
Page 70

Household exposure44
Credit risk of household loans stayed low during
the review period. Banks’ mortgage portfolios
remained healthy, with the delinquency ratio at
a low level of 0.03% at the end of June 2017.
The average loan-to-value ratio (LTV) of new
mortgage loans approved decreased further to
50.1% in the second quarter of 2017 from 51.3%
in the last quarter of 2016 (Chart 5.12).
Chart 5.12
Average LTV ratio and household debt-servicing
burden for new mortgage loans
Note: The calculation of the index is based on the average interest rate for BLR-based mortgages.
Sources: HKMA and staff estimates.
However, the debt-service index of new
mortgages45 increased further to 50.3 in the
second quarter of 2017 from 48.8 in the fourth
quarter of 2016 (the red line in Chart 5.12),
mainly due to an increase in the average size of
44 Loans to households constitute lending to professional and private individuals, excluding lending for other business purposes. Mortgage lending accounts for a major proportion of household loans while the remainder comprises mainly unsecured lending through credit card lending and other personal loans for private purposes. At the end of June, the share of household lending in domestic lending was 28.5%.
45 A higher value of the debt-service index indicates that there is either a drop in household income, or an increase in interest rates, or an increase in the average mortgage loan amount drawn by households. Historical movements in the index suggest that a sharp rise in the index may lead to a deterioration in the asset quality of household debt.
new mortgage loans (Chart 5.13). The ongoing
US interest rate hikes and the prospective start to
the Fed’s balance sheet normalisation could
weigh further on the already rising household
debt-servicing burden. A sensitivity test suggests
that the index could rise significantly to 69.6 in a
four-quarter period if interest rates were to
increase by 300 basis points46, other things being
constant. Therefore, the affordability of
household could be under significant pressures if
interest rates rise rapidly. To further strengthen
banks’ risk management of their mortgage loan
portfolio, the HKMA implemented the eighth
round of macro-prudential measures on banks’
mortgage lending in May 2017.47
Chart 5.13
New mortgage loans of surveyed AIs
Source: HKMA Residential Mortgage Survey.
46 The assumption of a 300-basis-point rise in interest rates is consistent with the prudential measure that requires AIs to have a 3-percentage-point mortgage rate upward adjustment for stress testing property mortgage loan applicants’ debt servicing ability.
47 On 19 May 2017, the HKMA introduced a new round of prudential supervisory measures on property mortgage business, which included lowering the maximum LTV ratio and debt-servicing ratio for specified groups of borrowers, to strengthen the risk management of AIs and safeguard banking stability. The HKMA also requires AIs using the internal ratings-based approach to raise the risk-weight floor from 15% to 25% for new residential mortgage loans approved after 19 May 2017. For details, see HKMA press release “Prudential Measures for Property Mortgage Loans” on the same date.
Page 71

The credit risk of unsecured household exposure
remained contained in the first half of 2017,
with the annualised credit card charge-off ratio
and the delinquency ratio largely unchanged at
1.93% and 0.25% (Chart 5.14) at the end of June
2017 respectively.
Chart 5.14
Charge-off ratio and delinquency ratio for credit
card lending and bankruptcy petitions
Sources: Official Receiver’s Office and HKMA.
Corporate exposure48
The pace of US interest rate normalisation
continued to be one key factor affecting the
credit risk of corporate exposures, given the
rising trends of corporate sector leverage
(Chart 5.15). As discussed in previous issues of
this Report,49 the leverage of local and non-local
corporates exhibited very different developments
after the GFC, therefore it is important to
separately assess the leverage of these two groups.
Using accounting data up to the end of 2016, the
leverage for non-local corporates (as measured by
the weighted average debt-to-equity ratio)
continued to stay high at around 81%, while the
48 Excluding interbank exposure. At the end of June, the share of corporate loans in domestic lending was 71.4%.
49 For details, see “Box 4: Assessing corporate leverage in Hong Kong”, Half-yearly Monetary and Financial Stability Report, September 2016.
leverage for local corporates also increased
slightly to 42%. The higher level of leverage for
non-local corporates implies that these
corporates would be more vulnerable to interest
rate shocks. As such, banks should carefully
assess how interest rates rise will affect the credit
risk in relation to their exposure to non-local
corporates.
Looking ahead, given the recent strong growth in
corporate loans and loans for use outside Hong
Kong which were registered in the first half of
2017, the leverage for both local and non-local
corporates would likely rise further. In view of
the rising levels of corporate sector leverage,
banks should maintain prudent credit risk
management.
Chart 5.15
Leverage ratio of listed non-financial corporates
in Hong Kong
Notes:
1. Weighted average figures.
2. The leverage ratio is defined as the ratio of debt to equity. A higher value indicates higher leverage.
3. All non-financial corporates listed on the Hong Kong Stock Exchange are selected. Local and non-local corporates refer to listed firms that are domiciled in and outside Hong Kong respectively.
4. Figures are calculated based on information up to end-August 2017.
Source: HKMA staff estimates based on data from Bloomberg.
Page 72

Mainland-related lending and non-bank
exposures
The banking sector’s Mainland-related lending
increased during the first half of 2017. Total
Mainland-related lending rose by 11.9% to
HK$3,992 billion (16.6% of total assets) at the
end of June 2017 from HK$3,566 billion (15.6%
of total assets) at the end of 2016 (Table 5.B).
Other non-bank exposures also edged up by 4.8%
to HK$1,298 billion (Table 5.C).
Table 5.B
Mainland-related lending
HK$ bn Sep 2016 Dec 2016 Mar 2017 Jun 2017
Mainland-related loans 3,554 3,566 3,808 3,992
Mainland-related loans 3,260 3,294 3,509 3,695 excluding trade finance Trade finance 294 273 299 297
By type of AIs: Overseas incorporated AIs 1,552 1,531 1,686 1,777 Locally incorporated AIs* 1,442 1,490 1,548 1,613 Mainland banking 560 545 574 603 subsidiaries of locally incorporated AIs
By type of borrowers: Mainland state-owned 1,481 1,436 1,545 1,663 entities Mainland private entities 772 834 921 969 Non Mainland entities 1,301 1,297 1,342 1,361
Notes:
1. * Including loans booked in Mainland branches of locally incorporated AIs.
2. Figures may not add up to total due to rounding.
Source: HKMA.
Table 5.C
Other non-bank exposures
HK$ bn Sep 2016 Dec 2016 Mar 2017 Jun 2017
Negotiable debt instruments and other on-balance sheet exposuresOff-balance sheet exposures
709
453
722
517
764
483
815
483
Total 1,162 1,238 1,246 1,298
Note: Figures may not add up to total due to rounding.
Source: HKMA.
Despite the concerns over the rising share of
banks’ Mainland-related lending, the credit risks
arising from this should remain manageable as
76% of the Mainland-related lending at the end
of June 2017 was for state-owned enterprises and
non-Mainland multinational companies, with
the majority of loans to Mainland private entities
being secured with collaterals or guarantees.
Partly reflecting improved economic conditions
and market sentiment in Mainland China, the
distance-to-default index,50 a market-based
default risk indicator, points to a broad-based
reduction in the default risk of the Mainland
corporate sector since early 2016 (Chart 5.16).
Chart 5.16
Distance-to-default index for the Mainland
corporate sector
Note: Distance-to-default index is calculated based on the non-financial constituent companies (i.e. excluding investment companies and those engaged in banking, insurance and finance) of the Shanghai Stock Exchange 180 A-share index.
Source: HKMA staff estimates based on data from Bloomberg.
The gross classified loan ratio of Mainland-
related lending of all AIs51 increased marginally
to 0.88% at the end of June 2017 from 0.80% at
the end of 2016. In view of the rising trends of
the credit-to-GDP ratio and corporate sector
leverage in the Mainland (Chart 5.17 and
Chart 5.18), banks are reminded to maintain
prudent credit risk management for their
Mainland-related lending.
50 The distance-to-default is a market-based default risk indicator based on the framework by R. Merton (1974), “On the pricing of corporate debt: the risk structure of interest rates”, Journal of Finance, Vol. 29, pages 449–470, in which equity prices, equity volatility, and companies’ financial liabilities are the determinants of default risk. In essence, it measures the difference between the asset value of a firm and a default threshold in terms of the firm’s asset volatility.
51 Figures cover AIs’ Hong Kong offices and Mainland branches and subsidiaries.
Page 73

Chart 5.17
Credit-to-GDP ratio in Mainland China
Note: Credit-to-GDP ratio is defined as the ratio of total bank loans (all currencies) to the sum of quarterly nominal GDP for the latest four quarters.
Sources: CEIC and HKMA staff estimates.
Chart 5.18
Leverage ratio for the Mainland corporate
sector
Notes:
1. The leverage ratio is defined as the ratio of total liabilities to total assets.
2. It is calculated based on the non-financial constituent companies (i.e. excluding investment companies and those engaged in banking, insurance and finance) of the Shanghai Stock Exchange 180 A-share index.
Source: HKMA staff estimates based on data from Bloomberg.
Macro stress testing of credit risk52
Results of the latest macro stress testing on retail
banks’ credit exposure suggest that the Hong
Kong banking sector remains resilient
and should be able to withstand rather severe
52 Macro stress testing refers to a range of techniques used to assess the vulnerability of a financial system to “exceptional but plausible” macroeconomic shocks. The credit loss estimates presented in this report are obtained based on a revised framework from J. Wong et al. (2006), “A framework for stress testing banks’ credit risk”, Journal of Risk Model Validation, Vol. 2(1), pages 3–23. All estimates in the current issue are not strictly comparable to those estimates from previous issues of this Report.
macroeconomic shocks similar to those
experienced during the Asian financial crisis.
Chart 5.19 presents the simulated future credit
loss rate of retail banks in the second quarter of
2019 under four specific macroeconomic shocks53
using information up to the second quarter of
2017.
Taking account of tail risk, banks’ credit losses (at
the confidence level of 99.9%) under the stress
scenarios range from 1.20% (Interest rate shock)
to 2.74% (Hong Kong GDP shock), which are
significant, but smaller than the estimated loan
loss of 4.39% following the Asian financial crisis.
Chart 5.19
The mean and value-at-risk statistics of
simulated credit loss distributions1
Notes:
1. The assessments assume the economic conditions in 2017 Q2 as the current environment. The Monte Carlo simulation method is adopted to generate the credit loss distribution for each scenario.
2. Baseline scenario: no shock throughout the two-year period.
3. Stressed scenarios:
Hong Kong GDP shock: reductions in Hong Kong’s real GDP by 2.3%, 2.8%, 1.6%, and 1.5% respectively in each of the four consecutive quarters starting from 2017 Q3 to 2018 Q2.
Property price shock: Reductions in Hong Kong’s real property prices by 4.4%, 14.5%, 10.8%, and 16.9% respectively in each of the four consecutive quarters starting from 2017 Q3 to 2018 Q2.
Interest rate shock: A rise in real interest rates (HIBORs) by 300 basis points in the first quarter (i.e. 2017 Q3), followed by no change in the second and third quarters and another rise of 300 basis points in the fourth quarter (i.e. 2018 Q2).
Mainland GDP shock: Slowdown in the year-on-year annual real GDP growth rate to 4% in one year.
Source: HKMA staff estimates.
53 These shocks are calibrated to be similar to those that occurred during the Asian financial crisis, except the Mainland GDP shock.
Page 74

5.4 Systemic risk
Policy uncertainties in major advanced
economies are one important factor affecting the
systemic risk of the Hong Kong banking sector.
In the US, the Fed’s intention to implement
balance sheet normalisation in the near term has
raised market concerns about its potential
impacts on global financial markets. Although
the pace of the Fed’s balance sheet normalisation
is expected to be gradual, it remains to be seen
how it will affect the US Treasury market. Should
the Fed’s balance sheet normalisation and the
ongoing US rate hikes trigger significant
volatilities in US interest rates, this may have
ramifications for global financial conditions. If
this scenario occurs, it could pose various
challenges for banks in Hong Kong.
In particular, sharper-than-expected rises in US
interest rates may translate into higher financing
costs for corporates which affect their debt-
servicing ability. This could in turn put pressure
on banks’ credit risk management in view of the
rising levels of leverage among non-local
corporates. Banks in Hong Kong could also face
higher risks of mark-to-market losses in their
investment portfolios, as they have generally
increased holdings of government debt securities
since the crisis.54
In view of the widened interest rate differential
between the Hong Kong dollar and US dollar, the
US monetary policy normalisation could
heighten the risks of significant capital outflows
from the Hong Kong banking sector, which may
result in an overshooting of interest rates in
Hong Kong.
54 For details, see “Box 5: Changes in the business models of banks in Hong Kong after the crisis and their implications”, Half-yearly Monetary and Financial Stability Report, March 2017.
In the UK, uncertainty about the outcome of the
Brexit negotiations has increased following the
results of the UK election. If the Brexit
negotiations lead to an abrupt shift in
cross-border banking flows between the UK and
euro-area economies, the subsequent impact of
spillover risks to the Hong Kong banking sector
could be large, given the significant interbank
linkage between Hong Kong and the UK.
However, during the review period, there was no
apparent deterioration in interbank funding
conditions. The spread between the three-month
US dollar LIBOR and its corresponding overnight
index swap (OIS) rate55, which is a common
indicator of systemic liquidity risks in the
short-term dollar funding market, has been
broadly stable (Chart 5.20).
Chart 5.20
3-month US dollar LIBOR-OIS spreads
Source: Bloomberg.
55 An OIS is an interest rate swap in which the floating leg is linked to an index of daily overnight rates. The two parties agree to exchange at maturity, on an agreed notional amount, the difference between interest accrued at the agreed fixed rate and interest accrued at the floating index rate over the life of the swap. The fixed rate is a proxy for expected future overnight interest rates. As overnight lending generally bears lower credit and liquidity risks, the credit risk and liquidity risk premiums contained in the OIS rates should be small. Therefore, the LIBOR-OIS spread generally reflects the credit and liquidity risks in the interbank market.
Page 75

Elsewhere, there has been market speculation on
whether the ECB and the BoJ may start tapering
their unconventional monetary policies.
Although it is not expected to happen
immediately, when it occurs, the potential
spillover effects arising from the joint tightening
of monetary policies to the Hong Kong banking
sector should not be underestimated given the
strong presence of global banks. Box 5 examines
how foreign banks in Hong Kong respond to
changes in monetary policies by major central
banks. The findings suggest that the negative
spillover effects arising from the joint tightening
of monetary policies in these economies would
exert pressure on US dollar credit availability in
Hong Kong. Nevertheless, the ongoing
regulatory reforms and prudential measures,
which encourage banks to develop more resilient
capital and liquidity positions, may help to
mitigate the adverse impact.
The countercyclical capital buffer (CCyB) for
Hong Kong
The CCyB is part of the internationally agreed
Basel III standards and is designed to enhance
the resilience of the banking sector against
system-wide risks associated with excessive
aggregate credit growth. Hong Kong is
implementing the CCyB in line with the Basel III
implementation schedule. The Monetary
Authority announced on 27 January 2017 that
the CCyB ratio for Hong Kong will increase to
1.875% with effect from 1 January 2018, from
the current 1.25%.56 This reflects the fact that,
under the Basel III phase-in arrangements, the
maximum CCyB under Basel III will increase to
1.875% of banks’ risk-weighted assets on
1 January 2018 from 1.25% effective from
1 January 2017.57
56 Further details of the decision may be found in the press release “Monetary Authority Announces Countercyclical Capital Buffer for Hong Kong” issued on 27 January 2017 which is available on the HKMA website.
57 Under the Basel III phase-in arrangements, the maximum CCyB rate was capped at 0.625% on 1 January 2016, with the cap rising by 0.625 percentage points each subsequent year until it reaches 2.5% on 1 January 2019.
In setting the CCyB rate, the Monetary Authority
considered a series of indicators (Table 5.D),
including an “indicative buffer guide” (which is a
metric providing a guide for CCyB rates based on
credit-to-GDP and property price-to-rent gaps58).
Based on the information up to the decision date
at the end of the second quarter, both the
credit-to-GDP gap and the property price-to-rent
gap widened to 13.4% and 10.0% respectively,
from 11.5% and 8.2% on the last announcement
date. Both gaps remained at elevated levels and
the risks associated with credit and property
market conditions have not abated. A simple
mapping from the indicative buffer guide would
signal a CCyB rate of 2.5%, which is at the upper
end of the Basel III range.
In addition, the information drawn from other
reference indicators59 was, in the view of the
Monetary Authority, consistent with the signal
from the indicative buffer guide.
58 The gaps between the ratio of credit to GDP and its long term trend, and between the ratio of residential property prices to rentals and its long-term trend.
59 These included measures of bank, corporate and household leverage; debt servicing capacity; profitability and funding conditions within the banking sector and macroeconomic imbalances.
Page 76

Table 5.D
Information related to the Hong Kong
jurisdictional CCyB rate
14-Jan-16 27-Jan-17 Q2-2017
Announced CCyB rate 1.25% 1.875%
Date effective 01/01/2017 01/01/2018
Indicative buffer guide 2.5% 2.4% 2.5%Basel Common Reference Guide 2.5% 2.5% 2.5%Property Buffer Guide 2.5% 2.0% 2.5%Composite CCyB Guide 2.5% 2.4% 2.5%Indicative CCyB Ceiling None None None
Primary gap indicators
Credit/GDP gap 15.3% 11.5% 13.4% Property price/rent gap 13.1% 8.2% 10.0%Primary stress indicators
3-month HIBOR spread 0.30% 0.75% 0.47%* (percentage points) Quarterly change in classified 0.07% 0.01% -0.02% loan ratio (percentage points)
Notes:
1. The values of all CCyB guides, the Indicative CCyB Ceiling and their respective input variables are based on public data available prior to the corresponding review/announcement date, and may not be the most recent available as of each quarter end (refer to SPM CA-B-1 for explanations of the variables). If there is a CCyB announcement, the date of the announcement is shown at the top of the respective column. If there is no CCyB announcement, the quarter in which a CCyB review takes place (normally close to quarter end) is shown at the top of the column.
2. * Following a review of the appropriate risk-free rate benchmark (previously identified as the 3-month OIS rate), the HKMA has decided to amend the definition of the interbank market spread to the difference between 3-month HIBOR and 3-month Exchange Fund Bill yield, effective from April 2017.
Source: HKMA.
Key performance indicators of the banking sector
are provided in Table 5.E.
Page 77

Table 5.EKey performance indicators of the banking sector1 (%)
Jun 2016 Mar 2017 Jun 2017
Interest rates 1-month HIBOR fixing2 (quarterly average) 0.22 0.55 0.40 3-month HIBOR fixing (quarterly average) 0.54 0.97 0.83 BLR3 and 1-month HIBOR fixing spread (quarterly average) 4.78 4.45 4.60 BLR and 3-month HIBOR fixing spread (quarterly average) 4.46 4.03 4.17 Composite interest rate4 0.26 0.32 0.31
All AIs
Balance sheet developments5
Total deposits 0.7 3.0 2.4 Hong Kong dollar 1.8 5.1 4.0 Foreign currency -0.4 1.0 0.9 Total loans 2.4 4.6 5.4 Domestic lending6 3.1 4.0 5.2 Loans for use outside Hong Kong7 0.7 6.0 5.9 Negotiable instruments Negotiable certificates of deposit (NCDs) issued 1.3 7.4 8.1 Negotiable debt instruments held (excluding NCDs) 2.1 1.4 -1.7
Asset quality As a percentage of total loans8
Pass loans 97.36 97.51 97.77 Special mention loans 1.74 1.66 1.40 Classified loans9 (gross) 0.90 0.83 0.83 Classified loans (net)10 0.58 0.50 0.47 Overdue > 3 months and rescheduled loans 0.69 0.68 0.61 Classified loan ratio (gross) of Mainland related lending11 0.87 0.78 0.88
Liquidity ratios (quarterly average, consolidated) Liquidity Coverage Ratio — category 1 institutions 158.0 146.2 144.2 Liquidity Maintenance Ratio — category 2 institutions 53.8 49.9 49.7
Retail banks
Profitability
Loan impairment charges as a percentage of average total assets12 0.07 0.06 0.08 Net interest margin12 1.30 1.38 1.41 Cost-to-income ratio13 42.7 41.1 40.7
Surveyed institutions
Asset quality Delinquency ratio of residential mortgage loans 0.04 0.04 0.03 Credit card lending Delinquency ratio 0.27 0.27 0.25 Charge-off ratio — quarterly annualised 2.17 1.88 2.08 — year-to-date annualised 2.00 1.88 1.93
All locally incorporated AIs
Capital adequacy (consolidated) Common Equity Tier 1 capital ratio 15.8 15.2 15.1 Tier 1 capital ratio 16.6 16.1 16.1 Total capital ratio 19.4 18.8 18.7
Notes:1. Figures are related to Hong Kong offices only except where otherwise stated.2. The Hong Kong Interbank Offered Rates are released by the Hong Kong Association of Banks.3. With reference to the rate quoted by The Hongkong and Shanghai Banking Corporation Limited.4. The composite interest rate is a weighted average interest rate of all Hong Kong-dollar interest-bearing liabilities, which include deposits from
customers, amounts due to banks, negotiable certificates of deposit and other debt instruments, and Hong Kong-dollar non-interest-bearing demand deposits on the books of banks. Further details can be found on the HKMA website.
5. Quarterly change.6. Loans for use in Hong Kong plus trade finance.7. Including “others” (i.e. unallocated).8. Figures are related to all AIs’ Hong Kong offices, as well as locally incorporated AIs’ overseas branches and major overseas subsidiaries.9. Classified loans are those loans graded as “substandard”, “doubtful” or “loss”.10. Net of specific provisions/individual impairment allowances.11. Figures are related to all AIs’ Hong Kong offices, as well as locally incorporated AIs' Mainland branches and subsidiaries.12. Year-to-date annualised.13. Year-to-date figures.
Page 78

Box 5Inward monetary policy spillover and implications for
US dollar lending of foreign banks in Hong Kong
Introduction
Foreign banks are important vehicles for
transmitting foreign monetary policies to host
countries. Being an international financial
centre, Hong Kong is not immune from such
inward spillovers. As the US monetary policy
normalisation continues and the European
Central Bank and the Bank of Japan may possibly
wind down their unconventional monetary
policies (UMPs), the supply of US dollar loans of
foreign banks in Hong Kong (FBHKs)60 could be
affected significantly amid tighter liquidity
conditions. The issue deserves an in-depth
assessment in view of the fact that many foreign
bank branches in Hong Kong have been more
active in the dollar loan market since the global
financial crisis. And, they have funded their
dollar loans primarily by overseas funding,
particularly from countries adopting UMPs.61
Against such a background, this box empirically
examines how the supply of dollar loans of
FBHKs would be affected if major advanced
economies that have adopted UMPs (i.e. the US,
euro area, Japan and the UK, and henceforth
referred to as UMP countries) tighten their
monetary policies.
The empirical models
We start the analysis by constructing a quarterly
monetary policy index (MPI) that reflects
monetary policies of the four major UMP
countries. We then estimate econometric models
to explain quarterly changes of dollar loans of
FBHKs in the logarithm form (ΔL) by quarterly
changes of the MPI (ΔMPI) and other factors.
60 Foreign banks include both foreign bank branches and subsidiaries.
61 See “Box 5: Changes in business models of banks in Hong Kong after the crisis and their implications”, Half-yearly Monetary and Financial Stability Report, March 2017.
We construct the MPI as follows. First, we obtain
a shadow policy rate for each of the four UMP
countries as estimated by Krippner (2015).62 In
essence, the shadow rate coincides with the
policy rate before it hits zero, and contains
information about the monetary policy stance
when the policy rate reaches the zero lower
bound. Chart B5.1 shows the shadow policy rate
for the four countries. Apart from the US, which
started its monetary policy normalisation in
December 2015, shadow policy rates of other
countries remained at negative levels as their
central banks continued to adopt UMPs.
Chart B5.1
Shadow policy rates for UMP countries
Source: Estimated shadow rates are sourced from Krippner (2015).
Secondly, for each FBHK, we compute a weighted
average of the four shadow rates for each time
point, with the weights reflecting funding
dependence of the FBHK with respective
countries. More specifically, we proxy the
funding dependence of the FBHK on a UMP
country by its net US dollar cross-border
62 For details, see http://www.rbnz.govt.nz/research-and-publications/research-programme/additional-research/measures-of-the-stance-of-united-states-monetary-policy/comparison-of-international-monetary-policy-measures.
Page 79
liabilities from the banking sector of that country
as a share of the FBHK’s total liabilities in the
previous quarter.63 Essentially, we assume that an
FBHK would respond differently to monetary
policies in the four UMP countries such that the
more dollar funding it directly obtains from a
UMP country, the more responsive is that FBHK
to the monetary policy in that UMP country.64
Apart from direct dollar funding flows from the
four UMP countries, FBHKs may also source
dollar funding from parent banks. Since a typical
way for parent banks to obtain dollar funding is
from the US wholesale funding market,65 FBHKs
may be responsive to monetary policy in the US
through this indirect channel. In order to
capture the potential spillover effect through this
indirect channel in constructing the MPI, we
increase the weight for the US shadow rate if the
FBHK receives net dollar funding from its home
country’s banking sector.66 We define the
resulting bank-specific time series as the MPI. By
construction, a positive value of ΔMPI indicates a
tighter monetary policy condition of the four
major UMP countries.
To capture a fuller effect of ΔMPI on ΔL, our
benchmark model includes the contemporaneous
and the first three lag terms of ΔMPI as
explanatory variables. We also include
bank-fixed and time-fixed effects in the model.
The former captures unobservable time-invariant
63 A zero weight is assigned if net US dollar cross-border liabilities from that country are negative, i.e. the FBHK is a net funding provider to the banking sector of that country.
64 As the direct dollar banking flows are used in the model, these essentially assume that banks in the respective UMP countries would first obtain US dollar funding either from wholesale markets or through foreign exchange (FX) swap markets before lending to FBHKs.
65 Alternatively, parent banks could also obtain dollar funding through FX swap markets and such dollar funding is also captured in FBHK’s US dollar net funding from parents.
66 In practice, the weight for the US shadow rate is increased by the ratio of FBHK’s net US dollar cross-border liabilities from the home-country’s banking sector to its total liabilities in the previous quarter if the ratio is positive.
characteristics of FBHKs, while the latter takes
into account changes in loan demand and
economic conditions in Hong Kong that
commonly affect FBHKs over time.67 Under this
specification, the sum of the estimated
coefficients of contemporaneous and lag terms of
ΔMPI can be interpreted as the cumulative effect
of ΔMPI on changes in the supply of dollar loans
of FBHKs in a one-year horizon.
We also consider a modified model that studies
how balance sheet factors would affect the extent
of inward monetary policy spillover. In
particular, we conjecture that FBHKs with a
higher capital ratio (at the parent level) and a
more stable funding structure would be less
responsive to monetary policy changes in the
UMP countries. For the former factor, we argue
that highly capitalised banks could have broader
access to alternative funding other than retail
deposits, by which they can counterbalance
some of the contractionary effect of monetary
policy tightening. Also, FBHKs with a more
stable funding structure, such as taking more
local retail deposits and long-term funding, are
arguably less subject to inward monetary policy
spillover or, at least, tend to have a smaller
immediate spillover effect.
To test these two conjectures, we include the
tier-one capital ratio of the parent bank and the
ratio of the sum of customer deposits and non-
deposit liabilities with a maturity over three
months to total liabilities (henceforth referred to
as the stable funding ratio) of FBHKs in the
model. These two variables are separately
interacted with all ΔMPI terms in the regression
equation to reveal how these two balance sheet
factors affect the extent of inward monetary
policy spillover. The structure of the empirical
model is summarised by Chart B5.2.
67 The model also includes some control variables, including (1) log assets of parent bank; (2) tier-one capital ratio of FBHK’s parent bank; (3) FBHK’s total loans as a share of its assets; and (4) FBHK’s stable funding as a share of its liabilities.
Page 80

Chart B5.2
The structure of the empirical models
The model is estimated using a quarterly panel
dataset of 79 foreign banks in Hong Kong
covering from the first quarter of 2004 to the first
quarter of 2017. The foreign branch- and
subsidiaries-level variables are constructed using
regulatory data filed by FBHKs to the HKMA,
while parent-level variables are constructed using
consolidated balance sheet data of their
respective parents from SNL and Capital IQ.
Estimation results and scenario analysis
Table B5.1
Estimated impact of inward monetary policy
spillover on dollar lending of foreign banks in
Hong Kong
Explanatory variables ΔUSD Loans ΔUSD Loans
∑ΔMPI (t to t-3)
∑ΔMPI (t to t-3) * T1 ratio
∑ΔMPI (t to t-3) * stable funding ratio
–** –***
+**
+*
Bank control Yes Yes
Bank fixed effect Yes Yes
Time fixed effect Yes Yes
Note: ***, ** and * denote the estimated coefficients are significant at 1%, 5% and 10% levels
respectively.
Source: HKMA staff estimates.
Our preliminary estimation results are
summarised in Table B5.1, which are in line with
our expectations. In particular –
(1) First, estimation results from the benchmark
model (i.e. the first column of Table B5.1)
show that FBHKs would reduce their dollar
lending in response to monetary policy
tightening in the UMP countries. As implied
by the construction of the MPI, the estimated
impact tends to be larger for those FBHKs
that rely more on funding from UMP
countries and the home country.
(2) Secondly, the balance sheet factors are found
to significantly affect the extent of inward
monetary spillover (i.e. see the second
column of Table B5.1). Specifically, those
FBHKs that have a higher tier-one capital
ratio (at the parent level) or a higher stable
funding ratio tend to have a smaller
reduction in dollar lending in response to
monetary policy tightening in UMP countries
than other FBHKs.
Based on the estimation results from the
modified model, we further conduct analysis
based on two hypothetical scenarios. We assume
a 100-basis-point increase in the shadow policy
rates in a one-year horizon by the US Fed in the
first scenario, and by all the four UMP countries
jointly in the second scenario. We put our focus
on the estimated impact of dollar loans of FBHKs
from the four UMP countries for two reasons.
First, European and Japanese banks and, to a
lesser extent, US banks are major providers of
dollar loans. Secondly, analysing granular data
finds that this group of FBHKs relied much more
on funding from UMP countries than other
FBHKs, suggesting that the inward monetary
spillover effect would mainly pass through
FBHKs from UMP countries.
Page 81

Chart B5.3 presents the estimated cumulative
impact68 on dollar loans for the two hypothetical
scenarios based on the latest average balance
sheet position of FBHKs from the UMP countries.
The FBHKs from UMP countries are estimated to
reduce their dollar loans by 1.9% if the US Fed
raises the policy rate by 100 basis points (i.e. the
first scenario), while in the more extreme
scenario, the estimated decline in dollar loans is
much larger at 3.8% (the second scenario).
Chart B5.3
Estimated cumulative impact on dollar lending
of a 100-basis-point rise in shadow rates in the
US and in all four UMP countries
Source: HKMA staff estimates.
The relatively moderate estimated impact on
dollar loans69 may be partly attributable to
post-crisis development in the balance sheet
characteristics of FBHKs. Specifically, both the
average tier-one capital ratio and the stable
funding ratio of FBHKs have improved notably
after the crisis and even surpassed their pre-crisis
levels (Charts B5.4 and B5.5). These
developments partly reflect the policy effects of
Basel III capital requirements introduced since
2007 and the Stable Funding Requirement
introduced by the HKMA in 2013.
68 We assume a 25-basis-point increase in the policy rate for four consecutive quarters. The cumulative impact is defined as the sum of the estimated impact of each quarter rise in the policy rate on dollar loans over four quarters.
69 As a reference, dollar loans of the Hong Kong banking sector declined by 4.6% in the fourth quarter of 2006 after a total of 84 basis points increase in the effective Fed Fund Rate from March to December 2006.
Chart B5.4
Average tier-one capital ratio of FBHKs
Note: Figures refer to the simple average of the consolidated tier-one capital ratio of parent banks of FBHKs.
Source: HKMA staff estimates based on data obtained from SNL and Capital IQ.
Chart B5.5
Stable funding ratio of FBHKs
Note: Stable funding sources are defined as the sum of customer deposits and non-deposit liabilities with maturity over three months.
Source: HKMA.
To evaluate how far the post-crisis improvement
in bank balance sheet factors may have
dampened the inward monetary policy spillover
effect, we conduct a counterfactual exercise by
assuming that the average tier-one capital ratio
and stable funding ratio of FBHKs from UMP
countries were to stay at their levels at the end of
2008. We then re-estimate the loan responses in
two hypothetical scenarios as shown in Chart
B5.3 previously. Had their balance sheets not
improved after the crisis, FBHKs from UMP
countries would reduce their dollar loans more
significantly by 4.8% if the US Fed raises the
policy rate by 100 basis points in the first
scenario, while the estimated decline in dollar
loans in the second scenario is larger at 9.5%.
Page 82

Conclusion
Our study finds that the Hong Kong banking
sector is not immune from the inward spillover
of monetary policy. In particular, FBHKs’ cross-
border funding linkages with UMP countries are
one significant channel through which the
supply of dollar loans could be affected by
monetary policy tightening in UMP countries.
Yet, our empirical results suggest that the
potential impact on the supply of dollar loans
would be much smaller than before because of
the notable post-crisis improvement in FBHKs’
capitalisation and funding structure. Looking
ahead, the stronger balance sheet of FBHKs may
help reduce the risk of a sharp disruption in the
supply of dollar loans in the Hong Kong banking
sector when major advanced economies
eventually unwind their unconventional
monetary policies.
Page 83

Glossary of terms
Aggregate Balance
The sum of balances in the clearing accounts and reserve accounts maintained by commercial banks with
the central bank. In Hong Kong, this refers to the sum of the balances in the clearing accounts maintained
by the banks with the HKMA for settling interbank payments and payments between banks and the HKMA.
The Aggregate Balance represents the level of interbank liquidity, and is a part of the Monetary Base.
Authorized Institution (AI)
An institution authorized under the Banking Ordinance to carry on the business of taking deposits.
Hong Kong maintains a Three-tier Banking System, which comprises licensed banks, restricted licence banks
and deposit-taking companies.
Best Lending Rate
A benchmark interest rate that banks use to price loans. In Hong Kong, the Best Lending Rate is used as a
base for quoting interest rates on mortgage loans.
Certificates of Indebtedness (CIs)
Certificates issued by the Financial Secretary under the Exchange Fund Ordinance, to be held by
note-issuing banks as cover for the banknotes they issue.
Composite Consumer Price Index (CCPI)
The headline consumer price index (CPI) for Hong Kong. The Census and Statistics Department compiles
three separate CPI series relating to households in different expenditure ranges. The CPI(A) relates to about
50% of households in the relatively low expenditure range; the CPI(B) relates to the next 30% of households
in the medium expenditure range; and the CPI(C) relates to the next 10% of households in the relatively
high expenditure range. The Composite CPI is compiled based on the aggregate expenditure pattern of all
of the above households taken together.
Composite Interest Rate
The composite interest rate is a weighted average interest rate of all Hong Kong dollar interest bearing
liabilities, which include deposits from customers, amounts due to banks, negotiable certificates of deposit
and other debt instruments, and Hong Kong dollar non-interest bearing demand deposits on the books of
banks. Data from retail banks, which account for about 90% of the total customers’ deposits in the banking
sector, are used in the calculation. It should be noted that the composite interest rate represents only
average interest expenses. There are various other costs involved in the making of a loan, such as operating
costs (e.g. staff and rental expenses), credit cost and hedging cost, which are not covered by the composite
interest rate.
Convertibility Undertaking (CU)
An undertaking by a central bank or currency board to convert domestic currency into foreign currency and
vice versa at a fixed exchange rate. In Hong Kong, the HKMA operates Convertibility Undertakings on both
the strong side and the weak side. Under the strong-side Convertibility Undertaking, the HKMA undertakes
Page 84

to buy US dollars from licensed banks at 7.75. Under the weak-side Convertibility Undertaking, the HKMA
undertakes to sell US dollars at 7.85. Within the Convertibility Zone between 7.75 and 7.85, the HKMA may
choose to conduct market operations consistent with Currency Board principles with the aim of promoting
the smooth functioning of the money and foreign exchange markets.
Convertibility Zone
The Hong Kong dollar-US dollar exchange rate band, defined by the levels of the strong- and weak-side
Convertibility Undertakings, within which the HKMA may choose to conduct market operations consistent
with Currency Board principles.
Exchange Fund Bills and Notes (EFBN)
Debt instruments issued by the HKMA for the account of the Exchange Fund. These instruments are fully
backed by the foreign reserves. The HKMA has undertaken that new Exchange Fund paper will only be
issued when there is an inflow of funds, thus enabling the additional paper to be fully backed by the foreign
reserves. Since 1 April 1999, interest payments on Exchange Fund paper have been allowed to expand the
Monetary Base. Additional Exchange Fund paper is issued to absorb such interest payments. This is
consistent with the Currency Board discipline since interest payments on Exchange Fund paper are backed
by interest income on the US dollar assets backing the Monetary Base.
Monetary Base
A part of the monetary liabilities of a central bank. The monetary base is defined, at the minimum, as the
sum of the currency in circulation (banknotes and coins) and the balance of the banking system held with
the central bank (the reserve balance or the clearing balance). In Hong Kong, the Monetary Base comprises
Certificates of Indebtedness (for backing the banknotes issued by the note-issuing banks), government-issued
currency in circulation, the balance of the clearing accounts of banks kept with the HKMA, and Exchange
Fund Bills and Notes.
Nominal and Real Effective Exchange Rate (NEER and REER)
An indicator of the overall exchange rate value of the Hong Kong dollar against a basket of currencies of
Hong Kong’s principal trading partners. The nominal effective exchange rate (NEER) is a weighted average of
the exchange rates between Hong Kong and its principal trading partners. The real effective exchange rate
(REER) is obtained by adjusting the NEER for relative movements in the seasonally adjusted consumer price
indices of those selected trading partners.
Page 85

Abbreviations
3m moving average Three-month moving average
3m-on-3m Three-month-on-three-month
AEs Advanced economies
AFC Asian Financial Crisis
ASEAN Association of Southeast Asian Nations
AIs Authorized Institutions
BIS Bank for International Settlements
bn Billion
BLR Best lending rate
BoJ Bank of Japan
BoP Balance of Payments
BSD Buyer’s stamp duty
CAPE Cyclically-adjusted price-to-earnings
CAR Capital Adequacy Ratio
CBRC China Banking Regulatory Commission
CCPI Composite Consumer Price Index
CCyB Countercyclical capital buffer
CDs Certificates of deposits
CDS Credit default swap
CET1 Common equity tier-one
CFETS China Foreign Exchange Trade System
ChiNext The start-ups board in the Shenzhen Stock Exchange
CIs Certificates of Indebtedness
CNH Offshore renminbi in Hong Kong
CNY Onshore renminbi
C&SD Census and Statistics Department
CPI Consumer Price Index
CU Convertibility Undertaking
DF Deliverable forward
DI Direct investment
DSD Doubling of the ad valorem stamp duty rates
Page 86

DSR Debt-servicing ratio
ECB European Central Bank
EFBNs Exchange Fund Bills and Notes
EMEs Emerging Market Economies
EPIFs External primary income flows
EPU Economic policy uncertainty
ETFs Exchange traded funds
EU European Union
EUR Euro
FDI Foreign direct investment
Fed Federal Reserve
FOMC Federal Open Market Committee
FSB Financial Stability Board
FX Foreign exchange
GBs Government Bonds
GDP Gross Domestic Product
GFC Global Financial Crisis
G-SIBs Global systemically important banks
HIBOR Hong Kong Interbank Offered Rate
HK Hong Kong
HKD Hong Kong dollar
HKEx The Hong Kong Exchanges and Clearing Limited
HKMA Hong Kong Monetary Authority
HK$M3 Hong Kong dollar broad money supply
HSCEI Hang Seng China Enterprises Index
HSI Hang Seng Index
IFC International Finance Corporation
IMF International Monetary Fund
IPO Initial Public Offering
IT Information technology
LCR Liquidity Coverage Ratio
LEI Composite index of leading economic indicators
LIBOR London Interbank Offered Rate
LERS Linked Exchange Rate System
LMR Liquidity Maintenance Ratio
lhs Left-hand scale
Page 87

IRB Internal Ratings-Based Approach
LTD Loan-to-deposit
LTV Loan-to-value
mn Million
MDBs Multilateral Development Banks
MLF Medium-term Lending Facility
MPA Macro Prudential Assessment
MRF Mutual Recognition of Funds
MSCI Morgan Stanley Capital International
MTN Medium-term Note
NBER National Bureau of Economic Research
NBS National Bureau of Statistics
NCD Negotiable certificate of deposit
NEER Nominal effective exchange rate
NIE Newly industrialised economies
NIM Net interest margin
NPL Non-performing loan
OIS Overnight indexed swap
OTC Over-the-counter
p.a. Per annum
P2P Peer-to-peer
PBoC People’s Bank of China
PMI Purchasing Managers’ Index
PPI Producer Price Index
PSL Pledged Supplementary Lending
qoq Quarter-on-quarter
qoqa Quarter-on-quarter annualised
QE Quantitative Easing
QQE Quantitative and Qualitative Easing
R&VD Rating and Valuation Department
REER Real effective exchange rate
Repo Repurchase operation
rhs Right-hand scale
RMB Renminbi
RQFII Renminbi Qualified Foreign Institutional Investor
RTGS Real time gross settlement
Page 88

SAFE State Administration of Foreign Exchange
SDR Special Drawing Rights
SHIBOR Shanghai Interbank Offered Rate
SKEW Chicago Board Options Exchange Skew Index
SLO Short-term Liquidity operation
SME Small and medium-sized enterprise
SOEs State-owned enterprises
SPM Supervisory Policy Manual
SSD Special stamp duty
SSE Shanghai Stock Exchange
SWIFTs Society for Worldwide Interbank Financial
Telecommunication
S&P Sale and Purchase Agreements of Building Units
S&P 500 Standard & Poor’s 500 Index
TLTRO Targeted Longer-Term Refinancing Operation
TWI Trade Weighted Index
UK United Kingdom
US United States
USD US dollar
VAR Vector autoregressive
VHSI HSI Volatility Index
VIX Chicago Board Options Exchange Market Volatility Index
WMPs Wealth management products
yoy Year-on-year
Page 89


©2017 Hong Kong Monetary Authority
Reproduction for non-commercial
purposes is permitted provided that the
source is properly stated.
Full text of this Report is available on the
HKMA website at www.hkma.gov.hk.
Hong Kong Monetary Authority55th Floor, Two International Finance Centre,
8 Finance Street, Central, Hong Kong
Telephone: (852) 2878 8196
Fax: (852) 2878 8197
E-mail: [email protected]
www.hkma.gov.hk
Printed in Hong Kong
ISSN 2221-5727 (Print version)
ISSN 2222-1514 (Online version)
HK$60