haiti sustainable energy roadmap - worldwatch institute · haiti sustainable energy roadmap...
TRANSCRIPT

Haiti Sustainable Energy RoadmapHarnessing Domestic Energy Resources to Build a Reliable,
Affordable, and Climate-Compatible Electricity System
November 2014
Ministère des Travaux Publics, Transports, Énergie et
Communications
Project Director: Alexander Ochs
Project Manager: Mark Konold
Report Authors: Matthew Lucky, Katie Auth, Alexander Ochs, Xing Fu-Bertaux, Michael Weber, Mark Konold, Jiemei Lu
Editor: Lisa Mastny
Typesetting and Layout: Lyle Rosbotham
This project is part of the International Climate Initiative. The Federal Ministry for the Environment, Nature Conservation and Nuclear Safety supports this initiative on the basis of a decision adopted by the German Bundestag.
The views expressed are those of the authors and do not necessarily represent those of the Worldwatch Institute; of its directors, officers, or staff; or of its funding organizations.
Suggested Citation: Matthew Lucky, Katie Auth, Alexander Ochs, et al., Haiti Sustainable Energy Roadmap: Harnessing Domestic Energy Resources to Build an Affordable, Reliable, and Climate-Compatible Electricity System (Washington, DC: Worldwatch Institute, 2014).
On the cover: Mirebalais Hospital, Mirebalais, Haiti. Photo courtesy of Matthew Lucky.
© 2014 Worldwatch Institute, Washington, D.C.

Haiti Sustainable Energy RoadmapHarnessing Domestic Energy Resources to Build a Reliable,
Affordable, and Climate-Compatible Electricity System
Worldwatch InstituteWashington, D.C.November 2014
Ministère des Travaux Publics, Transports, Énergie et
Communications

2 | Haiti Sustainable Energy Roadmap
Foreword 9Preface 10Acknowledgments 11Executive Summary 12
1. A Sustainable Energy Roadmap for Haiti: Context, Goals, and Methodology. . . 21
1.1 Sustainable Energy and Climate Change: Haiti in the Global Context 221.2 Haiti’s Current Electricity System 241.3 The Role of Sustainable Power in Building Haiti’s Future 301.4 Methodology and Report Structure 32
2. Energy Efficiency in Haiti . . . . . . . . . . . . . . . . . . . . . . . . . . . . . . . . . . . . . . . . . . . . . . . . . . 35
2.1 The Importance of Efficiency for a Sustainable Energy System in Haiti 362.2 Improving the Efficiency of Existing Power Plants 372.3 Improving the Efficiency of Transmission and Distribution 392.4 Boosting the Industrial Sector’s Efficiency 392.5 Encouraging Efficient Household Electricity Consumption 40
2.5.1 Appliance Labeling 40
2.5.2 Lighting 42
2.6 Increasing Efficiency in Buildings 432.7 Increasing Efficiency in Hotels 442.8 Summary 45
3. Haiti’s Renewable Energy Potential . . . . . . . . . . . . . . . . . . . . . . . . . . . . . . . . . . . . . . . . 47
3.1 Building on Existing Assessments 483.2 Solar Power Potential 49
3.2.1 The Global Solar Power Success Story 49
3.2.2 Current Status of Solar Energy in Haiti 50
3.2.3 Haiti’s Impressive Solar Energy Potential 50
3.2.4 Positive Effects of Wind and Temperature on Solar Energy Potential 54
3.2.5 Summary of Solar Energy Potential 55
3.3 Wind Energy Potential 563.3.1 Global Status of Wind Energy 56
Contents

Contents | 3
3.3.2 Current Status of Wind Energy in Haiti 57
3.3.3 Wind Energy Potential 57
3.3.4 Wind Resource by Zone 57
3.3.5 Summary of Wind Energy Potential 58
3.4 Hydropower Potential 623.4.1 Global Status of Hydropower Technology 62
3.4.2 Current Status of Hydropower in Haiti 62
3.4.3 Hydropower Potential 63
3.4.4 Ouest Resource Assessment 64
3.4.5 Summary of Hydropower Potential 64
3.5 Biomass Energy Potential 643.5.1 Global Status of Biomass Energy Technology 64
3.5.2 Current Status of Biomass Energy in Haiti 66
3.5.3 Biomass Energy Potential 66
3.5.4 Summary of Biomass Energy 67
3.6 Waste-to-Energy Potential 683.6.1 Global Status of Waste-to-Energy Technology 68
3.6.2 Current Status of Waste-to-Energy in Haiti 68
3.6.3 Waste-to-Energy Potential 68
3.6.4 Summary of Waste-to-Energy Potential 69
3.7 Alternative Renewable Energy Technologies 693.7.1 Wave and Tidal Energy 70
3.7.2 Geothermal Energy 70
3.8 Summary 71
4. Grid Improvement and Energy Storage . . . . . . . . . . . . . . . . . . . . . . . . . . . . . . . . . . . . 72
4.1 Overview of Haiti’s Existing Grid 734.2 Decentralized/Distributed Generation 73
4.2.1 Minigrids for Rural Electrification 74
4.3 Grid Connection and Integration for Centralized Generation 774.4 Integrating Complementary Renewable Energy Resources 804.5 Operations, Markets, and Forecasting 834.6 Role of Oil and Natural Gas in Offsetting Variability 854.7 Electricity Storage 874.8 Curtailment 874.9 Grid Interconnection with the Dominican Republic 904.10 Summary 91
5. Technological Pathways for Meeting Haiti’s Future Electricity Demand . . . . . . . 93
5.1 Demand Projections 94

4 | Haiti Sustainable Energy Roadmap
5.2 Scenario Types 965.3 Scenario Results: Yearly Analysis 965.4 Scenario Results: Hourly Analysis 985.5 Conclusion 102
6. Assessing the Socioeconomic Impacts of Alternative Electricity Pathways . . . 103
6.1 Analyzing the Levelized Costs of Electricity Generation 1046.1.1 Methodology 104
6.1.2 Results 105
6.2 LCOE+: Assessing the Full Costs of Alternative Electricity Sources 1076.2.1 Methodology 107
6.2.2 Costs of Local Pollutants 107
6.2.3 Costs of Global Climate Change 108
6.2.4 Results 109
6.3 LCOE Projection: The Future Costs of Electricity Generation 1116.3.1 Methodology 111
6.3.2 Results 111
6.4 Macroeconomic Impacts: Benefits of a Transition to Renewable-Based Electricity Systems 112
6.4.1 Falling Costs of Electricity Generation 112
6.4.2 Saving Billions on Reduced Fossil Fuel Imports 113
6.4.3 Investment versus Total Cost of Electricity: Upfront Costs but Long-term Savings 115
6.4.4 Greenhouse Gas Emissions Savings 117
6.4.5 Job Creation 118
6.4.6 Impact on Economic Sectors 121
6.5 Conclusion 121
7. Overcoming Barriers to Financing Sustainable Energy in Haiti . . . . . . . . . . . . . . 123
7.1 Underlying Investment Risks in Haiti 1257.1.1 Lack of Adequate National Infrastructure 125
7.1.2 Unclear Property Rights 125
7.1.3 Frequent Political Instability 126
7.1.4 Risk of Natural Disaster 126
7.1.5 Security Risks 126
7.1.6 Overall Investment Climate 126
7.2 Ways to Address Sector-Specific Barriers 1277.2.1 Strengthening the Ability of Commercial Banks to Provide Sustainable Energy Finance 127
7.2.2 Bundling Projects to Lower the Per-unit Costs of Sustainable Energy 131
7.2.3 Ensuring Cash Recovery for Electricity Generators 131
7.2.4 Creating Working Microloan Programs 132

Contents | 5
7.3 Finding New Sources for Sustainable Energy Finance 1337.3.1 Directing Development Assistance to Sustainable Energy Projects 133
7.3.2 Attracting Climate Finance 135
7.3.3 Using PetroCaribe Funds 138
7.3.4 Finding Creative Ways to Provide Sovereign Guarantees 139
7.3.5 Creating Additional Innovative Financing Mechanisms 140
7.4 Implementing Working Rural Electrification Business Models in Haiti 1417.5 Conclusion 142
8. Building an Effective Policy Framework to Harness Sustainable Energy Opportunities in Haiti. . . . . . . . . . . . . . . . . . . . . . . . . . . . . . . . . . . . . . . . . . . . . . . . . . . . 144
8.1 Identifying Appropriate and Ambitious Sustainable Energy Priorities 1458.2 Establishing an Effective and Ambitious Vision for Sustainable Energy Development 145
8.2.1 Haiti’s Current Energy Vision 145
8.2.2 Emphasizing a Clear Intention to Prioritize Sustainable Energy and Distributed Generation 147
8.2.3 Adopting Ambitious, Official Sustainable Energy Targets 148
8.2.4 Synthesizing the Vision Across All Relevant Institutions and Sectors 148
8.2.5 Finalizing and Officially Adopting a National Energy Policy 149
8.3 Improving Institutional Capacity and Administrative Effectiveness 1498.3.1 Existing Energy Sector Institutions and Administration in Haiti 150
8.3.2 Mainstreaming Sustainable Energy and Enhancing Coordination Among Government Actors 151
8.3.3 Strengthening the Institutional Structure, Including by Adding Key Institutions 152
8.3.4 Creating Clear, Transparent Processes That Facilitate Communication, Investment, and Smart Policy 154
8.4 Implementing Effective, Targeted Support Policies and Mechanisms 1558.4.1 Current Status of Sustainable Energy Policies and Mechanisms in Haiti 155
8.4.2 Designing a Policy Mix to Improve Energy Efficiency 156
8.4.3 Designing a Policy Mix to Accelerate Renewable Energy Deployment 157
8.5 Conclusion 162
9. Haiti’s Energy Outlook: Building a Sustainable Energy System . . . . . . . . . . . . . . 163
Endnotes . . . . . . . . . . . . . . . . . . . . . . . . . . . . . . . . . . . . . . . . . . . . . . . . . . . . . . . . . . . . . . . . . . 166
Appendices (begin after page 180)
Appendix I. Summary of Past Renewable Energy Resource AssessmentsAppendix II. 3TIER Solar Assessment MethodologyAppendix III. Solar Assessments by ZoneAppendix IV. 3TIER Wind Assessment MethodologyAppendix V. Wind Assessment by ZoneAppendix VI. Hydropower Assessment by Department

6 | Haiti Sustainable Energy Roadmap
Appendix VII. Pumped-Storage Hydro in El HierroAppendix VIII. International Financing InstitutionsAppendix IX. International Rural Electrification Program Best Practices
Figures, Tables, Sidebars, and Case StudiesFigure 1.1. Share of Electricity Generation by Source, 2011 25Figure 1.2. Residential Tariff Rates in the CARILEC Region, 2009 27Figure 1.3. Industrial Tariff Rates in the CARILEC Region, 2009 27Figure 1.4. Human Development, Gross National Income, and Electricity Consumption in Select Latin
American Countries, 2011 31Figure 1.5. Worldwatch Methodology for Sustainable Energy Roadmap Development 33Figure 2.1. Electricity Consumption Compared to Per Capita GDP in Latin America and the Caribbean, 2010 38Figure 2.2. Share of Electricity Consumption in Haiti, by Sector, 2011 38Figure 2.3. Share of Residential Electricity Consumption in Haiti, by Appliance Type, 2006 41Figure 3.1. Average Global Horizontal Irradiance (GHI) in Haiti 52Figure 3.2. Map of 3TIER Solar Resource Assessment Locations in Haiti 52Figure 3.3. Comparison of Monthly Average GHI, Six Haitian Zones versus Germany 53Figure 3.4. Average Long-Term DHI and DNI in Les Cayes, 1997–2011 53Figure 3.5. Seasonal and Diurnal Variability of GHI and DNI at Les Cayes 54Figure 3.6. Average Wind Speeds in Haiti at 80 Meters 57Figure 3.7. Map of 3TIER Wind Resource Assessment Locations in Haiti 58Figure 3.8. Average Wind Speed at Lac Azuéi 59Figure 3.9. Seasonal Variation in Wind Power Capacity Factor in Lac Azuéi 60Figure 3.10. Diurnal Variation in Wind Power Capacity Factor in Lac Azuéi 60Figure 3.11. Municipal Solid Waste Profile in Haiti 69Figure 4.1. Electricity Production, Consumption, and Losses in Haiti, 1971–2010 73Figure 4.2. Cost Estimates of Grid Connection in Haiti 77Figure 4.3. Diurnal Variability of Wind in the Six Haitian Zones 81Figure 4.4. Seasonal Variability of Wind in the Six Haitian Zones 81Figure 4.5. Seasonal and Diurnal Variation of Solar at Les Cayes 82Figure 4.6. Seasonal Variability of Hydro in Haiti 83Figure 5.1. Projections for Electricity Demand in Haiti, 2010–2030 94Figure 5.2. Projections for Peak Electricity Demand in Haiti, 2010–2030 95Figure 5.3. Energy Demand and Generation Under All Scenarios, 2013–2030 97Figure 5.4. Peak Demand and Installed Capacity Under Scenario 4 98Figure 5.5. Hourly Load Analysis Under Scenario 1 100Figure 5.6. Hourly Load Analysis Under Scenario 2 100Figure 5.7. Hourly Load Analysis Under Scenario 3 101Figure 5.8. Hourly Load Analysis Under Scenario 4 101Figure 6.1. Levelized Cost of Electricity for Haiti (Capital, O&M, and Fuel Costs) 106Figure 6.2. LCOE for Haiti with External Costs (Local Air Pollution and Climate Change) 110Figure 6.3. Haiti LCOE Projection to 2030 111Figure 6.4. Average LCOE in 2030 Under All Scenarios 112Figure 6.5. Average Annual LCOE for All Scenarios 114
Contents | 7
Figure 6.6. Cumulative Fuel Costs and Savings to 2030 Under All Scenarios 114Figure 6.7. Total Annual Costs of Electricity Generation for Each Scenario 115Figure 6.8. Total Investment, Generation Cost, and Savings to 2030 Under All Scenarios 116Figure 6.9. Projected Annual Greenhouse Gas Emissions for All Scenarios, 2015–2030 117Figure 6.10. Cumulative CO2-equivalent Emissions to 2030 Under All Scenarios 118Figure 6.11. Direct Jobs in the Power Plant Lifecycle Value Chain 119Figure 6.12. Global Job Creation Estimates for Various Power Generation Sources 119Figure 6.13. LCOE and Job Creation Estimates for Various Power Generation Sources 120Figure 6.14. Total Jobs Created by 2030 Under All Scenarios 121Figure 7.1. Impact of Interest Rates on Financing Costs for a Utility-Scale Wind Farm 128Figure 7.2. Earthquake Recovery Grant Activities by Sector 135
Table 1.1. Overview of Haiti’s Existing Power Plant Fleet 25Table 1.2. Electricity Prices in Haiti, 2012 26Table 1.3. Haiti’s Largest Existing and Planned Renewable Energy Projects 28Table 2.1. Residential Electricity Consumption in Haiti, by Appliance Type 41Table 2.2. Potential Energy and Cost Savings from Switching Lighting Technologies in Haiti 43Table 2.3. Savings from Installing Energy Efficiency Equipment in Hotels in the Caribbean 46Table 3.1. Potential Gross Annual Solar PV Module Yields in the Six Haitian Zones 55Table 3.2. Effects of Wind and Temperature on Solar PV Module Yields in the Six Haitian Zones 56Table 3.3. Average Wind Speed and Capacity Factor in the Six Haitian Zones 61Table 3.4. Summary of Wind Energy Potential in Haiti 61Table 3.5. Summary of Hydropower Potential in Haiti 63Table 3.6. Hydropower Potential in the Ouest Département 64Table 3.7. Sugarcane Bagasse Cogeneration Potential in Haiti 66Table 3.8. Municipal Solid Waste Potential in Haiti 68Table 4.1. Ongoing Grid Improvement Projects in Haiti 74Table 4.2. Summary of Seasonal Renewable Energy Variability 83Table 4.3. Scenarios for Haiti’s Power Supply, 2009–2028 86Table 4.4. Energy Storage Technology Options 88Table 5.1. Worldwatch Scenarios for a Renewable Energy Transition in Haiti by 2030 95Table 6.1. Carbon Dioxide Emissions and Emissions Intensities of 15 Caribbean Countries, 2009 109Table 7.1. Selected Business and Economic Competitiveness Indicators for Haiti 127Table 7.2. Haiti’s Financial Market Development Rankings in the GCI 129Table 7.3. Selected Internationally Financed Technical Assistance Projects in Haiti 134Table 7.4. Sample of De-risking Mechanisms for Renewable Energy Projects 138Table 7.5. PetroCaribe Financing Terms 139Table 7.6. Comparison of Minigrid Business Models 142Table 8.1. Electricity Sector Plans and Associated Targets 146Table 9.1. Next Steps for Haiti’s Sustainable Energy Transition 164
Sidebar 2.1. Supplying Efficient Cookstoves and Alternatives to Charcoal 36Sidebar 2.2. Lighting Options for Haiti 42Sidebar 2.3. Cool Roofs for Haiti 45Sidebar 3.1. Key Measurements of Irradiation and Their Application to Solar Resource Analysis 51

8 | Haiti Sustainable Energy Roadmap
Sidebar 4.1. Technical Challenges and Solutions Associated with Distributed Generation 75Sidebar 7.1. Financing Small-scale Low-carbon Energy Projects with International Climate Finance 137Sidebar 7.2. Standard Business Models for Rural Minigrids 141Sidebar 8.1. Subsidy Schemes for Electrification Programs 160
Case Study 1. Solar Self-Generation in Haiti: L’Hôpital Universitaire de Mirebalais 51Case Study 2. Les Cayes Zonal Assessment 53Case Study 3. Lac Azuéi Regional Assessment 59Case Study 4. The Potential for Integrating Wind and Solar into the Grid of Oahu, Hawaii 79Case Study 5. The Potential for Seawater Pumped-Storage Hydro 91Case Study 6. Partial Loan Guarantees for Chicken House Solar PV Systems in Jamaica 130Case Study 7. Best Practices for Rural Electrification Initiatives and Their Applicability in Haiti 161

Foreword | 9
With their soft white sand and pristine ocean waters, their swaying coconut trees and bright blue skies, small islands in the Caribbean are often compared to paradise. Yet they all struggle to attain the ideal supply of energy to serve their population.
Availability of energy is a critical issue for most countries in the world. More than that, it is an absolute necessity for small developing countries, as a driver for their growth and a contributor to social well-being. In these countries, the difficulty is compounded when special effort is devoted to include mainly clean renewable energy sources and technologies. For small-island nations, there is a mixed blessing: the dearth of conventional (fossil) energy resources is, in a way, compensated by an abundance of renewable energy sources. This should be exploited.
In the case of Haiti, there lie a number of additional challenges to reach the goal of sufficient energy for household, institutional, commercial, and industrial needs. The questions of accessibility, availability, quality, and cost must be dealt with, while additional efforts are made to mitigate any detrimental effects on human health and ecological preservation. The difficulties include: an inadequate legal framework, an insufficient pool of technical personnel, political interference, social instability, meager capital resources, and insufficient fiscal incentives.
The following Haiti Sustainable Energy Roadmap looks at options for integrating renewable resources as much as possible into the energy mix of the country, focusing on those that are most appropriate for the island nation. The model has been previously applied to different small countries. For each one, the best types of resources were identified and a roadmap for implementation was proposed. The best options for Haiti include: hydropower, solar energy, wind resources, biomass, and biofuels.
A Roadmap for the sustainable development of renewable energy resources in Haiti must be considered alongside options for conventional forms of energy. However, integration of renewables will most certainly bring to the small nation the drive of development, with certain relief from the burden of costly energy imports. For Haiti and other small-island nations, a Roadmap for optimal use of renewable energy might just be the path to their paradise.
René Jean-Jumeau Minister Delegate in Charge of Energy Security, Haiti Port-au-Prince, August 2014
Foreword

10 | Haiti Sustainable Energy Roadmap
There is hardly a place on Earth where the advantages and tremendous potential of domestic renewable power are as evident as in Haiti. Today, the country’s electricity system, which relies largely on dirty, expensive, and unreliable fossil fuel generators and an aging infrastructure, faces two urgent and interwoven challenges. First, it must develop the infrastructure needed to provide power to the three-quarters of Haitians currently without access to modern electricity services. Second, it must diversify its power supply to increase energy security and resilience to natural disasters and climate change.
Today, Haiti sends about 7% of its gross domestic product overseas for the import of fossil fuels each year, limiting the capital that can be invested domestically and exposing the country’s economy to a volatile global market and rising fuel costs. Erratic rainfall patterns and increased siltation from deforestation threaten hydropower production, highlighting the urgent need to diversify energy supply. The existing system is also vulnerable to natural disasters, such as the 2010 earthquake and the four major storms that hit the island in 2008. Such events are forecast to increase in frequency and intensity as a result of climate change.
In the absence of a centralized grid system, Haiti has an opportunity to leapfrog conventional energy development, modeling a pathway to electrification and resilience that harnesses the country’s strong biomass, small hydropower, solar, and wind resources. Already, household-level solar systems and minigrids are benefiting end-users and can—over time—be incorporated into regional power networks.
Access to affordable, reliable, and sustainable energy is a linchpin to human development. This Haiti Sustainable Energy Roadmap—developed in partnership with Haiti’s Bureau of the Minister Delegate to the Prime Minister for Energy Security—explores the issues involved in building a sustainable electricity system based on domestic energy resources and capable of providing modern electricity services to all Haitians. It assesses the potentials of renewable energy, energy efficiency, and grid solutions; analyzes the social and economic impacts of various electricity pathways; looks into financing opportunities; and suggests policy and institutional reforms that will make sustainable energy investments more attractive.
Haiti has already demonstrated its commitment to achieving a more diverse, sustainable energy supply. We will continue to support the government and civil society as they move forward. This Roadmap is dedicated to the citizens of Haiti and to all those individuals—including energy practitioners, policymakers, entrepreneurs, consumers, and academics—who volunteered their time and expertise to support this project. Let’s now move from plan to action!
Alexander OchsDirector of Climate and Energy, Worldwatch InstituteBerlin, November 2014
Preface

Acknowledgments | 11
Worldwatch Institute would like to thank the International Climate Initiative of the German Federal Ministry for the Environment, Nature Conservation and Nuclear Safety, whose financial support made this work possible. We are also deeply grateful for the support of our partners at the Haitian Bureau of the Minister Delegate to the Prime Minister for Energy Security, in particular Dr. René Jean-Jumeau.
The authors thank Nicolas Allien, Dr. Marc Archer, Galvin Clancey, Jean Fanfan Jourdain, Dr. René Jean-Jumeau, Andrew Morton, and his team at the United Nations Environment Programme, Francis Mitchell, Reginald J. Noel, and Lesly Theard, for their thorough review and insight on the report. Additional valuable input was provided by participants in interviews and in our stakeholder consultation workshops in Port-au-Prince. The insight and perspectives of all those who participated added tremendous value to this work.
The unparalleled solar and wind resource information provided by 3TIER forms an essential component of this project. We owe a debt of gratitude to Pascal Storck, Craig Husa, Cameron Potter, Gwen Bender, and Charlie Wise for their professionalism, support, and assistance.
At Worldwatch, we would like to thank Antoine Ebel, Shakuntala Makhijani, Evan Musolino, and Reese Rogers for their valuable review and contributions. Supriya Kumar and Gaelle Gourmelon supported vital outreach and communication efforts, and Barbara Fallin and Mary Redfern provided crucial administrative and institutional support. The excellent review by Worldwatch Senior Editor Lisa Mastny and layout work by independent designer Lyle Rosbotham ensured a polished final product.
Finally, we wish to thank the many additional experts and practitioners who cannot be named here but who supported this project in diverse ways—by sharing ideas, providing us with access to data, and encouraging our efforts along the way.
Acknowledgments

12 | Haiti Sustainable Energy Roadmap
Today marks a critical moment for Haiti’s energy system. The country’s electricity sector—plagued by low access rates, poor service quality, and inadequate capacity—stands at a crossroads.
Only 25% of the Haitian population has access to electricity, marking a key barrier to advances in human health, economic development, gender and social equality, and education. Electricity service is concentrated in and around the capital, Port-au-Prince, and remains unreliable even there; those with access to electricity receive power for an average of only five to nine hours per day. Haiti depends on imported petroleum for 85% of its electricity generation, exposing the country to rising fuel costs and diverting a significant portion of annual gross domestic product to importing a fuel that has destructive impacts on human health and the environment. In 2011, two-thirds of total electricity production was lost to technical inefficiencies or consumed by Haitians unable or unwilling to pay the utility, posing immense challenges to the sector’s financial viability.
In this Haiti Sustainable Energy Roadmap, Worldwatch Institute partnered with the Bureau of the Minister Delegate to the Prime Minister for Energy Security to assess the interconnected technical, socioeconomic, financial, and policy aspects of building a sustainable energy system. Tremendous opportunities exist to improve service and build an electricity system that is economically, socially, and environmentally sustainable. Haiti has abundant renewable energy resources, including solar, wind, and modern biomass, as well as a growing number of renewable energy practitioners. The government has committed to diversifying the country’s energy mix and expanding its use of renewable energy.
Although Haiti has contributed very little to the global rise in greenhouse gas emissions, it is one of the most vulnerable nations in the world to the impacts of climate change. Building a low-emissions electricity sector that efficiently harnesses indigenous renewable resources will improve access rates, increase energy security, and address a host of human and social needs. It will also provide a climate-resilient, low-emissions development model for other small-island developing states.
Improving Energy Efficiency
Haiti’s high electricity costs, significant technical and non-technical losses, and large suppressed demand mean that energy efficiency improvements could result in significant cost savings for the country. Improving the efficiency of power generation and reducing grid losses—both of which fall far short of international standards—are a crucial first step. Given that only 63% of Haiti’s total installed capacity is currently operational, efficiency upgrades and refurbishment projects at existing power plants can increase production and reduce energy costs in the near-to-medium term.
Executive Summary

An inefficient and overburdened grid system results in significant technical and non-technical losses during transmission and distribution, estimated at roughly 66% of total electricity production. Some 70% of these “losses” result from a combination of illegal connections and the limited capacity of the national utility, Electricité d’Haïti (EDH), to collect bills. Overall, EDH recovers only 22% of its generation costs, placing significant financial strain on the utility and limiting the resources available to maintain existing infrastructure. Addressing these issues will require strengthening the grid system, reforming the tariff structure, improving metering, and implementing anti-electricity theft legislation.
End-use efficiency improvements, for example through consumption standards for key sectors and appliances, can achieve significant additional energy savings. Because industry accounts for more than 40% of electricity consumption, measures targeted to improve industrial efficiency will play a key role in improving overall efficiency and spurring economic development. In 2010, all 23 registered textile manufacturers in Haiti had their own non-renewable power generators on site; promoting on-site renewable generation and improved efficiency would reduce costs and increase reliability for industrial consumers, resulting in stronger competitiveness. In the residential sector, natural ventilation systems and cool roofs offer low-cost and highly effective ways to reduce air conditioning needs in the commercial, public services, and residential sectors.
Appliance standards for lighting, refrigeration, and televisions should be targeted as high-impact interventions, especially as these appliances become more common. Switching to CFL or LED bulbs could reduce Haiti’s final electricity consumption by an estimated 9–10%. Efficiency upgrades in Haiti’s burgeoning hotel and tourism industry present a significant and largely untapped opportunity to reduce energy costs; adopting energy efficiency measures in Haitian hotels could save approximately 7 gigawatt-hours (GWh) and 5.1 kilotons of carbon dioxide (CO2) each year. Building codes are another suggested instrument to reduce electricity consumption.
Harnessing Renewable Energy Resources
Improving energy efficiency will help address the growing gap between energy supply and demand, but significant new power capacity will be needed to meet Haiti’s short- and long-term electricity needs. Haiti has very strong renewable energy potential. Renewable technologies available today could generate more electricity than the country currently consumes. Haiti’s solar resources are particularly strong and relatively consistent throughout the year. Only six square kilometers of solar photovoltaic (PV) panels would be able to generate as much electricity as Haiti produced in 2011. Distributed solar PV generation at the household and commercial levels is already playing an increasingly important role in Haiti, and is far from its full potential. Major energy consumers such as Mirebalais Hospital are demonstrating the feasibility of meeting large-scale energy needs with solar and of feeding excess power into the local grid.
Several locations in Haiti have extremely strong wind energy potential. Although wind potential varies throughout the day and year, several locations—particularly Lac Azuéi to the east of Port-au-Prince—could support economical wind power generation even during relative wind speed lows. Just a few medium-sized wind farms near Lac Azuéi could generate as much electricity as Haiti currently produces.
By developing small and micro-hydropower, Haiti could add at least 102 megawatts (MW) of power
Executive Summary | 13

14 | Haiti Sustainable Energy Roadmap
capacity, producing up to 896 GWh of electricity each year. Several of the country’s most promising sites are located near Port-au-Prince, presenting opportunities to supply large populations at relatively low cost.
Modern biomass generation presents additional opportunities. Haiti could install an additional 10–14 MW of new bagasse cogeneration capacity, producing as much as 7% of Haiti’s generation in 2011 while reducing agricultural waste. Given the country’s degraded soil, jatropha presents opportunities to replace charcoal demand without displacing food crops. If Port-au-Prince could improve its waste collection rate to 40%, the city could generate enough municipal solid waste to fuel a 12 MW power plant.
Although Haiti’s geothermal resources are not suited for electricity production, geothermal cooling systems could be used in government buildings and hotels. Ocean energy technologies, such as wave and tidal or ocean thermal energy conversion, currently present significant cost barriers but could play a role in the future.
Building Reliable and Affordable Electricity Grids
Haiti has no nationwide electricity grid, creating both challenges and opportunities. Haiti’s nine isolated electricity grids—covering major population centers, including Port-au-Prince, Saint-Marc, Jacmel, Les Cayes, and Cap-Haïtien—require significant upgrades to reduce transmission losses and increase the number of people and businesses served. Although the current lack of infrastructure makes it difficult to expand existing grids, it also means that Haiti is not locked into any one system. Decentralized electricity systems built on local resources offer an alternative model that would allow the country to leapfrog the conventional energy development pathway. A strategy focused on domestic and distributed generation arguably would have a much more immediate impact on the lives of those who live in areas currently without grid access.
Renewable minigrids, along with household and commercial-scale rooftop solar PV systems, can improve access while reducing power system inefficiency by avoiding grid losses. The technical challenges associated with distributed generation, such as unintentional islanding and voltage fluctuations, can be addressed using well-established technologies, operating standards, and regulatory best practices. A distributed electricity system based on renewable energy will be more resilient to earthquakes as well as to climate change impacts, including increased intensity of tropical storms—to which Haiti is particularly vulnerable—and extended periods of drought.
Existing diesel and fuel oil power plants can be quickly fired up and down in response to fluctuations in solar and wind generation. Integrating multiple renewable energy resources—hydro, solar, and wind—in different geographic locations can further reduce renewable intermittency issues and smooth out daily and seasonal variability. Wind and solar energy in Haiti complement each other well, although smart integrated resource planning will be needed to secure consistent generation, particularly in the winter months. Baseload power (e.g., from biomass, waste, and hydro resources) and electricity storage options (especially batteries and pumped hydro systems) can be paired with renewable energy capacity to make electricity supply reliable at all times, including peak hours. Liquefied natural gas could also complement a renewable system, but should not be pursued at the expense of renewable technologies.

Executive Summary | 15
Although potential interconnection with the Dominican Republic presents opportunities to improve energy security and expand the electricity market in both countries, it also poses technical and social challenges that require further analysis. Discussion of this possibility should continue, especially as the Caribbean region explores greater interconnection.
Assessing the Socioeconomic Impacts of Alternative Electricity Scenarios
If the necessary grid improvements and distributed generation developments are implemented, renewable energy can reliably meet more than 90% of Haiti’s electricity demand while lowering energy costs. In this Roadmap, several scenarios for scaling up renewable electricity through 2030 have been developed.
Investments in new coal plants would ultimately limit the amount of renewable energy that can be integrated into the system. Natural gas and oil-based generation plants are more flexible solutions, with fast ramp rates and lower minimum operating levels, allowing a smoother integration of larger renewable energy shares. While liquefied natural gas could potentially complement renewable generation, the scale of infrastructure development required to make it economically feasible may preclude development of other renewables. Simultaneous investments in new coal, natural gas, and renewable power will limit the amount of renewable energy that the system can integrate and will raise profitability concerns for many power plants.
The technical resource assessments in this Roadmap serve as a basis to model the costs of electricity production from various energy sources from 2013 through 2030. Based on findings from this socioeconomic assessment, renewable energy can enable Haiti to extend energy access, lower electricity prices, increase energy security, decrease the country’s trade deficit, create jobs, and reduce greenhouse gas emissions and local pollution—all at negative costs. A business-as-usual approach is not a feasible expansion option in Haiti. Meeting growing demand by increasing reliance on fossil fuels is the more expensive option; it would also make Haiti’s economy increasingly susceptible to price shocks and would further constrain growth.
Hydropower is currently the country’s cheapest source of electricity generation (5 U.S. cents per kWh). Wind and solar PV in good locations (approx. 11 U.S. cents per kWh) are fully competitive with coal power, the cheapest conventional power source, even without internalizing societal costs associated with fossil fuel combustion. The cost of renewables is expected to decrease further in coming years, with solar PV likely to become the cheapest renewable generation source by 2020. On the contrary, the operational costs of oil, natural gas, and coal-fired plants are projected to increase.
Once external health, environmental, and climate change costs of fossil fuel generation are factored in, the economic case for all renewable energy sources becomes even stronger. Including local pollution and climate change costs, a kWh generated by wind power is less than one-fifth the generation costs of oil combustion turbines and about one-fourth that of diesel generators. Coal power has enormous negative impacts on local pollution and climate change, tripling its generation costs.
Building an electricity system powered almost exclusively by renewables would have a broad variety of social benefits, making this a top development priority. It would decrease the average cost of electricity by 15 U.S. cents per kWh, from 25 to 10 U.S. cents. Our highest renewable energy scenario shows the highest

16 | Haiti Sustainable Energy Roadmap
costs savings by 2030, saving Haiti up to USD 5.84 billion by 2030. It would also create up to 1,870 new jobs, reduce local air and water pollution, improve health and education through expanded electricity access, and position the country as a leader in climate change mitigation and adaptation, reducing greenhouse gas emissions in the electricity sector by as much as 22.2 million tons of CO2-equivalent by 2030.
Financing a Sustainable Energy System in Haiti
While an energy system built on intelligent grid solutions, high efficiency, and renewable resources promises enormous development benefits, substantial investments are needed to implement it. Our cost analyses demonstrate that Haiti could reach 90% renewable electricity generation by 2030 with less than USD 7 billion in investment costs between 2013 and 2030. However, a number of underlying factors—including limited national infrastructure, disputed land ownership, and a history of political instability, natural disasters, and insecurity—contribute to international actors’ general hesitation to invest in the country. Haiti fares low in all major investment indexes, and Bloomberg New Energy Finance’s Climatescope report ranks the country 22nd of 26 Latin American countries in terms of its green investment climate. High perceived risk of sustainable energy technologies themselves, often misguided, acts as an additional barrier to required investment.
Domestically, perceived risk and a lack of institutional and finance capacity in Haitian banks contribute to high interest rates and a lack of long-term loans specifically tailored to sustainable energy projects. Human resource building and well-designed loan programs need to go hand in hand to support interested investors. Microfinance institutions exist but can be strengthened to fit the sustainable energy sector. Partnerships with finance organizations that have experience in sustainable energy could provide financial, technical, and human support to microfinance institutions in Haiti.
In Haiti’s relatively small market, it is often difficult to build a single renewable energy project at the scale required to make initial investment profitable. Creating greater economies of scale through bundling multiple renewable energy projects together—or combining a renewable project with related development projects in education, health, or telecommunications—could help reduce financing and capital costs while leveraging greater private investment.
Most private international finance institutions do not provide sustainable energy loans in Haiti without assurance through a sovereign guarantee that debts will be repaid. Loan guarantees and significant improvements in the electricity sector’s credit rating would contribute to a more stable investment climate. Ensuring cash recovery for generators through fair electricity tariffs and fewer transmission and distribution losses can increase the quality of energy services and encourage more investment in sustainable energy projects. An examination of other countries with comparatively poor overall investment climates that have successfully attracted investment in the renewables sector, such as Nicaragua, can provide insight into how this might be achieved in Haiti.
Bilateral and multilateral development assistance increasingly targets sustainable energy. Haiti should harness these resources to establish energy efficiency and renewable energy programs. Climate financing, including through the Green Climate Fund, the Clean Development Mechanism, and Nationally Appropriate Mitigation Actions, has the potential to provide major support for Haiti’s energy transition.

Executive Summary | 17
Climate financing could also replace sovereign guarantees as a form of investment security to lower the risk for potential investors. Additionally, savings from the PetroCaribe fund could be used to provide low-interest, long-term loans for sustainable energy projects.
Nearly USD 2 billion is sent to Haiti each year in remittances from members of the Haitian diaspora; an estimated 10–25% of all remittances to Haiti and the Dominican Republic end up being used to pay for some form of fuel, mainly kerosene and petrol. Harnessing a portion of remittances for clean energy projects through hometown associations, online lending platforms, or programs like Arc Finance could have a significant positive impact. When pooled, remittances could finance minigrids or other major sustainable energy projects in specific communities or could provide the necessary financial leverage required to get larger investors involved. Implementing working rural electrification business models will be key to building sustainable energy systems across Haiti. Several business models have proved successful internationally in creating and maintaining minigrids and could serve as important examples for the country.
Implementing Policy and Institutional Reform
Although capacity building and creative financing solutions can increase investment in sustainable energy solutions, certain barriers to achieving a transition to sustainable energy in Haiti can only be overcome through policy and governance reform. Haiti should establish a long-term vision that articulates a clear intent to develop a highly efficient and sustainable energy sector, focuses on distributed renewable generation models, and sets ambitious and mandatory energy targets. This framework for action should take into account projected energy needs and growth targets across all economic sectors, the potential for renewables and efficiency, and economic models, including levelized cost of electricity and scenario analyses. Once agreed upon, it must be made explicit, articulated consistently across all relevant government institutions, and reflected in all relevant policies.
The government of Haiti needs to address, with concrete policies and measures, the institutional and regulatory barriers that currently stand in the way of rapidly expanding sustainable energy access. Building capacity at EDH and in ministries relevant to the energy sector must become a major focus. The role of the Minister Delegate to the Prime Minister for Energy Security should be strengthened, and participation in energy planning should be extended to all relevant ministries in order to mainstream energy priorities throughout the government. Haiti should establish an independent electricity regulator, improve oversight of the national utility and third-party power producers, and facilitate transparent, explicit terms of agreement between them. Lengthy and onerous permitting procedures for sustainable energy projects should be streamlined to reduce time and costs. International funders, organizations, and actors should make a concerted effort to work more closely with each other and coordinate with the Haitian government, ensuring that their priorities and projects align with Haiti’s development needs, including its energy goals.
To address Haiti’s extremely low electrification rate, the government should create a Rural Electrification Agency dedicated specifically to rural energy issues. This office could help relieve EDH’s regulatory burden and monitor quality of service in specific areas, making rural electrification programs and businesses profitable in the long term. Coupling rural electrification and minigrid development with

18 | Haiti Sustainable Energy Roadmap
income-generating activities can make energy development more cost effective and directly support local economic development. Adapting the Haitian Investment Code and the Centre de Facilitation d’Investissement to incentivize renewable development would further improve financing opportunities.
The country needs to reform existing policies and, where necessary, create new ones to support sustainable energy solutions. Efficiency codes and tax incentives to promote energy audits in the industrial and commercial sectors would promote more-efficient energy consumption. To reduce electricity theft, the Haitian government should finalize and implement a revised electricity theft law and should work with EDH and international supporters to improve metering and bill collection—especially among large-scale consumers. A net metering program encouraging larger consumers to use and feed self-generated excess power into the grid represents another powerful instrument. Import tariffs and tax credits should be adjusted to promote renewable energy and energy efficiency. Incentives and subsidies specifically targeted to rural electrification and reforming protectionist grid policies will also result in dramatic improvements.
Implementing This Roadmap
Haiti’s government, private industry, and civil society have acknowledged the important role of energy efficiency, renewable energy, and intelligent grid solutions in reducing energy costs, addressing important human needs, bolstering the national economy, and contributing to a healthier environment. The country is now at a crucial point where it must design a long-term policy plan and implement targeted measures and reforms based on sound technical assessments of different solutions and socioeconomic analyses of alternate development pathways. This Roadmap provides the information necessary to create a national consensus on the most suitable energy path forward. It ends with a list of recommended next steps to make this transition a reality.

Executive Summary | 19
Recommended Next Steps
Short Term Long Term
Conduct Additional Technical Assessments
Assess energy and cost savings potential for energy efficiency measures in commercial and public services sector
●
Conduct energy audits of identified target areas: agribusiness, textile, and hotel industries ●
Conduct feasibility assessments for utility-scale solar PV farms ●
Conduct thorough resource, environmental, and social impact assessments of biomass options such as sugar cane, coffee, and rice
●
Conduct grid connection feasibility and cost assessments for solar, wind, and small hydro sites ●
Conduct site feasibility assessments for pumped hydro storage ●
Assess the feasibility of interconnection with the Dominican Republic ●
Conduct needed hydropower resource assessments ●
Identify opportunities to retrofit existing conventional generation ●
Strengthen Socioeconomic Analysis
Collect more power plant-specific data (capital and O&M costs, heat rates, efficiencies, capacity factors)
●
Study ways to transition to renewable energy (and away from charcoal) while creating increased opportunities for employment
●
Gather more Haiti-specific data on environmental and health impacts of power plants (e.g., local pollutants, greenhouse gas emissions, water use)
●
Survey and communicate socioeconomic co-benefits of distributed generation ●
Develop community-specific economic models for least-cost generation options ●
Strengthen Financial Institutions and Mechanisms
Expand education campaigns for Haitian banks to improve risk perception for sustainable energy investment
● ●
Prioritize finance for refurbishment projects ●
Bundle sustainable energy projects with each other, or with larger development projects ●
Encourage development and strengthening of microloan programs focused on sustainable energy
●
Use existing climate finance opportunities to provide investment guarantees ●
Establish national strategy for accessing climate finance, including through the Global Environ-ment Fund, Clean Development Mechanism, and Nationally Appropriate Mitigation Actions
●
Use bundled remittances to finance renewable energy projects ●
Use a portion of internal savings from PetroCaribe Agreement to fund low-interest sustainable energy projects
●
Work with practitioners and communities to identify and replicate successful, scaleable business models for rural electrification
●
Implement a Strong Policy Framework
Articulate a clear and unified government intent to prioritize sustainable energy and distributed generation
●
Officially adopt ambitious sustainable energy targets based on research ●

20 | Haiti Sustainable Energy Roadmap
Recommended Next Steps, continued
Short Term Long Term
Implement a Strong Policy Framework, continued
Survey major sectors to determine development goals and projected energy needs; use this as input in strategy formation
● ●
Finalize and officially adopt a national energy policy ●
Establish a platform for dialogue between local and national government institutions ●
Adopt a framework to coordinate investment by international organizations ●
Create an electricity regulator with sufficient capacity and a clear mandate ●
Create a rural electrification agency ●
Improve data collection and make key energy information publicly available ●
Streamline and communicate requirements and processes for renewable energy development ●
Encourage public participation and education in sustainable energy matters ● ●
Where economically viable, implement codes and standards that target low-cost efficiency and conservation solutions
●
Implement tax incentives to encourage energy audits by major consumers ●
Implement tax incentives to promote importation and use of energy-efficient appliances ●
Prioritize distributed generation projects that involve local communities and provide a sense of ownership
● ●
Clarify legislation governing relationship between independent power producers (IPPs) and EDH ●
Standardize the power purchase agreement (PPA) process ●
Develop a net metering program for major energy consumers ●
Lower or eliminate import tariffs on sustainable energy technology and components ●
Implement targeted tax credits for renewable energy power plants ●
Encourage models to promote private sector involvement in rural electrification (e.g., pre-pay structures, solar leasing programs, tariffs appropriate for rural microgrids, integrated rural development)
● ●

A Sustainable Energy Roadmap for Haiti: Context, Goals, and Methodology | 21
Key Findings
• This Sustainable Energy Roadmap identifies opportunities to accelerate creation of a clean and affordable energy matrix. It assesses Haiti’s technical potentials for efficiency, renewable energy, and grid improvements; analyzes socioeconomic costs and benefits of different electricity development pathways; identifies barriers and opportunities for financing sustainable energy projects; and recommends policy, regulatory, and institutional changes.
• Haiti’s electricity sector is dominated by imported oil, with petroleum fuel accounting for 85% of the country’s power generation. Haiti spends around 7% of its gross domestic product (GDP) on petroleum imports for power generation and transportation.
• Still, three out of four Haitians do not have access to electricity, one of the lowest electrification rates in the world. Most power production is centered in the greater Port-au-Prince area. Even there, supply is unreliable and blackouts are common. Outside the capital, electrification rates drop to an average of 5%.
• Haiti’s existing electricity infrastructure is aging and poorly maintained. More than 65% of Haiti’s electricity production is lost to grid inefficiencies and electricity theft.
• Haiti’s installed operating capacity of 244 MW will have to more than double over the next decade to meet expected demand. Despite significant subsidies, the state utility EDH is in severe debt, unable to invest in the infrastructure needed. Improved metering, billing, and enforcement are key to electricity sector reform.
• Residential electricity tariffs in Haiti rank among the lowest in the Caribbean, due to government subsidies. High rates for industry, however, pose significant challenges for business development.
• Haiti ‘s only utility-scale renewable energy installations are its 30 MW of operating hydropower plants. Existing off-grid renewable generation and micro-grid systems in the country can serve as models of the technical feasibility and economic viability of distributed electricity.
• The Haitian government has made energy and the environment two of its five major priorities. The 2007–2017 Energy Sector Development Plan highlights solar, wind, hydropower, and bagasse as viable sources to offset Haiti’s fossil fuel use. Major policy changes are necessary to make this a reality.
• International support for climate change mitigation, adaptation, and energy access provides Haiti with opportunities to deploy energy efficiency measures and harness its strong renewable potential.
• Although Haiti’s contribution to global carbon emissions has been minimal, it is highly vulnerable to the impacts of climate change. Building a low-emission, climate-resilient electricity sector would establish Haiti as a climate leader and help support economically, socially, and environmentally sustainable development.
1 | A Sustainable Energy Roadmap for Haiti: Context, Goals, and Methodology

22 | Haiti Sustainable Energy Roadmap
Access to electricity is crucial for almost all aspects of human and economic development. The right of all people to access affordable, reliable, and sustainable electricity that elevates living standards while promoting economic growth, preserving natural resources, and mitigating and adapting to climate change has been widely recognized, notably by the United Nations’ Sustainable Energy for All (SE4ALL) initiative.1*
Haiti faces an enormous set of critical, interconnected challenges including pervasive poverty, political instability, environmental degradation, health risks, and a high vulnerability to natural disasters and climate change. The Haitian government and international partners have recognized the need to transform the country’s energy sector and chart a new path forward. This Roadmap lays out concrete strategies to build a power system that is economically, socially, and politically sustainable—one that powers economic growth and poverty reduction, facilitates improvements in health and education, and enables Haiti to mitigate and adapt to global climate change.†
Chapter 1 provides the international context and methodology for this Roadmap. It describes Haiti’s current electricity system and its key challenges, and defines the crucial role that a sustainable electricity system could play in powering an economy that meets human needs and aspirations while protecting the environment and fostering greater independence, security, and sustainability.2
1.1 Sustainable Energy and Climate Change: Haiti in the Global Context
At the 2009 and 2010 Conferences of the Parties to the United Nations Framework Convention on Climate Change (UNFCCC), held in Copenhagen, Denmark, and Cancún, Mexico, advanced economies pledged to provide developing countries USD 30 billion in financial and technical assistance for climate change adaptation and mitigation by 2012, and USD 100 billion annually by 2020.‡ These efforts are supported by the international development community, including the World Bank, regional development banks, and other international and bilateral mechanisms, both public and private.
These commitments to financial assistance build on earlier agreements, including those made at the 2007 UN Climate Change Conference in Bali, Indonesia. According to the Bali Action Plan (commonly known as the Bali Roadmap), developing countries are to consider “[n]ationally appropriate mitigation actions…in the context of sustainable development, supported and enabled by technology, financing and capacity-building.” The activities of developing countries, as well as the technology transfer and financial assistance efforts of industrial countries, are to be implemented in a “measurable, reportable and verifiable manner.”3
As a Small Island Developing State (SIDS), Haiti belongs to a group of nations that have played a proactive role in international climate negotiations. At the Copenhagen conference in December 2009, the Alliance of Small Island States (AOSIS) launched a sustainable energy initiative known as SIDS DOCK, designed as a “docking” station to connect the energy sectors in SIDS to global markets for finance, carbon, and sustainable energy sources. SIDS DOCK commits SIDS to work together to develop
* Endnotes are numbered by chapter and begin on page 166.† This Roadmap constitutes part of a Worldwatch series of Sustainable Energy Roadmaps. Portions of the analysis and text in
each Roadmap follow a similar model, reflecting the Institute’s knowledge base and methodology.‡ Information on industrialized-country contributions to so-called Fast-Start Finance can be found at the UNFCCC.

A Sustainable Energy Roadmap for Haiti: Context, Goals, and Methodology | 23
renewable energy and energy efficiency options and to seek international funding to implement their low-carbon energy strategies.
Additionally, UN Secretary-General Ban Ki-moon launched the SE4ALL initiative in 2012, with three central objectives through 2030: “providing universal access to modern energy services; doubling the global rate of improvement in energy efficiency; and doubling the share of renewable energy in the global energy mix.”4 This Sustainable Energy Roadmap provides Haiti with a clear pathway to meeting these goals and accessing opportunities under the initiative.
Historically, developing countries, and particularly SIDS, have contributed comparatively little to the world’s climate crisis. Yet these nations are profoundly vulnerable to the impacts of climate change, including water shortages, reduced food production, increased storm intensity, and rising sea levels. The Intergovernmental Panel on Climate Change’s (IPCC) Fifth Assessment Report, released in 2013–14, confirms that continued greenhouse gas emissions will result in additional global temperature rise, and that this will have significant impacts on all aspects of the climate system—as well as on ecosystems and human communities.5 Increased hurricane wind intensities (of 5–10% by 2050) and associated increases in storm surge are likely in the Atlantic Ocean, posing a particularly significant threat to islands like Haiti.6
In Haiti, socioeconomic factors augment physical threats. Maplecroft’s 2014 Climate Change and Environmental Risk Atlas ranks Haiti fourth in the world in vulnerability to climate impacts, a product of its exposure to climate-related events, the population’s health and educational status, and the country’s overall adaptive capacity.7 This underscores not only Haiti’s immense vulnerability, but also the complex and interconnected factors that need to be addressed in order to respond to the environmental threat.
Global greenhouse gas emissions are expected to soar in coming decades unless new approaches are taken to develop low-emissions energy, building, and transport systems. Most developing countries, including SIDS, currently lack the technologies and policies needed to pursue an alternative, less emissions-intensive path.
In addition to addressing climate change, low-emissions development strategies can deliver socioeconomic benefits by taking advantage of indigenous renewable energy resources such as solar, wind, hydropower, biomass, and geothermal, rather than relying on imported fossil fuels. SIDS can serve as ideal showcases for low-carbon development strategies due to the congruence of their national economic and security interests with the global climate agenda, as well as to their relatively small sizes and the homogeneity of their economies. With adequate support, they can demonstrate on a small scale what needs to be done globally.
Sustainable energy technologies that are already competitive today, and those that are expected to become so in the next few years, can permit a rapid decarbonization of the global energy economy if they are deployed in an integrated strategy.8 Modern sustainable energy systems are built on an advanced degree of energy efficiency, a high share of renewable energy in the overall electricity mix, and a strong and flexible grid structure. Additional key components to increasing energy and economic security include the diversification of energy sources and suppliers, a decrease in the level of energy imports, and greater infrastructure stability during natural disasters.

24 | Haiti Sustainable Energy Roadmap
Like most countries in the world, Haiti has enormous renewable energy resources. In order to harness them, however, a robust framework of policies and regulations is needed. Low-carbon energy strategies require solutions that are physically available, economically viable, and politically feasible.
1.2 Haiti’s Current Electricity System
Unlike most of its Caribbean neighbors, Haiti obtains the majority of its energy from traditional biomass resources such as charcoal and wood fuel, which accounted for more than 77% of the country’s final primary energy supply in 2011.9 Although most biomass is used for domestic heating and cooking, it is being used increasingly for power generation. The second most important energy source is petroleum, used for electricity generation and transportation, followed by hydropower. In the absence of domestic resources, all petroleum fuels are imported, with imports totaling some 691,000 tons of oil equivalent (toe) in 2011.10* The residential sector accounts for a majority of the country’s energy consumption (70%), followed by the industrial (15%) and transportation (13%) sectors.11
In the electricity sector, petroleum accounts for 85% of production on the grid, while hydropower comprises the remaining 15%.12 (See Figure 1.1.) Haiti’s grid faces severe challenges. In 2009, just over half of total electricity production was lost for technical and non-technical reasons, and this figure grew to about 66% in 2011.13 Chronic unreliability prompts many factories and businesses to generate electricity with their own private diesel generators.
Estimates of Haiti’s installed electricity capacity range from 250 to 400 MW.14 However, a combination of insufficient maintenance and outdated equipment means that much of the country’s installed capacity is non-operational.15 (See Table 1.1.) With an operational installed capacity of just 244 MW and an estimated peak power demand ranging between 250 and 500 MW, demand exceeds supply significantly, posing severe challenges for the country’s population.16
A 2011 report predicts that Haiti’s net peak demand will grow 5% annually until 2028, when it will reach 570 MW.17 The study predicts that the demand-supply gap will progressively narrow, as generation expands by 7.9% to reach 2,782 GWh in 2028.18 There is a great risk, however, that population growth and the consequent increase in energy demand will outpace improvement in electricity access. Conservative estimates suggest that by 2030, Haiti’s population will exceed 11 million, or as high as 14 million if fertility rates remain constant.19 Moreover, the nature of the Haitian electricity sector—particularly the lack of reliable data collection, limited electricity metering, rampant power theft, and the system’s vulnerability to natural disasters and economic downturns—makes any projection difficult. (See Chapter 5 for Worldwatch’s demand projection.)
Although EDH has its own generation park and technically holds a monopoly over the country’s electricity system, most power is currently produced by independent power producers (IPPs), including Sogener, E-Power, and Haytrac. IPPs have been operating in Haiti’s electricity sector since 1996. The first to sign a contract with EDH was Interselect SA in Cap Haitïen in 1996. Outside of Port-au-Prince, Sogener signed two power purchase agreements (PPAs) in 2002 for a total installed capacity of 16 MW: Cap Haïtien (8
* All measurements in this report are provided in metric units unless indicated otherwise.

A Sustainable Energy Roadmap for Haiti: Context, Goals, and Methodology | 25
Oil85%
Hydro, 15%
Figure 1.1
Share of Electricity Generation by Source, 2011Source: World Bank © Worldwatch Institute
Table 1.1 Overview of Haiti’s Existing Power Plant Fleet
Name of Unit Location of Unit Owner Plant Type Installed Capacity Operating Capacity
MW MW
Varreau PAP EDH distillate 68 34
Carrefour PAP EDH distillate 48 24
Péligre PAP EDH hydro 54 26
Sogener PAP (Varreau) Sogener (IPP) distillate 40 20
E-Power PAP IPP heavy fuel oil (HFO) 30 30
Centrale José Marti Cap Haïtien IPP HFO 15 15
Centrale Simón Bolívar
Gonaives IPP HFO 15 15
Centrale Alexandre Pétion
Carrefour IPP HFO 30 30
Caracol Caracol IPP HFO 10 10
Thermal outside Département de l’Ouest
Provinces — distillate 72 36
Hydro outside Département de l’Ouest
Provinces — hydro 8 4
Solar at Mirebalais Hospital
Mirebalais — solar 0.4 0.4
Total — — — 390 244
Source: See Endnote 15 for this chapter.

26 | Haiti Sustainable Energy Roadmap
MW) and Artibonite (8 MW). Haytrac currently operates two plants with a total installed capacity of 12 MW: Petit-Goâve (6 MW) and Les Cayes (6 MW).20 Following the earthquake in 2010, E-Power entered the market with a 30 MW heavy fuel oil (HFO) diesel power plant in Port-au-Prince.21
Haiti has no national electricity grid. Instead, five separate and isolated grid systems service specific regions. Only 12.5% of the population has official access to an electricity grid; an additional 12.5% is connected illegally, bringing the total electrification rate to 25%.22 Approximately three-quarters of Haiti’s installed capacity is located in the greater Port-au-Prince area.23 The rate of electrification within the capital is therefore comparatively high, about 40%, although the average EDH customer in Port-au-Prince still receives only about 15 hours of electricity service per day.24 Only about a quarter of the country’s population lives in the capital, however, and electrification rates in rural areas are much lower, at about 5%.25 In the country as a whole, those who do have access to electricity receive power for an average of only 5–9 hours per day.26
Haiti has one of the lowest electricity consumption rates in the world. Despite being the 88th most populous country, Haiti ranks 184th in total electricity consumption.27 Per capita electricity consumption was only 21 kWh in 2011, eighty times lower than the regional average.28 Haiti’s net electricity production was only 875 GWh in 2011.29
Haiti’s residential retail electricity tariff, averaging 16 U.S. cents per kWh in 2012, is relatively low compared to the Caribbean’s regional benchmark.30 (See Table 1.2 and Figure 1.2.) It is also much lower than generation costs for EDH and IPPs. Residential tariffs are subsidized to increase affordability and because historically, residential tariffs have been nonexistent or very low in Haiti. The tariff is even lower (12 U.S. cents per kWh) for residential customers that consume fewer than 200 kWh per month.31
Since 2009, however, the tariffs for industrial and commercial consumers have been on the higher end of the regional range, with industrial tariff rates at 36 U.S. cents per kWh.32 (See Figure 1.3.) This raises the country’s average cost of electricity to 31 U.S. cents per kWh, roughly on par with the rest of the region. These increases in tariff rates for large-scale consumers were part of an electricity sector reform aimed at addressing EDH’s persistent deficits. The new rates are also more reflective of actual generation costs based on Haiti’s current fuel mix, although high commercial and industrial rates can make it difficult for Haitian businesses to be regionally competitive.
Haiti has significant renewable energy resources. Strong solar irradiance throughout the country, numerous areas with significant wind resource potential, as well as underutilized opportunities for small
Table 1.2 Electricity Prices in Haiti, 2012
Average Residential
Residential (<200 kWh/month)
Average Commercial
Average Industrial
U.S. cents per kWh
2012 16 12 35 36
Source: See Endnote 30 for this chapter.

hydropower and biomass all contribute to Haiti’s significant renewable energy prospects. So far, however, very little of this potential has been developed.
The most sizeable contribution of renewables to the Haitian energy mix currently comes from hydropower,
A Sustainable Energy Roadmap for Haiti: Context, Goals, and Methodology | 27
Resi
dent
ial R
ates
(U
.S. c
ents
per
kilo
wat
t-ho
ur)
Trinidad
Surin
ame
Haiti
Dominican Republic
NevisBelize
St. Lu
cia
Baham
as (BEC)
Baham
as (G
BPC)
Guyana
Barbad
os
St. Kitts
St. Vince
nt
Grenada
Dominica
Jamaic
a
Antigua
0
5
10
15
20
25
30
35
40
Figure 1.2
Residential Tariff Rates in the CARILEC Region, 2009 Source: EDH, CARILEC © Worldwatch Institute
Indu
stria
l Rat
es
(U.S
. cen
ts p
er k
ilow
att-
hour
)
Trinidad
Barbad
osAruba
Jamaic
aNevis
St. Vince
nt
St. Lu
cia
Cayman
Islan
ds
Bermuda
Haiti
Antigua
Curacao
Dominica0
5
10
15
20
25
30
35
40
Figure 1.3
Industrial Tariff Rates in the CARILEC Region, 2009Source: EDH, CARILEC © Worldwatch Institute

28 | Haiti Sustainable Energy Roadmap
and further hydropower development remains a priority for the Haitian government.33 (See Table 1.3.) Rehabilitation of the Péligre power plant is being supported by the Inter-American Development Bank (IDB), the German development agency KfW, and concessional financing from the International Fund for Development of the Organization of the Petroleum Exporting Countries (OPEC).34
The proposed Artibonite 4C, a 32 MW hydroelectric dam to be constructed near Mirebalais in the country’s principal agricultural region, would supply energy to approximately 213,000 households.35 Initially proposed in 2008 within a bilateral cooperative framework between the governments of Haiti and Brazil, the project’s total budget is expected to be USD 191 million over 40 months.36 The potentially negative impacts of large hydropower on local communities and the environment have been widely documented, and the resource must therefore be well managed.37 In 2012, the IDB issued a call for expressions of interest (EOI) for a study of the plant’s social and environmental impacts.38 The project is currently awaiting funding.
Haiti has no utility-scale renewable facilities other than hydropower, although there are isolated examples of off-grid renewable use, particularly solar electricity generation and solar water heating. As of 2006, the installed site-level capacity of non-hydro renewable electricity in Haiti was estimated at 0.7 MW, with several significant additions since then.39
Encouraging signs point to the expansion of renewables in Haiti. (See Table 1.3.) The government has acknowledged that the use of local energy resources augments energy independence. It has also noted that although the initial investment requirements for renewable technologies are high, they are already cost competitive in Haiti given the country’s current reliance on expensive imported fuels.40 The 2007–2017 Haitian Energy Sector Development Plan highlights bagasse, hydro, solar, and wind as potentially viable sources of energy to offset Haiti’s reliance on fossil fuels.41
Table 1.3 Haiti’s Largest Existing and Planned Renewable Energy Projects
Project Type of Energy Completion Date Estimated Cost Maximum Capacity Outside Stakeholders
USD MW
Péligre rehabilitation
hydropower 2015 48.8 million 54 (restored potential)
IDB, OPEC, German government
Project Phoenix dual fuel waste-to-energy and coal
Planning ongoing
330 million 50 International Electric Power, LLC
Project Siroc wind N/A 60 million 20 International Electric Power, LLC
Darbonne Sugar Mill
biomass 12 to 18 months from contract date
N/A 12 to 15 BioTek, IDB
Artibonite 4C hydropower 40 months from contract date
191 million 32 Brazilian government
“Ban m Limyè, Ban m Lavi”
solar 2014 45 million 30 (200,000 homes)
Haitian banks
Source: See Endnote 33 for this chapter.

A Sustainable Energy Roadmap for Haiti: Context, Goals, and Methodology | 29
President Michel Martelly has made energy and the environment two of his five major national priorities, indicating significant government focus on the intersection of these issues.42 In January 2012, his administration announced the goal of ensuring that each Haitian home have at least one light over the next two years through the “Ban m limyè, Ban m lavi” (“Give me light, give me life”) program. At an estimated cost of less than USD 20 million, about two-thirds of which would be awarded by Haitian banks via long-term loans, the program helped finance the purchase of solar home kits and single lanterns.43 As solar component costs continue to fall, the program is also testing the use of low-consumption and high-efficiency LED bulbs.44 Although the ultimate impacts of this initiative remain uncertain, it indicates an acknowledgment by the government that the future of Haiti’s electricity sector must be based on renewable technologies, not just a greater dependence on imported fossil fuels.
Support for renewable energy is also gaining momentum in the private and donor sectors. International and local partners are using a greater share of off-grid renewables in their operations, largely because of Haiti’s immensely unreliable electricity grid. In October 2010, the Interim Haiti Recovery Commission (IHRC) commissioned the Solar Electric Light Fund (SELF) to expand solar energy in the Haitian Central Plateau commune of Boucan Carré.45 SELF also installed a 10 kW solar-diesel hybrid system at a Boucan Carré clinic run by Partners in Health in September 2009.46 In 2012, SELF installed a total of 40 kW photovoltaic (PV) battery systems at 12 health facilities in the South Department, including an 11 kW installation at the Port-a-Piment hospital.47 Mirebalais Hospital, a joint initiative of Partners in Health and Zanmi Lasante, is powered by 1,800 rooftop solar panels that generate enough to meet 100% of the hospital’s power needs and provide surplus electricity back into the local grid. Although many of these projects are small, they could serve as important models for the Ministry of Public Works and as an impetus to craft or reform necessary energy policies and could therefore be important game-changers.48 A consortium of implementing and donor organizations, facilitated by the United Nations Environment Programme (UNEP) and the Government of Haiti, is currently constructing a 400 kW diesel-solar PV hybrid minigrid in the South Department. It will connect Port-a-Piment, Damassin, Coteau, and Roche-a-Bateau and will be operated by a rural energy cooperative: Cooperative Electrique de l’Arrondissement des Coteaux.49
Biomass-based energy solutions are gaining momentum as well. The IDB recently partnered with the Haitian Ministry of Agriculture to develop biofuels as an alternative to imported oil.50 The Haitian government and BioTek, a bioenergy and biofuels distribution company, have also signed a public-private management agreement to optimize Haiti’s only remaining sugar mill.51 Optimizing the mill’s production would not only displace 50% of Haiti’s sugar imports, but also produce an estimated 12 to 15 MW of power from sugarcane bagasse to service Port-au-Prince.52
Moreover, recent evidence suggests that jatropha trees, if managed responsibly, could serve as a renewable and environmentally friendly replacement for Haiti’s devastated wood stock. Jatropha could thrive on the country’s degraded hillsides, improving soil quality, providing fuel, and possibly providing products such as livestock feed, soap, and fertilizer.53 As with all biomass-based energy solutions, however, factors such as soil degradation and competition with food production need to be considered. Especially in the case of Haiti, which is trying to overcome several recent natural disasters and enduring poverty throughout many of its communities, biomass-based solutions that compete directly with food should be avoided.
Finally, waste-to-energy programs are burgeoning in the country, due in part to post-earthquake health

30 | Haiti Sustainable Energy Roadmap
concerns about solid waste.54 In 2012, a U.S.-based private company, International Electric Power LLC (IEP), announced Project Phoenix, a partnership agreement with the Haitian government to build what is now slated as a 50 MW waste-to-energy and coal power plant near Port-au-Prince.55
Apart from renewables, various alternatives provide opportunities to use cleaner-burning fuels. In 2013, construction of a liquefied natural gas (LNG) terminal began near Titanyen, north of Port-au-Prince. Later phases of the project will include construction of a pipeline to supply industrial actors in the capital city.56 Although cleaner than heavy fuel oil, LNG will still need to be imported, and that releases climate-altering emissions.
Traditionally, the Haitian electricity sector has been based on a vertically integrated, public monopoly (EDH). Since that approach has resulted in only a 10% improvement in electricity access over 40 years and has consistently failed to meet the country’s power demands, the Haitian government has recently decided to involve the private sector and to transition to a more open and diversified system.57 In June 2014, the government launched an open call for local or international operators interested in taking over EDH’s role in the Southeast Department, which is attractive because of its small size and potential for tourism development. The winning operator will be awarded a concession for production, transmission, distribution, and sale of electricity. The operator must repair existing infrastructure, build new production capacity to meet demand, and rehabilitate the grid to reduce losses.
Ultimately, the government aims to expand this model to the country’s other departments, excluding the metropolitan zone.58 This is a huge transition for Haiti’s electricity system, and there will likely be bumps in the road. However, it is now generally recognized that a public monopoly is not the best system for the country’s power sector and that things need to change. This Roadmap will be a useful tool as the government and electricity sector stakeholders continue to transform Haiti’s electricity system.
1.3 The Role of Sustainable Power in Building Haiti’s Future
Development of affordable, reliable, and sustainable energy would have significant positive impacts on Haiti’s economy and quality of life. With a GDP per capita of only USD 1,300, Haiti is currently the only least-developed country (LDC) in the Western hemisphere.59 In 2013, Haiti ranked far below its regional neighbors (161st) on the UN’s Human Development Index and received a designation of “low human development.”60 Only about a quarter of the Haitian population has access to electricity, leaving more than 7 million people without power.61
Building a sustainable energy system capable of serving all Haitians will play a crucial role in improving living conditions. The positive correlation between energy access and human development has been widely noted; the UN’s Sustainable Energy for All initiative commits to ensuring universal access to modern energy services as a means of reducing poverty, improving education and human health, and powering economic growth.62 Figure 1.4 illustrates the correlation between electricity consumption per capita, gross national income, and human development in select Latin American countries.63
The Haitian government recognizes the crucial links between electrification and human development, arguing in its Action Plan for National Recovery and Development that access to basic services, including

A Sustainable Energy Roadmap for Haiti: Context, Goals, and Methodology | 31
electricity, should be considered critical investments in human capital and an “engine for the new foundation of Haiti.”64 According to the Office of the Minister Delegate to the Prime Minister in Charge of Energy Security, making electrification a top government priority is needed to power the economy and improve quality of life.65 A sustainable power system will be required to overcome many of the country’s major long-term challenges, including facilitating economic and social development, stabilizing and restoring Haiti’s natural environment, and increasing resilience against natural disasters and economic shocks.66
Harnessing domestic renewable energy will free up resources to be invested in Haiti. The country’s current reliance on fossil fuels requires that a significant portion of annual GDP (about 7% in 2011) be spent on importing petroleum for power generation and transportation.67 Given EDH’s perilous financial situation, the Haitian government has historically diverted a significant sum from its general fund to cover the utility’s expenses and to purchase oil for electricity each year. Between September 2010 and September 2011, this amounted to over USD 180 million, or approximately 2.8% of GDP.68
If Haiti were to expand electricity services to the 7 million people currently without power while continuing to rely predominantly on fossil fuel generation, the annual share of GDP required to be spent on oil imports would soar, with severe macroeconomic impacts. The Haitian government acknowledges that reliance on costly imported petroleum prevents money from being invested in vital economic activities, and that any move to increase energy imports should be avoided.69 Development of domestic renewable resources will allow this money to be reinvested within Haiti instead, contributing to critical improvements in infrastructure, health services, small business development, and education.
Expanding sustainable energy services will drive economic growth and stability. Extremely limited access to electricity significantly hampers commercial activity and education, and constrains economic development.70 Industry, agriculture, and the services industry would each benefit substantially from improvements in the availability and reliability of electricity services, including the attendant improvements in education, health care, and available working hours. Improvements in energy
Gro
ss N
atio
nal I
ncom
e pe
r Cap
ita
(Tho
usan
d 20
05 U
SD)
0
2
4
6
8
10
12
0.43 0.48 0.53 0.58 0.63 0.68 0.73 0.78Human Development Index (HDI)
Haiti
Nicaragua Honduras
Bolivia
El Salvador
Jamaica
Brazil
Dominican Republic
Size of ellipse re�ects relative electricity consumption per capita.
Ecuador
Colombia
Figure 1.4
Human Development, Gross National Income, and Electricity Consumption in Select Latin American Countries, 2011Source: UNDP © Worldwatch Institute

32 | Haiti Sustainable Energy Roadmap
efficiency will allow Haitian industry, small business, and agriculture to produce more with less, powering future growth.
Building a sustainable energy system will help restore and conserve Haiti’s environment. Transitioning from traditional biofuels to renewable energy will have positive impacts on forest conservation, human health and security, and resilience to tropical storms. The Haitian government acknowledges that energy and the environment are inextricably linked, and that environmental protection must be a primary goal of any national energy policy.71 Forest cover across Haiti has declined dramatically in recent decades, largely as a result of widespread dependence on traditional sources of biomass like charcoal for primary energy. This contributes to the loss of approximately 10,000–15,000 hectares of once-fertile land each year and worsens the flooding impacts of heavy rains.72 Already one of the 25 driest countries in the world, Haiti is now experiencing rising demand for water and increasingly irregular rainfall patterns that exacerbate its water scarcity issues and further hamper agricultural development.73 Transitioning away from traditional biomass use is one of the most fundamental ways to reverse environmental degradation, facilitate agricultural growth, and increase resilience.
Finally, sustainable energy would significantly increase Haiti’s ability to respond to natural disasters. Haiti is highly vulnerable to both hurricanes and earthquakes. In 2008, four major hurricanes (Ike, Fay, Hanna, and Gustav) struck the country within a period of just 30 days, resulting in devastating damage and displacing approximately 800,000 people.74 Climate change will likely increase both the frequency and intensity of such extreme weather events.75 Haiti also straddles several fault lines, one of which resulted in the devastating earthquake that struck Port-au-Prince, Léogâne, Jacmel, and Petit Goâve on January 12, 2010. That disaster directly affected 1.5 million people and resulted in an estimated USD 7.8 billion in damages, a figure equivalent to just over 120% of the country’s GDP in 2009.76
In the event of a natural disaster, electricity services are a vital lifeline, allowing rescue crews to continue working around the clock, facilitating communication, enhancing security, and allowing for coordination of evacuation procedures and facilities. In the aftermath of the 2010 earthquake, hospitals and rescue crews often struggled to work without power and were forced to rely on costly and unsustainable fossil fuel generators. A sustainable power system in Haiti must allow rescue crews and health workers to operate safely and effectively in the immediate aftermath of a natural disaster, and communities to recover sustainably in the long term. Studies indicate that renewable energy systems are generally better equipped than fossil fuel or nuclear technologies to effectively support communities struck by natural disasters.77
1.4 Methodology and Report Structure
This Roadmap is the result of an intensive, multi-year research project on how to seize opportunities and overcome barriers to a sustainable energy transition in Haiti. Because energy infrastructure decisions are decisive for a country’s development and involve difficult tradeoffs, it was essential to gather the most recent and high-quality data. To make feasible recommendations for concrete actions, it was important to understand the interests, positions, and insights of all parties critical to making the proposed ambitious energy plan a reality.
Worldwatch worked closely with Haitian officials and partners to ensure that the scope of work would

complement, not duplicate, previous efforts to examine various aspects of the potential for energy efficiency and renewables in Haiti and the Caribbean region. These studies served as important references for this project and provided essential information about particular aspects of Haiti’s energy situation. A comprehensive study of efficiency, renewable energy and integration options, and strategies at the country level was lacking. This Worldwatch Roadmap aims to fill this information gap.
The Worldwatch Sustainable Energy Roadmap methodology takes a holistic approach to assessing the interdependent components that are essential to integrated clean energy planning. (See Figure 1.5.) We identify opportunities for increased efficiency; examine a country’s resource potential for renewable energy production; and catalogue grid enhancement and extension needs and energy storage solutions. The Roadmap analyses socioeconomic impacts of a sustainable energy transition, including costs of various electricity pathways and macroeconomic effects such as job creation potential and cross-sectoral impacts. The Roadmap then studies the existing climate for sustainable energy investments and highlights private, public, and multilateral funding opportunities to make renewable energy plans a reality. Finally, the Roadmap highlights policy barriers to renewable energy development and recommends how they can be overcome.
The first step in identifying sustainable energy opportunities in Haiti was to pinpoint areas for energy savings and efficiency improvements. By targeting high-consuming, energy-intensive sectors, Chapter 2 of this Roadmap identifies key low-cost leverage points for improving efficiency in Haiti.
A Sustainable Energy Roadmap for Haiti: Context, Goals, and Methodology | 33
Figure 1.5
Worldwatch Methodology for Sustainable Energy Roadmap Development © Worldwatch Institute
Policy Recommendations
• Vision and long-term goals• Governance and administrative
efficiency• Concrete policy
mechanisms
Technical Assessment
• Energy efficiency potential• Renewable energy potential
• Grid solutions
Socioeconomic Analysis
• Levelized cost of energy +• Energy scenarios
• Macroeconomic effects
Finance and Investment Assessment
• Gap analysis• Domestic reform and capacity
building• International support and
cooperation

34 | Haiti Sustainable Energy Roadmap
Chapter 3 includes the most detailed assessment ever undertaken of wind and solar resources in Haiti. Worldwatch partnered with 3TIER, Inc., a renewable energy risk-analysis company that develops high-resolution mapping and data, to gain access to comprehensive wind and solar resource datasets. These include consideration of diurnal, seasonal, and long-term variability, as well as the spatial detail of wind and weather resources—an important factor in accelerating the process of prospecting and screening for potential renewable energy development sites, especially in areas of complex mountainous terrain. The chapter provides countrywide maps of Haiti’s solar and wind resources. Based on these initial assessments, and on intense discussion with the government, specific solar and wind zones were defined and then profiled in depth. 3TIER’s detailed zonal assessments are included in the Appendices. The chapter also provides an overview of other sustainable energy resources in Haiti, including small hydropower, biomass, and municipal solid waste.
This Roadmap focuses on cost-effective ways to build a strong and reliable national energy system. The technical analysis provided in Chapter 4 catalogues the grid enhancement and extension that could support the increased use of renewable energy. It also discusses opportunities for distributed renewable generation. This technical assessment, reflecting research and consultations with in-country experts, relates infrastructure needs to the resource assessments undertaken in this and other studies.
An in-depth analysis of the socioeconomic impacts of transitioning to renewable energy will help decision makers make the case to energy developers, investors, and the public that harnessing these domestic resources is in Haiti’s best interest. Chapter 5 presents detailed scenario analyses for potential energy pathways that Haiti could take, demonstrating the feasibility of meeting expected demand with high renewable energy penetration.
Chapter 6 builds on these scenarios to compare the costs of electricity generation from various fossil fuel and renewable energy sources in Haiti based on locally gathered data. It also assesses the cross-sectoral impacts (economic, social, and environmental) associated with developing these resources.
Chapter 7 describes the existing climate for sustainable energy finance in Haiti, including domestic and international sources of private and public investment. It then identifies financing gaps and analyzes how to fill them.
Chapter 8 surveys existing laws and regulations relating to the electricity sector. Drawing on domestic expertise as well as international best practice, the chapter discusses opportunities for legislative, institutional, and administrative reforms, looking at key principles that should guide successful energy policymaking as well as at concrete policies and measures.
Throughout the project, Worldwatch has engaged in local capacity building and knowledge sharing through workshops, conferences, interviews, and conversations. These efforts were essential in writing this integrated study but also served a purpose in themselves: they brought stakeholders together and bridged knowledge gaps between government, private renewable energy investors, utilities, and the financial sector. This final Roadmap will be presented to stakeholders in Haiti as a concrete tool that they can use to plan and implement new renewable energy policies and projects.

Energy Efficiency in Haiti | 35
Key Findings
• Haiti’s electricity system is currently unable to meet domestic demand and leaves three-quarters of the population without access to modern electricity services. Energy efficiency improvements—on both the demand and supply sides—would enable the system to reach more customers and to improve energy services and reliability with less additional capacity.
• Haiti’s electricity grid has very high transmission and distribution losses. Strengthening grid infrastructure and reducing electricity theft represent cost-effective ways to improve overall system efficiency.
• Repairs, technology upgrades, and refurbishment would greatly improve the output of existing fossil fuel and hydropower plants—reducing the need for additional baseload generation capacity and increasing opportunities to integrate intermittent renewables.
• Sectors that should be targeted for energy efficiency improvements include industry (43% of Haiti’s total electricity consumption), the residential sector (32%), and commercial and public services (25%).
• Haiti’s industrial energy intensity is six times the global average, creating a major strain on business competitiveness. The textile industry and other major industrial sectors should continue switching to CFL lights, implementing cool roof technology, and insulating buildings to reduce their high energy costs.
• Switching to CFL and LED light bulbs in households would reduce energy bills significantly and save up to 9% of Haiti’s current electricity generation.
• Refrigeration makes up an overwhelming majority of electricity consumption in Haiti’s residential sector, even though few households have refrigerators. As refrigerators become more common in the country, it will be crucial to target their efficiency.
• Air conditioning, currently a small fraction of energy consumption, is expected to increase significantly as Haiti’s economy develops, particularly with the expected rise in tourism. Cool roofs and better insulation offer affordable and quick cooling alternatives for homes and businesses, expanding comfort at a low price.
• The increased adoption of efficient cookstoves has the greatest potential to save primary energy. It would also help to combat deforestation, as only 2% of Haiti’s forest cover remains.
2 | Energy Efficiency in Haiti

36 | Haiti Sustainable Energy Roadmap
2.1 The Importance of Efficiency for a Sustainable Energy System in Haiti
Every country has a unique set of challenges and opportunities for undertaking a sustainable energy transformation. The level of energy efficiency is determined by a broad range of factors, including overall electricity demand, the specific requirements of major energy consumers, past energy prices and policies, and local knowledge and attitudes about energy conservation. Identifying opportunities for energy savings and efficiency improvements in the most energy-intensive sectors is an important initial step in creating a sustainable energy system.
Energy efficiency measures can reduce the energy required to provide the same level of service for all economic sectors, including residential, commercial, and industrial. Employing energy efficiency technologies and practices in buildings, for example, provides the same degree of comfort with a lower level of energy consumption.1 Utilizing energy efficient cookstoves (cooking accounts for a majority of Haiti’s residential energy consumption) enables Haitians to use less energy and save money.2 (See Sidebar 2.1.)
Improvements in energy efficiency are often the cheapest and fastest way to reduce the environmental and economic costs associated with an energy system. A high degree of energy efficiency is a crucial
Sidebar 2.1 Supplying Efficient Cookstoves and Alternatives to Charcoal
Cooking accounts for the majority of energy consumption in Haiti’s residential sector. An estimated 93% of Haiti’s population relies on solid fuels—predominantly wood and charcoal—for cooking. This has considerable negative impacts, particularly on women and children, who tend to spend more time indoors and near open fires. According to the World Health Organization, household air pollution caused by cooking with traditional biomass can cause serious ailments, including childhood pneumonia, pulmonary disease, and lung cancer. The Global Alliance for Clean Cookstoves estimates that over 9.4 million people in Haiti (or 94% of the country’s total population) are affected by household air pollution. Other major health risks associated with inefficient cooking include injuries and burns. In Haiti, reliance on traditional biomass has also contributed to heavy deforestation, with significant negative impacts on things like flood control and agricultural productivity.
Efficient cookstoves can lower the energy intensity of cooking and help mitigate these challenges. Although efficient cookstoves do not necessarily reduce household electricity consumption, they are an important piece of the energy discussion in Haiti because they reduce a consumer’s need for cooking fuel, thereby decreasing a stove’s expense, as well as its negative impacts on health and the environment. Efficient cookstoves would not entirely displace the charcoal industry, but they would go a long way toward mitigating environmental and economic costs.
In addition to efficient cookstoves, kerosene, ethanol, waste paper briquettes, solar cookers, biochar, and biomass pellets all have been recommended as possible replacements for charcoal. Although these technologies and fuels have environmental and economic advantages over charcoal, their widespread implementation faces many barriers. For example, although waste paper briquettes generate local jobs and facilitate productive use of paper and cardboard and recycling of metals, glass, and aluminum, industry stakeholders admit that Haiti does not have enough paper or cardboard to replace charcoal, and that the briquettes industry would likely remain small. Similarly, although cookstoves fueled by kerosene would be cost competitive with LPG or efficient cookstoves, analysts believe that kerosene’s strong effect on the taste of food will prevent it from becoming more popular in Haiti. Despite these challenges, such innovations can play a constructive role in Haiti’s energy future.
Source: See Endnote 2 for this chapter.

Energy Efficiency in Haiti | 37
component of a sustainable energy system because of its compounding effects: when a user consumes one less unit of energy because of efficiency measures, the system typically saves much more than this one unit because of avoided losses during generation, transmission, and distribution. Especially in Haiti, where more than 30% of generation is unused due to technical losses, end-user efficiency savings can translate into much greater savings in generation.3 For every 1 watt of energy saved by a consumer in Haiti, much more than 1 watt of generation is saved for the generator. Efficiency improvements can amplify the benefits of developing utility-scale energy production, including from renewables, by increasing the impact of added power capacity.
Energy efficiency measures also offer some of the most cost-effective tools for reducing carbon dioxide (CO2) emissions. Especially in a country like Haiti, which has high energy supply costs and few efficiency measures in place, there are large gains to be made in this area. In many cases, energy efficiency measures actually save money because of reduced energy costs. In neighboring Dominican Republic, a 2011 study indicated that the five lowest-cost CO2 abatement measures were all related to energy efficiency.4
Haiti’s per capita electricity consumption is by far the lowest in the Latin America and Caribbean region (see Figure 2.1), largely because EDH cannot meet the existing power demand.5 Energy efficiency measures are crucial because they would allow Haiti to provide more energy services with less energy.
Sectors that should be targeted for energy efficiency measures are those that 1) account for a large share of Haiti’s energy consumption, 2) are highly inefficient, and 3) are central to the Haitian economy or the well-being of Haitians. Industry accounts for the greatest share of total electricity consumption in the country, at 43%, followed by the residential sector (32%) and commercial and public services (25%).6 (See Figure 2.2.)
2.2 Improving the Efficiency of Existing Power Plants
Much of Haiti’s power generation fleet is aging and inefficient. Only 63% of the country’s total installed capacity, including 48% of its installed hydropower capacity, is currently operational.7 As Haiti looks to diversify its energy supply and add needed capacity, improving efficiency and refurbishing existing power plants would increase production and reduce energy costs in the near-to-medium term.
As a result of inadequate upkeep, some energy installations in Haiti are deteriorating more quickly than expected, and at times equipment cannot be repaired or replaced.8 Péligre, Haiti’s largest hydropower facility, has a nameplate capacity of 52 MW but is operating at only half capacity, with at least one turbine out of operation.9 In addition, ongoing deforestation and resulting erosion have contributed to an accumulation of silt that clogs the reservoir.10 On average, Haitian generators operate at a 25% capacity factor, meaning that only about 60 MW in total is effectively produced at any given time in the country.11 Limited capacity largely explains why Haiti’s electricity generation declined more than 30% between 2004 and 2010.12
Even as Haiti continues to explore different options for energy diversification, efficiency upgrades and refurbishment of existing power plants are important ways to increase production and reduce energy costs

38 | Haiti Sustainable Energy Roadmap
Industry43%
Commercial and public services
25%
Residential32%
Figure 2.2
Share of Electricity Consumption in Haiti, by Sector, 2011Source: IEA © Worldwatch Institute
Elec
tric
ity C
onsu
mpt
ion
(kW
h pe
r Cap
ita)
0 2,000 4,000 6,000 8,000 10,000 12,000 14,000 16,000 18,000GDP per Capita (USD)
0
1,000
2,000
3,000
4,000
5,000
6,000
RegionalAverage
Haiti
Argentina
Barbados
Belize
Bolivia
Brazil
Chile
Colombia
Costa Rica
Dominican RepublicEcuador
El Salvador
Grenada
Guatemala
GuyanaHonduras
Jamaica
Mexico
Nicaragua
Panama
ParaguayPeru
Suriname
Trinidad & Tobago
Uruguay
Venezuela
Figure 2.1
Electricity Consumption Compared to Per Capita GDP in Latin America and the Caribbean, 2010Source: EIA, World Bank © Worldwatch Institute

Energy Efficiency in Haiti | 39
in the near-to-medium term. The ongoing effort by the IDB, KfW, and the OPEC Fund for International Development to rehabilitate Péligre is a good example of international partnerships focusing on the importance of upgrades.13 In addition to helping meet unmet demand, repairing existing fossil fuel and hydropower plants increases baseload capacity, creating opportunities to integrate intermittent renewables into the energy mix.
2.3 Improving the Efficiency of Transmission and Distribution
EDH’s grid system has significant transmission and distribution losses, estimated at 66% in 2011.14 This is extremely high compared to international standards; in the United States, for example, total transmission and distribution losses average only about 7% annually.15 About 30% of electricity losses in Haiti are technical, resulting from the inefficient and overburdened national grid system.16 (For a discussion of grid strengthening and expansion measures, see Chapter 4.) The remainder of Haiti’s transmission and distribution losses are non-technical, resulting from illegal connections and EDH’s inability to collect tariffs from some customers. According to the World Bank, only about 50% of Haitians (180,315 customers) connected to EDH’s grid are legal customers paying their bills.17
Improving the efficiency of Haiti’s electricity transmission and distribution system will require strengthening the grid to reduce technical losses and implementing anti-theft measures to reduce illegal connections and increase payment collection. (See Chapters 4 and 8 for a discussion of these measures, as well as of the regulatory and policy framework necessary to implement them.)
Although non-technical losses result in economic losses to utilities and grid operators, they still represent energy that is being used and that often covers the electricity needs of people who otherwise could not afford it. It is nevertheless problematic for building an efficient and reliable electricity system if a large share of the electricity produced is stolen from the grid. Finding creative policy and market solutions that can lower non-technical losses for power distributors while promoting affordable and reliable electricity services is vital to the long-term efficiency of the power system.
2.4 Boosting the Industrial Sector’s Efficiency
Despite accounting for only 10% of Haiti’s GDP, industry consumes more than 40% of the country’s electricity.18 Haiti’s industrial energy intensity has increased significantly over the past two decades, posing challenges for economic development. In 2008, Haiti’s industrial sector consumed 1.95 tons of oil equivalent (toe) per USD 1,000 of economic production.19 This is three times greater than Haiti’s energy intensity in 1990, and nearly six times the global average of 0.35 toe.20 A lack of available electricity has been cited as a major contributor to decline across all Haitian industries.21 Energy efficiency measures are crucial for reviving Haiti’s industrial production.
Improving energy efficiency in agricultural production should be a priority. According to one study, the challenges of energy access and the high cost of electricity consumption have placed a major strain on the competitiveness of the Haitian coffee industry.22 In rural communities, two-thirds of the Haitian workforce earns its livelihood in agricultural production.23 Future studies should focus on the energy–

40 | Haiti Sustainable Energy Roadmap
agriculture nexus and evaluate ways that Haitian farmers can increase yields and profitability without increasing demand for the country’s very limited water, biomass, and fossil fuel resources. Introducing innovative renewable technologies such as solar-powered drip irrigation could go a long way in saving energy and water resources.
Haiti’s textile industry is one of the country’s largest industrial sectors, providing more than 22,000 local jobs.24 As of 2010, all 23 registered textile manufacturers had their own power generators on site, although many were also connected to the grid.25 There was no evidence of non-petroleum-based generators at any of these manufacturing sites. Although private generators provide companies with some measure of assurance in the face of unreliable grid supply, factories have had to shut down temporarily due to oil supply shortages. On-site renewable generation and energy efficiency measures could reduce the industry’s dependence on imported petroleum fuels and mitigate the chances of factory closures. Some textile manufacturers, citing energy as their primary cost concern, have adopted CFL lighting, implemented cool roof technology, and improved building insulation.26 The textile industry, agribusinesses, and other industrial sectors need to continue adopting these measures to reduce their high energy costs.
Many bakeries, distilleries, and laundries continue to rely on fuel wood to cover their significant energy demands and represent a potential high-impact intervention area for fuel switching, with benefits for the economy, human health, and the environment.27 Transitioning to more-efficient fuels is a crucial step to confront Haiti’s deforestation problem. Expanding the use of solar water heaters would provide these industries with a cheaper and less environmentally destructive source of energy. Additionally, on-site renewable generation could lower long-term electricity costs. As of July 2014, UNEP is conducting energy surveys of bakeries and laundries in the South Department under the energy portfolio of the Côte Sud Initiative. The project aims to identify viable substitutes for fuel wood to reduce pressure on local forest resources.28
2.5 Encouraging Efficient Household Electricity Consumption
Haiti’s residential sector accounts for 32% of electricity consumption, providing significant opportunities for efficiency improvements. Currently, EDH simply cuts off electricity access to residential customers during the day so that it can provide electricity to commercial and industrial customers during their working hours. By implementing efficiency measures that reduce power demand, EDH would be better equipped to meet demand and would need to cut off the residential electricity supply less often.
2.5.1 Appliance Labeling
As of 2006, significantly fewer than one-third of Haitian households used any electric appliances.29 (See Table 2.1.) Although Haitian households generally consume very little electricity overall, the appliances that are used could be targeted for large efficiency gains, including refrigerators, televisions, and audio appliances.30 (See Figure 2.3.) These appliances often operate well below international efficiency standards. As the country’s economic situation improves and more households are able to afford modern household goods, it will be even more important to target these appliances for efficiency improvements.

Energy Efficiency in Haiti | 41
Energy ratings can be used to indicate appliance efficiency. In the European Union, energy ratings are available for domestic and commercial appliances and range from A to G, with A being the most efficient.31 Higher efficiency ratings of A+ and A++ are available for certain appliances. Although the rating parameters vary slightly depending on the type of appliance, the main criteria assessed are energy consumption (kWh), volume (liters), and noise level (decibels). In addition to providing informational efficiency labels, some countries have programs that provide consumers with financial incentives for purchasing or switching to high-efficiency appliances, such as the U.S. Energy Star program. Efficiency labeling can be applied across all energy-consuming sectors.
Although refrigerators are found only in a small percentage of Haitian households, they account for the vast majority of residential energy consumption and present enormous opportunities for efficiency improvements. The U.S. Energy Star program identifies efficient refrigerators as the appliance with the largest impact on energy savings in the United States.32 Over the past 20 years, the average energy use of U.S. refrigerators has been reduced by 60%.33 Similar progress can be made in Haiti, and since
Table 2.1 Residential Electricity Consumption in Haiti, by Appliance Type
Appliance Type
Share of Households with Appliances
Energy Use per Appliance
Energy Use per Grid- Connected Household
percent kilowatt-hours
Lighting 30 100 100
Television and audio 25 100 84
Refrigerator 13 900 390
Washing machine 1 100 4
Other 20 30 20
Total — — 600
Source: See Endnote 29 for this chapter.
Washing machine, 1%
Other, 3%
Refrigerator65%
TV andaudio14%
Lighting17%
Figure 2.3
Share of Residential Electricity Con-sumption in Haiti, by Appliance Type, 2006Source: MTPTC © Worldwatch Institute

42 | Haiti Sustainable Energy Roadmap
refrigeration will become more common as per capita GDP increases, it should be prioritized in energy efficiency policy.
Additionally, televisions and computers will become more common in Haiti as disposable income increases. Lower-energy-consuming appliances, such as LED televisions, will be an important component of efficient households and offices in the future. The government should consider implementing a labeling program to allow consumers to make more-informed decisions when purchasing high-energy-use appliances.
2.5.2 Lighting
Lighting accounts for 17% of residential electricity consumption in Haiti and is the most common electrical appliance in Haitian households.34 It also offers some of the lowest-cost options for reducing energy use. Every 3 watts of avoided lighting saves 1 watt for cooling needs to address the heat created from light bulbs, reducing the energy required for cooling by 30–40%.35
The two main approaches to maximizing lighting efficiency are: 1) to target communities that still use incandescent light bulbs and to replace these bulbs with more-efficient CFLs or LEDs, and 2) to minimize the need for artificial lighting by relying on building and space design to optimize natural light. (See Sidebar 2.2.) For rural communities, which are of particular interest to Haiti, CFL and LED installations and public lighting retrofits are among the most cost-effective energy efficiency solutions.36
Assuming that all existing lighting in Haitian households is provided by incandescent bulbs, transitioning to CFL or LED bulbs could save the country between 9 and 10% of its current final electricity consumption.37 (See Table 2.2.) Yet although CFL bulbs would save energy and reduce associated costs in Haiti, they contain mercury and must be disposed of carefully. Considering Haiti’s limited waste management capacity, this could pose problems in the short term.
Sidebar 2.2 Lighting Options for Haiti
There are several types of light bulbs with varying levels of efficiency. These include:
Incandescent light bulbs, which produce light by heating a filament wire to a high temperature to make it glow. Incandescent bulbs are used widely in domestic and commercial buildings but are being replaced increasingly in favor of more energy efficient lighting. Incandescent bulbs are relatively inefficient, as about 90% of the energy they consume is lost through waste heat, and only a small amount is actually harnessed to produce visible light.
Compact fluorescent lamps (CFLs), which have a gas-filled tube that generates light when ionized by an electrical discharge. CFLs use less power than incandescent light bulbs to produce the same amount of light. A CFL that consumes energy at the rate of 15 watts produces as much light as an incandescent light bulb that consumes at 60 watts. The light output of CFL bulbs is proportional to the bulb surface area.
Light-emitting diodes (LEDs), which work by moving electrons to release energy in the form of photons. LEDs are more efficient than incandescent light bulbs, as a 10 watt LED is equivalent to a 60 watt incandescent light bulb, and LEDs are being used increasingly for indoor lighting. Unlike CFLs, LED efficiency does not depend on bulb shape or size.

Energy Efficiency in Haiti | 43
Finding ways to enhance natural daylight can maximize lighting efficiency at low cost but may also lead to overheating. Shadowing devices, or “louvers,” angled to let light in while keeping direct sunshine out, can mitigate this potential problem.38 Photo sensors are another easily accessible tool that can be used to improve lighting system energy savings by automatically turning lights off when a building space is unoccupied. Photo sensors detect the presence or absence of a building occupant by using a light transmitter and a photoelectric receiver. In particular, photo sensors can save tremendous amounts of energy in larger and more frequented buildings, such as in the commercial and public services sector.
2.6 Increasing Efficiency in Buildings
Cooling interior spaces requires significant electricity consumption in the commercial and public services sector. Focusing on more-efficient heating, ventilation, and air conditioning (HVAC) systems as well as more-efficient building envelopes can lead to substantial energy savings, particularly in larger commercial and public buildings. Globally, switching to more-efficient air conditioning units can save up to 30% of energy costs spent on cooling.39 Efficient ventilation fans, which use up to 60% less energy than standard ventilation fans, also can contribute to dramatic energy savings at relatively low cost.40 Although few Haitian households currently have HVAC systems, HVAC efficiency should also be considered in the residential sector as household disposable incomes increase. Moreover, high-efficiency HVAC systems should be implemented in the industrial sector as it expands.
Because buildings, unlike energy-consuming components in other sectors, are designed to last for decades, they have particular impact on long-term energy consumption.41 Thoughtful design and construction therefore present significant opportunities for efficiency gains.
Haiti’s tropical climate presents particular cooling challenges. The building envelope—the physical separator between the exterior and the interior environments of a building, including walls, floors, roofs, windows, and doors—is the main tool with which heat can be kept in or out of a building.42 The main indicator used to evaluate the effectiveness of the building envelope in maintaining a comfortable indoor environment is the overall heat transfer coefficient, known as the U-value. A low U-value means
Table 2.2 Potential Energy and Cost Savings from Switching Lighting Technologies in Haiti
Lighting Technology
Power
Consumption per
Light Bulb
Annual Electricity
Consumption per
Appliance
Annual Residential
Consumption per
Technology
Annual Individual Household Mon-
etary Savings with Switch from
Incandescent
Potential Annual Savings
with Switch from
Incandescent
Annual Potential Savings as Share of Total National
Electricity Consump-tion in 2009
watts kWh USD GWh percent
Incandescent 60 100 44.7 — — —
CFL 15 25 11.2 11.70 33.5 9.5
LED 10 16.7 7.5 13.00 37.3 10.6
Source: See Endnote 37 for this chapter. © Worldwatch Institute

44 | Haiti Sustainable Energy Roadmap
that the building materials conserve energy effectively by limiting the transfer of heat in and out of the building. Building orientation also influences the U-value, by influencing how much the building envelope and interior are heated by the sun.43 A variety of different material compositions can be used to achieve a low U-value.
Low U-values help keep buildings warm in winter and cool in summer, and can reduce cooling demands by up to 75%.44 Low U-values indicate good building insulation, meaning that less energy consumption is needed to maintain buildings at a comfortable temperature. The impact of low U-values is especially relevant in roofs, reducing heat gains as a result of the significant amount of solar energy that falls on the roof, and in walls with a low thermal mass.45
Reducing air drafts by ensuring insulation continuity and properly sealed window and door joints improves overall building efficiency. Drafts can be identified by using thermal imaging, although this process can be expensive depending on the size of the surveyed building. Accurate thermal imaging also requires large differences between indoor and outdoor temperatures. This is an important process to undergo for buildings that use air conditioning.
Ensuring high-level performance throughout the life of a building, however, also requires constant upkeep. As buildings age, so does the effectiveness of their electrical and mechanical systems. Building codes and standards can help ensure that both proper insulation and regular maintenance keep buildings efficient and effective, thereby contributing to long-term cost and energy savings. Established building codes such as the International Energy Conservation Code (IECC) provide an excellent base for the development of regulations and standards, but it is also important to assess conditions that are specific to the region in which they are implemented.
Although improving building envelope efficiency has the most potential to save energy in the commercial and public services sector, there is also significant potential for efficiency gains in the residential and industrial sectors. Cool roofs are especially applicable to these sectors because they are inexpensive and quick to implement.46 (See Sidebar 2.3.)
2.7 Increasing Efficiency in Hotels
The hotel and tourism industry in Haiti is energy intensive, due mostly to the requirements for air conditioning, lighting, and water heating. Because of EDH’s unreliable services, nearly all Haitian hotels rely on expensive self-generation. Despite these high energy costs for the tourism industry, hotels have been slow to introduce energy efficiency measures in their long-term plans. A recent assessment of hotels throughout the Caribbean showed that the adoption of energy efficiency measures in air conditioning, lighting, and other end-uses could save 34.4% of the facilities’ electricity costs.47
The Haitian government has signaled that building up the tourism sector is a priority moving forward. Haitian hotels consume 30 GWh of electricity annually, and through energy efficiency measures there is potential to save 7 GWh of electricity and 5.1 kilotons of CO2 annually.48
The necessary investment to reach these targets is estimated at USD 4 million, which would save an

Energy Efficiency in Haiti | 45
estimated USD 2.5 million in energy costs annually.49 This represents a total payback period of only 1.6 years.50 Table 2.3 shows the energy efficiency potential for hotels for the entire Caribbean region, including with specific technology payback periods.51 Air conditioning, controls, lighting, and solar water heaters stand out as having high savings potential and short payback periods.
2.8 Summary
Haiti’s high electricity costs and significant technical and non-technical losses mean that energy efficiency improvements would result in significant cost savings. Given the current shortage of supply, such measures would also help expand electricity services. Improving power generation efficiency and reducing grid losses in Haiti—both of which fall far short of international standards—are a first step to reducing electricity prices for consumers.
End-use improvements and standards for key sectors can achieve significant additional energy savings. Further studies assessing the potential energy efficiency gains in the agricultural and textile industries
Sidebar 2.3 Cool Roofs for Haiti
Given Haiti’s climate, cool roofs—which reflect light and emit heat more efficiently than traditional roofs—are an effective and inexpensive way to increase building efficiency. In warm climates, dark roofs can reach temperatures above 65.5 degrees Celsius (°C), while cool roofs can help to reduce roof temperature by about 10°C. They are most effective and economical in climates that are hot year-round, making Haiti an ideal location for their use.
The many direct benefits of cool roofs include reduced air conditioning demands, resulting in lower energy bills. In buildings without air conditioning, they make indoor climates cooler and more comfortable. They also extend a roof’s lifetime. Indirect benefits include reducing local temperatures by reflecting more solar radiation back to the atmosphere. By reducing air conditioning needs, cool roofs also reduce overall power demand and lead to load shaving. In Haiti’s case, this would allow EDH to meet a greater share of the country’s power demand with existing generation capacity. Load shaving also would reduce greenhouse gas and particulate emissions.
The two measures used to evaluate a cool roof are solar reflectance and thermal emittance. Solar reflectance is the ability of a roof to reflect sunlight, and is measured on a scale of 0 to 1; the more reflective a surface, the higher its score. For example, if a roof reflects 60% of incoming sunlight, its solar reflectance is 0.6. Dark roofs typically have a solar reflectance of 0.05–0.2, whereas lighter roofs are in the range of 0.55–0.9. The more sunlight a roof reflects, the less heat it (and therefore the building) absorbs. Lighter-colored roofs thus help to cool down roofs and building spaces.
Thermal emittance measures how effectively a space emits thermal radiation. Like solar reflectance, it is measured on a scale of 0 to 1. If a material can perfectly emit all of its thermal radiation, it has a thermal radiation of 1. Most non-metallic surfaces have thermal emittances of 0.8–0.95. The higher a roof’s thermal emittance, the cooler the building space will be as heat will more easily escape through the roof.
Generally, the Solar Reflectance Index (SRI)—calculated by combining the solar reflectance and thermal emittance of a roof on a scale from 0 to 100—is used to measure the coolness of a roof. The higher a roof’s SRI, the cooler it is. Dark roofs typically have an SRI of less than 20. The U.S. Green Building Council defines a cool roof as a low-sloped roof with an SRI of at least 78 and a steep-sloped roof with an SRI of at least 29.
Source: See Endnote 46 for this chapter.

46 | Haiti Sustainable Energy Roadmap
should be prioritized. In the residential sector, lighting and refrigeration show the most potential for energy savings. HVAC systems and building envelope improvements could save the commercial and public services sector significant energy and money as well.
Despite the economic motivation for energy efficiency improvements, lack of awareness of these benefits and upfront financing costs still pose a barrier to implementation. (See Chapter 7 for a discussion of existing financing options and capacity building needs, and Chapter 8 for additional recommended energy efficiency programs and standards.)
Table 2.3 Savings from Installing Energy Efficiency Equipment in Hotels in the Caribbean
Equipment Electricity Savings Cost Savings Investment Payback Period
GWh million USD years
Air conditioning 340 105 185 1.8
Efficiency controls 76 24 41 1.7
Exhaust fan 3 1 1 1.5
Lighting 83 24 18 0.7
Pool pumps 19 5 3 0.6
Pumps 8 2 1 0.5
Solar hot water 47 8 9 1.1
Solar PV 36 10 39 3.8
Window film 35 9 19 2.0
Source: See Endnote 51 for this chapter.

Haiti’s Renewable Energy Potential | 47
Key Findings
• Haiti has excellent renewable energy potential, especially for solar and wind energy; based on assessed resources, the country has the theoretical potential to meet its entire electricity demand with renewable resources and technologies that are available today.
• The Port-au-Prince metropolitan area, home to a quarter of the country’s population, has some of the greatest solar and wind resources.
• Solar energy potential is extremely strong across the entire country and consistently strong throughout the year, even in winter months. An estimated six square kilometers of solar PV panels would be able to generate as much electricity as Haiti currently produces.
• Distributed solar PV generation at the household and commercial levels can play an important role in Haiti’s energy mix. Solar PV has demonstrated that it is capable of powering major energy consumers, such as the Mirebalais Hospital, and it provides opportunities to feed renewable electricity from self-producers back into the grid.
• Several locations in Haiti have extremely strong wind energy potential. Just a few medium-sized wind farms throughout the country could provide a majority of Haiti’s current power demand. Depending on the location, between 6 and 12 square kilometers of wind farms could generate as much electricity as Haiti currently produces.
• Wind energy potential varies throughout the day and year, meaning that installation sites need to be chosen carefully and in accordance with other production areas, sources, and load centers. Lac Azeui stands out as having very strong and consistent wind resources throughout the day and year.
• Developing additional small hydropower capacity can provide relatively cheap power for currently underserved and remote areas of Haiti.
• There is significant potential for waste-to-energy in Haiti, although the lack of a coordinated system for collecting waste throughout the country remains a major barrier.
• Biomass potential remains significant in Haiti. In particular, unused waste from sugar cane could provide significant amounts of power.
• Although Haiti has no potential for geothermal power development, geothermal heating and cooling systems could be used in facilities like government offices, commercial buildings, and hotels.
• There is currently no marine energy development in Haiti, although interest has been shown across a few sites and costs continue to come down globally.
3 | Haiti’s Renewable Energy Potential

48 | Haiti Sustainable Energy Roadmap
In areas where the existing electricity grid is unreliable or inaccessible, consumers who can afford it often rely on self-generation to ensure adequate power supply. In the Caribbean, this has been done traditionally through the use of privately owned diesel generators, an inefficient and often expensive source of power that contributes to local pollution. Increasingly, however, consumers—including hotels, businesses, and private institutions—are turning to renewable energy. This chapter assesses Haiti’s physical renewable energy resources, specifically solar, wind, small hydro, biomass, waste-to-energy, wave and tidal, and geothermal.
3.1 Building on Existing Assessments
A variety of studies have estimated the renewable energy resource potential in Haiti, providing an important overview of resource availability. (See Appendix I.) In the cases where the studies are detailed and cover a broad expanse of Haiti’s geography, their results have been included here to supplement our own assessments.
This Roadmap includes assessments of Haiti’s solar, wind, biomass, hydropower, and waste-to-energy potential. Exclusive in-depth analysis of the solar resource in six locations (Cul de Sac, Les Cayes, L’île de la Tortue, Parc Sonapi, Péligre, and Port-de-Paix) and the wind resource in six locations (Morne à Cabrit, La Gonâve, Morne Vent, Môle Saint-Nicolas, Lac Azuéi, and Tiburon) were conducted for this study. Key insights are discussed in the following chapter, and the complete reports are available in the Appendices.
The solar locations were chosen in close deliberations with the Office of the Minister Delegate to the Prime Minister for Energy Security after examining national resource maps and selecting areas with both high resource potential and proximity to population centers. In Port-au-Prince, the commercial center of Haiti and home to one-quarter of the population, solar energy provides the unique opportunity for commercial and residential power generation and water heating. Haiti does not have a country-wide power grid, leaving many communities without access. In addition to utility-scale solar, this report discusses the potential for rural electrification through standalone solar systems.
The Office of the Minister Delegate also advised on the selection of the six wind zones. The selection was based on careful review of national assessments, choosing areas with high wind potential and proximity to both population centers and transmission systems. Previous assessments performed by E3/Windenergy were done at a 50-meter hub height; however, the Worldwatch assessment is done at an 80-meter height, which allows for the siting of utility-scale wind turbines. The U.S. National Renewable Energy Laboratory (NREL) also has performed a wind study, but this was done at a lower resolution and the data are not readily available.
Worldwatch’s analysis is intended to inform plans for Haiti’s central transmission and generation mix, providing a window into the aggregate renewable energy potential of the studied regions and exploring the effects of geographic dispersion on fluctuations in power generation. The analysis is too coarse, however, to capture the small and localized phenomena that can cause, for example, dramatic shifts in wind speed that result in deviations from estimated generation. Moreover, the power estimates in our wind analysis are calculated only in gross (not net) terms, and cannot be relied upon for specific development purposes.

Haiti’s Renewable Energy Potential | 49
A future site-specific evaluation would evaluate these issues as a logical next step, using observational data and further modeling to obtain a more accurate understanding of a site’s solar or wind potential.
Additionally, Worldwatch’s analysis provides an overview of hydropower and biomass potential in Haiti. Both of these resources are already being utilized in the country and have the potential to contribute significantly to centralized and off-grid electricity generation.
3.2 Solar Power Potential
3.2.1 The Global Solar Power Success Story
Today, a suite of relatively mature technologies is available to convert the sun’s energy into electricity. These generally fit into one of two categories: photovoltaic (PV) modules that convert light directly into electricity, and concentrating solar thermal power (CSP) systems that convert sunlight into heat energy that is later used to drive an engine. Solar power can operate at any scale, but whereas CSP systems are considered viable typically only as utility-scale power plants, PV technology is modular and can be scaled for use on a household rooftop, in medium-size settings such as resorts and industrial facilities, or as part of a large network of utility-scale PV farms.
Traditionally, solar power has not been cost competitive with conventional electricity generation, due in part to the high level of direct and indirect subsidies benefiting fossil fuels.1 Government support, whether in the form of feed-in tariffs, renewable portfolio standards, tax credits, or other mechanisms, has been necessary to help level the playing field and accelerate the adoption of solar technologies. But costs for solar systems are falling rapidly, and an oversupply of modules may further speed this decline. The price of crystalline silicon PV modules fell by 45% in only two years, from USD 4.05 per watt in 2008 to USD 2.21 per watt in 2010, and is projected to fall to USD .36 per watt by the end of 2017.2 Solar is already cost competitive in many situations: PV installations in the Persian Gulf region, for example, are offsetting oil-generated electricity, bringing positive returns.3 The 39% increase in new PV installations worldwide in 2013 alone was a result of both strong support policies and rapidly declining technology costs.4
Until recently, CSP costs were lower than for solar PV; however, the dramatic reduction in PV costs over the past few years has made PV technology comparable or even cheaper than CSP. Nevertheless, further CSP cost reductions are expected as commercial deployment of the technology expands. More-efficient generation technologies and improved storage are projected to reduce CSP capital costs by up to 40% or more by 2020.5 Although CSP can be an effective technology at an industrial scale, its high water consumption relative to other renewable energy sources is an issue, making CSP less attractive for small-island states and other countries that have limited freshwater supplies. The global CSP market grew by 60% in 2012 and 36% in 2013 to reach a total installed capacity of 3.4 GW; on the other hand, the global solar PV market reached a total installed capacity of 139 GW in 2013.6
In addition to providing electricity, solar energy is commonly used for heating water and spaces, replacing electric or gas systems. Solar water heating can be active or passive, meaning that the systems either use pumps and controllers to move and regulate the water, or rely only on convection. Active systems are more efficient but are also more expensive and require significantly more maintenance. Passive systems have

50 | Haiti Sustainable Energy Roadmap
no moving parts and are valued for their simplicity. Solar hot water systems are broadly cost competitive globally, with payback periods under two years in many cases. In 2013, global solar water heating capacity reached 325 gigawatts-thermal.7
In small-island states, the attractiveness of solar water heating is clear. Cyprus is the world leader in installations per capita, and Barbados’ experience is considered a Caribbean renewable energy success story.8 Duty-free equipment imports and tax incentives in Barbados have created a thriving market, with 40,000 solar hot water systems installed on homes, businesses, and hotels, as well as a market penetration of 33% for residential buildings.9 The success of this project was cited explicitly by the IDB in announcing a multimillion-dollar loan to the country for continued renewable energy development.10
3.2.2 Current Status of Solar Energy in Haiti
Solar PV systems are being used on a small scale throughout Haiti. Several initiatives—including the Boucan Carré installation, the ongoing “Ban m Limyè, Ban m Lavi” program, and the self-generation efforts at Mirebalais and Bernard Mevs Hospitals (see Case Study 1)—demonstrate the feasibility of solar PV in the country.11 EarthSpark, an organization with the goal of eradicating energy poverty in Haiti, has opened a store that sells solar-powered merchandise. This includes solar lamps, which have helped families save money compared to the use of kerosene and candle light, and have also enabled many storefronts to stay open later and led to new business enterprises such as mobile phone charging stations. Sirona Cares Foundation is implementing a solar-charged battery rental scheme in several Departments, which includes a 2 kW charging station capable of servicing 100 batteries rented to customers on a monthly basis for a tariff that includes recharging fees.12
Although solar energy development has been limited in Haiti to this point, it has had a transformative impact in the communities where it is used. The country has yet to utilize solar water heating at any meaningful scale, yet solar hot water represents a low-hanging fruit for increasing the uptake of renewables in the country, with costs being far below those of PV per unit of energy generated.
3.2.3 Haiti’s Impressive Solar Energy Potential
Resource mapping undertaken exclusively for this Roadmap indicates that Haiti has tremendous solar potential. The global horizontal irradiance, or GHI, ranges from 5 to 7 kilowatt-hours per square meter per day (kWh/m2/day) throughout most of the country and nears 8 kWh/m2/day in some regions.13 (See Sidebar 3.1 and Figure 3.1.) By comparison, Germany, which has nearly half of the world’s installed solar PV capacity, has few locations with a GHI over 3.0 kWh/m2/day, and virtually none above 3.5 kWh/m2/day, and Phoenix, Arizona—a city in the U.S. southwest famed for its solar potential—has an average GHI of 5.7 kWh/m2/day.14 Although all of Haiti has a relatively uniform and strong solar resource, the greater Port-au-Prince area and the coastal region between Gonaïves and Saint-Marc show particular potential, which is especially important given that these areas are dense population centers.
In addition to the nationwide solar resource map (see Figure 3.1), our study performed detailed analysis for six zones within Haiti: Cul de Sac, Les Cayes, L’île de la Tortue, Parc Sonapi, Péligre, and Port-de-Paix.15 (See Figure 3.2.) Each zone is 50 kilometers by 50 kilometers (centered on the identified location) and is split into high-resolution grid points of approximately 1 kilometer by 1 kilometer. All six zones have very strong solar resources by global standards: the monthly average GHI is extremely high from April to August and strong even during the winter months at the weakest sites, showing less

Haiti’s Renewable Energy Potential | 51
Case Study 1 Solar Self-Generation in Haiti: L’Hôpital Universitaire de Mirebalais
In Haiti, L’Hôpital Universitaire de Mirebalais (HUM), constructed in 2013, illustrates the degree to which self-generation from affordable, renewable electricity sources can have broad, positive impacts.
Even before the disastrous 2010 earthquake, Haiti’s electricity and public health systems ranked among the worst in the Western hemisphere. In addition to damaging energy infrastructure and disrupting already-limited electricity services, the quake ruined existing health clinics, killed many skilled medical professionals and nursing students, and severely damaged the General Hospital in Port-au-Prince.
HUM, a joint initiative of Boston-based Partners in Health and Haitian organization Zanmi Lasante, is a 205,000-square-foot, solar-powered facility with 300 beds. When fully operational, it will provide primary care services to an estimated 185,000 people in Mirebalais and nearby communities, with patients from Central Haiti and Port-au-Prince able to access secondary and tertiary care. As the largest hospital in the country—with six operating rooms, a neonatal intensive care unit, and the only public facility in Haiti with a CT-scan machine—HUM will serve as a teaching hospital for the next generation of Haitian nurses, medical students, and physicians, helping to build much-needed human capacity.
Renewable energy has been at the core of the hospital’s design and mission since its inception. HUM is powered by 1,800 rooftop solar panels producing a total of 400 kW, enough to cover 100% of the hospital’s electricity needs even during peak hours; often, surplus power can be fed back into the grid. Although the hospital is currently negotiating the terms and compensation of this arrangement with EDH, this could serve as a broader model for feeding self-generated renewables into the grid in both the country and the region. Already, following the example of HUM, the first phase of a solar power system has been installed at another hospital, L’Hôpital Bernard Mevs in Port-au-Prince.
If greater effort is made to communicate the role that solar energy is playing—and can play—in improving public health services in Haiti, as well as the fact that HUM is able to feed its excess energy back into the grid, this could galvanize interest in and support for solar self-generation throughout the country.
Source: See Endnote 11 for this chapter.
Sidebar 3.1 Key Measurements of Irradiation and Their Application to Solar Resource Analysis
The solar assessment for Haiti produced by 3TIER for Worldwatch includes three different measurements for solar irradiation: global horizontal irradiance (GHI), direct normal irradiance (DNI), and diffuse horizontal irradiance (DIF).
Measurement Description Application
GHI Total solar radiation per unit area that is intercepted by a flat, horizontal surface.
Solar PV installations
DNI Total direct beam solar radiation per unit area that is intercept-ed by a flat surface that is at all times pointed in the direction of the sun.
CSP installations and installations that track the position of the sun
DIF Diffuse solar radiation per unit area that is intercepted by a flat, horizontal surface that is not subject to any shade or shadow and does not arrive on a direct path from the sun.
Some PV installations that are best suited to diffuse radiation (DIF is included in the GHI calculation)
Based on the specific conditions of Haiti’s solar resource and the suitability of specific solar technologies, this assessment focuses mostly on the country’s GHI measurements for solar PV installations and DNI for solar water heating applications.
For additional detail, see Appendix II.

52 | Haiti Sustainable Energy Roadmap
variation throughout the year than many of the leading solar geographies in the world.16 (See Figure 3.3.) This chapter details the data for Les Cayes, because it represents well the seasonal and diurnal variation of the other sites.17 (See Case Study 2.) For an extensive analysis of the other five regions, see Appendix III.
Figure 3.2
Map of 3TIER Solar Resource Assess-ment Locations in HaitiSource: 3TIER
Figure 3.1
Average Global Horizontal Irradiance (GHI) in HaitiSource: 3TIER

Haiti’s Renewable Energy Potential | 53
Aver
age
GH
I (kW
h/m
2 /day
)
Jan Mar May Jul SepFeb Apr Jun Aug Oct Nov Dec0
1
2
3
4
5
6
7
8
Figure 3.3
Comparison of Monthly Average GHI, Six Haitian Zones versus GermanySource: 3TIER, DWD © Worldwatch Institute
Cul de SacParc SonapiPéligrePort de PaixL’île de la TortueLes CayesGermany
Case Study 2 Les Cayes Zonal Assessment
Les Cayes is Haiti’s most important southern seaport, home to an estimated 71,000 people and located on the southern peninsula nearly 200 kilometers southwest of Port-au-Prince. Les Cayes’s solar resource is average for Haiti but very strong by global standards, with a long-term mean GHI of 235.2 W/m2 (5.65 kWh/m2/day) and a long-term mean DNI of 221 W/m2 (5.30 kWh/m2/day. (See Figure 3.4.) This compares favorably with most of the Caribbean region and is significantly higher than in areas of Europe and Asia that boast high penetration of solar power. Les Cayes’s mean DIF is 1.94 kWh/m2/day (80.6 W/m2).
Figure 3.4
Average Long-Term DHI and DNI in Les Cayes, 1997–2011 Source: 3TIER

54 | Haiti Sustainable Energy Roadmap
The monthly mean GHI varies throughout the year, peaking in the summer months from June to August and reaching a high in July of 276.8 W/m2 (6.64 kWh/m2/day). (See Figure 3.5.) GHI remains high in March, April, May, and September, ranging from 5.76 to 6.06 kWh/m2/day, and drops to a low of 4.43 kWh/m2/day in December, although this is still much higher than in many regions of the world that use solar energy. The monthly mean DNI remains relatively constant throughout the year, with a high of 5.65 kWh/m2/day in January and a low of 4.82 kWh/m2/day in October. DNI monthly means are much more variable than GHI from year-to-year, however.
During the course of the day, GHI peaks in the early afternoon throughout the year, at its highest between 10 a.m. and 3 p.m. and usually peaking between noon and 1 p.m. (See Figure 3.5.) The peak hourly mean is consistently more than three times higher than the daily mean. DNI is also highest during the middle of the day, but because it involves tracking the sun’s movement, the peaks more closely resemble plateaus that last from 9 a.m. to 4 p.m.
Overall, solar potential is extremely high in Les Cayes. One square kilometer of solar PV panels would generate on average 5.65 kWh per day, which is significantly more electricity than the average Haitian family consumes on an average day.
Source: See Endnote 17 for this chapter.
3.2.4 Positive Effects of Wind and Temperature on Solar Energy Potential
Both ambient temperatures and the presence of wind can influence a site’s potential to generate solar energy. Under standard test conditions (STC), which assume a module temperature of 25°C, a single Aleo Solar S16 175 photovoltaic module (with a power rating of 175 watts) can generate a gross annual yield
Figure 3.5
Seasonal and Diurnal Variability of GHI and DNI at Les Cayes Source: 3TIER

Haiti’s Renewable Energy Potential | 55
of 397 kWh on average. This means that a one-square-kilometer area could produce 144 GWh of power annually, some 16.5% of total electricity generation in Haiti in 2011.18 (See Table 3.1.)
When the module temperature rises, however, PV systems experience significant power degradation. For each degree above STC, the module loses roughly 0.5% of its capacity. Additional variables can further affect generation. For example, the conversion from STC to utility-scale test conditions (so-called PTC, which assume a 20°C ambient temperature and a module temperature that is 20–30°C above ambient), plus a wind speed of 1 meter per second (m/s), results in a capacity loss of as much as 11%.
The six study sites in Haiti experience similar average temperatures (between 24.2°C and 26.1°C), so efficiency losses resulting from panel warming would be fairly uniform across all sites. Five of the six sites, however, experience relatively consistent winds above 3 m/s, which would help to cool off modules and make them more efficient, resulting in estimated gross annual yields of as high as 413 kWh.19 (See Table 3.2.) Only Péligre experiences low wind speeds (average 1.8 m/s), contributing to its lower projected yield of 392 kWh. Even though Les Cayes, Parc Sonapi, and Port-de-Paix have GHI levels equal to or less than Péligre, they have higher estimated gross annual yields due to their higher average wind speeds. L’île de la Tortue still has the lowest projected yield as a result of having the lowest average GHI.
3.2.5 Summary of Solar Energy Potential
A majority of Haiti’s territory appears to have an average GHI of at least 6 kWh/m2/day, signaling that solar PV is a strong candidate to provide additional power capacity in populated regions like Port-au-Prince. Our analysis shows that with six square kilometers of solar panels, Haiti would be able to generate annually as much electricity as its current grids generated in all of 2011. Overall, all six study sites appear capable of supporting utility-scale PV generation, and solar potential peaks during the summer months for all study sites.
Additionally, solar PV is a potential electrification solution that could provide decentralized power in
Table 3.1 Potential Gross Annual Solar PV Module Yields in the Six Haitian Zones
Site
Annual Generation per 175 Watt
Module*
Annual Generation per Square Kilometer†
Total Solar Panel Area Needed to Meet Haiti’s 2011
Power Generation
Share of 2011 Generation from One Square Kilometer
of PV Modules
kWh GWh km2 percent
Cul de Sac 413.2 149.9 5.59 17.1
Parc Sonapi 405.5 147.1 5.70 16.8
Port-de-Paix 403.7 146.5 5.72 16.7
Les Cayes 397.0 144.0 5.82 16.5
Péligre 392.3 142.3 5.89 16.3
L’île de la Tortue 391.8 142.2 5.89 16.2
* Includes effects of wind and temperature. †Assumes that energy production per meter is cut in half to account for maintenance, the prevention of shading, and construction of other equipment. Source: See Endnote 18 for this chapter. © Worldwatch Institute

56 | Haiti Sustainable Energy Roadmap
many rural communities. The study sites also appear suitable for solar water heating and residential and commercial solar PV installations, although they may not be ideal for CSP development since DNI levels are lower due to fairly significant cloud cover in these locations.
Although all six study sites studied in detail in this Roadmap have strong solar energy potential, other sites in Haiti boast even higher GHI levels, above 7 kWh/m2/day. At the grid scale, solar PV or CSP development may be viable between Saint-Marc and Gonaives and around Cap-Haïtien. Opportunities also exist for off-grid solar development, especially in rural communities outside of cities like Port-au-Prince.
3.3 Wind Energy Potential
3.3.1 Global Status of Wind Energy
Outside of hydropower, wind has been by far the most successful renewable electricity source, with 318 GW of wind power installed globally by the end of 2013.20 In some markets, the costs of wind power are estimated at 4–7 U.S. cents per kWh in attractive locations, making it fully competitive with fossil fuels.21
Although turbines come in many sizes, wind power is used mostly for utility-scale generation because the lower wind speeds accessible by most smaller turbines make the units less efficient. This means that wind power is most often used as a centralized source of electricity generation, in contrast to solar PV systems that can be effective at a small, distributed scale. Decentralized wind power is becoming an increasingly viable option, however, with the growth of small-scale wind power systems, including 50–100 kW wind-diesel hybrid systems in the Caribbean, and a U.S.-funded project in Dominica aimed at demonstrating the viability of facilities under 250 kW.22
Wind turbines can provide on-site electricity generation for large electricity consumers such as a factory or a farm. Unlike traditional on-site thermal generators, however, wind is intermittent and cannot be started up at will. Connecting these turbines to the grid can increase the value of the electricity significantly, as landowners are able to sell excess power.
Table 3.2 Effects of Wind and Temperature on Solar PV Module Yields in the Six Haitian Zones
Site
Average GHI
Average DNI
Average DIF
Average Wind Speed
Average Temperature
Estimated Gross Annual Yield
(W/m2) · day m/s °C kWh
Cul de Sac 5,796 5,602 1,909 4.9 25.7 413.2
Parc Sonapi 5,707 5,436 1,949 5.1 26.1 405.5
Port-de-Paix 5,578 5,258 1,943 6.6 25.8 403.7
Les Cayes 5,645 5,304 1,935 3.3 25.9 397.0
Péligre 5,707 5,472 1,860 1.8 25.1 392.3
L’île de la Tortue 5,472 5,057 1,967 4.7 24.2 391.8
Source: See Endnote 19 for this chapter. © Worldwatch Institute

Haiti’s Renewable Energy Potential | 57
3.3.2 Current Status of Wind Energy in Haiti
The Haitian government has identified wind power as a national priority, determining that the resource should be developed wherever there is evidence that it may be economically viable.23 There are currently no wind turbines operating in Haiti. In 2009, the Belgian company 3E performed wind potential assessments for five regions of the country at a 50-meter hub height, and in 2010 the U.S.-based NREL performed a national assessment at an 80-meter hub height.
3.3.3 Wind Energy Potential
Like much of the Caribbean, Haiti benefits from trade winds, the year-round steady winds that enter the region from the northeast and strengthen in the winter. Most of the country has sites where the average annual wind speed is at least 6 m/s at a hub height of 80 meters. This suggests good wind power potential: according to a global study, roughly 13% of locations measured worldwide have wind speeds of 7 m/s or greater, which is generally an indication that low-cost wind energy development is possible.24
Haiti’s greater Port-au-Prince area and southwestern and northern regions show the most potential for wind power.25 (See Figure 3.6.) The population centers of Port-au-Prince, Gonaïves, and Port-de-Paix are all located near regions with average annual wind speeds of 7–9 m/s, and a corridor of very strong wind potential connects the latter two cities. Strong annual average wind speeds of around 7 m/s are found near Miragoâne, Les Cayes, and the southern part of the province of Nord-Est.
3.3.4 Wind Resource by Zone
In addition to producing a nationwide wind resource map (see Appendix IV for methodology), 3TIER performed more granular analysis for six zones: Lac Azuéi, La Gonâve, Môle-Saint-Nicolas, Morne à Cabrit, Morne Vent, and Tiburon.26 (See Figure 3.7.) The data represent mean data for several points
Figure 3.6
Average Wind Speeds in Haiti at 80 MetersSource: 3TIER

58 | Haiti Sustainable Energy Roadmap
assessed in each zone, which were selected not to reflect actual wind farms, but rather to best characterize the entire wind zone. This chapter examines in detail the data for Lac Azuéi, Haiti’s most promising wind site.27 (See Case Study 3.) For analyses of the other five zones, see Appendix V.
Overall, Haiti has a strong wind potential that is suitable for wind power development. The average gross capacity factors at 80 meters for each zone range from 26.5% (mean wind speed of 5.08 m/s) to 62.6% (mean wind speed of 8.13 m/s).28 (See Table 3.3.) Five of the six zones have an average gross capacity factor at 80 meters above 30%, the minimum value that is often used to determine if a site is suitable for commercial wind development.
It should be noted that no on-site data were available for this study. The data came from raw model outputs, and should be used to guide future on-site studies for project development. Meteorological on-site data should be collected for at least one year before project construction begins.
3.3.5 Summary of Wind Energy Potential
Haiti has strong wind energy potential overall, and several regions demonstrate resource capacities that are suitable for wind power development. Although most regions of the country are located near sites with average annual wind speeds of at least 6 m/s, the greater Port-au-Prince area and the southwestern and northern regions show the most potential. Despite variability across the country, most study sites demonstrate a peaking resource in the late night and early morning, as well as seasonal peaks during the summer months, which could help to meet cooling needs during the slightly warmer season.
Of the six study sites, five have an average assessed capacity factor above 30%, a level that is deemed suitable for wind energy development. Lac Azuéi and Morne à Cabrit show the most exceptional potential of the assessed sites, with average capacity factors above 50% at the 80-meter hub height. Lac Azuéi, besides
Figure 3.7
Map of 3TIER Wind Resource Assess-ment Locations in HaitiSource: 3TIER

Case Study 3 Lac Azéui Regional Assessment
Lac Azuéi, also known as Étang Saumatre, is Haiti’s largest lake, located 22 kilometers east of Port-au-Prince on the Plaine du Cul de Sac along the border with the Dominican Republic. The strong wind resource in this couloir de vent (wind corridor) has been known for some time, and there has been serious consideration of developing a wind park in the area.
Lac Azuéi has the highest average wind speed of the six study sites, at 8.13 m/s at an 80-meter hub height for all 18 points, measured over a 25-year period. (See Figure 3.8.) This reflects annual variation from an average high of 9.3 m/s in 1997 to an average low of 7.2 m/s in 2010. The average capacity factor over the 25-year period is 62.6% at an 80-meter hub height.* Although the average wind speed varies significantly among the 18 points measured—ranging from 6.71 m/s (a capacity factor of 48%) to 9.44 m/s (a capacity factor of 76%)—even the lower end of this range would still be commercially viable for a wind farm. Furthermore, this site is particularly attractive due to its proximity to Haiti’s largest load center (Port-au-Prince) and the border with the Dominican Republic, which provides potential opportunities for interconnection.
On a seasonal basis, wind speeds are greatest in Lac Azuéi from June to August, with average speeds during this period ranging from 9 m/s (August) to greater than 10 m/s (June and July). This corresponds to an average capacity factor of at least 75% during these months. April has the lowest average wind speed, although it is still nearly 7 m/s, which translates to an average capacity factor of just under 50%. (See Figure 3.9.) On a diurnal basis, Lac Azuéi shows less variation than most other sites assessed in this study, peaking in the early afternoon from about 2 p.m. to 7 p.m. and reaching a low from 1 a.m. to 6 a.m. (when power demand is lowest); even so, the average capacity factor remains at or above 60% during these hours. (See Figure 3.10.)
Haiti’s Renewable Energy Potential | 59
Figure 3.8
Average Wind Speed at Lac Azuéi Source: 3TIER

60 | Haiti Sustainable Energy Roadmap
* See Annex V for information regarding the methodology used in referenced wind assessments. Source: See Endnote 27 for this chapter.
having the highest overall potential, shows little diurnal variation, making it the most attractive wind site in Haiti. Just over six square kilometers of wind turbines in Lac Azuéi would be able to generate as much electricity in one year as all of Haiti generated in 2011; Morne à Cabrit would be able to accomplish the same feat with just 7.5 square kilometers of wind turbines.29 (See Table 3.4.)
Perc
enta
ge
Jan Mar May Jul SepFeb Apr Jun Aug Oct Nov Dec0
20
40
60
80
100
Figure 3.9
Seasonal Variation in Wind Power Capacity Factor in Lac Azuéi Source: 3TIER
Perc
ent
0 4 8 12 162 6 10 14 18 20 2422Hour of Day (UTC)
55
60
65
70
Figure 3.10
Diurnal Variation in Wind Power Capacity Factor in Lac Azuéi Source: 3TIER
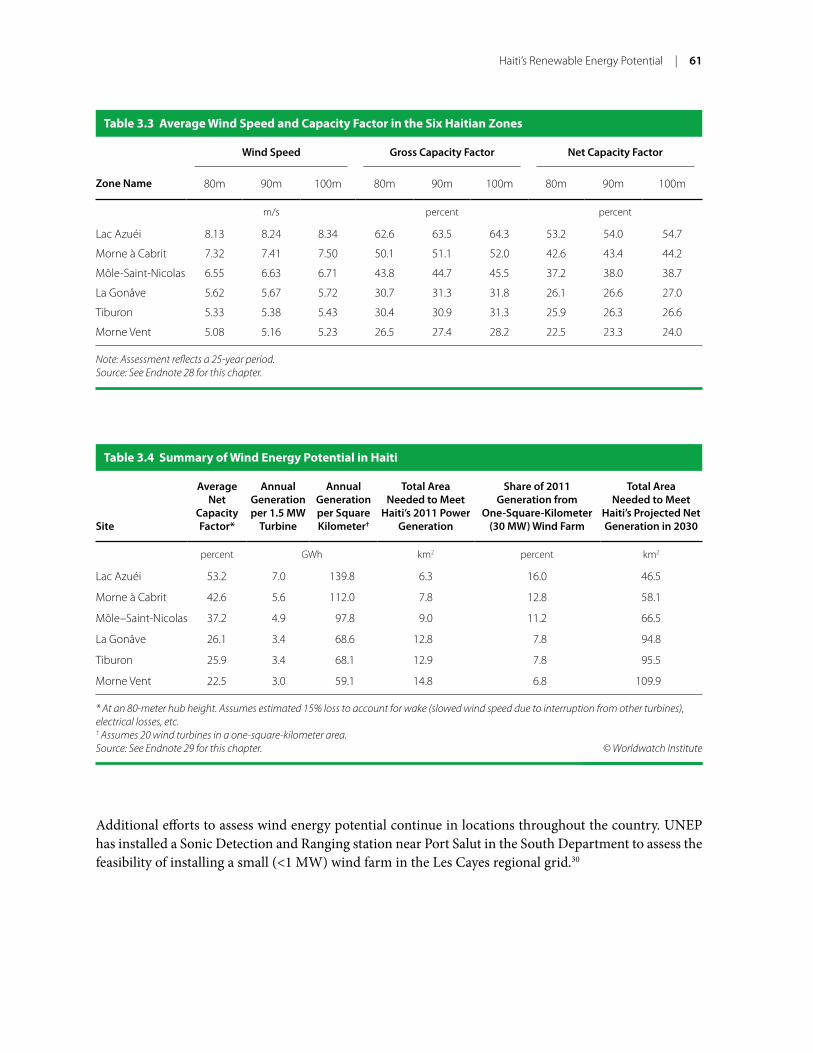
Haiti’s Renewable Energy Potential | 61
Additional efforts to assess wind energy potential continue in locations throughout the country. UNEP has installed a Sonic Detection and Ranging station near Port Salut in the South Department to assess the feasibility of installing a small (<1 MW) wind farm in the Les Cayes regional grid.30
Table 3.3 Average Wind Speed and Capacity Factor in the Six Haitian Zones
Wind Speed Gross Capacity Factor Net Capacity Factor
Zone Name 80m 90m 100m 80m 90m 100m 80m 90m 100m
m/s percent percent
Lac Azuéi 8.13 8.24 8.34 62.6 63.5 64.3 53.2 54.0 54.7
Morne à Cabrit 7.32 7.41 7.50 50.1 51.1 52.0 42.6 43.4 44.2
Môle-Saint-Nicolas 6.55 6.63 6.71 43.8 44.7 45.5 37.2 38.0 38.7
La Gonâve 5.62 5.67 5.72 30.7 31.3 31.8 26.1 26.6 27.0
Tiburon 5.33 5.38 5.43 30.4 30.9 31.3 25.9 26.3 26.6
Morne Vent 5.08 5.16 5.23 26.5 27.4 28.2 22.5 23.3 24.0
Note: Assessment reflects a 25-year period. Source: See Endnote 28 for this chapter.
Table 3.4 Summary of Wind Energy Potential in Haiti
Site
Average Net
Capacity Factor*
Annual Generation per 1.5 MW
Turbine
Annual Generation per Square Kilometer†
Total Area Needed to Meet
Haiti’s 2011 Power Generation
Share of 2011 Generation from
One-Square-Kilometer (30 MW) Wind Farm
Total Area Needed to Meet
Haiti’s Projected Net Generation in 2030
percent GWh km2 percent km2
Lac Azuéi 53.2 7.0 139.8 6.3 16.0 46.5
Morne à Cabrit 42.6 5.6 112.0 7.8 12.8 58.1
Môle–Saint-Nicolas 37.2 4.9 97.8 9.0 11.2 66.5
La Gonâve 26.1 3.4 68.6 12.8 7.8 94.8
Tiburon 25.9 3.4 68.1 12.9 7.8 95.5
Morne Vent 22.5 3.0 59.1 14.8 6.8 109.9
* At an 80-meter hub height. Assumes estimated 15% loss to account for wake (slowed wind speed due to interruption from other turbines), electrical losses, etc. † Assumes 20 wind turbines in a one-square-kilometer area. Source: See Endnote 29 for this chapter. © Worldwatch Institute

62 | Haiti Sustainable Energy Roadmap
3.4 Hydropower Potential
3.4.1 Global Status of Hydropower Technology
Hydropower accounts for the majority of renewable power generation worldwide, and it reached a total of 1,000 GW installed capacity by the end of 2013.31 But despite being a low-carbon, renewable energy source, large hydro often has serious environmental and socioeconomic impacts, including widespread ecosystem disruption and occasional large-scale displacement of populations.32 China’s controversial 20 GW Three Gorges Dam, for example, forced the relocation of 1.3 million local residents and has resulted in significant erosion and landslide dangers.33 Worldwatch’s analysis therefore concentrates primarily on the potential for small-scale hydropower development, which typically has fewer negative human and ecological impacts.
Small hydropower is used around the world, especially in remote areas, and can be an important renewable resource for powering communities that lack access to national electricity grids. Often classified as hydropower that generates less than 10 MW of electricity*, small hydropower can operate as “run-of-the-river” systems that divert water to channels leading to a waterwheel or turbine, or, similar to larger hydropower stations, it can operate as dammed systems that have small-scale storage reservoirs. Hydropower with small-scale storage reservoirs has the added benefit of being able to store potential energy that can then be released when other renewables are not producing. Although not as common around the world, seawater pumped-storage hydro is another form of hydropower that could play a role in energy storage.
Among the advantages of small hydropower is its ability to provide cheap and clean electricity to communities that may not have access to other energy resources. Relative to intermittent renewables like solar and wind, small hydropower can be brought online quickly and can serve as a source of baseload power. But small hydropower has relatively high upfront costs compared with conventional energy sources and requires certain site characteristics, including adequate stream flow and ensuring that users are close to the harvested hydro resource. Low consumer demand for the electricity due to the lack of economically productive uses for power in many rural areas often makes attracting financing difficult. Issuing grants or setting up preferential financing schemes, as well as cultivating local small hydropower manufacturing economies, have proven crucial for initiating and maintaining small hydropower projects. For very remote areas not connected to the grid, however, small hydropower can be one of the cheapest sources of power.
3.4.2 Current Status of Hydropower in Haiti
Haiti currently has 62 MW of installed hydropower capacity, making hydro the second largest source of electricity in the country. The country’s operating installed capacity, however, is only 40 MW, due to sediment build-up in reservoirs and the decreasing efficiency of turbines. Many of Haiti’s hydropower plants do not generate near their full capacity: for example, although the Péligre facility’s nameplate capacity is 54 MW, it is estimated to operate nearer to 36 MW because of sediment build-up and the fact that one of its turbines is not operational. Outside the Center Department, the installed hydropower capacity is 8 MW, although only half of this is operational. The government has indicated that it will prioritize small and micro-hydropower for development of isolated rural regions.34
* Definitions of “small” hydropower vary throughout the world; installations can be referred to as small-, mini-, micro-, or pico-hydropower, depending on their scale.

Haiti’s Renewable Energy Potential | 63
3.4.3 Hydropower Potential
According to ongoing assessments of Haiti’s hydropower resource potential, the country has at least 102 MW of additional hydropower capacity, which could produce up to 896 GWh of power annually.35 One assessment evaluated 140 sites, covering each of Haiti’s 10 departments.36 Rather than evaluating the entire country’s hydropower capacity, the study includes only those watersheds where data on measured river flow, precipitation, and evapotranspiration were readily available.*
Overall, the study concludes that 27 sites across six provinces are suitable for small-hydropower projects (>1 MW) and an additional 72 sites nationwide are suitable for micro-hydropower projects (0.1–1 MW); the remaining 41 sites evaluated all have capacities below 100 kW.37 Virtually all of these sites, however—whether small-, micro- or pico-hydropower (<0.1 MW)—can be exploited in one way or another. Although developing a site with a potential below 100 kW would likely not be profitable for a large public utility, it could make a significant difference for a small village far from the grid.
The Ouest, the department that contains Port-au-Prince, has by far the greatest potential capacity of any region, at more than 36 MW. The closest runner-up is the Sud-Est, with only half of the Ouest’s capacity (18 MW); Grand-Anse and Nippes are the only two other regions with an estimated generation potential above 10 MW.38 (See Table 3.5.) Ongoing efforts to assess hydropower potential include UNEP’s
* This assessment only evaluated potential and still needs to verify feasibility in light of factors including terrain and proximity of the power source to the nearest urban center. The distance from a proposed hydropower project to the nearest urban center usually determines its feasibility, as the cost of a high-voltage line increases the energy production cost.
Table 3.5 Summary of Hydropower Potential in Haiti
Region
Number of Sites
Evaluated
Number of Small Hydro Sites
(>1 MW)
Number of Micro Hydro Sites
(0.1 MW–1 MW)
Number of Pico Hydro Sites (<0.1 MW)
Average Power
Generation
Annual Energy Output
MW GWh
Ouest 27 11 9 7 36.6 320.7
Sud-Est 18 3 14 1 17.9 157.2
Grande-Anse 9 6 3 0 14.4 126.0
Nippes 5 2 3 0 10.3 89.9
Centre 24 0 18 6 7.3 64.3
Sud 8 4 3 1 6.2 54.0
Artibonite 23 0 8 15 3.6 31.9
Nord-Ouest 13 1 2 10 2.9 25.5
Nord 9 0 8 1 2.0 17.7
Nord-Est 4 0 4 0 1.1 9.3
Total 140 27 72 41 102.3 896.5
Source: See Endnote 38 for this chapter.

64 | Haiti Sustainable Energy Roadmap
installation of river gauging stations on three rivers (Cavaillon, Ravine du Sud, and Acul) in the South Department; these stations aim to assess the feasibility of installing run-of-river hydropower systems connected to the Les Cayes regional grid.39
3.4.4 Ouest Resource Assessment
Because the Ouest is Haiti’s most developed and densely populated region, additional hydropower capacity there could help tremendously in alleviating the area’s chronic power outages and beginning to bridge the significant gap between supply and demand. Among the most promising sites in the region are Rivière Blanche and Rivière Momance, which have strategic significance because they are located in the immediate surroundings of Port-au-Prince.40 (See Table 3.6.)
Although assessments have shown tremendous potential for several sites in the Ouest, there is a need for further studies of hydropower potential in Haiti, particularly in the Nord, Nord-Est, Nord-Ouest, and Sud provinces. These regions have electrification rates of only around 1%, and hydropower could provide them with a locally available energy resource.41 (For additional analysis of Haiti’s other nine provinces, see Appendix VI.)
3.4.5 Summary of Hydropower Potential
Haiti has several sites where small hydropower capacity could be developed. The estimated 102 MW of additional hydropower potential could contribute significantly to Haiti’s current electricity system of 240 MW. Small hydro resources can play an important role in providing low-cost electricity to the grid, as well as expanding energy access to the many remote locations currently underserviced by the grid. It is important to assess in greater detail the hydropower resources in regions to the north and south that have some of Haiti’s lowest rates of electrification.
3.5 Biomass Energy Potential
3.5.1 Global Status of Biomass Energy Technology
Energy can be generated from a wide variety of biological materials, including agricultural crop residues, forestry wastes (woody biomass), and even municipal solid waste. Electricity generation from biomass
Table 3.6 Hydropower Potential in the Ouest Département
Site Potential Installed Capacity Average Annual Energy Generation
MW GWh
Rivière Blanche Ouest #2 8.5 74
Rivière Momance #1 5.1 45
Rivière Grise 4.5 39
Rivière Boucan Greffin 2.7 24
Rivière Blanche Ouest #1 2.2 19
Source: See Endnote 40 for this chapter.

Haiti’s Renewable Energy Potential | 65
sources has the advantage of providing reliable baseload renewable power and can offset some of the intermittency of wind and solar generation in an integrated electricity system.
In most agricultural locations, crop residue follows a regular pattern of production and can be measured proportionally to the amount of land used to grow the crop and the number of times the crop is produced each year. Both crop residue and woody biomass can be used for heat or electricity, or they can be gasified to have the same functionality as oil and natural gas, but with lower net carbon emissions. Many potential sources of biomass feedstock exist in the Caribbean, including agricultural crop residues such as sugarcane bagasse, coffee husk, rice straw, vetiver roots, and coconut shells, as well as woody biomass.
A key barrier to developing biomass as an energy source is the logistical challenge of collecting the dispersed biomass residue in an economically efficient way. In addition, the diversion of crop residues for energy purposes has the potential to compromise soil quality for future agricultural production by removing a source of soil nutrients. Proper agricultural waste management is thus important to achieving a net positive societal outcome from using biomass.
Scaling up biomass production also can have serious implications for the local environment, affecting key ecosystem services, biodiversity, and the tourism industry. Large-scale production of energy crops can encourage monoculture agricultural practices that cause a host of local environmental problems including soil degradation, loss of biodiversity, overuse of chemical pesticides and fertilizers, and contamination of waterways. Expanded use of biomass energy can also create competition with food crops for limited agricultural land, a trend that in some places has driven up food prices and placed a particular burden on poorer populations.42
Given the sizeable role that biomass energy may play in the future energy matrix, however, this resource cannot go overlooked. In the short-to-medium term, biomass generation can serve as a reliable, renewable source of baseload power, particularly as solutions are still being developed to address the variability challenges that arise with other renewable energy sources such as wind and solar.
Like biomass energy, bio-based fuels (or biofuels) can be used for power generation, although they are most commonly used in the transportation sector. In particular, biodiesel derived from oilseed crops, such as the jatropha tree, can be used as a substitute for diesel to fuel thermal power plants. The use of biofuels for electricity generation is not suitable for communities that are less reliant on petroleum-based fuels, however. It is also important to consider the wider impacts of biofuel production, which can be similar to those of biomass production—such as the effect on local food prices.
One way to assess biomass resources is to model the potential for cultivating crops in particular locations, looking at environmental variables such as annual rainfall, soil nutrient levels, and average temperatures, as well as variables like land availability and economic costs. Although resource potentials vary depending on the location and crop considered, they are relatively easy to assess assuming that the data are readily available. It is harder, although equally important, to measure the secondary impacts of biomass development, such as the effects on food production. Assessing the potential of municipal solid waste is generally easy in areas that have waste collection and storage programs and that maintain data on waste levels.

66 | Haiti Sustainable Energy Roadmap
3.5.2 Current Status of Biomass Energy in Haiti
Currently, an estimated 95% of Haiti’s 10 million people use charcoal and fuel wood for their daily cooking needs; together, these fuels account for 71% of the country’s total energy consumption (charcoal at 39% and fuel wood at 32%).43 Yet Haiti is one of the world’s most deforested nations; between 1990 and 2010, approximately 31,000 hectares of natural forest cover was lost, leaving only 2% of the country’s original forest cover.44 Because both fuel wood and charcoal are derived from wood, the current energy industry is unsustainable, and Haiti needs to find suitable replacements for these fuels in the near future. Although many alternatives exist, a robust analysis of the economic, environmental, and social consequences of each is necessary for making informed decisions about future energy development.
Haiti’s charcoal industry has contributed to many other hardships for the country. Deforestation has increased erosion, polluting the country’s rivers, increasing its susceptibility to flooding, and damaging its most important sector, agriculture. Cooking with charcoal also leads to serious indoor air pollution, causing respiratory illnesses in a nation that is already plagued with many other health concerns. Charcoal’s impact on the economy is significant, however, and will be explored in more detail in Chapter 5.
3.5.3 Biomass Energy Potential
Sugarcane bagasse
One important biomass option in Haiti is sugarcane bagasse, the fibrous material that remains after the juice is extracted from the cane. Haiti already produces around 1 MW of electricity from bagasse, but as much as 120,000 tons of the material remains unused every year.45 Considering this, Haiti has the potential to install an additional 10–14 MW of bagasse cogeneration, producing between 44 and 61 GWh of electricity per year, or the equivalent of 5.0–6.9% of the country’s total power production in 2011.46 (See Table 3.7.)
One problem with sugarcane bagasse cogeneration is that the fuel is available only during the sugar cane growing season, or about half of the year. Although a power plant could provide reliable baseload power during the harvest season, it would need to run on a complementary fuel during the non-growing season. Alternatively, if a sugar mill were powered only using bagasse, a share of the bagasse could be pelleted and stored for use as fuel during the non-harvest season to achieve year-round bagasse-only generation.
Table 3.7 Sugarcane Bagasse Cogeneration Potential in Haiti
Unused Bagasse
Cogeneration Efficiency
Estimated Installation Capacity
Potential Annual Generation
Share of National Electricity Production in 2011
tons kWh per ton MW GWh percent
119,000 370 10.1 44.0 5.0
119,000 510 13.9 60.7 6.9
Source: See Endnote 46 for this chapter. © Worldwatch Institute

Haiti’s Renewable Energy Potential | 67
Other agricultural wastes, such as coffee pulp and coconut husks, also contain fibrous materials that could potentially be used for power generation. These types of waste materials require special handling and transport, however, and currently no large volumes of supply are located near existing biomass plants. The use of dedicated energy crops as a biomass feedstock would require establishing a new industry, as well as careful assessment of the environmental and food-price impacts.
Jatropha
Another potential biomass crop is the jatropha tree, an oilseed plant that can grow in arid climates with poor soil, making it very suitable for a country like Haiti that has heavily deforested and degraded lands. One study estimates that 1.1 million hectares of jatropha production could meet Haiti’s entire energy demand; because the country has some 500,000 hectares of degraded hillside, jatropha could realistically replace much of the current charcoal demand without displacing food crops.47
With some processing, jatropha oil could be blended into biodiesel and used for power generation or for fueling vehicles. Unprocessed jatropha vegetable oil could, with little-to-no alteration, fuel kerosene lamps and even power households or small community electricity generators. It also could be used to replace charcoal or fuelwood for cooking, although this would require many Haitians to switch from traditional wood cookstoves to vegetable oil-fueled cookstoves, a shift that proved unpopular in a pilot project in Tanzania.48 Another option is to fashion the jatropha fruit shells and hulls into briquettes as a replacement for charcoal, which would require little-to-no alteration to traditional cookstoves.
Vetiver roots
Waste produced from the distillation of vetiver roots for the production of aromatic oils can also be used for cogeneration. There is a substantial vetiver oil distillation industry in the South Department, with a total of 11 distillers processing for eight months each year.49 The resulting root waste, which UNEP estimates at approximately 8,000 tons per year, is currently discarded or burned, and the highly energy-intensive distillation industry remains wholly dependent on heavy fuel oil.50 Some estimates calculate that vetiver root cogeneration could produce an average 28.5 million kWh for a 6.5 MW facility running at an efficiency of 17.5%.51 UNEP is currently conducting a pre-feasibility study on the potential to recover energy from root combustion.52
3.5.4 Summary of Biomass Energy
By utilizing the unused waste from sugarcane production, Haiti could supply up to 9.5% of its current electricity production using biomass energy. This approach reduces many of the environmental and food-price impacts typically associated with biomass generation by avoiding the need to grow crops dedicated specifically to power production. Payments for independent bagasse power generation would need to be guaranteed, however, to provide adequate incentive for sugar producers to improve generation efficiencies and sell excess power to the grid. Jatropha, which is well suited for degraded soil, could replace much of Haiti’s current unsustainable demand for charcoal without displacing food crops. With processing, it could also be used in biodiesel for power generation or transportation fuels.

68 | Haiti Sustainable Energy Roadmap
3.6 Waste-to-Energy Potential
3.6.1 Global Status of Waste-to-Energy Technology
Municipal solid waste (MSW) contains significant organic material, and, when burned, it can drive a turbine to generate electricity, similar to any other thermal power plant. In addition, the gas produced in landfills (primarily methane) can be captured and used to power a thermal power plant. MSW is advantageous because it can be used as a baseload source of power. Because the waste would otherwise be discarded, it is also a cheap fuel source that requires little resource extraction or change in land use.
3.6.2 Current Status of Waste-to-Energy in Haiti
Haiti is currently home to two biogas projects, both in the Bel-Air neighborhood of Port-au-Prince. These projects have been largely successful, especially since they have trained local people to build and manage the plants. Yet barriers to the use of MSW in Haiti remain, among them a cultural reluctance to use waste for energy, high construction costs, and a limited ability to store MSW and biogas. Nevertheless, recent cholera outbreaks highlight the need for more effective waste management in the country, and developing waste-to-energy biogas plants could help Haiti address two of its most pressing needs: improved sanitation and increased access to energy.
3.6.3 Waste-to-Energy Potential
Recent studies show that there is potential for waste-to-energy in Haiti.53 The Port-au-Prince metropolitan area produces between 1,400 and 1,600 tons of MSW every day, and prior to the 2010 earthquake, as much as 40% of this material was collected by waste management services. If the metropolitan area can return to this collection rate and use the waste as an input for power generation, Port-au-Prince could fuel a 5 MW power plant. Although this may seem like a marginal addition, it would contribute significantly to Haiti’s power mix. If Port-au-Prince were to increase its collection rate to well above 40%, which many organizations and companies hope to achieve, the city generates enough MSW to fuel a 12 MW power plant.
Other cities and regions also show potential for waste-to-energy plants.54 (See Table 3.8.) The city of Cap-Haïtien is particularly appealing because it is the location of Haiti’s only other major landfill outside
Table 3.8 Municipal Solid Waste Potential in Haiti
City Potential Generation Capacity at 40% Collection Rate
MW
Port-au-Prince 4.79
Carrefour 0.82
Delmas 0.69
Pétionville 0.52
Cité Soleil 0.46
Gonaïves 0.44
Cap-Haïtien 0.47
Source: See Endnote 54 for this chapter.

Haiti’s Renewable Energy Potential | 69
of Port-au-Prince. According to estimates from NREL, Cap-Haïtien’s daily production of some 135 tons of MSW could power a 470 kilowatt plant (assuming a 40% collection rate).55 If the city were to collect nearly 100% of its waste, it could fuel a power plant greater than 1 MW. Currently, Cap-Haïtien has an operating power generation capacity of just over 2 MW, so an additional 0.47–1 MW in capacity would help significantly to power this city of more than 200,000 people.
An estimated 65–75% of Haiti’s MSW comes from food waste.56 (See Figure 3.11.) Because this organic matter has higher moisture levels than paper waste, it is not an effective fuel for use in combustion power plants. Instead, biodigesters, which expose organic wastes to heat and low-oxygen environments, can be used to convert the waste into methane fuel for powering generators or cooking with. In addition to improving sanitation and generating methane, biodigesters produce organic fertilizer. Thus, while an estimated 50–70% of MSW could be converted to methane, the remaining 30–50% (consisting of solids and water) could be used to replace expensive inorganic fertilizers. Because the agricultural sector is an important part of the Haitian economy, this can provide an important product to local communities.
3.6.4 Summary of Waste-to-Energy Potential
Waste-to-energy would likely be able to fuel only small- to medium-sized power plants in major Haitian cities such as Port-au-Prince and Cap-Haïtien. Such projects would be beneficial because they would help to tackle the problem of waste management. Nevertheless, the overall potential is limited. Biogas projects using biodigester technology are applicable on a smaller scale and can be used in off-grid electrification planning.
3.7 Alternative Renewable Energy Technologies
In addition to the mainstream renewable energy technologies discussed above—for which Haiti has significant available resources—two additional options are worth exploring: wave and tidal energy, and geothermal energy. In theory, wave and tidal energy have significant potential in island countries like Haiti,
Stones, charcoals, sands, 8%
Plastics, 7%
Metal, 3%
Paper 3%Tissues, 2%
Glass, 2%
Organics75%
Figure 3.11
Municipal Solid Waste Profile in HaitiSource: NREL © Worldwatch Institute

70 | Haiti Sustainable Energy Roadmap
yet technology costs remain too high for commercial-scale development in the country. Geothermal, meanwhile, is a mature technology that can provide a significant share of power generation in countries with strong resources. While it appears unlikely that Haiti has enough potential to develop geothermal electricity, geothermal heating and cooling systems, which do not have the same site-specific resource requirements, could be implemented.
3.7.1 Wave and Tidal Energy
Wave energy is a third-hand form of solar energy and a second-hand form of wind energy. Sunlight warms pockets of air, producing temperature gradients that induce atmospheric circulation in the form of wind, which then drives water to produce waves. The peaks and troughs that store the wave’s potential energy are proportional to how fast and consistent the wind blows over an open area of water.
Tidal energy, in contrast, is created by imbalances between the gravitational forces of the Earth, Moon, and Sun in orbit and the forces required to keep the orbits in place. The regular cycles of the orbits create a regular cycle of inflows and outflows in certain tidal estuaries and channels. Many tidal power systems use a design similar to wind turbines, except the units are located underwater at the base of tidal estuaries and channels. Because water is roughly 1,000 times denser than air, the systems are capable of producing roughly 1,000 times more energy than wind using water moving with the same flow speed as the air. Tidal energy resource assessments are based on grid-based oceanographic data including maximum current velocities, seabed depth, maximum probable wave height, seabed slope, significant wave height, and distance from land.57
It is important to note that, unlike most of the other renewable energy technologies examined in this chapter, marine energy technologies are far from commercially viable and have prohibitively high costs. Wave and tidal power face similar economic and technical barriers. The costs of building and installing these systems, including both the generation equipment and the underwater cables, is extremely high, and existing global capacity is almost exclusively in the form of pilot and demonstration projects. Among the factors to be considered when developing marine energy projects are the corrosion of equipment in seawater, coexistence with other uses of coastal waters such as fishing and recreation, grid connection obstacles, potentially significant ecosystem disturbances, and the vulnerability of island states to climate change. It is not fully understood how climate change and sea-level rise will affect currents, tides, and wave action, and wave and tidal power equipment would be vulnerable to hurricanes and other extreme weather conditions common in the Caribbean.
Despite the current barriers, wave and tidal power may soon play an important role in some locations, including small-island states that have extensive coastal territories. As technologies mature and costs come down, these sources could become cost competitive in the long term.58 Although there is currently no marine energy development in Haiti, interest has been shown across a few sites.59 Additional marine energy technologies that deserve further research include ocean thermal energy conversion for power generation and seawater air conditioning systems.
3.7.2 Geothermal Energy
Geothermal energy, or thermal energy stored in the Earth, can be used to generate electricity or to provide heating and cooling services. Good geothermal resources can contribute significantly to a region’s electricity portfolio. For example, geothermal accounts for approximately 27% of electricity generation

Haiti’s Renewable Energy Potential | 71
in the Philippines and 4.5% in California.60 A major advantage of geothermal power compared to many other renewable sources is that it can be used as a baseload source of energy.
Yet geothermal plays a limited role in global electricity production, with only 12 GW installed at the end of 2013.61 The main limitation is the need for reservoirs with very high temperatures near the Earth’s surface. The Geysers in California, the world’s largest geothermal power plant, takes advantage of 300°C steam less than two kilometers below the surface.62 Such resources are rare, however, and most deep geothermal reservoirs are technologically or economically unfeasible to exploit.
Haiti currently has no installed geothermal power capacity, and no geothermal resource assessments have been undertaken for the country. Regional assessments, however, show low potential for the island of Hispaniola overall. The greatest geothermal potential in the Caribbean is found on the islands of the Lesser Antilles, and, so far, only Guadeloupe has installed geothermal capacity (4.5 MW). Haiti may have potential for smaller-scale (<100 kW) geothermal systems that rely on relatively hot flows of water and that do not require wells, but further study of costs and resources is needed. The country is home to well-documented hot springs (sources chauds), some of which are currently being used for therapeutic purposes.63
Because Haiti does not have high geothermal power potential, the more attractive option is geothermal heating and cooling systems. Because these systems rely on reservoirs with much lower temperatures, they are not as site specific and can be built in many locations for direct heating or to power heat pumps; globally, at least 78 countries use geothermal energy directly for heating.64 In Haiti, geothermal systems could provide cooling in the warm tropical climate, as well as provide humidity control. Pipes would need to be placed only a few meters below the ground, making it an applicable technology for government and commercial buildings and hotels.
3.8 Summary
Haiti has very strong renewable energy potential spread across the country and could theoretically meet almost all of its power demand with the resources assessed in this chapter. Wind farms and distributed solar PV generation are especially viable and should be a central component of the country’s energy mix. Preliminary estimates based on the detailed resource assessments conducted above show that installing one square kilometer of solar PV capacity at each of four of the six sites examined, and building medium-sized (30 MW) wind farms at the three most favorable wind locations, could provide more than Haiti’s total electricity generation in 2011.
In addition, small hydropower, biomass, and waste-to-energy can each play a limited but important role in powering the country. Improving the efficiency of existing biomass capacity can provide almost 7% of Haiti’s power production using only agricultural wastes, thereby limiting negative environmental impacts. Small hydro capacity additions can be especially useful for expanding energy access to remote and underserved locations. Finally, Haiti needs to develop a long-term waste management strategy to efficiently harness its waste-to-energy potential.
Although Haiti has no potential for geothermal power development, geothermal heating and cooling systems could be used in facilities like government offices, commercial buildings, and hotels.

72 | Haiti Sustainable Energy Roadmap
Key Findings
• Haiti’s electricity grid systems will require significant upgrades to accommodate rising energy demand, regardless of whether these needs are met with fossil fuels or renewable resources.
• Although work is being done to improve grid systems, this has focused mainly on the Port-au-Prince service area, with mixed results. There is an urgent need to focus on solutions for areas outside the capital belt, which would help boost economic development and ease the influx of people from rural areas to Port-au-Prince.
• Haiti’s current grid system is well suited to renewable energy integration because existing diesel and fuel oil power plants can be fired up and down quickly in response to fluctuations in solar and wind generation.
• Integrating multiple renewable energy sources across a broad geographic area can further reduce intermittency issues associated with renewables; in particular, combining solar and wind capacity on the grid can smooth out seasonal variability. An integrated analysis of resources, grid infrastructure, and current and future demand is therefore vital.
• Renewable energy resources are strongest in the summer and lowest in the winter. Smart integrated resource planning will be needed to secure consistent renewable generation in the winter months.
• Wind and solar energy complement each other well, as solar peaks during midday while wind peaks during the late afternoon and evening.
• Distributed generation should be a priority. Smaller, more-distributed renewable power plants will increase electricity access in Haiti due to the limited range of its current grid systems. Household and commercial-scale rooftop solar PV systems can reduce power-system inefficiency by avoiding grid losses.
• Electricity storage options, especially batteries and pumped-hydro systems, can be paired with renewable energy capacity to store power generated during periods of high production and low demand, to be fed into the grid at peak hours. These technologies are maturing quickly and might become important components of a Haitian energy system with a high share of renewable energy.
• Haiti needs fully developed load profiles and future power demand projections to help with grid infrastructure planning.
• Natural gas should be pursued alongside rather than at the expense of renewable energy. In the end, an investment in renewable energy in addition to natural gas can lead to a more dynamic power system, giving Haiti greater flexibility to react to any changes in global politics, economics, or energy pricing in the future.
• Haiti could benefit from the interconnection with neighboring electricity grids.
4 | Grid Improvement and Energy Storage
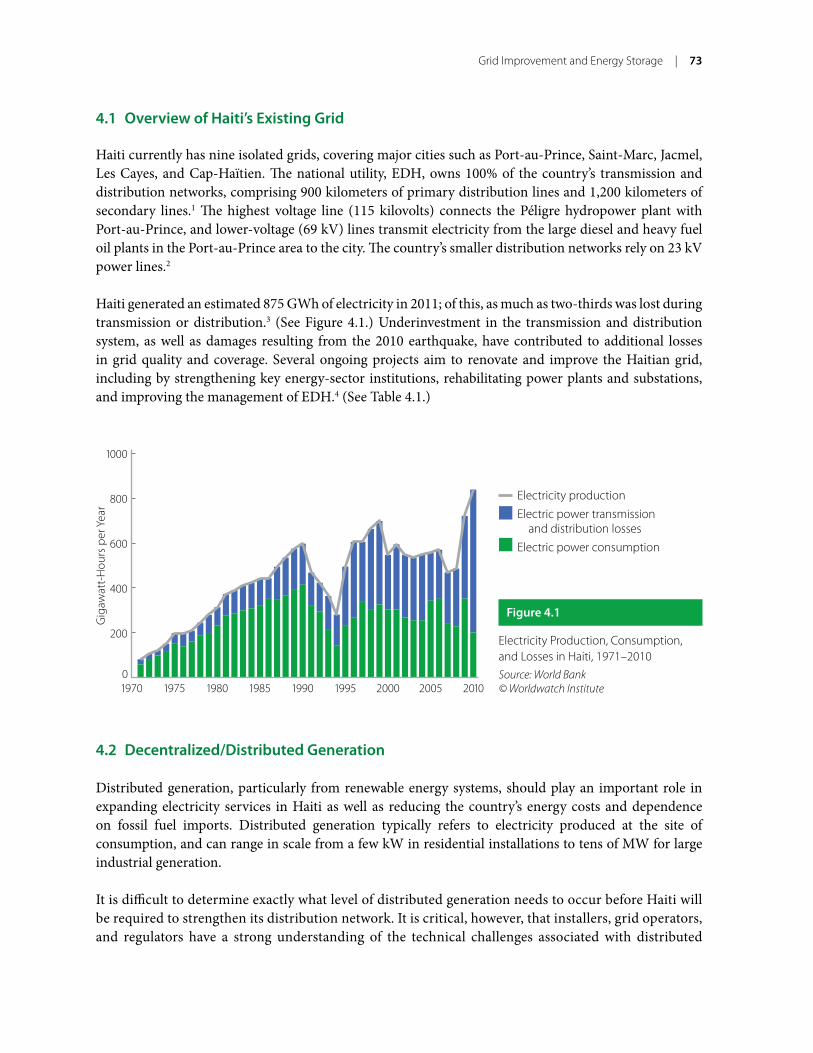
Grid Improvement and Energy Storage | 73
4.1 Overview of Haiti’s Existing Grid
Haiti currently has nine isolated grids, covering major cities such as Port-au-Prince, Saint-Marc, Jacmel, Les Cayes, and Cap-Haïtien. The national utility, EDH, owns 100% of the country’s transmission and distribution networks, comprising 900 kilometers of primary distribution lines and 1,200 kilometers of secondary lines.1 The highest voltage line (115 kilovolts) connects the Péligre hydropower plant with Port-au-Prince, and lower-voltage (69 kV) lines transmit electricity from the large diesel and heavy fuel oil plants in the Port-au-Prince area to the city. The country’s smaller distribution networks rely on 23 kV power lines.2
Haiti generated an estimated 875 GWh of electricity in 2011; of this, as much as two-thirds was lost during transmission or distribution.3 (See Figure 4.1.) Underinvestment in the transmission and distribution system, as well as damages resulting from the 2010 earthquake, have contributed to additional losses in grid quality and coverage. Several ongoing projects aim to renovate and improve the Haitian grid, including by strengthening key energy-sector institutions, rehabilitating power plants and substations, and improving the management of EDH.4 (See Table 4.1.)
4.2 Decentralized/Distributed Generation
Distributed generation, particularly from renewable energy systems, should play an important role in expanding electricity services in Haiti as well as reducing the country’s energy costs and dependence on fossil fuel imports. Distributed generation typically refers to electricity produced at the site of consumption, and can range in scale from a few kW in residential installations to tens of MW for large industrial generation.
It is difficult to determine exactly what level of distributed generation needs to occur before Haiti will be required to strengthen its distribution network. It is critical, however, that installers, grid operators, and regulators have a strong understanding of the technical challenges associated with distributed
Gig
awat
t-H
ours
per
Yea
r
1970 1975 1980 1985 19951990 2000 2005 20100
200
400
600
800
1000
Figure 4.1
Electricity Production, Consumption, and Losses in Haiti, 1971–2010Source: World Bank © Worldwatch Institute
Electricity productionElectric power transmission and distribution lossesElectric power consumption

74 | Haiti Sustainable Energy Roadmap
generation—from power flow reversal to unintentional islanding—as well as how to address them.5 (See Sidebar 4.1.) It is also helpful for utility engineers to plan for future penetration of distributed generation when completing standard maintenance on the grid, to reduce any future burdens on the grid or their customers.
Given the high technical and non-technical losses in Haiti’s transmission and distribution grids, distributed generation systems can have a significant positive economic impact. Because these systems generate electricity at the point of use that does not need to pass through the grid, a kilowatt-hour that comes from a rooftop solar panel is more valuable than a kilowatt-hour from a heavy fuel oil or diesel plant (equivalent to 3 kWh from a power plant if losses are 66%). Integrating a distributed generation system with the grid under a net metering or feed-in tariff regime, however, would mean that some of the output of the system would be subject to the grid’s losses.
Haiti’s grid losses are reflected in high electricity prices, which make distributed systems more financially attractive in Haiti than in countries where grid power prices are lower. Moreover, the installation of these systems would reduce the number of overall kilowatt-hours that have to be generated in the country, improving the efficiency of the electricity system. Consequently, the promotion of distributed generation is a worthy national priority.
4.2.1 Minigrids for Rural Electrification
Minigrids, a form of distributed generation, provide a technologically and economically feasible solution to rural electrification. A minigrid is described as “a discrete energy system consisting of distributed energy sources (e.g., renewables, conventional, storage) and loads capable of operating
Table 4.1 Ongoing Grid Improvement Projects in Haiti
Name Goals
Rebuilding Energy Infrastructure and Access Project (World Bank)
Strengthen energy sector institutions and increase energy access; improve EDH’s perfor-mance as well as rehabilitate the grid and expand its coverage; improve the emergency response of Haiti’s energy sector.
Institutional Transformation and Modernization Program of the Energy Sector (IDB)
Strengthen the capacity and financial viability of EDH by providing for an independent contractor to assume operational responsibility of the utility over three phases, as part of Phase III under the Transition Management Contract supported by USAID. Focus on sup-porting the energy sector regulatory framework, facilitating continued public disclosure of key sector information, engaging EDH in annual financial reporting, and implementing the Commercial Management System to improve billing and customer-related activities.
Electrical Substation Rehabilitation (USAID/AECOM/Perini)
Rehabilitate five substations in the Port-au-Prince metropolitan area: Canapé Vert, Carrefour Feuilles, Toussaint Brave, Croix-des-Bouquets, and Nouveau Delmas.
Rehabilitation of Péligre Hydro- electric Power Plant (IDB)
Restore the plant’s original installed capacity of 54 MW while preserving its ability to control floods and supply irrigation for the Artibonite valley.
Rehabilitation of Electricity Distribution System in Port-au- Prince (IDB)
Reduce electricity losses through rehabilitation of high-value distribution circuits and improve management of EDH. Phase II aims to expand and improve electricity service to Haiti’s industrial sector.
Source: See Endnote 4 for this chapter.

Grid Improvement and Energy Storage | 75
in parallel with, or independently from, the main grid.”6 In the case of rural electrification, minigrids are isolated from the main grid, with the option of interconnecting with the larger grid system if grid extension becomes a possibility.*
* Given that only three of Haiti’s sub-national grids have an operational capacity above 10 MW, most of the current system could already be classified as minigrids.
Sidebar 4.1 Technical Challenges and Solutions Associated with Distributed Generation
Power flow reversal. In instances where high distributed power generation exceeds the local electricity demand, this increases the voltage in the local network and may exceed the voltage that the grid supplies, reversing power flow. Reversed power flow may overload and damage electrical equipment if the grid is already experiencing power flow near its maximum capacity. To design a system that effectively addresses power flow reversal and maximum power flow parameters, engineers must first identify the unique infrastructure of the grid and distributed generation for each new large installation—as well as on a localized aggregate basis if there is a high density of small distributed generation installations.
Voltage regulation. Voltage regulation allows grid operators to ensure a high quality of electricity by maintaining distribution line voltage to within 5–10% of the designed operating voltage. Distributed generation systems fluctuate in voltage output during operation, or when turned on and off, and can potentially harm sensitive loads (like manufacturing equipment) to which they supply power. Static VAR compensators (a specialized electrical device for high-voltage systems) and load tap changers (mechanisms contained within power transformers) can regulate voltage levels by incrementally adjusting power on the distribution line.
Harmonic distortion. When the fundamental frequency of the electric current is distorted by other interfering frequencies, this can cause the total effective current to exceed the capacity of the transmission system, leading to overheating and voltage regulation problems. Any distributed generation unit connected to the grid must comply with limits for maximum harmonic distortion as outlined by the Institute of Electrical and Electronics Engineers (IEEE) Standard 519. Modern inverters are able to reduce the distortion effect of distributed generation to the point of negligibility. Passive and active power filters are electronic devices that can also suppress harmonics.
Protection scheme disturbance. This may occur when an existing network has several measures in place to protect against bidirectional power flow or an exceeding of the maximum transmission line capacity. When a new distributed generation system begins feeding power back into the grid, a fuse (for example) may melt if the power flow exceeds a certain threshold to prevent damage to the grid downstream. Fuses, circuit breakers, relays, reclosers, and sectionalizers may all need to be redesigned.
Unintentional islanding. This is the most significant problem that may occur with distributed generation systems, although it has been largely solved by advances in inverter standards. In the event of a grid outage, breakers automatically isolate the section of the grid in which a power interruption occurs. A generator that is still providing power within this “island” during a grid interruption can interfere with the breaker isolation procedure, leading to longer-than-necessary outages. More seriously, a technician attempting to fix a line that is thought to be disconnected but is actually still being powered can create a lethal hazard. Furthermore, if a generator is operating within an island, the alternating current (AC) on the island may begin to alternate out of phase with the AC on the grid, and out-of-phase reconnection can severely damage equipment.
Both passive and active solutions exist for preventing islanding by disconnecting the distributed generation within a standard timeframe. Passive methods measure the grid power at the distributed generation unit’s point of connection and disconnect the unit if the grid power ceases, but they are designed to be insensitive in order to prevent unnecessary disconnection. Active methods solve the islanding issue by periodically injecting small bursts of power into the grid and observing the response, but they are criticized for reducing power quality.
Source: See Endnote 5 for this chapter.

76 | Haiti Sustainable Energy Roadmap
Minigrid designs vary based on locally available resources and technologies. Many early minigrid projects were powered by diesel generators, used commonly to produce electricity in remote areas. Diesel generators have low upfront and capital costs and are dispatchable—able to generate electricity when needed, with the fuel able to be stored until needed. Diesel, however, is susceptible to very high price volatility, especially in remote areas. Supply disruptions in isolated areas (as in the case of a rural minigrid) can decrease the dispatchability of diesel generators, eliminating one of the few advantages that diesel generators have over renewable-powered minigrids.7 In addition to supply constraints, diesel combustion has environmental and health impacts, affecting local air quality and contributing to respiratory and other health problems.8
Despite their higher upfront costs, renewable energy systems are often well suited to taking advantage of local energy resources (e.g., solar, hydropower, biomass) and, if properly designed and managed, have a distinct long-term cost advantage over diesel generators in remote areas. Technologies that utilize solar, wind, and hydro avoid fuel costs and the possibility of supply shortages, but they must deal with the issue of variability (e.g., the sun is not always shining) and use energy storage solutions. Biomass-based systems, in contrast, are dispatchable, similar to diesel generators, but require procuring a stable, sufficient feedstock. With a sufficient fuel supply, they can provide high capacity factors and appropriate sizing to meet minigrid loads.9 With proper financing to pay for the renewable energy generation and energy storage technologies, renewable energy minigrid systems are an effective and economically viable option for rural electrification.
Another effective design option is the hybrid minigrid. Hybrid minigrid systems combine renewable energy, energy storage, and diesel generator backups to minimize the downsides of each system. Hybrid systems are often the least-cost long-term option, as the large share of renewable energy can reduce fuel costs and lower total energy costs, while the use of diesel backups can minimize the need for expensive energy storage technologies and guarantee a more reliable supply of electricity.10 Moreover, many remote communities already have access to diesel generators that can be appropriated or used as backup generators for a community-wide minigrid. These hybrid systems can generate as much as 75–99% of the total power supply from renewable energy, removing many of the health and environmental impacts of running diesel generators but still supplying reliable electricity.11
Minigrid development already exists in Haiti. Largely because EDH has been able to extend grid access by only 10% over the past several decades, dozens of organizations have begun building minigrids throughout the country.12 EDH has assisted in the development of 28 diesel-based minigrids for towns throughout the country, but these face chronic funding shortages and are now largely non-operational; an ongoing project seeks to combine several of these grids into an integrated system.13 EarthSpark initiated a minigrid in the southern town of Les Anglais in late 2012. It initially started with 14 customers but has now grown to over 400 customers.14 The grid uses custom-made smart meter technology to enable a business model of pre-paid energy. During 2014, this minigrid is expected to become a hybrid solar-diesel system, although it currently operates on only diesel power.15 The success and momentum behind this project highlight the potential for minigrids and smart meter technology in Haiti.

Grid Improvement and Energy Storage | 77
4.3 Grid Connection and Integration for Centralized Generation
At the utility scale, connecting to and integrating with the transmission grid poses challenges for variable generation. Generation from utility-scale wind and solar facilities is far more location-dependent than generation from fossil fuel-based plants, which consume portable (although often costly to transport) feedstocks. Finding a viable site for renewable generation requires balancing the resource available at the location with its proximity to existing infrastructure. In Haiti, even in areas with strong renewable resources, the cost of grid extension may make development prohibitively expensive in some of the zones surveyed in this Roadmap.
Preliminary Worldwatch calculations using the World Bank Model for Electricity Technology Assessment (META) demonstrate that, overall, grid connection does not present a significant additional cost for renewable energy development in Haiti. Based on modeling results, even building a 50-kilometer transmission line—for example, from Lac Azuéi to the greater Port-au-Prince area—would contribute less than 1 U.S. cent per kWh to the cost of electricity from a new wind farm.16 (See Figure 4.2.)
Grid flexibility—how quickly an electricity system can adjust the electricity supply and load up and down—is important for meeting Haiti’s power demand, especially if there is a high penetration of variable renewable energy. Flexibility is a function of both the grid’s physical characteristics and its operational and market design.17 All grids require a certain amount of flexibility to balance fluctuations in demand throughout the hour and day, as well as unexpected changes in supply in situations such as malfunctions or severe weather events. The integration of variable generation adds another element of variability to the grid system and generally requires greater grid flexibility. Consequently, changes that can increase the grid’s overall flexibility or reduce the need for flexibility to respond to demand fluctuations increase the potential for accommodating higher levels of variable generation.
Tran
smis
sion
Cos
ts(U
.S. c
ents
per
kilo
wat
t-ho
ur)
110 kV
overhead
line,
double circu
it, 30 km
110 kV
overhead
line,
double circu
it, 10
0 km
220 kV ove
rhead lin
e,
double circu
it, 50 km
220 kV ove
rhead lin
e,
double circu
it, 10
0 km
0
0.1
0.2
0.3
0.4
0.5
0.6
0.7
0.8
Figure 4.2
Cost Estimates of Grid Connection in HaitiSource: World Bank © Worldwatch Institute
Substation costTransmission cost
78 | Haiti Sustainable Energy Roadmap
Some of the physical characteristics that determine flexibility are out of the control of grid operators. For example, larger grids or balancing areas, whether measured by the number of generating facilities or the geographic area covered, are more flexible because variability in supply and demand can be smoothed by aggregation in balancing areas with more-diverse types of power plants. The ability of the generation fleet to supply variability to respond to changes in variable generation increases linearly as the balancing area grows, but the variability of the generation increases less than linearly.18 For example, two wind farms in different locations will generate a combined output that is less variable than that of either single farm. A study in New York State, an area twice the size of Haiti, found that combining the 11 zones of the state’s power system reduced hourly wind variability by 33%, and five-minute wind variability by 53%.19
For similar reasons, the number and capacity (in MW) of interconnections with neighboring grids is also positively correlated with grid flexibility. If neighboring grids are equipped to supply each other with needed variability in order to deal with excess or missing production, they can recreate the advantage of a larger balancing area within a single grid. In Haiti’s case, interconnection with the Dominican Republic could boost the renewable energy potential of both countries. For Haitian communities near the border that are not served by the grid, such interconnection could provide the most likely and economically feasible way to eventually connect. Lac Azuéi—the area of Haiti with the most substantial wind resource—is located near both Port-au-Prince and the Dominican border, and could potentially serve as a significant load source through which to interconnect grids. A large wind farm at Lac Azuéi would comprise a significant part of Haiti’s load profile, and interconnection with the Dominican Republic would lower the risk that the facility’s variable generation would bring to the Haitian grid.
The correlations between renewable generation and demand also help determine the amount of variable generation that can be integrated comfortably. If the peaks and valleys of wind or solar generation match up well with the peaks and valleys of demand, it is easier to fit them in with the rest of the generation fleet. On these counts, Haiti does not appear to be an ideal location for heavy centralized variable generation. Small islands tend to have small and geographically isolated grids (if any), and although underwater transmission lines can be built, the cost rises sharply with the distance and depths they must cross.20 Haiti’s current grid is smaller than regional grids in the United States and national grids in many areas that have existing high penetrations of variable generation. Studies indicate, however, that some island regions, such as Oahu in the U.S. state of Hawaii, may be able to integrate variable generation with the grid without sacrificing reliability.21 (See Case Study 4.)
Grid planners do have control over other physical factors that affect grid flexibility. Grid strength—the ability to transport electricity from its point of generation to its point of demand—is positively correlated with grid flexibility; however, it can be limited by old, inefficient, or bottlenecked transmission and distribution networks, as exist in Haiti. For these reasons, Haiti’s hydropower resources are not as useful for balancing variable generation as might be expected.
Hydropower is often seen as the ideal complement to variable generation because facilities that store water behind dams are dispatchable, meaning that they can be turned on almost instantly. Hydropower generation in Haiti, however, depends heavily on the level of rainfall, and any water that accumulates in reservoirs is quickly used to generate electricity, rather than being stored. As a result, these facilities (as currently operated) are not as useful for dealing with variability, in contrast with systems such as the Bonneville Power Administration in the U.S. Pacific Northwest that have routinely used hydroelectric

Grid Improvement and Energy Storage | 79
plants to balance increasing amounts of wind generation. This could change, of course, if overall generation capacity is increased significantly, such as with the addition of new renewable sources.
In the absence of continued improvements to infrastructure and market design, the ability of the Haitian grid to absorb variable generation may slow the growth of renewable energy generation in the country. Although much of what dictates the ability of a grid to accept variable generation is predetermined, there are many steps Haiti can take to ease the process.
Case Study 4 The Potential for Integrating Wind and Solar into the Grid of Oahu, Hawaii
A recent study of the grid of Oahu, Hawaii, demonstrates the potential of a small island grid to integrate wind and solar power without sacrificing stability. Oahu’s grid is fairly small, with less than 1,800 MW of installed capacity and annual generation of around 8,000 GWh per year. The study examined the possibility of integrating up to 500 MW of wind and 100 MW of solar power into the grid, which would account for over a quarter of the system’s electricity production. It found that up to 95% of the wind energy generated could be delivered successfully to the grid, which, along with the solar generation, would lower fuel consumption by 30% without sacrificing the reliability of the system.
The study found that three relatively simple changes to the operations of the grid would allow Oahu to achieve these results. First, Oahu would need to use the latest wind-forecasting technology and commit its fast-start generating units ahead of time, reducing the need for regulation units to manage unexpected wind fluctuations. A simultaneous change would be an increase in the requirements for “up-reserve” (regulating units that run at a base level of generation that can be increased as the grid operator requires) to account for sub-hourly variation, since Oahu runs on hourly economic dispatch. These actions would both increase the amount of wind energy that can be accepted by the grid by 7% and lower the system’s fuel costs by 14%.
The second step in the process would be to reduce the minimum stable operating level of the baseload facilities owned by the Oahu utility. Oahu is more reliant on coal than Haiti, and 95% of its electricity comes from relatively inflexible units. All baseload plants have a minimum level of production at which they can safely operate. Often at times of low electricity demand, wind energy cannot be accepted because conventional baseload facilities are already meeting load requirements at this minimum level. If these minima were lowered, more wind energy could be accepted by the grid. Implementing such a strategy would necessitate having a “down-reserve” (units that operate on a base level of generation that can be decreased as the grid operator requires) as well, to ensure stability in the event that load unexpectedly drops. This would increase the amount of wind energy that can be accepted by the grid by 14% and lower the system’s fuel costs by 9%.
According to the study, the third change that would ease wind and solar integration on Oahu would be to reduce the up-reserve requirement by taking advantage of fast-start generation units and other resources at the grid operator’s disposal. This would not affect the amount of wind energy accepted by the grid but would lower fuel costs slightly. These strategies raised the average heat rate of the fleet (the amount of primary energy required to produce a certain amount of electricity) because of the increased reliance on peaking units and reserve requirements, but fuel costs still fell by 30% overall. Operational complications remained, particularly dealing with sub-hourly variability, but the authors concluded that integration was possible without sacrificing stability.
Source: See Endnote 21 for this chapter.

80 | Haiti Sustainable Energy Roadmap
4.4 Integrating Complementary Renewable Energy Resources
One of the largest challenges associated with the variable nature of electricity from many renewable sources is to identify complementary resources—that is, renewable potential from different sources or geographic areas that are strongest at different times of the day or year. If resources are complementary, the weak period for one coincides with strong generation from another on the same grid, creating a relatively steady level of total generation. Solar and wind are both variable energy sources, and, in Haiti, small hydropower is part firm capacity and part variable, as it fluctuates with the seasons.
Wind power provides a particularly useful example of the benefits of integrating complementary resources, as intermittency is one of wind energy’s greatest challenges. The wind does not blow continuously but varies significantly throughout the year and the day. How pronounced this variation is, and how well wind resources with different variability patterns across a country can be integrated to reduce overall intermittency, go a long way to determining the viability of adding wind power to the electricity grid. Seasonal variation is useful for power-system planning and scheduling of long-term maintenance, whereas daily variation is especially important for examining if and when peak wind generation coincides with daily peak electricity demand.
The frequency with which potential wind energy sites experience significant changes in generation over short periods of time, known as “ramp events,” also plays a role in determining their attractiveness. Our assessments examine wind variation over 10-minute and hourly intervals from representative sites. In both cases, geographical diversification reduces both the number and size of ramp events—either positive or negative changes in output that are greater than 5% of installed capacity—but the effect is much greater over 10-minute intervals, as there is less time for multiple sites to be affected by the same weather pattern. One way to significantly reduce the variability of wind generation is to place wind farms in multiple geographic locations with a diversity of seasonal and daily variation, in order to level out daily and yearly generation.
Results from the six study zones across Haiti indicate that wind resources in diverse geographic locations appear to have similar daily generation patterns, although variations do exist that present an opportunity for complementarity.22 (See Figure 4.3.) For example, Môle-Saint-Nicolas, Morne à Cabrits, and Morne Vent all peak in the early evening, whereas La Gonâve peaks in the early to late morning. Lac Azuéi and Tiburon appear to have less diurnal variation, which is fortunate because Lac Azuéi has by far the most wind potential of the six zones.
The similarity in seasonal generation among the six zones is even more pronounced.23 (See Figure 4.4.) Like most tropical countries, Haiti experiences significant seasonal variation, including heavy seasonal rainfall, and weather events tend to be heavily influenced by long-lasting high and low pressure zones, which occur relatively consistently. The country’s wind potential tends to be highest during the summer months from May to August, but the pattern is not consistent in all locations, with wind patterns in Môle-Saint-Nicolas and Morne Vent varying less throughout the year.
Seasonal wind patterns are relatively consistent year-to-year as well, but there are some variations. The summer winds have almost always peaked from June to August; however, the winter and autumn winds have been more variable over the past 10 years, with the December–January and September–November

wind speeds varying more from year to year. This variability can lead to challenges in power-system planning and the scheduling of long-term maintenance.
The concentration of wind turbines has a meaningful effect on ramp events as well, again most notably when examining such events over 10-minute periods. A lower concentration of turbines, with fewer units per grid point, would mean that an installation of a given capacity would cover more area. The wind speed seen by each turbine would be less strongly correlated with the wind speed seen by the other turbines in the installation, making ramp events less severe and less frequent. In general, the relationship between the area covered and the number of ramp events over 10-minute periods is roughly exponential, whereas it is roughly linear when looking at hourly variation. Simply expanding the size of installations is not a solution, however, since a small ramp at a large project can be larger in megawatts than a large ramp at a small project.
Grid Improvement and Energy Storage | 81
Capa
city
Fac
tor
00
0.1
0.2
0.3
0.4
0.5
0.6
0.7
4 8 12 162 6 10 14 18 20 2422Hour of Day (UTC-5)
Figure 4.3
Diurnal Variability of Wind in the Six Haitian ZonesSource: 3TIER © Worldwatch Institute
Lac AzuéiMorne à CabritsMôle-Saint-NicolasTiburonMorne VentLa Gonâve
Capa
city
Fac
tor
Jan Mar May Jul SepFeb Apr Jun Aug Oct Nov Dec0
0.2
0.4
0.6
0.8
1.0
Figure 4.4
Seasonal Variability of Wind in the Six Haitian ZonesSource: 3TIER © Worldwatch Institute
Lac AzuéiMorne à CabritsMôle-Saint-NicolasTiburonMorne VentLa Gonâve

82 | Haiti Sustainable Energy Roadmap
With regard to solar energy, studies of the six zones indicate that solar potential peaks in the midday, between 10 a.m. and 2 p.m.24 (See Figure 4.5.) Because solar relies on sunlight, there is little complementarity to be found among different sites in the same region because they are producing energy at the same time. Likewise, seasonal variation of solar resources appears to be fairly uniform across Haiti.
Complementary generation from different renewable resources, such as wind and solar, can also be integrated on the same grid to smooth out daily and seasonal variability. In Haiti, solar and wind resources peak at different hours, meaning that they could potentially complement each other on a daily basis. Wind resources are often strongest during the evening and early morning, so wind could provide power when solar installations are not producing.
The seasonal complementarity between solar and wind, however, is not as clear. Both resources tend to peak in the summer from June to August and reach their lows during the winter from October to February. But solar potential picks up in March and April, meaning that it can make up for dips in wind potential during those months. The diurnal variation of wind patterns is also important, as wind is more useful when it occurs during times of peak demand. Although a profile of Haiti’s daily electricity load is not available, like many of its neighboring countries, its peak demand occurs during the night.
Fortunately, Haiti’s hydropower potential is high from September to December, which means that
Figure 4.5
Seasonal and Diurnal Variation of Solar at Les CayesSource: 3TIER

Grid Improvement and Energy Storage | 83
hydropower can make up for the low potential of solar and wind during these months.25 (See Figure 4.6.) The most difficult months for an integrated renewable energy grid are January–March, as hydropower, solar, and wind all have relatively average-to-low potential during these months. (See Table 4.2.) Because these resources all tend to peak during the summer season, however, there could be some seasonal complementarity with cogeneration from sugarcane bagasse at other times of the year, since the non-harvest season for sugar cane is from May to November. More research needs to be done on the seasonal availability of sugarcane bagasse in Haiti, however.
4.5 Operations, Markets, and Forecasting
Operational matters also influence a grid’s overall flexibility, not least because there are many situations where existing flexible generation cannot be accessed because of the grid’s institutional framework or scheduling rules. Each grid is governed by grid codes that define how and whether wind or solar devices respond to certain grid conditions, including voltage sags and over-generation. If grid codes are not designed to accommodate wind and solar PV, grid operators may, for example, curtail more renewable energy than necessary.
Pote
ntia
l Ope
ratin
g Ca
paci
ty (M
egaw
atts
)
Jan Mar May Jul SepFeb Apr Jun Aug Oct Nov Dec0
30
60
90
120
150
Figure 4.6
Seasonal Variability of Hydro in HaitiSource: Mitchell © Worldwatch Institute
Table 4.2 Summary of Seasonal Renewable Energy Variability in Haiti
Jan Feb Mar Apr May Jun Jul Aug Sep Oct Nov Dec
Solar medium medium medium very high high very
highvery high
very high high medium medium medium
Wind low low low very low medium very
highvery high high medium very
low low low
Hydro medium very low
very low medium high high high high high high high pretty
high

84 | Haiti Sustainable Energy Roadmap
The rate at which electricity markets operate affects grid flexibility as well, with close-to-real-time market clearing allowing for better response to unanticipated variability than hourly markets.26 Within a single energy market, a range of time frames may exist: some generators provide constant, stable power and sign contracts far in advance because their maneuvering cost is too high to respond to price signals; others enter into new contracts (for a certain level of generation at a certain price) at the beginning of each market period; and still others respond to changes in load or supply within the market period as the grid operator requires. This last segment of the market, the ancillary services market, is typically the most expensive from the grid operator’s perspective, because it requires generators to ramp production up or down quickly. These generators therefore sacrifice efficiency for flexibility, and require a high price to make such an arrangement worthwhile.
Historically, most energy markets have operated with an hour-long market period, so that those in that second category (intermediate and peaking generators) enter into new contracts with the operator each hour. This means that changes in load or supply within that hour must be balanced using regulation services. If this market period, providing economic dispatch, can be shortened to 5 or 15 minutes, as it has been in many parts of the United States and elsewhere, the market provides greater incentive for generation flexibility and there is less need to pay for regulation services.27
The reason for this is that the market clearing price will change more frequently, and the intermediate and peaking plants that can produce economically will then be more precisely fitted to the amount of energy needed to meet load over the market period. A study on the New York Independent System Operator (NYISO) found that providing intra-hour response in this way—relying on the economic incentives of a sub-hourly market—has been shown to come at no added cost. Freeing up generators that sell into the regulation market from having to respond as much to load changes provides more flexibility that can be used to smooth out variable generation ramps.28
The quality of wind and solar forecasting affects the ease of grid integration as well. The more accurately that variable generation producers and the grid operator are able to predict wind and solar production, the less they will have to rely on the regulation market to account for unexpected changes. Improving forecasting can be as simple as improving the methodology or technology used, but there are also operational elements. Multiple studies of wind forecasting have shown that forecast error is reduced significantly when aggregated over a large geographic area, suggesting that it is better to forecast production from a variable generation system as a whole rather than from each facility independently.29 Forecasting error also decreases as it approaches real-time. Markets that operate with quicker economic dispatch are therefore better able to predict the amount of variable generation that they will have on hand during each market period.
Haiti has definite room for improvement on these measures. Converting to faster dispatch, especially with a power generation system dominated by generating technologies that are well suited to functioning as intermediate or peaking plants, would have considerable benefits for the integration of variable generation.
The discussion of grid flexibility is based on the assumption that the grid operator must deliver the amount of power needed to meet the load at all times. The need to quickly adjust the energy delivered both up and down to respond to changes in load or variable generation is grounded in this requirement. In Haiti, however, load shedding—temporarily suspending energy delivery to some customers—is used

Grid Improvement and Energy Storage | 85
commonly to deal with generation shortages. If Haiti continues to rely on load shedding, this in essence makes the integration of variable generation easier, because it provides a solution to a situation where unexpected drops of generation cannot be quickly counterbalanced.
If Haiti is committed to ending its reliance on load shedding, however, high penetrations of variable generation could make the task more difficult. Both the effect of load shedding on integration of variable generation and the effect of this integration on any attempts to end dependence on load shedding deserve further discussion. Integration of variable generation should be handled carefully to avoid any increases in the need for load shedding. Planned demand management for select customer classes, particularly large consumers, could help demand respond to the supply of variable generation in an orderly and pre-agreed way.
4.6 Role of Oil and Natural Gas in Offsetting Variability
The nature of non-variable power generation on the national grid can affect the electricity system’s ability to respond to fluctuations in solar and wind generation. Quick changes in output from variable generators must be counterbalanced by quick increases or decreases in output from other generators that are explicitly designated as being responsible (at the direction of the grid operator) for responding to such changes.
Some power plant technologies are better suited to this task than others. Steam turbines powered by coal, for example, take a long time to ramp up and down, and they lose efficiency when they are not operating at their design load. Cycling places mechanical stress on these plants, potentially leading to increased maintenance needs and shorter lifetimes. Other plant technologies, such as oil or natural gas turbines or reciprocating engines, ramp up and down very quickly, and lose less efficiency when they are operating at partial loads.
By these metrics, Haiti looks more attractive. The country’s reliance on fuel oil and diesel means that a very large share of its generation system is of the more flexible variety. Diesel generators can provide backup power to the grid during times of low renewable generation. Assuming a functioning transmission infrastructure that can connect and integrate all new capacity, using diesel generation or even biodiesel for this purpose, could allow for over 90% renewable electricity. (See Chapter 5.)
It is also estimated that refurbishing existing power plants and turning them into combined-cycle can cost as little as one-tenth as much as constructing new combined-cycle plants, largely because developers get to bypass permitting costs and uncertainties and land issues.30 Therefore, refurbishing oil-based generation could be a low-cost solution to easing renewables onto the grid. These refurbishments would not lock Haiti into long-term fossil fuel dependence, allowing it to transition even further to low-carbon technologies as they become cheaper in the future.
In addition to petroleum-based generation, liquefied natural gas could complement a renewable energy system. Because LNG can be dispatched quickly in response to demand fluctuations, it can be used to address renewable variability in the near-to-medium term. A March 2011 report explores future electricity supply options for the Caribbean region and concludes that for Haiti, LNG is

86 | Haiti Sustainable Energy Roadmap
the cheapest fuel option at nearly all capacity factors.31 (See Table 4.3.) The report also notes that renewable energy technologies such as wind power and hydropower will be economically viable in the country through 2028. In 2013, construction of an LNG terminal began near Titanyen, north of Port-au-Prince. Later phases of the project will include construction of a pipeline to supply industrial actors in the capital city.32
Although the report provides useful first insights into the mix of power generation options available to Haiti, the model does not give a fully robust analysis. Policymakers should be aware of these limitations when interpreting the results of the study and making future energy plans. For one, the analysis recognizes but does not quantify the political, institutional, regulatory, or financial risks associated with each option, even though these factors will affect a project’s feasibility in the long run, especially in Haiti. Issues such as energy security, environmental impacts, and potential technological and political risks may present real obstacles to implementation of any of the analyzed scenarios.
The report also examines only large-scale and grid-connected systems and ignores the economic viability of distributed generation systems in Haiti. This is a major shortcoming, as the country lacks a national grid to connect rural regions (home to a majority of the un-electrified population) to the proposed large-scale power plants. A centralized generation model would require massive investments in the grid, yet EDH, Haiti’s government, and the private sector currently lack the upfront capital for grid extension.
It is important that Haiti not pursue natural gas at the expense of renewable energy. In the end, an investment in renewable energy in addition to natural gas can lead to a more dynamic power system,
Table 4.3 Scenarios for Haiti’s Power Supply, 2009–2028
Scenario
Added Capacity by 2028
Technology
Import Infrastructure
Savings Over Base Case Scenario
Base Case Scenario 540 MW 20 MW low-speed diesel (LSD) units (27 in total)
Imported —
Fuel Scenario 540 MW Liquefied natural gas (LNG)
Imported through an LNG terminal in 2014
USD 433 million
Interconnection Renewable Scenario
540 MW, including 81 MW wind
20 MW LSD units; 81 MW wind
— USD 76 million
Integrated Scenario 540 MW, plus 81 MW wind
LNG; 81 MW wind Imported through an LNG terminal in 2014
USD 476 million
Importing Power from the Dominican Republic (DR) via Landline
— Heavy fuel oil or LNG
Building a 563 km transmission line between Port-au-Prince and Santo Domingo, USD 242 million
Net savings USD 235 mil-lion (increases costs for DR by USD 322 million, decreases costs for Haiti by USD 556 million)
Note: The “Integrated Scenario” is the “Fuel Scenario” in addition to the wind capacity additions found in the “Interconnection Renewable Scenario.” Source See Endnote 31 for this chapter.

Grid Improvement and Energy Storage | 87
giving Haiti greater flexibility to react to any changes in global politics, economics, or energy pricing in the future.
4.7 Electricity Storage
Energy storage systems—including batteries, pumped hydropower, compressed air energy storage, molten salt thermal storage, and hydrogen—can address the intermittency challenge of variable renewable energy sources such as solar and wind.33 (See Table 4.4.) These systems store surplus renewable energy generated during periods where production exceeds demand, and dispatch this energy at times of low renewable generation. Because battery systems are currently the most mature and widely implemented energy storage technology, they are the most likely option to be implemented in Haiti in the near term.
There also has been interest in Haiti in pumped-storage hydro systems, which use excess electricity from power plants during periods of low power demand to pump water uphill to be stored in reservoirs, then later released as hydropower during periods of high demand. Haiti’s mountainous terrain is well suited for high-head and effective pumped-storage hydro systems, which could be paired with solar or wind farms sited near viable waterways. Assessments are needed to determine if there are sites that have potential for pumped-hydro systems and that would minimize the ecological impacts associated with large hydropower development. (See Chapter 3.) Another option is seawater pumped-storage hydro, which has the advantage of relying on stored sea water rather than fresh water.34 (See Case Study 5.)
A combined wind power and pumped-storage hydro system, such as the one on El Hierro in the Canary Islands (see Appendix VII), would help address some of Haiti’s greatest energy challenges. Because of low capacity factors and a weak grid infrastructure, Haiti’s energy demand often eclipses supply, and the country is less capable of meeting its energy demand during the dry season due to reduced hydropower production. In Port-au-Prince, available generating capacity has fallen by as much as 45 MW in the dry season due to a lack of available rain water for hydropower production.35 A wind and pumped-hydro system could offset capacity losses during these times and help ease Haiti’s difficulties with meeting energy supply.
4.8 Curtailment
When electricity supply exceeds demand for short periods of time, grid operators may choose to “curtail,” or reduce, the output from intermittent renewable energy sources such as wind or solar in order to stabilize the electricity system. Curtailment requirements vary from day-to-day, but high amounts of curtailment often occur even when conventional plants are operating at their minimum and fast-start units such as diesel generators are turned off.
Curtailment should be minimized if at all possible. When wind (or less frequently, solar) generators are asked to reduce their output, this can result in significant loss of revenue. Systems with large curtailment needs can decrease investment security and investor interest in the market. Support policies for renewables can counteract this fear and may include compensating renewably produced electricity even

88 | Haiti Sustainable Energy Roadmap
Table 4.4 Energy Storage Technology Options
Option
Description
Current Status of Technology
Scale of Tech-
nology
Cost per Discharge
Power
Levelized Cost of Storage
Annual Operating
Costs
Suitability for
Haiti
Lead-acid batteries
Used widely with off-grid technologies. Most commonly used to store electrical energy from PV systems, including at the household level.
Mature technology 10 MW or less
USD 300–800 per kW
USD 0.25–0.35 per kWhlife
USD 30 per kW per year
Suitable for off-grid applications. Environmental and health concerns arise from lack of maintenance and disposal of old batteries.
Nickel-cad-mium (NiCd) batteries
Have higher energy density and cycle life than lead-acid batteries, but are more expensive.
Mature technology. As with lead-acid, used for standalone power systems but not considered suitable for bulk storage due to cost.
A few kW to tens of MW
USD 3,000–
6,000 per kW (in bulk
storage)
Data not available
Data not available
Same as above
Lithium ion batteries
Rechargeable batteries used widely in mobile applications due to high energy density. Various types exist and offer different pros and cons.
Emerging technol-ogy. Need further development for power generation energy storage, but offer promise.
10 MW or less
USD 400–1,000
per kW
USD 0.30–0.45 per kWhlife
USD 25 per kW per year
Needs more R&D
Liquid-metal (NaS) batteries
Other types of batteries are being developed for utility-scale storage applications. NaS batter-ies utilize the sodium-sulfur reac-tion and require high operating temperatures.
Emerging, pre-commercial technology
100 MW or greater
USD 1,000–2,000
per kW
USD 0.05–0.15 per kWhlife
USD 15 per kW per year
Expensive and not yet devel-oped enough to be worthwhile. Potential to pair either with wind power could be useful, once the technology is more developed.
Vanadium redox and zinc-bromine flow batteries (VRB and ZBB)
Flow batteries utilize electro-chemical energy storage, just like lead-acid batteries, but require little maintenance. Large capacity potentials make VRBs suitable for wind energy storage, while ZBBs are more appropriate for smaller-scale systems.
Emerging, pre-commercial technology
25 kW–10 MW
USD 1,200–2,000
per kW
USD 0.15–0.25 per kWhlife
USD 30 per kW per year
Expensive and not yet devel-oped enough to be worthwhile. Potential to pair either option with wind power could be useful, once the technology is more developed.
Pumped-hydro storage
Most commonly used for large-scale energy storage, and to complement solar and wind. At times of low power demand, ex-cess electricity is used to pump water uphill into a sealed-off reservoir. During periods of peak demand (or low energy produc-tion), the stored water is released through a hydropower plant, pushing a turbine that rotates a generator to produce electricity. Requires hydro resources and mountainous landscapes.
Mature technology Typically 200 MW
or greater
USD 1,000–4,000
per kW
USD 0.05–0.15 per kWhlife
USD 5 per kW per year
Very suitable.
Assessments needed to identify viable sites.

Grid Improvement and Energy Storage | 89
Table 4.4 continued
Option
Description
Current Status of Technology
Scale of
Tech nology
Cost per Discharge
Power
Levelized Cost of Storage
Annual Operating
Costs
Suitability for
Haiti
Compressed Air Energy Storage (CAES)
Functions similarly to pumped-storage hydro and fits well into a micro-grid system. During times of low energy demand, cheap electricity is used to power a motor, which runs a com-pressor that forces air into tight underground reservoirs. During periods of peak demand, the compressed air is released and heated with natural gas, causing the air to expand and push a turbine that drives a generator to produce electricity.
Mature technology. Expansion limited due to availability of natural storage sites.
500 MW or greater
USD 800–1,000 per kW
USD 0.10–0.20 per kWhlife
USD 5 per kW per year
Depends on availability of natural stor-age sites.
Thermal storage
Often used in conjunction with CSP systems. Relies on heat-absorbing materials, such as molten salt, to ab-sorb and store heat. In such systems, several hours, and in some cases up to a couple of days, of thermal energy can be stored in molten salt. This stored heat can later be released to help generate electricity at night or on a cloudy day.
Demonstration projects under way.
MW-sized USD 50 per kWh
USD 375 per kW (@ 50 MW for 7.5 hours)
Data not available
Data not available
Depends on suitability of CSP genera-tion for Haiti
Flywheel energy storage
Uses electricity to accelerate a rotor to very high speeds and stores the energy as rotational energy.
Emerging technology.
Used mostly for uninterruptible power supply/ bridging power.
100 kW to 200 MW
USD 2,000–4,000 per kW
Data not available
USD 15 per kW per year
For bridging power ap-plications at critical insti-tutions (e.g., hospitals), potentially.
Supercon-ducting Magnetic Energy Storage (SMES)
Stores energy in the mag-netic field resulting from the flow of direct current through a superconducting coil that has been cooled below its superconducting critical temperature. SMES is highly efficient, losing less of its stored energy than any other energy storage system. Can be dispatched very quickly.
Emerging technology.
Used for short-duration energy storage and power-quality improvement. Nu-merous technical challenges still to be overcome.
1 MWh units in use for power quality control and grid stability; 20 MWh unit is a test model; cur-rently viable for short-term power (seconds) in the 1–10 MW range.
Estimated capital costs of USD 200,000–500,000 for systems with energy storage capacity be-tween 200 kWh and 1 MWh. Costs often vary based on current.
Data not available
Data not available
Not suitable due to expense and limited application.
Electro-chemical capacitors
Stores energy in the electrical double layer at an electrode/electrolyte interface
Still under devel-opment for use with renewable power systems.
Commercially vi-able for hundreds of kW scale for short power needs (seconds); utility-scale, longer-term (hours) stor-age not currently feasible.
USD 1,500–2,500 per kW (projected)
Data not available
Data not available
Not suitable

90 | Haiti Sustainable Energy Roadmap
if it is curtailed. Curtailment is also economically disadvantageous because once wind parks have been constructed or solar panels installed, the marginal costs of this renewable generation are near zero; thus, consuming renewable power in place of electricity from coal, oil, or natural gas would result in significant savings in fuel expenditures.
Curtailment needs should not prevent Haiti from accelerating its renewable energy use, however. Haiti’s goal should rather be to build a system that is as flexible as possible to minimize curtailment but still reap the benefits of a sustainable energy system. An important way to limit curtailment and increase system flexibility is to invest in only those fossil fuel generation options that can react quickly to changes in supply by intermittent resources. This becomes increasingly important as the share of renewables increases. Petroleum and natural gas plants are more suitable for this task than coal power plants. Coal use forms a barrier to a more accelerated renewable energy expansion and requires substantially greater amounts of curtailment than systems that use flexible natural gas or petroleum-based plants. Another option for limiting curtailment is the use of energy storage.
4.9 Grid Interconnection with the Dominican Republic
Grid interconnection between Haiti and the Dominican Republic could bring benefits to both countries; however, the idea needs to be studied in greater detail. Many observers outside of Haiti have suggested that the generation feeding such an interconnection should be located in the Dominican Republic, but there is concern within Haiti that if supply is ever cut off (for political or other reasons), then the Dominican Republic would have most of the bargaining power. Before any plan for interconnection is finalized, there needs to be better understanding and agreement between the two countries concerning rights to generation.
Developing generation infrastructure to feed the interconnection from both sides of the border—for example, through a large wind farm near Lac Azuéi in Haiti and a natural gas plant in the Dominican Republic—could help to subdue these tensions. Transmission and generation near the borders that is jointly owned and operated by both countries could be another solution. Overall, it is critical that Haiti remain involved in the interconnection discussion because it appears that the Caribbean region is trending in this direction, and Haiti should not be left out of these plans if they ever go forward.
Table 4.4 continued
Option
Description
Current Status of Technology
Scale of
Tech nology
Cost per Discharge
Power
Levelized Cost of Storage
Annual Operating
Costs
Suitability for
Haiti
Hydrogen storage
Hydrogen is produced through the electrolysis of water or the reforming of natural gas with steam. The hydrogen is then com-pressed or liquefied and stored for later conversion to electrical energy.
Future technology.
Barriers still exist with regard to hydrogen storage and safety.
MW-sized N/A Data not available
Data not available
Not suitable

Grid Improvement and Energy Storage | 91
4.10 Summary
Enormous opportunities exist for renewable energy development in Haiti. Distributed generation is particularly attractive and should be a focus of electricity planning going forward. Not only would it would provide power to populations not currently reached by the national grid, but it would help to avoid the current high losses during transmission and distribution. Although large, centralized power plants are
Case Study 5 The Potential for Seawater Pumped-Storage Hydro
Like traditional pumped-storage hydro systems, seawater systems use excess electricity from power plants during periods of low power demand to pump water uphill to be stored in reservoirs as potential energy. Then, when demand peaks, the reservoirs are opened, allowing water to pass through hydroelectric turbines to generate the electricity needed to meet power demand. But instead of having a lake, river, or some other source of fresh water serve as the lower reservoir, seawater systems pump salt water uphill from the ocean to a land reservoir above. This lowers the system’s freshwater footprint and greatly expands the potential for pumped-storage hydro because it is less site specific.
The world’s only operating seawater pumped-storage hydro system, on the northern coast of Okinawa in Japan, began operation in 1999 and has the potential to generate up to 30 MW of power. The hydropower plant has a total head (the vertical distance, or drop, between the intake of the plant and the turbine) of 136 meters, and the upper reservoir is located just 600 meters from the coast. To address the system’s unique challenges, including its reliance on salt water and its unique interaction with the ocean, engineers developed special technologies. For example, to prevent salt water leakage into the environment, they included a specialized rubber lining on the upper reservoir; if the lining fails, seawater detectors and pressure gauges in the drainage pipes will alert system operators of the infiltration, and the salt water can then be pumped back into the upper reservoir.
To maintain the system’s longevity and efficiency, the engineers used fiberglass reinforced plastic for the penstock (the pipe that carries water from the intake to the turbine), which prevents salt water corrosion of the equipment and deters the adhesion of marine organisms. The generating turbine is made from austenite stainless steel, found to be the most anticorrosive of the stainless steel options tested. Lastly, to limit the hydro plant’s impact on the marine ecosystem, engineers built the discharge outlet in an area with minimal coral development and surrounded it with a breakwater of concrete blocks to reduce the velocity of water reentering the ocean.
Similar systems have been proposed elsewhere. In Glinsk, Ireland, a proposed 480 MW seawater pumped-storage hydro plant would be able to accept approximately a third of the excess electricity generated by the 5,000 MW of wind turbines expected to be in operation nationwide by 2020. And in Lanai, Hawaii, a proposed 300 MW seawater plant would be used largely to facilitate greater renewable penetration in the state, storing the excess electricity from a proposed 400 MW of wind expected to come on line in the future.
In general, pumped-storage hydro has significant benefits. Most importantly, it serves as a relatively cheap way to store excess electricity, which is important for variable renewable energy sources like wind and solar, and can lower the need to use fossil fuel-based peaking plants to meet power needs during periods of high demand. The additional benefits of seawater pumped-hydro include much lower freshwater requirements and less land-use change (including deforestation and its associated climate impacts), because only one reservoir needs to be created or exploited on land. Greater siting flexibility enables the storage plants to be built closer to power generation facilities, including for renewables like solar and wind.
Seawater pumped-storage hydro systems would be a practical solution to energy storage in Haiti. Not only are most of the country’s population centers located on the coast, but there is significant renewable energy potential—particularly wind—located on or just off the coast, making seawater systems a great tool to integrate these resources into a reliable, low-carbon electricity network.
Source: See Endnote 34 for this chapter.
92 | Haiti Sustainable Energy Roadmap
often viewed as the norm for electrification (due mainly to economies of scale), this path is less viable for Haiti. Significant reliance on LNG and a few large generating plants would require building a centralized grid, an infrastructure project that would be both economically and logistically challenging. A more effective option may be to retrofit the current fleet of diesel power plants, which would substantially lower operating costs, reduce particulate matter and greenhouse gas emissions, and help ease the transition to sustainable energy.
Although Haiti, as a relatively small and isolated country, faces a particular challenge in integrating variable generation into its grid, its flexible generation fleet and superior wind and solar resources make it an attractive location for renewable energy development. The many positive externalities associated with renewables—including reduced fossil fuel dependence, improved air quality, and job creation—make development even more beneficial.
The technical challenges associated with both distributed and centralized wind and solar power will need to be addressed for any initial projects to lead to significantly higher penetration of renewables. Handling distributed generation should be considered when conducting maintenance and performing upgrades to distribution networks, and improving the reach and capacity of the transmission grid should be a top priority to allow for the acceptance of greater amounts of variable generation. The effect of variable generation on the need for load shedding should also be carefully considered. With improvements to grid infrastructure, however, the amount of flexible generation available from Haiti’s conventional generation fleet suggests that a substantial amount of variable generation can be integrated successfully into the national grid.
Energy portfolios that lack diversity increase a country’s susceptibility to fluctuations in supply and price, as well as increase its dependency on individual suppliers. Although many renewable energy technologies have high upfront costs, the smaller scale of these projects allows countries to maintain diverse, decentralized portfolios and to increase their resiliency to economic and natural disasters. Natural gas should be pursued alongside viable renewable energy sources in order to maximize diversity and flexibility.

Key Findings
• Assuming a functioning transmission infrastructure that can connect and integrate all new capacity, a sustainable electricity sector based on a share of more than 90% renewable energy by 2030 is technically feasible in Haiti.
• Haiti’s currently low energy consumption and its ambitious plans for economic development in the future require construction of a significant amount of new generating capacity.
• Haiti’s annual electricity demand is projected to reach 6,500 GWh by 2030, and peak demand is estimated to reach over 1 GW by then.
• Hourly analyses show that natural gas plants are more flexible solutions compared to coal plants, with faster ramp times and lower minimum operating levels, allowing for a smoother integration of larger renewable energy shares.
• Investments in new coal plants will ultimately limit the amount of renewable energy that the system can integrate.
• Simultaneous investments in new coal power, natural gas, and renewables will limit the amount of renewable energy that the system can integrate and will raise profitability concerns for many power plants.
Haiti’s electricity sector is at a crossroads. The current energy system is unable to provide for the electricity needs of most Haitians, and power production relies overwhelmingly on one energy source, petroleum (85%), followed by hydropower (15%). This chapter assesses different technological pathways for the future that would enable the electricity sector to add significant generation capacity while reducing its reliance on imported fossil fuels. The chapter outlines options for meeting rising demand with increasing shares of renewable energy while also renovating and replacing older power plants.
Although the Haitian grid is in need of upgrades and extension, this chapter focuses only on scenarios for power generation. It assumes that a functioning transmission infrastructure will be able to connect and integrate all required new capacity. This assumption seems reasonable given indications that Haiti’s grid will require renovation and extension regardless of whether future demand is met by new investments in fossil fuels or renewable energy. (See Chapter 4.)
The chapter begins by presenting demand projections that build the foundation for evaluating the development of Haiti’s electricity generation mix through 2030. This is especially important considering that Haiti currently does not have a government-endorsed projection for future electricity demand. The
5 | Technological Pathways for Meeting Haiti’s Future Electricity Demand
Technological Pathways for Meeting Haiti’s Future Electricity Demand | 93

94 | Haiti Sustainable Energy Roadmap
chapter then discusses a variety of scenarios for the integration of renewables into the energy mix and details their results. It distinguishes between an annual analysis, which assesses how yearly demand can be secured in all scenarios, and an hourly analysis, which offers a higher resolution for meeting demand on an average day in 2030.
The chapter concludes that an electricity system based largely on renewable energy is technically feasible in Haiti. Although a significant amount of new generating capacity will be needed, investing solely in additional conventional power is not necessary. Existing petroleum plants are well suited to integrate growing shares of intermittent renewable resources and can function as a bridge to a system based largely on renewable energy.
5.1 Demand Projections
In our scenario analysis, we evaluate how future electricity demand in Haiti can best be met using different generation technologies. Electricity demand developments depend on many factors, including changes in economic growth (GDP), population growth, electricity pricing, and the energy intensity of the economy. Where possible, our analysis of Haiti’s electricity system relies on existing data; however, because there is no government-endorsed projection of future energy demand, we have used data from several sources—including the MTPTC, World Bank, IDB, USAID, 3TIER, engineer Francis Mitchell, and management and consulting firm Nexant—to develop a projection through 2030.
In developing our demand projection, we assume that Haiti will experience significant economic growth and will achieve universal electricity access by 2030. Using population growth estimates, we assume that by 2030, Haiti’s average per capita electricity consumption will more closely resemble that of five neighboring countries: the Dominican Republic, El Salvador, Honduras, Jamaica, and Nicaragua. Our projections assume an annual growth in electricity demand of 9% from 2012 to 2020, and of 13.4% from 2021 to 2030, to reach a total of 6,500 GWh by 2030. (See Figure 5.1.) Based on this annual demand, peak demand is estimated to exceed 1 GW by 2030, indicating that Haiti will need to add significant new capacity in order to secure demand at peak times of the day over the next 20 years. (See Figure 5.2.)
Gig
awat
t-ho
urs
2010 2018 20262014 2022 20300
1000
2000
3000
4000
5000
6000
7000
8000
Figure 5.1
Projections for Electricity Demand in Haiti, 2010–2030© Worldwatch Institute

Technological Pathways for Meeting Haiti’s Future Electricity Demand | 95
Electricity demand has the potential to be lower than the projections presented here, however. As discussed in Chapter 2, available energy efficiency solutions could place Haiti’s economy on a path of lower energy demand, making a transition to an electricity system based largely on renewable energy much easier. We have adopted the base-growth scenario here to show that a transition to a more sustainable energy system can be achieved even under conservative assumptions; in other words, if this higher demand can be met using renewables, then the transition should be even easier in cases of lower demand.
In the scenarios that follow, we assume that Haiti’s electricity generation will increase to equal demand over time, and that grid losses will decrease over time. To simplify the scenarios, grid losses are internalized in demand and generation figures. The goal of the Haitian government is to ensure secure, reliable, and constant access to electricity for all customers.1 This chapter demonstrates different pathways for how this could be done; Chapter 6 then compares the costs of the various options.
Meg
awat
ts
2010 2018 20262014 2022 20300
200
400
600
800
1000
1200
Figure 5.2
Projections for Peak Electricity Demand in Haiti, 2010–2030© Worldwatch Institute
Table 5.1 Worldwatch Scenarios for a Renewable Energy Transition in Haiti by 2030
Scenario*
Renewable Share of Electricity Generation
Assumptions for Capacity Additions Beyond Renewable Energy
BAU 15% All generation sources expand according to their current share of production
1 52% An additional 200 MW of natural gas is on line by 2020, reaching 500 MW by 2030
2 56% An additional 200 MW of coal is on line by 2020, reaching 500 MW by 2030
3 85% An additional 300 MW of oil is added during 2020–2030
4 90% An additional 210 MW of natural gas is added during 2020–2030
* Based on a medium demand projection.

96 | Haiti Sustainable Energy Roadmap
5.2 Scenario Types
Based on our demand projections, Worldwatch has developed four transition scenarios to assess how growing shares of renewable energy can be used to meet Haiti’s future energy needs. (See Table 5.1.) These are compared to a business-as-usual (BAU) scenario that assumes that, despite rising demand, Haiti’s current electricity mix remains unchanged to 2030.
The scenarios are differentiated by the level of penetration of renewable energy in 2030, ranging from a 15% share under BAU to an ambitious scenario that has renewables meeting 90% of Haiti’s electricity demand that year. In the scenarios, solar and wind power comprise the majority of renewable capacity additions, and their potential are calculated based on the resource assessment presented in Chapter 3. Hydropower and bagasse-based generation are assumed to expand in order to make use of additional untapped resource potential, as discussed in Chapter 3.
The scenarios also vary in the conventional fuel used in the transitioning phase. In all scenarios, electricity consumption not covered by renewables is produced by a varying mix of natural gas, coal, and/or petroleum plants. Older power plants are assumed to retire according to their age and average lifespans (approximately 35 years for coal plants and 30 years for natural gas and petroleum plants). In three of the scenarios (Scenarios 1, 2, and 4), Worldwatch assumes that no new investments in oil plants will be made; in Scenario 3, another 300 MW of oil-based capacity is added to complement a high renewable portfolio. In all four transition scenarios, the role of petroleum generation is set to diminish over time, as envisioned by the government and reflecting the high costs of oil-based generation in comparison to alternatives. (See Chapter 6.)
Given the Haitian government’s current interest in investing in coal or natural gas power, we assume that one or both of these will be the preferred fuel in scenarios where further capacity additions are needed beyond the targeted renewable energy capacity and currently planned conventional projects.2 This assumption should be viewed as conservative, however, given the varying socioeconomic costs and benefits of the different technological pathways, as discussed in Chapter 6.
As the analysis that follows illustrates, all four transition scenarios are technically feasible, including a share of 90% renewables by 2030. Our scenarios demonstrate that Haiti’s current electricity mix is a good starting point for an ambitious transformation to a system based largely on renewable energy.
5.3 Scenario Results: Yearly Analysis
In our yearly analysis, we assess how Haiti’s annual electricity demand to 2030 can be met under the different scenarios. (See Figure 5.3). In the BAU scenario, all existing generation sources retain their current shares of the electricity mix (85% petroleum, 15% renewables), but overall production expands as demand grows. Scenarios 1–4, on the other hand, depict varying pathways for an increasing role of renewable energy, reflecting different levels of ambition and mixes of fossil fuels.
Scenario 1 represents an ambitious but manageable transition to renewables—comprising 52% of generation by 2030—accompanied by a decline in the share of oil-based generation and new investments

Technological Pathways for Meeting Haiti’s Future Electricity Demand | 97
in natural gas that reach 500 MW by 2030. Scenario 2 is similar to Scenario 1, but instead of investing in natural gas, Haiti invests in coal and slightly more renewable energy, achieving 56% renewable generation. Scenario 3 entails a more significant transition to renewables—85% by 2030—but also involves investment in additional oil-based generation. Scenario 4 is the most significant transition to renewable energy (90%) and involves investing in 210 MW of natural gas capacity by 2030.
As renewables are expanded in Scenarios 1–4, the share of electricity from petroleum-based technologies falls well below the current 85%, allowing for a near phaseout of oil-based generation. By 2030, petroleum accounts for 20% of generation in Scenario 3 (reflecting a small amount of newly added oil capacity) and only some 6% of generation in Scenarios 1, 2, and 4 (replaced by a small share of new coal or natural gas capacity). In all four transition scenarios, the remaining petroleum capacity is used as a backup reserve, offering important ancillary services but minimizing Haiti’s overall oil use.
Given the age of the country’s existing power plants, about half of Haiti’s current petroleum generation capacity is set to retire by 2030. These existing plants serve a crucial role in all four transition scenarios by providing the system with the flexibility required for a smooth integration of intermittent renewable resources, enabling adjustments in power output to match supply with demand at all times. Because of their ability to react to annual, seasonal, daily, and hourly variability in renewable energy output, petroleum plants are an ally of renewables in powering low-carbon economies.3
Two of the scenarios (Scenarios 1 and 4) include natural gas generation as well. Like petroleum plants, natural gas plants have the advantage of being flexible and capable of interacting well with intermittent renewable resources. Figure 5.4 presents an analysis for Scenario 4, which illustrates a high security of supply with the addition of a small amount of natural gas capacity. The Figure shows the relative contribution of each generation technology to installed capacity and compares it to peak demand. Because intermittent resources such as wind and solar do not produce constantly, installed capacity increases successively with growing shares of variable renewable energy. The model estimates that a total of 2,282 MW of installed energy capacity, of which 1,960 MW is renewable, is required to meet annual demand.
Thou
sand
Gig
awat
t-hou
rs
0
1
2
4
3
6
5
7
2010 20302010 2030 2010 2030 2010 2030 2010 2030
BAU 52% Renewable Energy (+500 MW Natural Gas)
56% Renewable Energy (+500 MW Coal)
85% Renewable Energy (+300 MW Petroleum)
90% Renewable Energy (+210 MW Natural Gas)
Petroleum Natural Gas Coal Renewables Annual Power Demand
Figure 5.3
Energy Demand and Generation Under All Scenarios, 2010–2030 © Worldwatch Institute

98 | Haiti Sustainable Energy Roadmap
Scenario 4 represents the manageable growth path for renewable energy in Haiti. The country would need to add just over 1,900 MW of renewables to its existing hydropower capacity to increase its renewable share to 90% by 2030. The projected installed capacity of wind (1,217 MW) is twice that of solar PV (609 MW), and together these technologies amount to 93% of total renewable energy capacity by 2030.* Hydropower comprises most of the remaining renewables share. The role of biomass power is marginal and is limited to existing sugarcane bagasse potential.
Compared to Scenario 4, Scenarios 1–3 require greater investments in conventional power. Closer analysis of these scenarios reveals that investment in either coal (Scenario 2) or petroleum (Scenario 3) along with renewables threatens to either limit the use of renewable energy or results in an underutilization of both conventional and renewable power plants that would challenge their economic profitability. In general, all renewable energy technologies are projected to be cheaper than coal and oil by 2030 (see Chapter 6), raising concerns about the economic attractiveness of Scenarios 2 and 3.
The flexibility of natural gas plants enables a more optimal mix with renewable energy, leading to less load shedding of generation. As a result, Haiti should look to optimize the use of natural gas, rather than encouraging investments in coal and other technologies that risk closing the door to renewable energy and putting the country on an unsustainable growth path.
5.4 Scenario Results: Hourly Analysis
Demand for electricity services changes continuously throughout the day, season, and year. In addition to looking at annual demand and generation, it is therefore helpful to analyze key scenarios on an hourly scale to assess how intermittent renewable energy sources behave throughout the day and how dispatchable
Meg
awat
ts
2010 2016 2020 2024 20282012 2014 2018 2022 2026 20300
500
1000
1500
2000
2500
Figure 5.4
Peak Demand and Installed Capacity Under Scenario 4© Worldwatch Institute
BiomassHydroWindSolarNatural gasPetroleumPeak demand
* The wind-to-solar ratio used here is an optimized result to achieve the goal of meeting the daily peak load with minimum curtailment and minimum cost; it could vary depending on changes in the actual load curve, the levelized costs of wind and solar power, and the proportion of distributed power systems that are integrated into the grid.

Technological Pathways for Meeting Haiti’s Future Electricity Demand | 99
generation sources, given their operational limitations, can help address some of the variability. The analysis here uses the load profile from a typical day in 2030, with a peak demand of 1,017 MW. Depending on the season and type of day (weekday or weekend/holiday), however, the load profile will likely change, influencing peak demand and the contribution from each generation source, particularly renewables. Nevertheless, an assessment of a typical day offers a good indication of the technical and economic challenges and opportunities that arise in an electricity system with high penetration of renewables.
A load profile or system curve represents graphically the behavior of electricity demand over a specified period of time. The hourly analysis in this section is based on a load profile that Worldwatch created specifically for this report.* It assumes that Haiti’s current profile characteristics, such as times of peak demand, remain the same, but that demand levels are higher. To create the load profile for 2030, we took our projected peak demand for Haiti in 2030 (see Section 5.2) and constructed a profile modeled on the system curve for a typical weekday in 2012 in the Dominican Republic. (We assume that load profiles for major economies in the Caribbean are similar in shape, and that Haiti’s economy will mirror other Caribbean economies in 2030.)
The analysis that follows takes into account the hourly resource potential for wind and solar through a 25-year period, as assessed in Chapter 3. It also considers utilization rates, minimum operating levels, and ramp rates for specific dispatchable power sources. The analysis evaluates how electricity that is generated hourly from each resource compares with electricity demand, enabling an assessment of the amount of load balancing needed at times of particularly high or low levels of intermittency. Such hourly analysis is an important step toward generation-system planning, because the goal for any utility is to provide reliable and uninterrupted electricity services at all times. A grid-level hourly analysis can also reveal the maximum penetration of renewable energy that a grid can manage on a typical day in 2030.
Worldwatch has used this method to calculate the upper limit of annual renewable electricity generation. In our assessment, we perform hourly electricity system analyses for all renewable energy scenarios. We assume that intermittent sources of electricity are not curtailed and that dispatchable sources can be ramped up or down, according to power plant type and specification, to meet demand. The analysis assumes a functioning grid in the future with significantly reduced transmission and distribution losses by 2030. It also assumes that power is dispatched according to price—that is, that the generator with the lowest cost of producing electricity is given preference on the grid.
Our hourly analyses for Scenarios 1–4 indicate that the four scenarios result in very different levels of renewable penetration on a daily basis. Under Scenario 1 (see Figure 5.5), with a 52% renewable share and expanding natural gas generation, curtailment is low at a peak of only 2% of load during midday. Renewable energy penetration reaches a maximum of 63% during the day and dips to 39% in the evening.
Under Scenario 2 (see Figure 5.6), with 56% annual renewable energy consumption and expanding coal generation, there is significant excess generation on the grid during midday, with up to 10% of the load needing to be curtailed because coal plants are not able to be run more flexibly. Renewable energy penetration reaches a maximum of 68% during the day and dips to 41% in the evening. The results for
* Haiti does not have a government-sponsored load profile, and because EDH currently does not meet national electricity demand, a load profile from EDH would be unrepresentative of demand for Haiti.

100 | Haiti Sustainable Energy Roadmap
Load
(Meg
awat
ts)
0 4 8 12 162 6 10 14 18 20 22Hour
Energy System in 2030—Natural Gas (52% Renewable Energy)
0
200
400
600
800
1000
1200
Figure 5.5
Hourly Load Analysis Under Scenario 1© Worldwatch Institute
BiomassHydroWindSolarNatural gasPetroleumLoad (MW)
Load
(Meg
awat
ts)
0 4 8 12 162 6 10 14 18 20 22Hour
Energy System in 2030—Coal (56% Renewable Energy)
0
200
400
600
800
1000
1200
Figure 5.6
Hourly Load Analysis Under Scenario 2© Worldwatch Institute
BiomassHydroWindSolarCoalPetroleumLoad (MW)
Scenario 2 indicate that a reliance on coal power for baseload generation would severely limit Haiti’s ability to integrate larger shares of renewable energy.
Under Scenario 3 (see Figure 5.7), with 85% annual renewable energy consumption and expanding petroleum capacity, there is also excess generation on the grid, and 7–10% of the load will need to be shed during midday unless electricity storage becomes available. Renewable energy penetration reaches a maximum of 100% during the day and dips to 63% at night.
Under Scenario 4 (see Figure 5.8), with 90% annual renewable energy consumption and a small amount of new natural gas capacity, the results are similar to Scenario 3, but higher levels of renewables are possible because natural gas is a very flexible source of generation with quick ramp times and low minimum operating levels. In Scenario 4, renewable energy is able to meet 100% of electricity demand for 11 hours out of the day, although small levels of oil-based generation remain operating during these hours.

Technological Pathways for Meeting Haiti’s Future Electricity Demand | 101
Load
(Meg
awat
ts)
0 4 8 12 162 6 10 14 18 20 22Hour
Energy System in 2030—Petroleum (85% Renewable Energy)
0
200
400
600
800
1000
1200
Figure 5.7
Hourly Load Analysis Under Scenario 3© Worldwatch Institute
BiomassHydroWindSolarPetroleumLoad (MW)
Renewable energy shares fall to a low of 71% in the evening. Although Scenario 4 has the highest share of renewable energy, it also has the highest curtailment levels—up to 18% of load during midday when both solar and wind are producing at high levels. Overall, about 6.5% of renewable energy generation is curtailed under Scenario 4.
Curtailment in Scenario 2 (coal) is significantly higher than in Scenario 1 (natural gas). Coal-fired power plants have slow ramp times and higher minimum operating levels than natural gas plants and are therefore less equipped to successfully integrate renewable energy. Adding even more coal-generating capacity than presented in Scenario 2 would increase load shedding and make it even more difficult to integrate intermittent renewable resources.
Overall, Worldwatch’s hourly analysis illustrates the importance of creating a flexible electricity system if the goal is a greater share of renewable energy in the long term. Haiti can ensure this by investing
Load
(Meg
awat
ts)
0 4 8 12 162 6 10 14 18 20 22Hour
Energy System in 2030—Natural Gas (95% Renewable Energy)
0
200
400
600
800
1000
1200
Figure 5.8
Hourly Load Analysis Under Scenario 4© Worldwatch Institute
BiomassHydroWindSolarNatural gasPetroleumLoad (MW)

102 | Haiti Sustainable Energy Roadmap
only in those fossil fuel generation options that can react quickly to changes in supply from intermittent resources. Natural gas plants and oil-based generation technologies are more suitable for this task than coal power plants. As has been shown, coal use forms a barrier to a more accelerated renewable energy expansion and requires substantially greater amounts of curtailment.
This analysis assumes that Haiti’s power demand will increase but that the characteristics of the demand curve, such as times of peak demand, will remain similar to that of other Caribbean countries. It is possible, however, that as Haiti continues to industrialize, the characteristics of its demand curve will change, showing a more pronounced demand peak during midday. Because generation from renewable energy sources—particularly solar—peaks at this time, such a shift would help to alleviate some of the curtailment issues illustrated in the scenarios above.
5.5 Conclusion
The analysis in this chapter indicates that a transition to a sustainable electricity sector based on expanded use of renewables is technically feasible in Haiti. Future demand can be met at all times despite concerns about the intermittency of wind and solar. Existing petroleum plants and a few new petroleum or natural gas plants would give the system the needed flexibility to smoothly integrate intermittent renewable resources. A transition to a renewable energy share of 90% is a realistic option.
Natural gas-based generation technologies are best suited to accommodate expanding renewable energy use. They are flexible solutions whose production can be more quickly adjusted to the needs of intermittent resources. Electricity produced by smaller natural gas plants can be dispatched very quickly in response to demand fluctuations throughout the day. In contrast, introducing coal power to the Haitian energy system limits the grid’s flexibility and leads to more electricity curtailment. Although not as flexible as natural gas plants, oil-based generation could complement renewable generation and lead to less curtailment than with coal.
Overall, Worldwatch believes that all four scenarios are preferable to business-as-usual; however, a large buildup of renewable energy with limited and complementary natural gas capacity (Scenario 4) will put Haiti on the best development pathway. It is also the lowest-cost option for the country, as is demonstrated in Chapter 6.

Key Findings
• Business-as-usual is not a feasible option for energy expansion in Haiti. Rising demand will increase the country’s reliance on fossil fuels and make the economy increasingly susceptible to price shocks; meanwhile, already high fossil fuel imports will place an even larger burden on economic progress. An expansion of renewables and diversification of the energy mix, in contrast, will have many positive socioeconomic impacts.
• Haiti’s energy future lies in developing local resources to increase energy security, reduce fossil fuel import costs, shrink government debt, lower electricity prices, reduce emissions, and create new jobs.
• Hydropower, solar, and wind are local renewable resources that can be readily integrated into Haiti’s electricity system and decrease energy prices. These renewables have strong resource potential, making them cost-competitive generation options already today, especially considering the enormous cost of Haiti’s current oil-reliant system.
• Hydro, solar, and wind power are currently Haiti’s cheapest options for electricity generation. Each of these is at least one-third cheaper than current oil-based generation in the country.
• By 2030, the cost of renewable energy is expected to decrease further, to below 7 U.S. cents per kWh on average; meanwhile, the costs of new oil, natural gas, and coal-fired power plants are expected to be 26.5, 22.1, and 11.2 U.S. cents per kWh, respectively.
• After internalizing the environmental costs of power generation, generating 1 kWh of wind power (10.9 U.S. cents per kWh) is less than one-third the generation cost of coal plants, around one-quarter that of diesel generators, and nearly one-fifth that of heavy-fuel-oil combustion turbines. Solar PV (11.4 U.S. cents per kWh) and hydro (5.0 U.S. cents per kWh) are also significantly cheaper than fossil fuel sources.
• Transitioning to an electricity system that is 90% powered by renewables can decrease average generation costs per kWh by around 15 U.S. cents by 2030 in comparison to BAU.
• Higher shares of renewables require higher investments but reduce the total cost of electricity generation. Our analysis shows that implementing a 90% renewable energy system could save Haiti USD 5.84 billion compared with BAU by 2030.
• In addition to the significant economic benefits, a transition to renewables creates social benefits from job creation and reduced greenhouse gas emissions. A transition to a 90% renewable energy system creates around 1,870 new additional jobs and keeps emissions in the electricity sector to below 0.7 million tons of CO2-equivalent annually.
• Haiti can save an estimated 22.2 million tons of CO2-equivalent by 2030 versus BAU under the 90% renewable energy scenario.
6 | Assessing the Socioeconomic Impacts of Alternative Electricity Pathways
Assessing the Socioeconomic Impacts of Alternative Electricity Pathways | 103

104 | Haiti Sustainable Energy Roadmap
Although Haiti’s natural resource endowment is very favorable to the expanded use of renewable energy (see Chapter 3), the country has not yet taken advantage of these resources. Petroleum-based power plants remain the country’s largest generation source, fired by costly imported fuel. Haiti’s high reliance on imported fossil fuels makes it vulnerable to international oil price shocks, further heightening the economic burden for homes and businesses. With annual electricity demand expected to grow at an average of 11.8% through 2030, these economic costs will likely only worsen in the future.
This chapter shows that more-sustainable solutions based on larger shares of renewable energy offer economic benefits that justify an accelerated transition away from conventional power. Given Haiti’s projected demand growth and its need to add substantial generation capacity, the country must make decisions now that will shape its energy sector for the coming decades. The Haitian government is tasked with guiding the transition to a truly sustainable electricity system in order to ensure simultaneous security of supply, affordability, and environmental integrity.
To aid the government in this planning process, this chapter explores the economic aspects of transitioning to a sustainable electricity sector. The chapter begins by presenting comparative cost assessments of different electricity generation technologies. Worldwatch then expands this analysis by integrating the negative impacts of some externalities to offer a better picture of the full costs of these generation sources. After projecting future costs, Worldwatch ultimately evaluates macroeconomic impacts of the different technological pathways described in Chapter 5.
The chapter concludes that an accelerated expansion of renewable energy will bring important benefits to the Haitian economy. With a 90% renewable power sector, the country would save USD 5.84 billion versus BAU by 2030, create 1,870 new jobs, save some 22 million tons of CO2-equivalent emissions, and reduce negative health effects from local pollution.
6.1 Analyzing the Levelized Costs of Electricity Generation
6.1.1 Methodology
Ideally, comparative cost assessments of different electricity generation options should go beyond the initial investment needs of constructing different technologies, and also include important variables such as operations and maintenance expenses as well as fuel costs. A useful tool for such assessment is “levelized cost of electricity” (LCOE) analysis, which calculates the price, per unit of electricity, required for the investment in an electricity project to break even over its useful life.1 Helpful for energy sector planning, LCOE allows policymakers to compare—using one common measure—the costs of generation technologies that have different lifetimes, utilization rates, fuel costs, and operations and maintenance needs.2
To estimate the LCOE for Haiti’s power system, Worldwatch extended the Model for Electricity Technology Development (META) developed by the World Bank’s Energy Sector Management Assistance Program (ESMAP). META is populated with common default values that are necessary inputs for estimating LCOE, but it also allows users to customize input data to calculate country-specific costs. Worldwatch modified the model to reflect Haiti’s project- and country-specific performance characteristics and cost parameters and extended the time frame to 2030 to reflect a more appropriate planning horizon. We

Assessing the Socioeconomic Impacts of Alternative Electricity Pathways | 105
gathered extensive in-country data and drew on local conditions, including the resource assessments discussed in Chapter 3; local cost data for equipment, fuel, and labor; as well as local performance data for plant efficiencies, capacity factors, and fuel quality. For data that were not available for Haiti, we drew on comparable datasets from our work in the Dominican Republic and Jamaica, and collaborated with local partners to ensure validity of the results.
META can be a useful tool for governments. In addition to comparing the economic attractiveness of different investment projects, its results can inform policymaking by showcasing the long-term effects of different fuel-cost developments, as well as likely cost reductions due to technological improvements and learning effects sparked by initial support instruments. META is also helpful for energy sector planning. Although it does not take an integrated energy system approach and is not an optimization model, it gives planners an accurate cost overview of different supply options that should be used along with other planning models to help policymakers and regulators make informed choices. (See Worldwatch’s technical pathway assessment in Chapter 5.)
LCOE analyses are not financial assessments, however, and they exclude taxes and subsidies. Moreover, the model uses the social discount rate instead of the financial interest rate that is more relevant in investment decisions for loan-financed projects. Project-specific investment analyses therefore would require also including the costs of subsidies and incentives, as well as the costs of loans that can vary substantially depending on the project’s technology and size as well as the type of investor. (See Chapter 7 for important aspects of financing renewable energy projects.)
6.1.2 Results
The LCOE for the various electricity generation options in Haiti shows that when the costs of capital, operations and maintenance, and fuel are factored in, most renewable energy technologies already are competitive solutions in the country. (See Figure 6.1.) This is particularly true when renewables are compared to petroleum-based technologies, which currently comprise 85% of Haiti’s generation system but are among the most expensive supply options available. Transitioning away from petroleum power plants should therefore be a priority for the government.
Hydro and wind power are the cheapest generation technologies available for new projects in Haiti, at less than one-third the cost of electricity from diesel generators. Wind power is widely feasible in many good locations and is a competitive alternative to coal and natural gas. Although solar PV (both small and large scale) is currently the most expensive renewable energy source, PV costs have fallen substantially in recent years. This trend is set to continue if Haiti can take advantage of economies of scale and learning curves as it expands its PV use. (See Chapter 3.) Moreover, expanding solar PV could reduce overall system costs because during midday, PV would compete with petroleum-based generation, the country’s most expensive generation technology. Using solar PV to replace electricity from diesel generators would save Haiti at least 20 U.S. cents per kWh, depending on the size of the PV installation.
Electricity generation from bagasse offers another competitive renewable energy solution and should be utilized, although expansion is limited because the resource is available only during the harvest season and only 15 MW of unused sugarcane bagasse is currently available.3 An expansion of hydropower would also be very cost effective, and Haiti should tap into unused potentials that do not compete for other uses of water.

106 | Haiti Sustainable Energy Roadmap
Given Haiti’s great renewable energy potential, new investments in oil-based electricity generation are not advisable from an economic perspective. The comparatively small upfront construction costs of these plants are deceiving of the high lifespan costs. Fuel expenditures drive up costs considerably, making oil-based plants uncompetitive solutions that place a burden on the country’s finances. Figure 6.1 distinguishes between base costs (overnight capital costs and fixed operations and maintenance (O&M) costs) and fuel costs, to highlight the importance of the latter.
Coal is the least expensive resource for fossil fuel-based electricity generation. Coal power has comparatively low fuel costs and high utilization rates. But coal, unlike natural gas and oil, can be used only for baseload generation and must be accompanied by additional flexible generation options. Natural gas is a much more suitable ally of renewables. Although it is more expensive than coal by 3 U.S. cents per kWh, it can decrease overall system costs by avoiding unnecessary curtailment of renewable energy sources and by offering flexibility to react to short-term fluctuations in demand.
When deciding on the most cost-effective option for expanding generation, the Haitian government should take into account additional infrastructure costs as well. Although new transmission lines and substations will be needed for large-scale renewable energy projects, the costs are relatively low compared to infrastructure costs on the generation side, and the grid will need to be extended no matter which technologies are used for expanded generation. Small-scale renewable generation technologies, used for distributed generation, do not require additional transmission lines, making them an attractive option for household use or for communities located farther from existing grid infrastructure.
Even under optimistic assumptions about fossil fuel prices, renewable energy sources—particularly wind power—already offer a competitive alternative to conventional generation that could shield Haiti from uncertain import prices and serve as a price hedge from international market price volatility.
Leve
lized
Cos
t of E
lect
ricity
(U
.S. c
ents
per
kilo
wat
t-ho
ur)
Diesel G
enerator
Oil/Gas
Combined Cycle – N
G
OIl/Gas
Combustion Tu
rbine – N
G
Waste-to
-Energy, Incin
eration
Waste-to
-Energy, Gasi
�catio
nWind
Solar PV
Hydro
Coal Su
bcritic
al
Oil/Gas
Combined Cycle – H
FO
OIl/Gas
Combustion Tu
rbine – H
FO0
10
20
30
40
50
Figure 6.1
Levelized Cost of Electricity for Haiti (Capital, O&M, and Fuel Costs)© Worldwatch Institute
FuelBase
HFO = heavy fuel oilNG = natural gas

Assessing the Socioeconomic Impacts of Alternative Electricity Pathways | 107
6.2 LCOE+: Assessing the Full Costs of Alternative Electricity Sources
6.2.1 MethodologyThe standard LCOE analysis, discussed above, offers policymakers a useful tool for energy sector planning as well as important information about what policy priorities can be developed. Energy sector decisions should not focus on generation costs alone, however, but rather should reflect a more holistic assessment that includes additional costs to society—so-called externalities—such as negative health effects caused by local emissions of pollutants such as particulate matter (PM), sulfur oxide (SOx), and nitrogen oxide (NOx).4 This is particularly relevant for emerging or developing countries like Haiti, where health care is often a luxury good and where generation technologies often lack the latest environmental control equipment.
In this analysis, Worldwatch has attempted to analyze the true costs of electricity generation in Haiti using an “LCOE+” approach to quantify some of these additional negative effects on society. To offer a more transparent measure of the costs of different generation technologies, we have added damage values in U.S. cents per kWh for the most important negative impacts, on top of the standard LCOE values calculated in Section 6.1. This allows for a renewed look at the competitiveness of different technologies from a wider societal point of view.
ESMAP’s META model is again helpful because it allows for the integration of costs caused by local pollution and climate change. Users can assign input values for the costs of carbon in USD per ton of CO2-equivalent and for the damages caused by emissions of SOx, NOx, and PM, measured in USD per ton. Based on the type and quality of fuel as well as plant efficiency, the model then attaches additional costs to LCOE estimates. Worldwatch has built on this feature to offer Haiti a more holistic assessment of the real costs of different generation technologies, highlighting societal costs that usually are not integrated in market prices. In doing so, we conducted extensive literature reviews to assign values for climate as well as pollution costs.
6.2.2 Costs of Local Pollutants
Local air pollutants that are emitted during combustion processes—such as SOx, NOx, and PM—can have adverse effects on human health, agricultural productivity, materials, and visibility. Depending on the age and efficiency of power plants, electricity production can contribute substantially to harmful emission concentrations near these plants. Expanding fossil fuel-based generation will only increase local air pollution, further deteriorating the environment and posing an economic burden to major economic sectors such as agriculture and tourism.
Worldwatch’s goal through LCOE+ analysis is to better illustrate environmental externalities of electricity generation that currently are not being reflected in market prices. The most precise approach would be to conduct site-specific assessments that evaluate in detail factors such as the expected dispersion of pollutants from a particular plant, the increase in pollutant concentrations, and the stress on the local environment given specific ecosystem characteristics; however, these analyses tend to be extremely cost, time, and data intensive. Nevertheless, it is possible to draw general conclusions about pollution costs from electricity generation based on a set of key inputs such as the technology and fuel used, the age of the plant, the existence of pollution control equipment, and a country’s income and population density.

108 | Haiti Sustainable Energy Roadmap
Efforts to quantify and internalize the negative impacts of electricity generation reach back more than 30 years.5 Putting a monetary value on damages has proven challenging at times. The causal links between pollutant concentrations and health impacts are still being studied, creating uncertainties; and, although human life depends on the services that ecosystems provide, the benefits of specific conservation efforts are only partially measurable. Moreover, attaching a certain value to human life can significantly alter the results and has tremendous ethical repercussions. Despite these difficulties, progress has been made on the research front.6 For its estimates, Worldwatch employed a second World Bank model developed specifically to evaluate pollution damage in developing nations.7 We adapted the model for Haiti, with adjustments for income and population, and incorporated it into the LCOE to evaluate the damage costs of local pollutants per unit of energy generated.
6.2.3 Costs of Global Climate Change
In addition to releasing local pollutants, fossil fuel-based power generation is one of the greatest emitters of greenhouse gases, contributing to human-induced climate change. Global impacts of climate change include increasing temperatures, more-frequent heat waves, higher sea levels, more drought-affected areas, and increased storm intensity.8 The severity of these impacts varies by region, but Caribbean islands are believed to be among the most vulnerable.9 The most significant consequences for small-island states are likely to be related to changes in sea level, given the coastal locations of most of the economic activity, infrastructure, and population. Haiti, like most islands, is likely to also suffer from changes in rainfall, soil moisture, and prevailing wind patterns.10
Carbon dioxide and the other greenhouse gases are global pollutants whose impact is independent of the point of emission. A specific point source in Haiti such as a power plant contributes to global climate change, but it cannot be made solely responsible for negative regional impacts. Thus, a ton of CO2 emitted in Haiti has the same negative effect on the country as a ton emitted in the United States, China, or Saudi Arabia. To integrate the costs of climate change into its LCOE+ analysis, Worldwatch assumed a global carbon cost of USD 100 per ton of CO2-equivalent. Although at the upper-mid range of existing estimates, this value is in line with prominent economic research, and also arguably better represents new findings about the severity of climate change’s negative impacts.11
Despite the global nature of climate change and the historic responsibility of industrialized countries to reduce their emissions, Haiti’s potential for emission reduction is significant from a regional perspective. In 2009, the country had the sixth highest CO2 emissions of 15 Caribbean nations (see Table 6.1), which may be perceived as low given that Haiti is the region’s most populous nation.12 But with both the economy and population projected to grow significantly in the coming decades, Haiti’s contribution to global emissions will increase. Undoubtedly, emissions increases will be needed to move the economy forward, but a transition to renewables can put the country on a climate-compatible development path that enables economic growth while reducing the economy’s climate impact. Moreover, as will be demonstrated, such a development path is likely the cheapest growth option for Haiti.
The inclusion of climate change costs in Haiti’s LCOE+ is not intended to imply that the country’s population should cover these costs. The goal is rather to change policymakers’ perception of the completeness of conventional cost assessments, to illustrate the potential economic burden that climate change poses to Haiti’s economy, and to heighten awareness of the opportunities that alternative energy sources bring for putting the country on a climate-compatible development path.

Assessing the Socioeconomic Impacts of Alternative Electricity Pathways | 109
6.2.4 Results
A more holistic LCOE+ assessment of the costs of different generation technologies—which includes the environmental costs from both local air pollution and climate change—highlights some of the benefits of renewable resources that are normally not captured in market prices. Since societies must bear the costs of local pollution and a changing climate, the data provide a pressing argument in favor of a transition toward clean energy alternatives.
Given Haiti’s population density, local air pollution threatens to damage the health of large populations living in the vicinity of power plants; hence, the model estimates high costs for PM emissions. The analysis indicates that petroleum-based power, Haiti’s dominant source of generation today, has significant impacts, raising the costs of generation by about 8.6 U.S. cents per kWh for diesel generators and 8.1 U.S. cents per kWh for oil combustion turbine plants. Internalizing climate change costs increases the cost of these fuels by an additional 6.8 and 6.5 U.S. cents per kWh, respectively. (See Figure 6.2.)
Although there are no coal power plants in Haiti, studies in the Dominican Republic have shown that coal is the most injurious generation technology to human health and the environment there.13 Similarly, our analysis for Haiti indicates that the impacts of local pollution alone increase the costs of coal power by about 100%, and, when climate change impacts are added, coal generation becomes nearly 210% more expensive. The negative impacts of potential coal use in Haiti demonstrate the need for LCOE+ analyses: although coal was estimated to be one of the most competitive generation options in the standard LCOE analysis (see Section 6.1), this changes greatly when some of its negative societal impacts are quantified, making coal significantly more expensive than generation from combined-cycle heavy fuel oil or natural gas.
Table 6.1 Carbon Dioxide Emissions and Emissions Intensities of 15 Caribbean Countries, 2009
Country CO2 Emissions GDP per Capita Emissions Intensity (CO2/GDP)
kilotons current USD metric tons per thousand USD
Trinidad and Tobago 52,069 17,627 2.754
Dominican Republic 20,640 5,486 0.417
Jamaica 9,557 5,330 0.851
The Bahamas 4,734 21,490 0.674
Suriname 2,335 8,125 1.006
Haiti 2,103 732 0.448
Guyana 1,672 3,258 1.563
Barbados 1,442 13,076 0.375
Antigua and Barbuda 732 12,757 0.844
Belize 536 4,577 0.431
St. Lucia 425 6,755 0.421
St. Kitts and Nevis 303 14,122 0.647
Grenada 269 7,427 0.505
St. Vincent and the Grenadines 199 6,320 0.318
Dominica 142 6,673 0.408
Source: See Endnote 12 for this chapter.

110 | Haiti Sustainable Energy Roadmap
From a global climate perspective, coal use is particularly carbon intensive and therefore has the greatest effect on global warming. Natural gas has low pollutant concentrations and is also less carbon intensive than any of the other conventional technologies. Combined-cycle technology is the most efficient form of thermal power generation.
Overall, the LCOE+ analysis offers a new view on the competitiveness of different electricity generation sources. Coal power becomes 24 U.S. cents per kWh more expensive than its conventional estimates and now costs more than 35 U.S. cents per kWh. The generation cost of diesel generators surpasses 40 U.S. cents per kWh, and that of heavy-fuel-oil combustion turbine generation more than 53 U.S. cents per kWh. Combined-cycle heavy fuel oil and natural gas are the only conventional fuels that retain some level of competitiveness, at 19.9 and 18.7 U.S. cents per kWh, respectively.
The cheapest generation sources are wind (10.9 U.S. cents per kWh) and hydro (5.0 U.S. cents per kWh). Generating 1 kWh of wind power is less than one-third the generation cost of coal plants, around one-quarter that of diesel generators, and nearly one-fifth that of heavy-fuel-oil combustion turbines. Solar PV is substantially less expensive than all conventional power (11.4 U.S. cents per kWh), including combined-cycle natural gas. It is about 7 U.S. cents per kWh cheaper than natural gas combined-cycle generation and 24 U.S. cents below coal generation.
Moreover, it should be emphasized that these findings are conservative. The World Bank model that is utilized to determine pollution costs in developing countries ignores key impacts, evaluating only the effects on human health, visibility, and soiling of buildings. More-comprehensive studies of developed countries have evaluated the effects of local pollution on variables such as agriculture, forests, fisheries, recreation, tourism, habitat, and biodiversity.14 Further research on pollution costs in developing countries is therefore recommended to extend the LCOE+ work.
Leve
lized
Cos
t of E
lect
ricity
(U
.S. c
ents
per
kilo
wat
t-ho
ur)
Diesel G
enerator
Oil/Gas
Combined Cycle – N
G
OIl/Gas
Combustion Tu
rbine – N
G
Waste-to
-Energy, Incin
eration
Waste-to
-Energy, Gasi
�catio
nWind
Solar PV
Hydro
Coal Su
bcritic
al
Oil/Gas
Combined Cycle – H
FO
OIl/Gas
Combustion Tu
rbine – H
FO0
10
20
30
40
50
60
Figure 6.2
LCOE for Haiti with External Costs (Local Air Pollution and Climate Change)© Worldwatch Institute
Climate ChangePollutionFuelBase
HFO = heavy fuel oilNG = natural gas

Assessing the Socioeconomic Impacts of Alternative Electricity Pathways | 111
6.3 LCOE Projection: The Future Costs of Electricity Generation
6.3.1 Methodology
Chapter 5 of this report assesses the technical feasibility of Haiti transitioning to an electricity sector based almost entirely on renewable energy by 2030. Analyzing the socioeconomic impacts of such a transformative change requires looking beyond current generation costs (see Sections 6.1 and 6.2) and assessing likely cost trends in the future. These can then be used to further analyze macroeconomic impacts such as clean energy investment needs and/or changes in fossil fuel import costs. (See Section 6.4.)
Although it is impossible to predict future energy prices accurately, analysts can make projections based on current available information and qualified assumptions. In this report, Worldwatch uses its LCOE estimates as a basis from which to extrapolate cost developments for different generation technologies. We assume that future base costs for thermal and hydropower generation will remain very similar to today’s levels, in line with the U.S. Department of Energy’s cost database.15 We also assume that the costs of wind and solar PV will decline further, as indicated by the International Renewable Energy Agency’s (IRENA) cost analysis series.16 And we assume that fuel prices overall will increase in real terms from 2010 to 2030, as projected in the U.S. Energy Information Administration’s (EIA) Annual Energy Outlook, with the largest increases seen in the price of oil.17
6.3.2 Results
Based on these assumptions, Figure 6.3 projects the LCOE for various electricity generation technologies in Haiti to 2030. Hydro, solar, and wind energy technologies are all projected to be cheaper than fossil fuel-based power generation by 2020. Solar PV is projected to experience the sharpest cost reductions and becomes cost
Leve
lized
Cos
t of E
lect
ricity
(U
.S. c
ents
per
kilo
wat
t-ho
ur)
Diesel G
enerator
Natu
ral G
as
Combined Cycle
Natu
ral G
as
Combustion Tu
rbine
Waste-to
-EnergyHyd
roWind
Solar
Coal Su
bcritic
al
Oil Combined Cyc
le
OIl Combusti
on Turb
ine0
10
20
30
40
50
60
Figure 6.3
Haiti LCOE Projection to 2030 © Worldwatch Institute
2010 Base2015 Base2020 Base2025 Base2030 Base
2010 Fuel2015 Fuel2020 Fuel2025 Fuel2030 Fuel

112 | Haiti Sustainable Energy Roadmap
competitive with coal in 2015, overtaking all resources except hydro as the least expensive form of electricity generation by that year. Among fossil fuels, coal is projected to be the least expensive generation option in 2030, because of abundant global reserves, but its costs are still projected to be higher than those of renewables.
Figure 6.3 also shows that a continued reliance on oil-based generation threatens to challenge Haiti’s economic development by burdening industry and households with electricity price increases to cover rising generation costs. Oil-based generation is not currently cost competitive with any other form of electricity generation in Haiti, nor will it be in the future. These LCOE results are sensitive to new developments, including new technologies and the discovery of new natural resources. Given currently available information, however, an expansion of renewable energy is a good price hedge against volatile and rising fossil fuel prices, and over time it becomes the most economical electricity option.
6.4 Macroeconomic Impacts: Benefits of a Transition to Renewable-Based Electricity Systems
Rebuilding an energy system based on renewable energy will have economic impacts. The following sections apply the findings from the LCOE results to the different technological pathways outlined in Chapter 5 in order to assess their potential economic impacts. Although opponents often argue that an expansion of renewables poses an economic burden, the quantitative analysis in this chapter shows the exact opposite for Haiti: that a system based largely on renewable energy can reduce average and total electricity costs, save the country much-needed public funds on avoided fuel imports, and create new jobs in the energy sector.
6.4.1 Falling Costs of Electricity Generation
The Haitian government currently subsidizes electricity prices for many consumers in order to protect them from the high costs of electricity generation that result primarily from importing oil. Yet this measure puts significant pressure on public funds and is no longer sustainable. Unless electricity generation costs can be lowered, Haiti will face significant economic pressure and two equally unsatisfactory and unviable solutions: either the government will have to accumulate additional debt to finance the national utility EDH, or it will have to charge consumers significantly higher rates, which would be very unpopular with ratepayers and possibly lead to higher levels of electricity theft.
A look at generation costs to 2030 is therefore a good proxy for possible developments of future industry and household electricity prices or accumulating government debt. Figure 6.4 shows the average LCOE in 2030 for the different Worldwatch scenarios presented in Chapter 5. The average cost of electricity is calculated using projections of LCOE estimates (see Section 6.3) as well as annual generation and utilization rates (see Chapter 5) from each generation source.
Figure 6.4 shows a clear trend: that continuation of the status quo is more expensive than any renewable expansion scenario. This is largely a result of rising oil prices. Moreover, as the costs of renewables decline and fall below those of conventional power, the average cost of electricity will decrease with growing renewable energy penetration. The average LCOE is therefore lowest in the high-renewable scenarios that have no additional future capacity of oil-based generation (Scenarios 1, 2, and 4). Scenario 4 is the cheapest option at 10 U.S. cents per kWh. Scenario 3, despite having a 30% greater share of renewable generation,

Assessing the Socioeconomic Impacts of Alternative Electricity Pathways | 113
has the same average LCOE as Scenario 2, highlighting just how expensive oil-based generation is. Scenario 2 is 3 U.S. cents per kWh cheaper than Scenario 1, even though the renewable energy penetration is only 4% higher, because coal is a cheaper generation option for Haiti than natural gas.
Overall, an expansion of coal and/or natural gas power can have a price-dampening effect in comparison to a continuation of the status quo. As the costs of all renewables fall below those of coal and natural gas power, however, generation costs are much lower in scenarios with a greater reliance on renewable power than in those with greater shares of coal or natural gas. (See Figure 6.5.) High renewable penetration with either coal or natural gas provide the least-cost options for Haiti.
These results are susceptible to changes in fuel costs, which may lead the price differentials among the scenarios to increase or decrease. Overall, however, the graphs show that an accelerated transition to renewable energy pays off. Greater shares of renewables have the potential to nearly halve the current cost of today’s electricity system, and therefore leave room for substantial tariff reductions for Haiti’s economy and population.
6.4.2 Saving Billions on Reduced Fossil Fuel Imports
Transitioning away from a fossil fuel-based power system can save Haiti significant financial resources that can instead be invested in renewable energy and other struggling economic sectors, as well as help to balance the budget. The country spent an estimated 10% of its GDP on oil imports in 2010.18 Without reform, this figure is set to increase due to rising fuel needs in the electricity sector, further burdening Haiti’s finances and industry and decreasing the country’s energy security. Growing energy demand and rising fossil fuel prices threaten to become an economic and security disaster.
In the BAU scenario, annual import costs for the electricity sector are set to increase to USD 1.27 billion in 2030. A switch to renewable energy can substantially reduce this import reliance, to as low as around
Leve
lized
Cos
t of E
lect
ricity
(U.S
. cen
ts p
er k
ilow
att-
hour
)
BAU
5
2% RE
(+500 M
W Natu
ral G
as)
56% RE
(+500 M
W Coal)
85% RE
(+300 M
W Petroleum)
9
0% RE
(+210 M
W Natu
ral G
as)0
5
10
15
20
25
Figure 6.4
Average LCOE in 2030 Under All Scenarios© Worldwatch Institute

114 | Haiti Sustainable Energy Roadmap
USD 223 million annually by 2030. Figure 6.6 shows the cumulative import costs for fossil fuels under Worldwatch’s four transition scenarios. The graph also shows fuel costs savings of the different scenarios versus BAU. Fuel cost imports in the BAU scenario add up to USD 9.73 billion by 2030. A switch to renewable energy can save Haiti around USD 6.88 billion in foregone fossil fuel imports within the same time period. This savings is set to grow even further beyond the 2030 time frame assessed in this study.
Leve
lized
Cos
t of E
lect
ricity
(U
.S. c
ents
per
kilo
wat
t-ho
ur)
0
5
10
15
20
25
30
2015 2016 2017 2018 2019 2020 2021 2022 2023 2024 2025 2026 2027 2028 2029 2030
Figure 6.5
Average Annual LCOE for All Scenarios, 2015–2030 © Worldwatch Institute
BAU 52% RE (+500 MW Natural Gas)
56% RE (+500 MW Coal)
85% RE (+300 MW Petroleum)
90% RE (+210 MW Natural Gas)
Billi
on U
SD
BAU
5
2% RE
(+500 M
W Natu
ral G
as)
56% RE
(+500 M
W Coal)
85% RE
(+300 M
W Petroleum)
9
0% RE
(+210 M
W Natu
ral G
as)0
2
4
6
8
10
Figure 6.6
Cumulative Fuel Costs and Savings to 2030 Under All Scenarios© Worldwatch Institute
Fuel CostFuel Cost Saving over BAU

Assessing the Socioeconomic Impacts of Alternative Electricity Pathways | 115
Overall, the analysis illustrates the enormous savings that Haiti can reap through an ambitious switch to renewables. It also shows that any increase in oil-based generation severely limits the fuel-cost savings of an energy system that has high renewable penetration; for example, fuel costs through 2030 under Scenario 3 are USD 196 million greater than under Scenario 2, even though Scenario 2 is about three times more dependent on fossil fuels for generation. These results could change, however, with new information about fossil fuel price trends. A continued shale gas revolution could reduce natural gas prices globally, although this would likely not significantly alter the attractiveness of an ambitious shift to domestic renewables. Given Haiti’s vast and cheaply available renewable resources, lower-priced natural gas is unlikely to out-compete renewables but is likely to become a more attractive alternative to coal.
6.4.3 Investment versus Total Cost of Electricity: Upfront Costs but Long-term Savings
When analyzing the economics of the different technological pathways (see Chapter 5), it is also useful to compare total investment needs and the total cost of electricity generation. Investment needs are a measure of the initial capital requirements to transform or modernize an energy system. Analyses of the total cost of electricity generation look beyond the investment needs and also take into account operations and maintenance costs, including total fuel costs. Unlike the average LCOE for specified years, total cost of electricity estimates are an aggregate of electricity costs over a defined period.
Figure 6.7 illustrates that in 2030, the total annual costs of electricity under the BAU scenario are more than double what they are under Scenario 4. Moreover, it shows that due largely to the high fuel costs of petroleum, even high-renewable scenarios that rely on petroleum generation for baseload power would be expensive. Greater shares of renewables, with a preference for either coal or natural gas over petroleum for baseload power, are the best way to keep annual generation costs lower through 2030.
Mill
ion
USD
2015 2016 2017 2018 2019 2020 2021 2022 2023 2024 2025 2026 2027 2028 2029 20300
500
1000
1500
2000
Figure 6.7
Total Annual Costs of Electricity Generation for Each Scenario © Worldwatch Institute
BAU 52% RE (+500 MW Natural Gas)
56% RE (+500 MW Coal)
85% RE (+300 MW Petroleum)
90% RE (+210 MW Natural Gas)

116 | Haiti Sustainable Energy Roadmap
Figure 6.8 shows the total cumulative investment required to build up necessary capacities in all scenarios. It also shows the total cost and savings versus the BAU scenario of electricity generation until 2030. The analysis assumes that investment includes only the overnight capital cost required to meet demand, and ignores interest during both construction and project contingencies. The cost of electricity generation comprises the total levelized cost of electricity production and therefore has the same assumptions as the LCOE analysis.
Figure 6.8 shows that the BAU scenario requires the lowest initial capital investment but is the most expensive form of electricity generation (USD 4.3 billion more expensive than the next most expensive scenario, Scenario 3), as a result of high fuel costs. In general, the scenarios demonstrate that increasing renewable energy penetration requires greater initial investment but also yields greater savings. The exception to this is Scenario 3, where a scale-up of petroleum-based power actually leads to slightly higher initial capital investment than the higher-renewable system in Scenario 4. Building up the 90% renewable energy scenario would require an initial capital investment of around USD 4.71 billion, nearly four times the initial capital investment required in the BAU scenario.
While such investments seem challenging, implementing a largely renewable-based energy system could in the long term save Haiti USD 5.84 billion versus BAU by 2030. Moreover, a share of 90% renewable energy by 2030 compares favorably to scenarios with lower penetration of renewables. In comparison to Scenario 3, Scenario 4 would save Haiti USD 1.55 billion, and in comparison to Scenarios 1 and 2 it would save USD 1.50 and 0.99 billion, respectively. After Scenario 4, Scenario 2 is the next cheapest option, demonstrating how coal can limit costs in Haiti more effectively than other fossil fuels. If local pollution costs were internalized in this assessment, however, Scenario 1 would easily become the second cheapest option because natural gas generally has significantly lower environmental impacts than either coal or petroleum.
As the solar and wind power industries mature, progressively more markets are being served. A growing number of developing countries, such as Kenya, Morocco, and South Africa, are attracting renewable
Billi
on U
SD
0
3
6
9
12
15
Total UpfrontInvestment Needed toMeet Annual Demand
Total Costof ElectricityGeneration
Total Savingover BAU
Figure 6.8
Total Investment, Generation Cost, and Savings to 2030 Under All Scenarios© Worldwatch Institute
BAU52% RE (+500 MW Natural Gas)56% RE (+500 MW Coal)85% RE (+300 MW Petroleum)90% RE (+210 MW Natural Gas)

Assessing the Socioeconomic Impacts of Alternative Electricity Pathways | 117
energy finance in rapidly increasing amounts.19 The development of a similar investment climate could put Haiti on a path to a clean electricity sector. Investors are increasingly seeking opportunities in developing countries with good natural resources and stable policy environments. It is in the power of local policymakers to help attract the necessary financial resources for a successful transformation of Haiti’s electricity sector. Chapters 7 and 8 explore how Haiti can access more finance and what policy frameworks are helpful in attracting domestic and international investors.
6.4.4 Greenhouse Gas Emissions Savings
Meeting rising electricity demand with a continued reliance on conventional power sources will increase Haiti’s greenhouse gas emissions dramatically. Transitioning to greater shares of renewable energy also will increase the country’s annual electricity-sector emissions compared to today (see Figure 6.9), which is not surprising considering that Haiti is projected to generate roughly 10 times more power in 2030 than today (see Chapter 5). Of the four transition scenarios, however, Scenario 4 results in the lowest annual emissions, or about 0.69 million tons of CO2-equivalent by 2030. Emissions under BAU are six times greater than under Scenario 4 by 2030, while emissions under Scenario 2 are higher than even BAU due to its high reliance on coal.
Figure 6.10 shows the projected cumulative electricity sector-related greenhouse gas emissions (CO2, N2O, and CH4) for the different scenarios. Scenario 4 has the greatest total emission savings versus BAU and can save around 22.2 million tons of CO2-equivalent by 2030. Emission savings for both Scenarios 1 and 3 versus BAU amount to more than 16 million tons of CO2-equivalent by 2030. Scenario 2, despite its high renewable share of 56%, leads to negligible emissions savings of 0.18 million tons of CO2-equivalent by 2030 because of its dependence on coal-fired generation.
CO2-e
quiv
alen
t Em
issi
ons
(Mill
ion
tons
)
2015 2016 2017 2018 2019 2020 2021 2022 2023 2024 2025 2026 2027 2028 2029 20300
1.0
2.0
3.0
4.0
5.0
Figure 6.9
Projected Annual Greenhouse Gas Emissions for All Scenarios, 2015–2030 © Worldwatch Institute
BAU 52% RE (+500 MW Natural Gas)
56% RE (+500 MW Coal)
85% RE (+300 MW Petroleum)
90% RE (+210 MW Natural Gas)

118 | Haiti Sustainable Energy Roadmap
These results illustrate the role of coal, and less so of oil-based generation, in driving emission increases. For example, emission projections for Scenario 2 are nearly as high as those under the BAU scenario despite a much higher renewable energy share. Moreover, results for Scenario 3 show that an 85% renewable energy share with increased oil-based generation leads to substantially higher emissions than a similar scenario of renewable energy penetration (Scenario 4, at 90%) that has additional natural gas capacity. Similarly, despite having a 33% greater share of renewable energy, Scenario 3’s emissions exceed those of Scenario 1 (natural gas) by 1.65 million tons of CO2-equivalent by 2030 because of Scenario 3’s increase in oil-based generation.
This analysis only takes into account emissions that occur as a direct result of generation. Renewable energy technology development, like fossil fuel technology development and resource extractions, leads to greenhouse gas emissions. Although these emissions figures were left out of this study due to time and resource constraints, it is believed that their inclusion would only help the argument for many renewable energy sources.
6.4.5 Job Creation
A tangible economic benefit from investment in renewable energy is new job creation. New jobs can include direct jobs in the energy sector’s core activities, indirect jobs in sectors that supply the energy industry, and induced jobs that are created when wealth generated by the energy industry is spent in other sectors of the economy.20
Direct jobs in electricity generation projects are generally divided into two categories: construction, installation, and manufacturing (CIM); and operations and maintenance (O&M).21 (See Figure 6.11.) CIM jobs typically are concentrated in the first few years of setting up an energy facility, whereas most O&M jobs exist for the lifespan of the installation. To estimate long-term job creation, CIM jobs can be averaged out over the expected lifetime of new projects. In general, renewable power plants are more labor intensive than conventional power plants.22 (See Figure 6.12.)
Indirect and induced employment opportunities are more difficult to quantify and are therefore excluded from the analysis that follows. Nonetheless, they can be significant. Indirect jobs are positions created throughout the supply chain based on the increased demand for materials and components required for
CO2-
equi
vale
nt E
mis
sion
s (M
illio
n to
ns)
Cumulative Emissions Cumulative Emissions Savings0
5
10
15
20
25
30
35
Figure 6.10
Cumulative CO2-equivalent Emissions to 2030 Under All Scenarios© Worldwatch Institute
BAU52% RE (+500 MW Natural Gas)56% RE (+500 MW Coal)85% RE (+300 MW Petroleum)90% RE (+210 MW Natural Gas)

Assessing the Socioeconomic Impacts of Alternative Electricity Pathways | 119
energy equipment. Induced jobs are the jobs created as the salaries earned in the direct and indirect jobs in the renewable value chains are then spent on a range of goods and services in the wider economy. The increased spending from the renewables jobs creates and supports induced jobs. In addition, reliable and affordable access to energy allows for investments in new local businesses, which bring additional revenue, incomes, and jobs.
Figure 6.13 compares the job creation estimates of different power generation technologies with the LCOE for each technology examined. Wind and hydro are not only less expensive than coal and natural gas, but also create more employment per GWh of generation. Solar PV is a bit more expensive than other renewable technologies but has the potential to create the highest number of jobs. Biomass also has the potential to create more jobs than either coal or natural gas.
Engineers Engineers Project develop-ment analysis
Construction workers
Materials recyclersSystem designers and installers
Maintenance staff
Construction workers
Technicians Technicians
Technicians
Processing of Raw Materials
Manufacture of Components
Installation and Plant Construction
Operation and Maintenance Decommissioning
Figure 6.11
Direct Jobs in the Power Plant Lifecycle Value Chain
Job
Crea
tion
(Job
-yea
rs p
er G
igaw
att-
hour
)
Biomass
Geotherm
al
Land�ll G
as
Small
Hyd
ro
Solar PV
Solar Th
ermal
Wind
Carbon Cap
ture & St
orage
Nuclear
Coal
Natural
Gas
Energy E�cie
ncy0
0.25
0.50
0.75
1.00
1.25
1.50
2.00
1.75
Figure 6.12
Global Job Creation Estimates for Various Power Generation Sources© Worldwatch Institute

120 | Haiti Sustainable Energy Roadmap
To assess the employment impacts of the different scenarios, we used a simple but thorough methodology developed by Wei, Patadia and Kammen (WPK) to estimate the number of jobs created in Haiti according to electricity demand and the composition of the generation mix.23 The model is derived from a meta-analysis of 15 job creation studies, which report employment within a specific energy sector using a top-down or bottom-up approach. From this meta-analysis, the model produces direct job multipliers per unit of energy that can be applied to an electricity scenario with a specified generation mix.
It is important to note that assumptions in the WPK model can lead to uncertainties in job creation estimates. Because the model assumes that transmission and distribution are unconstrained, job impacts from developing transmission lines and pipelines are not captured. Import leakage can lead to decreased local employment but is not considered in the model. In addition, technology or product improvements can lead to lower job requirements but are not accounted for in the model.
We applied the WPK model to the technological pathways elaborated in Chapter 5 to determine the cumulative number of local jobs (employment that occurs within Haiti) created by 2030 in each scenario. (See Figure 6.14.) The BAU scenario creates the lowest level of employment because the current electricity system is not labor intensive. As the share of renewables in the electricity system increases, however, the level of employment rises with the increasing use of labor-intensive technologies. In Scenario 4, with 90% renewable penetration, Haiti has the opportunity to create 1,870 new jobs in the electricity sector, 1,340 more than under BAU. Considering the current unemployment rate of 40.6%, these are valuable job additions that come at no additional cost.24
Renewable energy development clearly offers Haiti promising employment opportunities and an alternative to transferring its wealth out of the country to pay for fossil fuel imports. It is important to note, however, that most of the initial local jobs from renewables will occur in installation and O&M. To capture additional employment opportunities from renewable energy, Haiti would need to invest in capacity building, including expanding its domestic manufacturing base to allow for
Leve
lized
Cos
t of E
lect
ricity
(U.S
. Cen
ts p
er K
ilow
att-
hour
)
Job Creation(Job-years per G
igawatt-hour)
Biomass
Small
Hyd
ro
Small
-scale
Solar PV
Large-sc
ale Solar
PVWind Oil
Coal
Natural
Gas
0
5
10
15
20
25
0
0.3
0.6
0.9
1.2
1.5
Figure 6.13
LCOE and Job Creation Estimates for Various Power Generation Sources© Worldwatch Institute
LCOEJob Creation

Assessing the Socioeconomic Impacts of Alternative Electricity Pathways | 121
production of renewable energy equipment and training a skilled labor force to install, operate, and maintain new facilities. The success of Barbados in manufacturing solar water heaters for domestic consumption and export throughout the Caribbean is a success story that Haiti could emulate for this and other technologies.
6.4.6 Impact on Economic Sectors
Further research is needed to understand the economic risks that local pollution and a changing climate pose to Haiti’s different economic sectors. Such assessment is beyond the scope of this study but would be very insightful given the country’s vulnerability to environmental disasters and its growing reliance on tourism as a leading industry. In general, the impacts of pollution and climate change in Haiti will likely be higher than is discussed in this chapter. This is primarily because the country is an environmentally at-risk island nation; according to the Environmental Vulnerability Index, Haiti is “highly vulnerable” because of its susceptibility to hazards that include meteorological events, geological events, human-caused events, climate change, and sea-level rise.25
6.5 Conclusion
The economic case in favor of a transition to an electricity system that is based largely on renewable energy is strong in Haiti. It offers the country a chance to reduce power sector debt, charge electricity prices that cover generation costs, save scarce resources on fossil fuel imports, decrease its trade deficit, increase energy security, and reduce greenhouse gas emissions and local pollution at negative costs. On average, renewables in Haiti already cost less than conventional power, especially when compared to today’s oil-based system. Wind and hydropower are competitive generation solutions currently, and solar energy will, over time, become the country’s second cheapest source of electricity behind hydropower if Haiti can make use of learning curves and economies of scale.
Tota
l Dire
ct Jo
bs A
dded
BAU
5
2% RE
(+500 M
W Natu
ral G
as)
56% RE
(+500 M
W Coal)
85% RE
(+300 M
W Petroleum)
9
0% RE
(+210 M
W Natu
ral G
as)0
500
1000
1500
2000
Figure 6.14
Total Jobs Created by 2030 Under All Scenarios© Worldwatch Institute

122 | Haiti Sustainable Energy Roadmap
Assessments of the rising environmental costs associated with electricity generation make it possible to think in new paradigms that make the societal costs of generation more transparent. Our scenarios demonstrate that coal plants would be the most injurious to human health and the environment. The costs of local pollution alone double the costs of coal power. And once local pollution and climate change costs are accounted for, generating 1 kWh of wind power is less than one-third the cost of coal generation, around one-fourth that of diesel generation, and one-fifth that of generation from oil-based combustion turbines. Solar PV is substantially less expensive than all conventional power: it is 7 U.S. cents per kWh cheaper than combined-cycle natural gas generation and more than 24 U.S. cents less than coal power generation.
Given these powerful arguments in favor of a transition to renewables, a continued reliance on fossil fuels, especially petroleum, would be economically ill-advised. The Haitian government should therefore be encouraged to develop a more ambitious plan to rebuild the country’s electricity sector based on renewable energy.
An assessment of the comparative macroeconomic benefits of Worldwatch’s different scenarios to a more sustainable electricity sector further underlines the importance of this shift. Transitioning to an electricity system powered by 90% renewables can decrease average generation costs per kWh by around 15 U.S. cents by 2030 in comparison to BAU. Such a transition also can create an estimated 1,870 new additional jobs and keep greenhouse gas emissions in the electricity sector to below 0.7 million tons of CO2-equivalent annually. Although an accelerated expansion of renewables requires higher upfront investments, it reduces the total cost of electricity generation and can save Haiti around USD 5.84 billion by 2030, freeing up public money to be spent on more pressing social and economic concerns.
Overall, Worldwatch recommends that Haiti pursue an electricity expansion similar to Scenario 4, which relies on the addition of a small amount of natural gas capacity alongside renewable energy to achieve 90% penetration of renewables by 2030. If Haiti expands its fossil fuel installed capacity in addition to its renewable capacity, Worldwatch recommends that it transition away from oil-based generation. And although coal generation can substantially reduce Haiti’s fossil fuel import expenditures, coal’s impacts on local pollution and the global climate make it a less enticing option than natural gas.

Key Findings
• Sustainable energy investments do not take place in a vacuum. One of the major challenges in Haiti is the hesitation to invest in a country perceived as fragile. Limited national infrastructure, disputed land ownership, and a history of political instability, insecurity, and natural disasters have contributed to very low investment rankings.
• Haiti’s few existing sustainable energy projects are a result of foreign aid and donations, reflecting the unattractive investment environment for these technologies.
• The limited scale of investments and profits in sustainable energy projects—particularly decentralized, small-scale solutions—makes them unattractive to many investors. Creating economies of scale by bundling projects can make sustainable energy more attractive.
• Limited capacity in Haiti’s commercial banks continues to impede domestic financing for energy projects, especially in sustainable energy. High interest rates and the lack of long-term loans pose a major barrier for financing sustainable energy projects. Human resource building and well-designed loan programs need to go hand in hand to support interested investors. Mechanisms such as loan guarantees could provide a more stable investment climate.
• Cash recovery for generators through fair electricity tariffs and fewer transmission and distribution losses can increase the quality of energy services and encourage investment in sustainable energy projects.
• Implementing working rural electrification business models will be key to building sustainable energy systems across Haiti. Several business models have proved successful internationally in creating and maintaining minigrids and could serve as important examples for the country.
• Microfinance institutions exist but need to be adapted to fit the sustainable energy sector. Partnerships with finance organizations that have experience in sustainable energy could provide financial, technical, and human support to microfinance institutions in Haiti.
• Conventional development assistance is targeted increasingly toward sustainable energy. Haiti should direct these resources as well as unspent earthquake recovery funds to establishing sustainable energy programs.
• Savings from the PetroCaribe fund could be used to provide low-interest, long-term loans for sustainable energy projects.
• Climate financing could provide major support for Haiti’s sustainable energy transition. Such financing could also replace sovereign guarantees as a form of investment security to lower the risk for investors.
• Additional financing opportunities include remittances pooled together to finance larger projects.
7 | Overcoming Barriers to Financing Sustainable Energy in Haiti
Overcoming Barriers to Financing Sustainable Energy in Haiti | 123

124 | Haiti Sustainable Energy Roadmap
This chapter discusses Haiti’s challenging investment environment but also highlights sector-specific enablers and creative sources of finance that the country can rely on to fund sustainable energy projects. Historically, Haiti’s challenging economic environment has prevented domestic and international project developers and investors from becoming more active in the country.
Despite these investment barriers, Haiti has substantial economic and technical potential for renewable energy. Analysis of the country’s renewable potential shows that just six square kilometers of solar PV panels could generate as much electricity as Haiti currently produces. (See Chapter 3.) Meanwhile, LCOE and scenario analyses demonstrate the cost savings and other economic, environmental, and social benefits that Haiti can achieve by transitioning to sustainable energy systems. (See Chapter 6.) The modeling results show that reaching 90% renewable electricity generation by 2030 would require less than USD 6.85 billion in investment from 2013 to 2030 and would save Haiti an estimated USD 5.84 billion compared to similar levels of development under a business-as-usual model.
Globally, USD 244 billion was invested in renewable power and fuels in 2012.1 Although the Americas (excluding Brazil and the United States) still represents a relatively small share of global investments, regional investments that year increased by USD 1.2 billion, reaching USD 9.5 billion.2 Perhaps most impressively, this increase came in a year marked by large declines in major markets such as Brazil, Europe, India, and the United States. Haiti, however, has seen virtually no renewable energy investment over the past decade. Besides investment in small hydropower plants and upgrading the existing Péligre hydro plant, only one significant loan has been given to a renewable energy business or project: Fonkoze’s USD 100,000 loan to ENERSA, a solar manufacturing company based in Port-au-Prince.3
Nearly all renewable energy development in Haiti—in the form of small-scale solar PV technology and small hydropower—has been made possible through the work of nongovernmental organizations (NGOs), foreign aid, and donations, reflecting the unattractive investment environment for these technologies. Although it is a positive sign that renewable technologies are beginning to enter the market, the few renewable energy businesses that do exist in Haiti face challenges competing on a business level with these donations.4 The country has vast potential for renewable energy development, and both project developers and policymakers can take key steps to encourage the financing of profitable renewable energy projects.
Capacity within Haitian banks to provide sustainable energy financing is low. Efforts need to be made to strengthen the ability of domestic banks to finance renewable energy projects. At the same time, lack of awareness about available renewable energy financing schemes can act as a major barrier to project development, and additional education and outreach are needed to inform energy developers about positive developments in available financing. Additionally, increasing tariff collection, decreasing losses, and creating fair tariff structures can ease worries about sustainable energy investment in Haiti.
International finance has an important role to play in supporting sustainable energy development in Haiti, especially in the short term. Because the country is currently viewed as risky for investment due to its poor “ease of doing business” indicators, in order to attract international finance in this sector it will be essential to reduce economy-of-scale hurdles through project bundling and by instituting risk-management measures such as sovereign guarantees for sustainable energy projects. International assistance, including climate finance, can help bolster Haiti’s sustainable energy markets through individual projects as well as the development and implementation of sustainable energy support policies.

Overcoming Barriers to Financing Sustainable Energy in Haiti | 125
Finally, supporting small and medium-sized enterprises (SMEs) and finding innovative ways to finance and operate rural electrification programs such as minigrids can improve energy services while boosting the Haitian economy.
It is important to keep in mind that Haiti is still a policy-driven market. As a result, although this chapter focuses on ways to promote sustainable energy through financial institutions, many investment barriers will be most effectively addressed through policy and regulatory mechanisms. (See Chapter 8.)
7.1 Underlying Investment Risks in Haiti
Sustainable energy investments do not take place in a vacuum. One of the major challenges that Haiti faces is a general hesitation to make investments in a country that is perceived as fragile. In recent years, Haiti has made progress in improving its legal framework, strengthening relevant institutions, and improving economic governance. Increased international attention following the 2010 earthquake and the openly pro-business agenda of President Martelly’s administration has helped spur interest among foreign investors. Yet although the economic, environmental, and social benefits of renewable energy investment are too great to ignore, major challenges remain. Haiti remains one of the most difficult countries in the world to do business in, and a variety of interconnected factors increase the perceived risk among potential investors. These include:
7.1.1 Lack of Adequate National Infrastructure
The 2010 earthquake resulted in an estimated USD 4.3 billion in damages to physical assets including roads, bridges, ports, and airports—all of which were limited even before the disaster.5 Such infrastructure is required for the importation and transport of renewable energy technology and components, particularly wind turbines. Health infrastructure is also poor and inadequate throughout most of the country, presenting concerns for potential visitors to Haiti.6 The poor condition of Haiti’s existing power infrastructure creates additional challenges; frequent power outages reduce the output of grid-tied generation projects, posing risk for potential project investors.7
7.1.2 Unclear Property Rights
Companies seeking to access land for project development face significant hurdles. Land ownership and control have long been contentious, disrupted continually by political instability and historically used by various parties to wield power.8 At the time of the 2010 earthquake, the government agency responsible for overseeing land registration had an annual operating budget of only USD 130,000 and could account for less than 5% of the country’s territory.9 Most official records that did exist, kept in handwritten logs, were destroyed when the central tax office collapsed in the earthquake.10
This uncertainty leaves potential energy project developers facing the prospect of a lengthy and possibly contentious process to acquire access rights. The need to reform Haiti’s land rights system attracted renewed focus following the earthquake because of the challenges it posed for relocation and recovery, and President Martelly has made reform and modernization of the system a priority, noting that in addition to harming individual citizens, the uncertainty “paralyzes” investors.11 Although his administration aims to address problems related to lack of access to land records, surveys, and property titles, these issues have not yet been resolved.12

126 | Haiti Sustainable Energy Roadmap
7.1.3 Frequent Political Instability
Haiti’s history of political instability also poses a barrier to investors, who hesitate to commit to long-term project financing in an uncertain climate. Political stability has been identified as a prerequisite for solving the problems discussed above, as well as other factors that discourage investment, including security issues and a lack of transparency.13 In the renewable energy sector, political stability makes it possible to implement and sustain long-term policies, reassuring investors that they will be operating under predictable and stable regulations and incentives.
7.1.4 Risk of Natural Disaster
The risk of natural disaster is great in Haiti. Even before the 2010 earthquake, the country ranked fifth worldwide in the share of its population at high risk of mortality from multiple natural disasters (96.5%).14 Haiti is one of the Caribbean’s most disaster-prone countries, with high risk of severe winds, flooding, mudslides, and earthquakes. The country’s high rate of deforestation (98%) only magnifies these risks and can turn moderately sized rainstorms into flooding events.15 Haiti’s dense settlements in low-lying areas and floodplains contribute to its vulnerability.
In 2008, four major storm events—Tropical Storm Fay and Hurricanes Gustav, Hannah, and Ike—hit Haiti over a three-week period, causing losses equivalent to 15% of the country’s GDP.16 A 2012 Germanwatch study found Haiti to be one of the three countries most affected by extreme weather events between 1993 and 2012, subjected to 60 extreme weather events during that period.17 The same study ranked Haiti as the most affected country in 2012 alone, due largely to Hurricane Sandy, which cost the country over 100 lives and USD 750 million in economic losses (about 10% of GDP).18
7.1.5 Security Risks
Security remains a concern for potential investors and visitors to Haiti, although the situation has improved in recent years. Citing the “poor state of Haiti’s emergency response network,” the U.S. State Department urges visitors to exercise caution but downgraded its “Visitors Warnings” over the past year.19 Although the risk of violent crime and theft remain, the incidence of homicide and kidnapping decreased from 2012 to 2013, and the United Nations’ Stabilization Force for Haiti reports a decrease in civil unrest and major crimes, as well as improved performance by the Haitian National Police.20
7.1.6 Overall Investment Climate
Although renewable energy investments are continually diversifying across the globe, investments in the sector typically follow the general investment climate of a given country, which in turn reflects the factors described above. As a consequence, Haiti’s overall fiscal climate may pose a challenge in attracting investment to the renewables sector.
A country’s business climate has economy-wide impacts, affecting the cost of capital, goods, and services, and in turn influencing investor decisions. According to the International Finance Corporation’s Doing Business 2014 report, Haiti scores low on international rankings for “starting a business” (187th of 189 countries) and “ease of doing business” (177th), due in large part to the lack of available credit, low capability to resolve solvency, poor protection of investors, and bureaucratic barriers relating to registering property, paying taxes, and enforcing contracts.21 The World Economic Forum, meanwhile, ranks Haiti 143rd out of 148 countries in its Global Competitiveness Index.22 (See Table 7.1.)

Overcoming Barriers to Financing Sustainable Energy in Haiti | 127
Economic and energy challenges are often interlinked. Although a country’s overall investment climate has been shown to affect the financial attractiveness of the energy sector, conditions within the energy sector also play a role in influencing the overall economic climate. This is particularly evident in Haiti, where the country’s fragile financial situation impedes access to the significant domestic and international financing necessary for a large-scale shift to renewable energy. It creates an indirect risk for lending in the private sector, causing financial institutions to charge high interest rates for loans in the country.23
Nevertheless, there are steps that the Haitian government and banks can take to facilitate international sustainable energy loans. Nicaragua serves as a regional example of how to overcome investment barriers to sustainable energy, despite ranking among the lowest-performing countries in global competitiveness and ease of doing business. In 2012, the IDB’s Climatescope report ranked Nicaragua second out of 26 Latin American and Caribbean countries for its ability to attract clean energy financing, due in large part to government incentives and investment in the sector.24 These actions have sent a signal to potential investors in the energy sector that the Nicaraguan government is friendly to sustainable energy investors.
7.2 Ways to Address Sector-Specific Barriers
7.2.1 Strengthening the Ability of Commercial Banks to Provide Sustainable Energy Finance
Because of the high upfront investment requirements of renewable energy, access to long-term, low-interest loans is essential. Sustainable energy markets are still emerging in most countries, and large
Table 7.1 Selected Business and Economic Competitiveness Indicators for Haiti
Indicator Ranking
“Doing Business” Rankings (out of 189 countries) 177
Enforcing Contracts 96
Dealing with Construction Permits 141
Getting Credit 165
Resolving Insolvency 189
Protecting Investors 170
Starting a Business 187
Global Competitiveness Index rankings (out of 148 countries) 143
Macroeconomic Environment 105
Quality of Electricity Supply 137
Country Credit Rating 144
Financial Market Development 142
Institutions 146
Infrastructure 142
Note: In both rankings, a ranking closer to 1 indicates more favorable conditions. Source: See Endnote 22 for this chapter.

128 | Haiti Sustainable Energy Roadmap
conventional fossil fuel plants typically receive cheaper loans than do renewable energy projects, further skewing the investment climate. Due to Haiti’s underlying economic and structural problems, however, long-tem, low-interest loans are largely non-existent for not only sustainable energy projects, but also most infrastructural projects.25
High interest rates pose a barrier to accessing finance in Haiti in general, and can significantly increase the lifetime financing expense of energy efficiency and renewable energy projects with high upfront capital costs. In addition, sustainable energy financing remains a new market in Haiti, so banks are just starting to build their lending capacity, and project developers often lack experience in obtaining loans and permits. In many cases, interest rates are the make-or-break factor in determining the viability of renewable energy projects: over a 10-year loan period, increasing the interest rate from 5% to 20% can nearly double financing costs.26 (See Figure 7.1.)
Investor confidence remains too low and interest rates remain too high to enable widespread investments in energy efficiency and renewable energy projects across Haiti. The availability of loans for household and small- to medium-scale commercial energy efficiency and renewable energy projects is also minimal.27 To overcome this, Haiti needs improved capacity in domestic banks, improved awareness about the real opportunities and risks associated with sustainable energy lending, and increased experience of project developers seeking loans for sustainable energy projects. Capacity building for both domestic banks and energy developers should be prioritized in order to reduce real and perceived risks associated with sustainable energy project financing. Efforts to continue the uptake of available loans and to strengthen Haiti’s domestic sustainable energy market could be modeled on regional examples.
Private and public financing for energy efficiency and renewable energy investment is largely nonexistent in Haiti. To date, private sources of financing have proven insufficient to enable widespread investment in sustainable energy. Haiti ranked 22nd of 26 nations in the IDB’s Climatescope assessment of the investment environment for climate-related investments in Latin America.28 Public financing is essential for supplementing private capital and mobilizing additional private finance by demonstrating confidence in the viability of such projects and building investor confidence. The effectiveness of public finance
Fina
ncin
g Co
sts
over
10-
Year
Loa
nRe
paym
ent P
erio
d (M
illio
n U
SD)
0
20
40
60
80
100
120
5% 10% 15% 20%
Figure 7.1
Impact of Interest Rates on Financing Costs for a Utility-Scale Wind FarmNote: Assumes a 10-year, USD 50 million loan © Worldwatch Institute

Overcoming Barriers to Financing Sustainable Energy in Haiti | 129
at achieving this goal is a key determinant of the future vitality of sustainable energy investments. Unfortunately, the Haitian government is not well positioned to invest in such projects due to its many other high-priority development investments and its continual payments to EDH.
Haitian project developers often lack capital of their own to invest in renewable energy and have little access to borrowing instruments such as soft loans, credits, and grants. In general, access to capital remains a challenge throughout the country, and Haiti ranks last or near-last in several finance categories in the Global Competitiveness Index.29 (See Table 7.2.) As a result, aid and donations are the main way that developers take advantage of the country’s renewable potential.
Interest rates in Haiti are high for loans of any kind, but they can be especially prohibitive when it comes to financing renewable energy projects. The high upfront capital costs of such projects often require long-term loans: internationally, the repayment period for renewable energy technologies spans about 10–20 years. Haitian banks do not currently offer loan interest rates and time frames for businesses that align with typical sustainable energy financing needs. Additional capacity building and financial support mechanisms are needed to enable widespread domestic lending for sustainable energy investments and to ensure that overall interest rate reductions are applied to sustainable energy financing.
Well-structured loan guarantee programs can leverage significant money at low actual cost and help to de-risk renewable energy investments. As a result, loan guarantees can support a high volume of loans without requiring the government to give out much money. Loan guarantees have been identified as being especially critical in financing renewable energy projects in financially risky countries like Haiti; to date, however, the Haitian government has been hesitant to back loans to renewables.
One form of loan guarantee could be a sovereign guarantee from the Government of Haiti. This could be used to ensure that all loan-payment obligations will be met if the project developer defaults, which would greatly reduce the risk of renewable energy investment in the country. Although Haiti’s strained financial situation makes it difficult for the government to take on sustainable energy investment risk by itself, providing sovereign and other types of loan guarantees is one area where international assistance or climate finance can help strengthen the domestic energy market. Many companies will not invest in Haiti by themselves, and receiving support from organizations such as the IFC could provide the security they need to make investments, as was the case with E-Power’s 30 MW power plant.30
Table 7.2 Haiti’s Financial Market Development Rankings in the GCI
Indicator Ranking
Financing through local equity market 140
Ease of access to loans 126
Venture capital availability 135
Note: Ranking is out of 148 countries. A ranking closer to 1 indicates more favorable conditions. Source: See Endnote 29 for this chapter.

130 | Haiti Sustainable Energy Roadmap
In contrast to direct project loans or fiscal support through a feed-in tariff, loan guarantees allow the government to support projects without an initial capital outlay. If properly selected, the vast majority of projects will never need to collect on the commitments from the government, as the private loans that are made accessible and affordable as a result of the guarantee can be repaid in full based on revenue from successful project operation. The U.S. Department of Energy’s Loan Program, for example, has a loan default rate of below 2%, despite committing USD 34.4 billion since 2009.31 The Development Bank of Jamaica (DBJ) has a partial loan-guarantee program to address the lack of capacity of commercial banks in Jamaica to accept renewable energy equipment as collateral for loans, and can enable larger-scale project financing.32 (See Case Study 6.) Examples like this could be applied to the Haitian context.
In Haiti, where the capital market is not equipped to adequately finance renewable energy projects because of a lack of capital, awareness, and experience, strengthening financial intermediaries like banks and investment companies is a good way to leverage private capital to develop renewable energy projects. This alone may not be sufficient, however. Countries that have been successful in promoting renewables at a larger scale have not only enabled commercial financing for these projects, but also set up effective public support mechanisms for them. This is an important way to establish a country’s renewable energy market in the early stages and to build confidence among private investors and banks.
Case Study 6 Partial Loan Guarantees for Chicken House Solar PV Systems in Jamaica
As with many other industries and services in Jamaica, electricity is the largest cost in poultry farm operations. The Jamaica Broilers Group, the largest poultry producer in the Caribbean, has made significant efforts to produce its own energy from renewable resources in order to lower energy costs. In addition to the company’s own ethanol production plant, in 2013 Jamaica Broilers began installing solar PV capacity at chicken houses owned by farmers contracted by the company. The project also involved installing energy-efficient LED lighting at the facilities.
The first phase of the solar project aimed to install 15 kW PV systems at about 40 chicken houses—totaling some 600 kW—by the end of March 2013. Each 15 kW system is expected to generate 22 MWh of electricity per year. Phase 1 is aimed at supplying energy for daytime use, and grid access for the PV systems is an important criterion for the addition of more modules in future phases.
The project is estimated to cost USD 10 million over two years. Rather than requiring the chicken farmers to leverage their farms as collateral to purchase the solar equipment, Jamaica Broilers will facilitate obtaining supplies and financing for farmers to lease the equipment, with an expected payback period of five to six years. Each participating farmer applies for the loan, which is financed by the Development Bank of Jamaica (DBJ) through the National Peoples Cooperative Bank at a 9% interest rate over seven years.
The solar PV project is a pioneer in Jamaica’s renewable energy market in that it allows the use of renewable energy equipment—rather than farms—as collateral for loans. Jamaica Broilers has the right on behalf of the banks to repossess and sell the solar equipment if farmers fail to meet loan repayment requirements. The project makes use of DBJ’s partial loan guarantee program to enable this process: DBJ provided an 80% loan guarantee in the event of default.
Jamaica Broilers’ use of partial loan guarantees and solar PV equipment leasing constitute a creative approach to getting around some of the major barriers to renewable energy financing that persist in the country. The use of these and other emerging financial mechanisms can serve as a model for other individuals and companies seeking to reduce energy costs through substantial sustainable energy projects.
Source: See Endnote 32 for this chapter.

Overcoming Barriers to Financing Sustainable Energy in Haiti | 131
Other barriers include a lack of capital availability; the absence of long-term, concessional commercial loans; the difficulty in accessing international financing for renewable energy and energy efficiency; and a lack of knowledge and awareness of financing opportunities and conditions of international climate finance institutions. Some of these barriers could be effectively addressed simply through better execution of the existing laws and regulations.
Although Haiti does not currently have banks that consistently provide major credit lines for sustainable energy projects, lessons can be learned from regional leaders. For example, Jamaica’s energy credit lines until recently faced relatively low participation rates, despite the economic opportunities associated with sustainable energy projects in the country. A September 2011 study found that lack of public education and awareness of the benefits of energy efficiency and renewable energy contributed to the limited uptake of the country’s Energy Fund.33 In part to address these issues, in June 2012 the IDB and DBJ jointly launched DBJ GreenBiz, a roughly USD 800,000 initiative to demonstrate the benefits of energy efficiency measures for SMEs and to train Certified Energy Auditors and Managers to enable effective use of the Fund.34 The DBJ GreenBiz initiative aims to increase awareness through public showcases of energy projects, radio and television interviews, advertising, educational workshops and seminars, and an energy fair.35
According to DBJ, initial results indicate that Jamaica’s GreenBiz program and other measures have been successful in encouraging uptake of Energy Fund loans. Only between JMD 300 million and JMD 400 million (USD 2.8 million and USD 3.7 million) had been loaned through the fund since its launch in 2008 through early 2012. By late November 2012, however, after the start of the GreenBiz initiative, more than JMD 600 million (USD 5.6 million) in energy loans had been disbursed to SMEs and residential customers.36 Once Haiti develops credit lines for renewable energy, it will be important for banks to showcase the cost effectiveness of such development, as demonstrated throughout this report.
7.2.2 Bundling Projects to Lower the Per-unit Costs of Sustainable Energy
Creating economies of scale and lowering transaction costs are two ways to lower the per-unit financial costs of sustainable energy. Even though the levelized costs of many renewable energy technologies are lower than those of fossil fuel technologies in Haiti, renewables are still more capital intensive initially. As a result, it is even more important that utility-sized renewable projects are built to scale, as this can lower financing costs. In relatively small markets like Haiti, however, it would be difficult and arguably imprudent to build one very large renewable project, such as a 300 MW wind farm. It therefore is important to explore the idea of bundling renewable energy projects in Haiti.
This could involve bundling many renewable projects across the country as one project, or even bundling one renewable project with other development or infrastructure projects in the areas of education, health, and telecommunications. Including renewable energy developments in bundled projects could help to reduce financing and capital costs for individual renewable projects and could be used to leverage greater private investment in the sector. This strategy could also be used to garner funding from banks and programs that typically do not fund sustainable energy projects.
7.2.3 Ensuring Cash Recovery for Electricity Generators
The unsustainable operation and tenuous financial viability of electricity generators have long been major problems, with significant negative impacts across the electricity sector and broader Haitian economy. A combination of inappropriate electricity tariffs, difficulties in collecting bills from consumers, and

132 | Haiti Sustainable Energy Roadmap
significant technical and non-technical losses contribute to generators’ losses. Revenues from selling electricity amounted to only USD 66 million in FY 2010–11, whereas the state utility spent USD 301 million on all of its operations.37 This equates to a cash recovery index (CRI) of just 22%, one of the lowest in the world.38
The inability of the electricity sector to cover its operating expenses forces the Haitian government to make up for the losses with heavy spending, representing as much as 2.7% of Haiti’s GDP in 2010.39 The World Bank recently estimated the total value of electricity subsidies from the Haitian government to EDH at USD 180 million, or 17% of the national budget.40 This diverts funds that otherwise could be invested in much-needed infrastructure, health, and education improvements. Additionally, despite the significant transfers from the government to EDH, electrification throughout Haiti has increased only 10% in the past two decades; in 2013, EDH was able to extend grid access to only an additional 6,500 homes.41
Solutions to this financial problem include smart meters and making efforts to bill more customers. Although illegal connections contribute to Haiti’s high rate of non-technical losses, a large share of total losses is due to inefficient or ineffective billing and collection processes. Haiti currently lacks the capacity and resources to meter and charge many of its customers, resulting in only an estimated one-third of customers being billed in 2012.42 Meanwhile, the government estimated in 2006 that at least a third of all households illegally connected to the grid had the means to pay their electricity bill.43 Improving the utility’s billing and collection system represents a “low-hanging fruit,” offering significant and fairly simple opportunities to tap into a larger paying customer base. In its 2012–13 Action Plan, EDH aimed to raise its billing rate to 54% by the end of the year and to 90% by 2016, mainly through the installation of smart meters and a pilot project testing the use of pre-paid meters.44 Targets and programs like these should be continued in the future.
Aside from general country risk, the creditworthiness of off-takers (the party that buys the energy from an IPP, traditionally EDH) is the top risk for investing in renewable energy in Haiti.45 Project developers considering such investment in Haiti have cited the electricity sector’s credit rating as the primary perceived risk and barrier to moving forward.46 Indeed, many international banks have noted that they will lend to sustainable energy initiatives in Haiti and other countries in the region only if there is a sovereign guarantee from the government that ensures that loan repayments will be met even if the off-taker defaults. The government’s efforts to pilot a concessionary system in the Southeast Department (see Chapter 1) could improve off-taker credit and increase private sector participation in the sector.
Haiti’s historical inability to collect tariffs and its high transmission and distribution losses make investors worry that IPPs will not be paid for their generation. In the future, there should be routine tariff reviews that generate reasonable tariff rates that will enable utilities to cover their expenses. Additionally, there should be targets and mechanisms in place for reducing technical and non-technical losses, and these targets should be internalized into tariff review equations.
7.2.4 Creating Working Microloan Programs
For Haitians wishing to invest in household-scale renewable energy or to start a small sustainable energy business, small loans make a huge difference. Most of the people involved in Haiti’s vast informal economy have no access to the formal banking system, which historically has served only the most affluent 1% of the country’s population.47 Without substantial formal assets, such as property, to serve

Overcoming Barriers to Financing Sustainable Energy in Haiti | 133
as collateral, individuals find it difficult to access the credit required to meet the high upfront costs of renewable energy systems.
Until the mid-1990s, elements of Haitian banking legislation, including a cap on interest rates and a requirement that banks keep up to 70% of their outstanding deposits in reserve, prevented large commercial banks from making small loans.48 Haiti’s central bank lowered reserve requirements in 1995, making it feasible for banks to lend to small-scale entrepreneurs for the first time.49 Since then, several microfinance institutions have been developed to facilitate this process. The Haitian bank Sogebank created a microfinance arm called Sogesol in 2000. And Fonkoze, the country’s largest microfinance institution, has over 555,000 active borrowers (nearly all women) and 40 branch offices.50 It also remains the one domestic bank to finance a renewable energy business, having provided USD 100,000 to ENERSA in 2009.51
Given sustainable energy’s ability to provide opportunities for new income-generating activities and improve quality of life, Haitian microfinance institutions should prioritize developing expertise and lending capacity in the renewable energy sector. Efforts could be modeled on innovative partnership programs in other countries. In Nicaragua, for example, Tecnosol, a domestic green energy provider, teamed up with a local microcredit organization and a Seattle-based impact investor to provide small loans for solar technology in rural areas.52 Tecnosol also partnered with the Multilateral Investment Fund (MIF) to provide financing for the purchase of solar panel systems on terms of up to five years. Overall, the project installed 45,000 solar panels, which equated to 11 million liters of kerosene saved and 26,000 tons of CO2 emissions avoided.53 Partnerships like this should be encouraged in Haiti.
7.3 Finding New Sources for Sustainable Energy Finance
The potential sources of financing identified above are geared mostly toward small and medium-sized enterprises and smaller-scale energy investments; for the most part, they would not be sufficient for utility-scale renewable energy projects, which require additional sources of financing. Conventional international development financing, climate finance, and funds from PetroCaribe will all play a key role in funding sustainable energy projects in Haiti. Examining past and current internationally financed programs demonstrates the importance of this funding source, as well as potential future opportunities and projects that would be well suited to receiving additional finance.
7.3.1 Directing Development Assistance to Sustainable Energy Projects
Increasingly, multilateral development banks and bilateral aid from donor countries are focusing grants and loans on energy efficiency and renewable energy projects, rather than on conventional fossil fuel infrastructure such as coal power plants. (See Appendix VIII.) Countries that have emphasized the importance of sustainable energy in national development strategies have a better chance at accessing aid for these purposes.
Haiti has harnessed financing from development agencies in the past to support specific energy-capacity investments, as well as capacity-building programs within the Haitian government and EDH to promote institutional strengthening and policies in support of energy development. Because it will take time before Haiti’s domestic financial system can sponsor any type of large-scale infrastructural project—whether it

134 | Haiti Sustainable Energy Roadmap
be energy, health, transportation, etc.—this is where much of the opportunity for sustainable energy development lies in the short term. In fact, many investors say that they would not invest in energy projects in Haiti without the financial support of institutions like the IFC and the World Bank.54
Several governments, international organizations, and NGOs have directed monetary and technical assistance to Haiti to support energy sector development, including the World Bank, IDB, U.S. Agency for International Development, and Canadian Development Bank. (See Table 7.3.) Many of these projects have focused on refurbishment of existent power plants and transmission and distribution systems. Timelines for these refurbishment projects are more manageable, making them more attractive
Table 7.3 Selected Internationally Financed Technical Assistance Projects in Haiti
Canadian International Development Agency
Rehabilitation of Electrical Facilities Project
Semi-autonomous Electricity Supply Project
Technical Assistance (Jacmel) – Phase III
Global Environment Facility
Small Scale Hydro Power Development in Haiti
Emergency Program for Solar Power Generation and Lighting
Government of Norway Ministry of Foreign Affairs
Haiti Sustainable Energy – NMFA South Department
Inter-American Development Bank
Artibonite 4C Hydroelectric Project
Financing Sustainable Energy through Remittance Flows in Haiti and the Dominican Republic
Institutional Transformation and Modernization Program of the Energy Sector – I
Institutional Transformation and Modernization Program of the Energy Sector – II
Peligre Hydroelectric Plant Rehabilitation Project
Rehabilitation of Electricity Distribution System in Port-au-Prince Project
Supplementary Financing for the Rehabilitation of the Peligre Hydroelectric Plant
Towards a Sustainable Energy Sector Haiti – White Paper
U.S. Agency for International Development
Caracol Community Electrification Program
Electrical Substation Rehabilitation
Energy Sector Reform
Improved Cooking Technology Program
Northern Power Plant
World Bank
Electricity Loss Reduction Project
GEF Solar Autonomous Lighting MSP
Haiti Electricity Project
Rebuilding Energy Infrastructure and Access

Overcoming Barriers to Financing Sustainable Energy in Haiti | 135
for financing.55 Haiti should harness these financial resources to establish sustainable energy programs. Bundling smaller renewable energy projects with one another or with other projects in education, health, and telecommunications could make them more attractive for international donor organizations.
In the aftermath of the 2010 earthquake, international organizations and governments pledged enormous sums for recovery and reconstruction. Private donations reached USD 3.1 billion.56 At the United Nations’ Haiti Donor Conference, 55 countries and organizations pledged a total of USD 8.4 billion in aid over 10 years, in addition to offers of debt relief.57 Much of this money remains unspent: as of December 2012, only around half of the USD 5.37 billion pledged for 2010–12 had been disbursed.58
Although the manner in which international aid to Haiti has been delivered (or not delivered) in the aftermath of the earthquake has sparked controversy, the unspent sum presents opportunities to support sustainable energy development. Analysis of grant money funded through the New York Conference reveals little focus on energy issues, with the Haitian government requesting less money for the energy sector than for any of the other seven sectors assessed in the study.59 (See Figure 7.2.) Although all of these categories are important, the lack of energy-directed funding is striking, revealing a general failure to recognize its crucial role in facilitating improvements across all other sectors.
7.3.2 Attracting Climate Finance
In the UN Framework Convention on Climate Change (UNFCCC) negotiations, industrialized countries have pledged climate funds rising to USD 100 billion per year by 2020.60 Although the exact nature and mechanisms for this financing have yet to be determined, these funds will most likely be disbursed through multiple channels, including bilateral financing, support of multilateral sustainable energy development projects, and the Green Climate Fund (GCF).
In general, climate financing for sustainable energy projects aims to support the incremental costs of
Mill
ion
USD
Energy
Reconstr
uction
Transp
ort
Agricultu
re
Educa
tion
Health
Democratic
In
stitu
tions
Justi
ce an
d
Secu
rity0
100
200
300
400
500
600
700
800
Figure 7.2
Earthquake Recovery Grant Activities by SectorSource: Office of the Special Envoy for Haiti © Worldwatch Institute
Government of Haiti RequestDonor Funds CommittedDonor Funds Dispersed

136 | Haiti Sustainable Energy Roadmap
upfront capital compared to business-as-usual investments in fossil fuel generation. The energy pathway socioeconomic assessment for Haiti presented in Chapter 6 of this Roadmap demonstrates this need for additional upfront investment support for renewable energy development compared to BAU.
The Clean Development Mechanism (CDM), established by the Kyoto Protocol through the UNFCCC process, is an institutional device that allows developing countries to reduce the costs of their transition to sustainable sources of energy, while giving industrialized countries more flexibility in achieving their binding emissions reduction objectives.61 (See Sidebar 7.1.) The promise of CDM financing for future sustainable energy projects in Haiti is unknown, however, and to-date the mechanism has not financed a single project in the country. Latin American and Caribbean countries represent 12.3% of CDM projects worldwide, compared to more than 50% in China and just below 20% in India.62 The Caribbean represented only 0.003% of total registered CDM projects as of May 2013.63
The UNFCCC has identified a mix of technical and non-technical barriers constraining CDM participation in the Caribbean, including low per-capita regional emissions, high transaction costs for project compliance, lack of awareness of the opportunities for using the CDM, lack of experience and technical expertise in the CDM, and lack of financing for investments and funding for CDM transaction costs.64 Through the establishment of the Regional Collaboration Centre for the Caribbean, initially targeting 16 Caribbean nations including Haiti, the UNFCCC is committed to providing technical support to increase the uptake of CDM projects within the region.65
Additionally, Haiti will have access to climate funds through new programs, including Nationally Appropriate Mitigation Actions (NAMAs). NAMAs are one of the main pillars of future climate finance. Currently, NAMA guidelines remain loosely defined; however, there is strong interest on the part of several multilateral and bilateral climate finance sources for recipient countries to design NAMAs that will be ready to receive funding once the bureaucratic details are finalized. One of the benefits of the current loose structure of NAMA programs is that they can include a broad range of sustainable energy activities, including support for specific renewable energy capacity additions, funding to support renewable incentive mechanisms such as feed-in tariffs and energy efficiency programs, and capacity building and institutional strengthening for sustainable energy governance. In addition to climate mitigation, NAMAs are required to demonstrate co-benefits, such as job creation opportunities and health improvements from reduced local air pollution.
The German and U.K. governments have already set up a joint NAMA facility designed to support developing countries that, in the short term, want to implement transformational country-led initiatives within the existing global mitigation architecture. The UNFCCC established a registry to match NAMAs of developing countries with financial, technological, and capacity-building support from donor countries.
Bilateral climate finance from individual donor countries should be explored, as well as funding from multilateral agencies. The Global Environment Facility (GEF), administered through the World Bank, has been a major source of international climate finance since it was established in 1991 and has funded or is currently funding 40 projects in Haiti, 10 of which focus on climate change mitigation or community-based adaptation.66
More recently, in 2008, the World Bank along with several other regional development banks established the Climate Investment Funds (CIFs), which include programs dedicated to renewable energy and energy

Overcoming Barriers to Financing Sustainable Energy in Haiti | 137
efficiency. Through the UNFCCC process, countries agreed to establish a new Green Climate Fund (GCF) to function as the convention’s financial mechanism. Its goal is to provide substantive support to international efforts to combat climate change, and it is expected to channel a significant portion of climate finance in the future. The GCF is still under development but will likely incorporate the CIFs once it is fully operational.
Sidebar 7.1 Financing Small-scale Low-carbon Energy Projects with International Climate Finance
Although international climate finance is traditionally used to promote medium- to large-scale projects, it also can be harnessed to support community-level low-carbon energy projects. Two specific mechanisms, the GEF Small Grants Programme and the CDM Program of Activities, provide valuable financial and technical assistance for small-scale project development.
GEF Small Grants Programme
The GEF Small Grants Programme (SGP) provides needed capital to facilitate the development of small-scale projects. Unlike the larger GEF mechanism, the program, executed through a partnership between the GEF and the UN Development Programme, provides grants up to a maximum of USD 50,000 directly to local communities, financing projects below the size supported through traditional GEF funds.
After a successful Pilot Phase beginning in 1992, the SGP began its official First Operational Phase in 1996 with the aim of providing financial and technical support to small-scale sustainable development projects under a number of thematic areas. Due to strong demand from small-island developing states and least-developed countries, the program has been scaled up considerably since its inception and is currently in its fifth operational phase, 2011–14. To date, USD 450 million has been invested through the SGP to support 14,500 projects worldwide, including a large number of clean energy projects under the Climate Change Mitigation and Adaption program area.
In Haiti, the SGP has supported 30 projects overall and provided financial support to two small-scale renewable energy initiatives since 2012. A USD 47,914 grant to Mouvman Fanm Peyizan Karis, now in its fifth phase, aims to electrify 40 households in Carce by installing PV systems; local technicians are trained in installation, maintenance, and repair. A USD 48,536 grant to Mouvman Peyizan Merann, also in its fifth phase, is funding installment of a 10 kW micro-hydro system in Capotille, which is projected to provide electricity services to 70 families, or approximately 500 individuals.
CDM Program of Activities
The CDM Program of Activities (PoA) was introduced in 2005 as a way to group together several smaller-scale projects that individually would not generate the volume of certified emissions reductions (CERs) necessary for traditional CDM financing. In contrast to project bundling, the PoA requires only the project concept and one concrete activity in order to register as a CDM, thus reducing investment risk for low-carbon energy project developers. Furthermore, even if an individual activity under the PoA is found to be non-compliant, the rest of the activities can continue to operate.
Procedures for PoA projects were adopted in 2007, but the need for clearer guidance held back widespread use of the mechanism. In 2009, the UN Environment Programme released a primer on CDM PoA in an effort to provide clarification and guidance for countries and projects seeking to benefit from its flexibility. The PoA procedure increases the ability for small countries like Haiti to benefit from CDM financing by accommodating activities in several countries under one PoA. New activities also can be added throughout the 28-year time frame that a PoA is valid.
A further benefit of the PoA is that unlike the traditional CDM process in which developers have to prove that projects provide additional emission reductions, renewable energy projects under 5 MW are automatically considered additional. Not having to prove additionality removes a significant bureaucratic and financial burden from low-carbon energy project developers.
Source: See Endnote 61 for this chapter.

138 | Haiti Sustainable Energy Roadmap
International financing could play a role in scaling up renewable energy development in Haiti. A number of mechanisms that can be supported through the disbursement of public funds are available to de-risk investments in renewable energy projects. If well designed, they are capable of leveraging far more in total investments than the cost associated with the mechanism itself. Because project risk continues to be a major barrier for financing renewable energy projects in Haiti, de-risking mechanisms should be analyzed and implemented where deemed appropriate.67 (See Table 7.4.) Specific policies and programs that could benefit from climate finance opportunities, including NAMAs, are examined in Chapter 8.
7.3.3 Using PetroCaribe Funds
Although not necessarily designed for sustainable energy projects, the PetroCaribe Development Fund provides development assistance to Haiti and could potentially be used to leverage sustainable energy finance in the future. Haiti gets its oil from the PetroCaribe Agreement with Venezuela, which allows the country to buy oil at market value while paying as little as 50% upfront, the rest being subject to a 1% interest loan over 25 years.68 (See Table 7.5.) The funds have been the most consequent, unconditional, and readily available source for the Haitian government since the 2010 earthquake; immediately following the earthquake, Venezuela canceled USD 400 million of Haiti’s debt under the PetroCaribe Agreement.69 This agreement, however, largely discounts the cost of oil, making it difficult for renewable energy sources to compete because they do not receive the same favorable financing rates.
In the context of rising oil prices and global supply insecurity, however, the Haitian government has expressed in the last few years its wish to diminish its dependence on imported oil as well as the burden of energy subsidies. Likewise, the uncertainty surrounding the future of the PetroCaribe program leaves Haiti vulnerable to being reliant on potentially more costly imports in the future. Interestingly, Haiti could potentially use the PetroCaribe Agreement to help drive sustainable energy development.
The PetroCaribe Agreement has been very important to Haiti over the past several years. More than 73% of the funds made available in Haiti through the PetroCaribe deal had already been used for reconstruction
Table 7.4 Sample of De-risking Mechanisms for Renewable Energy Projects
Mechanism Type Description Estimated Leverage Ratio
Loan guarantees Debt-based Guarantees a loan payback if the borrower is unable to meet the loan terms.
6–10x
Policy insurance Debt-based Provides a guarantee that support from a policy, such as a feed-in tariff, will be provided even if the policy is not enforced as designed.
10x
Foreign exchange liquidity facility
Debt-based Guards against currency risk associated with revenues and debt in different currencies.
N/A
Pledge fund Equity-based Provides funding to projects that lack sufficient access to equity and that are too small to attract equity investors.
10x
Subordinated equity fund Equity-based Reduces risk to equity investors. 2–5x
Source: See Endnote 67 for this chapter.

Overcoming Barriers to Financing Sustainable Energy in Haiti | 139
and investment purposes by April 2012.70 That same year, the IMF estimated that PetroCaribe funds would account for half of domestically financed capital in the country.71 As of March 2013, a total of USD 1.12 billion in projects had been financed through PetroCaribe.72
Long-term low-interest financing from the PetroCaribe Agreement gives Haiti the opportunity to invest avoided near-term payments domestically. Internal savings from the Agreement have already been used to finance infrastructure projects in the power sector, and have recently been set aside for solar energy projects as well.73 Going forward, internal savings from the PetroCaribe Agreement should be used to finance more sustainable energy infrastructure projects. The financing terms of PetroCaribe provide Haiti with the opportunity to finance sustainable energy development at favorable rates that are currently not available from domestic or international banks. This has taken place in other countries participating in PetroCaribe, as the internal savings from PetroCaribe provide an opportunity to finance domestic renewable energy and energy efficiency projects.
7.3.4 Finding Creative Ways to Provide Sovereign Guarantees
International climate finance could be used to leverage private investment for sustainable energy projects as well. The low creditworthiness of power off-takers is the top risk for investing in renewable energy in the Caribbean.74 In Haiti, this limits the ability of other lending institutions to provide viable loans. Lack of trust in the government utility (EDH) to meet its payment obligations to IPPs also reduces investor confidence and the willingness of banks to lend for renewable energy projects.
According to one solar energy developer seeking to invest in the Caribbean, international lenders require a sovereign guarantee from the national government to ensure that all loan payment obligations will be met if the project off-taker defaults.75 This is difficult to provide, however, considering that the Government of Haiti is already investing in many high-priority sectors and is also sending payments to EDH. International climate funds therefore could be used to provide insurance for private investments in sustainable energy, filling in for the need of a sovereign guarantee.
Table 7.5 PetroCaribe Financing Terms
Oil Price Share Financed Through Loans Interest Rate Financing Period*
USD per barrel percent years
>15 5 2 15
>20 10 2 15
>22 15 2 15
>24 20 2 15
>30 25 2 15
>40 30 1 23
>50 40 1 23
>100 50 1 23
* An additional two-year grace period is included on top of the given financing period for total repayment periods of 17 and 25 years. Source: See Endnote 68 for this chapter.

140 | Haiti Sustainable Energy Roadmap
E-Power’s recently built power plant in Haiti benefits from a government-sponsored sovereign guarantee and demonstrates the effectiveness of this strategy.76 The project was financed largely by the IFC and sells electricity to EDH at USD 0.15–0.17 per kWh, compared to USD 0.22–0.26 per kWh for many of the country’s other facilities. Similar sovereign guarantees for sustainable energy projects would help to make them more financeable in Haiti.
7.3.5 Creating Additional Innovative Financing Mechanisms
The Haitian government has recognized that remittances, or money sent home by expatriates, are an important opportunity to promote social and economic development.77 Remittances—transferred into Haiti through a combination of banks, transfer agencies, and informal mail personnel, or facteurs, who make deliveries to friends and family—play a significant economic role throughout the Caribbean and Latin America, particularly in Haiti.78 Remittances from the more than 1 million Haitian citizens living abroad—mainly in Canada, France, and the United States—have accounted for 25–32% of total GDP since 2007.79 In 2012, Haiti received nearly USD 2 billion in remittances.80 The majority is used to cover basic household living expenses, with an estimated 10–25% of all remittances to Haiti and the Dominican Republic going to purchases of fuel, mainly kerosene or petrol.81
This money can be harnessed specifically for the purpose of financing clean energy, especially when pooled. Approximately 10% of Haitian immigrants who send remittances belong to Hometown Associations, groups of Haitian diaspora members with ties to the same community.82 These groups can channel remittances into specific projects, including sustainable energy. Zafen, an online lending platform modeled partly on Kiva, is a joint project of the IDB, Fonkoze, and a Catholic order. It aims to connect diaspora groups directly to projects on the ground in need of funding. Haiti should work to increase knowledge and awareness in Haitian communities and in Hometown Associations of the benefits of sustainable energy, and to identify local projects in need of funding.
Other models include Arc Finance, established in 2008 with support from the Clinton Bush Haiti Fund, the Basel Agency for Sustainable Development (BASE), and SogeXpress. Arc Finance works with members of the Haitian diaspora to facilitate the purchase of low-cost sustainable energy products for friends and family members in Haiti.83 Going forward, pooled remittances could be used as leverage to help finance larger sustainable energy projects, providing the necessary financial guarantee for investors to convince them to invest in the country. Pooled remittances also could be used to finance community-wide sustainable energy projects, such as a minigrid.
Similarly, remittances could be used to finance solar panel leasing programs. Although most renewable energy sources have a lower levelized cost than fossil fuel sources, they often are not purchased in lower-income communities because of their prohibitively high upfront costs, especially in the case of solar technologies. If customers could avoid the high upfront costs and simply pay the levelized cost of generation, they would be more willing to pay for renewables. Remittances could be pooled together to pay for the initial capital costs of renewable energy technologies, leaving customers responsible only for paying for generation.
Analysis from the IDB has concluded that remitters have a significant interest in controlling how their money is being spent as well as for linking remittances to the energy sector.84 With respect to investing in the energy sector, however, remitters were more likely to favor funding small equipment, such as solar lanterns or phone chargers, than larger systems, such as solar home kits or solar water heaters.

Overcoming Barriers to Financing Sustainable Energy in Haiti | 141
7.4 Implementing Working Rural Electrification Business Models in Haiti
Finding ways to finance rural electrification projects is essential if Haiti is to reach its development goals. Taking advantage of domestic institutions such as the CFI, international sustainable energy finance mechanisms such as the GEF and CDM, as well as donor-backed funding are just a few examples of how Haiti can fund necessary minigrid projects that would promote rural electrification.
Once the financing is found, there are four standard business models for rural minigrids: community owned, state owned, privately owned, and the hybrid private-public partnership model.85 (See Sidebar 7.2.) The first two models (community and state owned) have seen more use in the past but are often reliant initially on public or donor funding. An example of a private-public partnership minigrid that is donor funded (by UNEP) is EarthSpark’s project in the Haitian town of Les Anglais.86
In order to adequately build rural electrification efforts to meet the needs of millions of underserved Haitians, however, investment from the private sector is necessary. The last two models, privately owned minigrids and public-private partnerships, are increasingly important in the rural electrification arena. Although all four models have a role to play depending on the local context, regulatory frameworks and governments should strongly support the private and PPP models in order to encourage more private sector involvement in these critical issues.87 (See Table 7.6.) A number of minigrid models are already being demonstrated in Haiti. In the South Department, UNEP and the National Rural Electric
Sidebar 7.2 Standard Business Models for Rural Minigrids
In general, there are four standard business models for rural minigrids: community owned, state owned, privately owned, and the hybrid private-public partnership model. The community-owned model has been implemented globally in numerous instances, and its success depends greatly on the level of involvement of the community and the pricing structure. Early and continuous participation from the community creates a sense of ownership of the project that can contribute to the project’s sustainability.
State-owned or utility-owned minigrids have seen some development alongside community-owned projects. But utilities often face difficulties in operating at a local level given their centralized management structure and tendency to focus on large, capital-intensive projects such as centralized generation and grid extension.
Privately owned minigrids require projects to be profitable and attractive to investors. The private business model is becoming more appealing as businesses increasingly recognize the untapped potential market of rural electrification, and as projects become more financially viable because of falling technology costs. Although incentive schemes exist to increase the attractiveness of these projects to private operators and investors (see section below on incentives and subsidies), the private model still requires levels of community buy-in and is especially contingent on an agreeable regulatory framework.
Hybrid public-private partnerships (PPPs) may be the most effective model for setting up rural minigrid projects. They also are the hardest to define, since the exact contract terms and ownership structure will depend heavily on the local context where the project is being set up and the entities involved. But, when implemented effectively, PPPs have the potential to create a project using the best attributes and skills from each stakeholder. For instance, a private company or utility could develop and install a minigrid system, and a community organization could operate the system on a daily basis while the private company also provides technical and business expertise and support.
Source: See Endnote 85 for this chapter.

142 | Haiti Sustainable Energy Roadmap
Cooperative Association have worked with communities to establish the Cooperative Electrique de l’Arrondissement des Coteaux (CEAC), a member-owned community cooperative. The Cooperative elected its first management board in February 2014 and will use a solar-diesel hybrid system to supply power to CEAC’s shareholders.88
Regardless of the model used, there are a handful of factors that can contribute to the success of isolated minigrid projects. Some of these factors, such as regulatory frameworks and subsidies, come from the government or regulatory agency of the country in which the project is being implemented. Other factors, such as ensuring adequate demand for cost recovery, fall on the operator’s business model design. Once a business model is chosen for a given project, these success factors should be addressed. (See Chapter 8 for greater detail on this.)
7.5 Conclusion
There are a number of potent investment risks for sustainable energy entrepreneurs in Haiti. Some of them are economy wide, while some are specific to the electricity sector. These significant hurdles are preventing Haiti from experiencing the type of sustainable energy boom that has happened elsewhere in the region and beyond. Still, business models exist that can be employed to successfully implement sustainable energy projects in Haiti. Existing sources of development funding (domestic, international, private, public, energy specific, and climate related) can be used to immediately support such initiatives, given the pressing social and economic need to supply affordable and reliable energy—the foundation of sustained development—as quickly as possible.
In parallel, existing financial instruments should be fine-tuned to the specifics of the energy sector—and new ones should be created. International experience in this area should be used to design, implement,
Table 7.6 Comparison of Minigrid Business Models
Model Advantages Disadvantages
Community Owned Increase ownership, which improves maintenance; can be more efficient than bureaucratic utilities.
Communities may lack technical and business skills, leading to higher costs to bring these in; governance of systems needs to be well managed.
Private Greater efficiency; may have capacity to offer better operation and management services; may be better able to navigate political interference.
Lack upfront financial support in most cases; often difficult to find enough experienced companies, so schemes are often run by smaller companies with less capacity.
Utility (State) Owned Responsibility lies with an experienced organization; often good links to policy so have better access to legal systems; their scale may mean that they have better access to spare parts and maintenance.
Liberalization means that utilities are market driven, and may not prioritize decentralized systems in rural areas; are often inefficient and bankrupt, and often driven by political agendas.
Hybrid (Public-Private Partnership)
Combines advantages of models above. Differences in management structure for different entities involved can increase transaction costs.
Source: See Endnote 87 for this chapter.

Overcoming Barriers to Financing Sustainable Energy in Haiti | 143
and monitor these support mechanisms. Further, capacities, both human and technical, need to be built in both funding and financial institutions. Ultimately, however, all energy markets are policy driven. The government has an important role to play in improving the market framework conditions for sustainable energy investments.

144 | Haiti Sustainable Energy Roadmap
Key Findings
• The barriers to achieving a sustainable energy transition, as identified in Chapters 1–7, can be overcome using an effective policy framework, including a long-term strategy for energy sector development, improved institutional capacity and administrative efficiency, and well-designed and complementary policies.
• Haiti should establish a visionary framework that articulates an explicit commitment to sustainable energy, with ambitious national targets for renewables, energy efficiency, and electrification.
• Incorporating feedback from the public, relevant government offices, the private sector, and civil society can help to ensure that the vision reflects key priorities, existing targets, and overarching development goals.
• A platform to facilitate improved dialogue between local and national public institutions, as well as a framework to guide international organizations, would improve coordination of the energy sector.
• Haiti should consider including sustainable energy in its Coordination Framework for Foreign Development Aid. This will increase its capacity to engage with international organizations working on sustainable energy and better align sustainable energy projects with other development needs.
• Creating key institutions, including an independent regulator and a Bureau of Rural Electrification, would help direct resources and capacity to overcome major challenges. An independent electricity regulator would facilitate transparent, fair, and explicit terms of operation between grid operators and IPPs. Opening the market to other grid operators and increasing EDH’s ability to collect tariffs should be high priorities.
• The government should improve transparency of electricity tariffs and collection processes, communicate clear requirements for renewable project development, and make energy data more available.
• Implementing energy efficiency codes and standards in addition to encouraging energy audits could save energy consumers money and reduce the overall level of suppressed demand in Haiti.
• Haiti could reduce non-technical losses by focusing on community-based generation projects that work with local consumers to create a sense of ownership, and by initiating a targeted public outreach campaign.
• To facilitate the participation and success of IPPs, contracts for power purchase agreements should be standardized to help lower administrative fees. A net metering program should be created. And tax incentives should be implemented to encourage renewable energy technology importation and use.
• To expand electricity access through renewables, priority considerations include pre-pay structures for residential consumption, solar leasing programs, tariff structures for rural microgrids, and efforts to couple energy projects with income-generating economic and community development.
8 | Building an Effective Policy Framework to Harness Sustainable Energy Opportunities in Haiti

Building an Effective Policy Framework to Harness Sustainable Energy Opportunities in Haiti | 145
8.1 Identifying Appropriate and Ambitious Sustainable Energy Priorities
The analyses in Chapters 1–7 demonstrate the resource potential, technical feasibility, and socioeconomic benefits of developing sustainable energy in Haiti. Given the country’s available energy resources, the current condition of its electricity system, and the needs of its population, Worldwatch identifies three key priorities for the sector’s development in the medium-term: • Expand electricity access through a combination of new renewable generation (distributed and grid-
tied) and grid improvement, • Ensure that electricity services are both reliable and affordable, and• Significantly reduce dependence on imported fossil fuels.
Achieving these goals will require building an effective policy framework with three important elements: 1) an effective and ambitious vision for sustainable energy development that includes concrete goals and a cohesive strategic agenda, 2) a governance structure with strong institutional capacity and effective administrative processes, and 3) a mix of targeted support policies and mechanisms designed to improve energy efficiency, encourage investment in renewables, and accelerate their deployment. Based on analysis of Haiti’s existing policy framework and relevant international best practices, this chapter makes concrete recommendations for building a policy framework that achieves each of these important elements.
8.2 Establishing an Effective and Ambitious Vision for Sustainable Energy Development
A vision for sustainable energy development establishes the government’s strategic agenda for the sector, committing all relevant public institutions to a common plan and providing investors with the stability and predictability they require. An effective vision can do this by setting ambitious but feasible goals that reflect national priorities, and by involving relevant institutions and actors to ensure coherence and consistency.
8.2.1 Haiti’s Current Energy Vision
In recent years, the Haitian government has emphasized the extent and dire nature of the country’s energy crisis, and President Martelly made energy development one of five key pillars in his administration’s strategic agenda.1 Key public institutions, including the Ministry of Public Works, Transportation and Communication (MTPTC), the Bureau of Mines and Energy (BME), and Electricité d’Haiti (EDH), have emphasized the importance of developing sustainable energy, shaped the beginnings of a policy framework, and made progress in setting national targets for energy efficiency and renewable energy. In the past decade, these institutions have developed several major documents that identify various energy sector priorities and goals. (See Table 8.1).
The National Energy Sector Development Plan, last updated in December 2011, aimed to establish a vision for the future of the energy sector and a consensus around options for sustainable development.2 It designated renewable energy and rapid expansion of electricity access as major national priorities and included concrete targets for renewable energy penetration and electrification; however, these targets are now outdated and are not reflected in the Plan’s generation scenarios through 2017, which rely almost exclusively on existing large hydro facilities and combined-cycle combustion turbines and do not include significant expansion of non-hydro renewable generation.3 The Plan envisions expanding

146 | Haiti Sustainable Energy Roadmap
Table 8.1 Electricity Sector Plans and Associated Targets
Plan
Year Published
Institution(s)
Vision/Priorities
Electricity/Renewable Sector Goal(s)
Strengths
Limitations
National Energy Sector Develop-ment Plan (Plan national de développe-ment du secteur de l’énergie) (2006–17)
2006; updated December 2011
MTPTC, EDH, and BME
• Build an energy system that is reliable, affordable, environ-mentally sustainable, secure, and equitable • Achieve universal electrification through development of both thermal and renewable genera-tion sources, with an emphasis on using renewable energy for rural electrification • Prioritize wind development in all economically viable locations • Develop biomass, small hydro, and solar
• By 2020: 50% of electricity produced by renewables* • Maintain electricity services for at least 12 hours per day† • By 2013: Increase national electrification rate to 20%†
• Provides good overview of sectoral status, challenges, and priorities • Clearly designates renewable energy (particularly wind) development as a crucial priority • Identifies con-crete target for renewable energy penetration, and broader sector goals in the short (2006–08), medium (2008–13), and long (2013–17) terms
• No long-term plan with clear objectives and deadlines • Short- and medium-term tar-gets now outdated and do not reflect accurate demand projections • Generation sce-narios to 2017 rely on continued fossil fuel dependence, with no plans for non-hydro renew-able development • Focuses on grid-extension rather than the potential for distributed generation
Draft of Haiti’s National Energy Policy (Avant-Projet de Politique Energétique de la République d’Haïti)
Updated January 2012
MTPTC, BME, and EDH
• Explore, preserve, and exploit national energy resources including renewables and fossil fuels • Redefine and support the regulatory and in-stitutional framework to protect investors, consumers, and the environment • Create a regula-tory framework that promotes energy development and environmental sustainability
• By 2020: Increase en-ergy efficiency by 30% • By 2020: 50% renewable energy penetration • By 2020: Raise electrifi-cation rate to 50%
• Acknowledges critical need for official national energy policy and strategy • Sets concrete targets in three key sectors (energy efficiency, renew-ables, and electric-ity access) • Articulates strate-gies to achieve them
• Has not been adopted as official policy
CARICOM Energy Policy
March 2013
CARICOM • Ensure that all CARI-COM members have access to modern, affordable energy services • Improve energy efficiency and acceler-ate the development and use of renewable energy technologies
• By 2017: 20% renewable generation capacity; 18% reduction in power sec-tor CO2 emissions against business-as-usual • By 2022: 28% renewable generation capacity; 32% reduction in power sec-tor CO2 emissions against business-as-usual • By 2027: 47% renewable generation capacity; 46% reduction in power sec-tor CO2 emissions against business-as-usual; 33% reduction in energy intensity
• Identifies energy efficiency and renewable energy as key regional priorities • Sets ambitious sustainable energy targets in the short, medium, and long terms • Provides basis for future interconnec-tion and regional trade, which could bolster renewable development and affordability
• Includes non-binding regional targets, but no commitments by individual member states
* Target included in the updated version of the National Energy Sector Development Plan, published in December 2011. † Target included in the National Energy Sector Development Plan, published in November 2006.

Building an Effective Policy Framework to Harness Sustainable Energy Opportunities in Haiti | 147
electricity access primarily through the traditional method of gradually extending and interconnecting the country’s existing grid systems, with little-to-no focus on the potential for distributed generation or microgrids.4
Haiti has also been working to pass a National Energy Policy. The latest draft, written in 2012, articulates a vision to expand and improve energy services by reforming the country’s regulatory and institutional framework and developing renewables alongside fossil fuels.5 It includes ambitious but feasible targets for 2020 in the three key categories of energy efficiency, renewable penetration, and electrification, which would provide the country with a framework and set of goals for moving forward. Unfortunately, this policy has not been enacted and therefore has no official influence over energy development. The 2012 draft states that the absence of an official energy policy in Haiti creates significant problems, noting that without a document clearly defining the government’s energy priorities and long-term strategy, each sector develops its own plans according to its own goals, limiting their coherence and effectiveness.6
Lastly, the Caribbean Community (CARICOM) finalized and enacted the CARICOM Energy Policy in March 2013 after nearly 10 years of deliberation. As one of CARICOM’s 15 member states, Haiti falls under this document, which aims to ensure that “all CARICOM citizens have access to modern, clean and reliable energy supplies at affordable and stable prices.”7 Among other major objectives related to energy security and intra-Community trade, the policy calls for accelerating the development and use of renewable energy technologies and improving energy efficiency.8 The Energy Policy is also tied to a set of regional sustainable energy targets to be achieved in the short, medium, and long terms. Although these regional targets are not legally binding and include no commitments by individual CARICOM member states, they do indicate a regional determination to accelerate sustainable energy development and place this effort at the core of energy planning. However, Haiti only recently rejoined CARICOM in 2006 after a two-year suspension, and has sometimes struggled to participate fully in regional-level operations.9 No Haitian representative attended the 2013 Council of Trade and Economic Development at which the Energy Policy was formally accepted.
Overall, the lack of consistency between these plans and the continued absence of any official national energy strategy with clear objectives and deadlines for development contribute to significant uncertainty and represent major obstacles to sectoral progress.10 Without a clear government commitment to sustainable energy development, key stakeholders—including potential project financers and developers—find it difficult to make long-term plans.11 The recommendations made below would strengthen Haiti’s vision and increase its influence and effectiveness.
8.2.2 Emphasizing a Clear Intention to Prioritize Sustainable Energy and Distributed Generation
The analyses in Chapters 1–6 illustrate the viability and benefits (socioeconomic and environmental) of transforming Haiti’s energy sector to one based on efficiency and conservation, indigenous renewable resources, and distributed generation. To create the investment climate needed to accelerate energy efficiency improvements and the deployment of renewable energy technologies, the government should articulate a clear intention to transform the energy sector by prioritizing sustainable energy and distributed generation (particularly in rural areas). Haiti’s Delegate Minister to the Prime Minister for Energy Security has argued that the country’s approach to rural electrification should rely on local energy resources and reflect the country’s commitment to renewable energy.12 The National Energy Policy draft notes that renewable technologies should be prioritized in rural electrification.13

148 | Haiti Sustainable Energy Roadmap
These are important assertions, and should be codified and made explicit in all official energy sector planning documents.
8.2.3 Adopting Ambitious, Official Sustainable Energy Targets
Adopting an official set of ambitious national targets for sustainable energy would demonstrate the government’s commitment to these priorities and encourage investment. Priority indicators for development that would make valuable targets over the short, medium, and long term include: 1) total installed capacity, 2) generation shares for specific renewable technologies, 3) grid and appliance efficiency increases, and 4) electrification (with an explicit focus on areas outside of Port-au-Prince and other major urban centers). Setting appropriate national targets will require updating existing data to reflect political, institutional, and technical realities. The methodology behind the targets recommended in the National Energy Plan Draft is not clear, but it should be reviewed to ensure that targets are feasible and incorporate accurate demand projections, which should reflect (to the degree possible) updated information on how the 2010 earthquake altered demand patterns and population centers, the future energy needs and priorities of major economic sectors, and suppressed demand.14
8.2.4 Synthesizing the Vision Across All Relevant Institutions and Sectors
Include feedback from and projected needs of all relevant sectors
Energy is inherently cross-sectoral, with significant implications for all economic sectors. Defining a clear long-term vision will require greatly improved coordination among government ministries. Those responsible for energy planning have historically faced challenges related to poor coordination; representatives of EDH, for example, explain that their ability to prepare for project implementation is severely limited because they do not know what representatives have planned for various other sectors.15
A strategic vision for future energy development must reflect the government’s plans for sectors such as agriculture, manufacturing, and tourism, as these will significantly affect future demand patterns. A government roundtable convening all ministries to identify sectoral priorities and discuss projected energy needs could greatly improve coordination. Alternatively, the government could circulate an official survey asking for input from the various ministries, as has been suggested in the past.16 Ideally, this dialogue would also involve the major aid agencies and international organizations operating within Haiti to ensure coordination and consistency.
Projected sectoral energy needs should then be incorporated into integrated resource planning. An example of the foundation for such an approach already exists. The Government’s Action Plan for National Recovery and Development, published in 2010, recognizes the need to decentralize the population and ensure economic opportunity throughout the country. It identifies specific geographic areas with significant potential for tourism and development, particularly those with large population centers and comparative development advantages.17 Efforts could build on this to begin mapping projected energy demand and infrastructure needs.
Ensure unified messaging
The national priorities and goals laid out in Haiti’s energy vision must be understood, embraced, and articulated consistently by all relevant government institutions. A long-term vision for the energy sector becomes largely ineffective if it is not widely and consistently communicated, particularly to external

Building an Effective Policy Framework to Harness Sustainable Energy Opportunities in Haiti | 149
investors who value predictability. Unified messaging that reinforces Haiti’s commitment to sustainable energy development should come from key actors including the President, the Prime Minister, EDH, the MTPTC, and the Minister Delegate to the Prime Minister for Energy Security. Efforts to unify these important stakeholders around a common vision and coordinate their communication efforts will send a strong signal to crucial investors about the government’s commitment to meeting stated targets, and provide them with some of the security they need to commit to sustainable energy projects.
Participate in regional energy policy design and ensure that national and regional targets align
Where possible, national targets should aim to simultaneously achieve domestic targets and align with regional goals, including CARICOM’s regional sustainable energy targets. This will simplify planning processes and provide stakeholders and potential investors with one coherent vision that can support both national and regional efforts. It is in the interest of both Haiti and CARICOM to ensure that Haiti participates fully in ongoing regional energy policy design and deliberation. Given the size of Haiti’s population, CARICOM will not reach its energy targets without the country’s full engagement and participation.
At the same time, Haiti stands to benefit from increased opportunities for regional collaboration and investment. President Martelly has made a concerted effort to strengthen his country’s involvement in the regional organization.18 As Haiti continues this process of integration, it should strive to participate fully in energy-related discussions, negotiations, and initiatives to ensure that the regional strategy reflects Haiti’s domestic priorities, ambitions, and concerns.
Mainstream energy goals with climate mitigation and adaptation priorities
Given its extreme vulnerability to the impacts of climate change (see Section 1.1), Haiti has much to gain from mainstreaming its energy sector priorities with climate mitigation and adaptation efforts. The government should revisit its official communications to the UNFCCC to establish ambitious climate mitigation goals that reflect the country’s growing sustainable energy goals. It should also work to establish a robust program for monitoring greenhouse gas emissions and tracking the positive climate benefits of sustainable energy development. Such a program would provide key data regarding priority sectors to target for future emissions reductions, and could assist Haiti in accessing international technical assistance and expertise as well as climate funds to finance future clean energy projects, as discussed in Chapter 7.
8.2.5 Finalizing and Officially Adopting a National Energy Policy
The draft National Energy Policy provides a decent overview of government priorities, suggests energy sector targets, and recommends various strategies to achieve them. The recommendations made in Section 8.2 should be incorporated into the policy, which should be officially adopted as soon as possible so that efforts can turn to coordinated implementation.
8.3 Improving Institutional Capacity and Administrative Effectiveness
Overarching national energy plans and targets make up just one part of the framework needed to facilitate a sustainable energy transition, and are not enough to ensure that these goals will be met. Effective governance structures and administrative processes ensure that policymakers, investors,
150 | Haiti Sustainable Energy Roadmap
developers, and consumers operate within a system that facilitates sustainable energy development and mitigates major barriers.
8.3.1 Existing Energy Sector Institutions and Administration in Haiti
In the context of a history characterized by recurring episodes of social, political, and economic instability, the Haitian government has often struggled to fulfill many of the basic responsibilities and services of a sovereign governmental authority. In the energy sector, numerous government agencies with overlapping (and sometimes opposing) mandates and priorities can be involved in various aspects of planning and regulation.
There is not yet any clear or structured system for effective government coordination and dialogue in the sustainable energy sector. The National Development Plan for the Energy Sector cites as a major challenge a lack of coordination between the MTPTC, the Ministry of Economy and Finance, the Ministry of the Environment, EDH, and the Bureau of Mines and Energy.19 Public sector stakeholders report spending a great deal of time struggling to begin constructive dialogue and reach consensus, in part because each player involved in the power sector has its own distinct objectives and vested interests.20 Although this problem is by no means unique to Haiti or its energy sector, it has impeded consensus and policy implementation.21
Coordination between the central and local governments is also limited, hindering the efficiency of energy policy development and project implementation. Certain stakeholders note that local mayors have little power to solicit or approve energy sector projects, limiting the extent to which projects ultimately reflect the needs and priorities of local populations, and potentially contributing to the lack of energy sector investment outside Port-au-Prince.22 This can also discourage potential investors who find it difficult to identify the appropriate official to approach if they want to develop an energy project in a specific city or town.
A history of repeated crises and political turnover—which has prevented certain state institutions from maintaining their staff, institutional memory, and expertise—augments these challenges. Over the past few decades, the number of experts working on energy issues in Haiti has declined significantly, reaching a low just after the 2010 earthquake, when only a handful of people retained responsibility for moving Haiti’s energy sector forward. Public institutions that are responsible for planning and regulating the power sector—including the MTPTC and the Energy Unit—often face a shortage of qualified personnel and have limited capacity to design, implement, and monitor energy and electricity policies. This often prevents Haiti from taking advantage of important international opportunities and forums, or from adequately monitoring developments in the energy sector.
Several offices responsible for developing and overseeing major aspects of energy planning and implementation are commonly staffed by only one or two individuals, limiting their effectiveness.23 Staff turnover presents additional challenges. Several years ago, EDH lost 60% of its staff to Canada when that country made special visa arrangements available to engineers.24 Many other engineers and energy experts leave Haiti to pursue advantageous employment or educational opportunities abroad, depriving the country of its energy expertise and leaving behind institutions with limited capacity.
In Haiti, there is no designated institution—either inside or outside a ministry—dedicated to energy sector regulation, let alone specifically for renewables. Instead, the duties of a regulator are either

Building an Effective Policy Framework to Harness Sustainable Energy Opportunities in Haiti | 151
shared by various institutions, or simply not performed. In January 2013, the World Bank highlighted Haiti’s lack of an energy regulatory framework as a key barrier to advancement.25 Without an overseeing regulatory body, EDH has essentially acted as its own regulator, making most decisions unilaterally about the right to operate on the grid, the terms and conditions of operation, tariff rates, and investment opportunities.
This means that EDH has rarely been held accountable for its quality of service, which—in combination with limited resources—contributes to high technical losses and other significant problems. These failures have had a significant negative effect on perception and trust; in 2007, a Governance and Corruption (GAC) diagnostic developed by the World Bank found that approximately 70% of Haitian households classified the services of EDH as “poor” or “very poor,” marking the government’s inability to deliver basic services as a fundamental weakness.26
Finally, frequent political and economic instability, limited governmental capacity, and repeated international intervention have contributed to giving external institutions and actors a significant degree of influence over developments in Haiti—including in the energy sector. Despite the valuable role that international organizations can play in building capacity and providing financial support, the extent of their involvement in Haiti creates major challenges. It is widely acknowledged that there are too many NGOs and international organizations working in Haiti with too little coordination and oversight; this can result in inefficient duplication of effort and can weaken the Haitian state by acting as a long-term barrier to building state capacity and credibility.27 Although the estimated number of NGOs operating in Haiti varies widely, only a small fraction of them are officially registered with the Haitian Ministry of Planning, making coordination very difficult.28
Because the Haitian institutions involved in energy affairs are relatively weak and uncoordinated, financial support for energy projects is often channeled directly through multilateral development banks or international NGOs, with limited coordination or oversight by the Haitian government. Because the priorities of international organizations do not always align with those of the Haitian government, the government’s ability to influence project development or ensure that efforts reflect an overarching national strategy is limited. Because Haitian energy institutions are often understaffed, they also struggle to keep up with and comply with the protocol and format demanded by international organizations, which can lead to delays and even abandoned projects.29
Improving the strength and effectiveness of institutions required to develop and implement a robust and coherent energy policy framework will be crucial. In Haiti, three major priorities to building effective institutions and administrative processes for sustainable energy development include: 1) mainstreaming sustainable energy among relevant government actors, 2) building a strong institutional structure that includes certain key energy institutions with sufficient capacity, and 3) developing clear and transparent processes that facilitate communication, investment, and effective policy formulation.
8.3.2 Mainstreaming Sustainable Energy and Enhancing Coordination Among Government Actors
Establishing a clear and structured system for coordinating sustainable energy dialogue and development across these various agencies and between the central and local governments in Haiti would mitigate many of the challenges that currently lead to incomplete, redundant, or competing government efforts. Steps that can be taken to this end include:

152 | Haiti Sustainable Energy Roadmap
Establish a platform for energy dialogue between local and national government institutions
Establishing platforms for structured multi-stakeholder dialogue among key decision makers in the energy sector could help address these problems. The National Energy Policy draft of 2012 suggests forming a commission made up of representatives from the MTPTC; the Ministry of Agriculture, Natural Resources, and Rural Development; the Ministry of the Environment; the Ministry of Justice and Public Security; the Haitian Chamber of Commerce and Industry; the University of Haiti; and the Association of Haitian Media.30 Such a group would be beneficial and should be established as soon as possible.
Similar platforms in the Caribbean have proven successful. The Jamaica Energy Council, a bipartisan multi-stakeholder platform, was established in 2012 to assemble diverse government and nongovernmental actors, reduce energy costs, and increase competition in the energy sector.31 This Council has already succeeded in getting energy efficiency tax exemptions approved and in streamlining procedures for key energy programs.32 A similar Roundtable approach has been suggested in Haiti, but it has so far failed to gain the necessary buy-in from other institutional actors.33 A similar effort led by the President or Prime Minister could potentially carry more weight.
An organized energy council at the national level also could be used to increase communication and coordination between local governments and national agencies. The council could provide local governments with a platform through which they could express their energy needs and communicate directly with representatives of the Energy Council. Additionally, the council could sponsor official liaisons that would be in direct contact with specific towns and regions in Haiti.
Adopt a framework to coordinate actions and investment by international organizations
In November 2012, the Haitian government attempted to structure international aid around a single, cohesive development agenda by establishing the Coordination Framework for Foreign Development Aid (CAED).34 The framework is based on several key principles, including: 1) the Haitian government should take leadership and responsibility for national development policy, 2) technical and financial partners should operate in accordance with Haiti’s strategic development goals, and 3) institutional capacity should be strengthened to manage development efforts. This approach resembles examples such as Sierra Leone’s Aid Policy, which identifies national priorities, sets guidelines for mobilization and implementation of overseas development aid, and clarifies roles and relationships between the government and its partners.35 The framework represents an important statement of intent as well as a signal that Haiti wants to play a greater role in shaping external cooperation and aid. Sustainable energy development should reflect and respect these principles.
8.3.3 Strengthening the Institutional Structure, Including by Adding Key Institutions
Create an electricity regulator with sufficient capacity and a clear mandate
An independent regulator should monitor and guarantee the quality of electricity services as well as oversee and regulate the growing number of independent power producers (IPPs) in Haiti. Since EDH will be transitioning away from its historical role of being a generator, transmitter, as well as distributor of electricity, it is well positioned to become an electricity regulator for the country. EDH already has the institutional and human capacity to work on electricity issues, and it therefore makes sense for the institution to play a role in regulatory issues.

Building an Effective Policy Framework to Harness Sustainable Energy Opportunities in Haiti | 153
Given the urgent need to expand electricity services throughout Haiti—especially in areas without access to national grids—facilitating the continued participation of IPPs must be a crucial piece of Haiti’s sustainable energy strategy. At the same time, it is important that these producers be regulated, and that the Haitian government have increased oversight and knowledge of their activities. L’Hôpital Mirebalais is currently in discussions with EDH over the rules that should govern its ability to feed excess solar power generation back into the grid. This kind of arrangement presents enormous opportunities for Haiti, and there is a growing sense among some utility representatives that it represents a potential solution to Haiti’s energy crisis, but the rules need to be clearly established.36 As opportunities increase for more IPPs to do this, and the pilot project to create regional concession areas for private operators is implemented, the need for clear rules and regulations will grow, and EDH appears well positioned to take on this role.
Create a rural electrification agency
Given the urgent need to expand electricity access outside of Port-au-Price, Haiti should establish a bureau devoted specifically to rural electrification. Creating such an institution is crucial because so much funding and attention is typically devoted to solving energy issues in the capital, and identifying optimal solutions in other areas will require a specialized approach that takes into account the needs and capacities of particular communities.
The 2011 National Energy Sector Development Plan called for creating a Bureau of Rural Electrification, charged with defining and implementing a program focused specifically on renewable energy, financial mechanisms adapted for rural Haiti, and accessibility to low-income Haitians.37 Implementing this group would mark a significant step forward. Key responsibilities for this office could also include working with other federal and local agencies to design a regulatory framework for decentralized power production. Given the wide range of potential rural electrification supply models, the office should take a flexible approach to determining the best solutions for particular regions. It should also take a flexible approach to setting tariffs. For example, a community-owned and managed grid has different interests and needs when setting the tariffs than does a grid that is managed by a private firm.
Additionally, it will be important for Haiti to take into consideration the regulation of rural grids, as a lack of regulations has historically hurt the quality of services in the past. One option is for the Bureau of Rural Electrification to monitor service quality in specific areas, ensuring that consumers remain satisfied and willing to pay. The advantage of this option is that the Bureau would have expertise in rural electricity issues. Another option is for EDH to regulate rural grids. The advantage of this option is that if EDH becomes the national regulator, it will keep regulation of the electricity sector under one roof. No matter what, it is important that rural electrification projects are regulated in an organized manner.
Build capacity in public institutions
Increasing capacity in energy sector public institutions is a critical need, and could be improved through a more targeted focus on energy education and capacity building. Efforts to maintain continuity and retain institutional knowledge despite political transitions have marked a positive trend. When President Martelly took office in 2011, for example, he replaced only the top officials at EDH and left the majority of existing staff members in place, allowing the organization to maintain the bulk of its structure and institutional expertise.38 Energy development projects should focus on providing the resources and expertise to build capacity in these institutions, allowing progress to continue after the funding cycle for a specific project has ended.

154 | Haiti Sustainable Energy Roadmap
Education programs targeting engineers and agronomists would be particularly beneficial, as these professions address many of the sector’s underlying challenges. A program to teach engineers how to build and install solar panels, for example, would help ensure that solar projects can be repaired and maintained in-country. The government should also focus on embedding sustainable energy technology and policy in curricula at the university level. Worldwatch has collaborated with the Haitian government to develop such a curriculum for the country’s public university system. Similar initiatives should continue in the future.
8.3.4 Creating Clear, Transparent Processes That Facilitate Communication, Investment, and Smart Policy
Improve data collection and make crucial energy information publicly available
Transparency plays a critical role in ensuring that policies are implemented effectively and fairly; without it, even the most well-intentioned policies can quickly become counterproductive. In Haiti, the processes behind bill collection and tariff-setting are sometimes perceived as arbitrary and inconsistent because they are not well understood; some Haitians even talk of “billing guesswork.”39 EDH could improve the transparency of its tariff-setting and collection processes by making information about costs and payments more accessible, and by widely disseminating the breakdown of its tariff prices. Haiti does not currently participate in or benefit from the Caribbean Energy Information System (CEIS), designed to serve as a regional energy information platform to support planning and policymaking.40 A regional effort to make these data free and openly available would greatly improve the ability of Haiti and international partners to analyze the country’s electricity system and implement effective policies.
Codify and communicate requirements for renewable energy development
Bureaucratic and permitting delays for infrastructure projects also deter banks and institutions from lending to renewable energy developers. An abundance of and confusion over the number of steps required to construct a renewable energy project leads to high transaction costs. Haiti created the Centre de Facilitation d’Investissement (CFI) in 2007 to combat this problem and to streamline the investment process by simplifying cumbersome bureaucratic procedures and providing a range of economic and commercial information to potential investors. In September 2009, the CFI launched an online registry allowing investors to verify the existence of a Haitian business. Ultimately, the Center aims to allow online registration and to serve as a centralized, efficient platform for all business registration requirements.41
Although certain members of the private sector have complained that the CFI lacks the capacity and power required to attract or encourage investment, it has significant potential and could provide material to potential investors including preliminary market research and feasibility studies.42 By providing information on resource availability and an updated list of existing energy projects and investments in Haiti, the Center could be used to facilitate sustainable energy development in particular. Currently, there is no designated organization or person that potential energy investors can contact to be walked through the energy investment process in Haiti. The CFI could fill this void and train one of its employees to become a specialist on energy issues. This would include training on current energy policies, the steps a company needs to take to develop an energy project in Haiti, as well as renewable energy potential throughout the country. In other words, the CFI could provide a one-stop shop for investors interested in sustainable energy.

Building an Effective Policy Framework to Harness Sustainable Energy Opportunities in Haiti | 155
Encourage public participation and education in sustainable energy matters
Engaging in stakeholder education and outreach to increase the public’s understanding of electricity issues and programs can improve consumer behavior and the government’s ability to govern effectively. When it comes to a technical subject like electricity, policymakers may be reluctant to open the discussion to non-experts. A review of environmental decision making in the United States, however, reveals that in a significant number of cases, decisions were substantively improved through public participation.43 Successful social and environmental outcomes are more likely if policies and regulations in the power sector are open to public debate and scrutiny. Public participation and insight into crucial and often contentious subjects like electricity theft can improve both policymaking and the public’s willingness to comply with regulations.
8.4 Implementing Effective, Targeted Support Policies and Mechanisms
Targeted support policies and mechanisms can facilitate the development and deployment of suitable sustainable energy technologies and help achieve overarching goals. Public policies—including those targeted at research, development, demonstration, and deployment—play a crucial role in mitigating both technical and non-technical barriers. Effective policies share three general characteristics:
1. Policies must be implemented as part of an appropriate policy mix. Although certain policies have proven effective in rapidly increasing renewable energy deployment in certain contexts, policy design is not one-size-fits-all. Policymakers must identify a combination of policy measures that most effectively address existing circumstances, including technological maturity, affordable capital, ease of integration into the existing system, and the available local and national renewable energy resource base.
2. Policies must be sustained. In order to provide energy investors and developers with the stability and reassurance they need to commit to sustainable energy projects, policies must be sustained over an appropriate period of time. Without the assurance that the policy landscape will remain fairly stable, would-be investors will view commitment as too risky. This is particularly crucial in Haiti, where political stability has long been one of the country’s biggest underlying challenges.
3. Policies must be flexible. Given the dynamism of renewable energy markets and technology developments, policies must be flexible enough to evolve in changing conditions.
8.4.1 Current Status of Sustainable Energy Policies and Mechanisms in Haiti
A history of political instability and violence, along with limited institutional capacity and public financing, has made the implementation of concrete policies and measures to incentivize and regulate sustainable energy development an enormous challenge in Haiti. The country currently has no policies or support mechanisms specifically in place to encourage sustainable energy development. For each main component of a sustainable energy system (energy efficiency, renewable energy, and the transmission and distribution system), this chapter provides a policy toolbox containing measures that Haiti could implement to overcome major barriers to investment and deployment.

156 | Haiti Sustainable Energy Roadmap
8.4.2 Designing a Policy Mix to Improve Energy Efficiency
As discussed in Chapter 2, improving energy efficiency represents one of the cheapest and fastest ways to reduce the economic and environmental costs associated with a given generation system. Given Haiti’s limited generation capacity, it also represents one of the best opportunities to rapidly allow for increased consumption. Finally, promoting energy efficiency is one of the most effective ways to educate the public about energy issues and the impacts of their energy consumption, thereby encouraging wider behavioral changes and energy savings. Worldwatch recommends the following options to increase energy efficiency:
Encourage energy efficiency and conservation
Implement codes and standards that target low-cost efficiency and conservation solutions. As discussed in Chapter 2, Haiti’s residential sector accounts for 32% of final electricity consumption, which suggests that developing building codes promoting efficient cooling measures could result in significant energy savings. In Haiti, efficiency standards should focus on technologies that are cheap and easy to deploy, particularly passive cooling methods. Cool roofs can be installed at extremely low cost by simply painting roofs white. Mandating or incentivizing cool roofs would make spaces more comfortable, lower current cooling costs for those individuals, businesses, or public buildings with air conditioning units, and reduce future energy expenditures as more Haitian households adopt them.
In the United States, cool roof standards have already been implemented on a local level. The state of California has made installation of cool roofs mandatory on most new buildings and in cases where roofs are altered or buildings extended.44 New York City’s building code requires all new buildings with flat or low-sloping roofs to be white or to comply with Energy Star requirements.45 Even several years after the 2010 earthquake, post-earthquake reconstruction efforts in Haiti offer significant opportunities to better integrate energy efficiency considerations into new construction and to retrofit damaged structures.
Implement tax incentives to encourage major consumers to perform energy audits. Energy audits identify the simplest and most effective ways to reduce energy consumption and costs in a given building or business, and several Caribbean countries have implemented fiscal incentives to promote their use. In Trinidad and Tobago, Finance Act No. 13 provides a 150% tax allowance for companies that carry out energy audits and install energy-saving equipment. The same law also guarantees 75% accelerated depreciation on all machinery needed to conduct energy audits for those companies that perform them.46 In Haiti, such measures could have a particularly large impact in the tourism sector, where hotels require significant power for air conditioning and could potentially save a great deal of money by reducing their consumption. (See Section 2.7.3.)
Implement tax incentives to promote the importation and use of energy-efficient appliances. Haiti’s current draft of the National Energy Policy recommends implementing fiscal incentives to promote the importation and use of energy-efficient appliances.47 Lighting and refrigerators are two high-impact appliances that should be targeted for fiscal incentives.
Reduce non-technical losses
Significant non-technical losses, due largely to a combination of electricity theft and an inefficient system of tariff collection, represent one of the largest challenges facing EDH.48 The prolonged crisis has created an ongoing negative cycle of revenue loss and deteriorating service.49

Building an Effective Policy Framework to Harness Sustainable Energy Opportunities in Haiti | 157
Prioritize distributed generation projects that give communities a sense of ownership. Arguably, one of the most effective ways to reduce electricity theft is to work with local communities to develop energy projects that create a sense of ownership and responsibility among consumers. According to Haiti’s Prime Minister Delegate for Energy Security, rates of electricity theft rise when government institutions or NGOs fail to involve local communities in the design, installation, and maintenance of projects.50 An increased focus on distributed generation models—including microgrids—could facilitate increased community involvement.
Conduct widespread public outreach. Because electricity theft and fraud stem in part from a culture of non-payment and a misunderstanding of risks to personal security, grid reliability, and long-term costs, a large-scale public awareness campaign could contribute to reducing theft in Haiti by changing public perception. South Africa’s Operation Khanyisa serves as one international model. This campaign mobilized citizens to consume power legally by using exhibitions, advertisements, and targeted messages to raise awareness and portray legal electricity use as a patriotic act.51 In addition to slogans such as “keep our country powerful” and “unity is power,” the campaign provided information sheets and energy-saving tips. During the first three years of Operation Khanyisa, South Africa’s state utility (Eskom) recovered approximately USD 24 million in revenue.52
8.4.3 Designing a Policy Mix to Accelerate Renewable Energy Deployment
Open up market access to IPPs
Clarify legislation to allow IPPs to distribute electricity in areas not covered by EDH. Because EDH lacks the capacity to provide electricity services throughout Haiti, electrification efforts and minigrid development will need to involve independent producers. EDH’s legal monopoly over distribution has arguably limited investment.53 Explicitly enabling IPPs to distribute electricity in parts of the country where EDH cannot provide power would significantly accelerate renewable energy deployment. Arrangements allowing IPPs to produce power on EDH’s behalf have so far been negotiated bilaterally and in apparent conflict with the 1973 law granting EDH exclusive control over production, transmission, and distribution, creating a great deal of uncertainty and inconsistency for developers.
In June 2014, the government launched an open call for local or international companies to assume EDH’s role in the Southeast Department. The successful bidder will be awarded a concession to generate, transmit, distribute, and sell electricity within that area, and will be obligated to improve infrastructure and add sufficient capacity to provide electricity to all inhabitants. Ultimately, this model could be expanded throughout Haiti, with the exception of the metropolitan area.54 This pilot project marks an important step forward and an exciting shift in the structure and operation of Haiti’s electricity sector.
Standardize the power purchase agreement (PPA) process. As discussed in Section 8.2.5, well-structured PPAs give private investors enough confidence to invest in an energy project. PPAs must be binding, prevent unilateral changes, and protect both EDH and the producer. Standardizing PPA processes is a crucial step, particularly in supporting minigrid rural electrification efforts, as it will reduce administrative costs, increase efficiency, and attract private investors through increased market transparency.55 Standardizing the PPA process would encourage investment in both minigrids and the national grid. Potential investors currently have little-to-no knowledge of whom they should contact to begin the process of obtaining a PPA. This uncertainty discourages them from investing in the country.

158 | Haiti Sustainable Energy Roadmap
Implement competitive bidding (based on the per kWh cost for providing service). A tendering system could help facilitate renewable capacity additions. While tenders are effective at promoting competition between generation projects, one shortcoming is the potential for underbidding and a subsequent inability to deliver on the accepted contracts. Haiti could set minimum tariff rates as a precaution against this. Tenders must be issued on a frequent and regular basis to achieve continuous growth of renewables, so although the advantages of tenders for Haiti include their simplicity and relatively low administrative costs, these may be negated if the bidding and selection process must be repeated on an annual or biennial basis.
Develop a net metering program for major energy consumers. Net metering allows consumers who own renewable energy systems to contribute their power to the grid and to receive a credit for their own production, thereby reducing their own electricity bills and providing increased power to the utility. In Haiti, many companies and international organizations choose or are forced to rely on privately owned generators as a result of the unreliable and limited grid system. This not only contributes to increased consumption of costly and environmentally destructive diesel fuels, but also adds to EDH’s financial challenges.
Implementing a net metering program for large-scale electricity consumers such as hospitals and hotels would promote the use of renewable energy technologies and encourage these major consumers—where possible—to connect to the grid. Discussion of net metering continues at l’Hôpital Mirebalais, which currently uses rooftop solar PV to power its own operations and feed excess power into the local grid. The hospital and EDH are discussing the possibility of instituting a net metering program to credit the facility’s excess generation and to promote similar arrangements elsewhere in Haiti. Such a step would provide significant incentive for self-producers while simultaneously generating much-needed additional power.
Lower or eliminate import tariffs on renewable energy technology and components. Taxes and import duties on energy efficient and renewable energy technology imports can discourage investment by increasing technology costs. Because high capital costs already represent one of the largest barriers to renewable energy development, this additional cost can make otherwise viable projects unprofitable. The Dominican Republic implemented several tax incentives that have successfully spurred renewable energy development in the country, and these could be used as models for Haiti. They include: 1) a 100% tax exemption on the import of equipment and machinery necessary for the production of renewable energy, as well as on transformation equipment, transmission, and interconnection of electricity to the grid, and 2) a 100% exemption on the Tax on the Transfer of Industrialized Goods and Services for projects based on renewable energy, a value-added tax applicable to the transfer and importation of most goods, and to most services.56
Implement targeted tax credits for renewable energy power plants. These tax incentives would fall under two main categories: investment tax credits (ITCs) and production tax credits (PTCs). ITCs are tax reductions for energy developers based on investments in capital equipment and installation. They can reduce the burden of high upfront capital costs for renewable energy plants by quickly crediting back some of the initial investment to investors. PTCs are based on actual electricity generated. Proponents of PTCs favor the generation-based approach because it encourages companies to operate renewable energy facilities to their fullest potential, in contrast to ITC policies that can allow companies to install renewable energy capacity and benefit from the tax reduction without operating the systems.

Building an Effective Policy Framework to Harness Sustainable Energy Opportunities in Haiti | 159
The power of tax incentives has already been demonstrated in Haiti. E-Power’s ability to negotiate an exemption from income tax was a large driver for its ability to build its recent power plant in Haiti.57 In neighboring Dominican Republic, exemption from income tax was an important feature of financing Los Cocos, the country’s first wind farm. Similar tax code modifications could be made to encourage renewable investment in Haiti. On the household level, the national Energy Policy Draft recommends implementing tax incentives for solar water heaters and PV systems; this should be followed through.58
Expand electricity access via renewables
Provide targeted subsidies for private sector involvement in rural electrification. Electrifying remote areas presents a number of challenges to potential private sector investors: for example, relatively low demand makes appropriate sales volumes difficult to achieve; target populations often have limited purchasing power; and billing and payment collection are often difficult.59 In spite of these challenges, however, studies have indicated that low-income, rural populations often have the ability and willingness to pay for electricity access.60 Past experience and numerous studies have shown that subsidies for minigrid development should not be applied to operating costs.61 In order to promote sustainable, long-term minigrid projects, the operating costs should be wholly covered by energy sales and appropriate tariff setting.
Subsidizing investment or capital costs, however, can help attract private financing, establish projects, and scale minigrid rural electrification efforts to reach larger rural populations. Incentive schemes should also include a built-in exit strategy and a focus on transparency. Designing a gradual withdrawal of the subsidy ensures that projects do not become dependent on the subsidy or incentive scheme once the industry develops. Being transparent about the exit strategy allows minigrid developers to design their businesses and projects with the subsidy phaseout in mind. Typical subsidy schemes include one-time capital subsidies, output-based contracting, lifeline rates, and cross-subsidization. (See Sidebar 8.1.)
Pre-pay structures for residential consumption. EDH is already considering the use of pre-paid electricity cards similar to those used in the mobile phone industry.62 Mobile phone access rates are significantly higher than electricity access rates in Haiti. The pre-pay model is a proven model in Haiti and could help to protect distributors from electricity theft.
Solar leasing programs to lower upfront costs. Although most renewable energy sources have a lower levelized cost than fossil fuel sources, they often are not purchased in lower-income communities because of their prohibitively high upfront costs, especially in the case of solar technologies. If customers could avoid the high upfront costs and simply pay the levelized cost of generation, they would be more willing to pay for renewables.
Set appropriate tariffs for rural microgrids. Allowing minigrids to set appropriate commercial tariffs for an acceptable rate of return is critical for creating sustainable rural minigrid projects, as well as attracting private investment into the rural electrification market. While tariffs should generate enough profit to attract private investors, they should also balance profitability and project sustainability with customers’ willingness and ability to pay.63 In Haiti, residential rates applied by EDH average USD 0.16/kWh, while commercial rates average USD 0.35/kWh. It is not unlikely that a minigrid would be able to serve customers at lower rates and still profit. Therefore, in areas underserved by the national grid,

160 | Haiti Sustainable Energy Roadmap
allowing the market—not the national utility—to set rates would support private investment and rapid rural electrification.
Practice “integrated rural development” by coupling rural electrification and minigrid development with income-generating activities. Strategies to expand electrification should focus on developing electricity services in tandem with other development priorities, such as infrastructure. This approach—otherwise known as integrated rural development—rests on the idea that electrification is a necessary, but insufficient, condition for poverty alleviation. Although energy access alone does not provide significant economic benefits, communities have seen considerable economic progress when energy access is coupled with infrastructural support for small businesses.64 (See Case Study 7.)
Promoting income-generating activities alongside minigrid development increases the load factor (making minigrids more cost effective) and directly supports economic development within specific communities. Public works projects, such as construction of roads, schools, and health facilities, encourage economic development that, in turn, drives demand for electricity. Increased demand by small and medium-sized businesses can be instrumental in enabling a minigrid to recover costs and remain profitable, driving further economic development.
Infrastructural support can also be embedded directly into minigrid designs. In Kenya, the successful
Sidebar 8.1 Subsidy Schemes for Electrification Programs
One-time capital subsidies target the upfront cost of the minigrid. When paired with well-designed tariff structures that cover the operation and maintenance, capital cost subsidies can make minigrid projects not only commercially viable, but very attractive to private investors.
Output-based contracting exchanges a subsidy in return for a service performed, aiming to encourage certain actions on part of the rural electrification entity. The subsidy can be based on the number of connections or energy production. In the case of a production-based subsidy, the subsidy can be designed to decrease over time as revenues from energy sales increase and the rural electrification entity increases its own efficiency.
Lifeline tariffs provide subsidized energy tariffs for the poorest customers. Typically, these poorer customers consume very little energy. Therefore, charging lower tariffs for customers consuming less than, say, 25 kWh per month can help provide affordable energy to low-consumption, low-income customers.
Cross-subsidization can also be effective in providing subsidies for affordability by using revenue from wealthier customers to subsidize energy tariffs for low-income customers and/or by using revenue from urban customers to subsidize rural electrification programs.
Time-limited area concessions are another incentive that the government can supply to motivate rural minigrid development. The government gives a business exclusive right to supply energy to a community for a limited time. If the firm is successful within the allotted time and area, the government will allow the firm to continue operations. In this way, the government incentivizes efficient and sustainable operations of the minigrid operators.
Other incentive schemes exist beyond the direct subsidies outlined above. Some developing countries have effectively used investment and production tax credits to incentivize private project developers and investors. Accelerated depreciation and reducing import duties on minigrid equipment are other tax incentives that can contribute to attracting private investment in rural minigrids.

Building an Effective Policy Framework to Harness Sustainable Energy Opportunities in Haiti | 161
Mpeketoni minigrid includes a grain mill that acts as an anchor client, simultaneously providing the minigrid operators with a stable revenue stream, and the community with a productive service.65 In Haiti, mobile phone towers in remote communities have already powered the development of small economies; some Haitians have used the towers to plug in refrigerators or to study at night, demonstrating the potential of this kind of approach.66 Industries that create waste for energy or excess electricity should be targeted for priority development alongside rural electrification programs. Although mobile phone towers and sugar mills are obvious choices, other agricultural industries such as sweet sorghum, jatropha, and rice could provide valuable jobs, food, and excess energy.
Case Study 7 Best Practices for Rural Electrification Initiatives and Their Applicability in Haiti
President Martelly has placed renewed and much-needed focus on rural electrification, particularly through his ambitious “Ban m limyè Ban m lavi” (‘Give me light, Give me life’) program—part of a USD 20 million energy package designed to expand electricity access in the Grand-Anse and the Northwest Province, two of Haiti’s most remote regions. It includes a promising focus on renewable energy, calling on Haitian banks to issue USD 30 million in loans to help families purchase solar home kits (some for as low as USD 100), or single lanterns (USD 5). The program also includes USD 15 million in government loans to install street lamps. By early 2013, the program was operating at a much slower pace than originally planned, with many projects proving more expensive than originally anticipated. Costs have been falling and the program has been testing high-efficiency LED lamps, which allow the program to do more than expected.
Many developing countries have struggled to establish and maintain effective rural electrification programs. In many instances, rural electrification subsidies have “drained the resources of many of the state power companies, with highly damaging effects on their overall performance and quality of service.” Given the already precarious situation of its electricity sector, Haiti cannot afford to risk spending massive amounts of public money on excessively ambitious or poorly effective programs. The case studies presented in Appendix IX examine several successful rural electrification programs in other countries and identify best practices relevant to Haiti.
Cape Verde’s concessions system shows that rural electrification is possible even in a fragmented territory. Bangladesh’s Palli Bidyut Samities system demonstrates that a rigorous organization is far from incompatible with active participation of local communities. Costa Rica’s cooperative success story is perhaps the most encouraging one, combining democracy, public service spirit, and financial stability. All three cases also seem to demonstrate that rural electrification provides a fertile ground for productive public-private partnerships: companies are attracted by the untapped potential in rural areas, but they need help from authorities to cover upfront costs and connect with communities, while careful regulation ensures that providers do not engage in harmful monopolistic practices. The history of Costa Rica suggests that even when public and private sectors end up “competing for ‘bragging rights’ as to who can provide the best service,” rural customers are the ultimate beneficiaries.
Most successful rural electrification initiatives in the developing world—and in particular the three programs examined here—have been initiated with support from international grants, not loans from national banks (at least not exclusively). Receiving from an outside source gives a push for being financially sustainable, and the validation of a viable rural electrification project often leads to lower interest rates, which helps limit debt. The practices of some international donors, such as the IMF or World Bank, have been criticized in the past, but in general it could be argued that submitting a project to a form of international review—rather than fluctuating political goals and promises—can be an effective way of ensuring that an ambitious program does not turn into a draining, ineffective fiscal nightmare for the state.
Source: See Endnote 64 for this chapter.

162 | Haiti Sustainable Energy Roadmap
8.5 Conclusion
The Haitian government is tasked with further improving market conditions for sustainable energy investment as rapidly as possible. Significant risks still exist in this area, but so do significant opportunities. This Roadmap provides the government with the technical assessments and socioeconomic analysis necessary to determine an energy development pathway that is in the best economic, social, and environmental interest of it citizenry. Given that energy markets are policy driven, the Haitian government should continue its efforts to create a market framework that allows for investments at the scale most beneficial to the Haitian people.
A long-term vision for the energy sector is needed. It must include concrete short-, medium-, and long-term targets for rural electrification, energy capacity, generation, consumption, and greenhouse gas emission limits. This will be an important first step to creating confidence among stakeholders, and throughout society, for a continued transition of the energy sector. Concrete, effective, and cost-efficient policies and measures within the overarching framework will then be the key drivers of innovation and investment. This chapter described the available toolbox; the next step will be to choose, design, and integrate an appropriate and complementary mix that ensures that actions are transparent, and that accounts for measuring, reporting, and verifying stated goals.
Transitioning to an economically, socially, and environmentally sustainable energy system is a society-wide and cross-sectoral effort. It requires “all hands on deck” at the many planning, implementation, and evaluation stages. In order to achieve this, policymaking and implementation should include the offices of the President and Prime Minister, and should be mainstreamed among all relevant ministries. Key nongovernmental stakeholders and civil society representatives should be engaged in an open dialogue about the country’s envisioned energy development path and the measures that pave the way, including the future role of EDH in the energy sector, establishing an independent regulator, and establishing a Bureau for Rural Electrification.

Haiti’s Energy Outlook: Building a Sustainable Energy System | 163
As demonstrated throughout this Roadmap, Haiti has tremendous potential for building an efficient, affordable electricity system powered by renewable resources. To realize the social, economic, and environmental benefits of sustainable energy, Haiti can undertake several key actions that will help to build a stable investment environment for energy efficiency and renewable energy projects.
Throughout this Roadmap, Worldwatch has identified key research gaps, capacity building needs, and areas for policy reform that can be addressed in the coming years. Some of these challenges can be tackled in the near term, while others require a long-term approach. Many essential steps can be taken immediately.
Table 9.1 summarizes the suggestions from the individual chapters of this Roadmap. Important data gaps still exist regarding the different components of a sustainable energy system, which require further technical assessments. In addition, the socioeconomic analysis provided here can be further strengthened, reforms in the financial sector will improve the investment climate, and all of the above should be considered when designing a strong policy framework. Haiti’s government, private sector, and civil society have acknowledged the important role of energy efficiency and conservation, as well as renewable energy, in reducing energy costs, making electricity accessible to all Haitians, bolstering the national economy, and contributing to a healthier environment.
Any analysis of Haiti’s energy system, including this Roadmap, must be made available publicly and should be communicated both actively and broadly in order to have measurable impact. The country is now at a crucial point where in order to achieve the full benefits of a sustainable energy system, it must implement targeted measures and reforms, work with local practitioners and international groups, and build capacity within both government and the Haitian public. Determined individuals and organizations —domestic and international—should not be deterred by the work that remains to be done. Rather, they should get involved immediately. Visionary pioneers have broken ground with major transformation worldwide, in the Caribbean and in Haiti specifically. The stage has been set for dedicated professionals to move from plans to action!
9 | Haiti’s Energy Outlook: Building a Sustainable Energy System

164 | Haiti Sustainable Energy Roadmap
Table 9.1 Next Steps for Haiti’s Sustainable Energy Transition
Short Term Long Term
Conduct Additional Technical Assessments
Assess energy and cost savings potential for energy efficiency measures in commercial and public services sector
●
Conduct energy audits of identified target areas: agribusiness, textile, and hotel industries ●
Conduct feasibility assessments for utility-scale solar PV farms ●
Conduct thorough resource, environmental, and social impact assessments of biomass options such as sugar cane, coffee, and rice
●
Conduct grid connection feasibility and cost assessments for solar, wind, and small hydro sites ●
Conduct site feasibility assessments for pumped hydro storage ●
Assess the feasibility of interconnection with the Dominican Republic ●
Conduct needed hydropower resource assessments ●
Identify opportunities to retrofit existing conventional generation ●
Strengthen Socioeconomic Analysis
Collect more power plant-specific data (capital and O&M costs, heat rates, efficiencies, capacity factors) ●
Study ways to transition to renewable energy (and away from charcoal) while creating increased opportunities for employment
●
Gather more Haiti-specific data on environmental and health impacts of power plants (e.g., local pollutants, greenhouse gas emissions, water use)
●
Survey and communicate socioeconomic co-benefits of distributed generation ●
Develop community-specific economic models for least-cost generation options ●
Strengthen Financial Institutions and Mechanisms
Expand education campaigns for Haitian banks to improve risk perception for sustainable energy investment
● ●
Prioritize finance for refurbishment projects ●
Bundle sustainable energy projects with each other, or with larger development projects ●
Encourage development and strengthening of microloan programs focused on sustainable energy ●
Use existing climate finance opportunities to provide investment guarantees ●
Establish national strategy for accessing climate finance, including through the GEF, Clean Develop-ment Mechanism, and Nationally Appropriate Mitigation Actions
●
Use bundled remittances to finance renewable energy projects ●
Use portion of internal savings from PetroCaribe Agreement to fund low-interest sustainable energy projects
●
Work with practitioners and communities to identify and replicate successful, scaleable business models for rural electrification
●
Implement a Strong Policy Framework
Articulate a clear and unified government intent to prioritize sustainable energy and distributed generation
●
Officially adopt ambitious sustainable energy targets based on research ●

Haiti’s Energy Outlook: Building a Sustainable Energy System | 165
Table 9.1 continued
Short Term Long Term
Implement a Strong Policy Framework, continued
Survey major sectors to determine development goals and projected energy needs; use this as input in strategy formation
● ●
Finalize and officially adopt a national energy policy ●
Establish a platform for dialogue between local and national government institutions ●
Adopt a framework to coordinate investment by international organizations ●
Create an electricity regulator with sufficient capacity and a clear mandate ●
Create a rural electrification agency ●
Improve data collection and make key energy information publicly available ●
Streamline and communicate requirements and processes for renewable energy development ●
Encourage public participation and education in sustainable energy matters ● ●
Where economically viable, implement codes and standards that target low-cost efficiency and conservation solutions
●
Implement tax incentives to encourage energy audits by major consumers ●
Implement tax incentives to promote importation and use of energy-efficient appliances ●
Prioritize distributed generation projects that involve local communities and provide a sense of ownership
● ●
Clarify legislation governing relationship between independent power producers (IPPs) and EDH ●
Standardize the power purchase agreement (PPA) process ●
Develop a net metering program for major energy consumers ●
Lower or eliminate import tariffs on sustainable energy technology and components ●
Implement targeted tax credits for renewable energy power plants ●
Encourage models to promote private sector involvement in rural electrification (e.g., pre-pay struc-tures, solar leasing programs, tariffs appropriate for rural microgrids, integrated rural development)
● ●

166 | Haiti Sustainable Energy Roadmap
Chapter 1. Developing a Sustainable Electricity Roadmap for Haiti: An Integrated Approach1. United Nations (UN) Sustainable Energy for All (SE4ALL) website, www.sustainableenergyforall.org, viewed 10 July 2013. 2. United Nations Framework Convention on Climate Change (UNFCCC), Copenhagen Accord of 18 December 2009, Conference of the Parties 15th Session, Copenhagen, Denmark. 3. UNFCCC, Bali Action Plan of December 2007, Conference of the Parties 13th Session, Bali, Indonesia.4. UN SE4ALL, “About Us,” www.sustainableenergyforall.org/about-us, viewed 17 June 2013.5. M. Collins et al., “Long-term Climate Change: Projections, Commitments and Irreversibility,” in Climate Change 2013: The Physical Science Basis, Contribution of Working Group I to the Fifth Assessment Report of the Intergovernmental Panel on Climate Change (IPCC) (Cambridge, U.K.: Cambridge University Press, 2013); IPCC, “2014: Summary for Policymakers,” in Climate Change 2014: Impacts, Adaptation, and Vulnerability—Part A: Global and Sectoral Aspects, Contribution of Working Group II to the Fifth Assessment Report of the IPCC (Cambridge, U.K.: Cambridge University Press, 2014). 6. U.S. Climate Change Science Program, Synthesis and Assessment Product 3.3, Weather and Climate Extremes in a Changing Climate, North America, Hawaii, Caribbean and US Pacific Islands (Washington, DC: June 2008).7. Maplecroft Global Risk Analytics, Climate Change and Environmental Risk Atlas 2014 (Bath, U.K.: 2013). 8. Christopher Flavin, Low-Carbon Energy: A Roadmap, Worldwatch Report 178 (Washington, DC: Worldwatch Institute, 2008), p. 5. 9. International Energy Agency (IEA), “Haiti: Statistics for 2011,” www.iea.org/stats/countryresults.asp?COUNTRY _CODE=HT&Submit=Submit, viewed 6 December 2013.10. Ibid. 11. Ibid.12. Figure 1.1 from World Bank, Rebuilding Energy Infrastructure and Access Project (Washington, DC: 2012).13. IEA, “Haiti: Statistics for 2009,” www.iea.org/stats/countryresults.asp?COUNTRY_CODE=HT&Submit=Submit, viewed 30 July 2013; World Bank, op. cit. note 12.14. Worldwatch Institute, Breakout Session, Sustainable Energy Roadmap Stakeholder Consultation, Port-au-Prince, Haiti, 21 February 2013.15. Table 1.1 from Nexant, Caribbean Regional Electricity Generation, Interconnection, and Fuels Supply Strategy (Washington, DC: 2010); U.S. Agency for International Development (USAID), “Fact Sheet: Northern Power Plant” (Washington, DC: June 2012); Électricité d’Haïti (EDH), “Nos Centrales,” www.edh.ht/nos_centrales.php; E-Power, “Project Development,” www.epowerhaiti.com/#!project-development. 16. Worldwatch Institute, op. cit. note 14; Nexant, op. cit. note 15. 17. Nexant, op. cit. note 15.18. Ibid.19. UN Population Division, “World Population Prospects: The 2012 Revision,” esa.un.org/unpd/wpp/unpp/panel_population.htm.20. EDH, op. cit. note 15; Hermann Gerdes, Director of Sales, Haytrac, e-mail to Worldwatch Institute, 16 July 2014. 21. E-Power, op. cit. note 15.22. U.S. Department of State, “State Department Fact Sheet on Energy in Haiti” (Washington, DC: 22 October 2012).
Endnotes

Endnotes | 167
23. Worldwatch Institute, op. cit. note 14.24. World Bank, op. cit. note 12.25. USAID, “Haiti: Energy,” www.usaid.gov/haiti/energy, viewed 14 April 2013. 26. Haitian Ministry of Public Works, Transportation and Communications (MTPTC), Bureau of Mines and Energy (BME) and EDH, National Energy Sector Development Plan 2007–2017 (Port-au-Prince: November 2006).27. U.S. Central Intelligence Agency (CIA), “The World Factbook: Haiti,” www.cia.gov/library/publications/the-world -factbook/geos/ha.html, viewed 30 July 2013.28. World Bank, op. cit. note 12.29. Ibid.30. Table 1.2 from EDH, “Frais et Tarif,” www.edh.ht/tarif.php. Figure 1.2 from tariffs study conducted by Caribbean Electric Utility Service Corporation (CARILEC) and EDH, at idem.31. EDH, op. cit. note 30. 32. Figure 1.3 from CARILEC and EDH, op. cit. note 30.33. Table 1.3 from the following sources: Allison Archambault, “Government of Haiti Announces Rural Electrification Plans,” EarthSpark International blog, 26 January 2012, earthsparkinternational.org; Inter-American Development Bank (IDB), “IDB Makes $20 Million Grant for Haiti Hydro,” press release (Washington, DC: 15 December 2011); Regine Simon-Barjon, President, BioTek Solutions, “Effectiveness of Aid in Haiti and How Private Investment Can Facilitate the Reconstruction,” written statement to the U.S. Senate Subcommittees of Foreign Relations on International Development and Foreign Assistance and Western Hemisphere hearing, “Rebuilding Haiti in the Martelly Era,” 23 June 2011; Interim Haiti Recovery Commission (IHRC), “Projects: Energy,” 2011, www.cirh.ht/sites/ihrc/en/projects/Pages/default.aspx #energy; International Electric Power, “Project Siroc,” iepwr.com/projects/siroc.html; UN Environment Programme (UNEP) Haiti Sustainable Energy Programme, external review provided to Worldwatch Institute, 16 April 2014.34. IDB, op. cit. note 33. 35. IHRC, op. cit. note 33.36. Ibid.37. Union of Concerned Scientists, “How Hydro Electric Energy Works,” www.ucsusa.org/clean_energy/our-energy -choices/renewable-energy/how-hydroelectric-energy.html, viewed 6 July 2012. 38. IDB, “HA-T1150: Artibonite 4C Hydroelectric Project – Studies,” www.iadb.org/en/projects/project-description -title,1303.html?id=HA-T1150, viewed 6 September 2013. 39. MTPTC, BME, and EDH, op. cit. note 26.40. MTPTC, BME, and EDH, National Energy Sector Development Plan: Interim Version (NESDP-i) (Port-au-Prince: February 2011).41. MTPTC, BME, and EDH, op. cit. note 26.42. “Haiti’s Martelly Meets with EDH Utility,” caribjournal.com, 7 September 2012. 43. Archambault, op. cit. note 33.44. Bureau of the Minister Delegate to the Prime Minister for Energy Security, personal communication with Worldwatch Institute, June 2014. 45. eSolar, “NRG Energy and Solar Electric Light Fund Collaborate to Accelerate Economic Recovery in Haiti with Solar Energy,” press release (Princeton, NJ: 21 September 2010).46. Ibid.47. UNEP Haiti Sustainable Energy Programme, external review provided to Worldwatch Institute, 16 April 2014.48. MTPTC, BME, and EDH, op. cit. note 40, p. 6. 49. UNEP Haiti Sustainable Energy Programme, op. cit. note 47. 50. IDB, “Bioenergy Action Plan,” 2011, www.iadb.org/en/projects/project,1303.html?id=HA-T1077.51. Simon-Barjon, op. cit. note 33.52. Ibid.53. Matt Lucky, “Weighing Options for Haiti’s Energy Future: Is Jatropha a Realistic Alternative?” ReVolt (Worldwatch Institute blog), 24 February 2012.
168 | Haiti Sustainable Energy Roadmap
54. Matt Lucky, “Waste-to-Energy: One Solution for Health and Electrification in Haiti?” ReVolt (Worldwatch Institute blog), 17 May 2012.55. UNEP Haiti Sustainable Energy Programme, op. cit. note 47; Xing Fu-Bertaux and Matt Lucky, “Haitian Waste-to-Energy Project to Fall Short of Waste Requirements?” ReVolt (Worldwatch Institute blog), 6 June 2012.56. “Construction Starts on Haiti LNG Import Terminal,” LNG World News, 23 August 2013, www.lngworldnews.com; “Haiti – Reconstruction: LNG terminal of $103MM,” Haiti Libre, 18 August 2013, www.haitilibre.com. 57. Clean Energy Solutions Center, “Towards Energy Access in Haiti,” webinar presented by the National Renewable Energy Laboratory (NREL), 16 January 2014, cleanenergysolutions.org/training/towards-energy-access-in-haiti. 58. “EDH à l’Heure des Concessions,” 4 July 2014, Le Nouvelliste, lenouvelliste.com; “Le Gouvernment Martelly-Lamothe Veut Moderniser le Secteur de l’Électricité en Haiti,” Dernières Informations, 24 June 2014, directeinfo.com/le -gouvernement-martelly-lamothe-veut-moderniser-le-secteur-de-lelectricite-en-haiti. 59. CIA, op. cit. note 27.60. UN Development Programme (UNDP), Human Development Report 2013 (New York: 2013). 61. U.S. Department of State, op. cit. note 22. 62. UN SE4ALL, “Objectives,” sustainableenergyforall.org/objectives, viewed 16 October 2013. 63. Figure 1.4 from UNDP, “Human Development Index” (New York: 2013).64. Government of the Republic of Haiti, Action Plan for National Recovery and Development of Haiti (Port-au-Prince: March 2010). 65. René Jean-Jumeau, “Electricité Rurale en Haïti: Orientations pour l’amélioration de l’accès nationale à l’électricité” (Port-au-Prince: MTPTC, 2010). 66. Haiti Regeneration Initiative Web site, www.haitiregeneration.org, viewed 15 September 2012. 67. IEA, “Haiti: Oil for 2011,” www.iea.org/statistics/statisticssearch/report/?country=HAITI&product=oil&year=2011; U.S. Energy Information Administration, “2011 Brief: Brent Crude Oil Averages over $100 per Barrel in 2011,” 12 January 2012, www.eia.gov/todayinenergy/detail.cfm?id=4550; World Bank, “World DataBank: Haiti,” databank.worldbank.org/data/views/reports/tableview.aspx. 68. World Bank, op. cit. note 12. 69. MTPTC, BME, and EDH, op. cit. note 26, p. 1. 70. MTPTC, personal communication with Worldwatch, Port-au-Prince, February 2013.71. MTPTC, BME, and EDH, “Avant-Projet de Politique Energétique de la République d’Haïti” (Port-au-Prince: January 2008). 72. New Agriculturist, “Country Profile – Haiti,” www.new-ag.info/en/country/profile.php?a=202, viewed 30 July 2013. 73. Philip Howard, “Environmental Scarcities and Conflict in Haiti” (Ottawa: Canadian Development Agency, 1998). 74. UNICEF, “Haiti Prepares for Another Hurricane Season,” 8 September 2009, www.unicef.org/infobycountry/haiti _51083.html. 75. U.S. Climate Change Science Program, op. cit. note 6.76. Republic of Haiti, Haiti Earthquake Post Disaster Needs Assessment (PDNA): Assessment of damage, losses, general and sectoral needs (Port-au-Prince: 2010). 77. World Bank, Vulnerability, Risk Reduction, and Adaptation to Climate Change: Haiti (Washington, DC: 2011).
Chapter 2. Energy Efficiency in Haiti1. Center for Sustainable Energy California, “How Does One Define Efficiency?” energycenter.org/index.php/technical-assistance/energy-efficiency/energy-efficiency-definition, viewed 17 February 2012.2. Sidebar 2.1 from Amy Bracken, “Recycled Trash to Fuel Haiti,” The World, 22 April 2010, www.theworld.org; U.S. Agency for International Development (USAID), Assessment of Haiti Alternative Cooking Technologies Program (Washington, DC: November 2010); Global Alliance for Clean Cookstoves, “Haiti,” www.cleancookstoves.org /countries/america/haiti.html, viewed 5 June 2014; World Health Organization (WHO), Mortality and Burden of Disease Attributable to Selected Major Risks (Geneva: 2009) .3. World Bank, Rebuilding Energy Infrastructure and Access Project (Washington, DC: 2012).4. Dominican Republic National Council on Climate Change and Clean Development Mechanism, “A Journey to
Endnotes | 169
Sustainable Growth: The Draft Climate-Compatible Development Plan of the Dominican Republic” (Santo Domingo: September 2011).5. Figure 2.1 from World Bank, World Development Indicators (Washington, DC: 2013), and from U.S. Energy Information Administration (EIA), “Country Energy Profiles” (Washington, DC: 2013).6. Figure 2.2 from International Energy Agency (IEA), “Haiti: Electricity and Heat for 2011,” www.iea.org/statistics /statisticssearch/report/?&country=HAITI&year=2011&product=ElectricityandHeat.7. Nexant, Caribbean Regional Electricity Generation, Interconnection, and Fuels Supply Strategy (Washington, DC: 2010); USAID, “Fact Sheet: Northern Power Plant” (Washington, DC: June 2012); Électricité d’Haïti (EDH), “Nos Centrales,” www.edh.ht/nos_centrales.php; E-Power, “Project Development,” www.epowerhaiti.com/#!project-devel opment. 8. Haitian Ministry of Public Works, Transportation and Communications (MTPTC), Bureau of Mines and Energy (BME), and EDH, National Energy Sector Development Plan 2007–2017 (Port-au-Prince: November 2006), p. 6.9. Ibid., p. 510. Ibid., p. 5.11. Nexant, op. cit. note 7. 12. J. Wells, “A Dam for the People and a People Damned,” The Star, 21 November 2010.13. World Bank, op. cit. note 3.14. Ibid.15. EIA, “How Much Electricity Is Lost in Transmission and Distribution in the United States?” www.eia.gov/tools/faqs /faq.cfm?id=105&t=3, updated 9 July 2012.16. World Bank, op. cit. note 3.17. Ibid.18. MTPTC, BME, and EDH, National Energy Sector Development Plan: Interim Version (NESDP-i) (Port-au-Prince: February 2011).19. United Nations Industrial Development Organization (UNIDO), Industrial Development Report 2011 (Vienna: 2011).20. Ibid.21. Worldwatch Institute, Breakout Session, Sustainable Energy Roadmap Stakeholder Consultation, Port-au-Prince, Haiti, 21 February 2013.22. Inter-American Development Bank (IDB), Restoring the Competitiveness of the Coffee Sector in Haiti (Washington, DC: April 2006).23. MTPTC, BME, and EDH, op. cit. note 18.24. Business in Haiti, “Profile of Haiti’s Garment Manufacturing Sector,” May 2010, www.businessinhaiti.com/images /stories/pdf_files/Haiti_Garment_BaselineReport_05_20.pdf.25. Ibid. 26. Ibid. 27. MTPTC, BME, and EDH, op. cit. note 18.28. Environmental Advisor for the United Nations Environment Programme, personal communication with World-watch Institute,11 July 2014. 29. Table 2.1 from MTPTC, BME, and EDH, op. cit. note 8. 30. Figure 2.3 from ibid.31. European Energy Labels website, www.energylabels.co.uk/eulabel.html, viewed 30 January 2012. 32. Energy Star, “Refrigerators for Consumers,” www.energystar.gov/index.cfm?fuseaction=find_a_product.show ProductGroup&pgw_code=RF, viewed 1 March 2012.33. California Energy Commission, “Refrigerators and Freezers,” www.consumerenergycenter.org/home/appliances /refrigerators.html, viewed 1 March 2012.34. MTPTC, BME, and EDH, op. cit. note 8.35. Technology Action Plan: Buildings Sector Energy Efficiency, Report to the Major Economies Forum on Energy and

170 | Haiti Sustainable Energy Roadmap
Climate, Prepared by the United States in consultation with MEF Partners, December 2009. 36. Christian E. Casillas and Daniel E. Kammen, “The Energy-Poverty-Climate Nexus,” Science, 26 November 2010, pp. 1181–82.37. Table 2.2. from MTPTC, BME, and EDH, op. cit. note 8.38. Architectural Louvers website, www.archlouvers.com, viewed 5 March 2012. 39. Energy Star, “Energy Star Products: Air Conditioning,” www.energystar.gov/index.cfm?fuseaction=find_a_product .showProductGroup&pgw_code=CA, viewed 8 March 2012. 40. Energy Star, “Energy Star Products: Fans,” www.energystar.gov/index.cfm?fuseaction=find_a_product.showProduct Group&pgw_code=VF, viewed 8 March 2012. 41. Jane Lausten, Energy Efficiency Requirements in Building Codes: Energy Policies for New Buildings (Paris: IEA, 2008).42. Center for Climate and Energy Solutions, “Building Envelope,” www.c2es.org/technology/factsheet/Building Envelope.43. D.J. Bonnet et al., “Ultra Low U-value Walls for Low-Carbon-Dioxide Homes,” Proceedings of the ICE, Energy, 1 November 2008, pp. 175–85.44. European Insulation Manufacturers Association, “U-Values: For Better Energy Performance of Buildings”, (Brussels: November 2007).45. Ibid.46. Sidebar 2.3 from U.S. Department of Energy, “Guidelines for Selecting Cool Roofs,” July 2010, www1.eere.energy.gov /femp/pdfs/coolroofguide.pdf.47. Tetra Tech – Caribbean Hotel Energy Efficiency Action Programme, Energy Efficiency and Micro-Generation in Caribbean Hotels Consultancy (Arlington, VA: July 2012).48. Ibid.49. Ibid.50. Ibid.51. Ibid.
Chapter 3. Haiti’s Renewable Energy Potential1. Alexander Ochs and Annette Knödler, “Value of Fossil Fuel Subsidies Decline; National Bans Emerging,” Vital Signs Online (Washington, DC: Worldwatch Institute, 11 May 2011).2. International Renewable Energy Agency (IRENA), Renewable Energy Technologies: Cost Analysis Series: Solar Photovoltaics (Abu Dhabi: June 2012), p. 15; Shyam Mehta, “PV Technology and Cost Outlook, 2013-2017,” GTM Research, 18 June 2013, www.greentechmedia.com. 3. Bloomberg New Energy Finance, Sun Sets on Oil for Gulf Power Generation (London and New York: 19 January 2011).4. Renewable Energy Policy Network for the 21st Century (REN21), Renewables 2014 Global Status Report (Paris: 2014).5. IRENA, Renewable Energy Technologies: Cost Analysis Series: Concentrating Solar Power (Abu Dhabi: June 2012), p. i.6. REN21, op. cit. note 4.7. Ibid.; B. Perlack and W. Hinds, Evaluation of the Barbados Solar Water Heating Experience (Oak Ridge, TN: Oak Ridge National Laboratory, 2003); estimate of 15,000 homes based on U.S. Energy Information Administration (EIA) data for 2010 average electricity consumption for a U.S. residential utility customer, available at EIA, “How Much Electricity Does an American Home Use?,” at 205.254.135.7/tools/faqs/faq.cfm?id=97&t=3.8. International Energy Agency (IEA), Renewable Energy Essentials: Solar Heating and Cooling (Paris: 2009).9. United Nations Environment Programme (UNEP), “Success Stories: Solar Energy in Barbados,” www.unep.org /greeneconomy/SuccessStories/SolarEnergyinBarbados/tabid/29891/Default.aspx, viewed 14 December 2011.10. Inter-American Development Bank (IDB), “Barbados to Diversify Energy Matrix, Promote Sustainable Energy Sources with IDB Assistance,” press release (Washington, DC: 10 November 2011). 11. Case Study 1 from the following sources: Partners in Health, “Hôpital Universitaire de Mirebalais,” www.pih.org /pages/mirebalais, viewed 7 March 2014; Katie Auth, “In Haiti and Rwanda, Renewable Energy Helps Power National

Endnotes | 171
Recovery” ReVolt (Worldwatch Institute blog), 19 September 2012. 12. UNEP Haiti Sustainable Energy Programme, external review provided to Worldwatch Institute, 16 April 2014.13. Figure 3.1 from 3TIER, FullView: Haiti, prepared for the Worldwatch Institute, 30 October 2012.14. U.S. National Renewable Energy Laboratory (NREL), “30-Year Average of Monthly Solar Radiation, 1961–1990,” rredc.nrel.gov/solar/old_data/nsrdb/1961-1990/redbook/sum2/state.html, viewed 19 June 2013.15. Figure 3.2 from 3TIER, op. cit. note 13.16. Figure 3.3 from 3TIER, op. cit. note 13, and from German National Weather Service, “Monthly Average GHI for Germany, 1981–2010,” www.dwd.de, viewed 19 June 201317. Case Study 2 and Figures 3.4 and 3.5 from 3TIER, op. cit. note 13.18. Table 3.1 a Worldwatch calculation based on data from 3TIER, op. cit. note 13.19. Table 3.2 from ibid.20. REN21, op. cit. note 4.21. Mark Delucchi and Mark Z. Jacobson, “Providing All Global Energy with Wind, Water, and Solar Power, Part II: Reliability, System and Transmission Costs, and Policies,” Energy Policy, vol. 39 (2011), pp. 1170–90.22. American Wind Energy Association, Small Wind Turbine Global Market Study (Washington, DC: 2010); “Wind Farm Selected in First Selection of Clean Energy Projects,” RenewableEnergyFocus.com, 11 January 2010.23. Haitian Ministry of Public Works, Transportations and Communications (MTPTC), Bureau of Mines and Energy (BME), and Électricité d’Haïti (EDH), National Energy Sector Development Plan: Interim Version (NESDP-i) (Port-au-Prince: February 2011). 24. Cristina Archer and Mark Jacobson, Evaluation of Global Wind Power (Palo Alto, CA: Stanford University Depart-ment of Civil and Environmental Engineering, 2005).25. Figure 3.6 from 3TIER, op. cit. note 13.26. Figure 3.7 from ibid.27. Case Study 3 from MTPTC, BME, and EDH, National Energy Sector Development Plan 2007–2017 (Port-au-Prince: November 2006), p. 9, and from 3TIER, op. cit. note 13. Figures 3.8, 3.9, and 3.10 from 3TIER, idem.28. Table 3.3 from 3TIER, op. cit. note 13.29. Table 3.4 a Worldwatch calculation based on 3TIER, op. cit. note 13.30. UNEP Haiti Sustainable Energy Programme, op. cit. note 12. 31. REN21, op. cit. note 4. 32. World Commission on Dams, Dams and Development: A New Framework for Decision-Making (London: Earthscan, November 2000). 33. Changjiang Water Resources Commission, “Research on the Resettlement of the Three Gorges Project” (Hubei: Hubei Science and Technology Press, 1997); Shai Oster, “China Recognizes Dangers Caused by Three Gorges Dam,” Wall Street Journal, 27 September 2007. 34. MTPTC, BME, and EDH, Avant-Projet de Politique Energétique de la République d’Haiti (Port-au-Prince: January 2008). 35. Francis Mitchell, “Summary of Hydroelectric Potential Sites” (Port-au-Prince: Soleo Energies, 2011). 36. Ibid.37. Ibid.38. Table 3.5 from ibid. 39. UNEP Haiti Sustainable Energy Programme, op. cit. note 12. 40. Table 3.6 from Mitchell, op. cit. note 35. 41. MTPTC, BME, and EDH, op. cit. note 27. 42. Jane Earley and Alice McKeown, Red, White, and Green: Transforming U.S. Biofuels, Worldwatch Report 180 (Washington, DC: Worldwatch Institute, July 2009).43. IEA Energy Statistics, “Share of total primary energy supply in 2009: Haiti,” www.iea.org/stats/pdf_graphs/HTTP ESPI.pdf, viewed 30 October 2013. 44. Mongabay, “Haiti Forest Information and Data,” rainforests.mongabay.com/deforestation/2000/Haiti.htm#03

172 | Haiti Sustainable Energy Roadmap
-deforestation, viewed 30 October 2013. 45. Biomass stakeholders in Haiti, personal communications with Worldwatch, Port-au-Prince, September 2011; estimate of 119,000 tons of available unused bagasee from MTPTC, , BME, and EDH, op. cit. note 23.46. Table 3.7 derived from the following: Ranges of 370 kWh and 510 kWh per ton from D. Loy and M.F. Coviello, Renewable Energies Potential in Jamaica (Santiago, Chile: United Nations, 2005). Loy and Coviello assume that the harvest period in Jamaica is 185 days. We therefore assume that the Haitian harvest period is half a year, and that the cogeneration plant can run on the bagasse only during this period. To calculate the maximum generation capacity that can be built for the unused bagasse, we divided the potential annual generation by 4,380 hours (number of hours in half a year). This assumes a capacity factor of 1 and is therefore a conservative estimate. 47. Jatropha Foundation, Haiti Jatropha Stakeholders’ Conference: Summary Report, 23 June 2009, jatrophafoundation.org/assets/Resources/6-23-09-Clemens-StakeholdersMtgSummaryReport.pdf. 48. Richard Brittaine and NeBambi Lualadio, “Jatropha: A Smallholder Bioenergy Crop: The Potential for Pro-Poor Development,” Integrated Crop Management, vol. 8 (2010). 49. Francis Mitchell, Hydraulic Engineer, external review provided to Worldwatch Institute, 25 March 2014. 50. UNEP, op. cit. note 12. 51. Mitchell, op. cit. note 49. 52. UNEP, op. cit. note 12. 53. Samuel Booth et al., Haiti Waste-to-Energy Opportunity Analysis (Golden, CO: National Renewable Energy Laboratory, 2010).54. Table 3.8 from ibid.55. Ibid.56. Figure 3.11 from ibid.57. S.E. Ben Elghali, M.E.H. Benbouzid, and J.F. Charpentier, “Marine Tidal Current Electric Power Generation Technology: State of the Art and Current Status,” Electric Machines & Drives Conference, May 2007, IEEE International, pp. 1407–12, hal.archives-ouvertes.fr/docs/00/53/12/55/PDF/IEEE_IEMDC_2007_BENELGHALI.pdf. 58. California Energy Commission, “Ocean Energy,” www.energy.ca.gov/oceanenergy/index.html, viewed 9 February 2011. 59. Energinat, “Optimal Management of Natural Energy Resources for the Benefit of the People of Haiti,” www.energinat.com/sansaqua_site.shtml, viewed 30 October 2013. 60. Utrecht Faculty of Education, The Philippines, “Geothermal Energy on Leyte,” www.philippines.hvu.nl/leyte2.htm, viewed 22 February 2012; California Energy Commission, “Geothermal Energy in California,” www.energy.ca.gov/geo thermal, updated 29 March 2010.61. REN21, op. cit. note 4, p. 38. 62. Ted J. Clutter, “Absolute Commitment: Geothermal Operations at the Geysers,” RenewableEnergyWorld.com, 27 April 2010.63. Worldwatch Institute, Breakout Session, Sustainable Energy Roadmap Stakeholder Consultation, Port-au-Prince, Haiti, 21 February 2013; Office of the Minister Delegate to the Prime Minister for Energy Security, reviewer input provided to Worldwatch Institute, May 2014.64. REN21, op. cit. note 4.
4. Grid Improvement and Energy Storage 1. World Bank, Rebuilding Energy Infrastructure and Access Project (Washington, DC: 27 August 2012); Inter-American Development Bank (IDB), Institutional Transformation and Modernization Program of the Energy Sector – II (Washington DC: 26 July 2012).2. IDB, op. cit. note 1.3. Figure 4.1 from World Bank, op. cit. note 1. 4. Table 4.1 from the following sources: World Bank, op. cit. note 1; IDB, op. cit. note 1; U.S. Agency for International Development (USAID), “Electrical Substation Rehabilitation” (Washington, DC: May 2012); IDB, Péligre Hydroelectric Plant Rehabilitation Program (Washington, DC: 14 December 2008); IDB, Rehabilitation of Electricity Distribution System in Port-au-Prince (Washington, DC: 22 September 2010).

Endnotes | 173
5. M. Golkar, “Distributed Generation and Competition in Electric Distribution Market,” IEEE Eurocon, 2009. Sidebar 4.1 from the following sources: reversed power flow damage from S.G.M. Therien, “Distributed Generation: Issues Concerning a Changing Power Grid Paradigm,” thesis presented to the Faculty of California Polytechnic State University, San Luis Obispo, CA; within 5–10% from C. Lawrence, M. Salama, and R. Elshatshat, “Analysis of the Impact of Distributed Generation on Voltage Regulation,” 2004 IEEE PES Power Systems Conference and Exposition; incrementally adjusting power from Therien, op. cit. this note; overheating and voltage regulation problems from Taufik, Introduction to Power Electronics, 6th Rev., 2008; reduce the distortion effect and fuses, circuit breakers, etc. from Taufik, Advanced Power Electronics, 3rd Rev., 2009; lethal hazard from islanding from G.M. Masters, Renewable and Efficient Electric Power Systems (Hoboken, NJ: John Wiley & Sons, 2004); damage from out-of-phase reconnection from P. Barker and R. De Mello, “Determining the Impact of Distributed Generation on Power Systems: Part 1 - Radial Distribution Systems,” Proceedings of the IEEE Power Engineering Society Transmission and Distribution Conference, vol. 3 (2000), pp. 1645–56.6. Robert L. Dohn, The Business Case for Microgrids (Munich: Siemens, 2011). 7. Simon Rolland and Carlos Guerroro, Hybrid Mini-Grids for Rural Electrification: Lessons Learned (Brussels: Alliance for Rural Electrification, 2011), p. 12.8. Ibid.9. GVEP International, Policy Briefing: The History of Minigrid Development in Developing Countries. (London: 2011), p. 3. 10. Rolland and Guerroro, op. cit. note 7, p.12.11. Ibid., p. 12.12. Clean Energy Solutions Center, “Toward Energy Access in Haiti,” webinar presented by National Renewable Energy Laboratory (NREL), 16 January 2014, cleanenergysolutions.org/training/towards-energy-access-in-haiti. 13. United Nations Environment Programme (UNEP) Haiti Sustainable Energy Programme, external review provided to Worldwatch Institute, 16 April 2014.14. Clean Energy Solutions Center, op. cit. note 12. 15. Ibid.16. Figure 4.2 from World Bank Energy Sector Management Assistance Program (ESMAP), META User Manual, www .esmap.org/node/3051.17. International Energy Agency (IEA), Harnessing Variable Renewables: A Guide to the Balancing Challenge – 2011 (Paris: May 2011).18. M. Milligan and B. Kirby, Market Characteristics for Efficient Integration of Variable Generation in the Western Interconnection (Golden, CO: NREL, August 2010).19. GE Energy, The Effects of Integrating Wind Power on Transmission System Planning, Reliability, and Operations: Report on Phase 2, prepared for the New York State Energy Research and Development Authority (Albany, NY: 2005).20. Such undersea cables have been proposed for several locations in the Caribbean, including Haiti; however, the most beneficial interconnections are generally seen as being in the Lesser Antilles, per Franz Gerner and Megan Hansen, Caribbean Regional Electricity Supply Options: Toward Greater Security, Renewables and Resilience (Washington, DC: World Bank, 2010). 21. Case Study 4 from University of Hawaii, Hawaii Natural Energy Institute, Oahu Wind Integration Study: Final Report, prepared for the U.S. Department of Energy, Office of Electricity Delivery and Energy Reliability (Honalulu: February 2011).22. Figure 4.3 from 3TIER, FullView: Haiti, prepared for the Worldwatch Institute, 30 October 2012.23. Figure 4.4 from ibid.24. Figure 4.5 from ibid.25. Figure 4.6 from Francis Mitchell, “Summary of Hydroelectric Potential Sites” (Port-au-Prince: Soleo Energies, 2011).26. Milligan and Kirby, op. cit. note 18.27. Ibid.28. Ibid.29. M. Ahlstrom, Short-term Forecasting: Integration of Forecast Data into Utility Operations Planning Tools, presented at the Utility Wind Integration Group/NREL Wind Forecasting Applications to Utility Planning and Operations, St. Paul,

174 | Haiti Sustainable Energy Roadmap
MN, 21–22 February 2008; K. Rohrig, ed., Entwicklung eines Rechenmodells zur Windleistungsprognose für das Geboet des deutschen Verbundnetzes, Abschlussbericht Forchungsvorhaben Nr. 0329915A, gefördert durch Bundesministeriums für Umwelt, Naturschutz und Reaktorsicherheit (BMU) (Kassel, Germany: 2005).30. International Finance Corporation (IFC) representatives, personal communications with Worldwatch, 2013.31. Table 4.3 from Nexant, Caribbean Regional Electricity Generation, Interconnection, and Fuels Supply Strategy (Washington, DC: 2010).32. “Construction Starts on Haiti LNG Import Terminal,” LNG World News, 23 August 2013, www.lngworldnews.com; “Haiti – Reconstruction: LNG terminal of $103MM,” Haiti Libre, 18 August 2013, www.haitilibre.com. 33. Table 4.4. from International Renewable Energy Agency (IRENA), Electricity Storage and Renewables for Island Power (Abu Dhabi: May 2012), p. 12; IEA Energy Technology Systems Analysis Programme and IRENA, Electricity Storage Technology Brief (Abu Dhabi: April 2012), p. 15; thermal storage costs calculated based on data from D. Biello, “How to Use Solar Energy at Night,” Scientific American, 18 February 2009.34. Case Study 5 from the following sources: Japan Commission on Large Dams, “Summary” (Tokyo: 2011); Organic Power, “Glinsk Pumped Hydroelectric Energy Storage,” 2011, www.organicpower.ie/content/projects/glinsk.htm; Pete Singer, “Gridflex Proposes 300MW Energy Storage Project for Hawaii,” RenewableEnergyWorld.com, 16 December 2010.35. Haitian Ministry for Public Works, Transportation, and Communications (MTPTC), Bureau of Mines and Energy (BME), and Électricité d›Haïti (EDH), National Energy Sector Development Plan 2007–2017 (Port-au-Prince: November 2006).
5. Technological Pathways for Meeting Haiti’s Future Electricity Demand1. Haitian Ministry of Public Works, Transportations and Communications (MTPTC), Bureau of Mines and Energy (BME), and Électricité d›Haïti (EDH), National Energy Sector Development Plan: Interim Version (NESDP-i) (Port-au-Prince: February 2011). 2. Various stakeholders in Haiti, personal communications with Worldwatch, Port-au-Prince, 2012. 3. Worldwatch Institute, Powering the Low-Carbon Economy: The Once and Future Roles of Renewable Energy and Natural Gas (Washington, DC: 2010).
6. Assessing the Socioeconomic Impacts of Alternative Electricity Pathways1. U.S. Energy Information Administration (EIA), “Levelized Cost of New Generation Resources,” in Annual Energy Outlook 2011 (Washington, DC: 2011).2. World Bank Energy Sector Management Assistance Program (ESMAP), META User Manual, www.esmap.org/node /3051; Christoph Kost et al., Levelized Cost of Electricity: Renewable Energies (Freiburg, Germany: Fraunhofer Institut for Solar Energy Systems, 2012). 3. This analysis assumes that fuel costs are free for sugarcane bagasse cogeneration, since many sugarcane producers currently have their own generation yet do not utilize all of their bagasse; if these producers were to build up generation capacity, they would be able to supply their boilers with currently unused bagasse at virtually no cost. For other biomass resources, however, a market would need to be created for biomass waste. Because this assessment considers only bagasse-fed generation, it assumes that the fuel cost is zero.4. Jonathan Koomey and Florentin Krause, “Introduction to Environmental Externality Costs,” in CRC Handbook on Energy Efficiency (Berkeley, CA: Lawrence Berkeley Laboratory, 1997).5. Olav Hohmeyer, Social Costs of Energy Consumption: External Effects of Electricity Generation in the Federal Republic of Germany (New York/Heidelberg: Springer-Verlag, 1989).6. ExternE - External Costs of Energy, “Methodology,” www.externe.info/externe_d7/?q=node/1; U.S. National Research Council, Hidden Costs of Energy: Unpriced Consequences of Energy Production and Use (Washington, DC: National Academy of Sciences, 2010).7. Kseniya Lvovsky et al., Environmental Cost of Fossil Fuels: A Rapid Assessment Method with Application to Six Cities, Environment Department Papers #78 (Washington, DC: World Bank, 2000).8. U.S. National Aeronautics and Space Administration, “Effects: The Current and Future Consequences of Global Change,” climate.nasa.gov/effects.9. Ramón Bueno et al., Climate Change: The Cost of Inaction (Somerville, MA: Stockholm Environment Institute—

Endnotes | 175
U.S. Center and Global Development and Environment Institute, Tufts University, May 2008); J.E. Hay et al., “Small Island States,” in Intergovernmental Panel on Climate Change (IPCC), Climate Change 2001: Impacts, Adaptation and Vulnerability, report of Working Group II (Cambridge, U.K.: Cambridge University Press, 2001).10. Hay et al., op. cit. note 9.11. Chris W. Hope, “The Social Cost of CO2 from the PAGE09 Model,” Economic Discussion Papers No. 2011-39 (Kiel, Germany: Kiel Institute for the World Economy, 2011); World Bank, Turn Down the Heat: Why a 4°C Warmer World Must be Avoided, prepared by the Potsdam Institute for Climate Impact Research and Climate Analytics (Washington, DC: 2012); IPCC, Managing the Risks of Extreme Events and Disasters to Advance Climate Change Adaptation, Special Report (Cambridge, U.K.: Cambridge University Press: 2011).12. Table 6.1 from U.S. Energy Information Administration (EIA), International Energy Statistics, “Total Carbon Dioxide Emissions from the Consumption of Energy (Million Metric Tons),” www.eia.gov/cfapps/ipdbproject/IED Index3.cfm?tid=90&pid=44&aid=8, viewed 28 September 2013, and from World Bank, “GDP per capita (current US$),” data.worldbank.org/indicator/NY.GDP.PCAP.CD, viewed 28 September 2013. Energy-related CO2 emissions include emissions from coal and petroleum consumption and flaring of natural gas.13. Worldwatch Institute, Sustainable Energy Roadmap for the Dominican Republic (Washington, DC: forthcoming 2014).14. U.S. Congress, Office of Technology Assessment, Studies of the Environmental Costs of Electricity (Washington, DC: 1994).15. Open EI, “Transparent Cost Database,” en.openei.org/wiki/Transparent_Cost_Database.16. International Renewable Energy Agency (IRENA), Renewable Energy Technologies: Cost Analysis Series (Abu Dhabi: 2012).17. EIA, Annual Energy Outlook 2013 (Washington, DC: 2013).18. U.S. Central Intelligence Agency (CIA), The World Factbook, www.cia.gov/library/publications/the-world-factbook /geos/ha.html, viewed 23 October 2013; United Nations, “World Statistics Pocketbook,” unstats.un.org/unsd/pocket book/, viewed 23 October 2013. Calculations assume a refined oil cost of USD 100 per barrel in 2011.19. Bloomberg New Energy Finance and Frankfurt School – United Nations Environment Programme (UNEP) Collaborating Centre for Climate & Sustainable Energy Finance, Global Trends in Renewable Energy Investment 2013 (London: 2013).20. IRENA, Renewable Energy Jobs: Status, Prospects & Policies: Biofuels and Grid-Connected Electricity Generation (Abu Dhabi: 2011) pp. 7–8.21. Figure 6.11 from ibid.22. Figure 6.12 from Max Wei, Shana Patadia, and Daniel M. Kammen, “Putting Renewables and Energy Efficiency to Work: How Many Jobs Can the Clean Energy Industry Generate in the US?” Energy Policy, vol. 38 (2010), pp. 919–31.23. Ibid.24. CIA, op. cit. note 18, viewed 17 October 2013.25. South Pacific Applied Geoscience Commission and UNEP, “Environmental Vulnerability Index,” www.sopac.org /index.php/environmental-vulnerability-index.
7. Overcoming Barriers to Financing Sustainable Energy in Haiti1. Bloomberg New Energy Finance (BNEF) and Frankfurt School – United Nations Environment Programme (UNEP) Collaborating Centre for Climate & Sustainable Energy Finance, Global Trends in Renewable Energy Investment 2013 (London: 2013).2. Ibid.3. Nouvel Fonkoze, “Fonkoze Loan Helps Light Haiti’s Dark Corners” (Washington, DC: 2012).4. Jaeah Lee, “Haiti Searches for a Solar Future,” Mother Jones, 28 January 2011. 5. Government of the Republic of Haiti, Action Plan for National Recovery and Development of Haiti (Port-au-Prince: March 2010). 6. U.S. Department of State, “Travel Warning” (Port-au-Prince: 13 August 2013).7. Galvin Clancey, Vestas, external review provided to Worldwatch Institute, April 2014. 8. Jonathan M. Katz, The Big Truck That Went By: How the World Came to Save Haiti and Left Behind a Disaster (New

176 | Haiti Sustainable Energy Roadmap
York: Palgrave Macmillan, 2013), p. 176. 9. Organization of American States, “Modernization of Cadastre and Land Rights Infrastructure in Haiti” (Washington, DC: May 2010). 10. Katz, op. cit. note 8, p. 101. 11. “Haiti – Social: The Land Reform, a Priority of President Martelly,” Haiti Libre, 8 September 2012, www.haitilibre.com. 12. World Economic Forum, Private Sector Development in Haiti: Opportunities for Investment, Job Creation and Growth (Geneva: 2011), p. 16. 13. Club de Madrid, “Haiti – Political Stability Is a Must and a Prerequisite for Investment,” 6 March 2012, www.club madrid.org. 14. World Bank, Natural Disaster Hotspots: A Global Risk Analysis (Washington, DC: 2005).15. U.S. Senate Committee on Foreign Relations, “Haiti Reforestation Act of 2011: Senate Report 112-165,” (Washington, DC: 15 May 2012). 16. World Bank, “World Bank Supports Haiti’s Rebuilding Efforts After Recent Hurricanes” (Washington, DC: 12 December 2008).17. Sönke Kreft and David Eckstein, Global Climate Risk Index 2014 (Berlin: Germanwatch, 2014).18. Ibid.19. U.S. Department of State Bureau of Consular Affairs, “Haiti Travel Warning,” 12 March 2014, http://travel.state.gov /content/passports/english/alertswarnings/haiti-travel-warning.html. 20. Donn Bobb, “Overall Security Situation in Haiti Remains ‘Relatively Stable’ UN Envoy,” United Nations Radio, 28 August 2013, www.unmultimedia.org. 21. World Bank and International Finance Corporation (IFC), Doing Business 2014 (Washington, DC: 2013). 22. Table 7.1 from World Economic Forum, The Global Competitiveness Report 2013–2014 (Geneva: 2013). 23. Worldwatch Institute, Breakout Session, Sustainable Energy Roadmap Stakeholder Consultation, Port-au-Prince, 21 February 2013.24. World Bank, “Ease of Doing Business in Jamaica,” in Doing Business 2013, www.doingbusiness.org/data/explore economies/jamaica; X. Sala-I-Martín, “Chapter 1.1 The Global Competitiveness Index 2012–2013: Strengthening Recovery by Raising Productivity,” in World Economic Forum, The Global Competitiveness Report 2012-2013 (Washington, DC: 2012); Inter-American Development Bank (IDB) and BNEF, Climatescope 2012: Assessing the Climate for Climate Investing in Latin America and the Caribbean (London: 2012), pp. 86–89.25. IFC, personal communication with Worldwatch, Washington, DC, May 2013.26. Figure 7.1 estimates calculated using Bloomberg, “Fixed Mortgage Loan Calculator,” www.bloomberg.com/personal -finance/calculators/mortgage, viewed 27 June 2013. 27. IDB, Climatescope Index 2013 (Washington, DC: 2013).28. Ibid.29. Table 7.2 from World Economic Forum, op. cit. note 22.30. IFC, op. cit. note 25.31. U.S. Department of Energy, “Loan Programs Office: Our Projects,” lpo.energy.gov/our-projects/.32. Case Study 6 from the following sources: electricity as largest cost from M. Thompson, “Jamaica Broilers Lights Up Chicken Houses with Solar Plan,” The Gleaner, 13 July 2013, jamaica-gleaner.com; 22 MWh from New Leaf Power, personal communication with Worldwatch, 14 January 2013; daytime use and grid access from Development Bank of Jamaica (DBJ), personal communication with Worldwatch, November 2012; payback period from Thompson, op. cit. this note; 8.5% rate from New Leaf Power, op. cit. this note; right to repossess and sell, and partial loan guarantee from DBJ, op. cit. this note. 33. DBJ GreenBiz, “About Us,” dbankjm.com/dbjgreenbiz/about-us, viewed 25 February 2013. 34. Ibid.; Jamaica Information Service, “Energy Efficiency Project Launched to Assist SMEs,” 21 June 2012, www.jis.gov .jm/news/leads/30995. 35. DBJ GreenBiz, op. cit. note 33. 36. DBJ, personal communication with Worldwatch, November 2012.37. World Bank, Rebuilding Energy Infrastructure and Access Project (Washington, DC: August 2012).

Endnotes | 177
38. Ibid.39. USD 180 million from ibid. USD 180 million represents 2.7% of Haiti’s 2010 national GDP of USD 6.63 billion. 40. Ibid.41. Clean Energy Solutions Center, “Toward Energy Access in Haiti,” webinar presented by National Renewable Energy Laboratory (NREL), 16 January 2014, cleanenergysolutions.org/training/towards-energy-access-in-haiti.42. Électricité d’Haïti (EDH), “Le Plan d’Action 2012-2013 de l’EDH: Retour à la Discipline du Marché,” edh.ht/actual ites-entrepview.php?id=1, viewed 1 October 2013.43. Haitian Ministry of Public Works, Transportation and Communications (MTPTC), Bureau of Mines and Energy (BME), and EDH, National Energy Sector Development Plan 2007–2017 (Port-au-Prince: November 2006). 44. EDH, op. cit. note 42.45. IFC, op. cit. note 25.46. Renewable energy project developer, personal communication with Worldwatch, 2 August 2013. 47. LaSean Brown et al., “Growing the Middle: Strategies for Job Creation and SME Development in Haiti” (Princeton, NJ: Woodrow Wilson School of Public and International Affairs, Princeton University, 2011).48. Miranda Daniloff Mancusi, “Public Service Innovators – Pierre-Marie Boisson: Lending from the Ground Up,” press release (Boston: Harvard University Kennedy School of Government, 25 April 2013).49. Ibid. 50. LinkedIn, “About Fonkoze,” www.linkedin.com/company/fonkoze.51. Nouvel Fonkoze, op. cit. note 3.52. MiCrédito, “Tecnosol & Global Partnerships Meet Clients,” 20 June 2013, at www.micredito.com.ni. 53. IDB Multilateral Investment Fund, “Tecnosol: Solar Power for the Rural Poor,” www5.iadb.org/mif/Portals/0/High lights/MIF2011_Project_Environment_Technosol.pdf. 54. IFC, op. cit. note 25.55. Ibid.56. United Nations Office of the Special Envoy for Haiti, “Has Aid Changed?” June 2011, www.lessonsfromhaiti.org /download/Report_Center/has_aid_changed_en.pdf. 57. Katz, op. cit. note 8, p. 152. 58. United Nations Office of the Special Envoy for Haiti, “International Assistance to Haiti: Key Facts,” December 2012, www.lessonsfromhaiti.org/download/International_Assistance/1-overall-key-facts.pdf. 59. Figure 7.2 from Ibid.60. United Nations Framework Convention on Climate Change (UNFCCC), “Financial, Technology and Capacity-building Support: New Long-term Funding Arrangements,” The Cancun Agreements, cancun.unfccc.int/financial-tech nology-and-capacity-building-support/new-long-term-funding-arrangements/. 61. Sidebar 7.1 from Global Environment Facility (GEF) Small Grants Programme, “Haiti,” sgp.undp.org/index.php ?option=com_countrypages&view=countrypage&country=128&Itemid=204, and from UNFCCC, Clean Development Mechanism Web site, cdm.unfccc.int/. 62. S. Bakker et al., “The Future of the CDM: Same, But Differentiated?” Climate Policy Journal, June 2011. 63. Sohel Pasha, “UNFCCC Regional Collaboration Centre (RCC),” presentation to the Caribbean Sustainable Energy Roadmap and Strategy (C-SERMS) Resource Mobilisation Forum, Christ Church, Barbados, 11 July 2013.64. Ibid.65. Ibid.66. GEF Small Grants Programme, “Country Profile for Haiti,” sgp.undp.org/index.php?option=com_countrypages&view=countrypage&country=128&Itemid=204, viewed 16 July 2014. 67. Table 7.4 from Richard W. Caperton, “Leveraging Private Finance for Clean Energy” (Washington, DC: Center for American Progress, Global Climate Network, November 2010).68. Table 7.5 from ibid.69. Center for Economic and Policy Research, “Haiti Using Funds from PetroCaribe to Finance Reconstruction,” 17 April 2012, www.cepr.net.

178 | Haiti Sustainable Energy Roadmap
70. Ibid.71. Ibid.72. Haitian Ministry of Finance, “Direction générale du budget état des décaissements pour les projets financés par le fonds Petrocaribe” (Port-au-Prince: 28 February 2013). 73. Ibid.74. IFC, op. cit. note 25.75. U.S.-based solar energy developer, personal communication with Worldwatch, March 2013.76. IFC, op. cit. note 25.77. Government of the Republic of Haiti, op. cit. note 5. 78. Rene Maldonado and Maria Luisa Hayem, Remittances to Latin America and the Caribbean in 2012: Differing Behavior Across Subregions (Washington, DC: IDB Multilateral Investment Fund, 2013). 79. Ibid., p. 21.80. Ibid.81. Julia Hawkins, “Financing Sustainable Energy: An Optimistic View from Niki Armacost,” The Ashden Blog, 11 July 2012, www.ashden.org.82. Manuel Orozco and Rebecca Rouse, “Migrant Hometown Associations and Opportunities for Development: A Global Perspective,” Migration Information Source, February 2007, www.migrationinformation.org/feature/display.cfm?ID=579.83. Nara Meli, “Where Innovation Pays Off: Helping Low-income Haitians Access Environmentally Friendly Energy Products” (Washington, DC: IDB Multilateral Investment Fund, 19 November 2012). 84. IDB, “Financing Sustainable Energy Through Remittance Flows in Haiti and the Dominican Republic,” (Washington, DC: December 2009).85. Sidebar 7.2 from Simon Rolland and Carlos Guerroro, Hybrid Mini-Grids for Rural Electrification: Lessons Learned (Brussels: Alliance for Rural Electrification), p. 28.86. EarthSpark International, “Microgrids - Eko Pwòp – Elektrisite Kominote - Community Electricity,” www.earth sparkinternational.org/eko-pwogravep-microgrids.html.87. Table 7.6 from GVEP International, “The History of Mini-grid Development in Developing Countries” (London: September 2011).88. National Rural Electric Cooperative Association, “NRECA and U.S. Electric Co-ops Continue to Support Electrification in Haiti,” www.nreca.coop/what-we-do/international-programs/country-projects/haiti/, viewed 16 July 2014.
8. Building an Effective Policy Framework to Harness Sustainable Energy Opportunities in Haiti 1. Xing Fu-Bertaux, “The Fifth ‘E’: Is Energy Becoming a Presidential Priority in Haiti?” ReVolt (Worldwatch Institute blog), 7 November 2011.2. Haitian Ministry of Public Works, Transportation and Communications (MTPTC), Bureau of Mines and Energy (BME), and Électricité d’Haïti (EDH), National Energy Sector Development Plan: Intermediate Version (NESDP-i), (Port-au-Prince: February 2011). 3. Ibid., p. 184. Ibid., p. 16.5. MTPTC, BME, and EDH, “Avant-Projet de Politique Energétique de la République d’Haïti : Ebauche 9” (Port-au-Prince: January 2012). 6. Ibid. 7. Caribbean Community (CARICOM), CARICOM Energy Policy, Draft Revision 4 (Georgetown, Guyana: June 2012), p. 16. 8. Ibid., pp. 16–17. 9. “Haiti Rejoins Caribbean Community,” Caribbean Net News, 9 June 2006, www.caribbeannewsnow.com. 10. MTPTC, BME, and EDH, op. cit. note 5.
Endnotes | 179
11. EDH representatives, personal communication with Worldwatch, Port-au-Prince, February 2013. 12. René Jean-Jumeau, “Electricité Rurale en Haiti: Orientations pour l’amélioration de l’accès nationale à l’électricité,” August 2010. 13. MTPTC, BME, and EDH, op. cit. note 5.14. Existing demand projection models routinely do not consider approximately 75% of the Haitian population, meaning that even if the country developed its power system to meet demand projections, a majority of the population would remain without access.15. EDH representatives, op. cit. note 11.16. MTPTC, personal communication with Worldwatch, Port-au-Prince, February 2013. 17. Government of Haiti, Action Plan for National Recovery and Development of Haiti (Port-au-Prince: March 2010). 18. CARICOM Secretariat, “Haiti ‘More Involved’ in the Community – President Martelly,” press release (Georgetown, Guyana: 13 June 2013). 19. MTPTC, BME, and EDH, op. cit. note 2.20. MTPTC, op. cit. note 16.21. International Crisis Group, “Governing Haiti: Time for National Consensus,” Latin America and Caribbean Report No. 46 (Brussels: 4 February 2013); Elizabeth Abbot, “The Ghosts of Duvalier,” Foreign Policy, 19 January 2011. 22. Worldwatch Institute, Breakout Session, Sustainable Energy Roadmap Stakeholder Consultation, Port-au-Prince, 21 February 2013.23. Deutsche Gesellschaft für Internationale Zusammenarbeit (GIZ) representative, personal communication with Worldwatch, Port-au-Prince, February 2013; MTPTC representative, personal communications with Worldwatch, Port-au-Prince, 10–20 July 2011. 24. EDH representatives, op. cit. note 11.25. World Bank, “Implementation Status & Results, Haiti, Rebuilding Energy Infrastructure and Access (P127203)” (Washington, DC: 15 January 2013).26. S. Carrillo, “Assessing Governance and Strengthening Capacity in Haiti,” Capacity Development Briefs (Washington, DC: World Bank Institute, December 2007), p. 25. 27. LaSean Brown et al., “Growing the Middle: Strategies for Job Creation and SME Development in Haiti” (Princeton, NJ: Woodrow Wilson School of Public & International Affairs, Princeton University, 2011), p. 13.28. Vijaya Ramachandran and Julie Walz, Haiti: Where Has All the Money Gone? Policy Paper 004 (Washington, DC: Center for Global Development, May 2012). 29. MTPTC, op. cit. note 16.30. MTPTC, BME, and EDH, op. cit. note 5.31. S. Jackson, “Paulwell Sets Up Energy Council,” The Gleaner, 12 February 2012, jamaica-gleaner.com.32. Shakuntala Makhijani et al., Jamaica Sustainable Energy Roadmap: Pathways to an Affordable, Reliable, Low-Emission Electricity System (Washington, DC: Worldwatch Institute, 2013). 33. MTPTC, op. cit. note 16.34. Haitian Ministry of Planning and External Cooperation, Cadre de Coordination de l’Aide Externe au Développement d’Haiti (CAED) (Port-au-Prince: September 2012). 35. Government of Sierra Leone, “Aid Policy,” unipsil.unmissions.org/portals/unipsil/media/publications/sl_aid_policy .pdf, viewed 1 August 2013. 36. EDH representatives, op. cit. note 11.37. MTPTC, BME, and EDH, op. cit. note 2.38. EDH representatives, op. cit. note 11.39. Worldwatch Institute, op. cit. note 22.40. Caribbean Energy Information System, www.ceis-caribenergy.org, viewed 18 June 2013.41. U.S. Department of State, 2013 Investment Climate Statement – Haiti (Washington, DC: 2013).42. Brown et al., op. cit. note 27, p. 17. 43. T. Beierle and J. Crawford, Public Participation in Environmental Decisions (Washington, DC: Resources for the
180 | Haiti Sustainable Energy Roadmap
Future, 2002), as cited in S. Nakhooda, S. Dixit, and N.K. Dubash, Empowering People: A Governance Analysis of Electricity; India, Indonesia, Philippines, Thailand (Washington, DC: World Resources Institute, 2007).44. California Energy Commission, “Cool Roofs and Title 24,” www.energy.ca.gov/title24/coolroofs/, viewed 20 February 2014.45. City of New York, “Local Laws of the City of New York for the Year 2011” (New York: 2011).46. Republic of Trinidad and Tobago, Act No. 13 of 2010 (Port of Spain: 13 December 2010).47. MTPTC, BME, and EDH, National Energy Sector Development Plan 2007–2017 (Port-au-Prince: November 2006), p. 8. 48. Ibid., p. 7. 49. Ibid., p. 7. 50. Clean Energy Solutions Center, “Toward Energy Access in Haiti,” webinar presented by National Renewable Energy Laboratory (NREL), 16 January 2014, at cleanenergysolutions.org/training/towards-energy-access-in-haiti.51. Operation Khanyisa Web site, www.operationkhanyisa.co.za, viewed 6 November 2013.52. Operation Khanyisa, “Eskom Recovers Over R243 Million Since Launch of Operation Khanyisa,” press release (Johannesburg, South Africa: 22 August 2013). 53. Worldwatch Institute, op. cit. note 2254. EDH, “Pour le sélection d’investisseurs stratégiques pour la production, le transport, la distribution et la commercialisation d’électricité dans le département du Sud-est,” open call No. AOI/EDH/SE/2014, Le Nouvelliste, 24 June 2014. 55. Simon Rolland and Carlos Guerroro, Hybrid Mini-Grids for Rural Electrification: Lessons Learned (Brussels: Alliance for Rural Electrification, March 2011), p. 7.56. Comisión Nacional de Energía, “Law 57-07” (Santo Domingo: 2007). 57. International Finance Corporation (IFC) representatives, personal communications with Worldwatch, 2013.58. MTPTC, BME, and EDH, Avant-Projet de Politique Energétique de la République d’Haïti (Ebauche 7) (Port-au-Prince: January 2008), p. 17. 59. EDH representatives, op. cit. note 11.60. Sabah Abdullah, “Rural Electrification Programmes in Kenya: Policy Conclusion from a Valuation Study” (Bath, U.K.: University of Bath, Department of Economics, 2009).61. Ibid.62. “Electricite d’Haiti to Implement Pre-Pay Requirements,” The Sentinel (Port-au-Prince), 10 October 2013.63. Rolland and Guerroro, op. cit. note 55, p. 7.64. Ibid., p. 31. Case Study 7 from the following sources: “Ban m limyè Ban m lavi” status in 2013 from MTPTC, op. cit. note 16; quotes about rural electrification subsidies and history of Costa Rica from D. Barnes, “Meeting the Challenge of Rural Electrification in Developing Nations: The Experience of Successful Programs” (Washington, DC: World Bank, 2005); Martelly quote from “Martelly promised electricity to 200,000 homes,” HaitiMega, 29 January 2012, www.haiti mega.com65. Charles Kirubi, “Community-Based Electric Micro-Grids Can Contribute to Rural Development: Evidence from Kenya,” World Development (2009), p. 10.66. GIZ representative, op. cit. note 23.

! A-1
Appendix I. Summary of Past Renewable Energy Resource Assessments
Resource Name Date Description Wind
Atlas Eolien d'Haïti Préparé Par Winergy–3E
July 2009
National wind assessment at 50-meter hub height.
Waste-to-Energy
Haiti Waste to Energy Opportunity Analysis (NREL)
November 2010
Exploration of waste levels and potential for waste-to-energy power plants in the most populated parts of Haiti, including an economic analysis of these sites.
Hydro Soleo Energies Hydro Assessment
N/A Resource-potential assessment by hydroengineer Francis Mitchell, suggesting that there is at least 102 MW of additional hydro capacity in Haiti, which could produce up to 896 GWh annually. The assessment evaluates 140 sites, covering each of Haiti’s 10 provinces. Rather than evaluating the entire nation’s hydro capacity, it measures the capacity for watersheds where precipitation and evapotranspiration data were readily available from past studies.
Solar Haiti – Solar Resource Characterization (NREL)
November 2010
Assessment of global horizontal irradience (GHI) for the entire country at 10-kilometer resolution.
Wind Haiti – Wind Resource Characterization (NREL)
November 2010
National wind assessment at 80-meter hub height.
Biomass Anaerobic Digestion of Biowastes – An Alternative Energy Source for Haiti
N/A Assessment of the biogas potential for Haiti.
Waste-to-Energy
Feasability Study for the Construction of 25 Full Scale Biodigestors in the Area of Bel Air and Surroundings
March 2011
Assessment of the potential for small biodigesters in a part of Port-au-Prince.

! A-2
Appendix II. 3TIER Solar Assessment Methodology To assess an area’s solar energy potential, Worldwatch relies on satellite data as well as data generated from proprietary models of solar irradiance. 3TIER, for example, bases its datasets on 15-plus years of half-hourly, high-resolution (3-kilometer) satellite imagery. 3TIER processes the imagery to create hourly values for irradiance, wind speed, and temperature, allowing the company to generate annual and monthly means and to track variations in daily patterns throughout the year. 3TIER’s datasets provide three key measurements of solar energy that together provide the information necessary for developing solar photovoltaic and solar thermal projects: global horizontal irradiance (GHI), direct normal irradiance (DNI), and diffuse horizontal irradiance (DIF). (See Table A–1.) Using these data on monthly and daily variations, it is then possible to determine energy generation potential. The analysis compares monthly variation in solar generation potential to overall electricity demand throughout the year, and the daily variation for each month against the hours of peak demand in the study area. The solar assessment also measures hourly temperatures and wind speeds, as these factors affect generation from PV systems, most of which experience significant power degradation when the unit’s temperature rises.1 Table A–1. Key Measurements of Irradiation and Their Application to Solar Resource Analysis
Measurement Description Application GHI Total solar radiation per unit area that
is intercepted by a flat, horizontal surface.
Of particular interest to PV installations, as it includes both direct beam radiation (radiation directly from the sun) and diffuse radiation (radiation scattered from all directions).
DNI Total direct beam solar radiation per unit area that is intercepted by a flat surface that is at all times pointed in the direction of the sun.
Of particular interest to concentrating solar power installations and installations that track the position of the sun.
DIF Diffuse solar radiation per unit area that is intercepted by a flat, horizontal surface that is not subject to any shade or shadow and does not arrive on a direct path from the sun.
Of particular interest to some PV installations which are best suited to diffuse radiation.
3TIER’s solar analysis is intended to be used for the purposes of planning the country’s central transmission and generation mix, as well as to provide a window into the aggregate potential of the studied regions and the effects of geographic dispersion on fluctuations in generation. It is too coarse to capture the small area phenomena that can cause dramatic wind acceleration or slowdown and therefore deviations from estimated generation. However, these issues would be examined in the logical next step of site-specific evaluation. It is at this stage that observational data and further modeling could be used in solar calculations to obtain a more accurate understanding of a site’s potential.

! A-3
Appendix III. Solar Assessments by Zone Cul de Sac The Plaine de Cul-de-Sac is a fertile lowland in southeastern Haiti. Considered part of greater Port-au-Prince, certain areas lie below sea level and are consequently at risk for flooding. Because Cul de Sac represents one of the country’s main productive agricultural plains, it remains central to Haiti’s development. Cul de Sac’s solar resource is very strong by global standards, and has the greatest potential of the six sites studied in this report. The long-term mean GHI (1997-2011) is 5.79 kWh/m2/day (241.5 W/m2). (See Figure A–1.) This compares favorably with most of the rest of the Caribbean region and is significantly higher than the insolation in the areas of Europe and Asia where solar power penetration is currently highest. In Germany, for example, few locations have a GHI over 3.0 kWh/m2/day, and virtually nowhere is the GHI above 3.5.
Figure A–1. Annual Mean GHI and DNI at Cul de Sac The site’s DNI is 5.60 kWh/m2/day (233.4 W/m2), again strong globally. (See Figure A–1.) Cul de Sac’s mean DIF is 1.91 kWh/m2/day (79.6 W/m2). Compared to other areas in Haiti, Cul de Sac has strong solar resources. Monthly mean GHI varies substantially throughout the year. (See Figure A–2.) It is highest in April, June, and July, with July’s average the greatest at 6.57 kWh/m2/day (273.9 W/m2). GHI remains high in March, May, August, and September, ranging from 5.92 to 6.34 kWh/m2/day. It dips throughout the rest of the year, reaching a low of 4.54 kWh/m2/day in December, although this is still much higher than many parts of the world with solar development.

! A-4
Monthly mean DNI peaks in January, February, and March, with a high of 6.27 kWh/m2/day in February. DNI remains relatively constant throughout the year, with the low monthly mean occurring in October at 5.23 kWh/m2/day. DNI is strong overall in Cul de Sac, although monthly means are much more variable than GHI from year-to-year. During the course of the day, GHI peaks in the early afternoon throughout the year, highest between 11 a.m. and 2 p.m. and usually peaking between noon and 1 p.m. (See Figure A–2.) The peak hourly mean is consistently over three times the daily mean. DNI is also highest during the middle of the day, reaching its summit between 11 a.m. and noon, but because it involves tracking the sun’s movement, the peaks more closely resemble plateaus that last from 9 a.m. to 3 p.m. The average gross annual yield for one Aleo Solar S16 175 module in Cul de Sac—which has a Standard Test Condition power rating of 175 W—is 413.2 kWh. A one-square-kilometer area could produce around 149.9 GWh annually.
Figure A–2. Seasonal and Diurnal Variability of GHI and DNI at Cul de Sac L’île de la Tortue L’île de la Tortue is a mountainous island off Haiti’s northern coast. L’îlle de la Tortue’s solar resource is very strong by global standards, despite having the least potential of the sites studied in this report. The long-term mean GHI (1997-2011) is 5.47 kWh/m2/day (228.0 W/m2). (See Figure A–3.) This compares favorably with most of the rest of the Caribbean region and is

! A-5
significantly higher than the insolation in the areas of Europe and Asia where solar power penetration is currently highest. In Germany, for example, few locations have a GHI over 3.0 kWh/m2/day, and virtually nowhere is the GHI above 3.5. The site’s DNI is 5.06 kWh/m2/day (210.7 W/m2), again strong globally. (See Figure A–3.) L’île de la Tortue’s mean DIF is 1.97 kWh/m2/day (81.9 W/m2). Compared to other areas assessed in Haiti, L’île de la Tortue has relative lower but still very strong solar resources. Monthly mean GHI varies more throughout the year for L’île de la Tortue than any other site studied. (See Figure A–4.) It is highest from June-August, with July’s average the greatest at 6.68 kWh/m2/day (278.3 W/m2). GHI remains high in April, May, and September, ranging from 6.03 to 6.22 kWh/m2/day. It dips substantially in November, December, and January, however, reaching a low of 3.79 kWh/m2/day in December, although this is still higher than many parts of the world with solar development.
Figure A–3. Annual Mean GHI and DNI at L’île de la Tortue Monthly mean DNI peaks in June-September, with a high of 5.67 kWh/m2/day in August. DNI varies more in L’île de la Tortue than other study sites in Haiti, with the low monthly mean occurring in December at 4.28 kWh/m2/day. DNI monthly means, however, are much more variable than GHI from year-to-year.

! A-6
Figure A–4. Seasonal and Diurnal Variability of GHI and DNI at L’île de la Tortue During the course of the day, GHI peaks in the early afternoon throughout the year, highest between 10 a.m. and 2 p.m. and usually peaking between noon and 1 p.m. (See Figure A–4.) The peak hourly mean is consistently over three times the daily mean. DNI is also highest during the middle of the day, but because it involves tracking the sun’s movement, the peaks more closely resemble plateaus that last from 9 a.m. to 4 p.m. The average gross annual yield for one Aleo Solar S16 175 module in L’île de la Tortue—which has a Standard Test Condition power rating of 175 W—is 391.8 kWh. A one-square-kilometer area could produce around 142.2 GWh annually. Parc Sonapi Parc Sonapi, located near the airport and the port of Port-au-Prince, is the site of one of several industrial parks in Haiti. Parc Sonapi has been a center of Haiti’s garment manufacturing and assemblage industries. Given the park’s role in the country’s industrial and economic development, reliable and affordable power supply is of high importance. Parc Sonapi’s solar resource is very strong by global standards, and has the second most potential of the sites studied in this report. The long-term mean GHI (1997-2011) is 5.71 kWh/m2/day (237.8 W/m2). (See Figure A–5.) This compares favorably with most of the rest of the Caribbean region and is significantly higher than the insolation in the areas of Europe and

! A-7
Asia where solar power penetration is currently highest. In Germany, for example, few locations have a GHI over 3.0 kWh/m2/day, and virtually nowhere is the GHI above 3.5. The site’s DNI is 5.44 kWh/m2/day (226.5 W/m2), again strong globally. (See Figure A–5.) Parc Sonapi’s mean DIF is 1.95 kWh/m2/day (81.2 W/m2). Compared to other areas assessed in Haiti, Parc Sonapi has strong solar resources.
Figure A–5. Annual Mean GHI and DNI at Parc Sonapi Monthly mean GHI varies substantially throughout the year. (See Figure A–6.) It is highest in April, June, and July, with July’s average the greatest at 6.50 kWh/m2/day (270.8 W/m2). GHI remains high in March, May, August, and September, ranging from 5.85 to 6.24 kWh/m2/day. It dips in November-January, reaching a low of 4.49 kWh/m2/day in December, although this is still much higher than many parts of the world with solar development. Monthly mean DNI peaks in January-April, with a high of 6.06 kWh/m2/day in February. DNI remains relatively constant throughout the year, with the low monthly mean occurring in October at 4.99 kWh/m2/day. DNI monthly means, however, are much more variable than GHI from year-to-year.

! A-8
Figure A–6. Seasonal and Diurnal Variability of GHI and DNI at Parc Sonapi During the course of the day, GHI peaks in the early afternoon throughout the year, highest between 10 a.m. and 2 p.m. and usually peaking between noon and 1 p.m. (See Figure A–6.) The peak hourly mean is consistently over three times the daily mean. DNI is also highest during the middle of the day, but because it involves tracking the sun’s movement, the peaks more closely resemble plateaus that last from 9 a.m. to 4 p.m. DNI reaches its peak between 11 a.m. and noon. The average gross annual yield for one Aleo Solar S16 175 module in Parc Sonapi—which has a Standard Test Condition power rating of 175 W—is 405.5 kWh. A one-square-kilometer area could produce around 147.1 GWh annually. Péligre Lac Péligre is a large manmade reservoir located on the Artibonite River, created in the process of constructing the Péligre Hydroelectric facility in the 1950s. Located in Haiti’s Centre Department and surrounded by mountainous terrain, Lac Péligre is the second largest lake in the country. Péligre’s solar resource is very strong by global standards. The long-term mean GHI (1997–2011) is 5.71 kWh/m2/day (237.8 W/m2). (See Figure A–7.) This compares favorably with most of the rest of the Caribbean region and is significantly higher than the insolation in the areas of
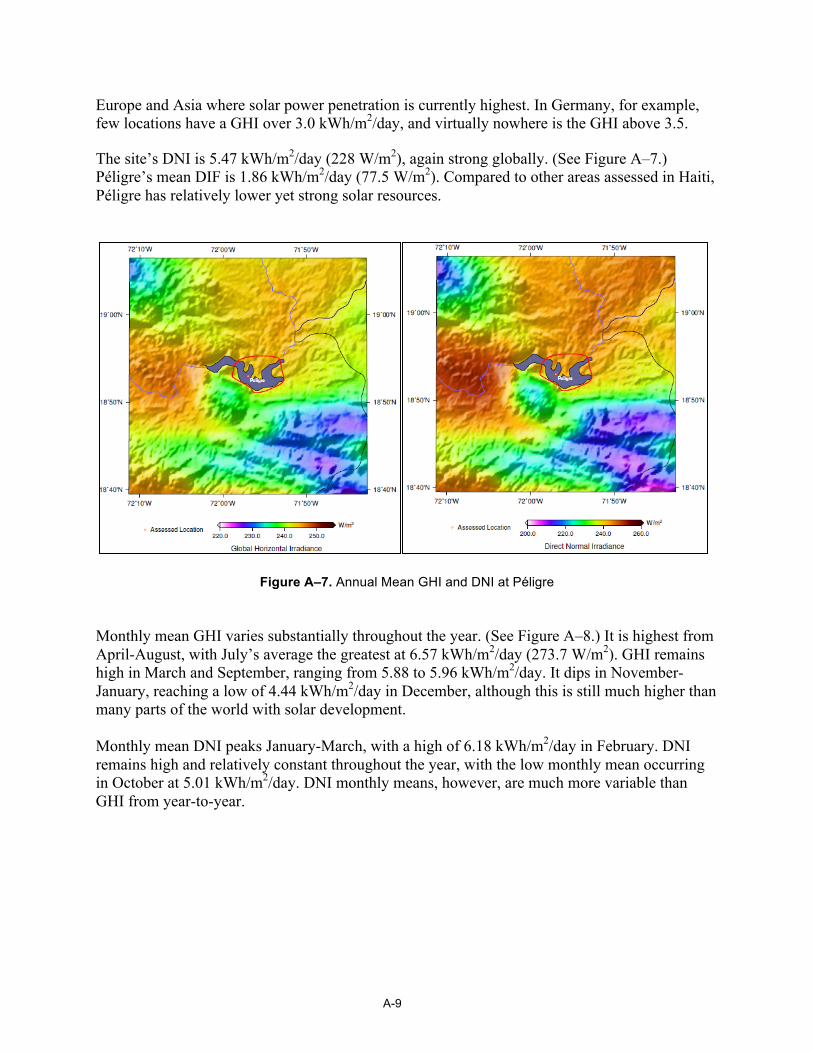
! A-9
Europe and Asia where solar power penetration is currently highest. In Germany, for example, few locations have a GHI over 3.0 kWh/m2/day, and virtually nowhere is the GHI above 3.5. The site’s DNI is 5.47 kWh/m2/day (228 W/m2), again strong globally. (See Figure A–7.) Péligre’s mean DIF is 1.86 kWh/m2/day (77.5 W/m2). Compared to other areas assessed in Haiti, Péligre has relatively lower yet strong solar resources.
Figure A–7. Annual Mean GHI and DNI at Péligre Monthly mean GHI varies substantially throughout the year. (See Figure A–8.) It is highest from April-August, with July’s average the greatest at 6.57 kWh/m2/day (273.7 W/m2). GHI remains high in March and September, ranging from 5.88 to 5.96 kWh/m2/day. It dips in November-January, reaching a low of 4.44 kWh/m2/day in December, although this is still much higher than many parts of the world with solar development. Monthly mean DNI peaks January-March, with a high of 6.18 kWh/m2/day in February. DNI remains high and relatively constant throughout the year, with the low monthly mean occurring in October at 5.01 kWh/m2/day. DNI monthly means, however, are much more variable than GHI from year-to-year.

! A-10
Figure A–8. Seasonal and Diurnal Variability of GHI and DNI at Péligre During the course of the day, GHI peaks in the early afternoon throughout the year, highest between 10 a.m. and 2 p.m. and usually peaking between 11 a.m. and 1 p.m. (See Figure A–8.) The peak hourly mean is consistently over three times the daily mean. DNI is also highest during the middle of the day, but because it involves tracking the sun’s movement, the peaks more closely resemble plateaus that last from 9 a.m. to 3 p.m. DNI reaches its peak between 11 a.m. and noon. The average gross annual yield for one Aleo Solar S16 175 module in Péligre—which has a Standard Test Condition power rating of 175 W—is 392.3 kWh. This is the lowest potential production of any site studied in this report, which is due to Péligre having lower wind speeds than the other five study sites. Wind helps to cool down solar PV cells, which leads to greater electricity production. A one-square- kilometer area could produce around 142.3 GWh annually. Port-de-Paix Port-de-Paix is a city on Haiti’s northern coast. Port-de-Paix’s solar resource is very strong by global standards. The long-term mean GHI (1997–2011) is 5.58 kWh/m2/day (232.4W/m2). (See Figure A–9.) This compares favorably with most of the rest of the Caribbean region and is significantly higher than the insolation in the areas of Europe and Asia where solar power

! A-11
penetration is currently highest. In Germany, for example, few locations have a GHI over 3.0 kWh/m2/day, and virtually nowhere is the GHI above 3.5. The site’s DNI is 5.26 kWh/m2/day (219.1 W/m2), again strong globally. (See Figure A–9.) Port-de-Paix’s mean DIF is 1.94 kWh/m2/day (81.0W/m2). Compared to other areas assessed in Haiti, Port-de-Paix has strong solar resources.
Figure A–9. Annual Mean GHI and DNI at Port-de-Paix Monthly mean GHI varies substantially throughout the year; it varies more only in L’île de la Tortue. (See Figure A–10.) It is highest during June-August, with July’s average the greatest at 6.73 kWh/m2/day (280.4W/m2). GHI remains high in April, May, and September, ranging from 5.96 to 6.31 kWh/m2/day. It dips relatively substantially during November-January, reaching a low of 3.96 kWh/m2/day in December, although this is still higher than many parts of the world with solar development. Monthly mean DNI peaks in April, June, July, and August, with a high of 5.73 kWh/m2/day in April. DNI remains relatively constant throughout the year, with the low monthly mean occurring in December at 4.57 kWh/m2/day. DNI monthly means, however, are much more variable than GHI from year-to-year.

! A-12
Figure A–10. Seasonal and Diurnal Variability of GHI and DNI at Port-de-Paix During the course of the day, GHI peaks in the early afternoon throughout the year, highest between 10 a.m. and 2 p.m. and usually peaking between noon and 1 p.m. (See Figure A–10.) The peak hourly mean is consistently over three times the daily mean. DNI is also highest during the middle of the day, but because it involves tracking the sun’s movement, the peaks more closely resemble plateaus that last from 9 a.m. to 4 p.m. DNI reaches its peak between 11 a.m. and noon. The average gross annual yield for one Aleo Solar S16 175 module Port-de-Paix—which has a Standard Test Condition power rating of 175 W—is 403.7 kWh. A one-square-kilometer area could produce around 146.5 GWh annually.

! A-13
Appendix IV. 3TIER Wind Assessment Methodology As with solar, Worldwatch relies on data generated from proprietary models to develop our wind resource assessments. The mapping company 3TIER, for example, generates wind resource assessments by means of 25 years of simulated data (January 1987–March 2012) from a mesoscale numerical weather prediction (NWP) model of the atmosphere. Two different model runs are used to create the dataset. First, a 25-year run on a 4,500 meter resolution is done to model long-term variability, and second, a one-year run is done at a 2,000 meter resolution where the year of each calendar day is chosen sequentially from 2001 to 2010. A second dataset is then downscaled to a 200-meter resolution using 3TIER’s proprietary Time Varying Microscale (TVM) model. The NWP model represents the roughness of the underlying terrain or water, heat and moisture fluxes into the atmosphere, stability and turbulence within the boundary layer, and wind shear. The coarser grid is used to highlight the effect of general weather patterns on the site, as well as to model regional and thermally driven circulations. The finer grids are used to model the impact of local terrain and local scale atmospheric circulations on the sites. Under ideal conditions, each 4.5 by 4.5 kilometer grid point in the 3TIER analysis could hold 40 wind turbines in four rows of 10. Practical considerations such as difficult terrain, aesthetic design considerations, and wake losses (due to interrupted wind flow for wind turbines downstream of other turbines on the same wind farm), however, often make such turbine density unrealistic. It is therefore common to use a Project Layout Discount Factor (PLDF) to account for limitations. Experience shows that the typical spacing for a wind farm might allow for approximately 20 turbines in a 4.5 by 4.5 kilometer area (equaling a PLDF of 50%). 3TIER’s calculations of wind power potential assume the use of a 1.5 MW General Electric 1.6-100 turbine (a common model) that is operated at the highest efficiency point, using an “effective wind speed” derived from wind speed, temperature, and pressure data modeled at 10-minute intervals. The result is a capacity factor estimate for each grid point, which measures the amount of power potentially generated compared with the installed capacity of the generation plant. For example, if a 1.5 MW turbine generated 0.5 MW of electricity on average, the capacity factor would be one-third, or 33%.

! A-14
Appendix V. Wind Assessment by Zone La Gonâve La Gonâve is an island located to the west-northwest of Port-au-Prince, covering more than 700 square kilometers and home to approximately 80,000 inhabitants. La Gonâve has decent wind potential and the second lowest average wind speed of any site assessed in this study. Fourteen points were assessed for La Gonâve, with an average wind speed across all points of 5.62 m/s at a height of 80 meters over a 25-year period. (See Figure A–11.) Over this same 25-year period, the average CF for all sites was 0.307 at a hub height of 80 meters.
Figure A–11. Average Wind Speed in La Gonâve Wind speeds are greatest in La Gonâve from May to August, with an average wind speed of about 7 m/s in Hune, and an average greater than 6 m/s in the other three months. The average CF exceeds 0.4 in May, June, and July. (See Figure A–12.) April and October have the lowest average wind speeds and are the only months where the average speed falls below 5 m/s, which translates to an average CF of under 0.2 during each month.
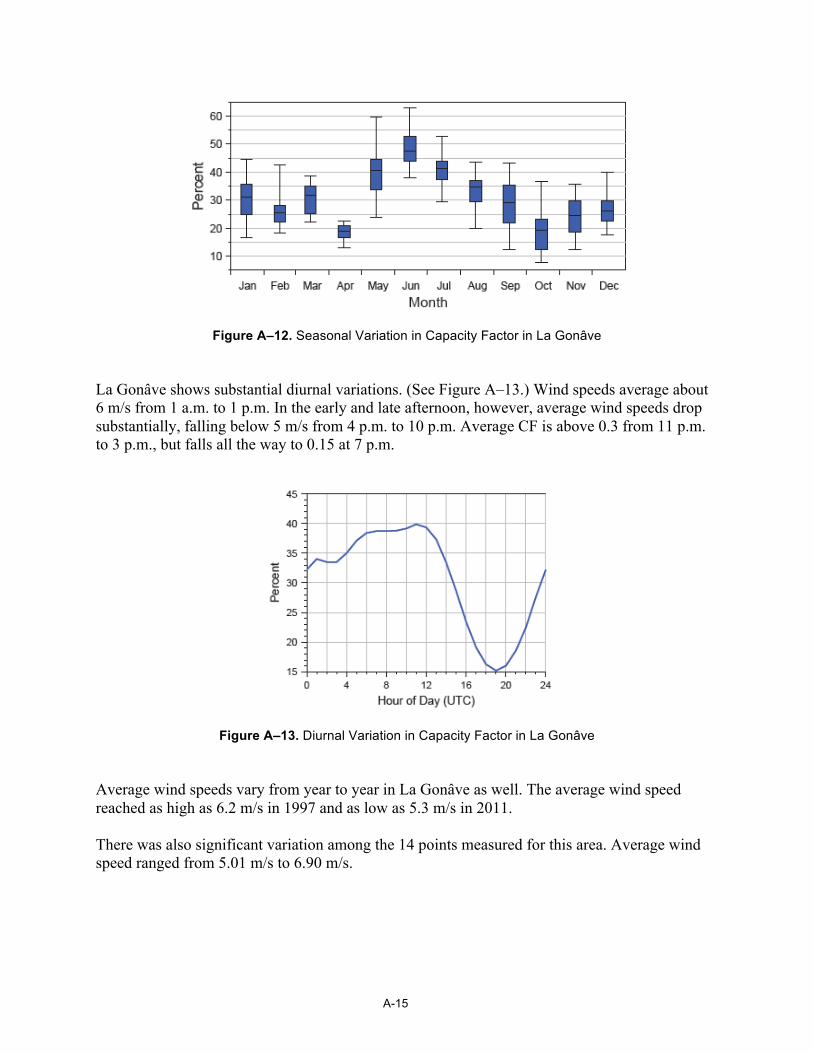
! A-15
Figure A–12. Seasonal Variation in Capacity Factor in La Gonâve La Gonâve shows substantial diurnal variations. (See Figure A–13.) Wind speeds average about 6 m/s from 1 a.m. to 1 p.m. In the early and late afternoon, however, average wind speeds drop substantially, falling below 5 m/s from 4 p.m. to 10 p.m. Average CF is above 0.3 from 11 p.m. to 3 p.m., but falls all the way to 0.15 at 7 p.m.
Figure A–13. Diurnal Variation in Capacity Factor in La Gonâve Average wind speeds vary from year to year in La Gonâve as well. The average wind speed reached as high as 6.2 m/s in 1997 and as low as 5.3 m/s in 2011. There was also significant variation among the 14 points measured for this area. Average wind speed ranged from 5.01 m/s to 6.90 m/s.

! A-16
Mole Saint-Nicolas Mole Saint-Nicolas is located on Haiti’s northwestern coast. Mole Saint-Nicolas has tremendous wind potential and the highest average wind speed of any site assessed in this study. Eight points were assessed for Mole Saint-Nicolas, with an average wind speed across all points of 6.55 m/s at a height of 80 meters over a 25-year period. (See Figure A–14.) Over this same 25-year period, the average CF for all sites was 0.438 at a hub height of 80 meters.
Figure A–14. Average Wind Speed in Mole Saint-Nicolas Wind speeds are greatest in Mole Saint-Nicolas in January, July, and December, with an average wind speed of at least 7 m/s during these months. This corresponds to an average CF of at least 0.5 during these months. (See Figure A–15.) October has the lowest average wind speed, the only month where average wind speed falls below 6 m/s, which translates to an average CF of just over 0.3.

! A-17
Figure A–15. Seasonal Variation in Capacity Factor in Mole Saint-Nicolas Mole Saint-Nicolas shows substantial diurnal variation. (See Figure A–16.) Wind speeds peak from 11 p.m. to 1 a.m., when they reach about 8 m/s. Wind speeds are lowest during the middle of the day, falling below 6 m/s from 8 a.m. to 5 p.m., and dipping below 5 m/s from 1 p.m. to 3 p.m.
Figure A–16. Diurnal Variation in Capacity Factor in Mole Saint-Nicolas Average wind speeds vary from year to year in Mole Saint-Nicolas as well. The average wind speed reached as high as 7.5 m/s in 2004 and as low as 6.1 m/s in 2003. There was also significant variation amongst the eight points measured for this area. Average wind speed ranged from 6.01 m/s to 7.26 m/s. It is important to keep in mind that the lower end of this range (CF of 0.372) would still be commercially viable for a wind farm.

! A-18
Morne à Cabrits Morne à Cabrits has good wind potential and the second highest average wind speed of any site assessed in this study. Six points were assessed for Morne à Cabrits, with an average wind speed across all points of 7.32 m/s at a height of 80 meters over a 25-year period. (See Figure A–17.) Over this same 25-year period, the average CF for all sites was 0.501 at a hub height of 80 meters.
Figure A–17. Average Wind Speed in Morne à Cabrits Wind speeds are greatest in Morne à Cabrits from June to August, with an average wind speed of at least 8 m/s in all three months. (See Figure A–18.) June and July each have an average CF of at least 0.65. October has the lowest average wind speed, although it is still above 6 m/s, which translates to an average CF above 0.35.

! A-19
Figure A–18. Seasonal Variation in Capacity Factor in Morne à Cabrits Morne à Cabrits shows less diurnal variation than some of the other sites. (See Figure A–19.) Average wind speeds peak in the evening from 6 p.m. to midnight, surpassing 8 m/s at around 11 p.m. They dip below 7 m/s from 5 a.m. to 2 p.m., although the average CF never falls below 0.4 during an hour.
Figure A–19. Diurnal Variation in Capacity Factor in Morne à Cabrits Average wind speeds vary from year-to-year in Morne à Cabrits as well. The average wind speed reached as high as 6.6 m/s in 2006 and as low as 7.9 m/s in 1991. There was little variation among the six points measured for this area. Average wind speed ranged from 6.91 m/s to 7.63 m/s. It is important to keep in mind that the lower end of this range (CF of 0.457) would still be commercially viable for a wind farm.

! A-20
Morne Vent Morne Vent has the least potential of any site assessed in this study. Four points were assessed for Morne Vent, with an average wind speed across all points of 5.08 m/s at a height of 80 meters over a 25-year period. (See Figure A–20.) Over this same 25-year period, the average CF for all sites was 0.265 at a hub height of 80 meters.
Figure A–20. Average Wind Speed in Morne Vent Wind speeds are greatest in Morne Vent in November, December, and January, although the average wind speed does not exceed 6 m/s in any of these months. This corresponds to an average CF of less than 0.35 during these months. (See Figure A–21.) October has the lowest average wind speed, about 4.3 m/s, which translates to an average CF of about 0.17.
Figure A–21. Seasonal Variation in Capacity Factor in Morne Vent

! A-21
Morne Vent shows tremendous diurnal variation. (See Figure A–22.) Average wind speeds peak late at night from about 8 p.m. to 1 a.m., and fall significantly in the middle of the day, falling below 4 m/s from noon to 3 p.m. The average CF goes above 0.40 from 9 p.m. to 11 p.m., but is below 0.30 from 4 a.m. to 7 p.m.
Figure A–22. Diurnal Variation in Capacity Factor in Morne Vent Average wind speeds vary from year to year in Morne Vent as well. The average wind speed reached as high as 7.75 m/s in 2004 and as low as 4.7 m/s in 2003. There was also significant variation among the four points measured for this area. Average wind speed ranged from 3.84 m/s to 6.39 m/s. So while overall this region does not appear to have commercially viable wind potential, the point with the highest average wind speed has an average CF of 0.417. Tiburon Tiburon has moderate wind potential. Eight points were assessed for Tiburon, with an average wind speed across all points of 5.33 m/s at a height of 80 meters over a 25-year period. (See Figure A–23.) Over this same 25-year period, the average CF for all sites was 0.304 at a hub height of 80 meters.

! A-22
Figure A–23. Average Wind Speed in Tiburon Wind speeds are greatest in Tiburon from May to July, with an average wind speed of greater than 7 m/s in June. This corresponds to an average CF of at least 35% during these months, and greater than 50% in June. (See Figure A–24.) February-April and October and November have the lowest average wind speeds, all with average wind speeds below 5 m/s. This translates to an average CF below 0.25 for each of these months.
Figure A–24. Seasonal Variation in Capacity Factor in Tiburon Tiburon shows fairly significant diurnal variation. (See Figure A–25.) It peaks in the late afternoon from about 3 p.m. to 7 p.m., and reaches a low from 5 a.m. to 9 a.m.

! A-23
Figure A–25. Diurnal Variation in Capacity Factor in Tiburon Average wind speeds vary from year-to-year in Tiburon as well. The average wind speed reached as high as 5.7 m/s in 1997 and as low as 4.75 m/s in 2006. There was not significant variation among the eight points measured for this area. Average wind speed ranged from 4.80 m/s to 5.49 m/s.

! A-24
Appendix VI. Hydropower Assessment by Department Sud-Est As one of the poorest regions in Haiti—more than 85% of the population there lived on less than USD 2 a day in 2009—the Sud-Est has a lot at stake when considering the exploitation of its renewable energy potential. It is fortunate enough to benefit from the second strongest assessed hydropower potential in the country; with 6.7 MW, the Riviere Pichon site has the potential to become one of the largest power producers nationwide. (See Table A–2.) However, the generally low population density of the region (more than half of its districts have less than 250 persons per square kilometer) might hamper grid extension and rural electrification efforts. Table A–2. Sud-Est High Hydro Potential Sites
Site Name Potential Installed Capacity (MW)
Average Annual Energy Generation (GWh)
Riviere Pichon 6.7 59 Riviere Blanche Marigot 3.9 34 Riviere Bainet #1 1.3 12
Source: Francis Mitchell Grand-Anse On the Southern tip of the island, the Grand-Anse region experiences roughly the same poverty and density conditions as the Sud-Est, but it does not benefit from the same assessed hydro expansion capacity—although it remains one of the most promising regions in the country in that regard. The assessment shows a total potential of 6.1 MW of installed capacity on the Riviere des Roseaux alone, which would make it one of the highest-yielding rivers in the country. (See Table A–3.) Table A–3. Grand-Anse High Hydro Potential Sites
Site Name Potential Installed Capacity (MW)
Average Annual Energy Generation (GWh)
Riviere des Roseaux #2 3.5 31 Riviere des Roseaux #1 2.6 23 Riviere Glace 2.3 20
Source: Francis Mitchell Nippes Haiti’s most recent department, born out of a split with the Grand-Anse in 2003, is a fairly contrasted region, with population density varying from under 100 persons per square kilometer to more than 500, around the active trading port of Miragoâne. The Grand Riviere de Nippes, however, does not come close to the department’s coastal capital, which could make its grid

! A-25
connection to the additional capacity uncertain. In any case, the very rural areas close to the river, around the center of the region, could benefit from these new electrification possibilities. Table A–4. Nippes High Hydro Potential Sites Site Name Potential Installed Capacity
(MW) Average Annual Energy Generation
(GWh) Grand Riviere de Nippes #1 6.6 58 Grand Riviere de Nippes #2 2.6 23
Source: Francis Mitchell Other Departments Both the Nord Ouest and the Sud have relatively low assessed hydropower potential capacity, with less than 2.4 cumulated MW for each region. The Nord Ouest is one of the two poorest regions in the country; more than 90% of its population lives in extreme poverty, on less than USD 2 a day. Harnessing the hydro potential of the region, albeit limited, could be a first step in the right direction. The commercial port of Les Cayes, in the Sud region (which shares the unequal density and high poverty features of the Nippes), might get a small boost from the potential installed capacity of the Riviere de Sud, while the Riviere des Anglais project could help reach the more isolated western tip of the department. Table A–5. Nord-Ouest High Hydro Potential Sites Site Name Potential Installed Capacity
(MW) Average Annual Energy Generation
(GWh) Trois Riviere #2 2.1 18
Source: Francis Mitchell Table A–6. Sud High Hydro Potential Sites Site Name Potential Installed Capacity
(MW) Average Annual Energy Generation
(GWh) Riviere des Anglais #1 1.2 11 Riviere de Sud 1.2 10.8
Source: Francis Mitchell

! A-26
Appendix VII. Pumped-Storage Hydro in El Hierro Today, El Hierro, a Spanish island off the coast of northwestern Africa, is developing a wind and pumped-storage hydro system to help it become the first independently 100% renewable-powered island in the world.2 The system will work by connecting five wind turbines with a total rated capacity of 11.5 MW to a pumped-storage hydro plant with a rated capacity of 11.3 MW.3 When wind generation exceeds power demand on the island, the excess electricity will be used to pump water from a low reservoir to a high reservoir situated in a 556,000 cubic meter (m3) volcanic crater.4 Then, when wind generation falls short of meeting the island’s power demand, water will be released from the high reservoir to a hydroelectric facility, helping to generate electricity and meet the island’s power demand. The water used in this system comes from three desalination plants connected to the wind turbines.5 The pumped-storage hydro system is also a closed-loop system, meaning that the same water is recycled through the system over time. One reason why this technology is so exciting for Haiti is because of the similarities between Haiti and El Hierro. Historically, each island’s lack of traditional energy resources has led it to become dependent on imported diesel fuel for electricity generation.6 This has made both islands vulnerable to fluctuating oil prices and supply. One goal of El Hierro’s project was to free itself from such a heavy dependency on outside sources for fuel. El Hierro, with a population of only 11,000, estimates that implementing this system will allow it to avoid importing 40,000 barrels of oil per year and emitting 18,700 tons of carbon dioxide (CO2) per year.7 If Haiti, a country with more than 10 million people, could implement this system on a larger scale, it could go a long way in helping it to lower its dependency on imported fossil fuels and to reduce its greenhouse gas emissions. Another benefit of this system is the services provided by the desalination plants. For El Hierro, desalinated water is used for the pumped-storage hydro system as well as for irrigation and residential use. In Haiti, a country where half of its citizens lack access to clean water, such a system could increase access to fresh water in addition to energy. Additionally, as more than half of the country’s land is dedicated to agriculture, these desalination plants could provide a much needed consistent supply of irrigation water. Irregular rainfall and high levels of soil erosion have impeded large-scale irrigation projects, as there is a lack of reliable and unpolluted water for irrigation.

! A-27
Appendix VIII. International Financing Institutions In addition to the development finance institutions mentioned in the Roadmap text, there are several other sources of traditional development assistance that could be tapped for sustainable energy project finance. These are listed in the table below.8 Table A–7. International Institutions with Potential for Financing Sustainable Energy Projects
Institution Overview Sustainable Energy Portfolio
Preferred Project Types
Relevant International Projects
Work in Haiti/ Latin America and Caribbean (LAC) Region
World Bank – International Bank for Reconstruction and Development (IBRD)
Lends to governments of middle-income and creditworthy low-income countries. Promotes sustainable development through loans, guarantees, risk management products, and advisory services.
USD 1.3 billion of IBRD new renewable energy (RE) and energy efficiency (EE) financing in 2009, double the level in 2008.
Capacity-building for local banks to invest in RE/EE, access extension, transmission and distribution improvement, efficiency.
Electrification of 1,700 households in Ecuador from solar home systems (2008). Electrical grid extension for more than 100,000 people in Peru (2009).9
USD 7 billion climate change portfolio for LAC.10 A 2005–08 project on “secure and clean energy” helped cut DR electricity losses by 14%.11
World Bank – International Finance Corporation (IFC)
Provides investment services, advisory services, and asset management to clients in more than 100 developing countries.
Financed more than USD 2.3 billion in RE projects since 2005. Committed to providing a further USD 3 billion for RE/EE projects for 2009–11.
Renewables are 70% of total investment in energy sector. Support of biomass, geothermal, hydro, solar, and wind. Hydro is largest component of portfolio.
USD 50 million for a 72 MW geothermal project in Nicaragua, by U.S.-based Ram Power Corp.12 USD 50 million over 20 years for a 2.7 MW waste-to-energy project in the Maldives.13
USD 3 billion to LAC region in 2010.
Global Environment Facility (GEF)
Independently operating financial organization. Largest public funder of environment-related project.,
USD 1.14 billion from 1991 to 2009, plus USD 8.3 billion in co-financing. Since 2009, decreasing share of RE
Market-based solutions to promote renewable electricity in grid-based systems. Sustainable biomass and small hydro
Technical capacity-building in Cuba for biomass and wind generation (2011).15 Creating market
LAC region accounts for 21% of total funding. USD 1.3 million grant for biomass generation in

! A-28
Institution Overview Sustainable Energy Portfolio
Preferred Project Types
Relevant International Projects
Work in Haiti/ Latin America and Caribbean (LAC) Region
due to greater emphasis on EE, maturation of previous projects, and suspension of off-grid activities.14
have large share. Maturing renewable technologies and off-grid not a priority.
conditions conducive to small/medium renewable generation in Cape Verde (2012).16
the DR (2012).17
European Investment Bank (EIB)
Aims to makes long-term finance available for sound investment,
USD 5.4 billion in 2010, up from USD 1.1 billion in 2007. Non-EU funding channeled through the Energy Sustainability and Security of Supply Facility (ESF).
Preference for wind and solar generation. Encourages new technologies like offshore wind, next-generation biofuels, and solar PV.
EUR 45 million financing for 28 MW onshore wind farm construction in Cape Verde.18 Financing a 117 MW hydropower plant in Panama.
EUR 800 million for African, Caribbean, and Pacific (ACP) countries and South Africa in 2011. EUR 100 million over past five years in DR, with 25% for energy.
EU Directorate-General for Development (EUROPEAID )
Responsible for designing EU development policy and delivering aid. Promotes poverty reduction, sustainable development, democracy, and security.
EUR 420 million from 2006–13 through the ACP-EU Energy Facility. EUR150 million in grants under the 10th European Development Fund (EDF), 2008–13, for countries prioritizing energy.
Officially endorsed the UN’s Sustainable Energy for All initiative. Assistance for implementing incentives, PPAs, feed-in tariffs, solar (including PV), wind, small hydro, and biomass for electricity generation.
EUR 4 million for 2008–11 project in Uganda to develop solar, hydro, and efficient household stoves.19 25% financing of EUR 340 million, 200 MW wind farm in Egypt, partnered with KfW (see below).20
EUR 194 million for DR under 10th EDF, but for focal areas governance, poverty, health, and education (about 50% of allocation). Environ-mental sustainability and energy are considered for funding in the region.
Global Energy Efficiency and Renewable Energy Fund (GEEREF)
Provides global risk capital through private investment for EE and RE projects in developing countries.
Target funding of EUR 200–250 million. As of September 2009, GEEREF had secured a total EUR 108 million.
Provides indirect equity finance to small and medium-sized enterprises. Projects are RE or EE that require up to EUR 10 million investment and fill a gap in the market.
Investments have been made in RE Asia Fund Berkeley, Clean Tech Latin American Fund, DI Frontier (RE projects and carbon trading in Africa).21
Priority focus on ACP. No existing projects in the region.

! A-29
Institution Overview Sustainable Energy Portfolio
Preferred Project Types
Relevant International Projects
Work in Haiti/ Latin America and Caribbean (LAC) Region
Nordic Investment Bank (NIB)
International financial institution owned by Denmark, Estonia, Finland, Iceland, Latvia, Lithuania, Norway, and Sweden. Projects to strengthen competitive-ness and/or enhance the environment.
USD 113 million in 2010 for investment in international green energy projects—a notable reduction since 2008 (USD 378 million).
Upgrading electricity transmission and distribution systems; renewable energy power projects.
On-lending for energy projects with environmental benefits in southern Africa (2011). Loan to the Inter-American Investment Corporation for projects within NIB’s mandate (2011).22
LAC region could be among “limited group” of countries where NIB sees good opportunity to maintain a long-term presence.
Inter-American Development Bank (IDB)
IDB has 48 member countries; 26 LAC countries hold the majority of shares. Aims to bring about develop-ment in a sustainable, climate-friendly way.
USD 83 million in 2010, a sharp decrease from 2008 (USD 662 million).
Hydro, biofuels, wind, solar, geothermal power. Emphasis on energy efficiency.
Ongoing electricity losses project in Guyana (monitoring, technical and commercial losses).23 USD 600 million pledged in March 2012 for green energy in LAC.24
USD 1.5–1.9 billion planned for 2009–13 in the DR, with long-term infrastructure objectives.
Caribbean Development Bank (CDB)
Aims to reduce poverty through sustainable economic and social development.
Virtually non-existent so far (few million dollars for regional expertise-building in 2011). Progressively making RE/EE a top priority.
Energy efficiency, conservation, and diversification. Regional initiatives to create the appropriate RE/EE policy environment.
Promotion of regional building code. Involved in construction of 30 MW bagasse project in Belize (2008). Biomass project at the Skeldon factory in Guyana.
Agence Française de Développement (AFD)
Main implementing agency for France’s official development assistance to developing countries and overseas territories. Also has private sector-oriented subsidiary PROPARCO.
USD 294 million in 2010, stable since 2007.
Connection/ strengthening electricity grids. Holistic electrification approach—both grid and off-grid projects. Both EE and RE projects.
Rural electrification program in Morocco (1995–2010) through grid extension and off-grid solar PV.25 Creation of a regulatory body for regional electricity ex-change in West Africa.26
Recent funding in Latin America, long-standing in Haiti and DR. EUR 400 million in projects since 1997, with growing involvement.

! A-30
Institution Overview Sustainable Energy Portfolio
Preferred Project Types
Relevant International Projects
Work in Haiti/ Latin America and Caribbean (LAC) Region
Kreditanstalt für Wiederaufbau (KfW) and affiliated DEG
KfW partners with DEG to promote sustainable progress in developing countries. KfW emphasis on partner countries; DEG emphasis on the private sector.
USD 1.5 billion in 2010, nearly doubled since 2007. Increasing reliance on private funds rather than German government funding.
Climate protection investments of private firms (DEG). Protecting tropical forests, biodiversity and natural resources (KfW).
EUR 5.5 million German-funded “Promaren” program to protect natural resources in the DR (KfW). Long-term loan to India-based Bhoruka Power Corp. for 26 MW wind farm (DEG).
DEG in particular has invested about USD 84 million in LAC infrastructure projects over 20 years.27
International Climate Initiative (ICI)
Funded by emissions trading, the German Environment Ministry (BMU). Finances climate and biodiversity projects in developing and newly industrializing countries.
EUR 634 million funding since 2008, plus EUR 1.5 billion in co-financing. 28% of projects go to RE and EE.
Actor in International Partnership on Mitigation and monitoring, reporting, and verification (MRV). Investment and policy advice to encourage RE and EE. Strategies for managing risks due to climate change.
Improving know-how for application of RE technologies in South Africa (2008–10). Switching from fossil fuels to biofuels on the Galapagos Islands (2012–14).
Worldwatch Low-Carbon Energy Roadmaps to promote EE and RE in the Caribbean—EUR 1.3 million funding over 2011–13.

! A-31
Appendix IX. International Rural Electrification Program Best Practices Bangladesh: Involving Local Communities With a Human Development score similar to Haiti’s (0.454 and 0.500, respectively), and a comparable electricity coverage rate (around 30% or less), Bangladesh provides an interesting comparison. Its approach to rural electrification demonstrates the critical importance of community involvement. Bangladesh established a Rural Electrification Board (REB) and 67 rural electric cooperatives called Palli Bidyut Samities (PBS). The locations of the cooperatives were carefully chosen after a review of the economic growth and poverty alleviation potential, and of existing financial and human resources in various communities. In addition to setting rules and guidelines, the REB eased relations with local communities by encouraging them to participation in the PBSs’ voluntary Boards of Directors (usually composed of 10–15 citizens, some of them union or association leaders and at least two of them women), and organizing public meetings to avoid and diffuse disputes over construction impact and access. In off-grid locations where the Bangladeshi government did not deem it possible to create PBSs, the project emphasized solar PV. “One-stop shops” marketed solar technologies and provided in-house financing and services to rural consumers.28 Customer training and service assistance helped ensure a continued commitment from consumers and a sustainable financing model. Given Haiti’s low recovery rates and chronic losses, these measures would be especially valuable. Cape Verde: Unleashing the Power of Initiative and Competition The West African archipelago of Cape Verde, with a Human Development Index of 0.568, virtually no fossil fuel resources, and significant renewable energy potential, is in many ways comparable to Haiti—although it benefits from a much more stable democratic political system and better economic growth, which led to it being classified as a developing nation in 2007. In recent years, Cape Verde has received significant attention for its rural electrification program, developed with the assistance of the World Bank.29 It achieved 95% electrification in 2010, up from 70% in 2005, and business-as-usual scenarios take it to 100% by 2015, including for rural areas.30 Cape Verde’s program relied on a system of 10-year concessions awarded to companies by competitive tender. Winning companies qualified for government subsidies within specific geographic areas. Amounts would diminish from one year to the next to reflect upfront costs and economies of scale; for a 50-watt solar home system, for instance, the first-cost subsidy would be USD 150 but it would go down to USD 30 by the fourth year.31 The funds would only be disbursed on the basis of adequate proof of advancement every six months. These companies had three responsibilities: 1) sell off-grid electrification systems, 2) sell electricity (in a fee-for-service model), and 3) manage publicly owned equipment. This type of concessions system could be useful in a country like Haiti, which fits researchers’ observation that “concessions are attractive where there are no existing energy service providers

! A-32
and/or in very small markets.”32 Of course, the replicability of the experience is limited by the size of the country’s population (about half a million inhabitants in 2010). It must also be noted that the country has one of the highest electricity tariff rates in Africa, with an average rate of USD 25 cents per kWh, although this is not that high when compared to tariffs in Haiti.33 Overall, the program nonetheless seems to have had very positive effects for the country. It seems that high prices have not been a significant hurdle to the expansion of electricity access. Costa Rica: Making Cooperation Work In Costa Rica, four rural electric cooperatives have been supplying electricity to rural residents for 30 years.34 Each cooperative is run by a general assembly and a board of directors elected by local communities. Despite initial challenges in pricing, loan repayments, and staff training, the cooperatives prospered quite rapidly; driven by the firm principle of cost recovery, initial low-cost capital, and interesting renewable energy possibilities, they managed to become self-sustaining. Additional benefits of the cooperative system include better information exchange between providers and consumers, popular solidarity mechanisms such as scholarships or discounts, as well as an enduring not-for-profit, public service mentality. While they constitute the most original and noteworthy aspect of Costa Rica’s rural electrification efforts, cooperatives currently count for “only” 40% of rural-area service (and 15% of the entire national market).35 Most of what remains resulted from the action of the state-run Costa Rican Electricity Institute (ICE), backed by international donors such as the IDB and USAID. Starting in 1976, an aggressive campaign of grid extension began, completed by field studies of potential electricity demand and detailed cost estimates. Ultimately, though, the project was only made possible by a negotiated concessionary loan from the IDB’s Special Operations Fund, at 2% interest with a grace period of 8.5 years. (In comparison, the loans made by Haitian banks to the government would be at a 7% interest rate over seven years.) The Costa Rican case calls for a more solid, affordable source of funding before Haiti launches such a large-scale project—possibly USAID or PetroCaribe loans, for instance. Another notable aspect is that within the ICE, rural electrification activities are separated from “mainstream” generation and transmission activities, which appropriately recognizes the specificity of rural electrification issues. The ICE’s pricing structure was also remarkable, a balanced mix of concessionary connection fees for poor consumers, progressive block rates following the volume of consumption, and the obligation to recover costs after a five-year initial setup period.36

! A-33
Endnotes, Appendices !!!!!!!!!!!!!!!!!!!!!!!!!!!!!!!!!!!!!!!!!!!!!!!!!!!!!!!!1 U.S. National Renewable Energy Laboratory, Renewable Resource Data Center, “Changing System Parameters,” rredc.nrel.gov/solar/calculators/PVWATTS/system.html, viewed 14 December 2011. 2 Andres Cala, “Tiny Spanish Country Has a Huge Stake in the Future,” New York Times, 19 January 2011. 3 ABB Communications, “The World’s First Renewable Energy Island,” 23 June 2011, www.abb.com. 4 Al Bredenberg, “El Hierro: How an Island Can Serve as a Model for Renewable Energy,” 18 July 2011, news.thomasnet.com. 5 Cala, op. cit. note 2. 6 Bredenberg, op. cit. note 4. 7 Ibid. 8 Unless otherwise specified, renewable energy and energy efficiency portfolio estimates in the table were extracted from International Energy Agency (IEA), Renewable Energy: Medium-Term Market Report (Paris: 2012). 9 World Bank, “IBRD and Results,” 2011, siteresources.worldbank.org/EXTABOUTUS/Resources/IBRDResults.pdf. 10 World Bank, “IBRD Results Profile: Climate Change,” 2010, web.worldbank.org/WBSITE/EXTERNAL/NEWS/0,,print:Y~isCURL:Y~contentMDK:22560662~menuPK:141311~pagePK:34370~piPK:34424~theSitePK:4607,00.html. 11 Ibid. 12 International Finance Corporation, “Climate Change: Private Sector Solutions,” 2012, www1.ifc.org/wps/wcm/connect/8004dc004ba103ada5dae71be6561834/TOS_Cimate_Change_June2012.pdf?MOD=AJPERES. 13 Ibid. 14 Global Environment Facility (GEF), “Investing in Renewable Energy: The GEF Experience” (Washington, DC: 2009). 15 GEF, “Detail of GEF Project #1361,” www.thegef.org/gef/project_detail?projID=1361. 16 Ibid. 17 GEF, “Dominican Republic Project Identification Form: Stimulating industrial competitiveness through biomass-based, grid-connected electricity generation” (Washington, DC: 2011). 18 European Investment Bank, “Supporting Renewable Energy” (Luxembourg: 2012). 19 EC Europa, “Modernising Energy Use in Northern Uganda” (Brussels: 13 April 2012). 20 EC Europa, “Energising the future with wind on Egypt’s desert coast” (Brussels: 13 April 2012). 21 Global Energy Efficiency and Renewable Energy Fund, Investment Portfolio (Luxembourg: 2012). 22 Nordic Investment Bank, Annual Activity Report, 2011 (Helsinki: 2011). 23 Inter-American Development Bank (IDB), “Project Results in Guyana,” 2012, www.iadb.org/en/mapamericas/guyana/mapamericas-project-results-in-guyana,5543.html. 24 IDB, “IDB and JICA to Invest Up to $600 Million in Green Energy in Central America and the Caribbean,” press release (Washington, DC: 16 March 2012). 25 French Agency for Development, “Project Details Sheet,” www.afd.fr/home/projets_afd/infrastructures_energie/Energie/eletrification-rurale-maroc. 26 French Agency for Development, “Project Details Sheet,” www.afd.fr/home/projets_afd/infrastructures_energie/Energie/organe-regulation-regional-afrique-ouest. 27 “German investment group sees fertile investment grounds in DR,” Dominican Today, 2006. 28 Nexant, “Rural Energy Services: Best Practices,” prepared for USAID (Washington, DC: 2012). 29 E. Martinot and K. Reiche, Regulatory Approaches to Rural Electrification and Renewable Energy: Case Studies from Six Developing Countries, World Bank working paper (Washington, DC: 2000). 30 United Nations Development Programme, Technical Discussion Paper on General Electricity Access in the ECOWAS Region (Washington, DC: 2012). 31 Martinot and Reiche, op. cit. note 29. 32 Ibid. 33 REEGLE, “Energy Profile: Cape Verde,” www.reegle.info/countries/cape-verde-energy-profile/CV. 34 D. Barnes, Meeting the Challenge of Rural Electrification in Developing Nations: The Experience of Successful Programs (Washington, DC: World Bank, 2005). 35 National Rural Electric Cooperative Association, “Country Project: Costa Rica,” www.nrecainternational.coop/Projects/CostaRica/Pages/default.aspx. 36 Barnes, op. cit. note 34.!