h1 2017 results briefing 14 august 2017 - semirara mining relations/investor... · consolidated...
TRANSCRIPT
H1 2017 Results Briefing 14 August 2017
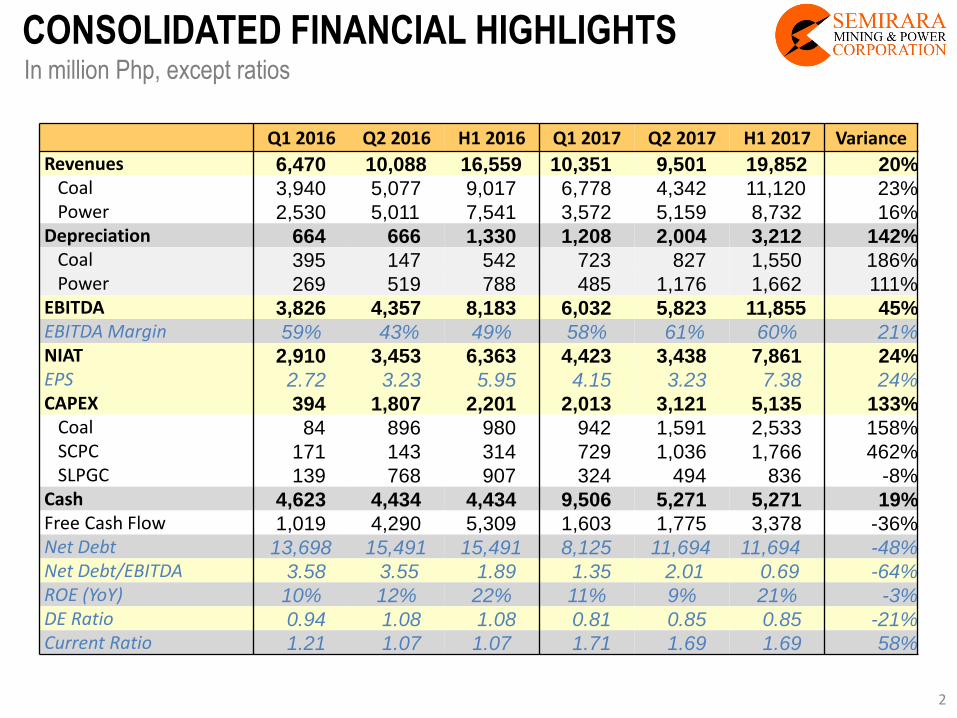
CONSOLIDATED FINANCIAL HIGHLIGHTS In million Php, except ratios
Q1 2016 Q2 2016 H1 2016 Q1 2017 Q2 2017 H1 2017 Variance
Revenues 6,470 10,088 16,559 10,351 9,501 19,852 20% Coal 3,940 5,077 9,017 6,778 4,342 11,120 23% Power 2,530 5,011 7,541 3,572 5,159 8,732 16% Depreciation 664 666 1,330 1,208 2,004 3,212 142% Coal 395 147 542 723 827 1,550 186% Power 269 519 788 485 1,176 1,662 111% EBITDA 3,826 4,357 8,183 6,032 5,823 11,855 45% EBITDA Margin 59% 43% 49% 58% 61% 60% 21% NIAT 2,910 3,453 6,363 4,423 3,438 7,861 24% EPS 2.72 3.23 5.95 4.15 3.23 7.38 24% CAPEX 394 1,807 2,201 2,013 3,121 5,135 133%
Coal 84 896 980 942 1,591 2,533 158% SCPC 171 143 314 729 1,036 1,766 462% SLPGC 139 768 907 324 494 836 -8%
Cash 4,623 4,434 4,434 9,506 5,271 5,271 19% Free Cash Flow 1,019 4,290 5,309 1,603 1,775 3,378 -36% Net Debt 13,698 15,491 15,491 8,125 11,694 11,694 -48% Net Debt/EBITDA 3.58 3.55 1.89 1.35 2.01 0.69 -64% ROE (YoY) 10% 12% 22% 11% 9% 21% -3% DE Ratio 0.94 1.08 1.08 0.81 0.85 0.85 -21% Current Ratio 1.21 1.07 1.07 1.71 1.69 1.69 58%
2
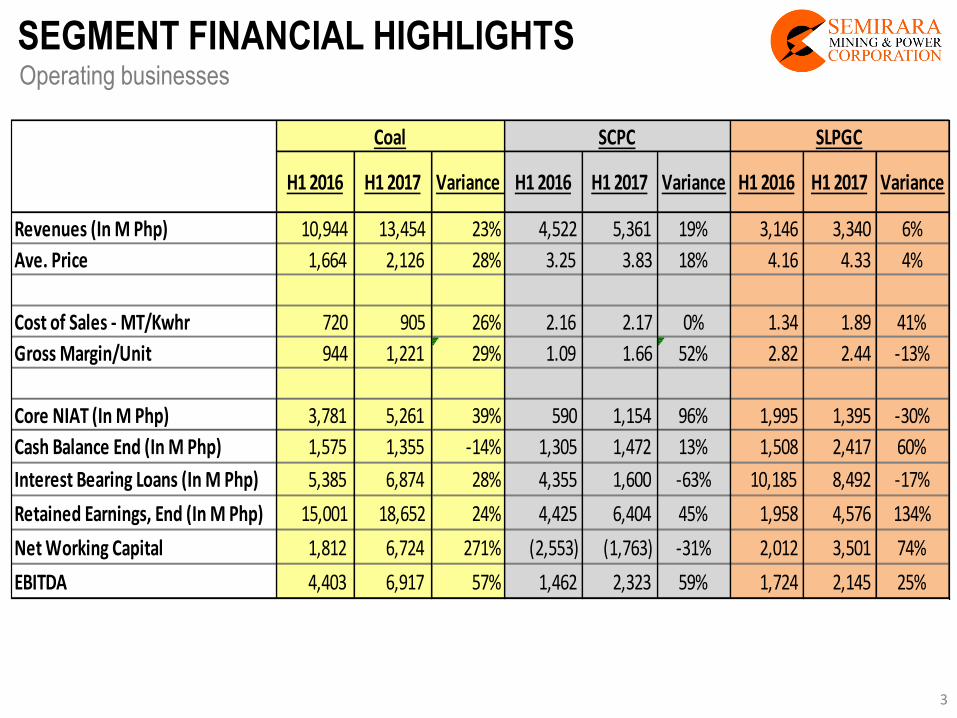
SEGMENT FINANCIAL HIGHLIGHTS
H1 2016 H1 2017 Variance H1 2016 H1 2017 Variance H1 2016 H1 2017 Variance
Revenues (In M Php) 10,944 13,454 23% 4,522 5,361 19% 3,146 3,340 6%
Ave. Price 1,664 2,126 28% 3.25 3.83 18% 4.16 4.33 4%
Cost of Sales - MT/Kwhr 720 905 26% 2.16 2.17 0% 1.34 1.89 41%
Gross Margin/Unit 944 1,221 29% 1.09 1.66 52% 2.82 2.44 -13%
Core NIAT (In M Php) 3,781 5,261 39% 590 1,154 96% 1,995 1,395 -30%
Cash Balance End (In M Php) 1,575 1,355 -14% 1,305 1,472 13% 1,508 2,417 60%
Interest Bearing Loans (In M Php) 5,385 6,874 28% 4,355 1,600 -63% 10,185 8,492 -17%
Retained Earnings, End (In M Php) 15,001 18,652 24% 4,425 6,404 45% 1,958 4,576 134%
Net Working Capital 1,812 6,724 271% (2,553) (1,763) -31% 2,012 3,501 74%
EBITDA 4,403 6,917 57% 1,462 2,323 59% 1,724 2,145 25%
SLPGCCoal SCPC
Operating businesses
3
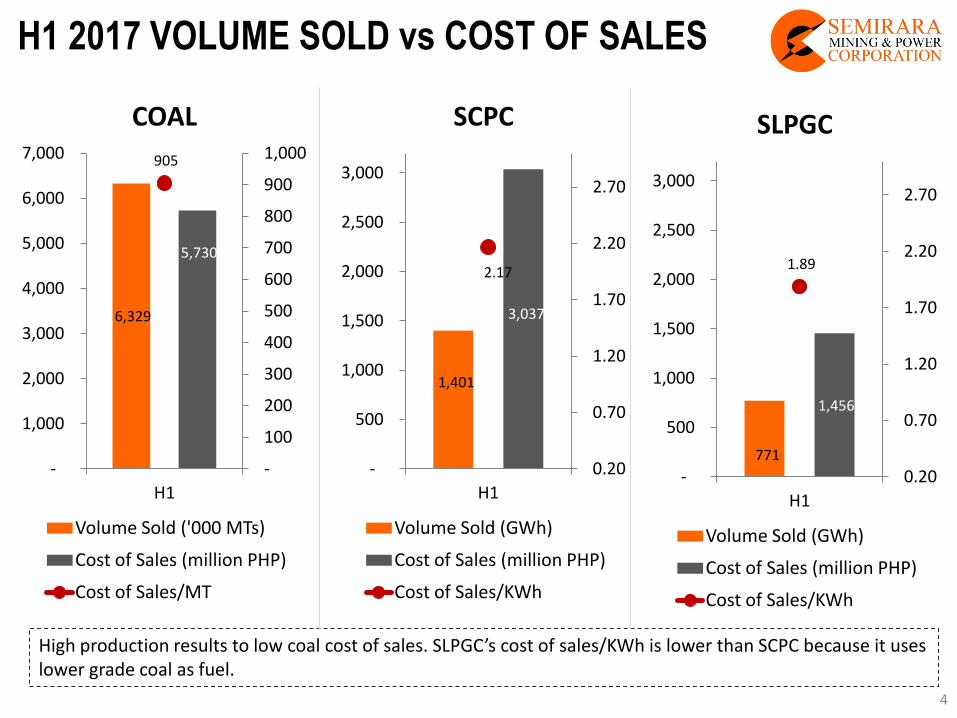
H1 2017 VOLUME SOLD vs COST OF SALES
1,401
3,037
2.17
0.20
0.70
1.20
1.70
2.20
2.70
-
500
1,000
1,500
2,000
2,500
3,000
H1
SCPC
Volume Sold (GWh)
Cost of Sales (million PHP)
Cost of Sales/KWh
High production results to low coal cost of sales. SLPGC’s cost of sales/KWh is lower than SCPC because it uses lower grade coal as fuel.
771
1,456
1.89
0.20
0.70
1.20
1.70
2.20
2.70
-
500
1,000
1,500
2,000
2,500
3,000
H1
SLPGC
Volume Sold (GWh)
Cost of Sales (million PHP)
Cost of Sales/KWh
6,329
5,730
905
-
100
200
300
400
500
600
700
800
900
1,000
-
1,000
2,000
3,000
4,000
5,000
6,000
7,000
H1
COAL
Volume Sold ('000 MTs)
Cost of Sales (million PHP)
Cost of Sales/MT
4
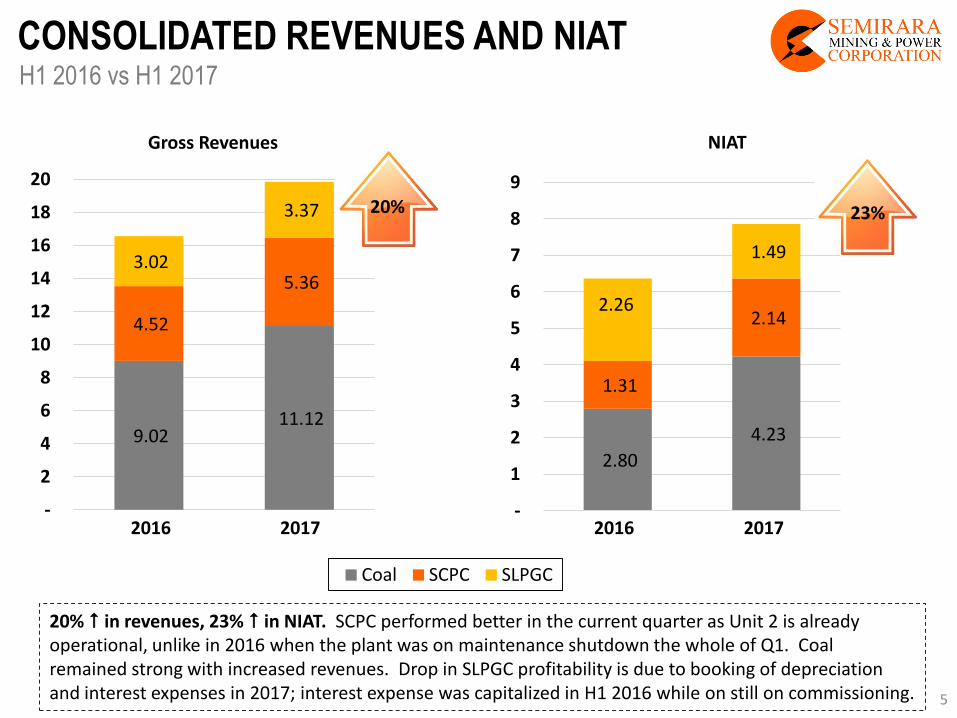
2.80
4.23
1.31
2.14 2.26
1.49
-
1
2
3
4
5
6
7
8
9
NIAT
Coal SCPC SLPGC
9.02 11.12
4.52
5.36 3.02
3.37
-
2
4
6
8
10
12
14
16
18
20
Gross Revenues
CONSOLIDATED REVENUES AND NIAT
2016 2017
20% in revenues, 23% in NIAT. SCPC performed better in the current quarter as Unit 2 is already operational, unlike in 2016 when the plant was on maintenance shutdown the whole of Q1. Coal remained strong with increased revenues. Drop in SLPGC profitability is due to booking of depreciation and interest expenses in 2017; interest expense was capitalized in H1 2016 while on still on commissioning.
20% 23%
2016 2017
H1 2016 vs H1 2017
5
In B
illio
n P
HP
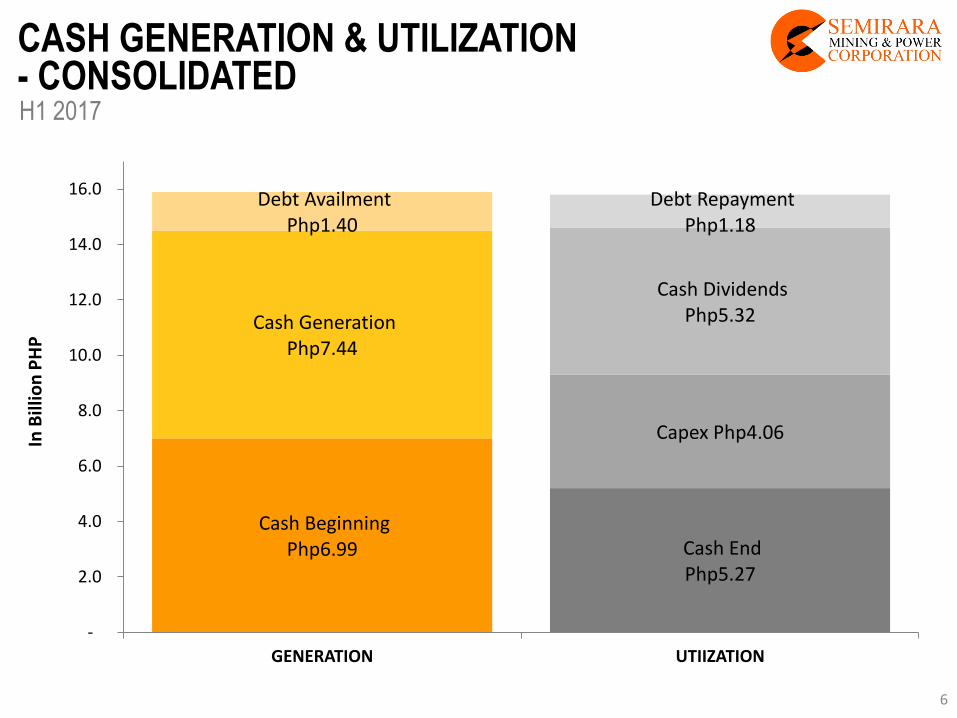
CASH GENERATION & UTILIZATION
H1 2017 - CONSOLIDATED
Cash Beginning Php6.99
Cash Generation Php7.44
Debt Availment Php1.40
Cash End Php5.27
Capex Php4.06
Cash Dividends Php5.32
Debt Repayment Php1.18
-
2.0
4.0
6.0
8.0
10.0
12.0
14.0
16.0
GENERATION UTIIZATION
6
21 19 15 15 24 25
21 22
4 3
7 7
24 25
12 11
3 5
0 0
0
(0) (0) (0)
(10)
-
10
20
30
40
50
60
70
Coal SCPC SLPGC Others
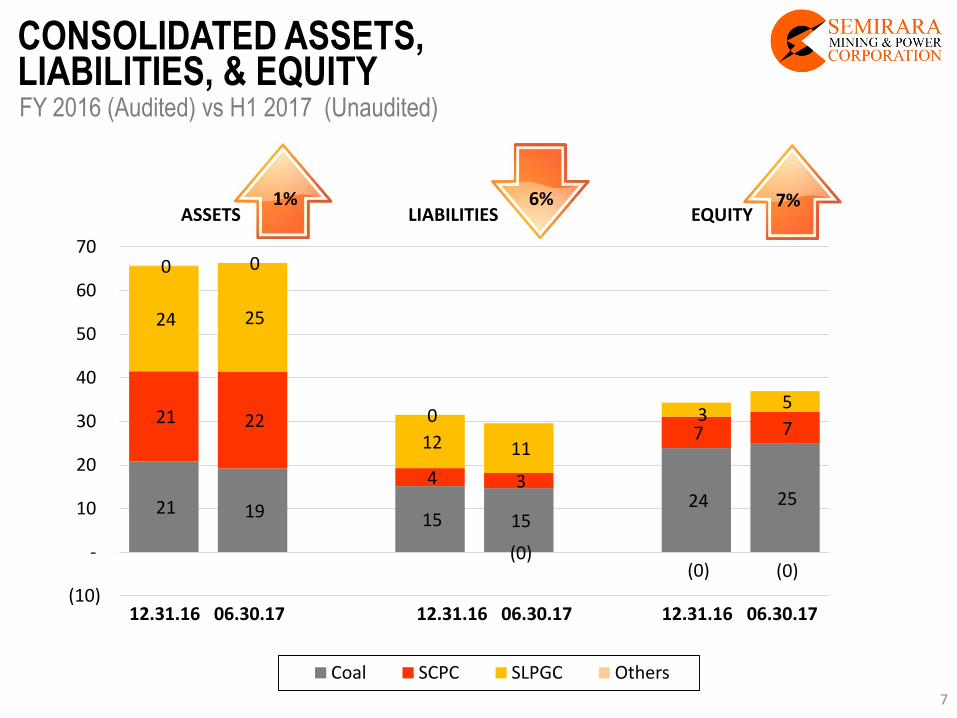
CONSOLIDATED ASSETS,
12.31.16 06.30.17 12.31.16 06.30.17 12.31.16 06.30.17
LIABILITIES, & EQUITY
ASSETS LIABILITIES EQUITY 1% 7% 6%
FY 2016 (Audited) vs H1 2017 (Unaudited)
7
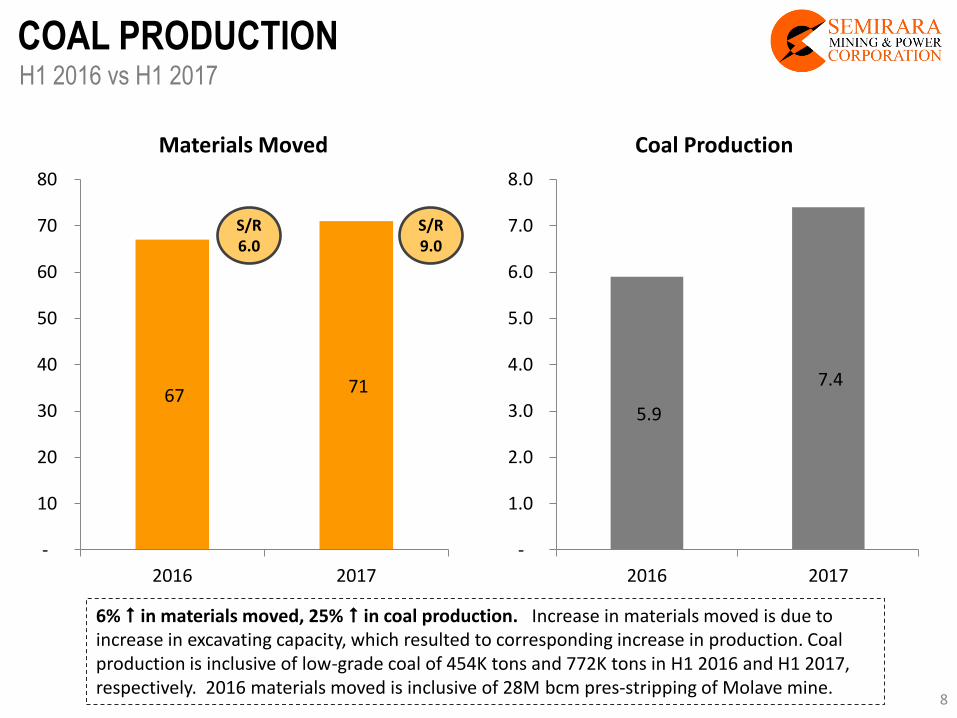
COAL PRODUCTION H1 2016 vs H1 2017
67 71
-
10
20
30
40
50
60
70
80
2016 2017
Materials Moved
6% in materials moved, 25% in coal production. Increase in materials moved is due to increase in excavating capacity, which resulted to corresponding increase in production. Coal production is inclusive of low-grade coal of 454K tons and 772K tons in H1 2016 and H1 2017, respectively. 2016 materials moved is inclusive of 28M bcm pres-stripping of Molave mine.
5.9
7.4
-
1.0
2.0
3.0
4.0
5.0
6.0
7.0
8.0
2016 2017
Coal Production
S/R 6.0
S/R 9.0
8
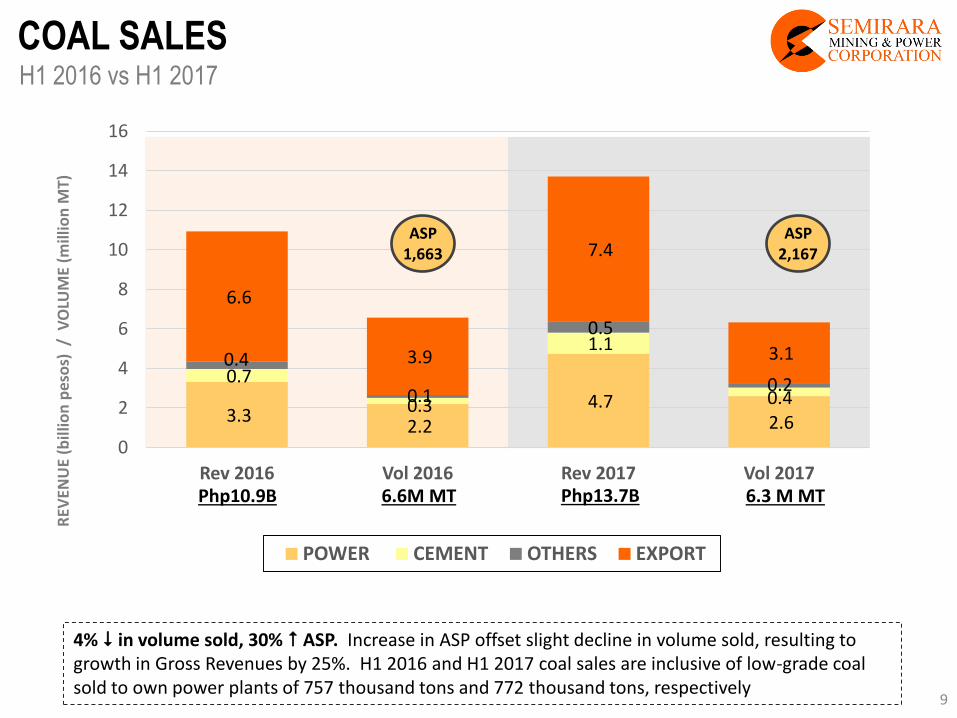
3.3 2.2
4.7 2.6
0.7
0.3
1.1
0.4
0.4
0.1
0.5
0.2
6.6
3.9
7.4
3.1
0
2
4
6
8
10
12
14
16
Rev 2016 Vol 2016 Rev 2017 Vol 2017
POWER CEMENT OTHERS EXPORT
REV
ENU
E (b
illio
n p
eso
s) /
VO
LUM
E (m
illio
n M
T)
Php10.9B Php13.7B 6.6M MT 6.3 M MT
ASP 1,663
ASP 2,167
COAL SALES
4% in volume sold, 30% ASP. Increase in ASP offset slight decline in volume sold, resulting to growth in Gross Revenues by 25%. H1 2016 and H1 2017 coal sales are inclusive of low-grade coal sold to own power plants of 757 thousand tons and 772 thousand tons, respectively
H1 2016 vs H1 2017
9
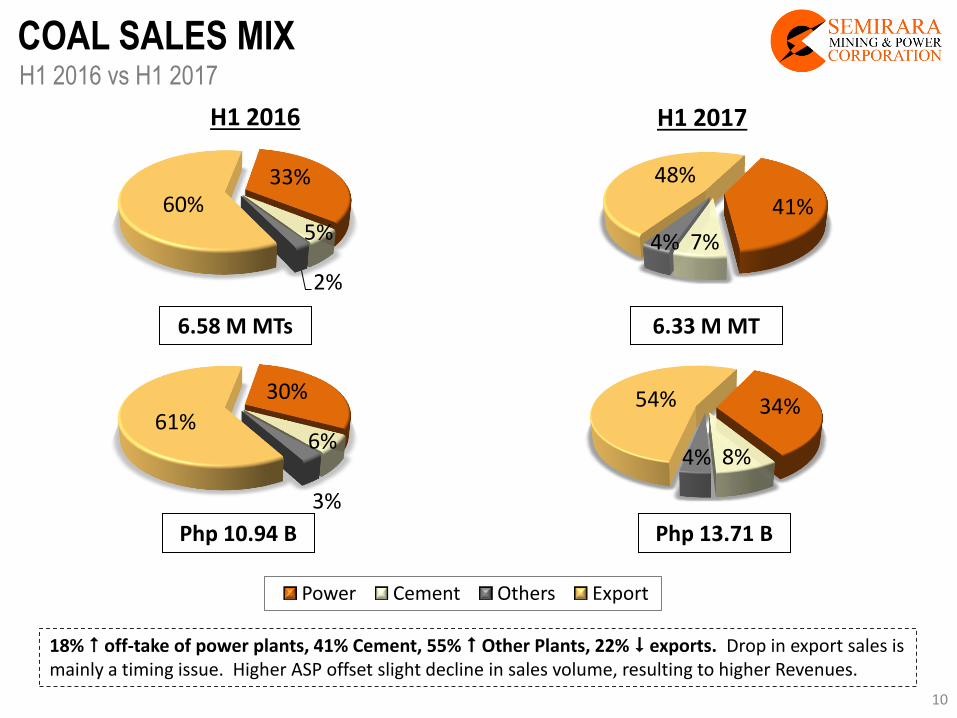
18% off-take of power plants, 41% Cement, 55% Other Plants, 22% exports. Drop in export sales is mainly a timing issue. Higher ASP offset slight decline in sales volume, resulting to higher Revenues.
34%
8% 4%
54%
Power Cement Others Export
H1 2016 H1 2017
6.33 M MT 6.58 M MTs
Php 13.71 B Php 10.94 B
33%
5%
2%
60% 41%
7% 4%
48%
30%
6%
3%
61%
COAL SALES MIX H1 2016 vs H1 2017
10
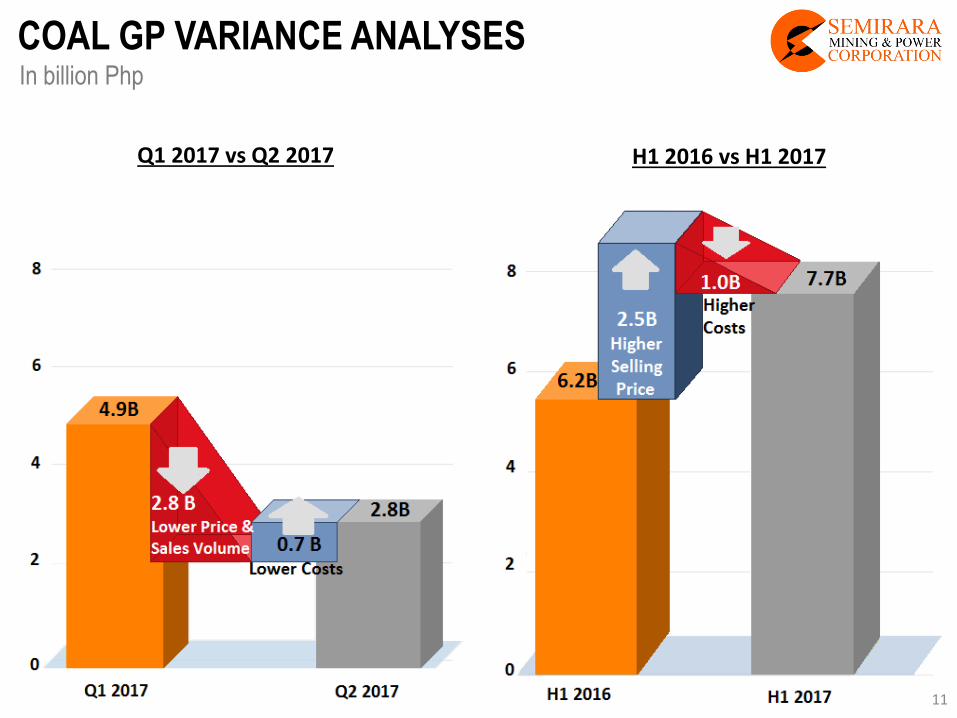
COAL GP VARIANCE ANALYSES In billion Php
Q1 2017 vs Q2 2017 H1 2016 vs H1 2017
11
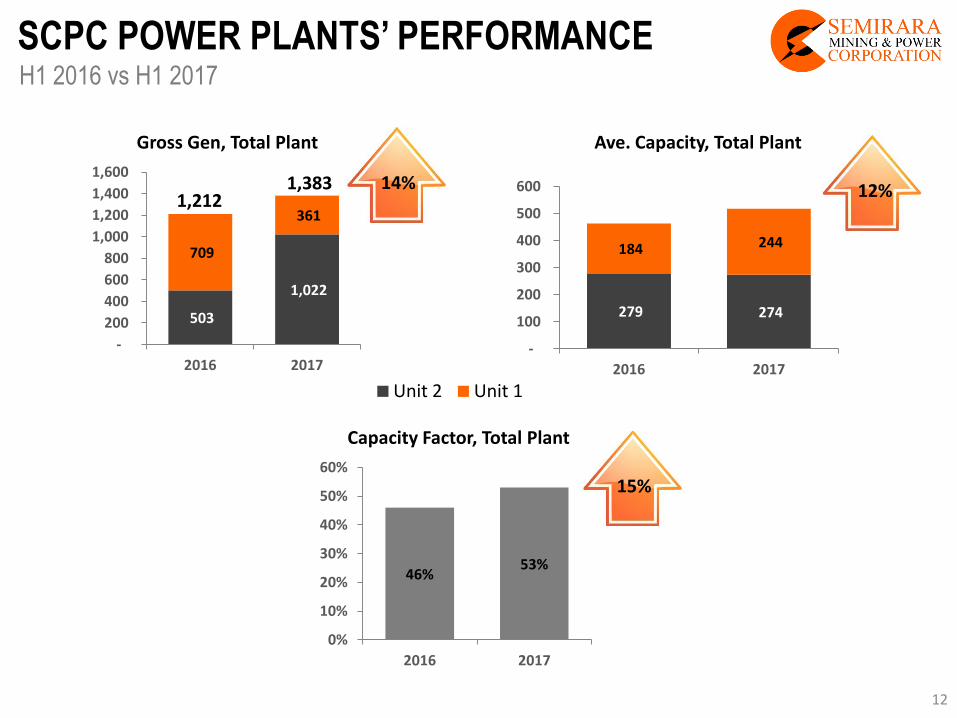
46% 53%
0%
10%
20%
30%
40%
50%
60%
2016 2017
Capacity Factor, Total Plant
279 274
184 244
-
100
200
300
400
500
600
2016 2017
Ave. Capacity, Total Plant
Unit 2 Unit 1
503
1,022
709
361
-
200
400
600
800
1,000
1,200
1,400
1,600
2016 2017
Gross Gen, Total Plant
SCPC POWER PLANTS’ PERFORMANCE
14%
15%
12%
H1 2016 vs H1 2017
1,383 1,212
12
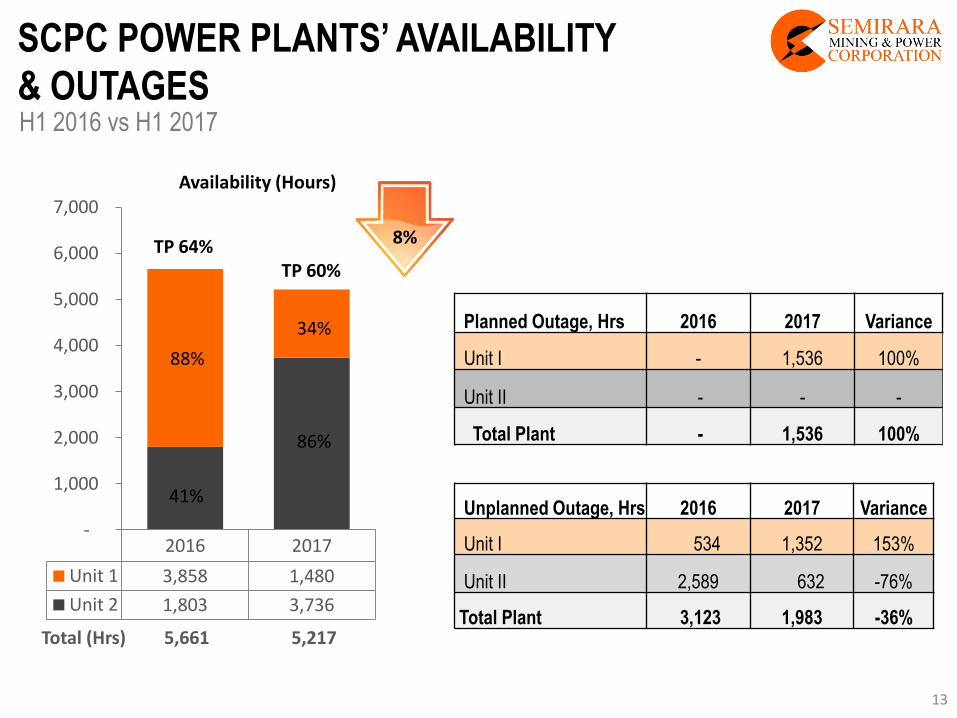
Planned Outage, Hrs 2016 2017 Variance
Unit I - 1,536 100%
Unit II - - -
Total Plant - 1,536 100%
Unplanned Outage, Hrs 2016 2017 Variance
Unit I 534 1,352 153%
Unit II 2,589 632 -76%
Total Plant 3,123 1,983 -36%
SCPC POWER PLANTS’ AVAILABILITY
& OUTAGES
2016 2017
Unit 1 3,858 1,480
Unit 2 1,803 3,736
88%
86%
-
1,000
2,000
3,000
4,000
5,000
6,000
7,000 Availability (Hours)
34%
41%
TP 60% TP 64%
Total (Hrs) 5,661 5,217
8%
H1 2016 vs H1 2017
13
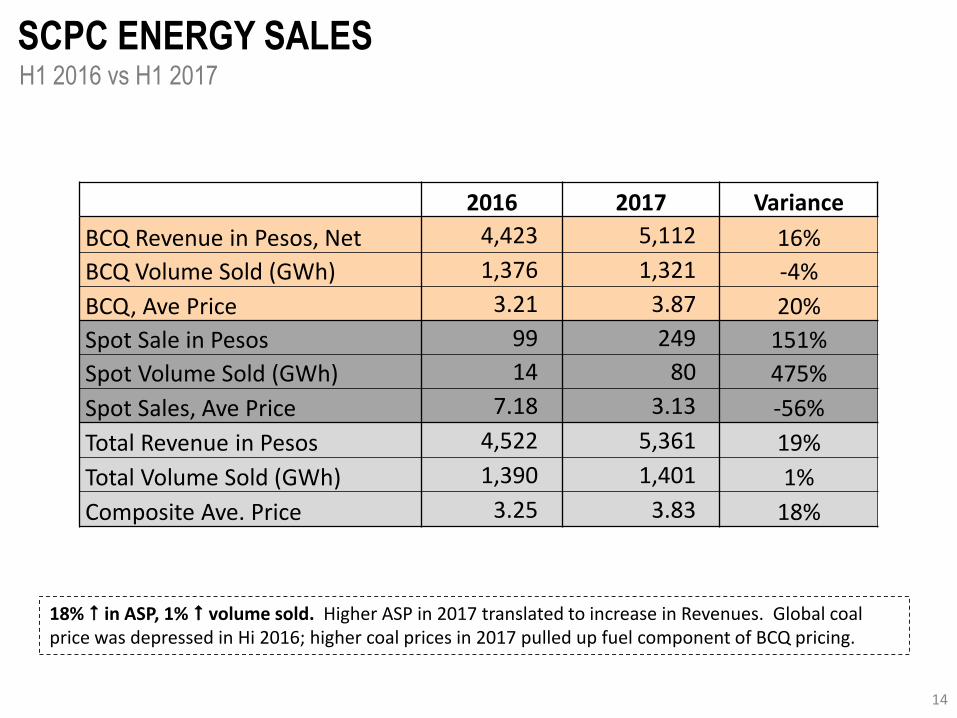
2016 2017 Variance
BCQ Revenue in Pesos, Net 4,423 5,112 16%
BCQ Volume Sold (GWh) 1,376 1,321 -4%
BCQ, Ave Price 3.21 3.87 20%
Spot Sale in Pesos 99 249 151%
Spot Volume Sold (GWh) 14 80 475%
Spot Sales, Ave Price 7.18 3.13 -56%
Total Revenue in Pesos 4,522 5,361 19%
Total Volume Sold (GWh) 1,390 1,401 1%
Composite Ave. Price 3.25 3.83 18%
SCPC ENERGY SALES
18% in ASP, 1% volume sold. Higher ASP in 2017 translated to increase in Revenues. Global coal price was depressed in Hi 2016; higher coal prices in 2017 pulled up fuel component of BCQ pricing.
H1 2016 vs H1 2017
14
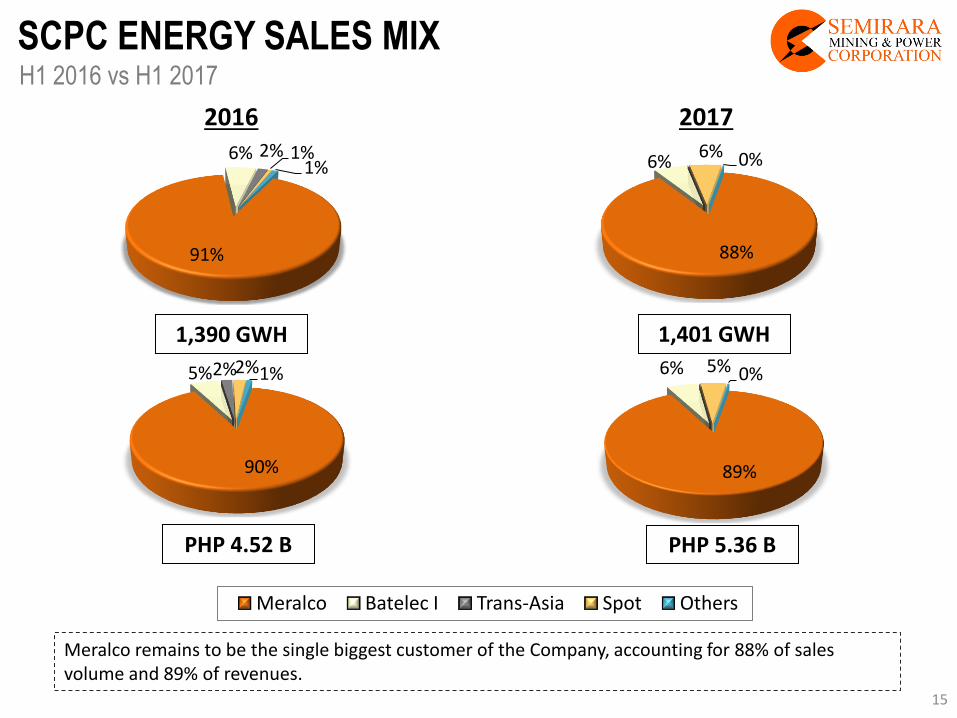
89%
6% 5% 0%
Meralco Batelec I Trans-Asia Spot Others
88%
6% 6% 0%
91%
6% 2% 1% 1%
2016 2017
1,401 GWH 1,390 GWH
PHP 5.36 B
90%
5% 2% 2% 1%
Meralco remains to be the single biggest customer of the Company, accounting for 88% of sales volume and 89% of revenues.
SCPC ENERGY SALES MIX H1 2016 vs H1 2017
PHP 4.52 B
15
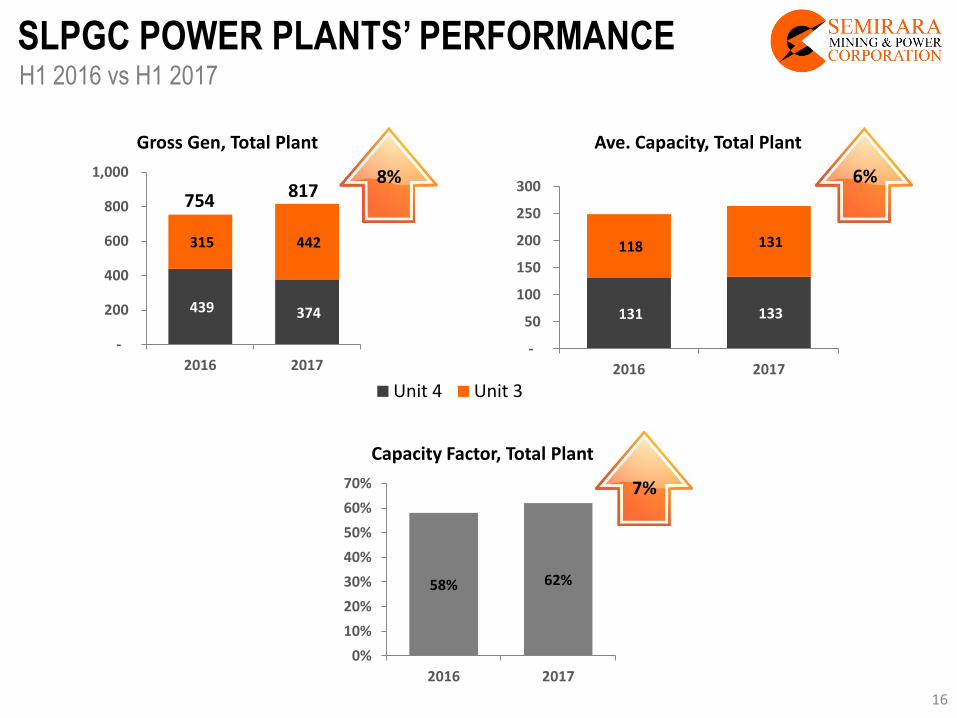
58% 62%
0%
10%
20%
30%
40%
50%
60%
70%
2016 2017
Capacity Factor, Total Plant
131 133
118 131
-
50
100
150
200
250
300
2016 2017
Ave. Capacity, Total Plant
Unit 4 Unit 3
439 374
315 442
-
200
400
600
800
1,000
2016 2017
Gross Gen, Total Plant
SLPGC POWER PLANTS’ PERFORMANCE
817
H1 2016 vs H1 2017
754 8% 6%
7%
16
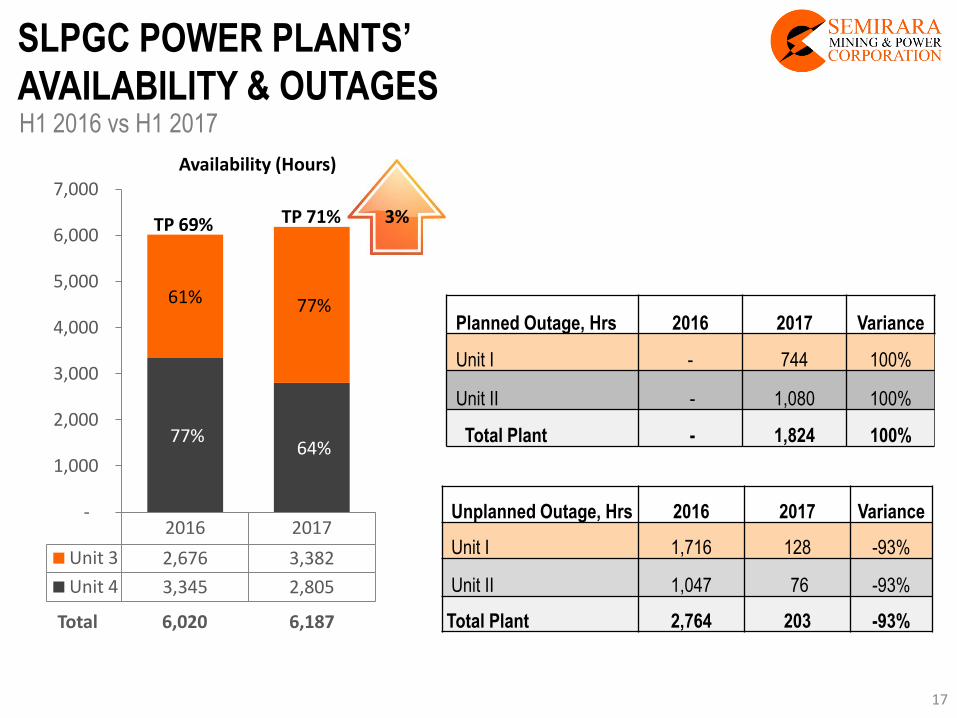
SLPGC POWER PLANTS’
AVAILABILITY & OUTAGES
2016 2017
Unit 3 2,676 3,382
Unit 4 3,345 2,805
77% 64%
61% 77%
-
1,000
2,000
3,000
4,000
5,000
6,000
7,000 Availability (Hours)
TP 71%
Total 6,020 6,187
H1 2016 vs H1 2017
TP 69% 3%
Planned Outage, Hrs 2016 2017 Variance
Unit I - 744 100%
Unit II - 1,080 100%
Total Plant - 1,824 100%
Unplanned Outage, Hrs 2016 2017 Variance
Unit I 1,716 128 -93%
Unit II 1,047 76 -93%
Total Plant 2,764 203 -93%
17
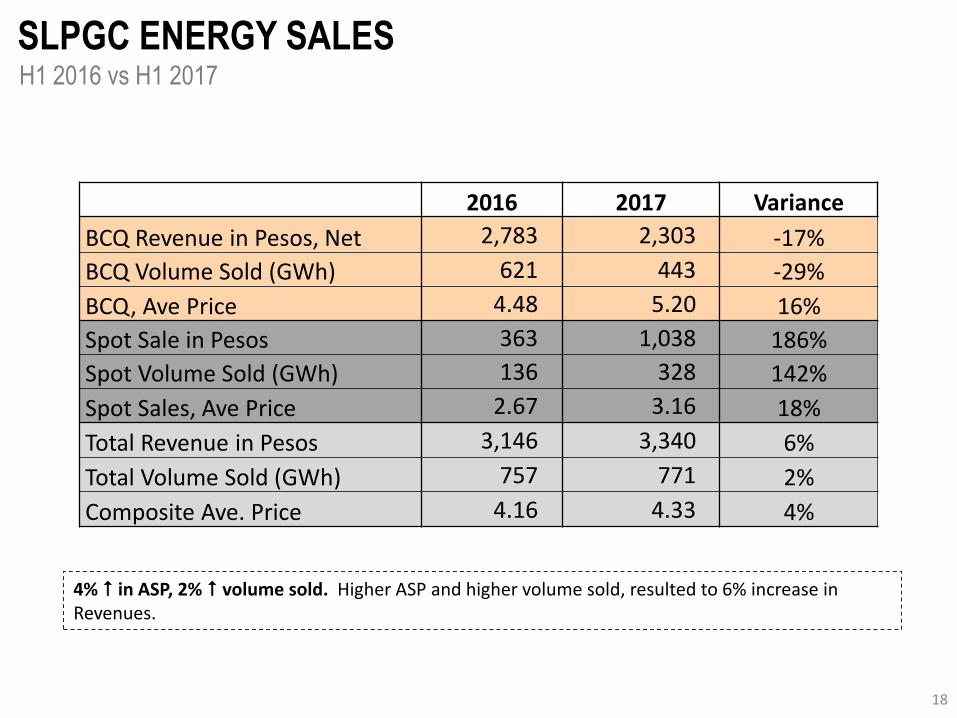
SLPGC ENERGY SALES H1 2016 vs H1 2017
4% in ASP, 2% volume sold. Higher ASP and higher volume sold, resulted to 6% increase in Revenues.
2016 2017 Variance
BCQ Revenue in Pesos, Net 2,783 2,303 -17%
BCQ Volume Sold (GWh) 621 443 -29%
BCQ, Ave Price 4.48 5.20 16%
Spot Sale in Pesos 363 1,038 186%
Spot Volume Sold (GWh) 136 328 142%
Spot Sales, Ave Price 2.67 3.16 18%
Total Revenue in Pesos 3,146 3,340 6%
Total Volume Sold (GWh) 757 771 2%
Composite Ave. Price 4.16 4.33 4%
18
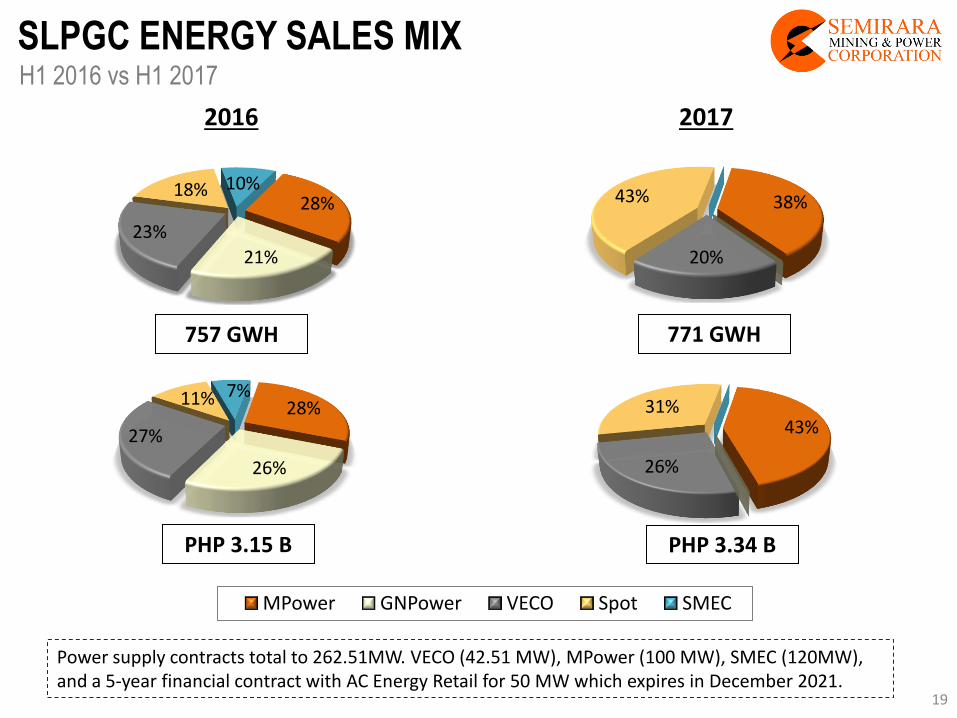
43%
26%
31%
MPower GNPower VECO Spot SMEC
PHP 3.34 B
38%
20%
43% 28%
21%
23%
18% 10%
2016 2017
771 GWH 757 GWH
28%
26%
27%
11% 7%
Power supply contracts total to 262.51MW. VECO (42.51 MW), MPower (100 MW), SMEC (120MW), and a 5-year financial contract with AC Energy Retail for 50 MW which expires in December 2021.
SLPGC ENERGY SALES MIX H1 2016 vs H1 2017
PHP 3.15 B
19
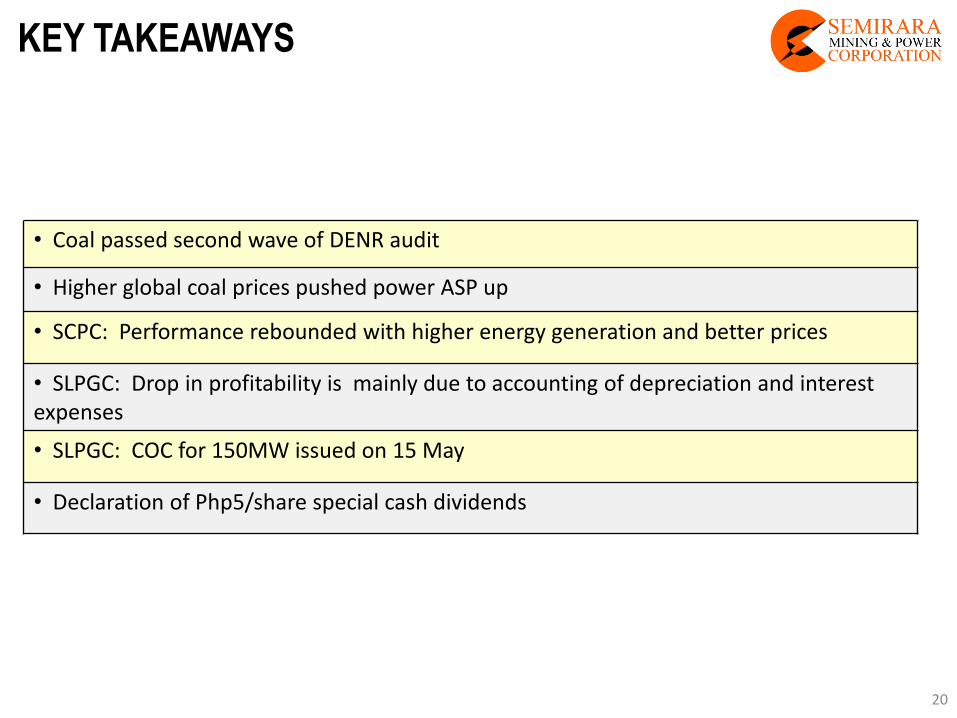
KEY TAKEAWAYS
• Coal passed second wave of DENR audit
• Higher global coal prices pushed power ASP up
• SCPC: Performance rebounded with higher energy generation and better prices
• SLPGC: Drop in profitability is mainly due to accounting of depreciation and interest expenses
• SLPGC: COC for 150MW issued on 15 May
• Declaration of Php5/share special cash dividends
20

APPENDIX
21
*Before eliminating entries
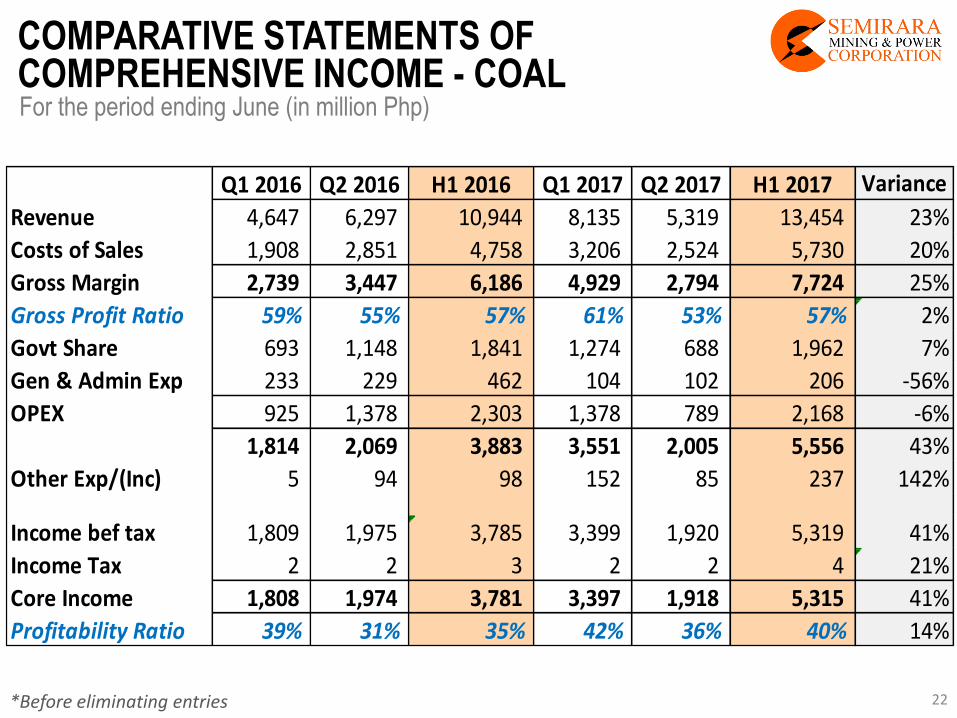
COMPARATIVE STATEMENTS OF COMPREHENSIVE INCOME - COAL For the period ending June (in million Php)
Q1 2016 Q2 2016 H1 2016 Q1 2017 Q2 2017 H1 2017
Revenue 4,647 6,297 10,944 8,135 5,319 13,454 23%
Costs of Sales 1,908 2,851 4,758 3,206 2,524 5,730 20%
Gross Margin 2,739 3,447 6,186 4,929 2,794 7,724 25%
Gross Profit Ratio 59% 55% 57% 61% 53% 57% 2%
Govt Share 693 1,148 1,841 1,274 688 1,962 7%
Gen & Admin Exp 233 229 462 104 102 206 -56%
OPEX 925 1,378 2,303 1,378 789 2,168 -6%
1,814 2,069 3,883 3,551 2,005 5,556 43%
Other Exp/(Inc) 5 94 98 152 85 237 142%
Income bef tax 1,809 1,975 3,785 3,399 1,920 5,319 41%
Income Tax 2 2 3 2 2 4 21%
Core Income 1,808 1,974 3,781 3,397 1,918 5,315 41%
Profitability Ratio 39% 31% 35% 42% 36% 40% 14%
Variance
22
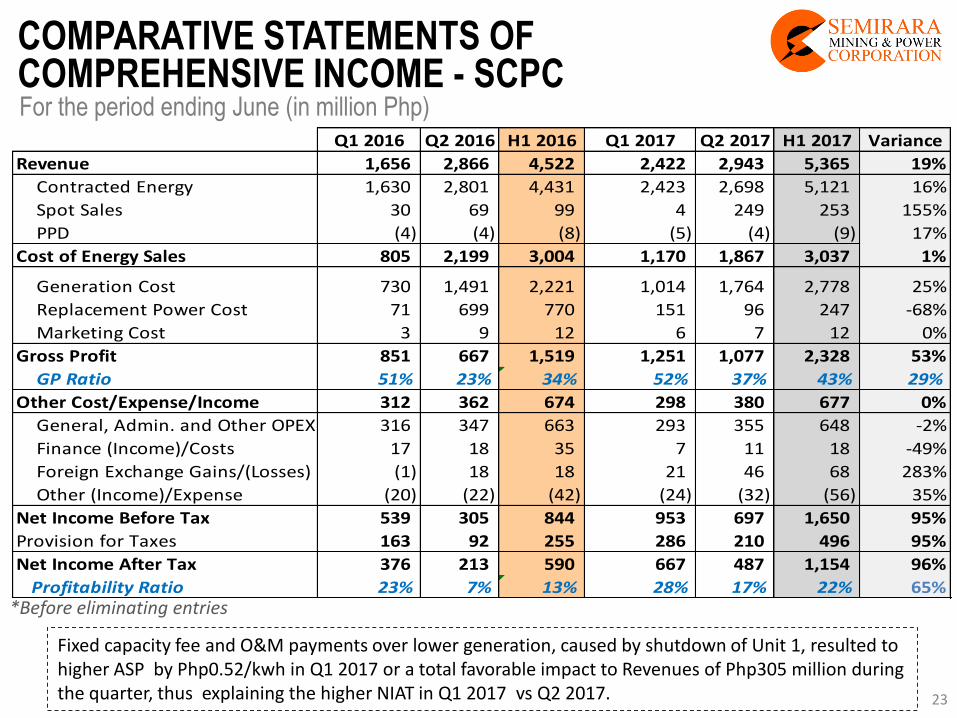
COMPARATIVE STATEMENTS OF COMPREHENSIVE INCOME - SCPC
*Before eliminating entries
For the period ending June (in million Php) Q1 2016 Q2 2016 H1 2016 Q1 2017 Q2 2017 H1 2017
Revenue 1,656 2,866 4,522 2,422 2,943 5,365 19%
Contracted Energy 1,630 2,801 4,431 2,423 2,698 5,121 16%
Spot Sales 30 69 99 4 249 253 155%
PPD (4) (4) (8) (5) (4) (9) 17%
Cost of Energy Sales 805 2,199 3,004 1,170 1,867 3,037 1%
Generation Cost 730 1,491 2,221 1,014 1,764 2,778 25%
Replacement Power Cost 71 699 770 151 96 247 -68%
Marketing Cost 3 9 12 6 7 12 0%
Gross Profit 851 667 1,519 1,251 1,077 2,328 53%
GP Ratio 51% 23% 34% 52% 37% 43% 29%
Other Cost/Expense/Income 312 362 674 298 380 677 0%
General, Admin. and Other OPEX 316 347 663 293 355 648 -2%
Finance (Income)/Costs 17 18 35 7 11 18 -49%
Foreign Exchange Gains/(Losses) (1) 18 18 21 46 68 283%
Other (Income)/Expense (20) (22) (42) (24) (32) (56) 35%
Net Income Before Tax 539 305 844 953 697 1,650 95%
Provision for Taxes 163 92 255 286 210 496 95%
Net Income After Tax 376 213 590 667 487 1,154 96%
Profitability Ratio 23% 7% 13% 28% 17% 22% 65%
Variance
Fixed capacity fee and O&M payments over lower generation, caused by shutdown of Unit 1, resulted to higher ASP by Php0.52/kwh in Q1 2017 or a total favorable impact to Revenues of Php305 million during the quarter, thus explaining the higher NIAT in Q1 2017 vs Q2 2017. 23
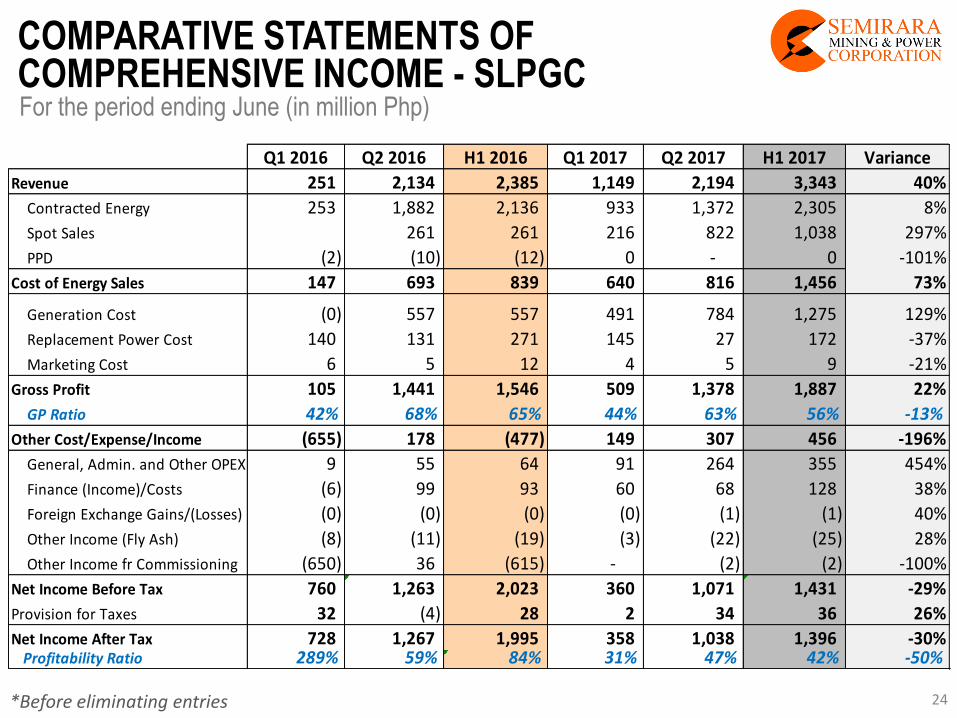
COMPARATIVE STATEMENTS OF COMPREHENSIVE INCOME - SLPGC
*Before eliminating entries
For the period ending June (in million Php)
Q1 2016 Q2 2016 H1 2016 Q1 2017 Q2 2017 H1 2017 Variance
Revenue 251 2,134 2,385 1,149 2,194 3,343 40%
Contracted Energy 253 1,882 2,136 933 1,372 2,305 8%
Spot Sales 261 261 216 822 1,038 297%
PPD (2) (10) (12) 0 - 0 -101%
Cost of Energy Sales 147 693 839 640 816 1,456 73%
Generation Cost (0) 557 557 491 784 1,275 129%
Replacement Power Cost 140 131 271 145 27 172 -37%
Marketing Cost 6 5 12 4 5 9 -21%
Gross Profit 105 1,441 1,546 509 1,378 1,887 22%
GP Ratio 42% 68% 65% 44% 63% 56% -13%
Other Cost/Expense/Income (655) 178 (477) 149 307 456 -196%
General, Admin. and Other OPEX 9 55 64 91 264 355 454%
Finance (Income)/Costs (6) 99 93 60 68 128 38%
Foreign Exchange Gains/(Losses) (0) (0) (0) (0) (1) (1) 40%
Other Income (Fly Ash) (8) (11) (19) (3) (22) (25) 28%
Other Income fr Commissioning (650) 36 (615) - (2) (2) -100%
Net Income Before Tax 760 1,263 2,023 360 1,071 1,431 -29%
Provision for Taxes 32 (4) 28 2 34 36 26%
Net Income After Tax 728 1,267 1,995 358 1,038 1,396 -30% Profitability Ratio 289% 59% 84% 31% 47% 42% -50%
24
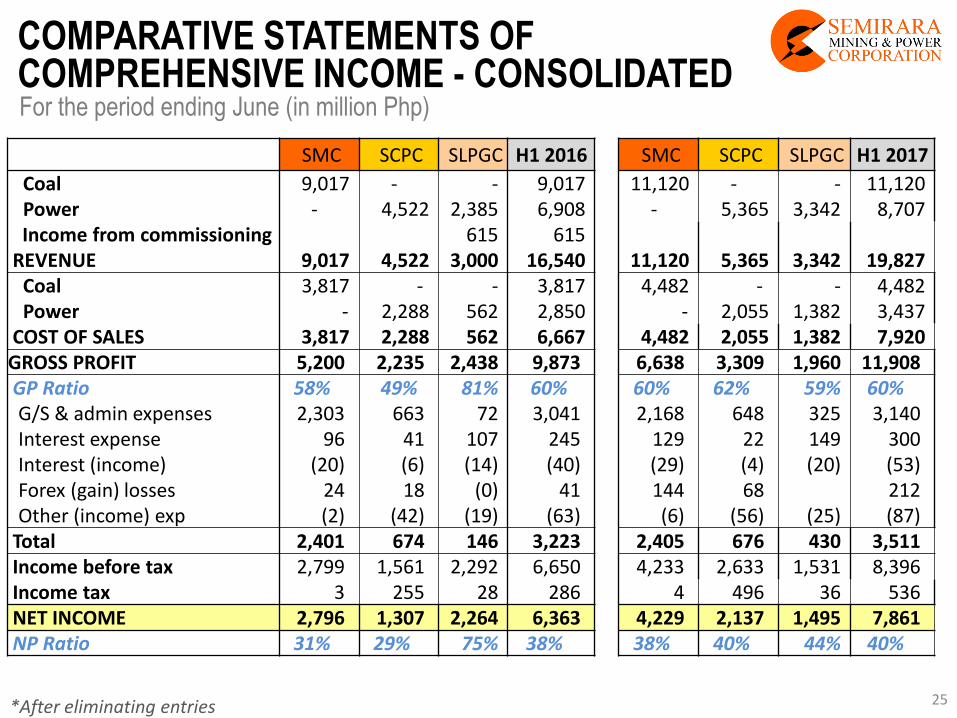
COMPARATIVE STATEMENTS OF COMPREHENSIVE INCOME - CONSOLIDATED For the period ending June (in million Php)
*After eliminating entries
SMC SCPC SLPGC H1 2016 SMC SCPC SLPGC H1 2017
Coal 9,017 - - 9,017 11,120 - - 11,120 Power - 4,522 2,385 6,908 - 5,365 3,342 8,707
Income from commissioning 615 615 REVENUE 9,017 4,522 3,000 16,540 11,120 5,365 3,342 19,827
Coal 3,817 - - 3,817 4,482 - - 4,482 Power - 2,288 562 2,850 - 2,055 1,382 3,437
COST OF SALES 3,817 2,288 562 6,667 4,482 2,055 1,382 7,920 GROSS PROFIT 5,200 2,235 2,438 9,873 6,638 3,309 1,960 11,908 GP Ratio 58% 49% 81% 60% 60% 62% 59% 60%
G/S & admin expenses 2,303 663 72 3,041 2,168 648 325 3,140 Interest expense 96 41 107 245 129 22 149 300 Interest (income) (20) (6) (14) (40) (29) (4) (20) (53) Forex (gain) losses 24 18 (0) 41 144 68 212 Other (income) exp (2) (42) (19) (63) (6) (56) (25) (87)
Total 2,401 674 146 3,223 2,405 676 430 3,511 Income before tax 2,799 1,561 2,292 6,650 4,233 2,633 1,531 8,396 Income tax 3 255 28 286 4 496 36 536 NET INCOME 2,796 1,307 2,264 6,363 4,229 2,137 1,495 7,861 NP Ratio 31% 29% 75% 38% 38% 40% 44% 40%
25
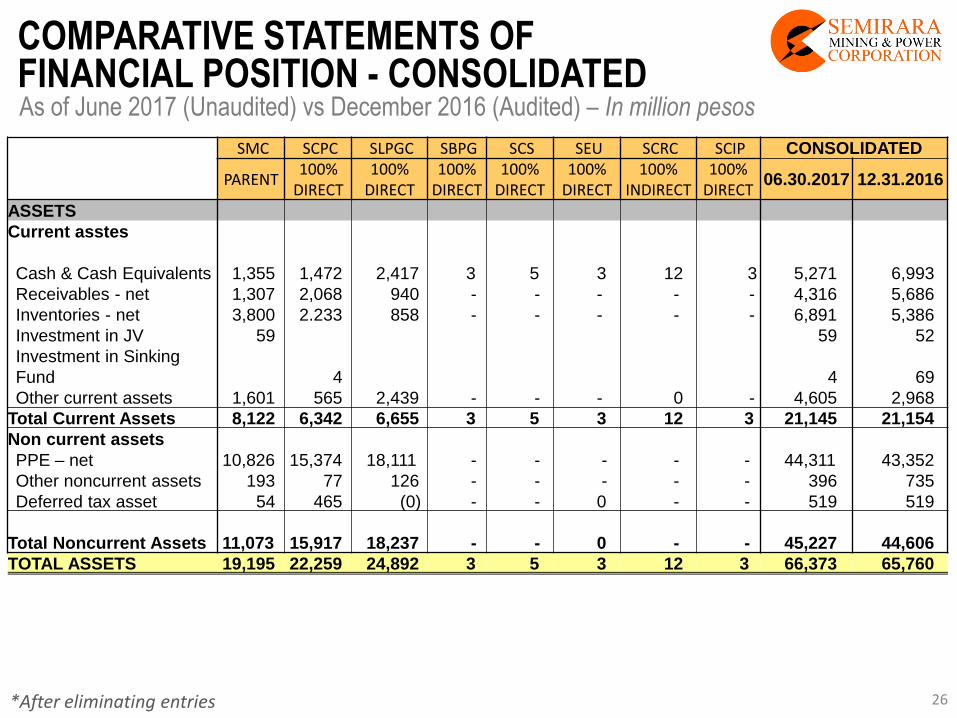
COMPARATIVE STATEMENTS OF FINANCIAL POSITION - CONSOLIDATED As of June 2017 (Unaudited) vs December 2016 (Audited) – In million pesos
*After eliminating entries
SMC SCPC SLPGC SBPG SCS SEU SCRC SCIP CONSOLIDATED
PARENT 100%
DIRECT 100%
DIRECT 100%
DIRECT 100%
DIRECT 100%
DIRECT 100%
INDIRECT 100%
DIRECT 06.30.2017 12.31.2016
ASSETS
Current asstes
Cash & Cash Equivalents 1,355
1,472
2,417
3 5 3
12 3 5,271
6,993
Receivables - net 1,307 2,068 940 - - - - - 4,316 5,686
Inventories - net 3,800 2.233 858 - - - - - 6,891 5,386
Investment in JV 59 59 52
Investment in Sinking
Fund 4 4 69
Other current assets 1,601 565 2,439 - - - 0 - 4,605 2,968
Total Current Assets 8,122 6,342 6,655 3 5 3 12 3 21,145 21,154
Non current assets
PPE – net 10,826 15,374 18,111 - - - - - 44,311 43,352
Other noncurrent assets 193 77 126 - - - - - 396 735
Deferred tax asset 54 465 (0) - - 0 - - 519 519
Total Noncurrent Assets
11,073
15,917
18,237 - - 0 - - 45,227
44,606
TOTAL ASSETS 19,195 22,259 24,892 3 5 3 12 3 66,373 65,760
26
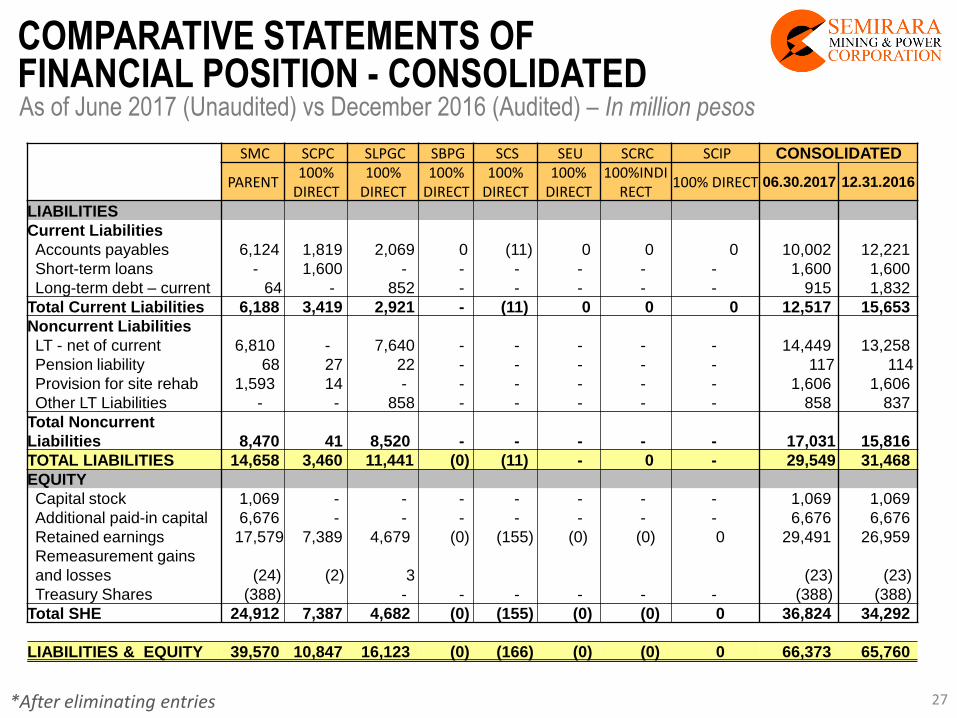
COMPARATIVE STATEMENTS OF FINANCIAL POSITION - CONSOLIDATED
*After eliminating entries
As of June 2017 (Unaudited) vs December 2016 (Audited) – In million pesos
SMC SCPC SLPGC SBPG SCS SEU SCRC SCIP CONSOLIDATED
PARENT 100%
DIRECT 100%
DIRECT 100%
DIRECT 100%
DIRECT 100%
DIRECT 100%INDI
RECT 100% DIRECT 06.30.2017 12.31.2016
LIABILITIES
Current Liabilities
Accounts payables 6,124 1,819 2,069 0 (11) 0 0 0 10,002 12,221
Short-term loans - 1,600 - - - - - - 1,600 1,600
Long-term debt – current 64 - 852 - - - - - 915 1,832
Total Current Liabilities 6,188 3,419 2,921 - (11) 0 0 0 12,517 15,653
Noncurrent Liabilities
LT - net of current 6,810 - 7,640 - - - - - 14,449 13,258
Pension liability 68 27 22 - - - - - 117 114
Provision for site rehab 1,593 14 - - - - - - 1,606 1,606
Other LT Liabilities - - 858 - - - - - 858 837
Total Noncurrent
Liabilities 8,470
41
8,520 - - - - - 17,031 15,816
TOTAL LIABILITIES 14,658 3,460 11,441 (0) (11) - 0 - 29,549 31,468
EQUITY
Capital stock 1,069 - - - - - - - 1,069 1,069
Additional paid-in capital 6,676 - - - - - - - 6,676 6,676
Retained earnings 17,579 7,389 4,679 (0) (155) (0) (0) 0 29,491 26,959
Remeasurement gains
and losses (24) (2) 3 (23) (23)
Treasury Shares (388) - - - - - - (388) (388)
Total SHE 24,912 7,387 4,682 (0) (155) (0) (0) 0 36,824 34,292
LIABILITIES & EQUITY 39,570 10,847 16,123 (0) (166) (0) (0) 0 66,373 65,760
27
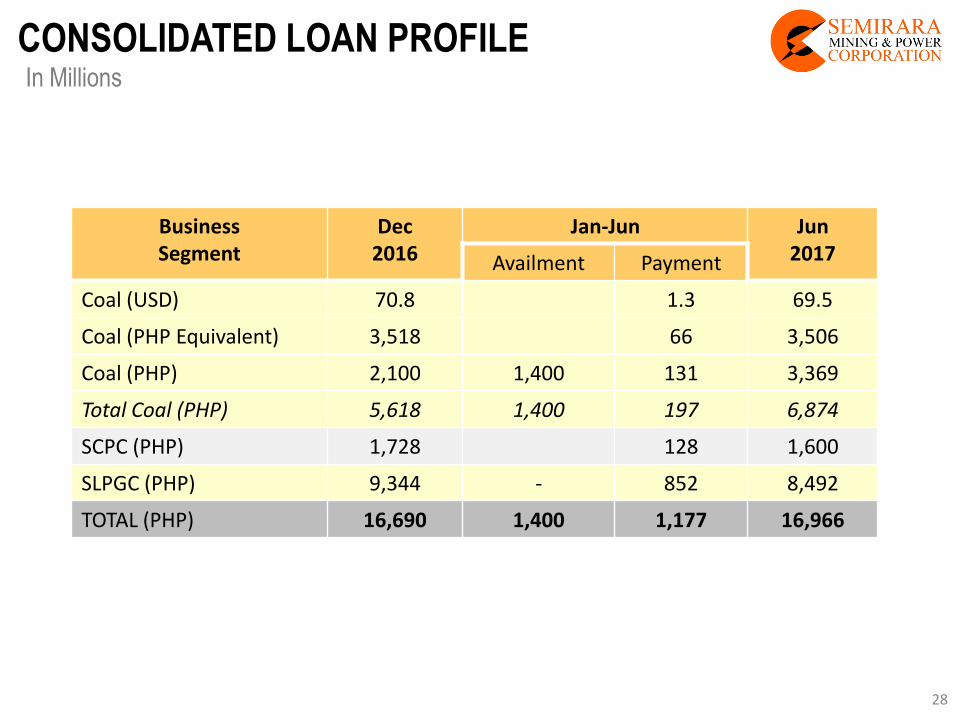
CONSOLIDATED LOAN PROFILE In Millions
Business Segment
Dec 2016
Jan-Jun Jun 2017 Availment Payment
Coal (USD) 70.8 1.3 69.5
Coal (PHP Equivalent) 3,518 66 3,506
Coal (PHP) 2,100 1,400 131 3,369
Total Coal (PHP) 5,618 1,400 197 6,874
SCPC (PHP) 1,728 128 1,600
SLPGC (PHP) 9,344 - 852 8,492
TOTAL (PHP) 16,690 1,400 1,177 16,966
28
DISCLAIMER
•Semirara Mining and Power Corporation (the “Company”) and its advisors assumes no responsibility or liability regarding actions or decision that may be taken regarding any information resulting from unintentional errors or omissions contained in this document. •In addition, this document contains financial information and results of operation, and may also contain certain projections, plans, strategies, and objectives of the Company, that are not statements of historical fact which would be treated as forward looking statements within the meaning of applicable law. Forward looking statements are subject to risks and uncertainties that may cause actual events and the Company’s future results to be materially different than expected or indicated by such statements. No assurance can be given that the results anticipated by the Company, or indicated by any such forward looking statements, will be achieved. •This document is not an offer to sell securities or a solicitation of an offer to buy securities.
29