h istorical assessment of the port of singapore authority ... · authority and its progression...
TRANSCRIPT
H
05-19
POLICY AND GOVERNANCE
istorical assessment of the Port of Singapore Authority and its progression towards a ‘High-Tech Port’
Jayarethanam Sinniah Pillai
Asia Pacific School of Economics and Government THE AUSTRALIAN NATIONAL UNIVERSITY http://apseg.anu.edu.au
Asia Pacific School of Economics and Government
DISCUSSION PAPERS
© Jayarethanam Sinniah Pillai 2005 The Policy and Governance Program at the Asia Pacific School of Economics and Government publishes a series of Discussion Papers on a range of policy issues, including issues of political institutions and institutional design, accountability and public sector management, and the relationship between political and economic reform. The Discussion Papers disseminate research quickly in order to generate comments and suggestions for revision or improvement. Since they often represent preliminary or incomplete work, citation and use of such a paper should take account of its provisional character. The opinions contained in the series are those of the authors, and not those of the Asia Pacific School of Economics and Government at The Australian National University.
Policy and Governance Discussion Paper 05-19
Jayarethanam Sinniah Pillai <[email protected]> is a PhD candidate in the Policy and Governance Program at ANU’s Asia Pacific School of Economics and Government. Abstract This paper tracks the development (1970-2000) of the Port of Singapore Authority (PSA) and its achievements towards the development of a competitive regional port via the adoption of technology. In doing so, the aim is to highlight the importance of continuous institutional reconfiguration and the adoption technology to leverage competitive advantage leading to significant developments. The findings in this paper highlight the flexibility of state-led institutional and strategic pragmatism towards development.
1
Historical Assessment of the Port of Singapore Authority
and its progression towards a ‘High-Tech Port’
Jayarethanam Sinniah Pillai*
December 2005
Abstract
This paper tracks the development (1970-2000) of the Port of Singapore Authority (PSA) and
its achievements towards the development of a competitive regional port via the adoption of
technology. In doing so, the aim is to highlight the importance of continuous institutional
reconfiguration and the adoption technology to leverage competitive advantage leading to
significant developments. The findings in this paper highlight the flexibility of state-led
institutional and strategic pragmatism towards development.
* PhD Candidate in the Policy and Governance Program at ANU’s Asia Pacific School of Economics and
Government
2
1. Introduction
Once the premier port in colonial Southeast Asia and one of the foremost in the British
Empire, Singapore now ranks as one of the world’s top competitive ports, in terms of tonnage
and port efficiency, with the second highest per capita gross domestic product (GDP) in Asia.
This is evident from the numerous accolades it has won for its efficiency in port operations.1
Though competition in port operations and maritime activities has intensified since the late
1980s, the Port of Singapore Authority (PSA) has warded off its major competitors, mainly
from the Hong Kong Port and Port of Rotterdam.
There is an existing voluminous literature that discusses at length, the successes
achieved by the Singapore Port since Singapore gained its independence in 1965.2 One of the
world’s classic entrepots, Singapore developed, over a long period of time, strong commercial
and shipping linkages with other ports. Interestingly, containerisation, as a new shipping and
cargo handling technology, further reinforced Singapore’s centre-dominance, as it became the
focus for large volumes of transhipment container traffic. There is a predominant economic
literature on the administrative structure of the Singapore port focusing primarily on the
existing and desired division of ownership and scale. While important, these administrative
criteria do not provide any insights into the contextual relationships within which the
Singapore Port activities take place. For reasons both of national cultural diversity and local
difference, and due to the fact that the Singapore port is culturally situated, locality-based, and
grounded historically, this paper aims to further add to the existing literature by throwing
further light into the success of PSA since the 1970s.
This paper will be discussed as follows: Section 1 discusses the historical
development of the Port of Singapore. Section 2 briefly looks at the establishment and
organisational structure of PSA. Section 3 dwells on the performance of PSA from 1970 to
2000. Section 4 discusses the historical development of the port of Singapore and also reports
1 Such as Best Container Terminal (two years from 1999-2000) from the Lloyd’s List of Maritime Asia
Awards; Named the Best Seaport in Asia (13 years) from the Asian Freight Industry Awards. For more details,
see http://www.psa.com.sg/ [accessed 13 September 2001]. 2 See for example, Huff, W. G. (1994) The Economic Growth of Singapore: The Economic Development in
the Twentieth Century, (Cambridge: University Press), pp. 120 – 149; Chia. L. S. and Colin Mac Andrews
(eds.)(1981) “The Straits of Malacca and Singapore: Navigational Resource and Environmental
Considerations”, in Southeast Asian Seas: Frontiers for Development, (Singapore: McGraw Hill), pp. 252-
263; Broeze, F. (ed) (1997) Gateways of Asia: Port Cities of Asia in the 13th-20th Centuries, (London: Kegan
Paul International).
3
the achievements of the 1990s through interviews done in Singapore in regard to PSA’s
achievements. And section 5 concludes the paper.
2. Historical Development of PSA3
The story of the port is really the story of Singapore. The modern port of Singapore traces its origin
to the mouth of the Singapore River and it is here that the port developed and flourished. The
Singapore River developed into the main commercial centre with a supplementary trading area for
small craft at the estuary of the Rochor and Kallang Rivers. When Stamford Raffles and his small
battalion arrived off Singapore on 28 January 1819 with the intention of establishing a trading
station for the British East India Company, one of his earliest tasks was to deploy a survey vessel to
conduct a hydrographic survey of the port.
After Raffles established a trading station in Singapore in 1819, East Indiamen and
Opium Clippers from India, an assortment of Chinese junks from Fukien, Hainan and
Kiangsu, Wangkang and Tope from Thailand and Indo-China, Palari, Golekkan, Lambo and
Leteh-ieteh from the Indonesian archipelago, and Tongkang and Pinas from the Malay
Peninsula, all came to their respective anchorages off the Singapore River.4 Their cargoes
were then transported by lighters to Boat Quay where the greater part of the business was
conducted. Boatyards developed along the Telok Ayer Street waterfront. Commercial Square,
now known as Raffles Place, developed as an adjunct to Boat Quay and until the reclamation
of Collyer Quay in the 1860s, the buildings and premises reached the waterfront and had their
own jetties for passengers and cargoes.
The administration of the Port was vested with the Master Attendant (Harbour
Master). Besides laying down the procedures for reporting the arrivals and departures of
ships, their passengers and cargoes, the regulations also stipulated the charges for repairing,
watering and ballasting ships calling at the port. Provision was also included for a register of
cargo vessels. Moreover, records of local shipping in the Master Attendant’s report book
show that for the year 1822, 139 square-rigged vessels entered the Port of Singapore.5 In
1834, 517 square-rigged vessels totalling 156,513 net registered tons (n.r.t) were recorded.6
The increase of traffic in the Port created a lot of congestion in the Singapore River and the
lighterage of cargo became a problem. The situation further worsened in 1845, when the
Peninsula and Oriental Steam Navigation Company (P&O) inaugurated its first scheduled
3 Ibid. 4 Port of Singapore Corporation (2001) http://psa.com.sg/about/8-3c.html. [Accessed 13 September 2001 5 Ibid. 6 Ibid.
4
steamship service from Europe to the Straits of Malacca through Singapore, as there was no
wharfage and coal, which were used for bunkering the steam vessels of that period. They had
to be laboriously brought in by sailing lighters, stored along the Singapore River, and then
brought out whenever a steamer arrived.
Moreover, bad weather conditions held up bunkering operations and inevitably,
several hundred tonnes of coals were lost when heavy seas swamped lighters. This led to
another hydrographic survey done at Keppel Harbour (then known as New Harbour) in 1849
by the P&O Company, and to the opening of their coal-bunkering pier at Tebing Tinggi in
1852. Keppel Harbour, which later became the major gateway of the Port of Singapore, was
thus opened. From the onset, ocean shipping favoured the Keppel wharves while coastal
shipping continued to anchor off the Singapore River. The outer roads, situated in the
extensive bay around which Singapore and to the east of the city, provided ‘a fine tune natural
open anchorage suitable for ocean-going vessels of deep draught’.7 Here, ships were serviced
immediately. Development of Keppel Harbour was rapid, with Jardine Matheson, the Borneo
Company and John Purvis and Sons opening up their wharves, warehouses and coal stores
along the stretch east of Tanjong Aur (St James).8 When the Patent Ship and Dock Company
opened Singapore’s first dry dock at Pantai Chermin, it was followed by the establishment of
the Tanjong Pagar Dock Company in 1863.9 At Pulau Brani, the firm of Buyers & Robb
opened the Bon Accord Dock while the British Navy established a coal depot there.10 Since
its formation, the Tanjong Pagar Dock Company has been operating dry docks and wharves in
Keppel Harbour and dominated the operation and shipping business in Singapore. In fact, the
company possessed a wharf frontage of about 1¼ miles and warehouses for 200,000 tonnes of
cargo and 250,000 tonnes of coals and kits properties, which extended over 375 acres.
With these developments, some 3,000 feet of wharves became available and as a
succession of shipping lines inaugurated regular steamship services through the Port of
Singapore, the tonnage of shipping rose from 375,000 n.r.t in 1860 to 650,000 n.r.t in 1870.11
The great impetus to the increase in steamship tonnage was the opening of the Suez Canal in
1869. The supply of raw materials and foodstuffs for industrialisation in Europe and the
securing of markets for European goods in Asia greatly expanded Singapore’s early entrepot
trade and commercial activities.12 Furthermore, as early as the 1880s, Singapore Chinese
7 International Shippers Chambers, Report on the harbour of Singapore, as cited in Huff, (1994), p. 138. 8 Port of Singapore Corporation (2001) [accessed 18 February 2001], http://psa.com.sg/about/8-3c.html. 9 Ibid. 10 Ibid. 11 Ibid. 12 Port of Singapore Authority (1982) Port of Singapore Handbook, (Singapore: Kan Wah Printers Pte Ltd).
5
interests were operating regular steamship services between Singapore and the Indonesian
archipelago.13 The Chinese succeeded where the indigenous people of Southeast Asia failed.
Few indigenous entrepreneurs had the commercial and technical knowledge required to
operate regional shipping services, nor were they able to mobilise sufficient capital. In
contrast the Chinese networks of business and social contacts not only helped in raising
capital but also guaranteed custom.14 In 1880, the total tonnage of shipping had risen to 1.5
million n.r.t with steamships aggregating 1.2 million n.r.t. With additional shipping lines like
the Straits Steamship Co and East Asiatic Co inaugurating regular services, total shipping
tonnage rose to 5.7 million n.r.t in 1900.
Increased shipping activities, increased port congestion and the lack of adequate
provision of infrastructure and shipping facilities by the Tanjong Pagar Dock Company led to
the British government to expropriate the company in 1905 and set up a port trust.15 From
1913, the trust was known as the Singapore Harbour Board, which was constituted in the
Straits Settlements Port Ordinance of 1912. The Board oversaw the construction between
1908-17 of modern port facilities, which made Singapore the ‘Second to none port out East’.16
By 1917 Singapore had 9,822 feet of wharfage, nearly 8,000 feet of which now offered ships
over 30 feet of water. Facilities, such as the entire wharf frontage built originally of wood,
were demolished and replaced with concrete structures. In addition, among other facilities, a
bonded storage and cold storage were developed. In conjunction with these new facilities,
quick dispatch at the wharves was facilitated by an abundant supply of casual labour.
Between 1912 and 1920, entrepot trade through Singapore increased tremendously, with more
facilities being added to the port, including the discovery of deep and sheltered water.
During the Pacific War (1941-45) about 70 per cent of the warehouses in Keppel
Harbour suffered damage from bombing raids and much of the machinery and equipment in
the dockyards fell into disrepair. Port waters became encumbered with sunken craft and
maintenance of port installations and ancillary facilities came to a standstill. When the
Singapore Harbour Board resumed control in 1946, it went about the reconstruction of the
port. Once the restoration of the port facilities was complete, passenger and cargo services
resumed with the shipping tonnages steadily mounting from 20.4 million n.r.t in 1947 to 82.9
13 Trace, K. (1997) “Asean Ports since 1945: Maritime Change and Port Rivalry” in Broeze, F. (ed) (1997)
Gateways of Asia: Port Cities of Asia in the 13th-20th Centuries, (London: Kegan Paul International), p. 319. 14 Ibid. 15 Port of Singapore Authority (1982) Port of Singapore Handbook. 16 Singapore Harbour board (1922) A Short History of the Port of Singapore, (Singapore: Harbour Board), p.
5.
6
million n.r.t in 1963.17 This trend of rapid growth continued well into the 1960s, with
Singapore exporting the region’s primary commodities and distributing the manufactured
goods from Europe and USA.18
Singapore became a self-governing state in 1959. The new leaders inaugurated an
ambitious policy of intensive and rapid industrialisation to provide badly needed employment
and to open up new avenues for economic growth.19 With its First Development Plan of
Singapore for 1961-64, the Singapore government embarked on a policy of industrialisation.
The government created a system of incentives to attract foreign and domestic capital into a
wide range of new manufacturing enterprises, the development of a whole new infrastructure
to support the envisioned industrial expansion, training of unskilled labour force, the
development of competent local technical and managerial staff and the urgent awareness of
the need to focus on the further development of the Singapore port. The first chairman of the
port, Mr. Howe Yoon Chong expressed it like this: ‘As Singapore’s industrialisation
programme continues to grow, the parallel growth of the port and its services and facilities
will continue to involve it as an inseparable partner of the country’s progress’.20
My Howe Yoon Chong’s comments came at a period when containerization
became a significant technical introduction to the port industries in the Asean region. Whilst
the earliest container services date from the 1950s and early 1960s, the modern intermodal
system of containerization was developed in the mid 1960s.21 For instance, Japan was the
first Asian country to adopt containerization services in its port activities. In contrast, the
introduction of containerization services had immediate implications for Asia’s major
entrepot ports. In July 1966 Singapore independently appointed committees to consider the
implications of containerization and make recommendations regarding container terminals,
noting that prior to their commissioning conventional vessels carrying containers would have
to be handled at existing berths.
In Singapore, the introduction of containerization coincided with a more aggressive,
entrepreneurial style of port management, prompted by the 1965 split with the Federation of
17 Port of Singapore Corporation (2001) [accessed 18 February 2001], http://psa.com.sg/about/8-3c.html. 18 Port of Singapore Authority (1982) Port of Singapore Handbook, pp. 2-3. 19 Economic Planning Unit of Singapore (1964) First Development Plan, 1961-1964: Review of Progress for
the Three Years Ending 31st December 1963, (Singapore: Prime Minister’s Office), p. 10. 20 Chong, H. Y. (1973) ‘The Port of Singapore’, in Towards Tomorrow, (Singapore: National Trades Union
Congress) p. 97. 21 Jennings, E. (1979) Cargoes. A Centenary of the Far Eastern Freight Conference, (Singapore: Meridian
Communications), pp. 59-64.
7
Malaysia.22 Singapore moved quickly in an attempt to maintain its position as regional hub, a
role then threatened by the economic policies of its neighbours.23 The most significant port
development took place on 23 June 1972, when a container berth was opened at Tanjong
Pagar (at the East Lagoon). With that development, Singapore became the first port in
Southeast Asia to accommodate a third generation container vessel, making it an important
link in the emerging chain of global container ports.
Because of increased efforts on improving port activities, some 12,500 acres of
swamps and mangrove at Jurong on the Southwest of the island were converted into what has
since become a prosperous industrial town.24 Jurong Port, Singapore’s international gateway
for bulk cargo was established to service Jurong Industrial Estate and the nearby shipbuilding
and repairing industries. Since then, the number of vessels over 75 n.r.t entering and clearing
increased from 10,800 and 34,500 n.r.t respectively in 1960 to 18,400 and 73,000 n.r.t in 1970
and to 24,900 and 155,200 n.r.t in 1980.25
The achievements of PSA can be seen from the achievement of the domestic ports and
container terminals. In 1999, PSA operated five port and container terminals in Singapore with a
total wharf length of about 30 km. It has continually upgraded its port facilities ahead of demand.
PSA sustains its competitive edge by planning investments in new port service, including freight
futures, ship management and ship brokering.26
In 1966, PSA decided to construct a container complex within Singapore. At the time,
the technique of handling cargo with containers and container ships was still relatively new and few
ports had such facilities. But, in hindsight, containerisation has been a worthwhile risk for PSA.
From 14,000 twenty-foot equivalent units (TEUs) in 1972, when the first three container berths
were opened at Tanjong Pagar Terminal, the volume of container traffic passed the one million
mark by 1982.27 The Brani Container Terminal began operating in December 1991 and is linked to
the main port area by a four-lane causeway across the Keppel Channel. In 1996, the eighteen main
22 Robinson, R. (1989) “Regional Ports: Development and Change since the 1970’s”, (in T. R. Leinbach and
Chia Lin Sien (1989) Southeast Asian Transport: Issues in Development, (Singapore: Oxford University
Press), p. 139. 23 Trace, K. (1997) “Asean Ports since 1945: Maritime Change and Port Rivalry”, p. 323. 24 Port of Singapore Authority (1982) Port of Singapore Handbook, p. 3. 25 Sun, W. S. (1976/77) ‘The Port of Singapore: Post-War Development of its Physical Facilities’, Academic
Exercise, submitted in partial fulfilment of the BA (Hons) Degree, (Singapore: Department of Geography,
National University of Singapore), pp. 23-25. 26 Refers to commodities or other financial products bought or sold at an agreed price for delivery at a
specified future date, in relation to shipping industries. 27 Yuan, L. T. (1997) ‘Infrastructure Geared to International Economic Activity: Singapore’, p. 77.
8
berths and twelve feeder berths handled 13 million TEUs of cargo.28 According to Keith Trace
(1997), within the ASEAN region, the pivotal position of the Port of Singapore has been
enhanced.29 He highlighted that PSA handled more containers than any other port in the world in
1990. This was due to increasing number of Japanese, Taiwanese and Korean firms setting up in
Southeast Asia as well as from the late 1980s retreat from maritime nationalism. The effect of this
retreat from maritime nationalism has been to enhance Singapore’s role as a transhipment port.
The main share of the container business for Singapore is transshipment.30 A ship
unloads containers that are stored in the port until they are loaded on to another ship for a different
destination. While the containers are in storage, they are the sole responsibility of PSA. Thus, it is
in the interest of the port to minimise the waiting and processing time of vessels whose fixed costs
are high. The longer the waiting time, the less satisfied customers would be. PSA competes under
these strained conditions by using information technology to support its operations. The
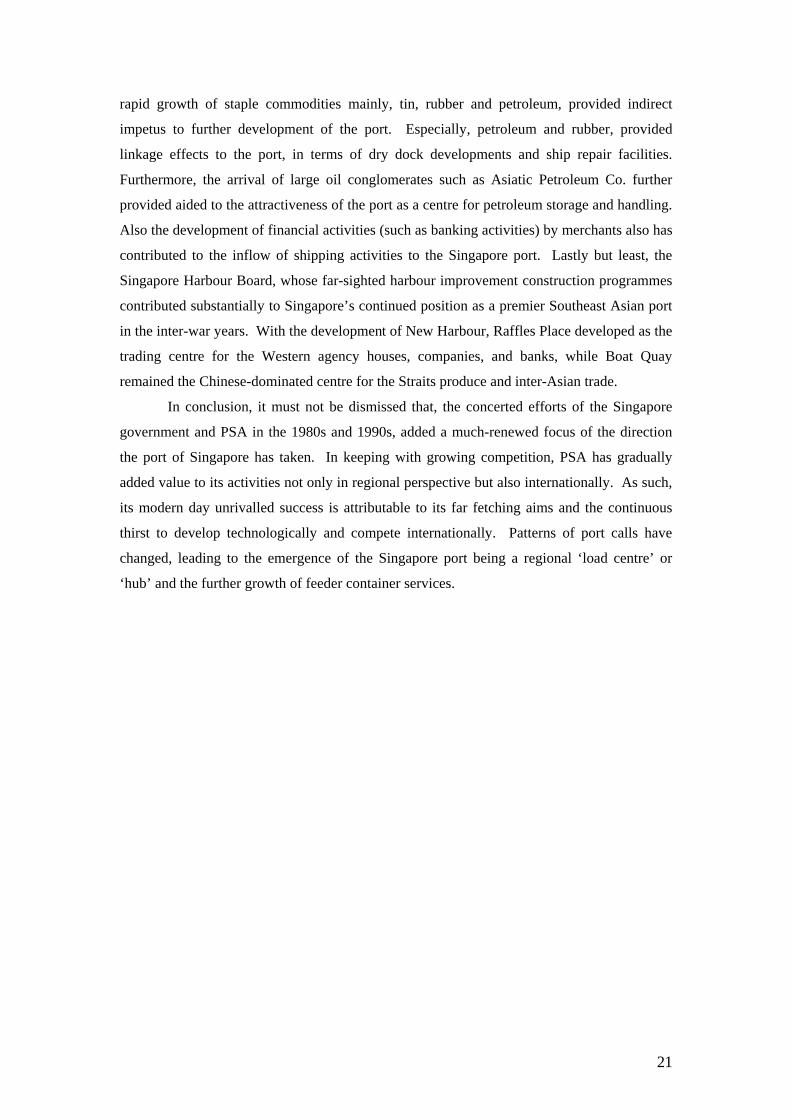
importance of transshipment activities to Singapore can be seen from Table 1. Keith Trace quoted
from a seminal paper of Ross Robinson that 3.1 to 3.7 million of the 1990 container throughput of
5.2 million might be classed as transshipment cargo.31 According to figures in Table 1, it is shown
that the capacity of feeder routes serving Singapore appears to support Ross Robinson’s judgment.
3. The Establishment and Organisational Structure of the Port of Singapore
Authority
After World War II, the administration of the port passed gradually to the Singapore government.
In 1960 the government undertook a study to consider the restructuring of all port operations
including the functions of the Singapore Harbour Board, the Marine Department and the Marine
Branch of the Public Works Department. This was to ensure that all the port operations and
decision-making came under one authority and to eliminate duplication of activities. The outcome
of the study was the establishment of PSA on 1 April 1964 under the Port of Singapore Authority
Act 1963. This consolidated single organisation operated as a statutory board under the Ministry of
Communications and Information. PSA took over the functions, assets and liabilities of the
Singapore Harbour Board, the operation of the pilotage services and the functions previously
undertaken by the Marine Department. Its principal activities were to provide and maintain
28 Ibid. 29 Trace, K. (1997) “Asean Ports since 1945: Maritime Change and Port Rivalry”, p. 331. 30 The transfer of containers or bulk cargo from one vessel or vehicle to another. 31 Robinson, R. (1991) “Hubs and Feeders: The Dynamics of Asian Maritime Development”, Centre for
Transport Policy Analysis, University of Wollongong, Seminar on The Globalisation of Liner Shipping,
Sydney 1991.
9
services and facilities in the port, to regulate and control navigation within the limits of the port and
its approaches, to provide pilotage services, to provide and maintain adequate, efficient lighthouses
and navigational aids in the territorial waters of Singapore and, most importantly, to promote the
use, improvement and development of the port.
On 2 February 1996, some of the services of the PSA, the Maritime Department
and the National Maritime Board of Singapore were merged to form the Maritime and Port
Authority of Singapore (MPA), a statutory board under the Ministry of Communications and
Information Technology (MCIT). This change was to create a more dynamic and integrated
structure. MPA has full responsibility for the regulation of port and shipping services, while
PSA manages and operates the container/cargo terminals and other business and commercial
services. The key mission of the MPA is to protect Singapore’s strategic maritime interests
and to promote Singapore as a major port and international maritime centre. MPA was
formed at a time when all over the world, ports were being corporatised or privatised to give
them the necessary flexibility and autonomy to reposition themselves.
The Singapore government corporatised PSA in October 1997. 32 This
corporatisation created many commercial incentives, which apply to private firms and
increased the separation between Government Linked Companies (GLCs), such as PSA, and
the Singapore government. The commercial incentives encompassed administrative reforms
aimed at giving public enterprises a more commercial focus and reforms to establish a
competitive environment. Importantly, the underlying motive was to give PSA greater
responsibilities and autonomy over day-to-day decisions on investments, revenue and
expenditure and commercial strategy, which previously were in the hands of the Singapore
government. Furthermore, this separation ensured a level playing ground so that the GLCs do
not have any competitive advantages or disadvantages relative to private organisation
operating under similar market risks.
3.1. The Organisational Structure of the Port of Singapore Authority
Since its establishment in 1964, PSA Corporation has become increasingly nimble, flexible
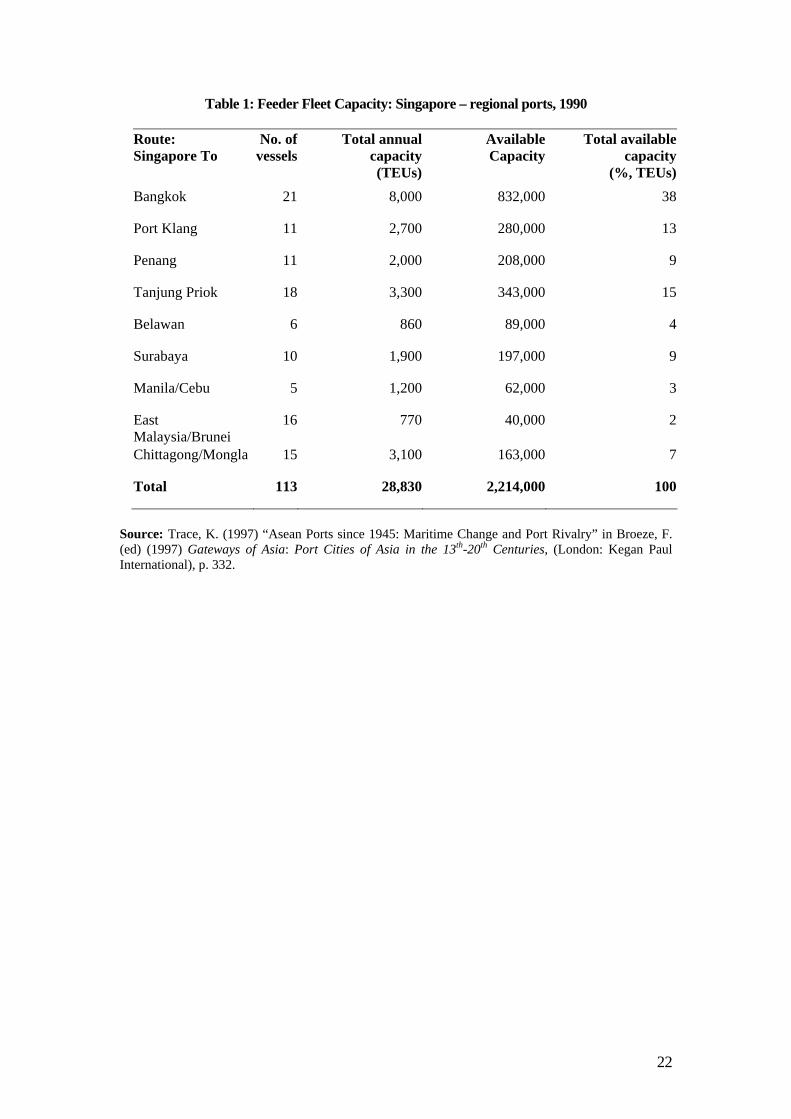
and customer-oriented with an evolving organisation structure. Figure 5.1 shows the
company’s organisation since it was corporatised in 1997, and assumed the structure and
operations of a private company with the Singapore government as the single shareholder. 32 Corporatisation involves the transformation of government enterprises into separate corporate entities with
clear objectives, the establishment of a board whose members are appointed on the basis of their expertise,
and managers who are given commercial objectives and the powers to raise funds on private capital markets.
In other words, a public enterprise faces exactly the same market conditions as competing organisations in the
private sector.
10
The new structure enabled PSA to operate more efficiently as a commercial
organisation. The creation of the Strategic Business and Strategic Development groups
presents many advantages. Each business division is independent, commercially flexible and
has greater control over its costs, which was not previously possible due to Singapore
government involvement. According to the regional manager for international business at
PSA, Mr. Peter Chew, ‘control of costs and increased customer-oriented focus is indeed
timely because the shipping industry is going through a difficult time of declining freight
rates’.33 PSA’s two strategic groups in Figure 5.1are:
A. The Strategic Business Group, which comprises:
1. Container Terminal Division, which has been PSA’s forte and continues to remain its
core business.
2. International Business Division, formed in 1996, which has been PSA’s international
arm for overseas business opportunities
3. Warehousing and Logistics, which is PSA’s new business focus. PSA will actively
seek business ventures with multinational corporations involved in high value-added
products and services.
B. The Strategic Development Group
This group supports PSA’s thrust to become more customer-focused, by continually improving
productivity through human resource development and innovative use of technology in port
management. This group comprises the corporate services division, engineering division, finance
division, human resource division, information technology division and properties division.
PSA also has several subsidiaries. For instance, under the International Business
Division it operates Port and Maritime Services (Pte) Ltd, a wholly owned subsidiary, which
provides expert and technological services to overseas ports. Set up in 1972, this company
undertook the operations of tugboats, ferries, slop collection, garbage collection and repairs and
maintenance of crafts. Later it expanded its role to provide comprehensive port, marine and
computer-related consultancy services both in Singapore and overseas. In 1986, the company was
renamed as PAM Services Pte Ltd. Similarly, Singapore Engineering and Consultancy Services
(Pte) Ltd (SPECS) is another PSA company working in regional consultancy work. Set up in 1978,
it specialises in providing port engineering consultancy services in Singapore and overseas. It was
renamed in 1990 as SPECS Consultants Pte Ltd. The company today continues to share its
expertise in port engineering design and the construction and maintenance of port facilities with its
international clientele, such as from China and Yemen. Through both these organisations, PSA
33 Interview with Mr. Peter Chew of the International Business Division (PSA), 19 January 2001.
11
aims to be a major global logistics owner-operator of port and container terminals and supporting
logistics businesses with the aim of maintaining long-term growth, in terms of larger profits and
increased overseas projects. PSA uses both subsidiaries to provide port and container services
overseas because PSA requires vast amounts of resources to maintain overseas operations and PSA
alone is not able to look after all the operations overseas and within Singapore. As a result, PSA
has created these subsidiaries to look after the operations overseas, while it retains full control on
decision-making.
In the course of project design, engineering and the actual construction, apart from
hardware technology transfer, significant service technologies are transferred by PSA. These range
from basic craft skills to sophisticated engineering, management and information technology
services. In an advanced transfer of service technology, subsidiaries infuse new knowledge into
host country organisations, which enables them to eventually design, construct and manage the
running of the port and terminal projects independently.34 In effect, PSA transfers its skills to
clients so that, in time, they can carry out the type of work that PSA does within Singapore.
4. Historical Performance of the Port of Singapore
While Singapore port’s geographical location played a crucial part in transforming the entrepot port
to an international port of call, this paper argues that there were other reasons to be critically
analysed in order to throw light in the success of the port. With the opening of the Suez Canal,
Singapore became the focal point of steamship lines in the Eastern trade.
Despite improvements in marine technology, steamship ships could not sail long distances
without bunkering, so that shipping routes along the coast of Southern Asia, down the Straits of
Malacca into the South China Sea, making it more important than the Sunda Straits, and giving
Singapore a new strategic and economic significance in the trade between Europe and the Pacific.
From than onwards, its enterprising merchants developed to the full Singapore’s entrepot
potentialities along the steamship routed between Suez and Shanghai.35 The rapid growth of the
Singapore port was also largely attributable to the rapid growth in the tin, petroleum and rubber
industries in Southeast Asia during this period, which added value to Singapore’s geographical
location.. The most significant economic event for Singapore before World War I (WWI) was the
development of its natural hinterland, Malaya, under the British rule. At least a decade before
34 Advanced technology transfer refers to projects that require sufficiently long duration, especially when the
engineering and construction elements of the job are likely to be repeated over time. Furthermore, it also
refers to the transfer of technological, practical expertise and importantly, the transfer of an understanding of
the thought processes that go into the technical and commercial decision-making. 35 E. Hyde, F. (1973) Far Eastern Trade 1860-1914, (London), pp. 16-19.

12
WWI Singapore’s trade with Malaya had already exceeded in value the trade with the Dutch East
Indies, which had been until then Singapore’s most important trading area in Southeast Asia.36
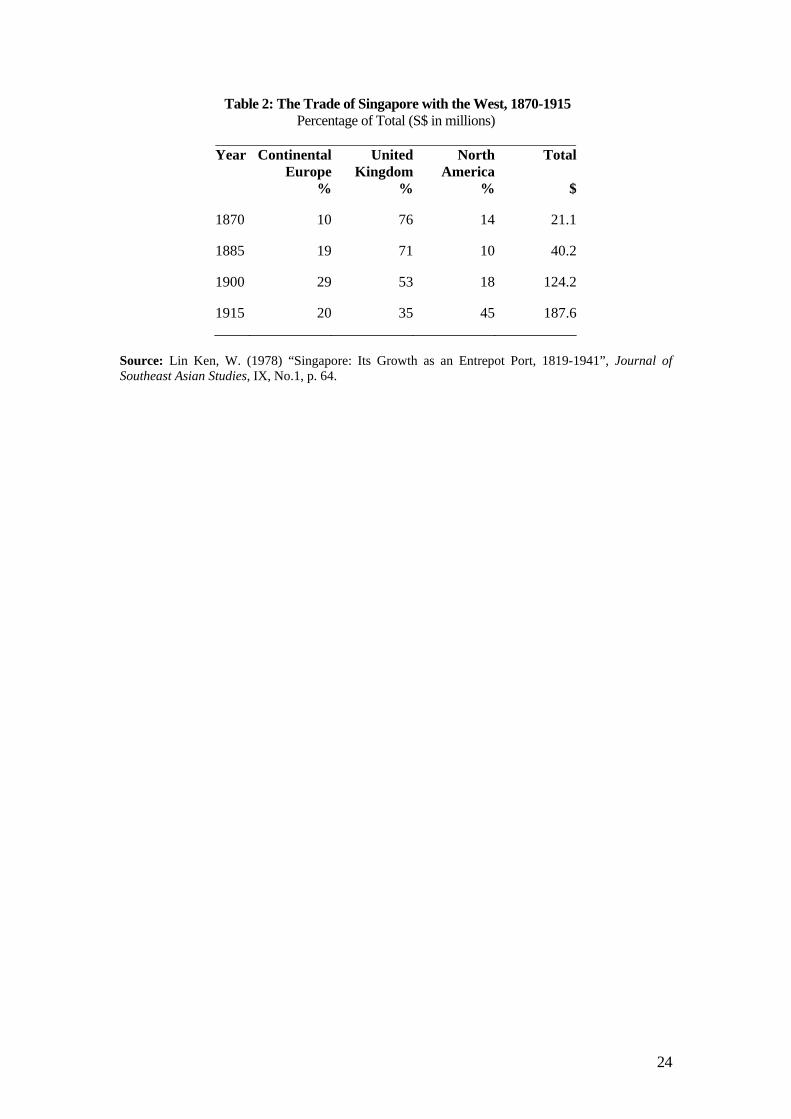
Before WWI, tin was the single most important item of Singapore’s export trade with the
West (see Table 2). At the same time, rubber was also fast becoming an important tradable
commodity. Furthermore, tin and rubber were the principal raw materials that drew economies of
the West and Southeast Asia into industrial interdependence.
As Table 2 indicates, the industrial demand for tin and rubber contributed towards a shift in
the direction of Singapore’s trade with the West from the UK to Continental Europe and especially,
the US. According to Table 2, the increase in the share of Continental Europe and the US in
Singapore’s trade, especially in the export sector reflected the relative decline of Britain’s industrial
position as the former became industrialized. This is attributable to the growth of the motor-car
industry just before World War I. Although the port of Singapore is within the British Empire,
Singapore was increasingly more important for the US than Britain.37 In overall trade of Singapore,
the West managed to keep its share in proportional terms, but East Asia and India had declined in
importance, while Southeast Asia continued to expand as the main outlet for Singapore’s trade.
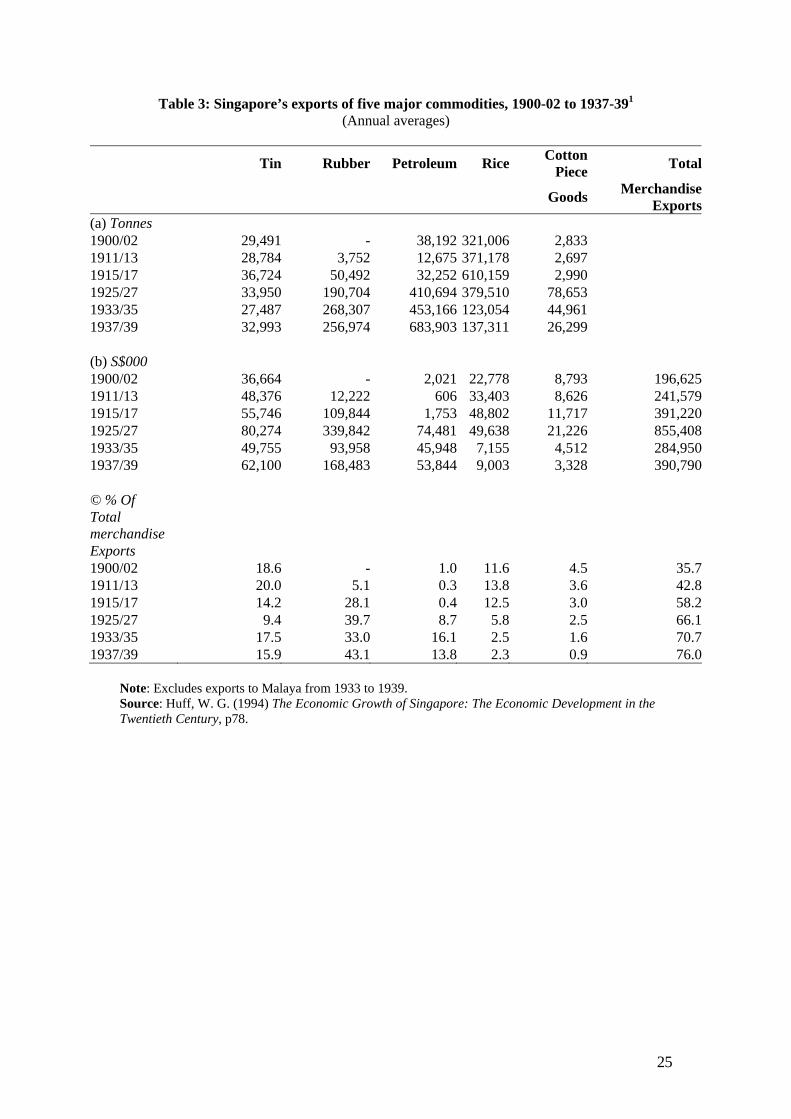
The gradual dominating position in Singapore’s port performance can further be seen from the
exports of rubber, tin and petroleum from Table 3.
In support of Tables 1 and 2, Table 3 justifies that in 1915-17 tin, rubber and petroleum
comprised of two-fifths by value of Singapore’s exports; the proportion rose to nearly three-fifths in
1925-1927, due to further rapid growth in rubber exports and the sudden growth of the petroleum
trade. Between 1937-39, more than half (43 per cent) of the total merchandise exports from
Singapore came from rubber. The actual importance of these three commodities was even greater,
since, due to Singapore’s political independence from its hinterland, export statistics included the
return flow of food and manufactured goods re-shipped from Singapore to the surrounding region,
largely for sale to the producers of staple exports.38 Most importantly, rubber led to the expansion
of shipping, railway and port facilities in Singapore. Moreover, it was associated with several other
major developmental features in the European business community, principally the widespread
adoption of the managing agency system and the establishment of oil palm estates.
Yet prior to World War II (WWII) petroleum created few major linkages, while some
important linkages associated with tin production weakened. During the inter-war period
petroleum in many ways remained an enclave industry. Physically it did not enter Singapore
36 Lin Ken, W. (1978) “Singapore: Its Growth as an Entrepot Port, 1819-1941”, Journal of Southeast Asian
Studies, IX, No.1, p. 67. 37 Ibid, p. 65.
38 Huff, W. G. (1994) The Economic Growth of Singapore: The Economic Development in the
Twentieth Century, p77.
13
except for the island’s own use, and since Singapore residents did not own the product, there
was no petroleum market in Singapore. What purpose Singapore port served for the oil
companies whom produced petroleum in Netherlands India and British Borneo was that it
served as in handling, storing and shipment, with consequent low value added and limited
employment. This is because much of the liquid fuel was sold to ships in Singapore as oil
bunkers. Petroleum exercised its greatest effect on Singapore’s economic development
through volume, and the commodity’s chief linkage was a large demand for ship repair
facilities within Singapore.
The main fact about Singapore’s petroleum trade was – and remained – the use,
which multinational oil companies found for the Singapore port in their worldwide operations.
Oil companies were drawn to Singapore not only for its geographical attractiveness – both
local and international – but also for freedom from regulations. Offshore islands afforded a
deep-water anchorage adjacent to Singapore harbour, so that use could easily be made of its
facilities, while at the same time allowing safe storage of large quantities of petroleum.
Whilst oil was not refined in Singapore, it was collected from several refineries in the region
and blended.39 During the inter-war period this location on world and regional shipping
routes enabled petroleum companies to keep distribution costs low by using a single store to
serve distinct markets with different product mixes.
Another factor that provided impetus to the Singapore port’s attractiveness is the
important linkage of dry dock facilities, which oil tankers created at Singapore normally,
associated with a terminal port, where longer stay of vessels affords the most economic place
to obtain repairs. During the inter-war period this linkage depended very largely on the
operations of the Asiatic Petroleum Co.40 In largely supporting the dry docks, tanker repair
contributed to Singapore’s economic development and indirectly to the development of port,
in two aspects. Firstly, it added substantially to Singapore’s attractiveness as a port. Superior
dry dock facilities encouraged Singapore’s use by ocean going shipping, which in transit
would normally stop for repairs. A major port like Singapore had to provide some dry dock
facilities, which were also necessary for local shipping. As it happened, because Singapore
was a petroleum distribution centre, the Singapore Harbour Board (see section 2 for details)
could maintain extensive, modern dry docks. Secondly, the dry docks helped Singapore to
develop a major engineering industry, which later emerged as a major service exporter in the
late 1970s on wards (see further below). The docks were judged ‘one of the most modern
ship-repairing establishments in the East’ by an ‘expert and highly critical’ witness: ‘I do not
think there is a place in the world in which you can get work as solid or as sound or as good a
39 Ibid, p. 240. 40 Ibid, p. 244.
14
job as you can get in Singapore’.41 In addition, the dry docks had a significant developmental
feature in the growth of a skilled labour force in Singapore.
From the 1950s onwards, the Singapore port continued to grow as the focal staple
port in Southeast Asia, for reasons highlighted earlier in this section. Section 3 discussed in
detail the development of the port after WWII. In looking forward to the 1990s, the port was
transformed gradually not only into a regional teleport, but internationally, it has shown as an
evidence of world-class maritime port of call.
This evidence was none more so obvious when in 1998, the Singapore Ministry of
Trade and Industry identified the port sector as a sector with global potential.42 During 1995-
1999, according to the World Competitiveness Report, Singapore topped the list of 48
developed and developing economies in terms of the extent to which port access
infrastructure met business requirements.43 New Generation Port is the buzzword for PSA.
PSA spends close to S$100 million a year on research and development, and this has resulted
in software applications so advanced that even the Port of Seattle, many miles away in the
home of Microsoft, has come all the way to Singapore to obtain it.44 PSA remains the world’s
biggest container transshipment port, with connections to 700 ports worldwide through more
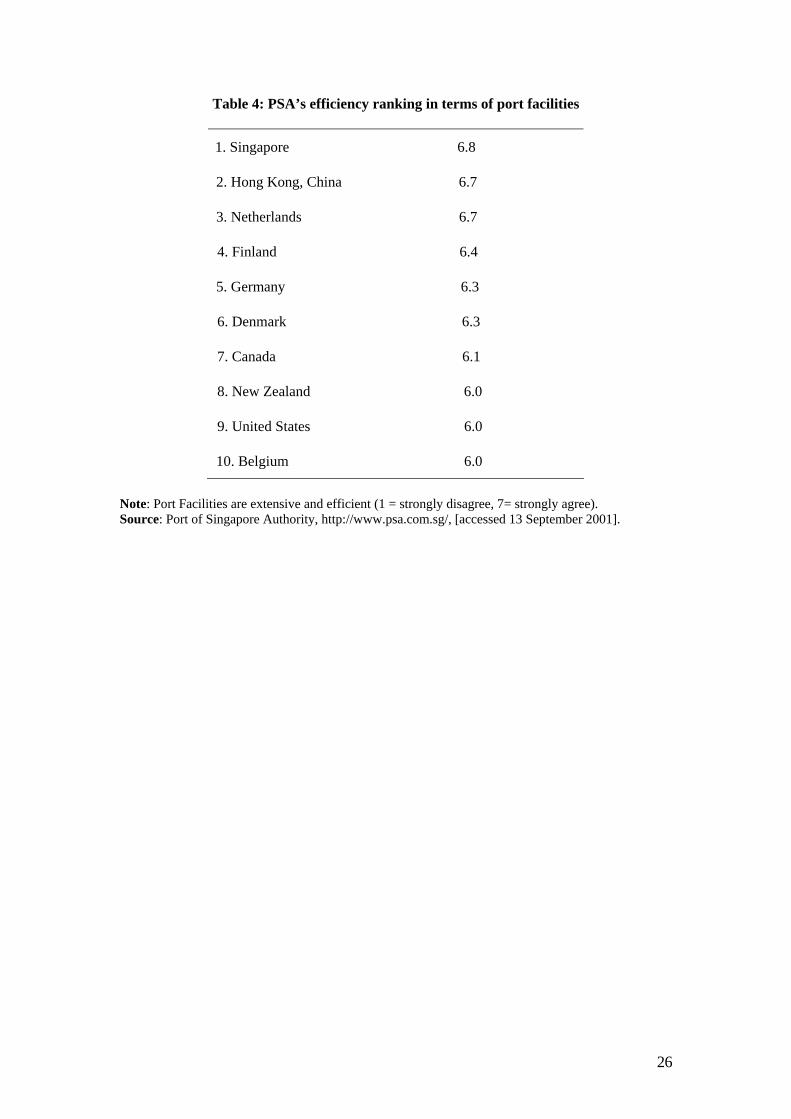
than 300 shipping lines out of Singapore.45 As of 2000, Singapore has been given top ranking
in the Global Competitiveness Report 2000 published by the World Economic Forum in the
area of port facilities. Table 4 shows that PSA achieved a high score of 6.8 out of a possible 7
to lead the way in terms how well PSA’s facilities meet business requirements.
As highlighted in Table 4, Singapore’s dominant position owes much to continuing
efforts on the part of the government and the PSA to create and sustain the port’s competitive
advantage. The efficiency with which containers are handled and the cost effectiveness of shipping
cargo via Singapore combine to create a service that is qualitatively different from that offered by
other ports around the world, especially by other ports in the region.46 This port facilities
extensiveness and efficiency is sustained by continuing investment and innovation. One of the
main reasons for the growing demand from overseas ports for PSA’s services is its ability to plan,
develop and manage container terminals not only domestically but also overseas. A brief 41 Ibid, p. 245. 42 Singapore Ministry of Trade and Industry (1998) Committee On Singapore’s Competitiveness, (Singapore),
pp. 54-58. 43 IMD (1995) World Competitiveness Report, (Switzerland: IMD). 44 Mcnulty, S. (2001) “Survey – Singapore: At the hub of shipping activity: Despite competition from
Malaysia, the high-tech port authority’s chairman says he is not rushing to reduce prices”, Financial Times,
April 11, 2001, http://globalarchive.ft.com/globalarchive/articles.html, [accessed 15april 2001]. 45 Ibid. 46 Trace, K. (1997) “Asean Ports since 1945: Maritime Change and Port Rivalry”, p. 331.
15
discussion of Pasir Panjang Terminal demonstrates the types of specialist container services that
PSA supplies.
Pasir Panjang Terminal (PPT), in operation since 1993, is Singapore’s most advanced
container terminal. It is the most advanced terminal in the world when compared with the best
container terminals elsewhere such as the Port of Rotterdam in the Netherlands. Its quay cranes can
handle the largest containerships, its towering bridge cranes are used for yard operations and PPT
uses a paperless ‘Flow-Through’ Container Gate System.47 Such aspects make PPT an innovative,
new-generation terminal. For instance, the award winning ‘Flow-Through’ Container Gate System
reduced the processing time of container trucks from five minutes in 1988 to twenty-five seconds in
1999.48 The system is developed to achieve high levels of productivity and service for PSA’s
customers. PPT was constructed with extensive input from its customers and from Singapore’s
existing terminal officials. PPT also runs the world’s first remotely controlled bridge cranes, using
artificial intelligence.49 This section in turn will now discuss the different types of specialist
containerisation services that PSA offers to host nations, which have been developed and tested in
Singapore.
In 1999, PSA introduced its PortCare Services, which consists of ReeferCare,
ChemCare, BoxCare and ProCare. Through PortCare, PSA is able to improve the reliability of the
shipment of its customers’ highly-perishable reefer cargo, manage their equipment professionally,
handle their out-of-gauge cargo, such as lifts, escalators and helicopters, without problems, as well
as ensure the safe and careful handling of their hazardous goods.50 With these specialised services,
customers are reassured that their cargo and equipment are well taken care of and will reach their
markets in excellent condition and on time. This is made possible through two key factors: the
proficient knowledge of handling such containers, and leveraging the indigenous advanced
technologies and expertise PSA has developed since the 1970s.
PSA is the world specialist in the transshipment of reefer containers.51 It operates the
world’s largest reefer port, handling some 800,000 reefer units annually. For instance, there are
more than 4,000 reefer power points located across Singapore’s four terminals, capable of handling
the entire reefer cargo.52 What makes PSA unique in the area of reefer care technology compared
to its competitors such as Hutchinson-Whampao of Hong Kong is its computerised Reefer 47 In 1999, PSA’s ‘Flow-Through’ Container Gate System was conferred an Innovation Award at the 11th UK
Sea Trade Awards for its contributions to the port’s excellence. 48 Port of Singapore Authority (1999) Annual Report of PSA, (Singapore: PSA), p. 37. 49 Port of Singapore Corporation Ltd (1998) ‘Pasir Panjang Termainal – Port of Singapore Authority’s
Newest Container Terminal: Fast, Flexible and Reliable’, Port Technology International, 12, pp. 19-23. 50 Reefer refers to refrigerated transport vehicle, a refrigerated railway wagon or truck trailer. 51 Port of Singapore Authority (1999) Annual Accounts, (Singapore: PSA), p. 24. 52 Ibid.
16
Monitoring System, which is designed to maintain pre-set temperatures at all times. This system
allows its customers to monitor the temperature of the reefers 24 hours a day in the comfort of their
offices, both in Singapore and overseas.
The uniqueness of PSA’s expertise in reefer technology can be highlighted from
Australian shippers, who reaffirmed the value of transhipping via PSA.53 According to Australian
Diary Corporation’s (ADC) Shipping Manager Sue Perry, the increasing sophistication and
reliability of international relay port operators, such as PSA, have given ADC the confidence to use
relay services for its sensitive time-critical cargo. Perry said, ‘PSA’s sophisticated IT system makes
relaying a seamless process. They maintain constant communication with the shipping lines via the
internet, providing ADC with real time access to their container whereabouts and temperature
monitoring of all their containers.’54 Direct shipping services were the traditional way of shipping
reefers. However, PSA has developed integrated services which provide fast transit times, high
productivity and the reliability ADC needs to be confident that its reefer cargo arrives safely and on
time in overseas markets.55
With ChemCare, PSA facilitates the movement of dangerous goods by offering
operational support and technical advice to help its customers meet the required safety standards in
Singapore and overseas. Pre-shipment inspections are conducted to ensure that goods are intact and
properly labelled before they are shipped out, saving time and effort in the crucial approval process.
PSA’s emergency response team (both locally and overseas) is on call 24 hours a day to ensure the
safety of its customers’ cargo within the terminals and on public roads. Furthermore, PSA goes a
long way to assist its customers through other services, such as the reworking of damaged or leaky
containers, safety assessment and certification, as well as the obtaining of safety clearance from the
relevant government authorities.
BoxCare builds on the synergies reaped from PSA’s five port and container
terminals to offer round-the-clock on-dock empty container depot facilities to its customers.
The comprehensive range of services provided under BoxCare includes the checking,
repairing, washing, painting and preparation of boxes for shipment. BoxCare handles more
than 70,000 empty boxes annually.56 On the other hand, under ProCare PSA recognises that
not all the cargo of its customers fits into standard 20 foot or 40 foot containers. For example,
there are out-of-gauge cargo such as tractors, heavy machinery, helicopters, escalators and
trains that cannot be containerised. Through its port experience, PSA has mastered the ability
53 “Australian Shippers Reaffirm the Value of Transhipping via PSA”, [accessed 11 March 2001],
http://www.psa.com.sg/portview/pv0103/pv010310.html. 54 Ibid. 55 Ibid. 56 Port of Singapore Authority (1999) Annual Accounts, p. 25.
17
of handling such unconventional cargo carefully and efficiently. PSA is able to handle such
out-of-gauge cargo in a seamless operation without any loss to vessel productivity, although
problems did arise in the early parts of its implementation in terms of the lack of
understanding how the system operated and how to handle such unconventional cargoes.
However, it is a value-added service that few other ports are able to match. As a result, it
attracts further demand for PSA’s services overseas.
4.1 Computerisation
Singapore’s major competitors in the region are the ports of the newly industrialising countries
nearby, including Malaysia, Indonesia, Hong Kong, China and Taiwan. Although Singapore’s
shipping and cargo handling business is growing, the country’s limited land area is a constraint on
its ability to expand its port facilities to meet the growing demand of the region. In order to stay
competitive and preserve or increase market share, PSA’s managers have devised ways to provide
higher quality services at prices competitive with regional competitors, especially in Malaysia and
Indonesia, where the cost of labour is much lower and the availability of land is much greater.
Furthermore, since most of the shipments are in transit to some other port, there is a need to shorten
port stays, reduce port charges and assure the safety of cargo in transit in order to attract more
customers into the port. For those ships intending to use the port, sufficient information is gathered
to coordinate the planning for their berthing and loading or unloading of containers and keep track
of marine and water space resource utilisation. Close monitoring is necessary to eliminate
unnecessary waiting time for berths and pilots at the boarding grounds.57
As a result, technology and automation have been regarded by PSA port managers and
administrators as being critical for increasing operational efficiency and reducing costs. Starting
with computerisation of basic issues such as payroll and billing, PSA built up in-house software
development capability, which it later put to good use in developing efficient port and container
systems, such as the computer integrated terminal operations system (CITOS) and computer
integrated marine operations system (CIMOS). It started computerising its operations in the late
1960s. The first online information system for handling containers became operational in 1973.
This sped up the process of locating containers and reduced the waiting time for port users to take
delivery of their goods. To exploit the potential of IT for port operations and management, PSA
identified and classified its activities according to cargo handling, marine operations, and
distribution and warehousing. Within each group, a command system, a database that controls port
activities by transmitting information to it, integrates the various related activities.
57 Port of Singapore Authority (1993) CIMOS, (Singapore: PSA Publications).
18
This command system, known as a Databox, was implemented in 1984 to link port
users on-line to the port computer systems. This system was upgraded to the PortNet system (using
a PC and a modem) in 1989. It was the world’s first electronic data interchange (EDI) system to be
implemented on a national scale to link all parties involved in international trade.58 PortNet is a 24-
hour real-time electronic link, which provided real-time port operations information, such as
berthing schedules and status of containers, to shipping lines and agents. Due to increased
improvements in information technology, additional information services, such as arrivals,
departures, ships in port and databases were added later. It was further upgraded to allow
government agencies such as the Singapore Trade Development Board and the Singapore
Economic Development Board, to interchange trade information and documents, submit
declarations, plans and manifests electronically in order to expedite the approval of imports or
exports, port operations, cargo clearance and statistics compilations.59
PortNet allows shipping companies and freight forwarders, to plan tight schedules
and monitor their cargo. Since the introduction of PortNet, PSA has also established
computer-to-computer links with major shipping lines (e.g. Maersk and NOL) and major
container ports of the world. By establishing such electronic links with other ports, PSA is
establishing itself as a teleport of the region. Being a teleport means that PSA together with
the National Computer Board of Singapore, developed the capability to access third party
databases, create electronic notice boards, and to track vessels via satellite. Overall, the
benefits of PortNet included savings on hardcopy documents and telex transmission costs, fast
turnaround of documentation, fewer errors with data captured at source without going through
various levels of transcription.
The transformation of Singapore port into a ‘techno-port’ (short for technological
port) has since gained further impetus. In order to handle all the services at the port 24 hours
per day throughout the year, more than 300 computer applications are in use since PortNet
was upgraded in 1990, in all facets of the PSA’s administration, planning and operations work.
These operations are organised according to business areas and most of them are integrated in
a port-wide communication system. Initially, during the upgrading stages, the upgrading was
time consuming and costly. This was due to the retraining of existing staff. They were sent
to computer appreciation courses in order to upgrade their computer programming skills. The
Maritime Port Academy trained this staff on different information systems. Thus it created
58 Wan, T. B., Eric Lui Chew Wah and Loh Chee Meng (1992) ‘The Use of Information Technology by the
Port of Singapore Authority’, World Development, 20, No. 12, pp. 1785-1795. 59 Ibid, p. 1791.
19
some degree of disruption in the terminal operations at PSA. Once that stage was passed, it
rapidly aided productivity and efficiency to PSA’s daily activities.60
There are two main applications of computer systems. CITOS (Computer
Integrated Terminal Operations System) is a system that supports the planning, command,
control and execution of all container-handling operations. This system includes four expert
systems designed for the planning of container operations of a ship as soon as it enters the
Singapore port. CIMOS (Computer Integrated Marine Operations System) manages the
marine operations within the port waters. Within CIMOS, there are five knowledge-based
expert planning systems to assist in resource planning for the port, coordinated by a
supervisory module. These two IT applications have further enhanced PSA’s competitive
advantage in areas such as allowing online transaction processing, improving container
handling productivity, efficient use of scarce yard terminal resources and space, real time
tracking of vessels and resources, active management of vessel movements, expert systems of
resource allocation and deployment and integrated graphic displays of all information
necessary for command and control.
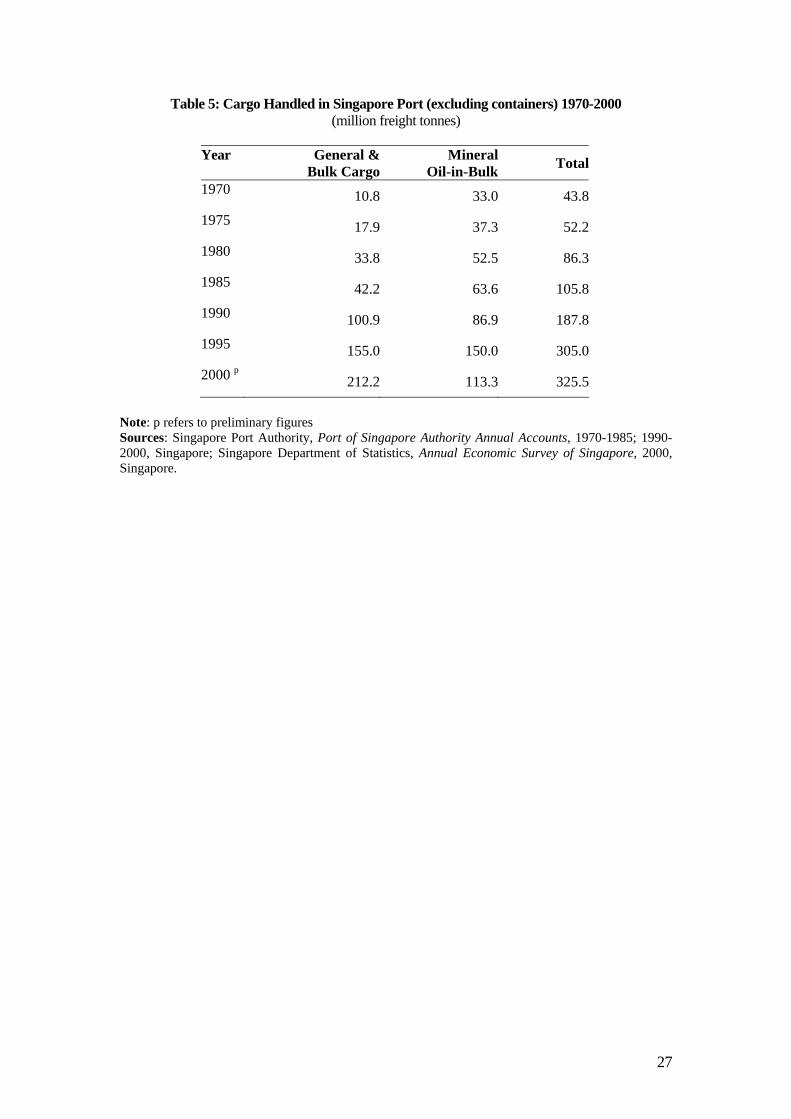
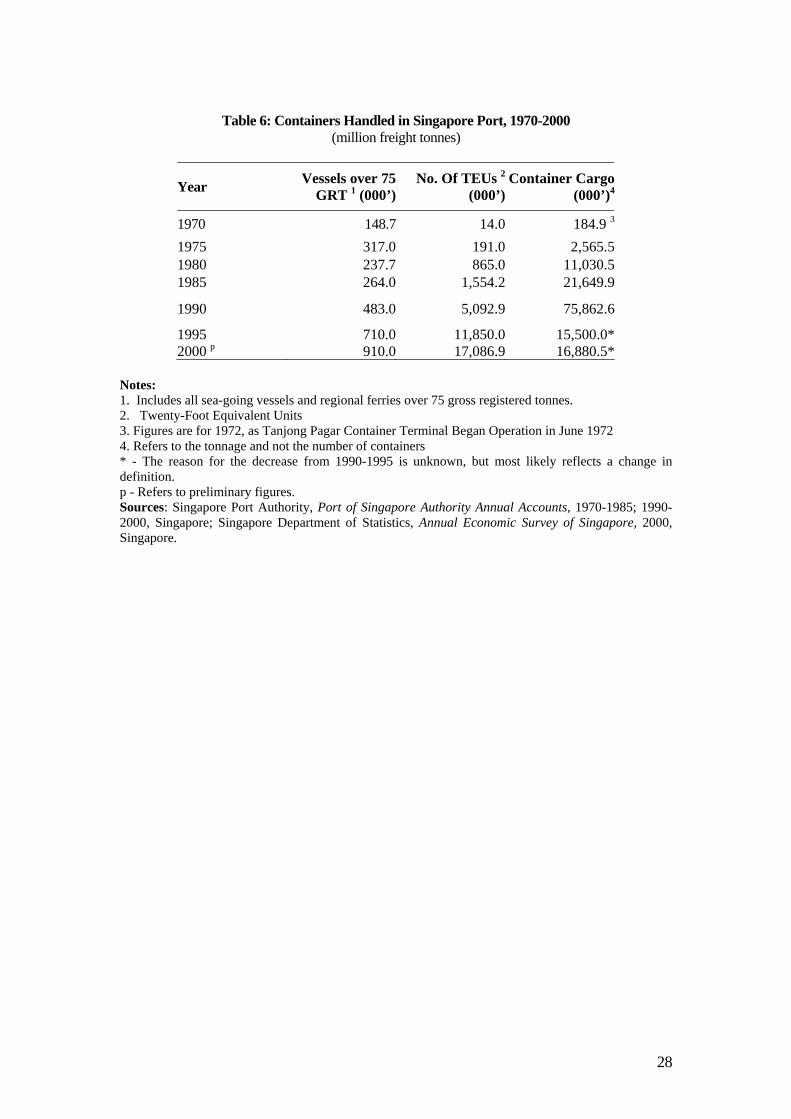
Tables 5 and 6 highlight the overall growth in maritime transport volume. Table 5
shows that the total volume of maritime cargo has increased since the 1970s by a factor of
7.4.61 This substantial increase was in part attributable to Esso’s new refinery at Pulau Ayre
Chawan. Similarly, since the opening of the Tanjong Pagar Container Terminal in 1972,
Singapore port’s container throughput gradually increased from an average of 100,000
Twenty-foot Equivalent Units (TEUs) annually in the 1970s and to an average 17 million
TEUs in 2000, as Table 6 shows. Container throughput jumped 22 per cent from 1970 to
reach 6.35 million TEUs in 1991. Total seaborne cargo handled increased from 188 million
tonnes in 1990 to 326 million tonnes in 2000.62 Vessel arrivals increased from 483 million
gross registered tonnes in 1990 to 910 million gross registered tonnes in 2000.
In 1982 Singapore overtook Rotterdam to become the world’s busiest port, in terms
of shipping tonnage, in 1988 it was listed as the world’s top bunkering port.63 In 1999 and
2000, two years in running, Singapore was named the world’s busiest port ahead of Hong
Kong.64 Along with prestiges accolades, foreign port organisations showed increasing interest 60 Interview with Mr Peter Chew of the International Business Division (PSA), 19 January 2001. 61 All the information provided on the maritime activities is obtained from the PSA Annual Accounts for 1970-
2000. 62 Ibid. 63 Port of Singapore Authority (1990), A Port’s Story: A Nation’s Success, (Singapore: Times Edition), p. 63;
Bunkering refers to a fuel-storage container on a ship. 64 Asian Economics News, Singapore set to retain busiest port status, [accessed 9 May 2001],
http://www.findarticles.com/cf_0/m0WDP/2000_March_6/59998159/print.html.
20
in obtaining PSA’s port and container management expertise. PSA also started to look for
business overseas. As a result, in preparation for the corporatisation of Port of Singapore
Authority (PSA), the government in February 1996 set up a new statutory body called the
Maritime and Port Authority of Singapore (MPA).
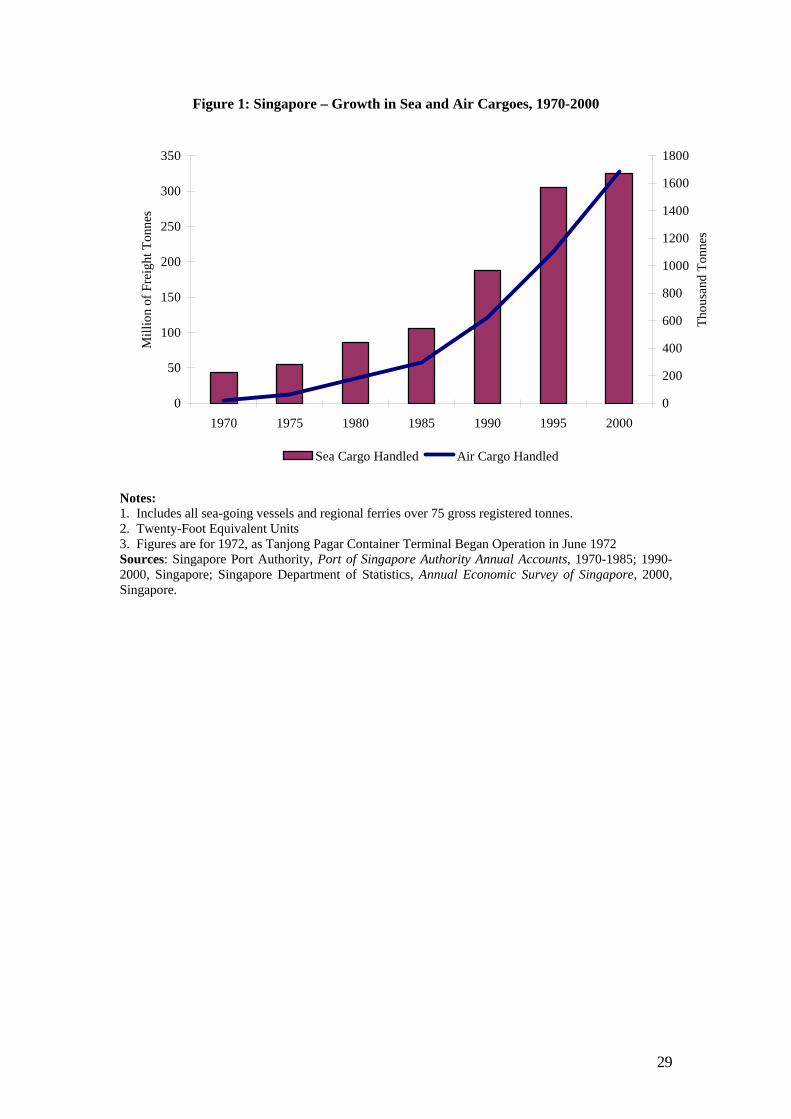
Similarly, in conjunction with Tables 5 and 6, Figure 1 also shows the extent to
which Singapore port has grown from 1970 to 2000. For the period of 170 to 1995, the
volume of air cargo handled rose at an annual average rate of 18 per cent. This was twice that
of sea cargo’s increase of 9.1 per cent per annum. For sea cargo, the total volume handled
during the past three decades increased by nearly 14 times, from 43.5 million freight tones
(FT) in 1970 to 325.5 FT in 2000 (see both Table 5 and Figure 1). The average annual
growth of sea cargo in the 1970s and 1980s were similar, maintaining at about 8 per cent.
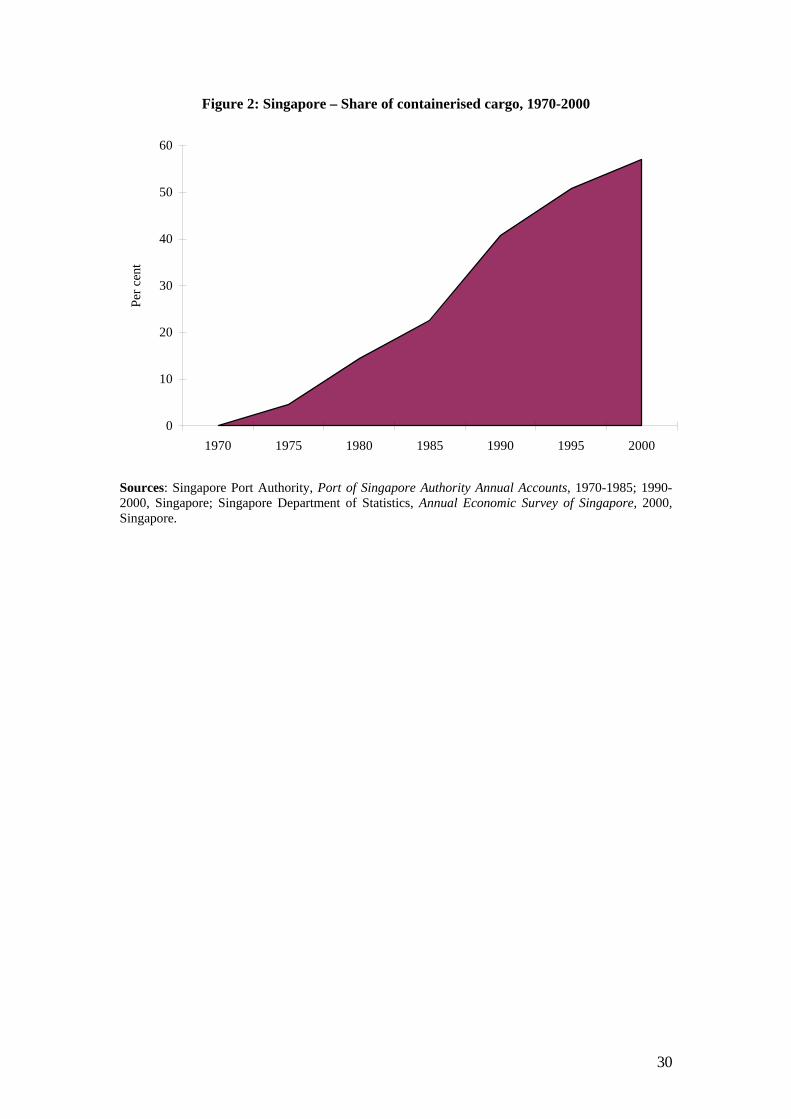
The corresponding figure in the 1990s was slightly higher at 10 per cent. Since the container
port opened in 1972, the share of containerized cargo had expanded significantly from less
than 11 per cent of the total sea cargo handled in the 1970s to more than 55 per cent in 2000
(see figure 2). The rapid expansion of container berths in the last two decades coupled with
the world-class terminals had contributed to the growing share of containerized cargo.
Moreover, in the first 10 months alone in 2000, PSA scored vessel rates above 200
containers per hour on 8 occasions. Besides holding the world record for vessel rate (243
containers per hour), PSA has broken the 200 containers per hour barrier more frequently and
for more shipping lines than any other terminal operator in the world.65
Having attained the status of a competitive maritime nation, in terms of the world’s
busiest and most innovative ports, the expertise of PSA is widely appreciated by developing
nations around the world, especially in the Asian region. This is attributable to not only the
geographic location of Singapore and the increased number of ships stopping at Singapore,
but also to factors such as rapid development of the port infrastructure, logistics, bunkering,
warehousing and other producer services.
5. Conclusion
This paper set out to show how the Port of Singapore has developed itself from an entrepot
port to a world-class port of call, with the PSA now exporting its port capabilities or services
to overseas maritime organisations. Although geographical reasons do play an important part
in the success, there were other reasons that were highlighted in this paper. Importantly, the
65 PortView (2000) PSA Corporation and APL Achieve Vessel Rate Exceeding 200 Containers per Hour for
Second Time in Year 2000, http://www.psa.com.sg/portview/pv0103/pv010310.html, [accessed 15
September 2001].
21
rapid growth of staple commodities mainly, tin, rubber and petroleum, provided indirect
impetus to further development of the port. Especially, petroleum and rubber, provided
linkage effects to the port, in terms of dry dock developments and ship repair facilities.
Furthermore, the arrival of large oil conglomerates such as Asiatic Petroleum Co. further
provided aided to the attractiveness of the port as a centre for petroleum storage and handling.
Also the development of financial activities (such as banking activities) by merchants also has
contributed to the inflow of shipping activities to the Singapore port. Lastly but least, the
Singapore Harbour Board, whose far-sighted harbour improvement construction programmes
contributed substantially to Singapore’s continued position as a premier Southeast Asian port
in the inter-war years. With the development of New Harbour, Raffles Place developed as the
trading centre for the Western agency houses, companies, and banks, while Boat Quay
remained the Chinese-dominated centre for the Straits produce and inter-Asian trade.
In conclusion, it must not be dismissed that, the concerted efforts of the Singapore
government and PSA in the 1980s and 1990s, added a much-renewed focus of the direction
the port of Singapore has taken. In keeping with growing competition, PSA has gradually
added value to its activities not only in regional perspective but also internationally. As such,
its modern day unrivalled success is attributable to its far fetching aims and the continuous
thirst to develop technologically and compete internationally. Patterns of port calls have
changed, leading to the emergence of the Singapore port being a regional ‘load centre’ or
‘hub’ and the further growth of feeder container services.
22
Table 1: Feeder Fleet Capacity: Singapore – regional ports, 1990
No. of vessels
Route: Singapore To
Total annual capacity(TEUs)
AvailableCapacity
Total available capacity
(%, TEUs)Bangkok 21 8,000 832,000 38
Port Klang 11 2,700 280,000 13
Penang 11 2,000 208,000 9
Tanjung Priok 18 3,300 343,000 15
Belawan 6 860 89,000 4
Surabaya 10 1,900 197,000 9
Manila/Cebu 5 1,200 62,000 3
East Malaysia/Brunei
16 770 40,000 2
Chittagong/Mongla 15 3,100 163,000 7
Total 113 28,830 2,214,000 100
Source: Trace, K. (1997) “Asean Ports since 1945: Maritime Change and Port Rivalry” in Broeze, F. (ed) (1997) Gateways of Asia: Port Cities of Asia in the 13th-20th Centuries, (London: Kegan Paul International), p. 332.
23
Figure 1: Port of Singapore Authority Organisational Chart
Source: Port Of Singapore Authority, Organization Chart, http://www.psa.com.sg/about/8-2.html, [accessed 14 September 2001].
Chairman (Board of Directors)
Group President
Deputy Group President (International Business) Deputy Group President (Terminal Operations)
Strategic Business Group
Logistics Division
Containers Terminal
International Business
Strategic Development Group
Properties Division
Engineering Division
Information Technology Division
Corporate Development Division
Finance Division
Human Resource Division
Internal Audit
24
Table 2: The Trade of Singapore with the West, 1870-1915 Percentage of Total (S$ in millions)
Year Continental
EuropeUnited
KingdomNorth
AmericaTotal
% % % $
1870 10 76 14 21.1
1885 19 71 10 40.2
1900 29 53 18 124.2
1915 20 35 45 187.6
Source: Lin Ken, W. (1978) “Singapore: Its Growth as an Entrepot Port, 1819-1941”, Journal of Southeast Asian Studies, IX, No.1, p. 64.
25
Table 3: Singapore’s exports of five major commodities, 1900-02 to 1937-391 (Annual averages)
Note: Excludes exports to Malaya from 1933 to 1939. Source: Huff, W. G. (1994) The Economic Growth of Singapore: The Economic Development in the Twentieth Century, p78.
Tin Rubber Petroleum Rice Cotton Piece Total
Goods Merchandise Exports
(a) Tonnes 1900/02 29,491 - 38,192 321,006 2,8331911/13 28,784 3,752 12,675 371,178 2,6971915/17 36,724 50,492 32,252 610,159 2,9901925/27 33,950 190,704 410,694 379,510 78,6531933/35 27,487 268,307 453,166 123,054 44,9611937/39 32,993 256,974 683,903 137,311 26,299 (b) S$000 1900/02 36,664 - 2,021 22,778 8,793 196,6251911/13 48,376 12,222 606 33,403 8,626 241,5791915/17 55,746 109,844 1,753 48,802 11,717 391,2201925/27 80,274 339,842 74,481 49,638 21,226 855,4081933/35 49,755 93,958 45,948 7,155 4,512 284,9501937/39 62,100 168,483 53,844 9,003 3,328 390,790 © % Of Total merchandise Exports 1900/02 18.6 - 1.0 11.6 4.5 35.71911/13 20.0 5.1 0.3 13.8 3.6 42.81915/17 14.2 28.1 0.4 12.5 3.0 58.21925/27 9.4 39.7 8.7 5.8 2.5 66.11933/35 17.5 33.0 16.1 2.5 1.6 70.71937/39 15.9 43.1 13.8 2.3 0.9 76.0
26
Table 4: PSA’s efficiency ranking in terms of port facilities
1. Singapore 6.8
2. Hong Kong, China 6.7
3. Netherlands 6.7
4. Finland 6.4
5. Germany 6.3
6. Denmark 6.3
7. Canada 6.1
8. New Zealand 6.0
9. United States 6.0
10. Belgium 6.0
Note: Port Facilities are extensive and efficient (1 = strongly disagree, 7= strongly agree). Source: Port of Singapore Authority, http://www.psa.com.sg/, [accessed 13 September 2001].
27
Table 5: Cargo Handled in Singapore Port (excluding containers) 1970-2000 (million freight tonnes)
Year General &
Bulk CargoMineral
Oil-in-Bulk Total
1970 10.8 33.0 43.81975 17.9 37.3 52.21980 33.8 52.5 86.31985 42.2 63.6 105.81990 100.9 86.9 187.81995 155.0 150.0 305.02000 p 212.2 113.3 325.5
Note: p refers to preliminary figures Sources: Singapore Port Authority, Port of Singapore Authority Annual Accounts, 1970-1985; 1990-2000, Singapore; Singapore Department of Statistics, Annual Economic Survey of Singapore, 2000, Singapore.
28
Table 6: Containers Handled in Singapore Port, 1970-2000
(million freight tonnes)
Year Vessels over 75GRT 1 (000’)
No. Of TEUs 2
(000’)Container Cargo
(000’)4
1970 148.7 14.0 184.9 3
1975 317.0 191.0 2,565.51980 237.7 865.0 11,030.51985 264.0 1,554.2 21,649.9
1990 483.0 5,092.9 75,862.6
1995 710.0 11,850.0 15,500.0*2000 p 910.0 17,086.9 16,880.5*
Notes: 1. Includes all sea-going vessels and regional ferries over 75 gross registered tonnes. 2. Twenty-Foot Equivalent Units 3. Figures are for 1972, as Tanjong Pagar Container Terminal Began Operation in June 1972 4. Refers to the tonnage and not the number of containers * - The reason for the decrease from 1990-1995 is unknown, but most likely reflects a change in definition. p - Refers to preliminary figures. Sources: Singapore Port Authority, Port of Singapore Authority Annual Accounts, 1970-1985; 1990-2000, Singapore; Singapore Department of Statistics, Annual Economic Survey of Singapore, 2000, Singapore.
29
Figure 1: Singapore – Growth in Sea and Air Cargoes, 1970-2000
0
50
100
150
200
250
300
350
1970 1975 1980 1985 1990 1995 2000
Mill
ion
of F
reig
ht T
onne
s
0
200
400
600
800
1000
1200
1400
1600
1800
Thou
sand
Ton
nes
Sea Cargo Handled Air Cargo Handled
Notes: 1. Includes all sea-going vessels and regional ferries over 75 gross registered tonnes. 2. Twenty-Foot Equivalent Units 3. Figures are for 1972, as Tanjong Pagar Container Terminal Began Operation in June 1972 Sources: Singapore Port Authority, Port of Singapore Authority Annual Accounts, 1970-1985; 1990-2000, Singapore; Singapore Department of Statistics, Annual Economic Survey of Singapore, 2000, Singapore.
30
Figure 2: Singapore – Share of containerised cargo, 1970-2000
0
10
20
30
40
50
60
1970 1975 1980 1985 1990 1995 2000
Per c
ent
Sources: Singapore Port Authority, Port of Singapore Authority Annual Accounts, 1970-1985; 1990-2000, Singapore; Singapore Department of Statistics, Annual Economic Survey of Singapore, 2000, Singapore.