guidelines for vegetative erosion control … · guidelines for vegetative erosion control on wave...
TRANSCRIPT
DREDGING OPERATIONS TECHNICALSUPPORT PROGRAM
GUIDELINES FOR VEGETATIVE EROSIONCONTROL ON WAVE-IMPACTED COASTAL
DREDGED MATERIAL SITES
i by
o Paul L. Knutson, Hollis H. Allen, James W. Webb
Environmental Laboratory
DEPARTMENT OF THE ARMYWaterways Experiment Station, Corps of Engineers
3909 Halls Ferry Road, Vicksburg, MS 39180-6199
', TI ,,,!' DEC2 11990-. v u mmu..
,e September 1990 E~Final Report
Approved for Public Release; Distribution Unlimited
Prepared for DEPARTMENT OF THE ARMY1US Army Corps of Engineers
Washington, DC 20314-1000
- ---- - - --
Destroy this report when no longer needed. ")o not returnit to the originator.
The findings in this report are not to be constrjed as an officialDepartment of the Army position unless sc. designated
by other authorized documents
The contents of this report are not to b . used foradvertising, publication, or promotional ourposes.Citation of trade names does not constitute anofficial endorsement or approval of th' use of
such commercial products.
The D-series of reports includes publications of theEnvironmental Effects of Dredging Programs:
Dredging Operations Technical Support
Long-Term Effects of Dredging OperationsIntrnrnonrJ F ld V i.ctioi oi Methuduogles or
Evaluating Dredged Material Disposal Alternatives(Field Verification Program)
Unclassified
SECURITY CLASSIFICATION OF THIS PAGE
Form ApprovedREPORT DOCUMENTATION PAGE OMBNo. 0704-0188
ta. REPORT SECURITY CLASSIFICATION Ib. RESTRICTIVE MARKINGS
Unclassified
2a. SECURITY CLASSIFICATION AUTHORITY 3. DISTRIBUTION/AVAILABILITY OF REPORTApproved for public release; distribution
2b. DECLASSIFICATION / DOWNGRADING SCHEDULE unlimited.
4. PERFORMING ORGANIZATION REPORT NUMBER(S) 5. MONITORING ORGANIZATION REPORT NUMBER(S)
Technical Report D-90-136a. NAME OF PERFORMING ORGANIZATION 6b. OFFICE SYMBOL 7a NAME OF MONITORING ORGANIZATION
USAEWES (If applicable)
Environmental Laboratory I6c. AUDRESS (City, State, and ZIP Code) 7b. ADDRESS (City, State, and ZIP Code)
3909 Halls Ferry Road
Vicksburg, MS 39180-6199
Ba. NAME OF FUNDING/SPONSORING 8b. OFFICE SYMBOL 9. PROCUREMENT INSTRUMENT IDENTIFICATION NUMBERORGANIZATION (If applicable)
USArmyCorDs of Engineers I
8c. ADDRESS (City, State, and ZIP Code) 10. SOURCE OF FUNDING NUMBERS
PROGRAM PROJECT TASK IWORK UNIT
Washington, DC 20314-1000 ELEMENT NO. NO. NO. ACCESSION NO.
11. TITLE (Include Security Cassification)
Guidelines for Vegetative Erosion Control on Wave-Impacted Coastal Dredged Material Sites
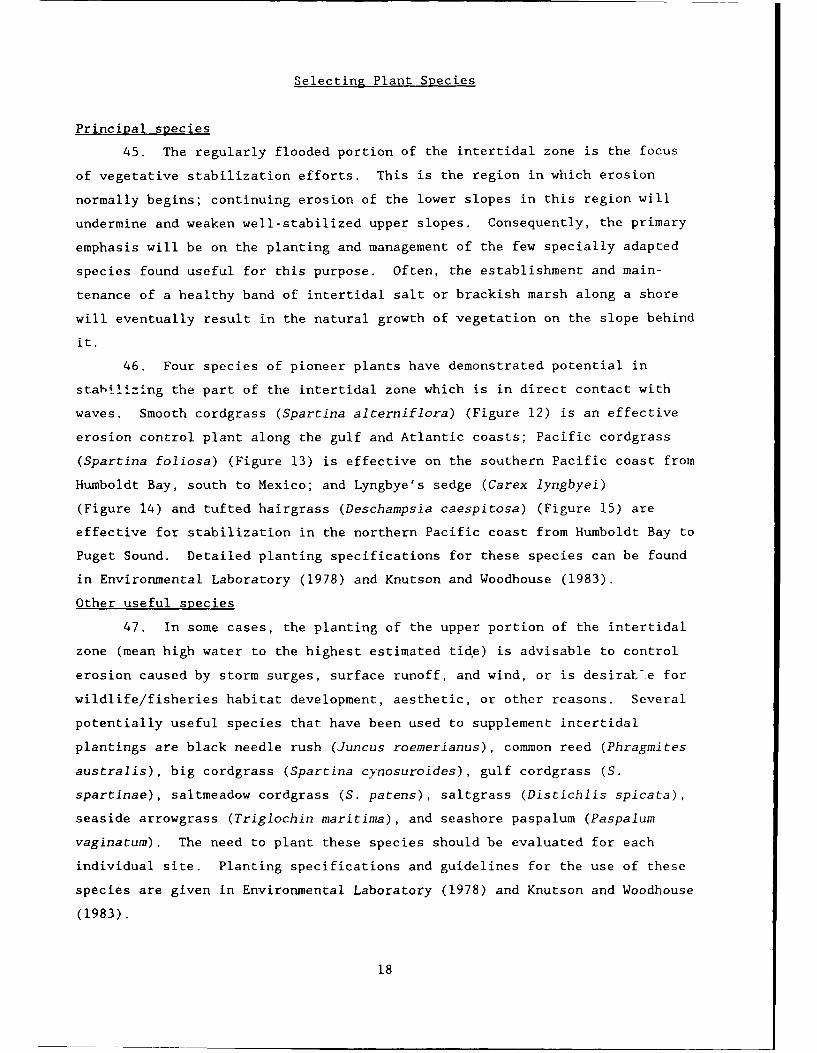
12. PERSONAL AUTHOR(S)
Knutson, Paul L.; Allen, Hollis H.; Webb, James W.
13a. TYPE OF REPORT 13b. TIME COVERED 14. DATE OF REPORT (Year, Month, Day) 15. PAGE COUNT
Final report FROM TO September 1990 8916. SUPPLEMENTARY NOTATION
Available from National Technical Information Service, 5285 Port Royal Road, Springfield,
VA 22161.
17. COSATI CODES 18. SUBJECT TERMS (Continue on reverse if necessary and identify by block number)
FIELD GROUP SUB-GROUP Beneficial uses Erosion control Wetlands creation
Coastal Salt marsh
Dredged material Vegetation
19 ABSTRACT (Continue on reverse if necessary and identif,£ i block number)
..... -- This report provides guidelines_ at permit the evaluation of vegetative stabiliza-
tion alternatives for dredged material disposal areas using salt marsh wetland plants. The
guidelines provide a methodology for classifying dredged material shorelines with respect
to wave energy (low-, moderate-, or high-energy sites) and specify a vegetative stabiliza-
tion strategy (standard planting techniques, root-anchored techniques, or wave protection
structures) for each energy regime. Such guidelines provide dredged material planners and
operations personnel the means to use dredged material for combined beneficial uses of wet-
lands creation, habitat development, and erosion control. The report also presents twocase studies of salt marsh creation on dredged material sites located in North Carolina
along the Atlantic Intracoastal Waterway and in Texas along the Gulf Intracoasta] Waterway
near Galveston. These studies provide guidelines for creating salt marsh on moderate- to
high-energy sites exposed to both ship- and wind-generated waves.--
20. DISTRIBUTION /AVAILABILITY OF ABSTRACT 21. ABSTRACT SECURITY CLASSIFICATION
[3UNCLASSIFIED/UNLIMITED 0 SAME AS RPT. 03 DTIC USERS Unclassified
22a. NAME OF RESPONSIBLE INDIVIDUAL 22b. TELEPHONE (Include Area Code) 22c. OFFICE SYMBOL
DD Form 1473, JUN 86 Previous editions are obsolete. SECURITY CLASSIFICATION OF THIS PAGE, Urclass~fied
pro tecl/o 0 . '.,; . '.Zx ~; :.,-a , ,':-D 61 r i '~ /I S 'V -1 "
r] . . . ... /rr , o_ -.4 ,J /° /r
7' C-ASSiFICATION OF THIS PAGE
/" / / " " ._. ,
SECURITV C.ASSIFICATION OF THIS PAGE
PREFACE
This study was conducted under the auspices of the Dredging Operations
Technical S,,pport (DOTS) Program, Beneficial Uses of Dredged Material Work
Unit, which is sponsored by the Headquarters, US Army Corps of Engineers
(HQUSACE). The DOTS is managed by the Environmental Laboratory (EL) of the
US Army Engineer Waterways Experiment Station (WES) as part of the Environ-
mental Effects of Dredging Programs (EEDP). Dr. Robert M. Engler was Program
Manager for the EEDP; Mr. Thomas R. Patin was the DOTS Program Manager.
Technical Monitor was Mr. Joseph Wilson, HQUSACE.
Parts I through IX of the report were prepared by Messrs. Paul L.
Knutson and Hollis H. Allen, Coastal Ecologist and Botanist, respectively,
Wetlands and Terrestrial Habitat Group (WTHG), Environmental Resources
Division (ERD), EL. Appendix A of the report was prepared by Mr. Knutson;
Dr. Steve Broome, Professor of Soil Science at North Carolina State University
at Raleigh; and Mr. Frank E. Yelverton, Biologist, US Army Engineer District,
Wilmington. Appendix B was prepared by Dr. James W. Webb, Professor of
Ecology at Texas A&M University at Galveston, and Mr. Allen. Dr. Webb was
employed by the WES under the terms of an Intergovernmental Personnel Act
agreement.
Technical reviews were provided by Dr. Charles V. Klimas and
Mr. Robert L. Lazor of the WTHG and by Mr. Donald D. Davidson of the Wave
Research Branch, Coastal Engineering Research Center, WES. The report was
edited by Ms. Jessica S. Ruff of the WES Information Technology Laboratory.
The work was conducted under the direct supervision of Dr. Hanley K.
Smith and Mr. E. Carl Brown, respective Chiefs of the WTHG, and under the
general supervision of Dr. Conrad J. Kirby, Chief, ERD, and Dr. John Harrison,
Chief, EL.
Commander and Director of WES was COL Larry B. Fulton, EN. Technical
Director was Dr. Robert W. Whalin. )r
This report should be cited as follows: 5Knutson, Paul L., Allen, Hollis H., and Webb, James W. 1990. .0
"Guid._lines for Vegetative Erosion Control on Wave-Impacted CoastalDredged Materi.al Sites," Technical Report D-90-13, US Army EnSgncCr --
wa tewa Thy2rment Station, Vicksburg, MS.n
Availability CodesAvail and/or
e Dit Special
1 AdOO
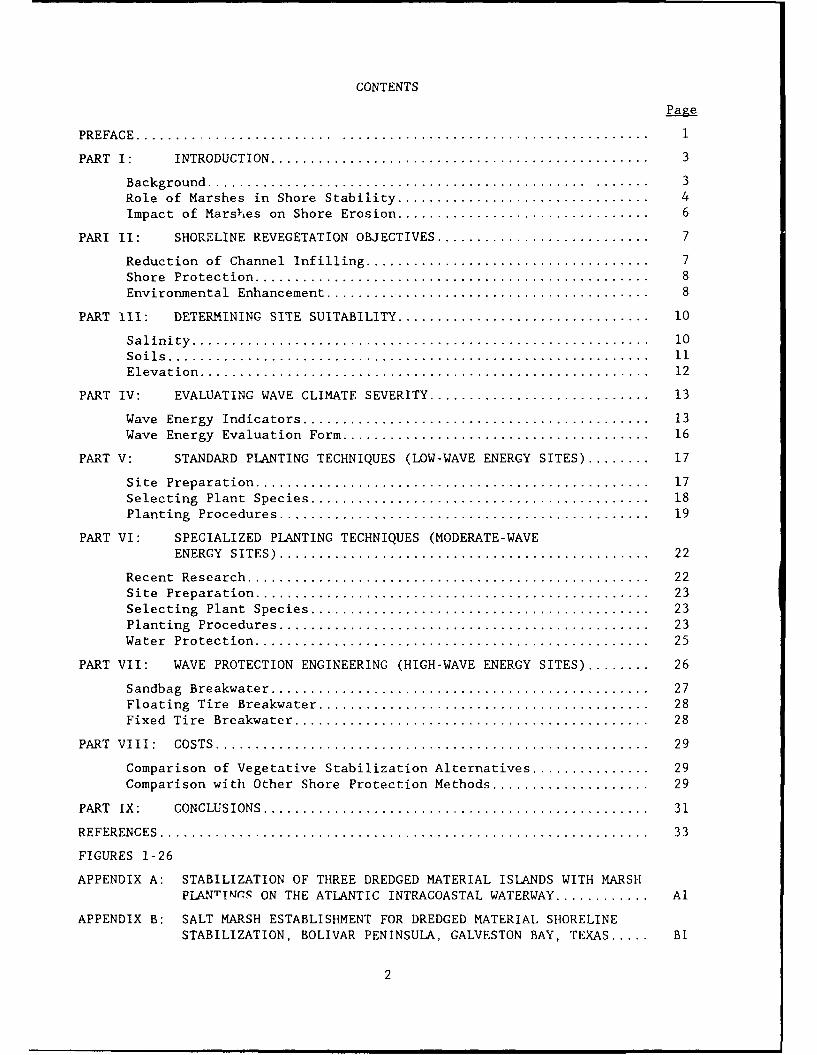
CONTENTS
Page
PREFACE.................................................................... 1
PART I: INTRODUCTION................................................... 3
Background.................................................... ....... 3Role of Marshes in Shore Stability................................... 4Impact of Mars-res on Shore Erosion................................... 6
PARI II: SHORELINE REVEGETATION OBJECTIVES.............................. 7
Reduction of Channel Infilling....................................... 7Shore Protection..................................................... 8Environmental Enhancement............................................ 8
PART III: DETERMINING SITE SUITABILITY.................................. 10
Salinity............................................................. 10Soils................................................................ 11Elevation............................................................ 12
PART IV: EVALUATING WAVE CLIMATE SEVERITY.............................. 13
Wave Energy Indicators.............................................. 13Wave Energy Evaluation Form......................................... 16
PART V: STANDARD PLANTING TECHNIQUES (LOW-WAVE ENERGY SITES) ........... 17
Site Preparation..................................................... 17Selecting Plant Species............................................. 18Planting Procedures................................................. 19
PART VI: SPECIALIZED PLANTING TECHNIQUES (MODERATE-WAVEENERGY SITES).................................................. 22
Recent Research...................................................... 22Site Preparation.................................................... 23Selecting Plant Species............................................. 23Planting Procedures................................................. 23Water Protection.................................................... 25
PART VII: WAVE PROTECTION ENGINEERING (HIGH-WAVE ENERGY SITES) ........... 26
Sandbag Breakwater.................................................. 27Floating Tire Breakwater............................................ 28Fixed Tire Breakwater............................................... 28
PART VIII: COSTS.......................................................... 29
Comparison of Vegetative Stabilization Alternatives .................. 29Comparison with Other Shore Protection Methods...................... 29
PART IX: CONCLUSIONS.................................................... 31
REFERENCES................................................................. 33
FIGURES 1-26
APPENDIX A: STABILIZATION OF THREE DREDGED MATERIAL ISLANDS WITH MARSHPLANTIMGS ON THE ATLANTIC INTRACOASTAL WATERWAY .............. Al
APPENDIX B: SALT MARSH ESTABLISHMENT FOR DREDGED MATERIAL SHORELINESTABILIZATION, BOLIVAR PENINSULA, GALVESTON BAY, TEXAS ....... Bi
2
GUIDELINES FOR VE(ETATIVE EROSION CONTROL ON WAVE-IMPACTED
COASTAL DREDGED MATERIAL SITES
PART I: INTRODUCTION
Background
1. The US Army Corps of Engineers' dredging program involves main-
tenance work and the improvement of some 40,000 km of navigation channels that
serve over 400 ports. This effort entails the disposal of about 230 million
cubic meters of dredged material.
2. Dredging within the bays, sounds, and estuaries of the coastal
United States consists of the excavation, transport, and disposal of material
at an environmentally acceptable location within a reasonable distance from
the navigation channel. Commonly, the margins of these disposal areas are
subject to erosion from wind-generated waves or the wakes of passing boats or
ships. Erosional losses may contribute to the infilling of navigation
channels, increasing dredging requirements. A wide variety of engineering
structures have been employed to abate erosional losses from these areas.
However, because of the high cost of structural shore protection measures, it
is often more cost effective to simply compensate for erosional losses with
increased dredging.
3. Over the past decade, the US Army Engineer Waterways Experiment
Station has assisted various Corps of Engineer Districts it1 stabilizing
dredged material and developing coastal marshes. Early work focused on
developing salt marshes on dredged material for habitat development in low-
wave energy environments (Environmental Laboratory 1978) (Figures 1 and 2).
More recently, the use of marshes to provide erosion control on wave-impacted
dredged material shorelines has been evaluated (Allen, Webb, and Shirley
1984). Salt marsh plants have proven to be a cost-effective erosion control
measure on dredged material shorelines while providing the combined benefit of
wildlife and fisheries habitat.
4. These guidelines include a discussion of (a) vegetative stabiliza-
tion theory, (b) site selection criteria, (c) advanced marsh-planting tech-
niques, (d) cost evaluation procedures, and (e) salt marsh development
demonstrations in North Carolina and Texas. Most of the research and
3
practical experience on this subject comes from projects on the Atlantic and
gulf coasts of the United States. Practices such as the building of dredged
material islands are more common in these coastal regions. The theory and
principles presented in these guidelines will be generally applicable to the
Pacific coast, but specific information may not apply. Few opportunities for
shore protection with salt marsh vegetation will be encountered in the Pacific
region due to a general avoidance of intertidal disposal alternatives.
5. Vegetative stabilization will continue to play a limited role in the
Great Lakes. Hall and Ludwig (1975) evaluated the potential use of marsh
plants for erosion control in the Great Lakes. They concluded that there were
few areas suitable for this method of shore protection because of high wave
energy, winter icing, and fluctuating lake levels. In Alaska, a relatively
short growing season, broad tidal ranges, high-energy conditions, and icing
prevent the use of salt marsh vegetation for erosion control. This alterna-
tive has not been used in the limited bays and estuaries of Hawaii.
Role of Marshes in Shore Stability
Wave damping
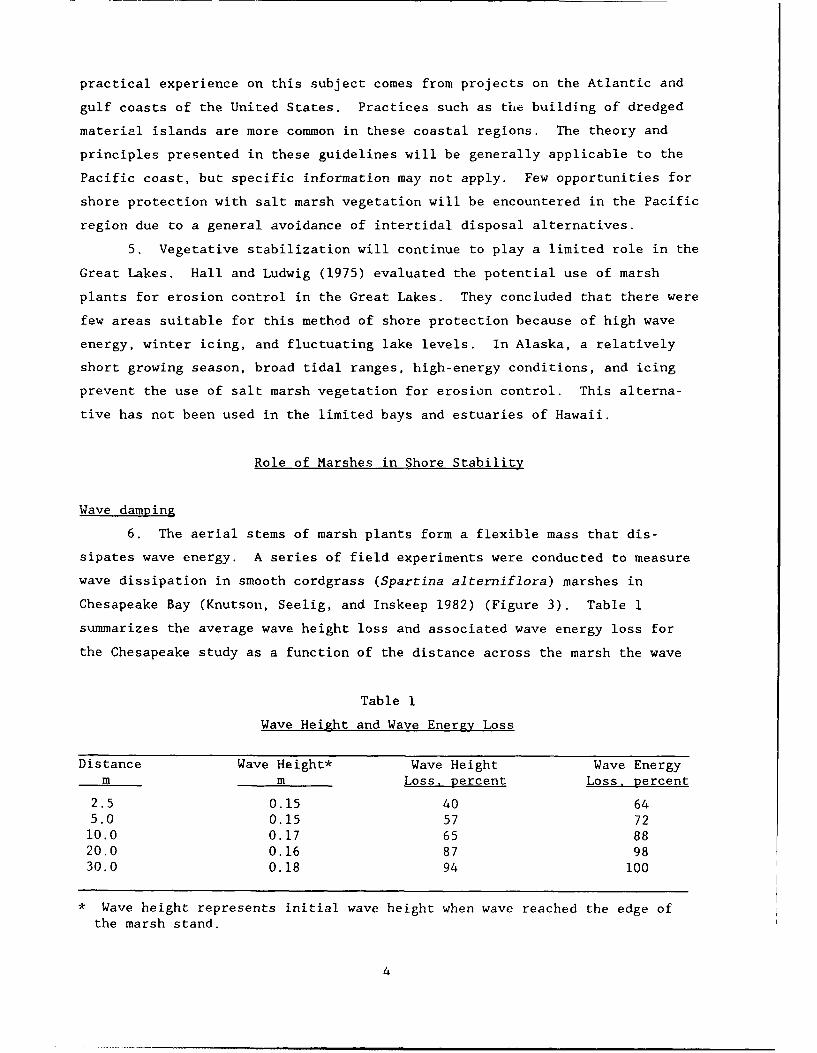
6. The aerial stems of marsh plants form a flexible mass that dis-
sipates wave energy. A series of field experiments were conducted to measure
wave dissipation in smooth cordgrass (Spartina alterniflora) marshes in
Chesapeake Bay (Knutson, Seelig, and Inskeep 1982) (Figure 3). Table I
summarizes the average wave height loss and associated wave energy loss for
the Chesapeake study as a function of the distance across the marsh the wave
Table I
Wave Height and Wave Energy Loss
Distance Wave Height* Wave Height Wave Energym m Loss, percent Loss, percent
2.5 0.15 40 645.0 0.15 57 7210.0 0.17 65 8820.0 0.16 87 9830.0 0.18 94 100
* Wave height represents initial wave height when wave reached the edge ofthe marsh stand.
4
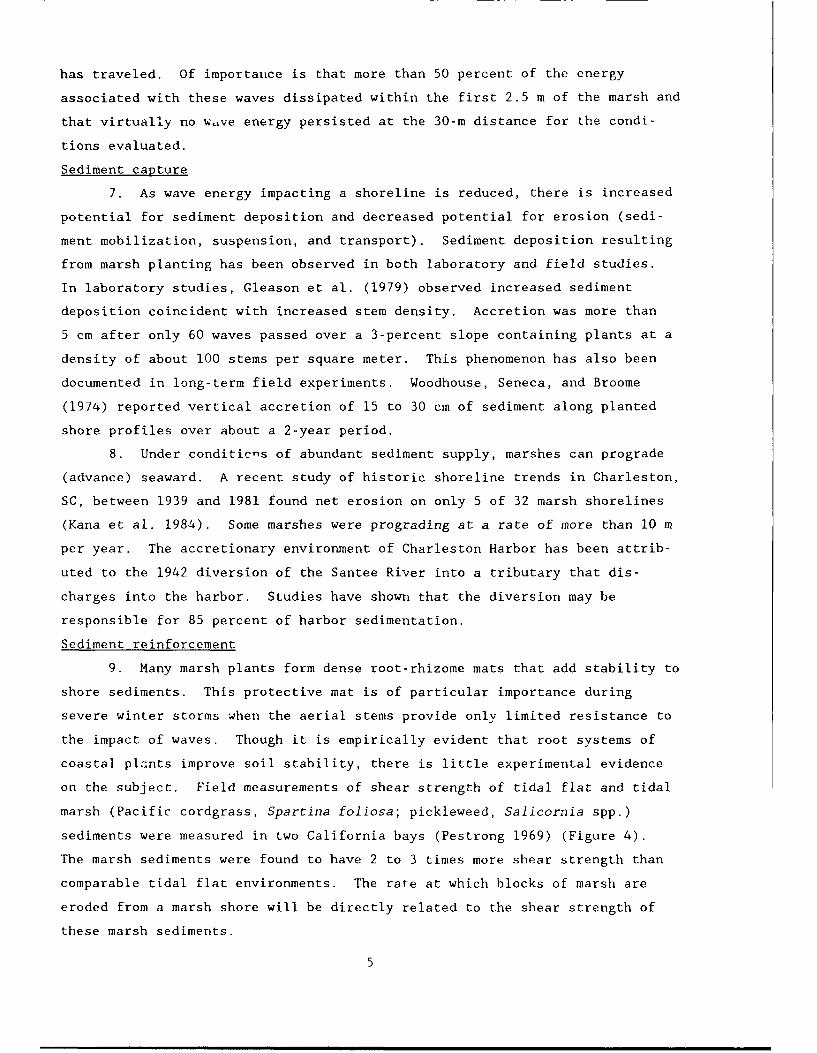
has traveled. Of importance is that more than 50 percent of the energy
associated with these waves dissipated within the first 2.5 m of the marsh and
that virtually no w.ve energy persisted at the 30-m distance for the condi-
tions evaluated.
Sediment capture
7. As wave energy impacting a shoreline is reduced, there is increased
potential for sediment deposition and decreased potential for erosion (sedi-
ment mobilization, suspension, and transport). Sediment deposition resulting
from marsh planting has been observed in both laboratory and field studies.
In laboratory studies, Gleason et al. (1979) observed increased sediment
deposition coincident with increased stem density. Accretion was more than
5 cm after only 60 waves passed over a 3-percent slope containing plants at a
density of about 100 stems per square meter. This phenomenon has also been
documented in long-term field experiments. Woodhouse, Seneca, and Broome
(1974) reported vertical accretion of 15 to 30 cm of sediment along planted
shore profiles over about a 2-year period.
8. Under conditions of abundant sediment supply, marshes can prograde
(advance) seaward. A recent study of historic shoreline trends in Charleston,
SC, between 1939 and 1981 found net erosion on only 5 of 32 marsh shorelines
(Kana et al. 1984). Some marshes were prograding at a rate of more than 10 m
per year. The accretionary environment of Charleston Harbor has been attrib-
uted to the 1942 diversion of the Santee River into a tributary that dis-
charges into the harbor. Studies have shown that the diversion may be
responsible for 85 percent of harbor sedimentation.
Sediment reinforcement
9. Many marsh plants form dense root-rhizome mats that add stability to
shore sediments. This protective mat is of particular importance during
severe winter storms when the aerial stems provide only limited resistance to
the impact of waves. Though it is empirically evident that root systems of
coastal plants improve soil stability, there is little experimental evidence
on the subject. Field measurements of shear strength of tidal flat and tidal
marsh (Pacific cordgrass, Spartina foliosa; pickleweed, Salicornia spp.)
sediments were measured in two California bays (Pestrong 1969) (Figure 4).
The marsh sediments were found to have 2 to 3 times more shear strength than
comparable tidal flat environments. The rate at which blocks of marsh are
eroded from a marsh shore will be directly related to the shear strength of
these marsh sediments.
5
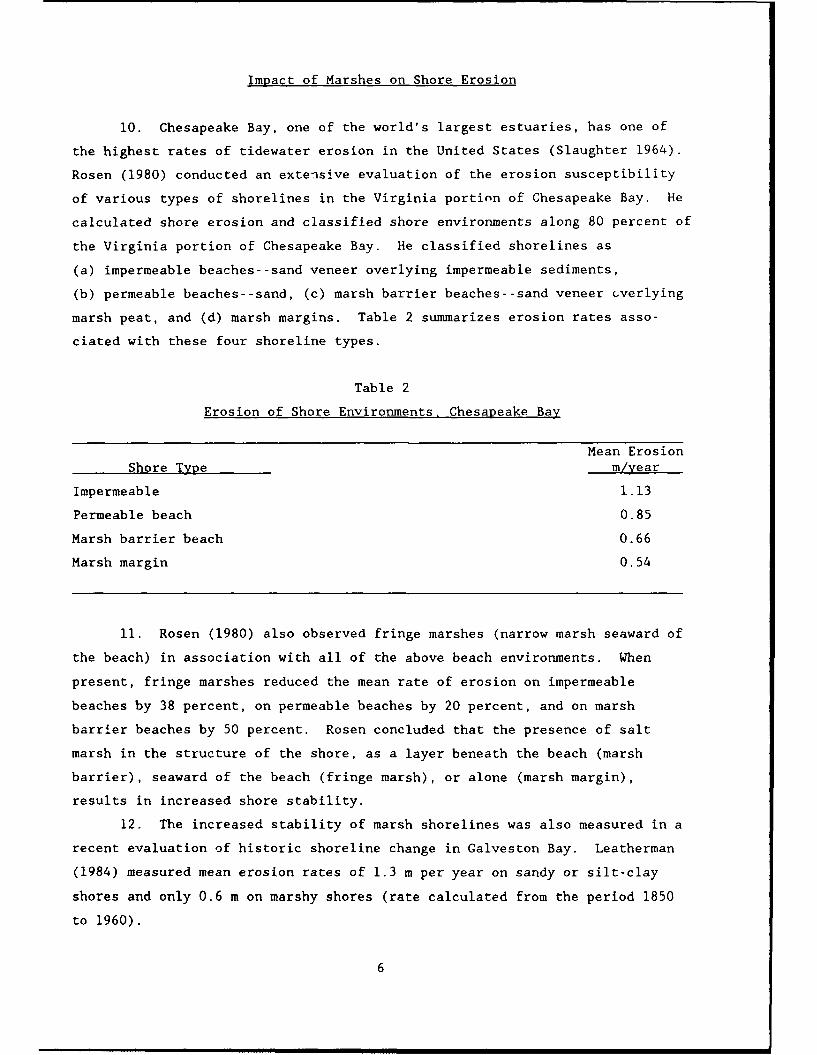
Impact of Marshes on Shore Erosion
10. Chesapeake Bay, one of the world's largest estuaries, has one of
the highest rates of tidewater erosion in the United States (Slaughter 1964).
Rosen (1980) conducted an extensive evaluation of the erosion susceptibility
of various types of shorelines in the Virginia portion of Chesapeake Bay. He
calculated shore erosion and classified shore environments along 80 percent of
the Virginia portion of Chesapeake Bay. He classified shorelines as
(a) impermeable beaches--sand veneer overlying impermeable sediments,
(b) permeable beaches--sand, (c) marsh barrier beaches--sand veneer overlying
marsh peat, and (d) marsh margins. Table 2 summarizes erosion rates asso-
ciated with these four shoreline types.
Table 2
Erosion of Shore Environments, Chesapeake Bay
Mean Erosion
Shore Type m/year
Impermeable 1.13
Permeable beach 0.85
Marsh barrier beach 0.66
Marsh margin 0.54
11. Rosen (1980) also observed fringe marshes (narrow marsh seaward of
the beach) in association with all of the above beach environments. When
present, fringe marshes reduced the mean rate of erosion on impermeable
beaches by 38 percent, on permeable beaches by 20 percent, and on marsh
barrier beaches by 50 percent. Rosen concluded that the presence of salt
marsh in the structure of the shore, as a layer beneath the beach (marsh
barrier), seaward of the beach (fringe marsh), or alone (marsh margin),
results in increased shore stability.
12. The increased stability of marsh shorelines was also measured in a
recent evaluation of historic shoreline change in Galveston Bay. Leatherman
(1984) measured mean erosion rates of 1.3 m per year on sandy or silt-clay
shores and only 0.6 m on marshy shores (rate calculated from the period 1850
to 1960).
6
PART II: SHORELINE REVEGETATION OBJECTIVES
Reduction of Channel Infilling
13. When dredged material is placed adjacent to an existing shoreline
or in the form of an island, a new shoreline (beach) is created. Dredged
material beaches typically experience short-term erosion a-d commonly are
subject to continual, long-term losses. The beach, the intersection of the
land and the sea, is where wave forces encounter the land. The beach responds
to this attack by a variety of "give-and-take" measures that effectively
dissipate the sea's energy.
14. The first defense against the sea's energy is in the form of the
sloping nearshore bottom. When a wave reaches a water depth equal to about
1.3 times its wave heighc, the wave collapses or breaks (Munk 1949). Thus, a
wave 0.3 m high will break in a depth of about 0.4 m. If there is an increase
in the incoming wave energy, the beach adjusts its profile to facilitate the
dissipation of the additional -nergy. This is most frequently done by the
seaward transport of beach material to an area where the bottom water veloci-
ties are sufficiently reduced to cause sediment deposition. Eventually,
enough material is deposited to form an offshore bar, which causes the waves
to break farther seaward, widening the surf zone over which the remaini.g
energy must be dissipated (Coastal Etgineering Research Center 1984)
(Figure 5).
15. All beaches go through continual change as sediments are tem-
porarily removed from and later redeposited on the beach in response to wave
conditions. In general, high, steep waves move material offshore, and low
waves of long period (low steepness) move material onshore. However, when
disposal areas are close to navigation channels, movement of sediment may be
primarily offshore. During storms, steep waves may move sediment offshore
into adjacent channels where it may be lost to the beach system; this materirl
might have to be redredged to maintain safe navigation. This net loss of
material from the beach system makes the beach increasingly vulnerable to
erosion during subsequent storms and increases the potential for continued
channel deposition.
16. Salt marsh vegetation can be established on the intertidal portion
of som dredged material sites to reduce sediment loss. Woodhouse, Seneca,
arc Broome (1974) report on a series of salt marsh plantings on sandy dredged
7

material in Snow's Cut, North Carolina. Elevational profiles over a 2.5-year
period indicate a continued accumulation of 4 to 10 cu in of sand per linear
meter of shoreline pet year. The stabilization or capture of material of this
magnitude can substaLtially reduce dredging requirements in adjacent chann is.
Shore Protection
17. The second major objective of vegetative establishment on dr~dged
material is shore protection. Dredged miterial is frequently confined within
containic,.C dikes. Containment dikes allow more material to be placed in a
smaller area and a'.leviate many water quality considerations. Continued use
of containment areas depends upon the maintenance of the integrity of the dike
structure. These structures are typically earthen in construction and may be
in direct contact with the water. Where dikes are constructed, shoreline
erosion is a common problem. To avoid direct wave attack, berms are often
established seaward of the dike. Salt marsh plantings have proven to be an
effective method of stabilizing the intertidal portion of the berm area,
reducing erosion, and decreasing maintenance on the diked structure.
Environmental Enhancement
18. Establishing marsh plants to abate shore erosion generally will be
considered as an "ervironmental enha..cement." Positive biological and
aesthetic benefits are typically associated with vegetative stabilization
projects. Salt marshes are valued as sources of primary production \energy),
as nursery grounds for sport and commercial fishery species, and as a system
for storing and recycling nutrients. Once established, planted salt marshes
function as natural salt marshes and gradually develop comparable animal
populations (Cammen 1976; Cammen, Seneca, and Copeland 1976; Landin 1986;
Landin, Webb, and Knutson 1989),
19. The primary pathway of energy flow from salt marshes is believed to
be through the detrital food chain. Dead grass is broken down by bacteria in
the surrounding watcrs and on the surface of the rarsh. This process greatly
decreases the total energy content but increases the concentration of protein,
thereby increasing ,he food value. Some detrital particles and microalgae are
eaten by a -ariety of deposit- and filter-feeders, such as fiddler crabs,
snails, and mussels; these organism, arc, in turn, eaten by predators such as
8
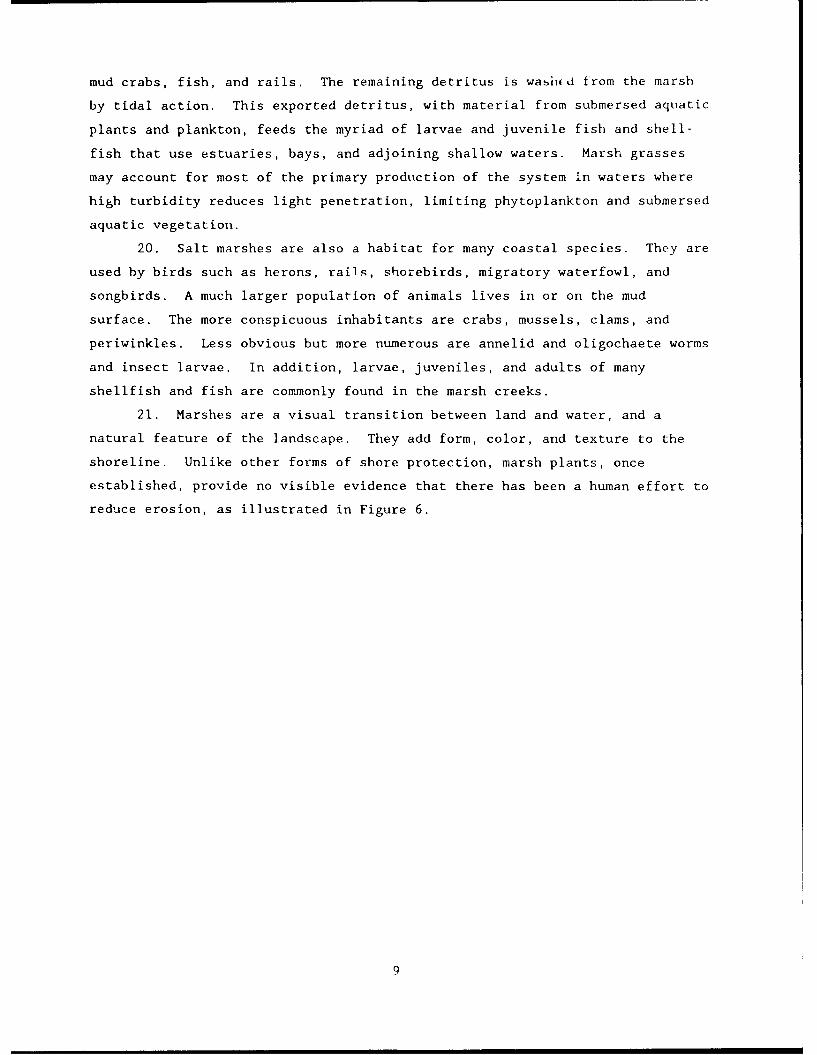
mud crabs, fish, and rails. The remaining detritus is washed from the marsh
by tidal action. This exported detritus, with material from submersed aquatic
plants and plankton, feeds the myriad of larvae and juvenile fish and shell-
fish that use estuaries, bays, and adjoining shallow waters. Marsh grasses
may account for most of the primary production of the system in waters where
high turbidity reduces light penetration, limiting phytoplankton and submersed
aquatic vegetation.
20. Salt marshes are also a habitat for many coastal species. They are
used by birds such as herons, rails, shorebirds, migratory waterfowl, and
songbirds. A much larger population of animals lives in or on the mud
surface. The more conspicuous inhabitants are crabs, mussels, clams, and
periwinkles. Less obvious but more numerous are annelid and oligochaete worms
and insect larvae. In addition, larvae, juveniles, and adults of many
shellfish and fish are commonly found in the marsh creeks.
21. Marshes are a visual transition between land and water, and a
natural feature of the landscape. They add form, color, and texture to the
shoreline. Unlike other forms of shore protection, marsh plants, once
established, provide no visible evidence that there has been a human effort to
reduce erosion, as illustrated in Figure 6.
9
PART III: DETERMINING SITE SUITABILITY
Salinity
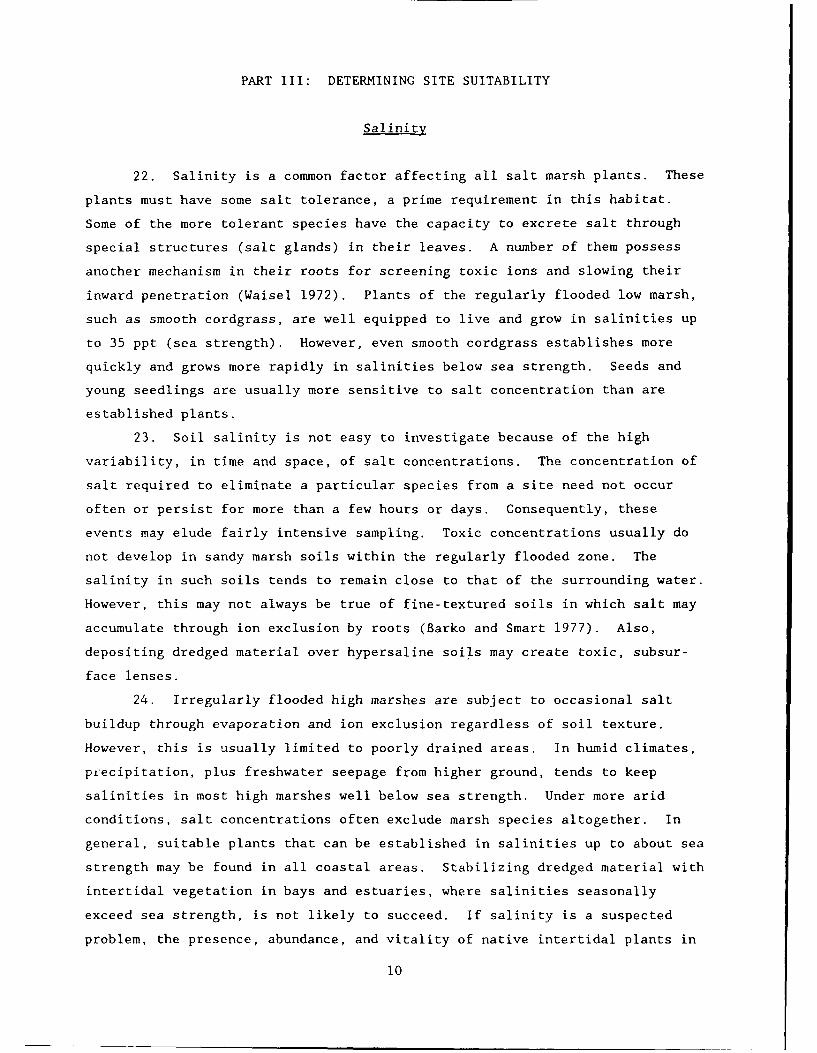
22. Salinity is a common factor affecting all salt marsh plants. These
plants must have some salt tolerance, a prime requirement in this habitat.
Some of the more tolerant species have the capacity to excrete salt through
special structures (salt glands) in their leaves. A number of them possess
another mechanism in their roots for screening toxic ions and slowing their
inward penetration (Waisel 1972). Plants of the regularly flooded low marsh,
such as smooth cordgrass, are well equipped to live and grow in salinities up
to 35 ppt (sea strength). However, even smooth cordgrass establishes more
quickly and grows more rapidly in salinities below sea strength. Seeds and
young seedlings are usually more sensitive to salt concentration than are
established plants.
23. Soil salinity is not easy to investigate because of the high
variability, in time and space, of salt concentrations. The concentration of
salt required to eliminate a particular species from a site need not occur
often or persist for more than a few hours or days. Consequently, these
events may elude fairly intensive sampling. Toxic concentrations usually do
not develop in sandy marsh soils within the regularly flooded zone. The
salinity in such soils tends to remain close to that of the surrounding water.
However, this may not always be true of fine-textured soils in which salt may
accumulate through ion exclusion by roots (Barko and Smart 1977). Also,
depositing dredged material over hypersaline soils may create toxic, subsur-
face lenses.
24. Irregularly flooded high marshes are subject to occasional salt
buildup through evaporation and ion exclusion regardless of soil texture.
However, this is usually limited to poorly drained areas. In humid climates,
pfecipitation, plus freshwater seepage from higher ground, tends to keep
salinities in most high marshes well below sea strength. Under more arid
conditions, salt concentrations often exclude marsh species altogether. In
general, suitable plants that can be established in salinities up to about sea
strength may be found in all coastal areas. Stabilizing dredged material with
intertidal vegetation in bays and estuaries, where salinities seasonally
exceed sea strength, is not likely to succeed. If salinity is a suspected
problem, the presence, abundance, and vitality of native intertidal plants in
10
sheltered areas near the proposed project will be the most reliable indicator
of probable success.
Soils
25. The distribution of most salt marsh plants is not limited by soil
type or texture. They may be found growing on mineral soils ranging from
coarse sands to heavy clays and on peats and mucks of widely varying nutrient
content and degree of decomposition. This does not mean that soils are
unimportant to marsh establishment and growth. Soil characteristics affect
marsh planting in at least three respects--substrate stability, nutrient
supply, and ease of planting.
26. Even under the most favorable conditions, transplants require
several weeks to anchor themselves and still more time to develop an apprecia-
ble protective effect. Substrate is important to this process. In loose
sands, even when net erosion may be minimal, substrate movement resulting from
wave action may dislodge the transplants before they can become fully
anchored. The threat of substrate movement is less critical in cohesive
soils, which tend to be more stable.
27. Nutrient deficiencies are seldom encountered on dredged sediments
because of their alluvial origins. However, the objective of erosion control
on dredged material is to establish rapid plant cover. For this reason,
nutrient supplements (fertilizer) are routinely applied, particularly on sandy
materials. Black (1968), Epstein (1972), Gauch (1972), Tisdale and Nelson
(1975), and Russell (1977) adequately cover the subject of soil fertility and
plant growth.
28. The nature and origin of the soils in a region will often provide
general guidance as to the probability of fertilizer needs. For example,
young soils formed from moderately weathered materials, such as occur in the
Mississippi Delta, are much less likely to be deficient in nutrients than the
much older, highly weathered sediments that predominate along much of the
Atlantic coast.
29. Soil characteristics can greatly influence the planting process.
It is essential that the soil be taken into account early, as it will often
dictate the planting method and thus have a major effect on costs. Loose,
sandy soils are usually easy to plant; planting holes are readily opened by
hand with shovels, spades, or dibbles and are easily closed and firmed after
11
transplanting. Tractor-drawn planters work well on these soils (Figure 7).
On fine-grained dredged material deposits, mobility may be greatly reduced,
which complicates hand planting and often precludes mechanical planting.
Elevation
30. The target area in vegetative stabilization projects is the portion
of the shore in direct contact with the waves--the intertidal zone. The
portion of the intertidal zone suitable for plant establishment is dependent
upon (a) the plant species selected, (b) the local tidal range, and
(c) regional trends. Though there is some variation in the elevation (tidal)
zones in which marsh plants can be established, the following is a general
guide. On the Atlantic and gulf coasts, marsh plants can be found throughout
much of the intertidal zone where the tidal amplitude is less than about
1.0 m. Where the tidal amplitude exceeds 1.0 m, the lower elevational limit
of invasion is more restricted. In areas of the north Atlantic, where the
tidal amplitude may reach or exceed 3.0 m, plants are restricted to the upper
one half or less of the tidal zone. On the southern Pacific coast, marsh
plants seldom extend below the elevation of mean tide, irrespective of tidal
amplitude. In the northern Pacific coast, most of the intertidal zone lacks
marsh vegetation because of the influence of large tidal ranges and the
absence of suitable adapted species. Marshes are rarely found below the
elevation of mean lower high water in this region. Local variability can
often be accounted for by measuring the elevational range of existing natural
marshes in the project area.
12
PART IV: EVALUATING WAVE CLIMATE SEVERITY
Wave Energy Indicators
31. It is a complex task to describe wave environments in which marsh
plantings are likely to survive and thrive. Many physical and biological
variables must be acknowledged when attempting to describe the impact of waves
on marsh stability. First, the frequency and magnitude of severe wave
conditions will be largely influenced by local climatological patterns, the
expanse of open water (fetch), and water depth. Second, the impact these
waves have on the shore will depend on the tidal stage or water level coinci-
dent with these waves, as well as such factors as offshore contours, foreshore
slope, and shore configuration. Third, the ability of the marsh to withstand
wave stress will depend on its growth stage, density, vigor, and overall
width.
Wind-generated waves
32. Knutson et al. (1981) developed a method for classifying shore-
lines with respect to wave energy based upon a limited number of shore
characteristics. Ten shore characteristics were identified as potential
indicators of wave severity. Eighty-six marsh-planting sites in 12 coastal
states were evaluated with respect to these indicators as part of the National
Marsh Survey (NMS) and Erosion Control Project. Four parameters proved to be
useful indicators: average fetch and longest fetch (defined below), shore
geometry, and sediment grain size. The relationships between these parameters
and planting success were condensed into a vegetative stabilization site
evaluation form, which provides an estimate of planting success.
33. Because the NMS evaluated only natural shorelines, difficulty is
often encountered in applying this information to dredged material disposal
areas. Marsh development on dredged material typically requires an appraisal
of site suitability prior to the disposal of the material and the creation of
a new intertidal shoreline. The sediment grain size parameter, in partic-
ular, cannot be validly applied to potential disposal sites. Sediment grain
size will be influenced by the type of material that is deposited and will not
be a valid indicator of wave severity at the site.
34. Similar site evaluation studies were initiated by the Virginia
Institute of Marine Sciences (VIMS) in 1981 (Hardaway et al. 1984). Twenty-
four sites were selected in the tidelands of Virginia on Chesapeake Bay. Each
13
of the selected sites was then planted by VIMS and evaluated over a 2-year
period. The VIMS program found excellent agreement between the single
parameter of average fetch and the multiple parameters identified in the NMS.
Knutson and Steele (1988) discuss the use of the single parameter "average
fetch" for evaluating wave climate and potential planting success on dredged
material.
35. Fetch is the distance over open water the wind blows to generate
waves. Average fetch is simply the average of three measured fetch
lengths--one measurement perpendicular to the shore and two measurements at
45-deg angles (0.8 rad) to perpendicular. For coastal engineers, fetch is an
important parameter in estimating wave height. The height of a wave formed by
a constant wind blowing over water of a constant depth is directly related to
fetch length (Coastal Engineering Research Center 1984). This relationship is
not linear. For example, a constant wind blowing 50 km/hr over a constant
water depth of 6 m will generate a 15-cm wave over a fetch of about 150 m, a
30-cm wave over 750 m, a 45-cm wave over 2 km, and a 60-cm wave over 4 km. As
fetch length increases, it has incrementally less influence on wave height;
however, in general, the greater the fetch, the greater the potential for
extreme wave conditions. For this reason, fetch is a useful indicator of
potential planting success (the presence of vegetation and the absence of
measurable erosion landward of the vegetation).
36. Figure 8 compares average fetch and planting success for all sites
evaluated in the NMS (86 sites) and in the VIMS study (24 sites). The number
of sites with fetches over 9.0 km was limited (only 16); however, the value of
this parameter is clearly illustrated.
37. A second useful parameter in evaluating wave climate severity is
shore geometry (the shape of the shoreline). Common sense would dictate that
sites located in narrow coves may be effectively sheltered from waves
approaching at oblique angles and will be subjected to large waves only when
winds blow directly onshore. Conversely, sites located on headlands are
exposed to waves from many directions. A more complex, though equally
important, concept involves the bending of waves as they approach the shore
(wave refraction). Under the influence of nearshore contours, wave crests
bend toward alignment with the shore (Figure 9). This produces a divergence
of energy in coves and a convergence of energy on headland features. Conse-
quently, similar wave events may focus more erosive force on a headland than
14
in a cove. Figure 10 summarizes planting success with respect to shore
geometry in the 110 sites evaluated in the NMS and the VIMS study.
38. Webb, Allen, and Shirley (1984) found shore configuration useful in
describing within-site variability at a large planting in Mobile Bay. They
evaluated a 1.6-km-long marsh planting along one leg of a triangular-shaped
dredged material island. Though the entire leg was exposed to comparable
wind-generated waves, plant cover was variable. They found that the degree of
shore exposure (shore configuration) had a measurable impact on plant density.
Sixty-three percent of the samples on indented shorelines (less than 120 deg
(2.1 rad) of exposure) had medium to dense cover, versus 34 percent on more
exposed shores (more than 120 deg of exposure). Sixty-five percent of samples
on exposed shores were sparsely vegetated, versus 37 percent on indented
shores.
Boat-generated waves
39. Even on shores relatively sheltered from wind waves, concern is
often expressed over the potential impact of ship- or boat-generated waves.
Shore areas close to ship traffic will be subject to vessel-generated waves.
The height of waves produced by a given vessel depends primarily on the speed
of the ship relative to water depth and, to a lesser extent, on the hull form
and draft. The wave climate produced by vessels at a particular shore site
will depend on the magnitude of the boat traffic and the distance between the
shore and the passing vessels.
40. Developing accurate estimates of the severity of boat-generated
waves at a particular site requires direct observation of the boat traffic and
the associated waves. Recent studies (described in Appendix A) have helped
contrast the relative importance of wind-generated versus boat-generated
waves. A wind-sheltered dredged material island in Swansboro, NC, was planted
with salt marsh vegetation for stabilization in 1987 (Appendix A). The island
is exposed to a fetch of only 0.5 km, but is located on the Atlantic Intra-
coastal Waterway where it is exposed to waves produced by the passing of
approximately 25,000 boats per year at a distance of 100 to 200 m. The
magnitude and frequency of wind and boat waves were studied at this site over
a 2-year period. The study found that boats could produce waves equal to
those produced by extreme wind conditions. However, in every category of
waves (Table 3), wind-generated waves were 10 times more frequent
than were boat-generated waves. Boat waves are probably responsible for less
than 5 percent of the wave energy impacting this site. Considering the
15
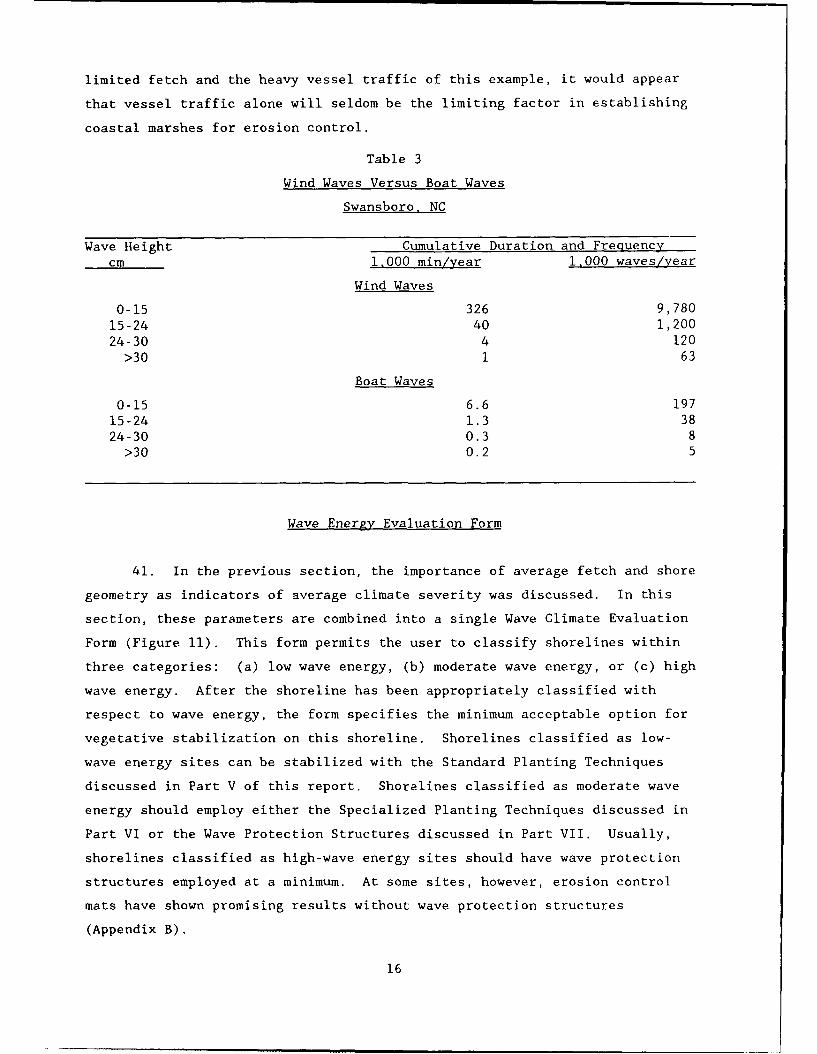
limited fetch and the heavy vessel traffic of this example, it would appear
that vessel traffic alone will seldom be the limiting factor in establishing
coastal marshes for erosion control.
Table 3
Wind Waves Versus Boat Waves
Swansboro, NC
Wave Height Cumulative Duration and Frequencycm 1,000 min/year 1,000 waves/year
Wind Waves
0-15 326 9,78015-24 40 1,200
24-30 4 120>30 1 63
Boat Waves
0-15 6.6 19715-24 1.3 3824-30 0.3 8>30 0.2 5
Wave Energy Evaluation Form
41. In the previous section, the importance of average fetch and shore
geometry as indicators of average climate severity was discussed. In this
section, these parameters are combined into a single Wave Climate Evaluation
Form (Figure 11). This form permits the user to classify shorelines within
three categories: (a) low wave energy, (b) moderate wave energy, or (c) high
wave energy. After the shoreline has been appropriately classified with
respect to wave energy, the form specifies the minimum acceptable option for
vegetative stabilization on this shoreline. Shorelines classified as low-
wave energy sites can be stabilized with the Standard Planting Techniques
discussed in Part V of this report. Shorelines classified as moderate wave
energy should employ either the Specialized Planting Techniques discussed in
Part VI or the Wave Protection Structures discussed in Part VII. Usually,
shorelines classified as high-wave energy sites should have wave protection
structures employed at a minimum. At some sites, however, erosion control
mats have shown promising results without wave protection structures
(Appendix B).
16
PART V: STANDARD PLANTING TECHNIQUES
(LOW-WAVE ENERGY SITES)
Site Preparation
42. An important first step in the process of stabilizing dredged
material shorelines is the creation of a broad, gradual sloping beach. Broad
beaches dissipate wave energy, protecting plants during the establishment
period, and are the foundation of a broad marsh that will ultimately provide
long-term shore protection. When practicable, a design slope of about
1 vertical to 15 horizontal (lV:15H) or more gradual should be maintained.
43. Planting width (the width of the beach at an elevation suitable for
plant establishment) will also influence the relative effectiveness of the
planting. Waves are dampened as they pass through stands of marsh vegetation.
The amount of dampening that occurs is directly related to the width of the
marsh. From a survey of erosion control plantings, Knutson et al. (1981)
concluded that erosion control plantings should maintain a width of at least
6.0 m. In this report, a more conservative minimum width of 10.0 m is
recommended. The potential width (landward to seaward) of a particular
planting depends on the tidal amplitude and shore slope. Broader marshes can
be established coincident with greater tidal ranges and more gradual sloping
shorelines.
44. In most cases, compliance with the recommended preplanting beach
slope of IV:15H will provide a potential planting area equal to or greater
than 10.0 m. Where potential planting width exceeds the recommended minimum,
the entire width should be planted to maximize opportuniLy for success. When
the planting area is not sufficiently wide, the beach must be graded further
to accommodate the 10.0-m minimum width. Creating beach slopes more gradual
than lV:15H will only be necessary in microtidal environments where tidal
amplitude is less than about 0.5 m. Creating a minimum planting width in
these environments is often critical to success because wave energy is focused
upon such as a narrow elevational range. For example, Rosen (1980) observed
that erosion in Chesapeake Bay was inversely related to tidal amplitude
(higher rates of erosion associated with narrow tidal ranges).
17
Selecting Plant Species
Principal species
45. The regularly flooded portion of the intertidal zone is the focus
of vegetative stabilization efforts. This is the region in which erosion
normally begins; continuing erosion of the lower slopes in this region will
undermine and weaken well-stabilized upper slopes. Consequently, the primary
emphasis will be on the planting and management of the few specially adapted
species found useful for this purpose. Often, the establishment and main-
tenance of a healthy band of intertidal salt or brackish marsh along a shore
will eventually result in the natural growth of vegetation on the slope behind
it.
46. Four species of pioneer plants have demonstrated potential in
stabilizing the part of the intertidal zone which is in direct contact with
waves. Smooth cordgrass (Spartina alterniflora) (Figure 12) is an effective
erosion control plant along the gulf and Atlantic coasts; Pacific cordgrass
(Spartina foliosa) (Figure 13) is effective on the southern Pacific coast from
Humboldt Bay, south to Mexico; and Lyngbye's sedge (Carex lyngbyei)
(Figure 14) and tufted hairgrass (Deschampsia caespitosa) (Figure 15) are
effective for stabilization in the northern Pacific coast from Humboldt Bay to
Puget Sound. Detailed planting specifications for these species can be found
in Environmental Laboratory (1978) and Knutson and Woodhouse (1983).
Other useful species
47. In some cases, the planting of the upper portion of the intertidal
zone (mean high water to the highest estimated tide) is advisable to control
erosion caused by storm surges, surface runoff, and wind, or is desiraL-.e for
wildlife/fisheries habitat development, aesthetic, or other reasons. Several
potentially useful species that have been used to supplement intertidal
plantings are black needle rush (Juncus roemerianus), common reed (Phragmites
australis), big cordgrass (Spartina cynosuroides), gulf cordgrass (S.
spartinae), saltmeadow cordgrass (S. patens), saltgrass (Distichlis spicata),
seaside arrowgrass (Triglochin maritima), and seashore paspalum (Paspalum
vaginatum). The need to plant these species should be evaluated for each
individual site. Planting specifications and guidelines for the use of these
species are given in Environmental Laboratory (1978) and Knutson and Woodhouse
(1983).
18
Planting Procedures
Materials
48. Choosing the type of planting materials and determining a source of
suitable planting stock should be done early in the planning process. The
cost of planting stock usually represents a substantial part of the total
expense, and this cost can vary over a wide range. Locating a suitable source
of plants may be the most difficult problem to be solved. The practice of
salt marsh planting is still relatively new in this country. Both the
development and the demonstration of planting techniques have taken place over
the past 15 years. Although a substantial number of successful field-scale
plantings have been made, this has not yet become a standard practice.
Therefore, the demand for planting stock is still small, erratic, and unpre-
dictable. Consequently, such materials are not generally commercially
stocked; however, a number of nurseries produce plant materials on order. In
general, state offices of the Soil Conservation Service maintain lists of
potential commercial growers.
49. Marsh plants are propagated either by seeds or some type of
vegetative transplant. Since direct seeding is effective only under fairly
sheltered conditions, the planting of dredged material areas subject to
erosion will usually be confined to the following vegetative transplants:
(a) sprigs, which are bare root plants dug from the wild or from field
nurseries, (b) pot-grown seedlings; or (c) plugs, which are root-soil masses
containing several intact plants dug from the wild. There is no one best type
of planting stock. The quality of the material is often the key to success.
High-quality material in any form can be very successful. High quality in
this context means young, vigorous, actively growing vegetation that is large
enough to carry appreciable stored food reserves. Early initiation of new
growth is essential if transplants are to establish under the rigorous
conditions existing on most eroding shorelines. This new growth cannot be
expected of old or stunted plants, regardless of transplant form.
50. The three types of planting stock vary in availability, cost, and
ease of planting:
a. Sprigs are the least expensive of the three types and easier tohandle, transport, and plant. They must be obtained from fieldnurseries (planted a year or more in advance), from youngdeveloping natural stands, or along the edges of stable or
19
expanding marshes. Sprigs are best dug from sandy substrates
(Figure 16).
b. Pot-grown seedlings are more expensive to grow and plant, moreawkward to handle and transport, but relatively easy to
produce. Seedlings of most species can be grown to trans-
planting size in 3 to 5 months, and this can be done almost
anywhere with very simple, inexpensive facilities and equip-
ment. However, their cost is usually at least 2 to 5 timesthat of sprigs. Seedlings become increasingly expensive to
carry over when transplanting is delayed. Repotting in larger
containers soon becomes essential. The coordination of plantproduction and site preparation is a frequent stumbling block
in the use of seedlings. However, potted material is oftenused when wild sources are not readily available or when local
regulations discourage wild harvest. Potted materials are also
superior for use in late-season plantings (Figure 17).
c. Plugs are the most expensive planting type: the cost is
usually about twice the cost of pot-grown seedlings. Plugs are
heavy, laborious to dig, difficult to transport, and moredifficult to plant. Satisfactory plugs can be dug only from
marshes growing on cohesive substrates. Plugs from old crowded
stands are likely to be too slow in initiating new growth.However, plugs are occasionally the only planting stock
available on short notice.
Methods
51. The essentials in successfully transplanting salt marsh plants
include opening a hole or furrow deep enough to accommodate the plant to the
required depth, closing the opening, and firming the soil around the plant.
This operation should be done during low water, as it is virtually impossible
to do a satisfactory job of transplanting while the surface is flooded.
Openings can close too rapidly, and plants tend to float out. A number of
tools and procedures are effective in substrate that is not flooded.
52. Hand planting can be very satisfactory if adequate attention is
given to details, particularly planting depth and soil firming after planting;
this is usually the most practical method for small-scale plantings. Opening
of planting holes is readily done with dibbles, spades, and shovels in loose,
sandy soils. Portable power-driven augers work well in the more difficult
cohesive or compact soils. Normally, planting crews work in pairs, one worker
opening holes and the other inserting the plant and closing the hole. A third
worker is used if fertilizer is added in the planting hole; this worker drops
in a measured amount of material just after the hole is opened and before the
plant is inserted.
53. Machine planting can do a much more uniform job and is far more
economical than hand planting in large-scale plantings. Tractor-drawn
20
planters designed to transplant crop plants such as cabbage,, tomatoes, and
tobacco are available in most regions. Although some may require an altera-
tion of the row opener for certain soils, they can often be used without
alteration. The principal barriers to machine planting are usually inadequate
traction on compact and slippery substrates, insufficient bearing capacity on
soft sites, or the presence of tree roots or stones that interfere with the
functioning of the row opener.
54. Most species wiil develop satisfactorily when planted 2 to 5 cm
deeper than their depth when originally dug or removed from pots. However, in
planting exposed shores, it is often highly desirable to anticipate erosion or
accretion trends that are likely to prevail during the first month or two
after planting. Where erosion is expected, plants should be set even deeper
than the 2- to 5-cm depth. Where deposition is likely, they should be set
very close to their original depth when dug or removed from pots.
Replanting
55. Achieving stability on dredged material shores with vegetation
often requires both perseverance and patience. First, severe storms during
establishment may cause temporary setbacks, even on highly promising sites.
but these setbacks should not discourage the planter. More formidoble and
e. pensive coastal engineering structures are often damaged by the untimely
occurrence of severe storms. Low-wave energy sites as defined in this report
are sites that are exposed to less than a 9.0-km average fetch, or exposed to
fetches of 9.0 to 18.0 km but located in a sheltered cove (see Wave Climate
Evaluation Form, Figure 11).
56. Use of the Standard Planting Techniques, as described in this
section, is recommended for vegetative stabilization on these sites. However,
the success of an initial planting is far from guaranteed. Knutson et al.
(1981) observed that one of three initial plantings fails on sites exposed to
fetches of less than 9.0 km, and one of two initial plantings fails in the
fetch range of 9.0 to 18.0 km.
21
PARf VI: SPECIALIZED PLANTING TECHNIQUES
(MODERATE-WAVE ENERGY SITES)
Recent Research
57. Planting fLlure is frequently encountered when Standard Planting
Techniques are employed in moderate-wave energy environments. Moderate-wave
environments are straight shorelines that are e-posed to an average fetch of
9.0 to 18 0 km or have the prescribed combination of average fetch and shore-
line geometry summarized in the Wave Climate Evaluation Form (Figure 11). In
moderate environments, plants are often dislodged by waves before they can
become established.
58. The WES has been assisting the US Army Engineer District, Mobile,
since 1981 with the vegetative stabilization of a dredged material island.
During 1981 and 1982, portions of Gaillard Island, a dredged material island
in Mobile Bay, Alabama, were planted with marsh grass sprigs, the most often
used Standard Planting Technique. The purpose of the planting was to stabi-
lize an unvegetated shoreline on the northwest side of the island (1.5 km
long) that is subject to low and moderate wave energies (average fetch =
6.0 km; shoreline geometry = variable cove to headland). The northwest side
of the island is actually a dike one of three dikes that enclose the disposal
area (Figure 18). In some places, washout occurred even after three planting
attempts. Washout of transplants was a problem in areas with long, straight
beaches and steep shorelines. Coves and broad, shallow flats vegetated
rapidly and experienced relatively little washout (Allen, Webb, and Shirley
1984).
59. In 1983, experiments were initiated on a series of new transplant
techniques aimed at holding the plants in place until they could become
established (plant-stem stabilization). A total of 10 new .echniques were
tested at Gaillard Island in areas that had been previously planted and had
washed out two or three times. Two plant-stem stabilization techniques
demonstrated potential at Gaillard: plant rolls and erosion control mats.
These techniques were subsequently tested in Galveston Bay, Texas (see
Appendix B); the Southwest Pass of the lower Mississippi River; and on Coffee
Island in Mississippi Sound.
22
Site Preparation
60. Creating a broad, gradual sloping beach to dissipate wave energy is
even more critical in moderate wave climates (see Site Preparation, Part V).
As noted in the previous description of Gaillard Island, repeated failures
were encountered on steeply sloping shores. In moderate-wave energy environ-
ments, the criteria for a maximum slope of IV:15H and the minimum planting
width of 10 m should be strictly observed.
Selecting Plant Species
61. In Part V, several species of pioneer plants are listed that have
demonstrated potential for stabilizing low-energy environments. However,
because this is a very new technology, only one salt marsh plant species has
been tested using plant-stem anchoring techniques--smooth cordgrass (Fig-
ure 12). Smooth cordgrass can be used throughout the Atlantic and gulf
coasts. However, smooth cordgrass is not native to the Pacific coast and
should be avoided. Planting of Pacific coast natives such as Pacific cord-
grass (Figure 13) in moderate-wave environments must be considered
experimental in nature. None of the common intertidal species on the west
coast establish and spread as rapidly as smooth cordgrass.
Planting Procedures
62. Two planting methods have demonstrated the potential for increasing
plant survival by anchoring the plant stem during establishment: plant rolls
and erosion control mats.
Plant roll
63. A plant roll is constructed by placing soil and six transplant
clumps (several stems from one intact root mass) at 0.5-m intervals on a strip
of 4-m-long by 0.9-m-wide burlap. The sides and ends of the burlap are
brought together around the plants and fastened with metal rings. This
creates a 3-m-long roll of plants and soil (Figure 19). The plant rolls are
placed end-to-end and parallel to the shoreline and buried to such a depth
that only the plant stems are exposed. Typically, individual plant rolls are
installed about 1 m apart.
23
64. Plant rolls have also been used to add stability to standard
single-stemmed transplant areas. This technique was used at Coffee Island in
Mississippi Sound south of Bayou La Batre, Alabama (Figure 18). The site was
formed from dredged material consisting largely of clay that was deposited in
1981 adjacent to the east side of Coffee Island, a natural island. The
dredged material formed an eroding face due to wave action. The site was
subject to low wave energy along straight portions of the shore and moderate
energy on protruding headland features (Wave Climate Evaluation Form - average
fetch = 6.0 km; shoreline geometry = straight to headland). Plant rolls (one
row) were placed end-to-end seaward of single-stemmed transplants over a
linear distance of about 0.5 km to cover an area 5 to 10 m in width (landward
to seaward).
65. Periodic inspection revealed that the plant rolls placed end-to-
end and seaward of single-stemmed transplants satisfactorily stabilized the
eroding dredged material face. This is evident from a comparison of the photo
presented as Figure 20a, taken 3 months after planting, and Figure 20b, taken
1.5 years after planting. Upon inspection of the site at the time of the
latter, the marsh fringe showed signs of accreting sediment and protecting the
island from further erosion (Allen, Shirley, and Webb 1986).
Erosion control mats
66. As noted earlier, marshes abate erosion by damping wave energy and
binding the sediment. Erosion control mats attempt not only to anchor the
plant but also to bind the surrounding sediment. The mats act as an instant
root mat, providing the sediment with a fibrous, erosion-resistant surface. A
type of mat found to be effective is a biodegradable fabric mat that consists
of 0.1 kg/sq m of natural fibers (coconut and horsehair). The mat is laid
like a carpet on the shore, and single-stemmed transplants are inserted into
slits cut through the material. The edges of the mat are buried in the
sediment.
67. Erosion control mats are about three times as costly to install as
plant rolls, and experimental evidence is lacking to justify their extensive
use. In fact, in the Mobile Bay experiments (Allen, Webb, and Shirley 1984),
plant rolls were somewhat superior in performance. The Gaillard Island
shoreline was exposed to low and moderate wave energy, and sediments were a
mixture of fine sand and cohesive material. However, in the Galveston Bay
studies (Allen, Shirley, and Webb 1986), erosion control mats showed an
impressive p.rformance under extreme wave conditions (see Appendix B).
24
68. The Bolivar site in Galveston Bay is a sandy, high-wave energy
shoreline (Wave Climate Evaluation Form - average fetch = 20 km; shoreline
geometry = straight). As discussed, the planting of such sites is not
recommended without wave protection. Plant rolls were washed out at the
Bolivar site, although portions of three of four mat plots remained intact
long enough to promote colonization and growth of plants, which have remained
to the present. Researchers speculate that erosion control mats may be
superior on eroding sandy shorelines where sand particles can be captured in
the interstices of the material. Conversely, they suspect that plant rolls
will be more cost effective on sediments that have a cohesive component.
Wave Protection
69. In moderate-wave climates, wave protection devices can be used to
reduce wave impact on the shore. Once protected from wave impact, it is often
possible to employ Standard Planting Techniques (Part V) on a shore that would
not otherwise be suitable for these low-energy planting techniques. In these
situations, wave protection is used in lieu of plant-stem anchoring. The
types of low-cost, temporary devices that are used for this purpose are
discussed in detail in Part VII.
25
PART VII: WAVE PROTECTION ENGINEERING
(HIGH-WAVE ENERGY SITES)
70. In moderate wave climates, wave protection is an alternative to the
use of plant-stem anchoring techniques. In high-energy environments, wave
protection will always be required. However, experience suggests that a
breakwater is only necessary for the first 2 to 3 years after planting, until
the plants have spread by rhizomes and completely covered the target planting
area (Newling and Landin 1985). Therefore, in this discussion, only less
expensive and expedient breakwaters, such as sandbag breakwaters, floating
tire breakwaters, and fixed tire breakwaters, are considered. It should be
noted that when dikes are used to contain dredged material, the area inclosed
is sheltered from wave activity. In this respect, containment dikes are
breakwaters. When planting che interior of contained dredged material areas,
low-energy, standard planting techniques are appropriate (Part V).
71. Br.akwaters should be placed far enough offshore to allow maximum
marsh development width (landward to seaward). They should be placed in water
depths so they continue to float at mean low water. Marsh planting should
begin at a distance equal to or exceeding half an average wavelength landward
of the breakwater. This is done to prevent the marsh from being scoured and
eroded from turbulence and backwash caused by the breakwater.
72. Though marsh can be established on virtually any shoreline if
adequate wave protection is provided, there are practical limits to the wise
use of this alternative. Temporary breakwaters willprovide protection to
plantings for a period of 2 to 3 years. Experience indicates that once the
breakwater ceases to protect the planting, an eroding scarp may form on the
leading edge of the planted area. This scarp or bank will be the focus of
continued erosion until the entire piatiLed marsh is gone.
73. Knutson et al. (1981) describe a planting at Cedar Island, North
Carolina, that was fully established after 2 years (Figure 21a) but completely
eroded after 8 years (Figure 21b). This was a high-energy site (average
fetch = 20 km). One should anticipate that after a breakwater ceases to
function, erosion will begin to degrade the seaward edge of the marsh. The
greater the wave energy at the site, the shorter will be the effective life
(design life) of the vegetative stabilization effort. For shallow water
(about 3.0 m deep), a practical average fetch-length limit for vegetative
stabilization projects (even when temporary wave protection is provided) might
26
be about 36 km. Under these wave climate extremes, the effective life of the
planting will approach the design life of the breakwater structure. In
addition, extreme wave conditions also increase the chance that the temporary
breakwater will fail prior to its expected functional life.
Sandbag Breakwater
74. Any container filled with sand, sand-cement, or concrete that is
used as building block material for a breakwater will be considered a sandbag
breakwater for purposes of this discussion. In construction projects, nylon
fabric bags are typically used because of their durability. Sandbag break-
water life expectancy is 2 to 5 years, depending upon site accessibility to
humans and subsequent vandalism, exposure to sunlight (ultraviolet rays
degrade fabric), and energy forces exerted against the dike. Bags can be
filled onsite with hydraulic pumps (sand/water slurry) until inflated and then
sealed. Bag breakwaters must be underlain with filter cloth to prevent scour
and resultant subsidence of the structure. While intact, sandbag breakwaters
provide nearly total protection from wave attack. One consequence of this
protection is that sediment deposition may initially be quite high in the
protected area. To avoid burial of the new plantings, the planting operation
should be delayed several weeks until a measure of stability has been
achieved.
75. A sandbag was successfully used in 1975 to develop salt marsh on a
dredged material site on the Bolivar Peninsula adjacent to Galveston Bay,
Texas (Figure 22) (Allen et al. 1978). This site is a high-wave energy shore
(Wave Climate Evaluation Form - average fetch = 20 km; shore geometry =
straight). A breakwater 300 m long and 1.5 m high was constructed from 0.5-
by 1.4- by 2.9-m nylon bags (Figure 23). Sprigs of smooth cordgrass were
planted immediately landward of the breakwater.
76. Before this project, no natural marsh existed on this side of
Galveston Bay because of the high-energy conditions. The sandbag breakwater
provided enough initial protection of the transplants to permit marsh estab-
lishment (Newling and Landin 1985, Landin 1986). Despite the eventual
degradation of the breakwater structure, the marsh has continued.
27
Floating Tire Breakwater
77. Floating tire breakwaters (FTBs) and shoreward salt marsh plantings
have been successfully used to stabilize shores of unconfined dredged material
deposits at two sites on the gulf coast. In 1981, a two-tier FTB (Figure 24)
and smooth cordgrass sprigs stabilized part of the dredged material dike on
Gaillard island in Mobile Bay (Figure 18). A Lwo-tiered breakwater was tested
in 1984 at the Bolivar Peninsula, Texas, 1 km west of the 1975 high-energy
site described in paragraph 75 (see also Appendix B). The configuration was
selected for field testing after wave tank studies demonstrated that it could
reduce wave energies by as much as 80 percent (Markle and Cialone 1986).
Smooth cordgrass was planted shoreward of the breakwater using conventional
single-stem techniques. Plantings unprotected by a breakwater were also
planted in an adjacent area. Results to date indicate that the protected area
has been completely covered by smooth cordgrass.
Fixed Tire Breakwater
78. A breakwater consisting of tires threaded on 15-cm-diam poles
(Figure 25) was also tested at the Bolivar Peninsula site in 1984. Shoreward
plantings similar to those used behind the two-tiered breakwater (previous
section) were employed. Plant cover after 2 years was similar to that
observed behind the FTB (47 percent). In subsequent years, however, the poles
holding the tires which formed the breakwater broke, scattering the tires.
Then, lack of wave protection led to significant plant washout (see
Appendix B).
28
PART VIII: COSTS
Comparison of Vegetative Stabilization Alternatives
79. Single-stemmed propagules can be harvested and planted for about
$0.15 per plant or $6,000/ha (planting costs based upon labor rate of $6.00/hr
and an additional $0.10/plant for digging, gathering, and transporting).
Because of their low unit cost, they are the primary planting method used in
low-wave energy areas and in conjunction with breakwaters in high-energy
areas. Potted seedlings and plugs are approximately 3 times more expensive
than single-stemmed materials. Plant rolls are the lowest cost of the plant-
stem anchoring methods, having a unit cost of about $0.60 or about $24,000/ha.
Anchoring plants with erosion control mats increases the per unit cost to
about $1.58 or about $63,000/ha.
80. The lowest cost method of providing temporary wave protection is
the FTB. The two-tiered breakwater can be installed on the shoreline for
about $114/m. Planting a 10-m-wide area with single-stemmed plants behind the
breakwater increases the cost per meter to $120. A similar installation using
a fixed tire breakwater increases the cost to $148/m of shoreline. Table 4
provides a cost comparison of these vegetative stabilization alternatives.
Cost Comparison with Other Shore Protection Methods
81. Vegetative stabilization is the least costly of all erosion control
measures (Figure 26). A 10-m-wide (landward to seaward) planting using
Standard Planting Techniques (single-stemmed plants, potted seedlings, and
plugs) on low-energy shorelines will range in cost from $6 to $18/m. The
plant-stem anchoring planting methods (plant roll and erosion control mat)
used in moderate-wave energy areas can be installed for $24 to $63/m. The use
of wave protection devices (tire or sandbag breakwaters) in high-energy areas
further increases costs to a range of $120 to $259/m. However, traditional
erosion control structures usually require a substantially higher investment.
For example, the cost of a 10-m-wide rock (riprap) revetment is about $340/m
of shoreline protected, and bulkheads may exceed $1,000/m (Eckert, Giles, and
Smith 1978).
29
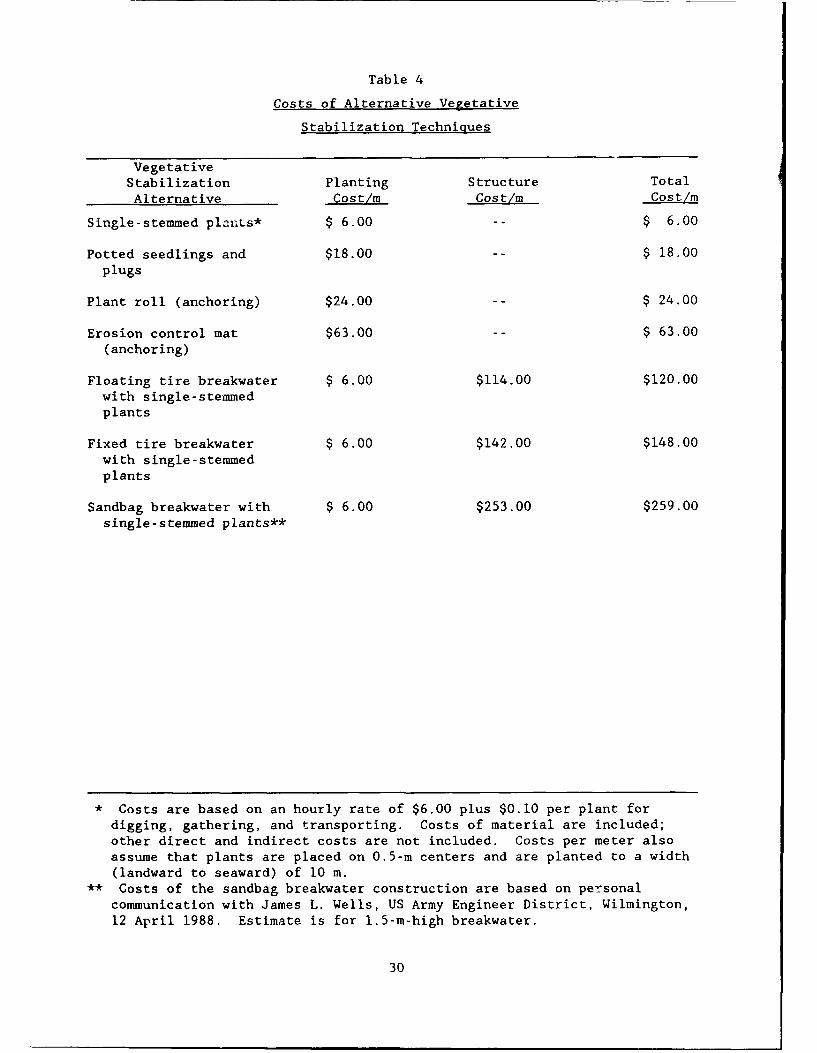
Table 4
Costs of Alternative Vegetative
Stabilization Techniques
VegetativeStabilization Planting Structure Total
Alternative Cost/m Cost/m Cost/
Single-stemmed plars* $ 6.00 -- $ 6.00
Potted seedlings and $18.00 -- $ 18.00plugs
Plant roll (anchoring) $24.00 -- $ 24.00
Erosion control mat $63.00 -- $ 63.00(anchoring)
Floating tire breakwater $ 6.00 $114.00 $120.00with single-stemmedplants
Fixed tire breakwater $ 6.00 $142.00 $148.00with single-stemmedplants
Sandbag breakwater with $ 6.00 $253.00 $259.00single-stemmed plants**
* Costs are based on an hourly rate of $6.00 plus $0.10 per plant fordigging, gathering, and transporting. Costs of material are included;other direct and indirect costs are not included. Costs per meter alsoassume that plants are placed on 0.5-m centers and are planted to a width(landward to seaward) of 10 m.
** Costs of the sandbag breakwater construction are based on personalcommunication with James L. Wells, US Army Engineer District, Wilmington,12 April 1988. Estimate is for 1.5-m-high breakwater.
30
PART IX: CONCLUSIONS
82. These guidelines permit the evaluation of vegetative stabilization
alternatives for both existing and anticipated dredged material disposal
areas. The guidelines provide a methodology for classifying dredged material
shorelines with respect to wave energy (low-, moderate-, or high-energy sites)
and specify a vegetative stabilization strategy (Standard Planting Tech-
niques, root-anchored techniques, or wave protection structures) for each
energy regime. Evaluating the potential use of these strategies will require
the consideration of both economic and environmental factors.
83. The economic benefit of any dredged material stabilization effort
is usually the reduction of operation and maintenance costs. These costs are
associated primarily with the redredging of material due to erosion and
channel infilling and the maintenance of containment structures. When the
potential benefits of shore protection measures exceed their costs, their use
is fully justified. Because vegetative stabilization is the least costly of
all erosion control alternatives (Figure 26), its use will often be justified
when more costly structural measures are not.
84. The process of vegetative stabilization involves the construction
of a new wetland. Because of a general acceptance of the intrinsic value of
wetlands as a National environmental resource, wetland construction can be
justified upon grounds other than the traditional cost-benefit analysis.
Engineer Regulation 1165-2-27, 30 July 1982, outlines the water resource
policies and authorities for the establishment of wetland areas in connection
with dredging. The following is an excerpt from the regulation:
Establishment of any wetland area in connection with the dredgingrequired for an authorized water resources development project maybe undertaken in any case where the Chief of Engineers in hisjudgment finds that:
(I) environmental, economic and social benefits of the wetlandarea justify the increased cost thereof above the costrequired for alternative methods of disposing of dredgedmaterial for such project; and
(2) the increased cost of such wetland area will not exceed$400,000 and
(3) there is reasonable evidence that the wetland area to beestablished will not be substantially altered or destroyedby natural or man-made causes.
85. This regulation will not be widely used for vegetative stabiliza-
tion projects because these projects will typically (a) be economically
31
justified on their own, (b) entail relatively small wetland acreages, and
(c) have a limited design life of perhaps 10 to 20 years. The regulation will
be more generally applicable to wetland construction in sheltered areas or
those protected by containment dikes. However, the regulation underscores the
fact that constructed wetlands have environmental values in addition to the
engineering values that are emphasized in these guidelines.
32
REFERENCES
Allen, H. H, Clairain, E. J., Jr., Diaz, R. J., Ford, A. W., Hunt, L. J., and
Wells, B. R. 1978. "Habitat Development Field Investigations, Bolivar
Peninsula Marsh and Upland Habitat Development Site, Galveston Bay, Texas:
Summary Report," Technical Report D-78-15, US Army Engineer Waterways Experi-
ment Station, Vicksburg, MS.
Allen, H. H., and Webb, J. W. 1983. "Erosion Control with Salt-marsh
Vegetation," Proceedings of the Third Symposium on Coastal and Ocean Manage-
ment, American Society of Civil Engineers, San Diego, CA, pp 735-748.
Allen, H. H., Webb, J. W., and Shirley, S. 0. 1984. "Wetlands Development in
Moderate Wave-Energy Climates," Proceedings: Conference Dredging '84.
Waterway, Port, Coastal and Ocean Division, American Society of Civil Engi-
neers, Clearwater Beach, FL, pp 943-955.
Allen, H. H., Shirley, S. 0. and Webb, J. W. 1986. "Vegetative Stabilization
of Dredged Material in Moderate to High Wave-Energy Environments and Created
Wetlands," Proceedings: 13th Annual Conference on Wetlands Restoration and
Creation, Hillsborough Community College, Tampa, FL.
Barko, J. W., and Smart, R. M. 1977. "Establishment and Growth of Selected
Freshwater and Coastal Marsh Plants in Relation to Characteristics of Dredged
Sediments," Technical Report D-77-2, US Army Engineer Waterways Experiment
Station, Vicksburg, MS.
Black, C. A. 1968. Soil-Plant Relationships, 2d ed., John Wiley and Sons,
New York.
Cammen, L. M. 1976. "Microinvertebrate Colonization of Spartina MarshArtificially Established on Dredge Spoil," Estuarine and Coastal Marine
Science, Vol 4, No. 4, pp 357-372.
Cammen, L. M., Seneca, E. D., and Copeland, B. J. 1976. "Animal Coloniza-tion of Salt Marshes Artificially Established on Dredge Spoil," Technical
Paper 76-7, US Army Engineer Coastal Engineer Research Center, Fort Belvoir,VA.
Coastal Engineering Research Center. 1984. "Shore Protection Manual, Vols I
and II, 4th Edition," US Army Engineer Waterways Experiment Station,
Vicksburg, MS.
Eckert, J. W., Giles, M. L., and Smith, G. M. 1978. "Design Concepts forIn-Wave Containment Structures for Marsh Habitat Development," Technical
Report D-78-31, US Army Engineer Waterways Experiment Station, Vicksburg, MS.
Environmental Laboratory. 1978. "Wetland Habitat Development with Dredged
Material: Engineering and Plant Propagation," Technical Report DS-78-16,
US Army Engineer Waterways Experiment Station, Vicksburg, MS.
Epstein, E. 1972. Mineral Nutrition of Plants, John Wiley and Sons, New
York.
Gauch, H. G. 1972. Inorganic Plant Nutrition, Dowden-Hutchinson and Ross,Stroudsberg, PA.
Gifford, C. A., Fisher, J. A., and Walton, T. L., Jr. 1977. "Floating Tire
Breakwaters," SUSF-SF-77-002, Florida Sea Grant Program, University of
Florida, Gainesville, FL.
33
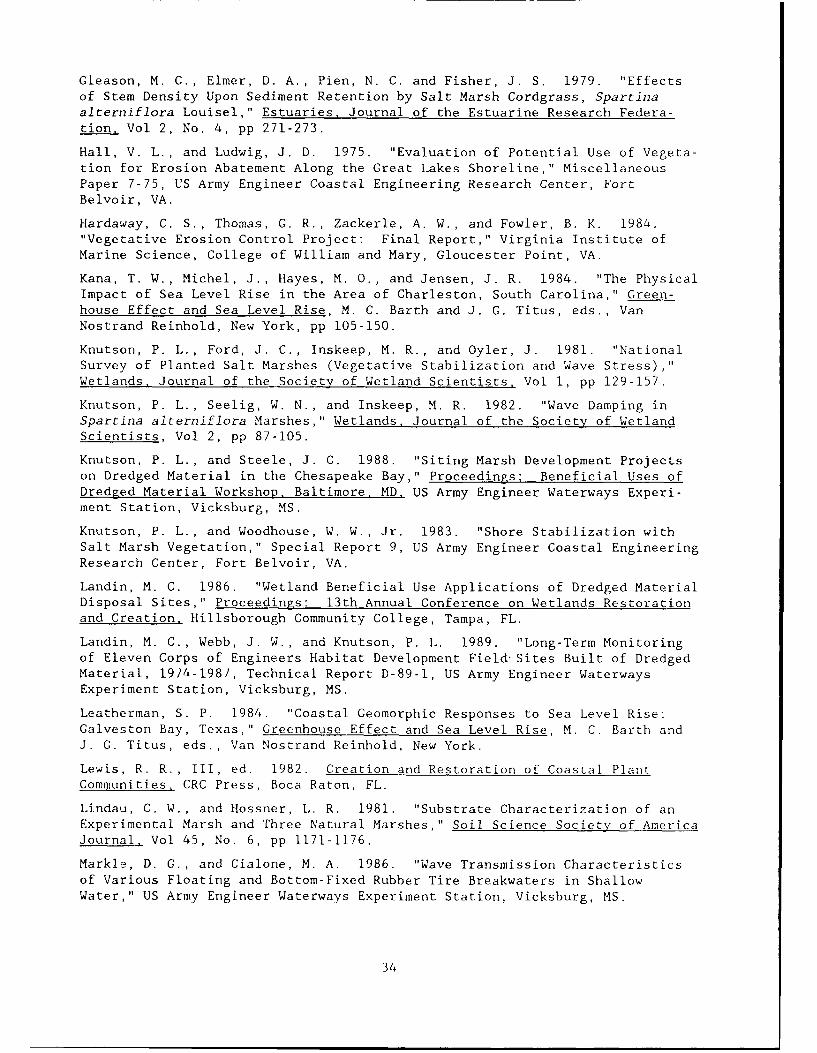
Gleason, M. C., Elmer, D. A., Pien, N. C. and Fisher, J. S. 1979. "Effectsof Stem Density Upon Sediment Retention by Salt Marsh Cordgrass, Spartina
alterniflora Louisel," Estuaries, Journal of the Estuarine Research Federa-tion Vol 2, No. 4, pp 271-273.
Hall, V. L., and Ludwig, J. D. 1975. "Evaluation of Potential Use of Vegeta-tion for Erosion Abatement Along the Great Lakes Shoreline," MiscellaneousPaper 7-75, US Army Engineer Coastal Engineering Research Center, Fort
Belvoir, VA.
Hardaway, C. S., Thomas, C. R., Zackerle, A. W., and Fowler, B. K. 1984."Vegetative Erosion Control Project: Final Report," Virginia Institute ofMarine Science, College of William and Mary, Gloucester Point, VA.
Kana, T. W., Michel, J., Hayes, M. 0., and Jensen, J. R. 1984. "The PhysicalImpact of Sea Level Rise in the Area of Charleston, South Carolina," Green-house Effect and Sea Level Rise, M. C. Barth and J. G. Titus, eds., VanNostrand Reinhold, New York, pp 105-150.
Knutson, P. L., Ford, J. C., Inskeep, M. R., and Oyler, J. 1981. "NationalSurvey of Planted Salt Marshes (Vegetative Stabilization and Wave Stress),"Wetlands, Journal of the Society of Wetland Scientists, Vol 1, pp 129-157.
Knutson, P. L., Seelig, W. N., and Inskeep, M. R. 1982. "Wave Damping inSpartina alterniflora Marshes," Wetlands, Journal of the Society of WetlandScientists, Vol 2, pp 87-105.
Knutson, P. L., and Steele, J. C. 1988. "Siting Marsh Development Projectson Dredged Material in the Chesapeake Bay," Proceedings: Beneficial Uses ofDredged Material Workshop, Baltimore, MD, US Army Engineer Waterways Experi-
ment Station, Vicksburg, MS.
Knutson, P. L., and Woodhouse, W. W., Jr. 1983. "Shore Stabilization withSalt Marsh Vegetation," Special Report 9, US Army Engineer Coastal EngineeringResearch Center, Fort Belvoir, VA.
Landin, M. C. 1986. "Wetland Beneficial Use Applications of Dredged Material
Disposal Sites," Proceedings: 13th Annual Conference on Wetlands Restorationand Creation, Hillsborough Community College, Tampa, FL.
Landin, M. C., Webb, J. W., and Knutson, P. L. 1989. "Long-Term Monitoringof Eleven Corps of Engineers Habitat Development Field-Sites Built of Dredged
Material, 1974-1987, Technical Report D-89-1, US Army Engineer WaterwaysExperiment Station, Vicksburg, MS.
Leatherman, S. P. 1984. "Coastal Geomorphic Responses to Sea Level Rise:Galveston Bay, Texas," Greenhouse Effect and Sea Level Rise, M. C. Barth andJ. G. Titus, eds., Van Nostrand Reinhold, New York.
Lewis, R. R., 111, ed. 1982. Creation and Restoration of Coastal PlantCommunities, CRC Press, Boca Raton, FL.
Lindau, C. W., and Hossner, L. R. 1981. "Substrate Characterization of anExperimental Marsh and Three Natural Marshes," Soil Science Society of AmericaJournal, Vol 45, No. 6, pp 1171-1176.
Markle, D. G., and Cialone, M. A. 1986. "Wave Transmission Characteristics
of Various Floating and Bottom-Fixed Rubber Tire Breakwaters in ShallowWater," US Army Engineer Waterways Experiment Station, Vicksburg, MS.
34
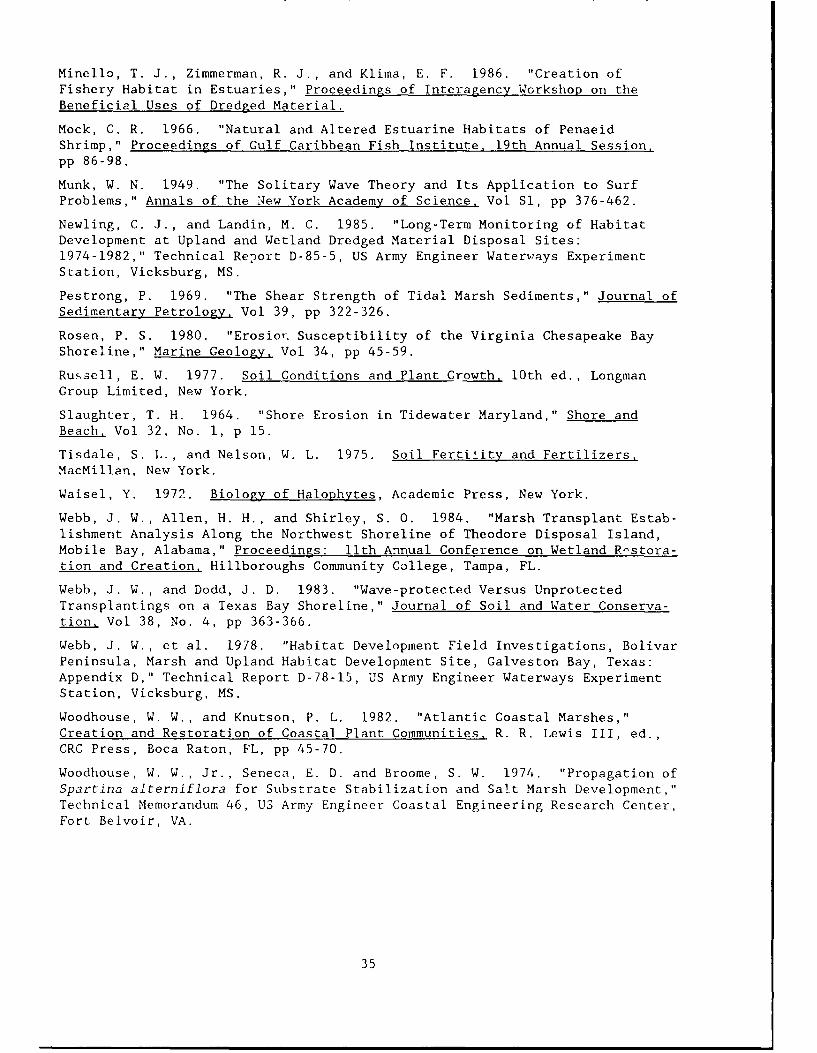
Minello, T. J., Zimmerman, R. J., and Klima, E. F. 1986. "Creation ofFishery Habitat in Estuaries," Proceedings of Interagency Workshop on the
Beneficial Uses of Dredged Material.
Mock, C. R. 1966. "Natural and Altered Estuarine Habitats of PenaeidShrimp," Proceedings of Gulf Caribbean Fish Institute, 19th Annual Session,pp 86-98.
Munk, W. N. 1949. "The Solitary Wave Theory and Its Application to Surf
Problems," Annals of the New York Academy of Science, Vol Sl, pp 376-462.
Newling, C. J., and Landin, M. C. 1985. "Long-Term Monitoring of Habitat
Development at Upland and Wetland Dredged Material Disposal Sites:1974-1982," Technical Report D-85-5, US Army Engineer Waterways ExperimentStation, Vicksburg, MS.
Pestrong, P. 1969. "The Shear Strength of Tidal Marsh Sediments," Journal ofSedimentary Petrology, Vol 39, pp 322-326.
Rosen, P. S. 1980. "Erosior. Susceptibility of the Virginia Chesapeake Bay
Shoreline," Marine Geology. Vol 34, pp 45-59.
Russell, E. W. 1977. Soil Conditions and Plant Growth 10th ed., LongmanGroup Limited, New York.
Slaughter, T. H. 1964. "Shore Erosion in Tidewater Maryland," Shore and
Beach Vol 32, No. 1, p 15.
Tisdale, S. L., and Nelson, W. L. 1975. Soil Fertility and Fertilizers,
MacMillan, New York.
Waisel, Y. 1972. Biology of Halophytes, Academic Press, New York.
Webb, J. W., Allen, H. H., and Shirley, S. 0. 1984. "Marsh Transplant Estab-
lishment Analysis Along the Northwest Shoreline of Theodore Disposal Island,Mobile Bay, Alabama," Proceedings: llth Annual Conference on Wetland R-stora-tion and Creation, Hillboroughs Community College, Tampa, FL.
Webb, J. W., and Dodd, J. D. 1983. "Wave-protected Versus Unprotected
Transplantings on a Texas Bay Shoreline," Journal of Soil and Water Conserva-tion Vol 38, No. 4, pp 363-366.
Webb, J. W., et al. 1978. "Habitat Development Field Investigations, Bolivar
Peninsula, Marsh and Upland Habitat Development Site, Galveston Bay, Texas:Appendix D," Technical Report D-78-15, US Army Engineer Waterways Experiment
Station, Vicksburg, MS.
Woodhouse, W. W., and Knutson, P. L. 1982. "Atlantic Coastal Marshes,"
Creation and Restoration of Coastal Plant Communities, R. R. Lewis III, ed.,CRC Press, Boca Raton, FL, pp 45-70.
Woodhouse, W. W., Jr., Seneca, E. D. and Broome, S. W. 1974. "Propagation ofSpartina alterniflora for Substrate Stabilization and Salt Marsh Development,"Technical Memorandum 46, US Army Engineer Coastal Engineering Research Center,
Fort Belvoir, VA.
35
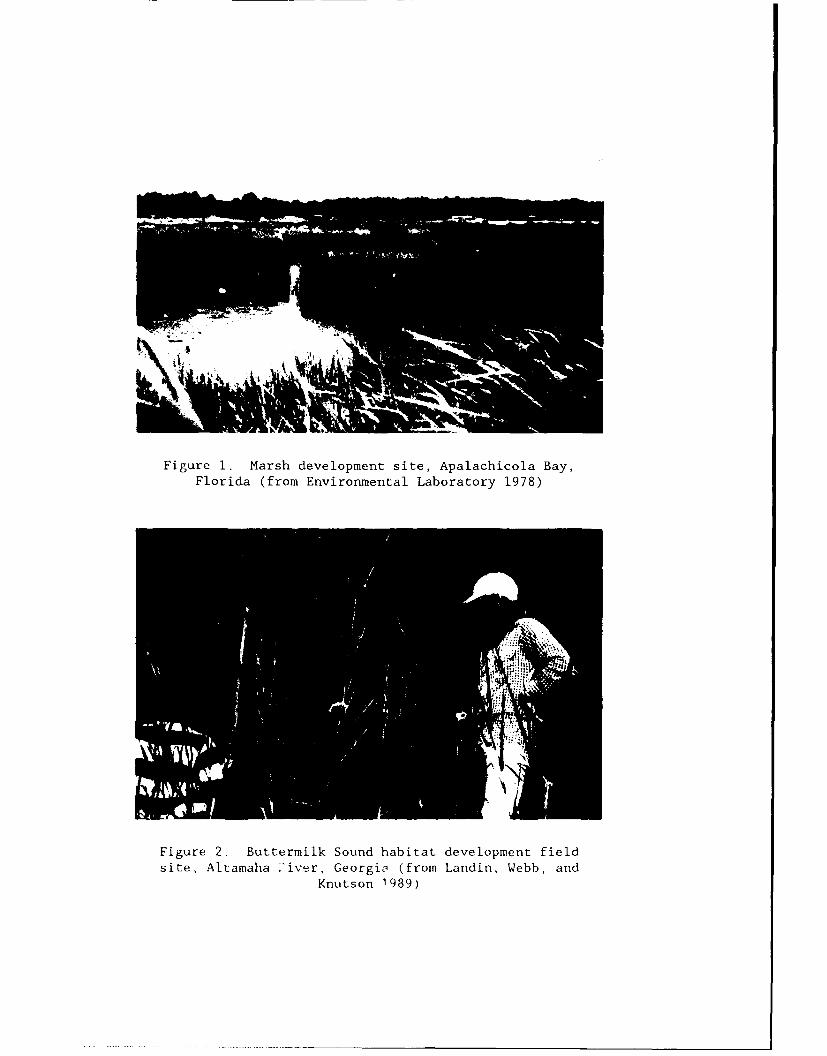
Figure 1. Marsh development site, Apalachicola Bay,Florida (from Environmental Laboratory 1978)
Figure 2. Buttermilk Sound habitat development fieldsite, Altamaha Piver, Georgia (from Landin, Webb, and
Knutson 1989)
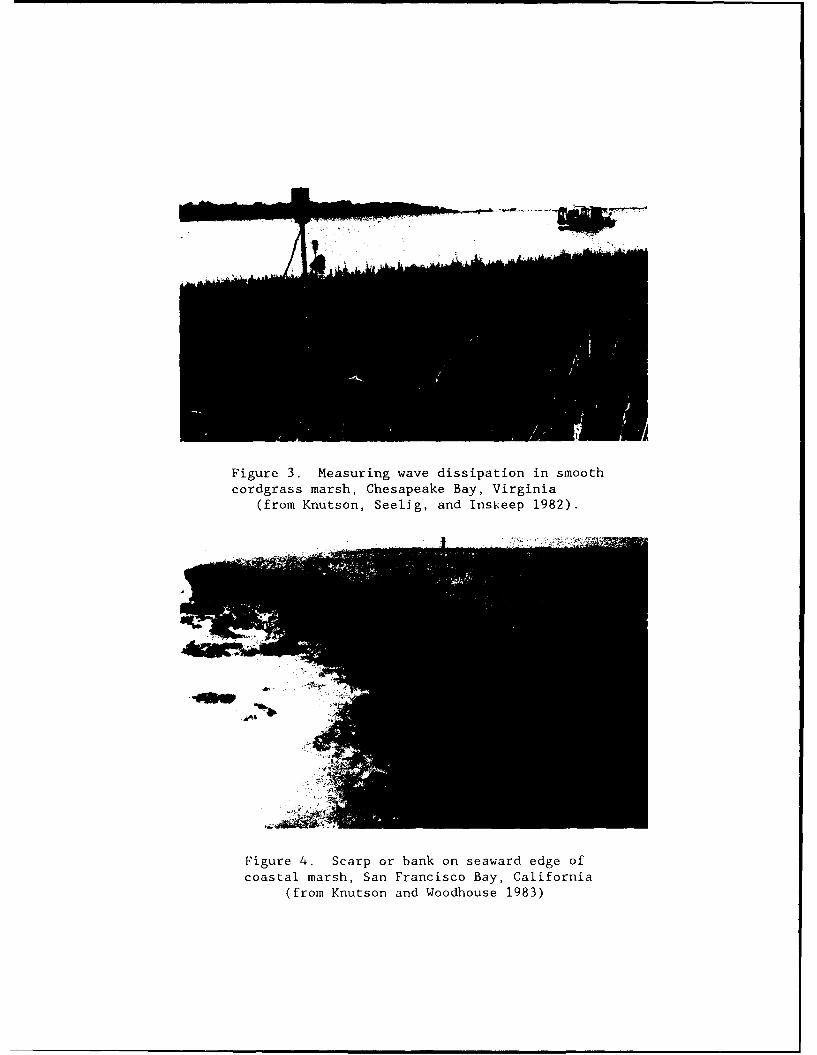
Figure 3. Measuring wave dissipation in smoothcordgrass marsh, Chesapeake Bay, Virginia
(from Knutson, Seelig, and Inskeep 1982).
.. paw
Figure 4. Scarp or bank on seaward edge ofcoastal marsh, San Francisco Bay, California
(from Knutson and Woodhouse 1983)
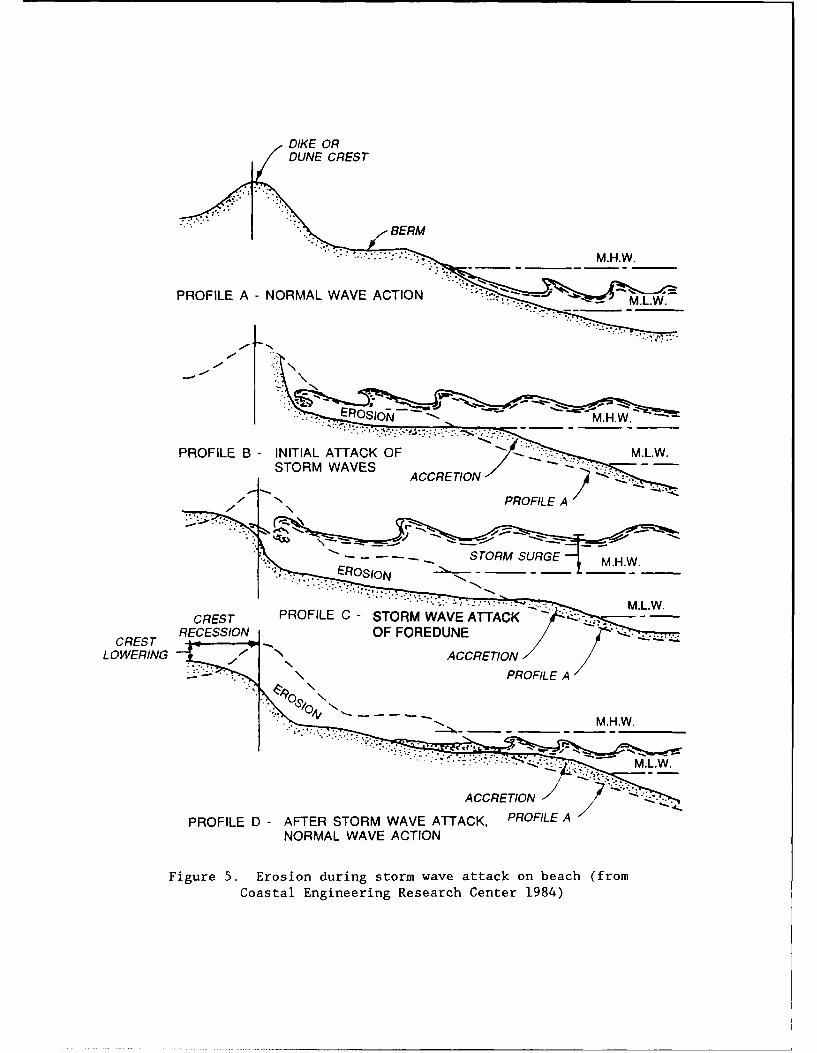
DIKE ORDUECREST
"": "- /BERM
PROFILE A - NORMAL WAVE ACTION
16ROIN ARI
PROFILE B -INITIAL ATTACK OF MLWSTORM WAVES
ACCRETION
PROFILE A
:..kSTOR SURGE- M..W.
RECROSION
CETPROFILE 0FE STORM WAVE ATTACK RFL
CREST REESOOFFRDN .. Zz
LOWERING W AVERACTI\\ .: PROFILE A
":'. " M.H.W.
PROFILE D -AFTER STORM WAVE ATTACK, PROFILE A"
NORMAL WAVE ACTION
Figure 5. Erosion during storm wave attack on beach (from
Coastal Engineering Research Center 1984)
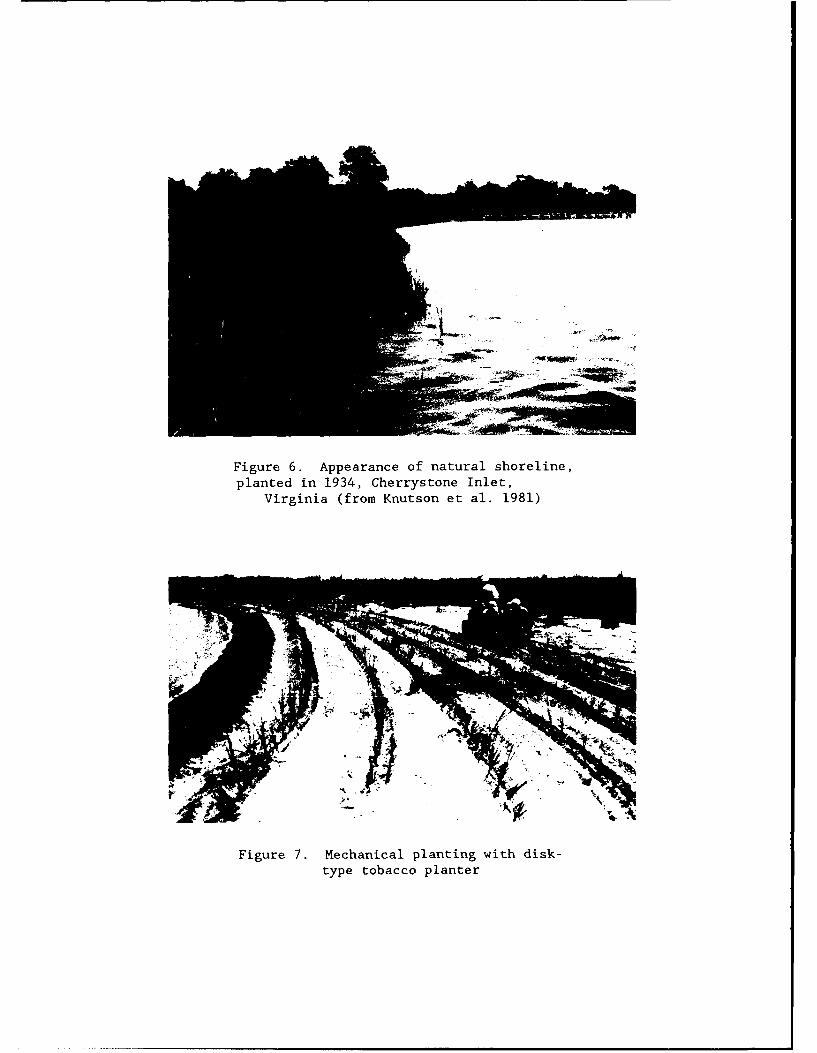
Figure 6. Appearance of natural shoreline,planted in 1934, Cherrystone Inlet,
Virginia (from Knutson et al. 1981)
Figure 7. Mechanical planting with disk-type tobacco planter
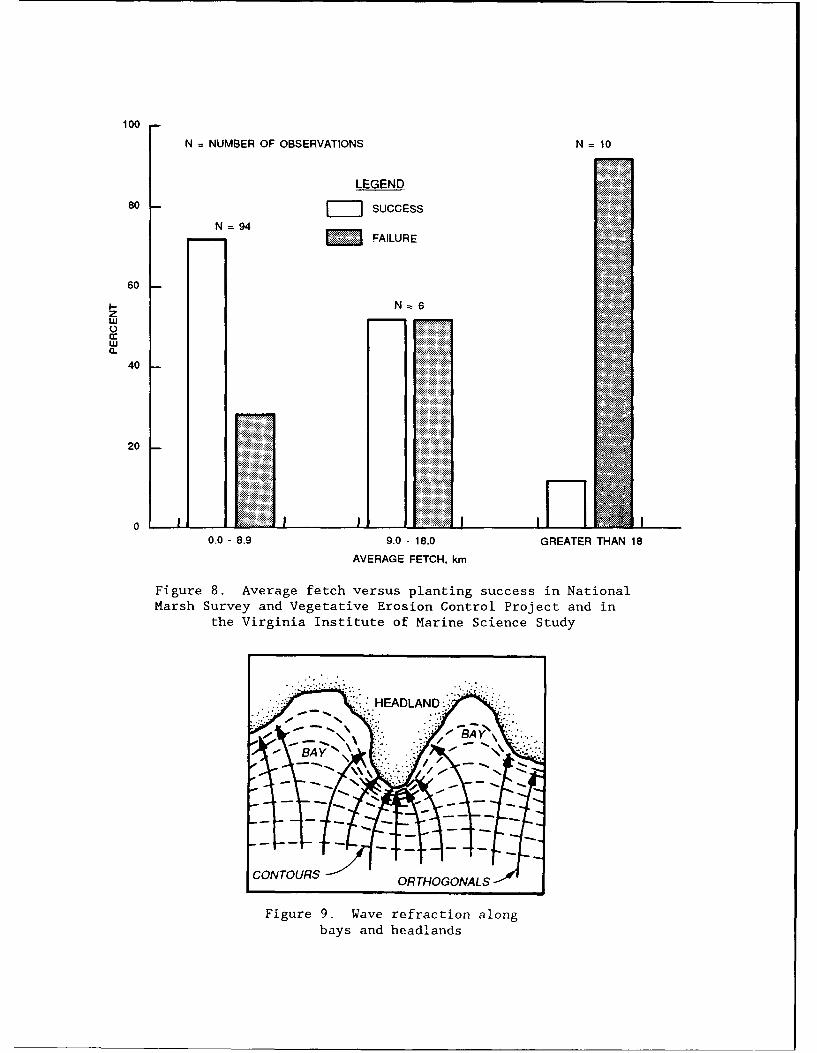
100 -
N = NUMBER OF OBSERVATIONS N = 10
LEGEND
8O - SUCCESSN=94N
FAILURE
60 -
N 6z
(L
0
40
20
0.0 8.9 9.0 18.0 GREATER THAN 18AVERAGE FETCH, km
Figure 8. Average fetch versus planting success in NationalMarsh Survey and Vegetative Erosion Control Project and in
the Virginia Institute of Marine Science Study
- HEADLAND:..
CONTOURS ORTHOGONALS
Figure 9. Wave refraction alongbays and headlands
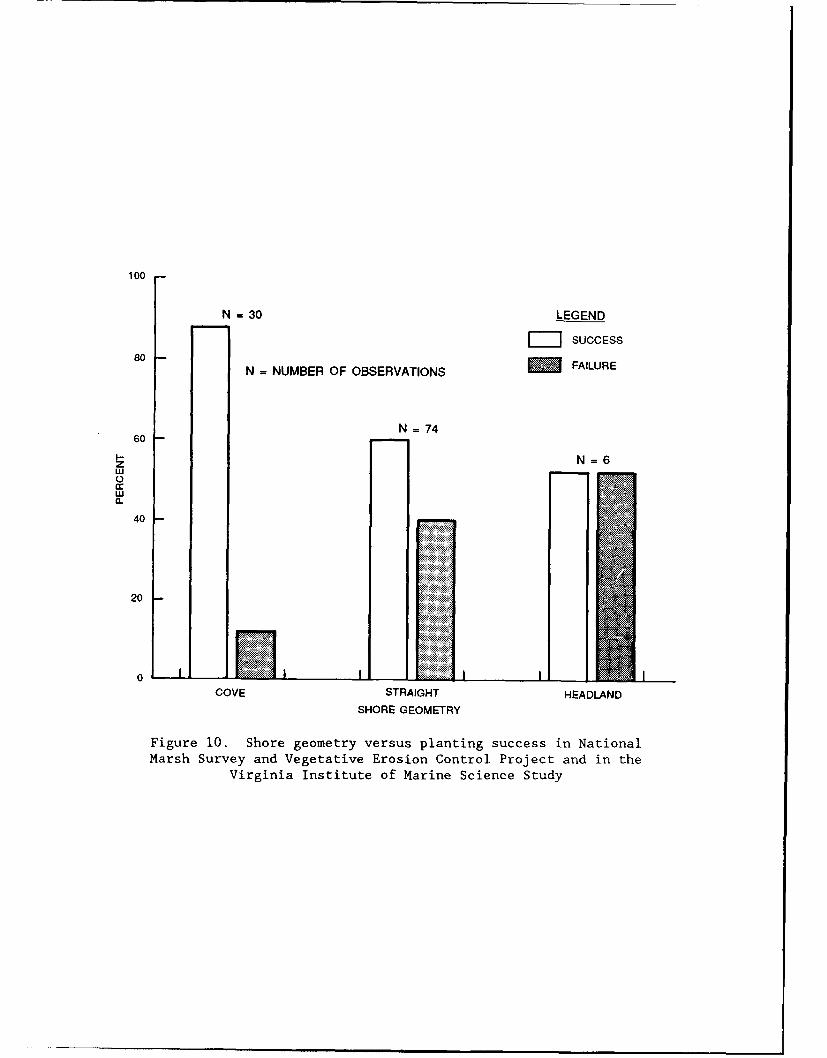
100
N - 30 LEGEND
= SUCCESS
so N = NUMBER OF OBSERVATIONS FAILURE
N = 7460
I- N=6zL)
ILla
40
20
COVE STRAIGHT HEADLAND
SHORE GEOMETRY
Figure 10. Shore geometry versus planting success in NationalMarsh Survey and Vegetative Erosion Control Project and in the
Virginia Institute of Marine Science Study
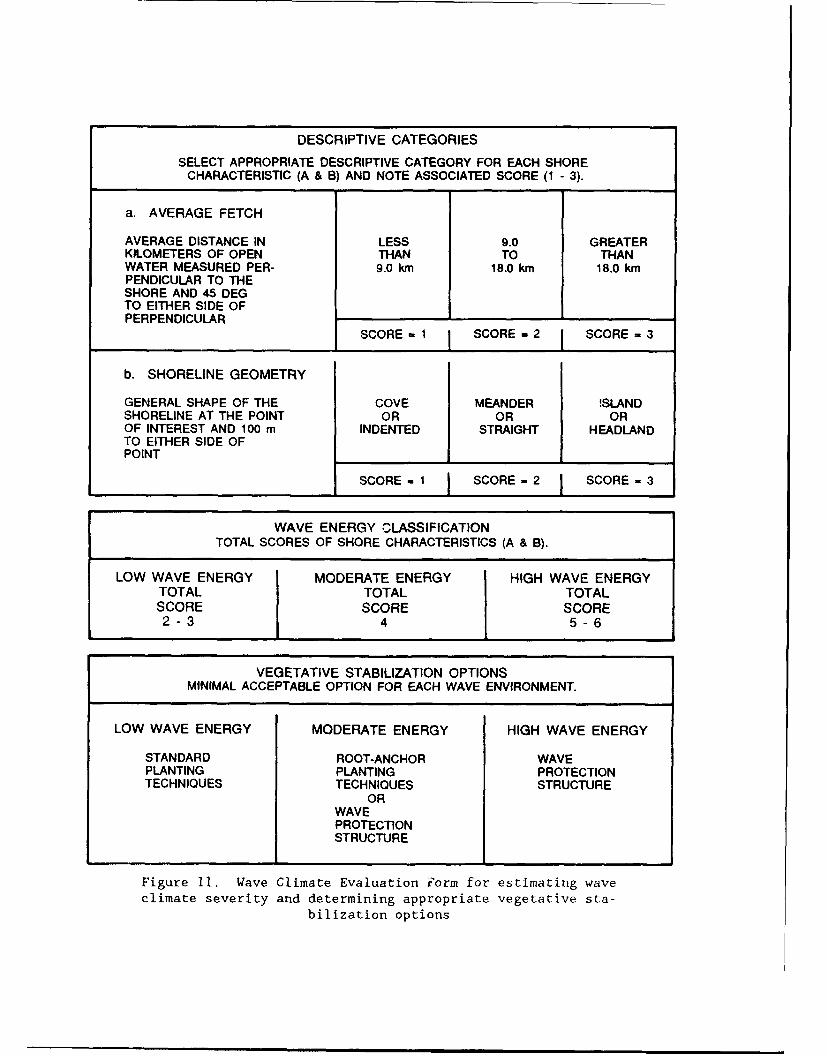
DESCRIPTIVE CATEGORIES
SELECT APPROPRIATE DESCRIPTIVE CATEGORY FOR EACH SHORECHARACTERISTIC (A & B) AND NOTE ASSOCIATED SCORE (1 - 3).
a. AVERAGE FETCH
AVERAGE DISTANCE IN LESS 9.0 GREATERKILOMETERS OF OPEN THAN TO THANWATER MEASURED PER- 9.0 km 18.0 km 18.0 kmPENDICULAR TO THESHORE AND 45 DEGTO EITHER SIDE OFPERPENDICULAR
SCORE 1 SCORE - 2 SCORE = 3
b. SHORELINE GEOMETRY
GENERAL SHAPE OF THE COVE MEANDER !SLANDSHORELINE AT THE POINT OR OR OROF INTEREST AND 100 m INDENTED STRAIGHT HEADLANDTO EITHER SIDE OFPOINT
SCORE - 1 SCORE = 2 SCORE = 3
WAVE ENERGY CLASSIFICATIONTOTAL SCORES OF SHORE CHARACTERISTICS (A & B).
LOW WAVE ENERGY MODERATE ENERGY HIGH WAVE ENERGYTOTAL TOTAL TOTALSCORE SCORE SCORE2-3 4 5-6
VEGETATIVE STABILIZATION OPTIONSMINIMAL ACCEPTABLE OPTION FOR EACH WAVE ENVIRONMENT.
LOW WAVE ENERGY MODERATE ENERGY HIGH WAVE ENERGY
STANDARD ROOT-ANCHOR WAVEPLANTING PLANTING PROTECTIONTECHNIQUES TECHNIQUES STRUCTURE
ORWAVEPROTECTIONSTRUCTURE
Figure 11. Wave Climate Evaluation Form for estimating waveclimate severity and determining appropriate vegetative sta-
bilization options
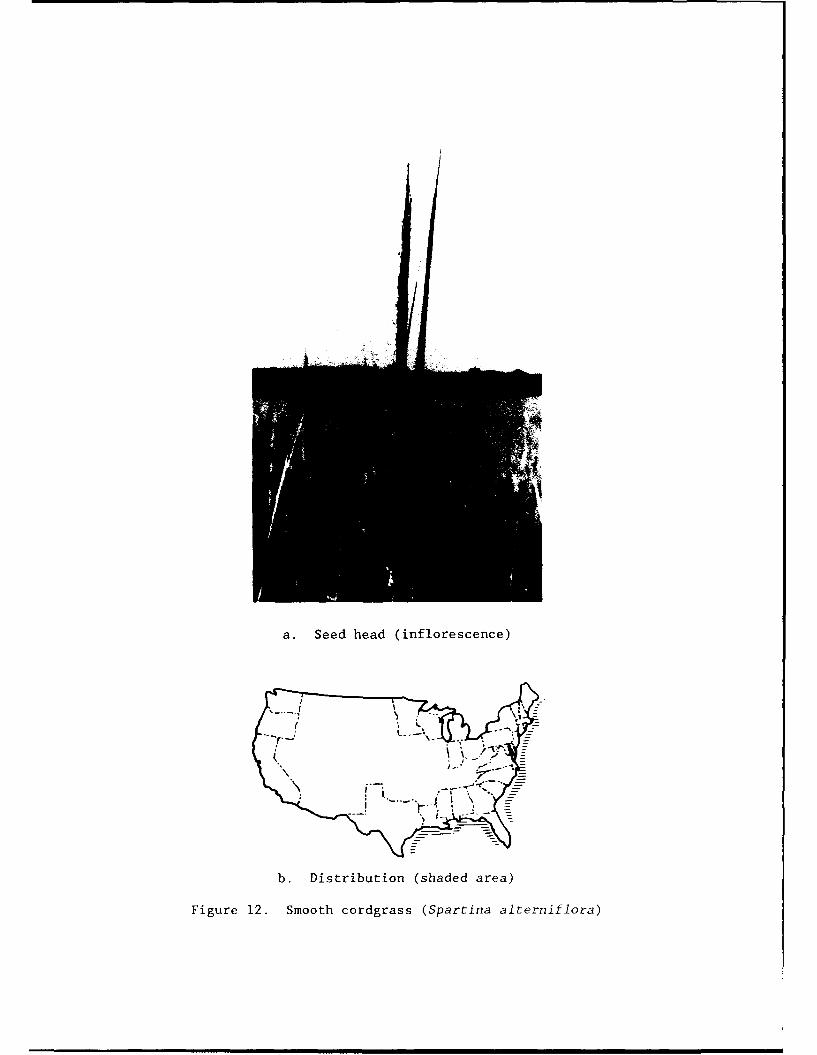
a. Seed head (inflorescence)
b. Distribution (shaded area)
Figure 12. Smooth cordgrass (Spartina alterniflora)
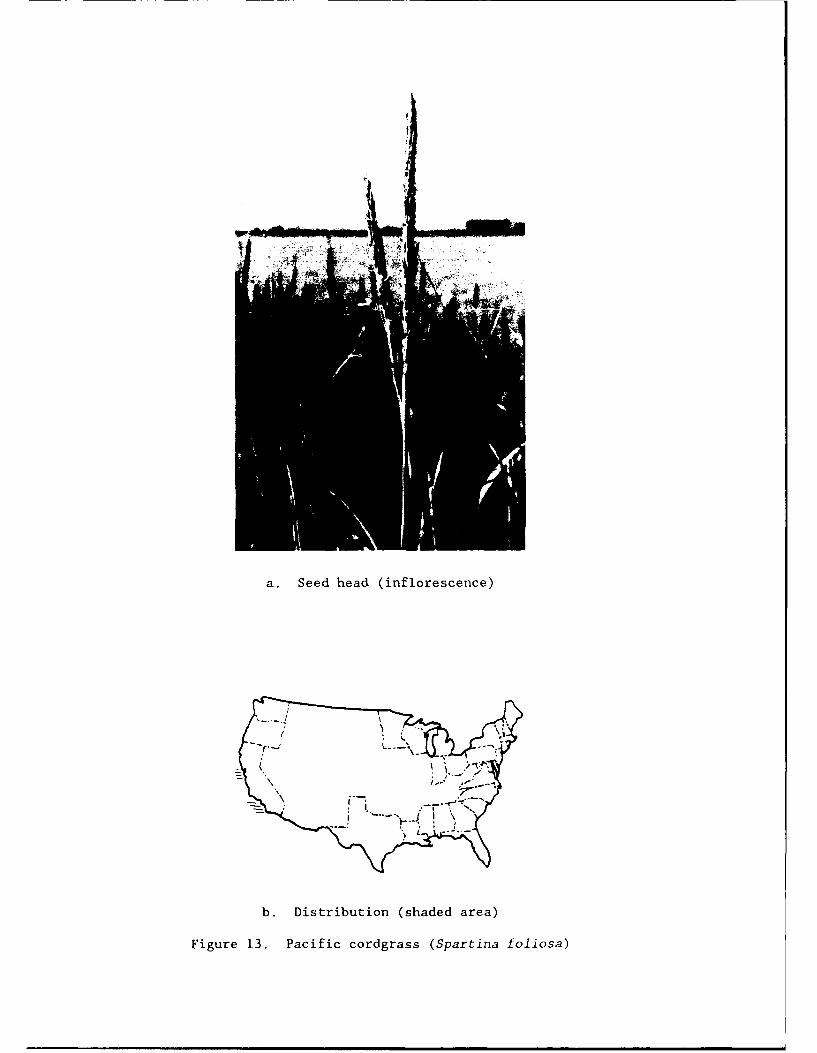
a. Seed head (inflorescence)
b. Distribution (shaded area)
Figure 13. Pacific cordgrass (Spartina foliosa)
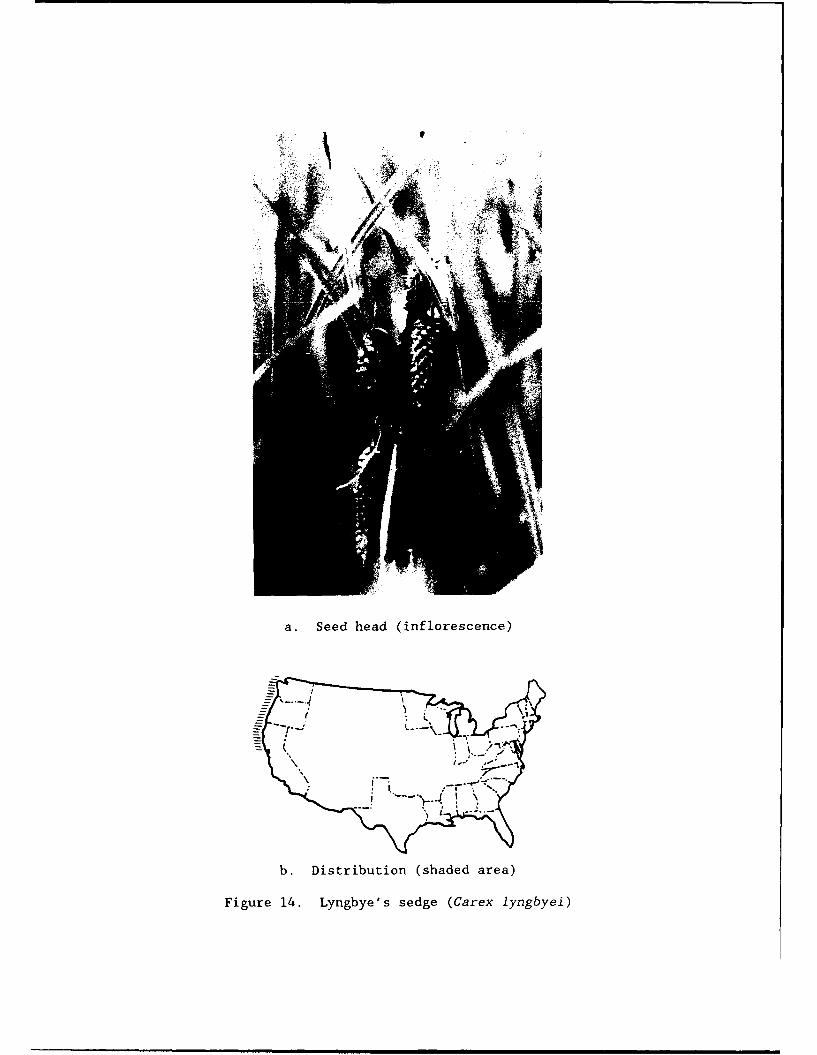
a. Seed head (inflorescence)
b. Distribution (shaded area)
Figure 14. Lyngbye's sedge (Garex lyngbyei)
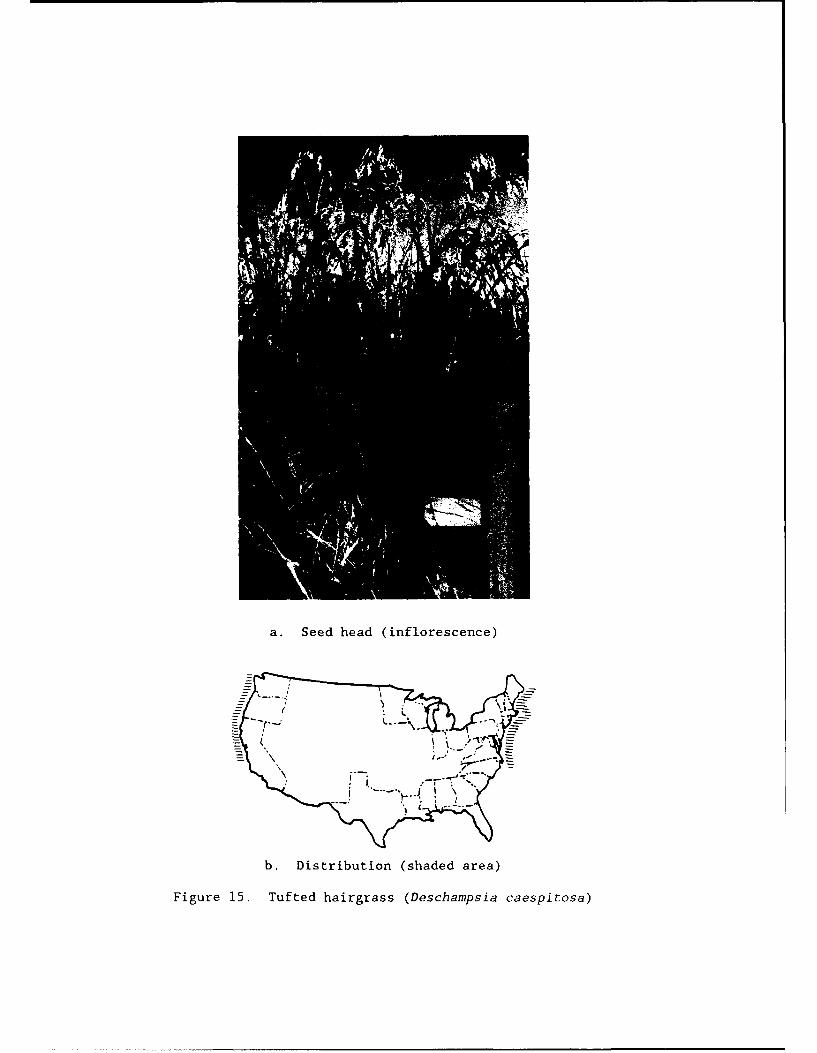
a. Seed head (inflorescence)
b. Distribution (shaded area)
Figure 15. Tufted hairgrass (Deschampsia caespitosa)
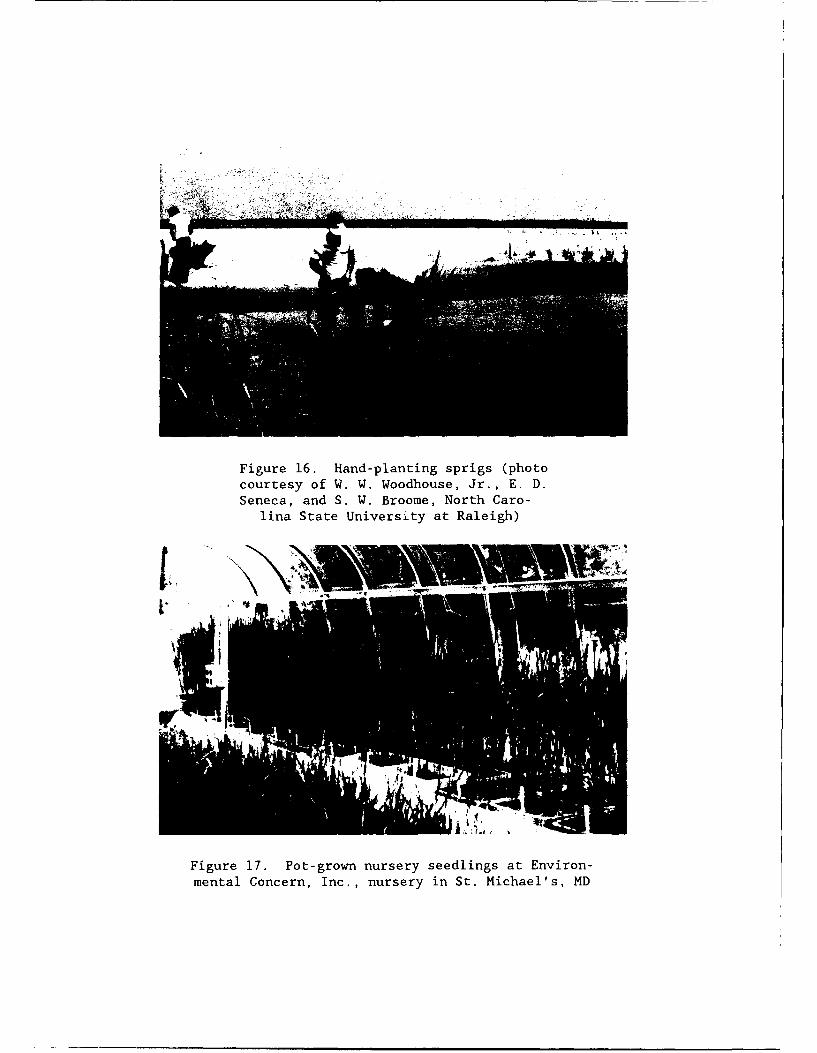
Figure 16. Hand-planting sprigs (photocourtesy of W. W. Woodhouse, Jr., E. D.Seneca, and S. W. Broome, North Caro-
lina State University at Raleigh)
Figure 17. Pot-grown nursery seedlings at Environ-mental Concern, Inc., nursery in St. Michael's, MD
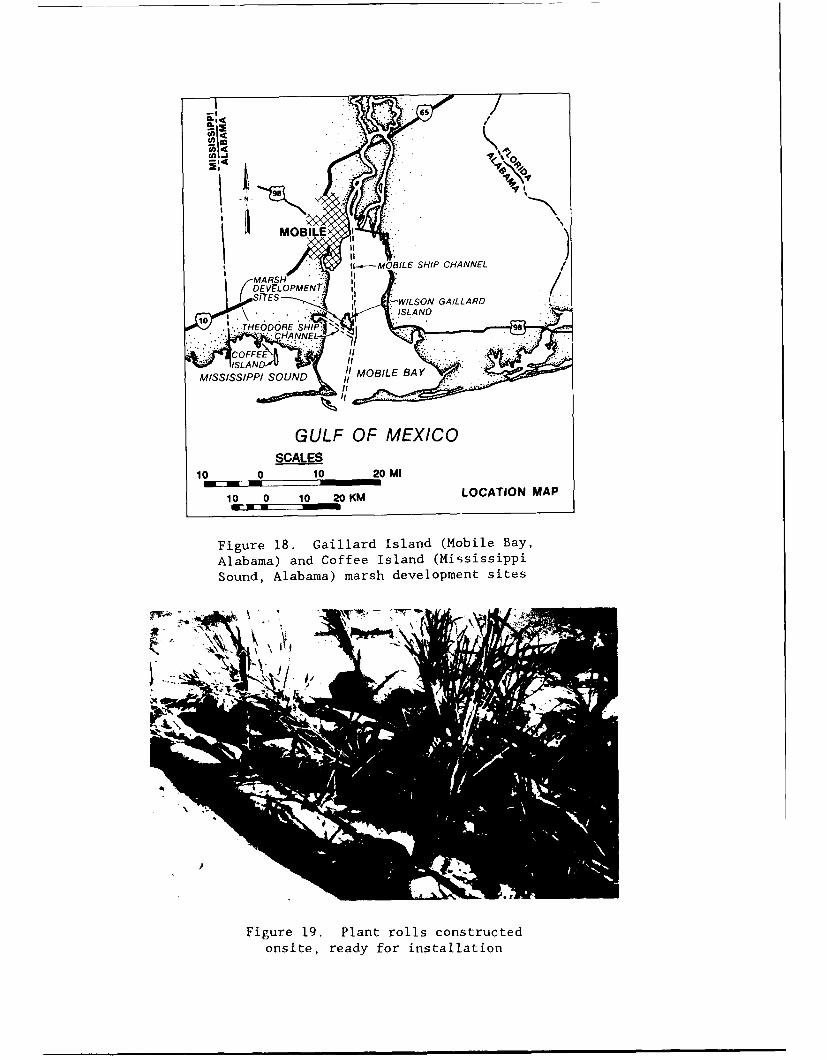
0,4 65
-'4
MOBILE
i.-MOBILE SHIP CHANNEL
GULFEOFPMEXICOSCALES i
10 ~I 0W10S2NKMILOATINA
Figure 18 GailardISLAND (oieByAlabama) an ofe san McssiSoudAaaa)mrh eelpet ie
FigEE 1. Patrll osrceOF ste EedEo nsalto
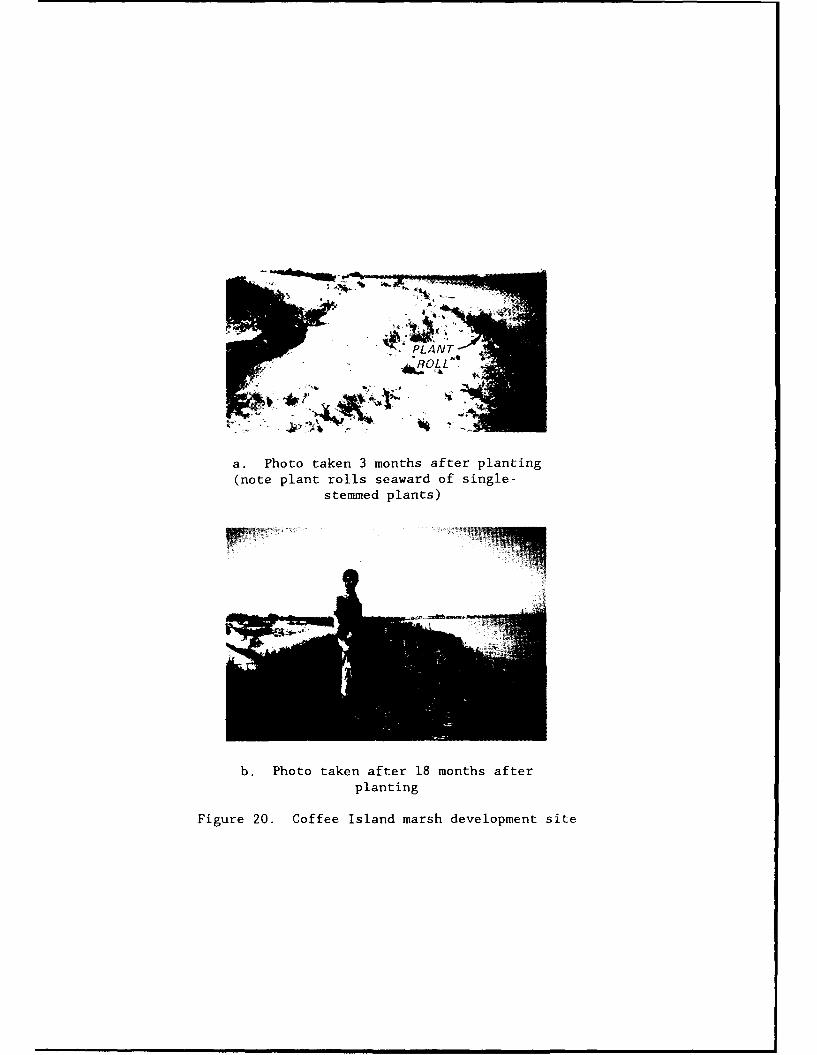
-',PLANTROLL" -4 4
a. Photo taken 3 months after planting
(note plant rolls seaward of single-stemmed plants)
b. Photo taken after 18 months afterplanting
Figure 20. Coffee Island marsh development site
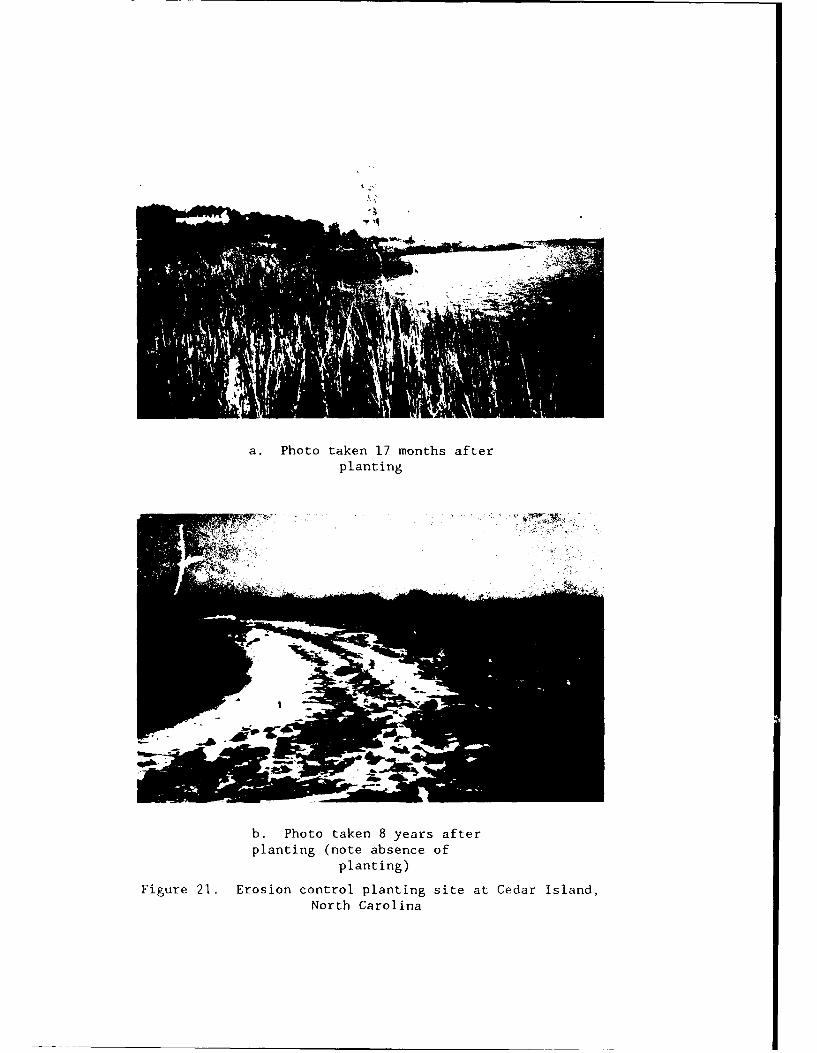
a. Photo taken 17 months afterplanting
b. Photo taken 8 years afterplanting (note absence of
planting)
Figure 21. Erosion control planting site at Cedar Island,North Carolina
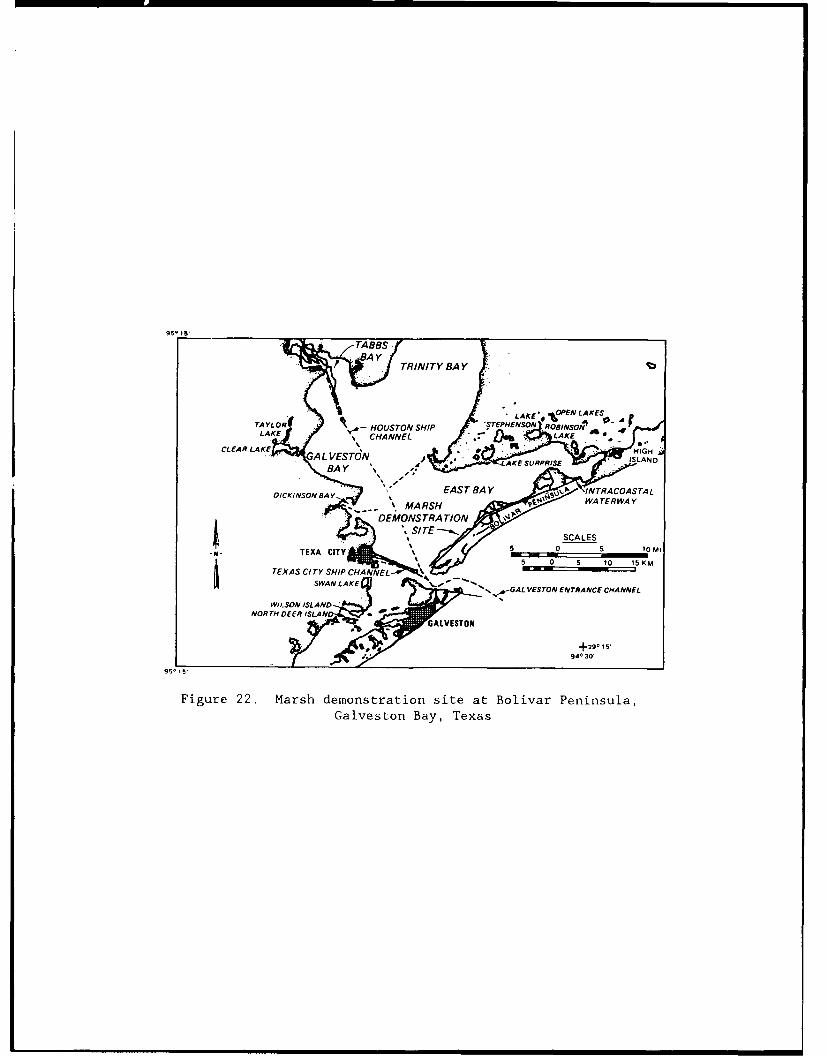
- BAY TRINIY BAY
TAY ORILA KE l* EN LA KES q
LAKE 'v"~~~~o- HOUSTON SHIP SEHNO OISN-
CLEA LAK CHANNEL *r ~ LAE
BAYA LAKE AK SIPRS
DIKNO 8 V EAST BA Y % INTRACOASTALDIKNO BASHWYTRW
* DEMONS TRA TION
TEXAS CITY SHIP CHA NNELSWAN LAKE-
**A-A VESTON ENTRANCE CHANNEL
WIL.SON ISLANDNORTH DEER ISLAN
+290 15-940 30'
9.15
Figure 22. Marsh demonstration site at Bolivar Peninsula,Galveston Bay, Texas
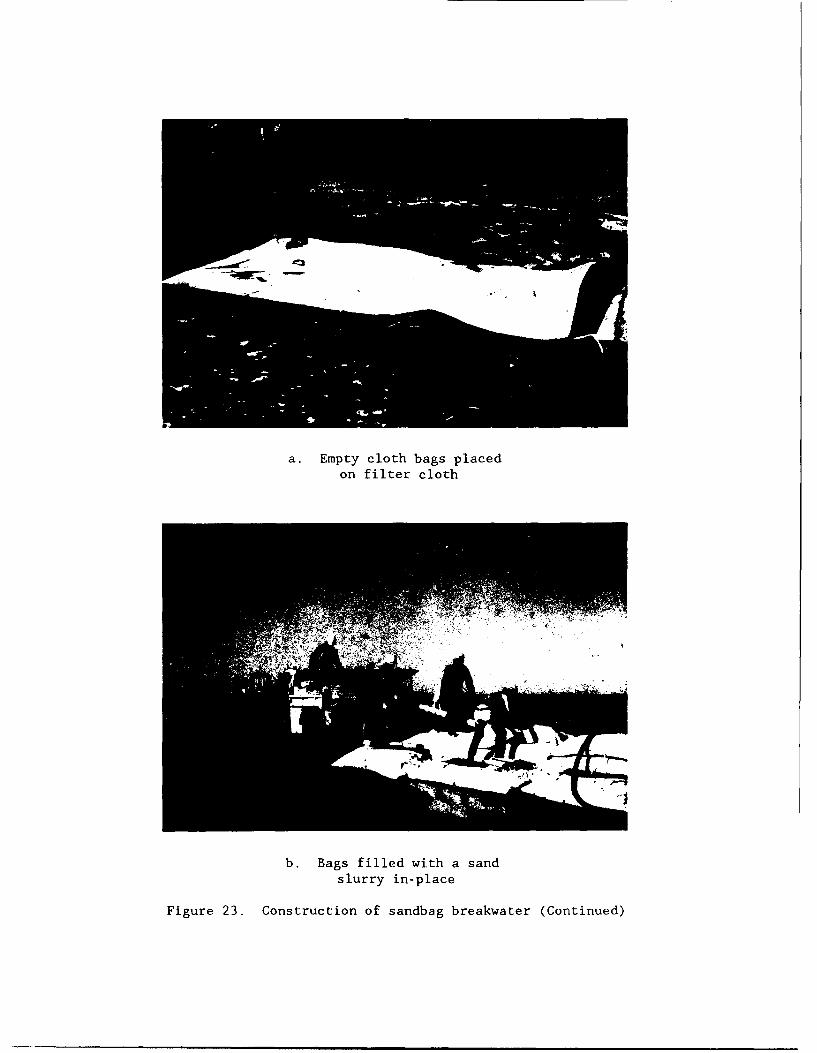
a. Empty cloth bags placedon filter cloth
b. Bags filled with a sandslurry in-place
Figure 23. Construction of sandbag breakwater (Continued)
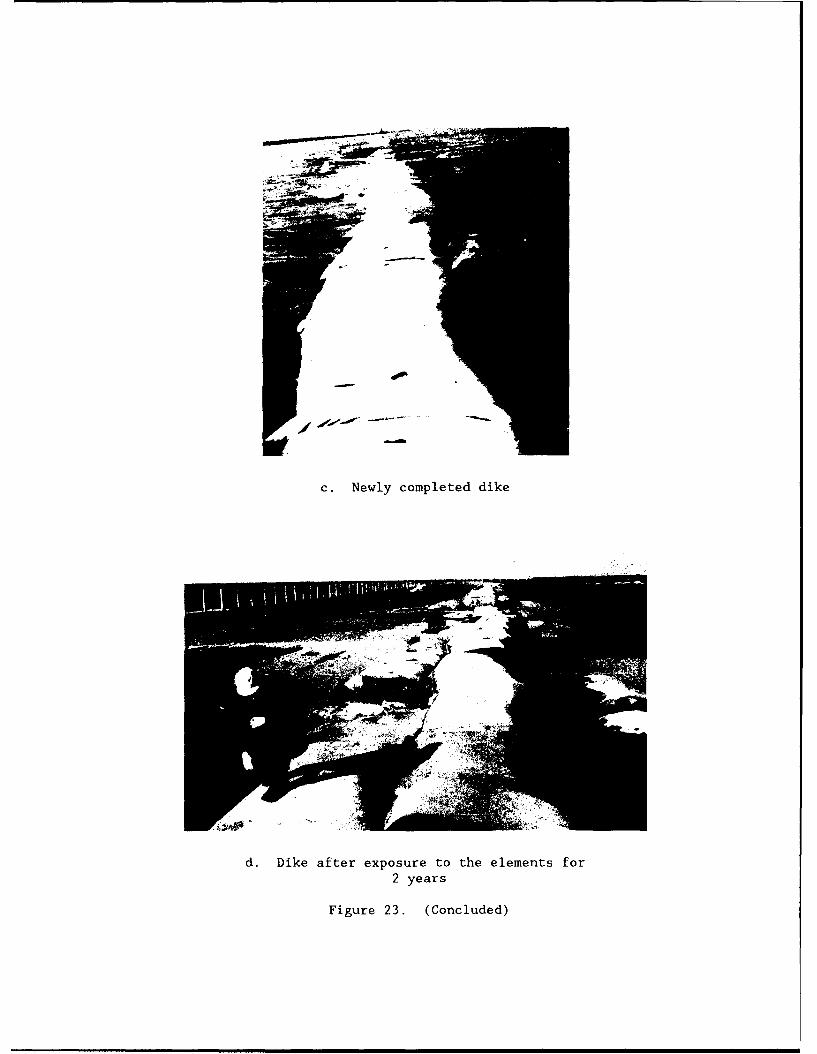
c. Newly completed dike
d. Dike after exposure to the elements for2 years
Figure 23. (Concluded)
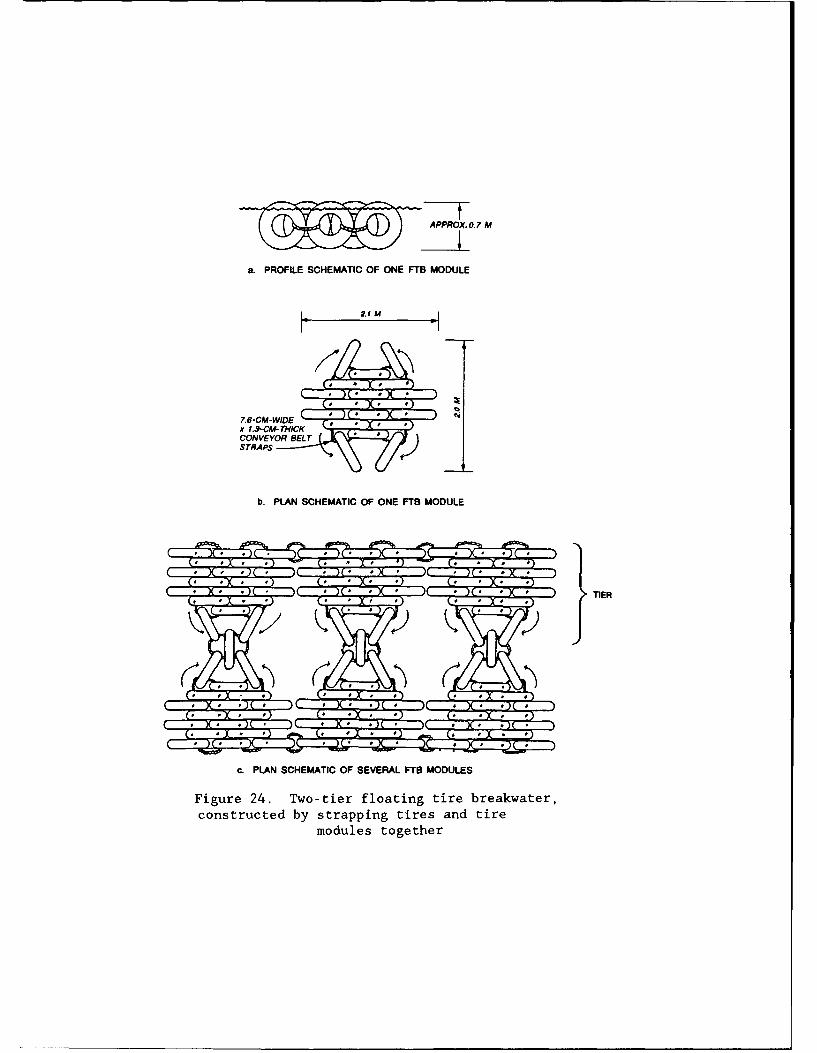
~ APPROX.0. 7 M
a. PROFILE SCHEMATIC OF ONE FTB MODULE
2.? M
'>
7. 6-CM-WIDEx .3-CM- THICKCONVEYOR BELTSTRAPSW
b. PLAN SCHEMATIC OF ONE FTB MODULE
* )C X *
c. PLAN SCHEMATIC OF SEVERAL FTB MODULES
Figure 24. Two-tier floating tire breakwater,constructed by strapping tires and tire
modules together
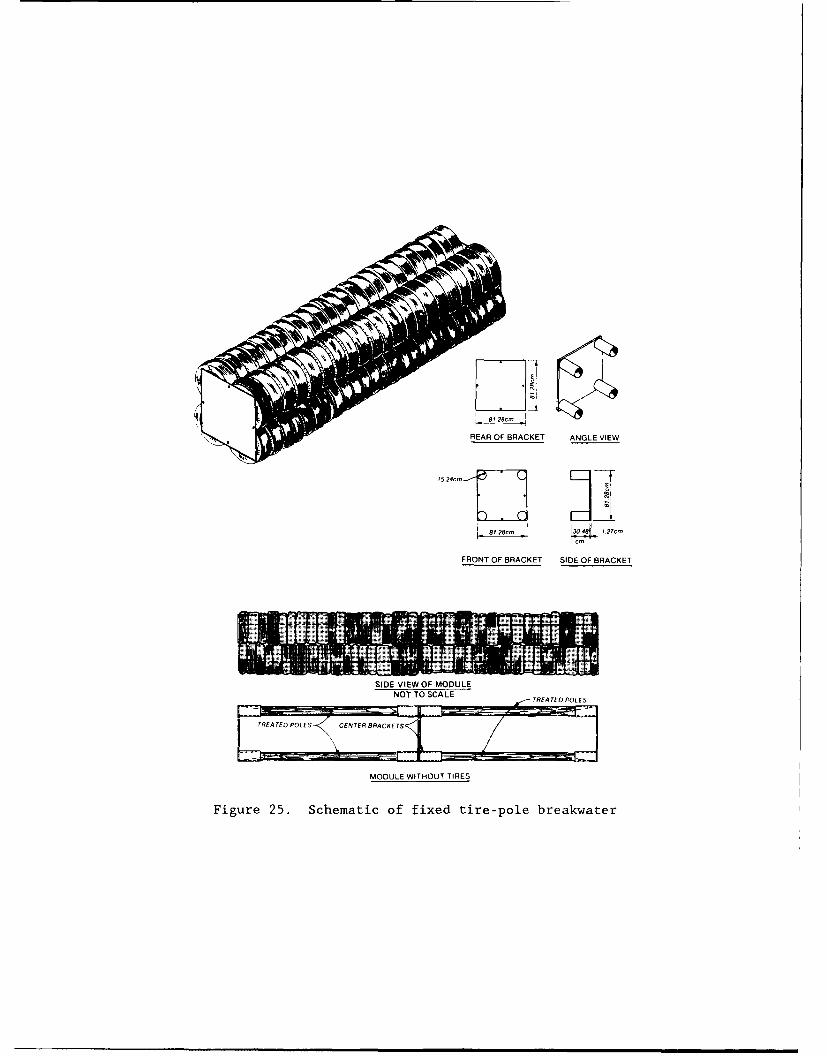
REAR OF BRACKET ANGLE VIEW
15 24
FRONT OF BRACKET SIDE OF BRACKET
SDE VIEW OF MODULENOT TO SCALE TE E OE
REA TED POLES CENTR BRA CKE S j
MODULE WITHOUT TIRES
Figure 25. Schematic of fixed tire-pole breakwater
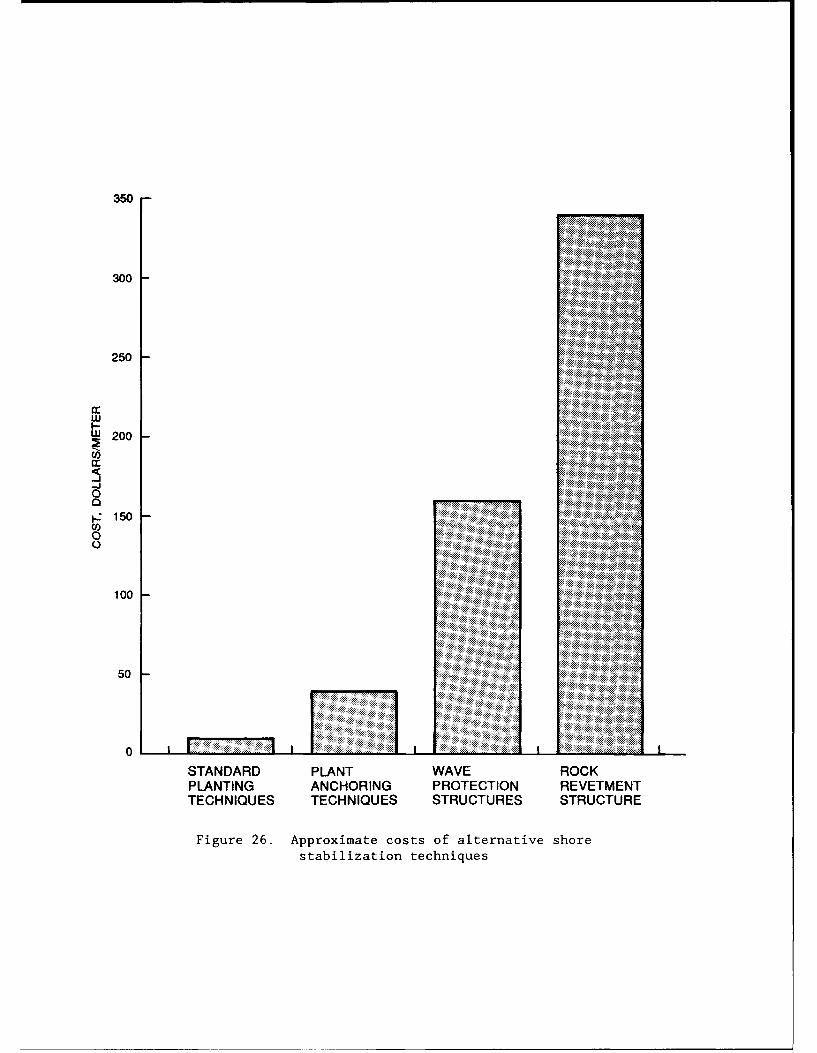
350
300
250
wI--W 200
cc,50
p150
0
100
5 0 -
0
STANDARD PLANT WAVE ROCKPLANTING ANCHORING PROTECTION REVETMENTTECHNIQUES TECHNIQUES STRUCTURES STRUCTURE
Figure 26. Approximate costs of alternative shorestabilization techniques
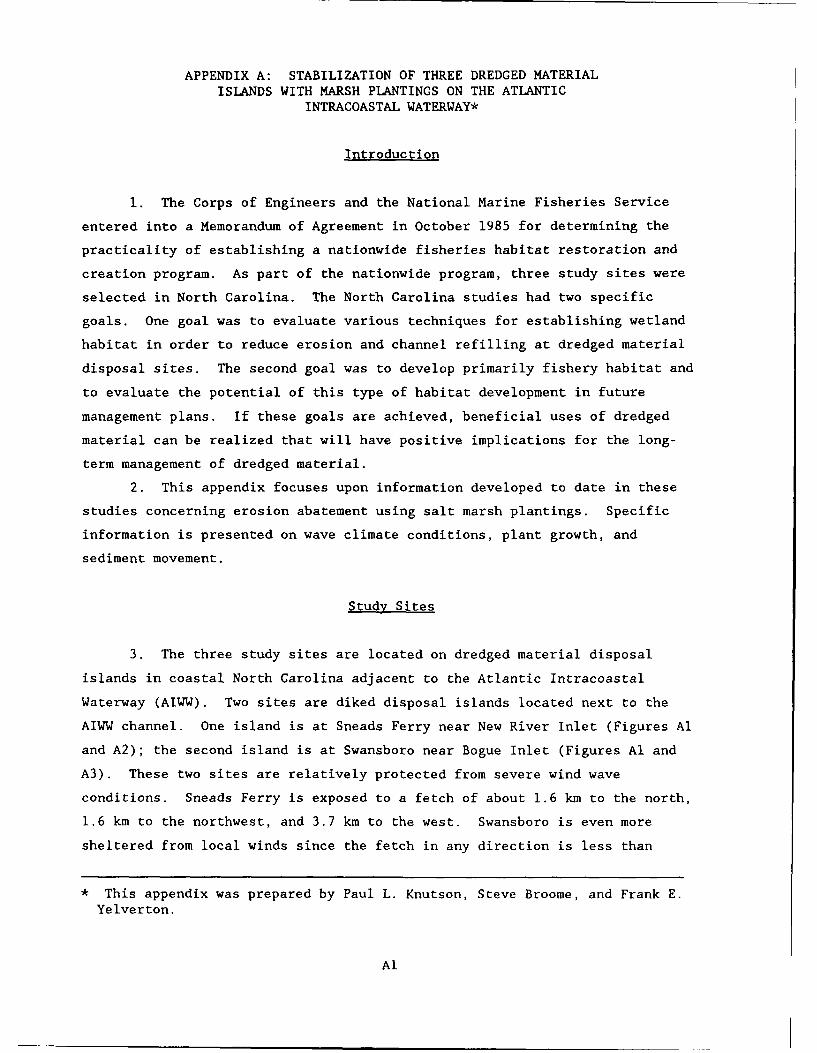
APPENDIX A: STABILIZATION OF THREE DREDGED MATERIAL
ISLANDS WITH MARSH PLANTINGS ON THE ATLANTIC
INTRACOASTAL WATERWAY*
Introduction
1. The Corps of Engineers and the National Marine Fisheries Service
entered into a Memorandum of Agreement in October 1985 for determining the
practicality of establishing a nationwide fisheries habitat restoration and
creation program. As part of the nationwide program, three study sites were
selected in North Carolina. The North Carolina studies had two specific
goals. One goal was to evaluate various techniques for establishing wetland
habitat in order to reduce erosion and channel refilling at dredged material
disposal sites. The second goal was to develop primarily fishery habitat and
to evaluate the potential of this type of habitat development in future
management plans. If these goals are achieved, beneficial uses of dredged
material can be realized that will have positive implications for the long-
term management of dredged material.
2. This appendix focuses upon information developed to date in these
studies concerning erosion abatement using salt marsh plantings. Specific
information is presented on wave climate conditions, plant growth, and
sediment movement.
Study Sites
3. The three study sites are located on dredged material disposal
islands in coastal North Carolina adjacent to the Atlantic Intracoastal
Waterway (AIWW). Two sites are diked disposal islands located next to the
AIWW channel. One island is at Sneads Ferry near New River Inlet (Figures Al
and A2); the second island is at Swansboro near Bogue Inlet (Figures Al and
A3). These two sites are relatively protected from severe wind wave
conditions. Sneads Ferry is exposed to a fetch of about 1.6 km to the north,
1.6 km to the northwest, and 3.7 km to the west. Swansboro is even more
sheltered from local winds since the fetch in any direction is less than
* This appendix was prepared by Paul L. Knutson, Steve Broome, and Frank E.
Yelverton.
Al
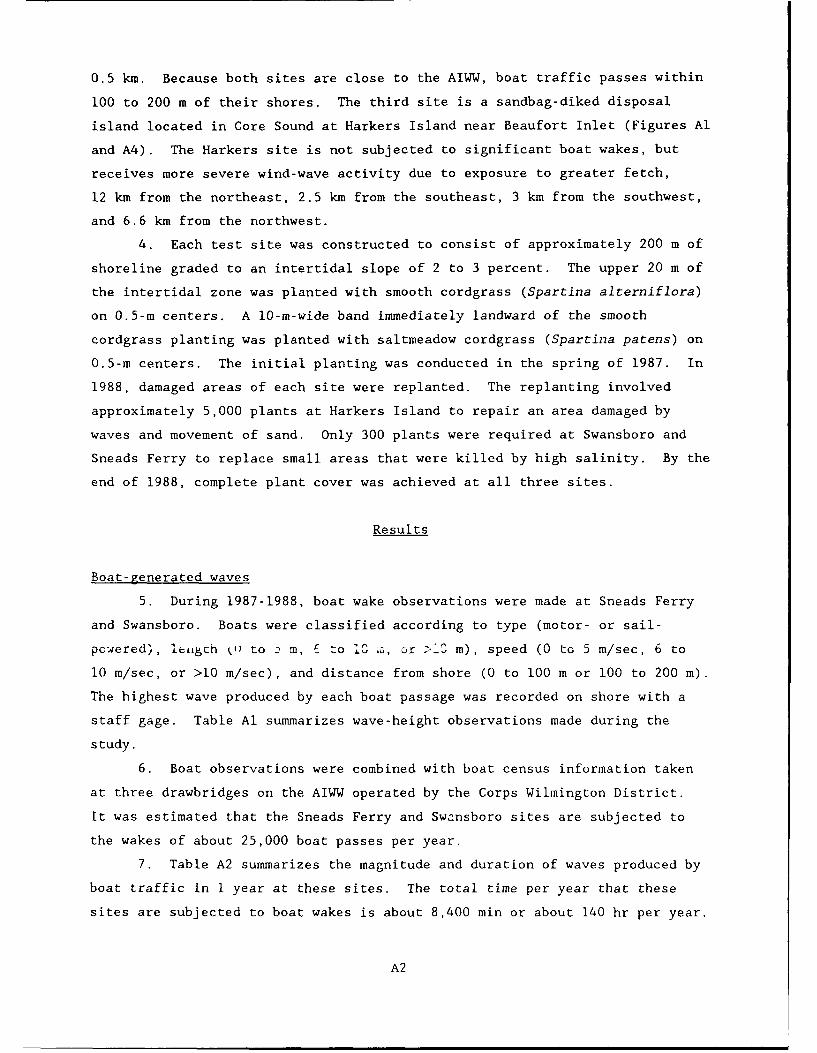
0.5 km. Because both sites are close to the AIWW, boat traffic passes within
100 to 200 m of their shores. The third site is a sandbag-diked disposal
island located in Core Sound at Harkers Island near Beaufort Inlet (Figures Al
and A4). The Harkers site is not subjected to significant boat wakes, but
receives more severe wind-wave activity due to exposure to greater fetch,
12 km from the northeast, 2.5 km from the southeast, 3 km from the southwest,
and 6.6 km from the northwest.
4. Each test site was constructed to consist of approximately 200 m of
shoreline graded to an intertidal slope of 2 to 3 percent. The upper 20 m of
the intertidal zone was planted with smooth cordgrass (Spartina alterniflora)
on 0.5-m centers. A 10-m-wide band immediately landward of the smooth
cordgrass planting was planted with saltmeadow cordgrass (Spartina patens) on
0.5-m centers. The initial planting was conducted in the spring of 1987. In
1988, damaged areas of each site were replanted. The replanting involved
approximately 5,000 plants at Harkers Island to repair an area damaged by
waves and movement of sand. Only 300 plants were required at Swansboro and
Sneads Ferry to replace small areas that were killed by high salinity. By the
end of 1988, complete plant cover was achieved at all three sites.
Results
Boat-generated waves
5. During 1987-1988, boat wake observations were made at Sneads Ferry
and Swansboro. Boats were classified according to type (motor- or sail-
powered), Ietigth ki) to 2 M, E o 1 ii, or >_" m), speed (0 to 5 m/sec, 6 to
10 m/sec, or >10 m/sec), and distance from shore (0 to 100 m or 100 to 200 m).
The highest wave produced by each boat passage was recorded on shore with a
staff gage. Table Al summarizes wave-height observations made during the
study.
6. Boat observations were combined with boat census information taken
at three drawbridges on the AIWW operated by the Corps Wilmington District.
It was estimated that the Sneads Ferry and Swansboro sites are subjected to
the wakes of about 25,000 boat passes per year.
7. Table A2 summarizes the magnitude and duration of waves produced by
boat traffic in I year at these sites. The total time per year that these
sites are subjected to boat wakes is about 8,400 min or about 140 hr per year.
A2
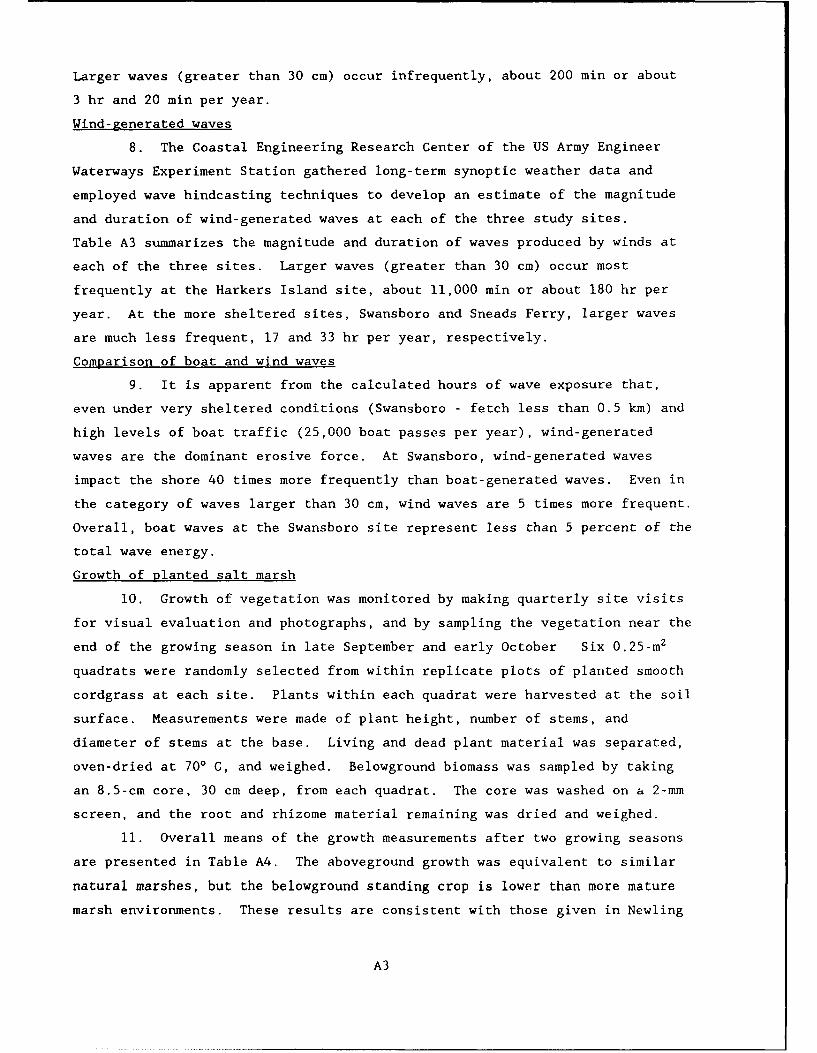
Larger waves (greater than 30 cm) occur infrequently, about 200 min or about
3 hr and 20 min per year.
Wind-generated waves
8. The Coastal Engineering Research Center of the US Army Engineer
Waterways Experiment Station gathered long-term synoptic weather data and
employed wave hindcasting techniques to develop an estimate of the magnitude
and duration of wind-generated waves at each of the three study sites.
Table A3 summarizes the magnitude and duration of waves produced by winds at
each of the three sites. Larger waves (greater than 30 cm) occur most
frequently at the Harkers Island site, about 11,000 min or about 180 hr per
year. At the more sheltered sites, Swansboro and Sneads Ferry, larger waves
are much less frequent, 17 and 33 hr per year, respectively.
Comparison of boat and wind waves
9. It is apparent from the calculated hours of wave exposure that,
even under very sheltered conditions (Swansboro - fetch less than 0.5 km) and
high levels of boat traffic (25,000 boat passes per year), wind-generated
waves are the dominant erosive force. At Swansboro, wind-generated waves
impact the shore 40 times more frequently than boat-generated waves. Even in
the category of waves larger than 30 cm, wind waves are 5 times more frequent.
Overall, boat waves at the Swansboro site represent less than 5 percent of the
total wave energy.
Growth of planted salt marsh
10. Growth of vegetation was monitored by making quarterly site visits
for visual evaluation and photographs, and by sampling the vegetation near the
end of the growing season in late September and early October Six 0.25-m 2
quadrats were randomly selected from within replicate plots of planted smooth
cordgrass at each site. Plants within each quadrat were harvested at the soil
surface. Measurements were made of plant height, number of stems, and
diameter of stems at the base. Living and dead plant material was separated,
oven-dried at 700 C, and weighed. Belowground biomass was sampled by taking
an 8.5-cm core, 30 cm deep, from each quadrat. The core was washed on a 2-mm
screen, and the root and rhizome material remaining was dried and weighed.
11. Overall means of the growth measurements after two growing seasons
are presented in Table A4. The aboveground growth was equivalent to similar
natural marshes, but the belowground standing crop is lower than more mature
marsh environments. These results are consistent with those given in Newling
A3
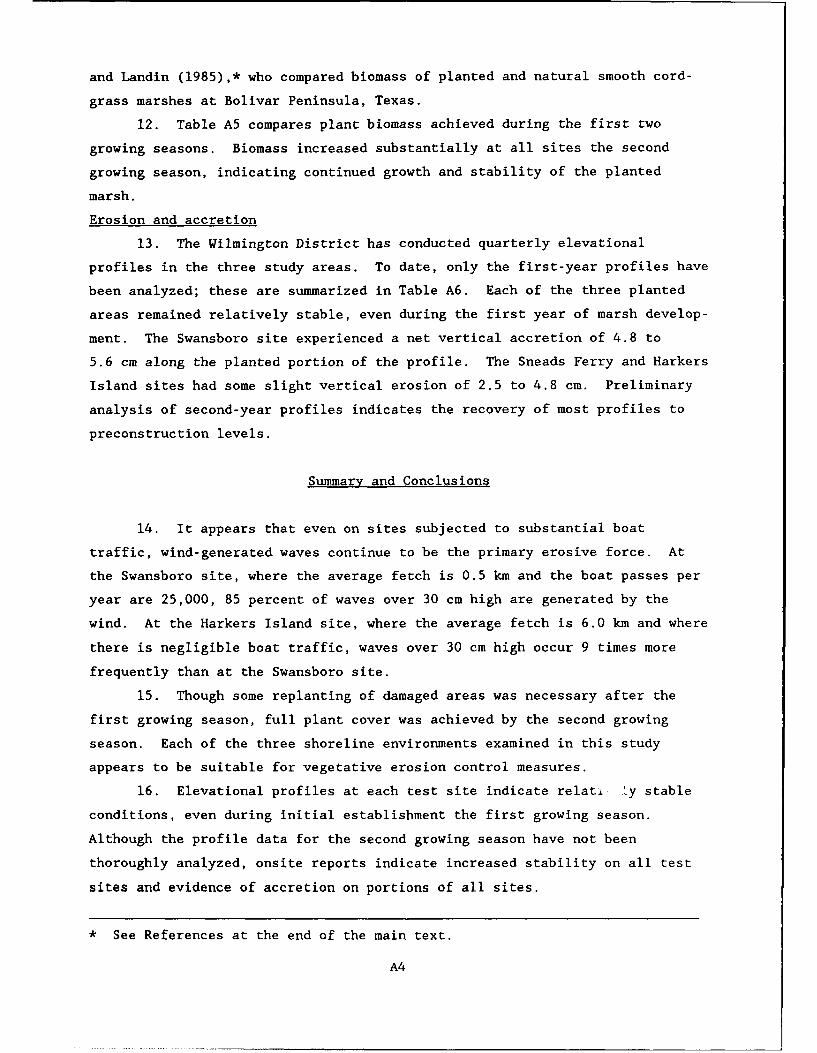
and Landin (1985),* who compared biomass of planted and natural smooth cord-
grass marshes at Bolivar Peninsula, Texas.
12. Table A5 compares plant biomass achieved during the first two
growing seasons. Biomass increased substantially at all sites the second
growing season, indicating continued growth and stability of the planted
marsh.
Erosion and accretion
13. The Wilmington District has conducted quarterly elevational
profiles in the three study areas. To date, only the first-year profiles have
been analyzed; these are summarized in Table A6. Each of the three planted
areas remained relatively stable, even during the first year of marsh develop-
ment. The Swansboro site experienced a net vertical accretion of 4.8 to
5.6 cm along the planted portion of the profile. The Sneads Ferry and Harkers
Island sites had some slight vertical erosion of 2.5 to 4.8 cm. Preliminary
analysis of second-year profiles indicates the recovery of most profiles to
preconstruction levels.
Summary and Conclusions
14. It appears that even on sites subjected to substantial boat
traffic, wind-generated waves continue to be the primary erosive force. At
the Swansboro site, where the average fetch is 0.5 km and the boat passes per
year are 25,000, 85 percent of waves over 30 cm high are generated by the
wind. At the Harkers Island site, where the average fetch is 6.0 km and where
there is negligible boat traffic, waves over 30 cm high occur 9 times more
frequently than at the Swansboro site.
15. Though some replanting of damaged areas was necessary after the
first growing season, full plant cover was achieved by the second growing
season. Each of the three shoreline environments examined in this study
appears to be suitable for vegetative erosion control measures.
16. Elevational profiles at each test site indicate relati 'y stable
conditions, even during initial establishment the first growing season.
Although the profile data for the second growing season have not been
thoroughly analyzed, onsite reports indicate increased stability on all test
sites and evidence of accretion on portions of all sites.
* See References at the end of the main text.
A4
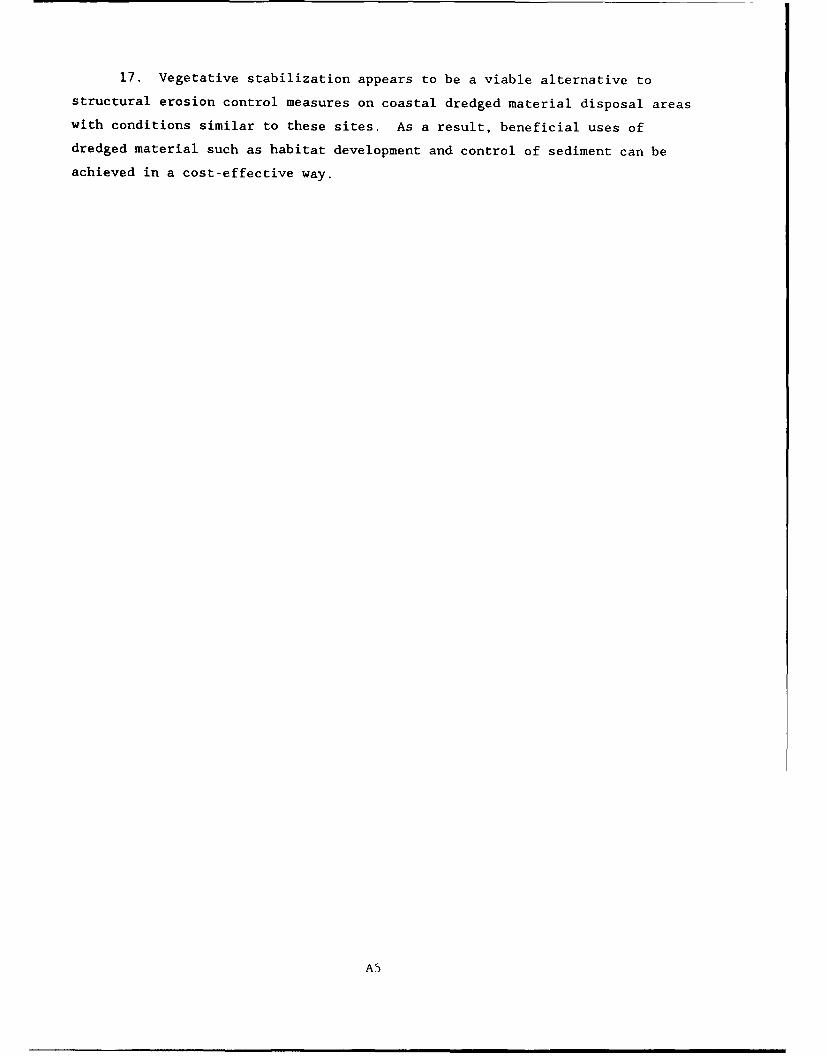
17. Vegetative stabilization appears to be a viable alternative tostructural erosion control measures on coastal dredged material disposal areas
with conditions similar to these sites. As a result, beneficial uses of
dredged material such as habitat development and control of sediment can be
achieved in a cost-effective way.
A5
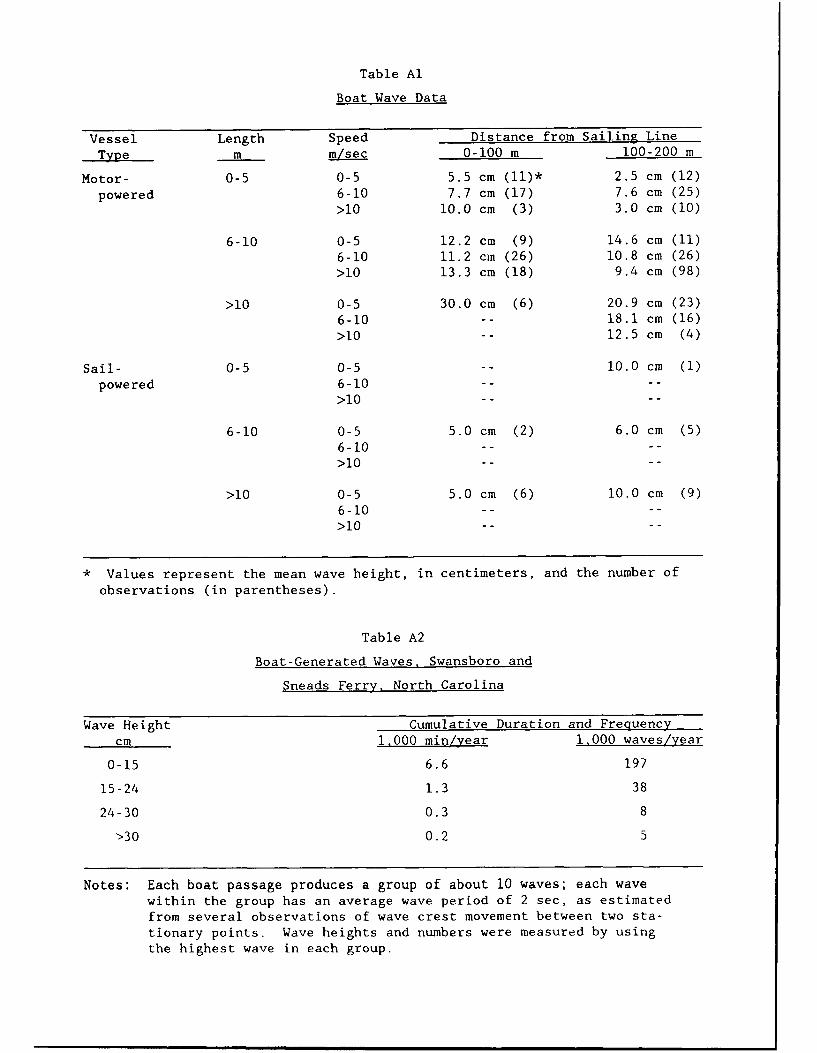
Table Al
Boat Wave Data
Vessel Length Speed Distance from Sailing Line
Type m m/sec 0-100 m 100-200 m.
Motor- 0-5 0-5 5.5 cm (ll)* 2.5 cm (12)
powered 6-10 7.7 cm (17) 7.6 cm (25)
>10 10.0 cm (3) 3.0 cm (10)
6-10 0-5 12.2 cm (9) 14.6 cm (11)
6-10 11.2 cm (26) 10.8 cm (26)
>10 13.3 cm (18) 9.4 cm (98)
>10 0-5 30.0 cm (6) 20.9 cm (23)
6-10 -- 18.1 cm (16)
>10 -- 12.5 cm (4)
Sail- 0-5 0-5 -- 10.0 cm (1)
powered 6-10 ....
>10 ....
6-10 0-5 5.0 cm (2) 6.0 cm (5)
6-10 ....
>10 ....
>10 0-5 5.0 cm (6) 10.0 cm (9)
6-10 ....
>10 ....
* Values represent the mean wave height, in centimeters, and the number of
observations (in parentheses).
Table A2
Boat-Generated Waves, Swansboro and
Sneads Ferry, North Carolina
Wave Height Cumulative Duration and Frequency
cm 1,000 min/year 1,000 waves/year
0-15 6.6 197
15-24 1.3 38
24-30 0.3 8
-30 0.2 5
Notes: Each boat passage produces a group of about 10 waves; each wave
within the group has an average wave period of 2 sec, as estimated
from several observations of wave crest movement between two sta-
tionary points. Wave heights and numbers were measured by using
the highest wave in each group.
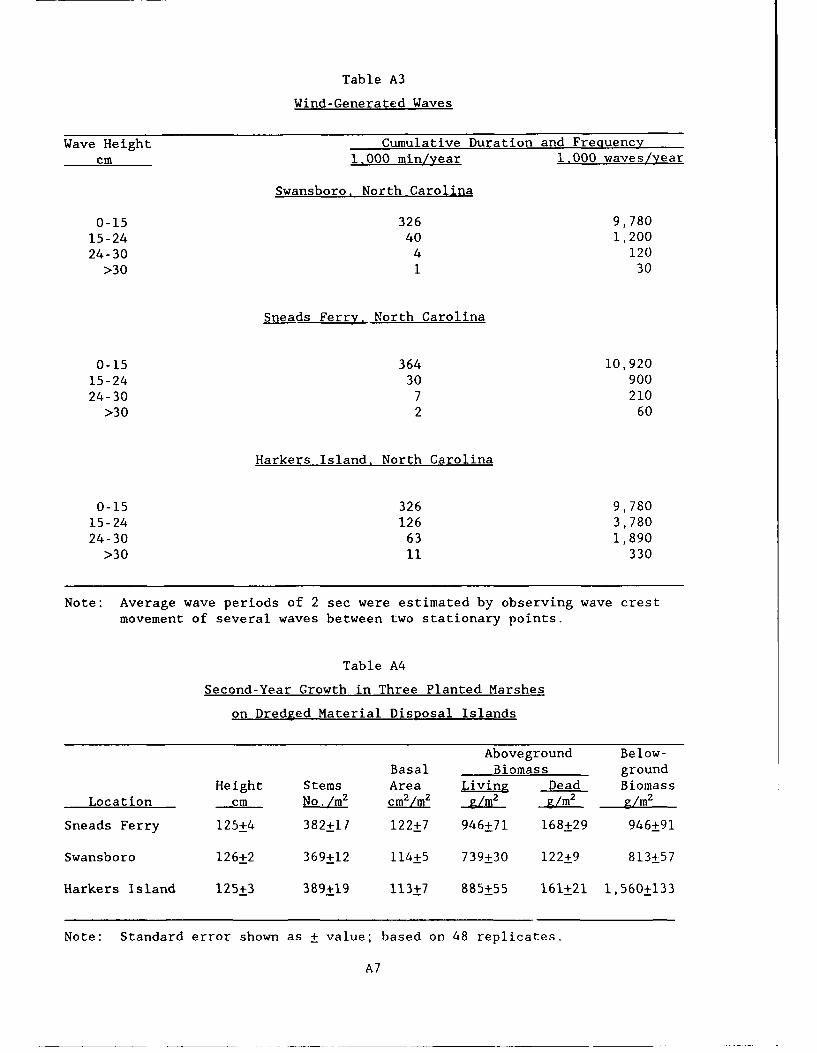
Table A3
Wind-Generated Waves
Wave Height Cumulative Duration and Frequency
cm 1,000 min/year 1,000 waves/year
Swansboro, North Carolina
0-15 326 9,78015-24 40 1,20024-30 4 120>30 1 30
Sneads Ferry, North Carolina
0-15 364 10,92015-24 30 90024-30 7 210
>30 2 60
Harkers Island, North Carolina
0-15 326 9,78015-24 126 3,78024-30 63 1,890>30 11 330
Note: Average wave periods of 2 sec were estimated by observing wave crestmovement of several waves between two stationary points.
Table A4
Second-Year Growth in Three Planted Marshes
on Dredged Material Disposal Islands
Aboveground Below-Basal Biomass ground
Height Stems Area Living Dead BiomassLocation cm cm 2 /M 2 Z/n 2LnL g/m 2
Sneads Ferry 125+4 382+17 122+7 946+71 168+29 946+91
Swansboro 126+2 369+12 114+5 739+30 122+9 813+57
Harkers Island 125+3 389+19 113+7 885+55 161+21 1,560+133
Note: Standard error shown as + value; based on 48 replicates.
A7
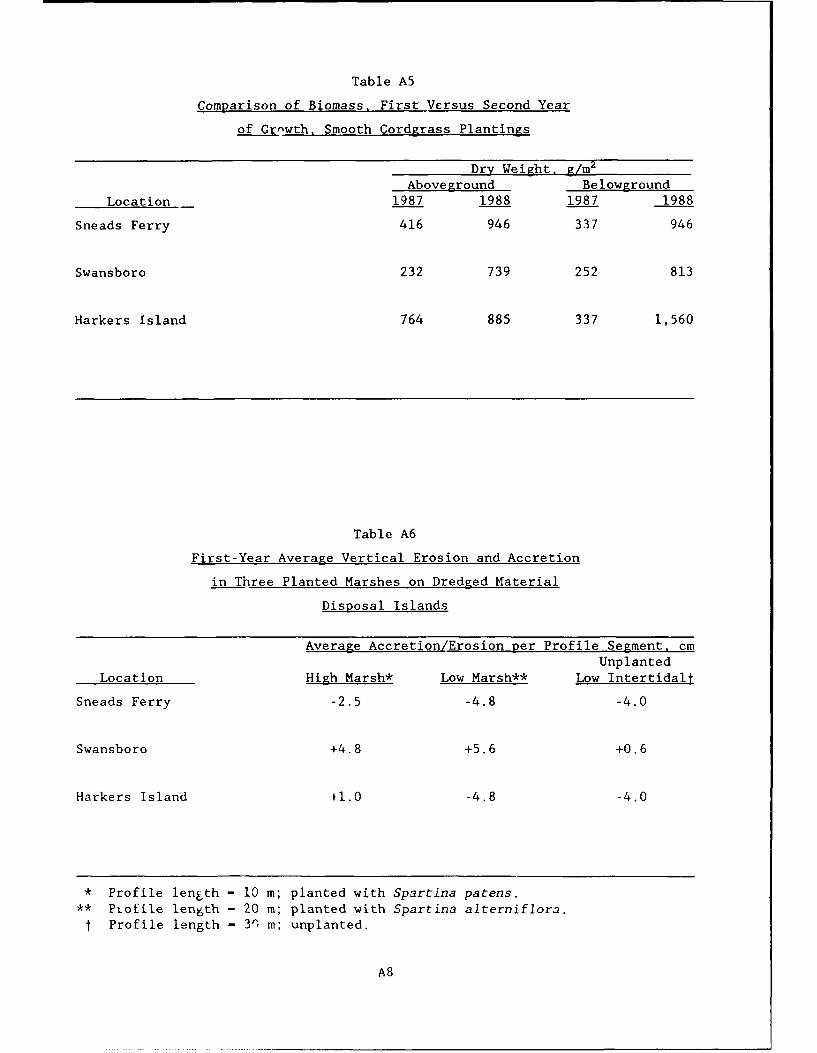
Table A5
Comparison of Biomass, First Versus Second Year
of Grnwth, Smooth Cordgrass Plantings
Dry Weight, g/m2
Aboveground Belowground
Location 1987 1988 1987 1988
Sneads Ferry 416 946 337 946
Swansboro 232 739 252 813
Harkers Island 764 885 337 1,560
Table A6
First-Year Average Vertical Erosion and Accretion
in Three Planted Marshes on Dredged Material
Disposal Islands
Average Accretion/Erosion per Profile Segment, cmUnplanted
Location High Marsh* Low Marsh** Low Intertidalt
Sneads Ferry -2.5 -4.8 -4.0
Swansboro +4.8 +5.6 +0.6
Harkers Island +1.0 -4.8 -4.0
* Profile length = 10 m; planted with Spartina patens.
** Piofile length = 20 m; planted with Spartina alterniflora.
t Profile length = 31 m; unplanted.
A8
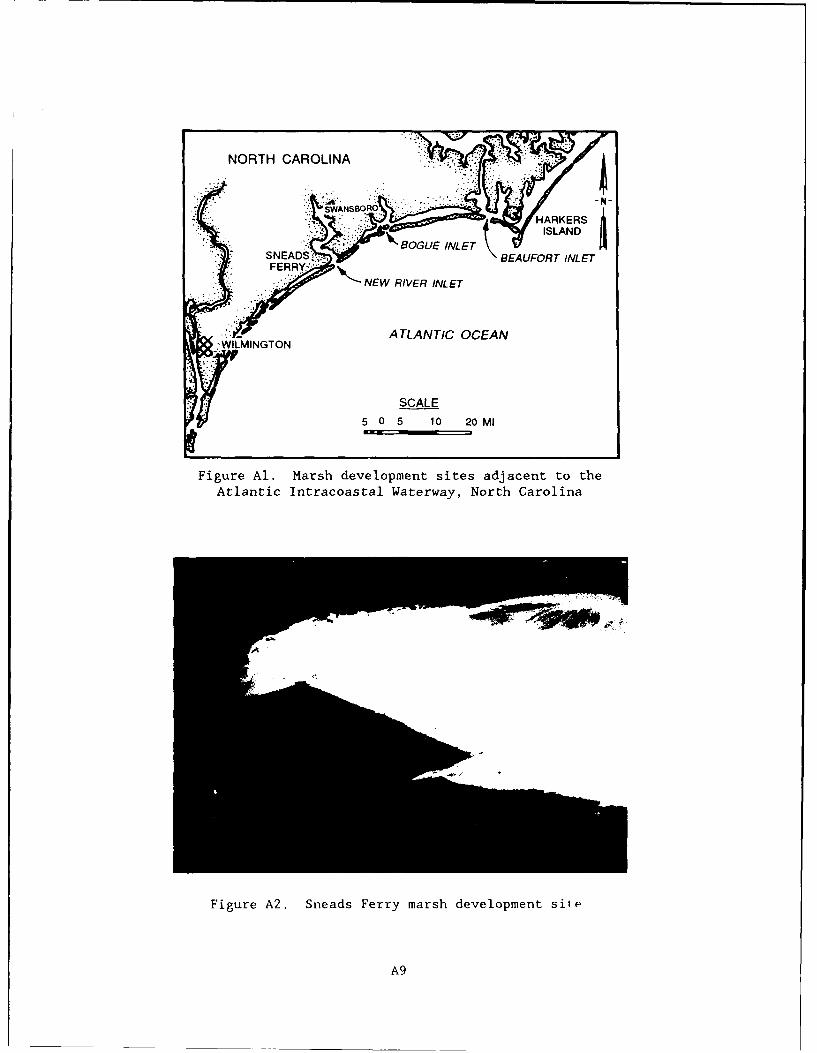
L
NORTH CAROLINA
SWANSB.AO 4 HARKERSSNEAS~.. ~ 8OUE ILETISLAND
SNEADS'BEAUFORT INLETFERRY
NWRIVER INLET
ATLANTIC OCEANWILMINGTON
SCALE5 0 5 10 20 MI
Figure Al. Marsh development sites adjacent to theAtlantic Intracoastal Waterway, North Carolina
Figure A2. Sneads Ferry marsh development site~
A9
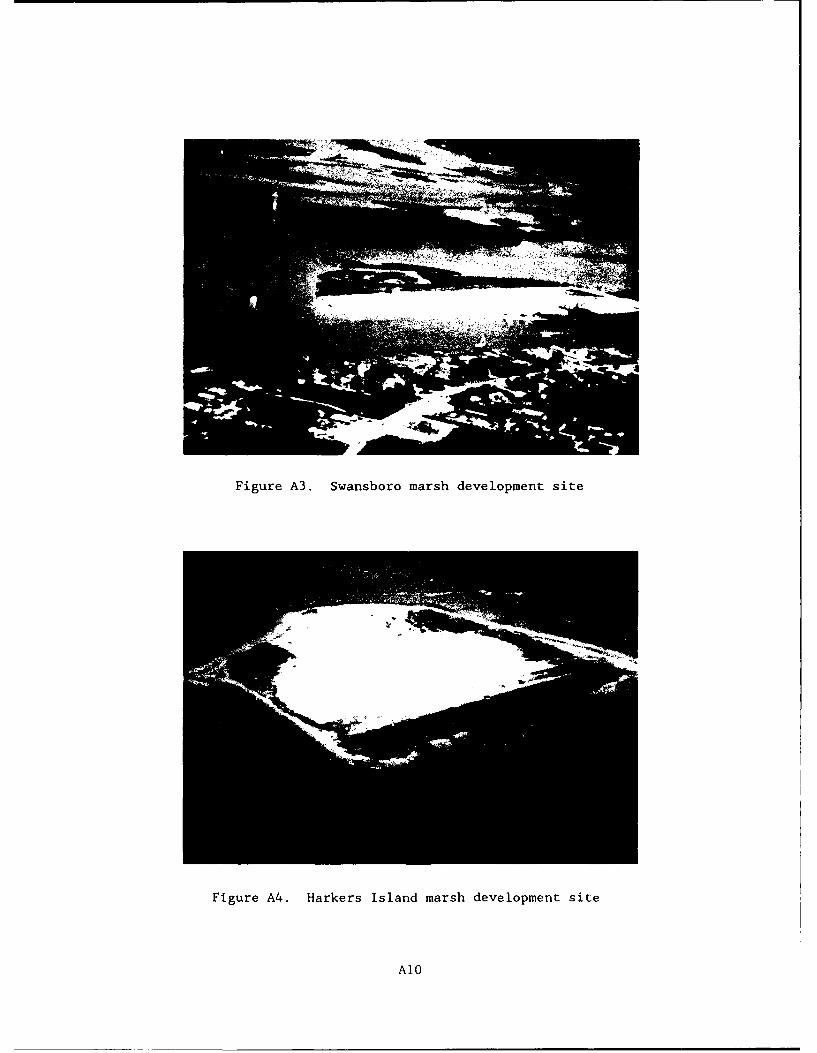
Figure A3. Swansboro marsh development site
Figure A4. Harkers Island marsh development site
A10
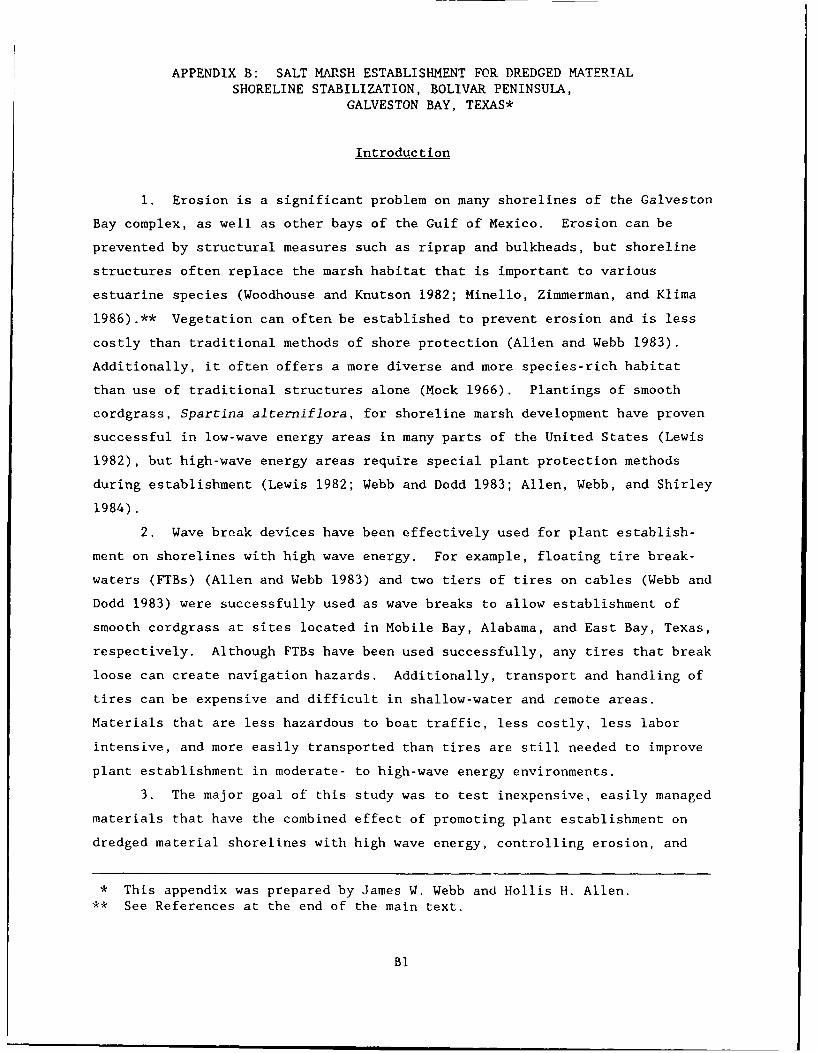
APPENDIX B: SALT MARSH ESTABLISHMENT FOR DREDGED MATERIALSHORELINE STABILIZATION, BOLIVAR PENINSULA,
GALVESTON BAY, TEXAS*
Introduction
1. Erosion is a significant problem on many shorelines of the Galveston
Bay complex, as well as other bays of the Gulf of Mexico. Erosion can be
prevented by structural measures such as riprap and bulkheads, but shoreline
structures often replace the marsh habitat that is important to various
estuarine species (Woodhouse and Knutson 1982; Minello, Zimmerman, and Klima
1986).** Vegetation can often be established to prevent erosion and is less
costly than traditional methods of shore protection (Allen and Webb 1983).
Additionally, it often offers a more diverse and more species-rich habitat
than use of traditional structures alone (Mock 1966). Plantings of smooth
cordgrass, Spartina alterniflora, for shoreline marsh development have proven
successful in low-wave energy areas in many parts of the United States (Lewis
1982), but high-wave energy areas require special plant protection methods
during establishment (Lewis 1982; Webb and Dodd 1983; Allen, Webb, and Shirley
1984).
2. Wave break devices have been effectively used for plant establish-
ment on shorelines with high wave energy. For example, floating tire break-
waters (FTBs) (Allen and Webb 1983) and two tiers of tires on cables (Webb and
Dodd 1983) were successfully used as wave breaks to allow establishment of
smooth cordgrass at sites located in Mobile Bay, Alabama, and East Bay, Texas,
respectively. Although FTBs have been used successfully, any tires that break
loose can create navigation hazards. Additionally, transport and handling of
tires can be expensive and difficult in shallow-water and remote areas.
Materials that are less hazardous to boat traffic, less costly, less labor
intensive, and more easily transported than tires are still needed to improve
plant establishment in moderate- to high-wave energy environments.
3. The major goal of this study was to test inexpensive, easily managed
materials that have the combined effect of promoting plant establishment on
dredged material shorelines with high wave energy, controlling erosion, and
* This appendix was prepared by James W. Webb and Hollis H. Allen.** See References at the end of the main text.
BI
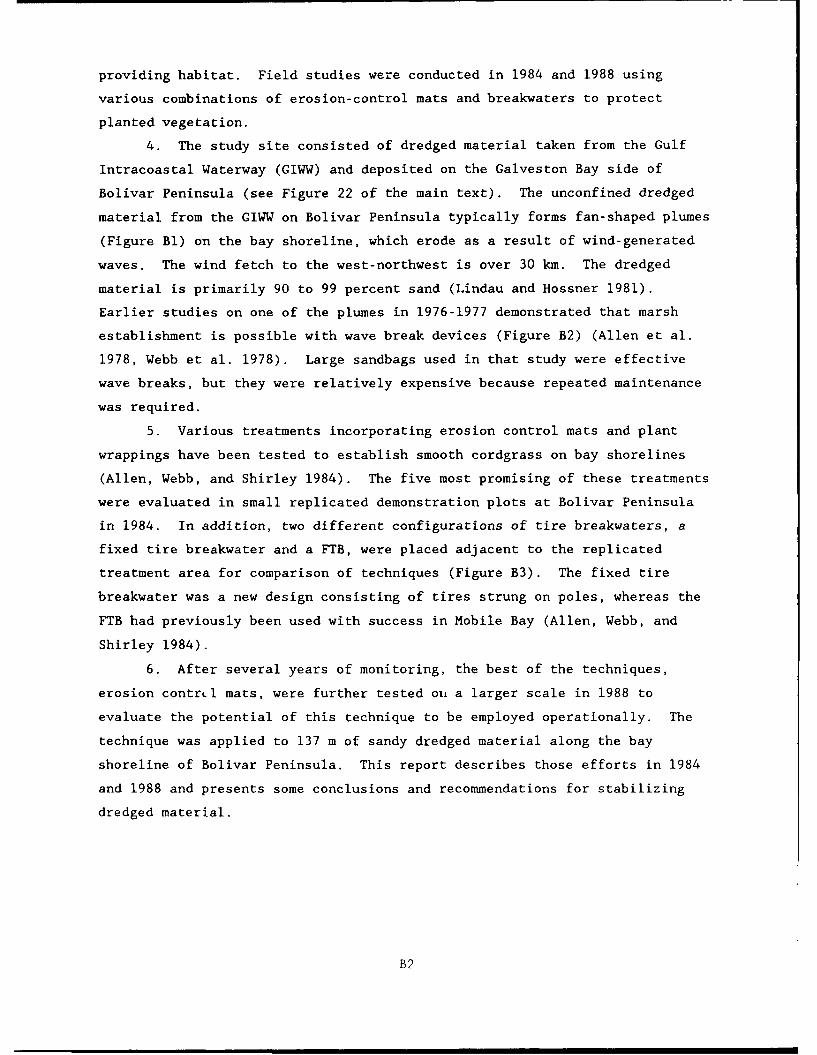
providing habitat. Field studies were conducted in 1984 and 1988 using
various combinations of erosion-control mats and breakwaters to protect
planted vegetation.
4. The study site consisted of dredged material taken from the Gulf
Intracoastal Waterway (GIWW) and deposited on the Galveston Bay side of
Bolivar Peninsula (see Figure 22 of the main text). The unconfined dredged
material from the GIWW on Bolivar Peninsula typically forms fan-shaped plumes
(Figure Bl) on the bay shoreline, which erode as a result of wind-generated
waves. The wind fetch to the west-northwest is over 30 km. The dredged
material is primarily 90 to 99 percent sand (Lindau and Hossner 1981).
Earlier studies on one of the plumes in 1976-1977 demonstrated that marsh
establishment is possible with wave break devices (Figure B2) (Allen et al.
1978, Webb et al. 1978). Large sandbags used in that study were effective
wave breaks, but they were relatively expensive because repeated maintenance
was required.
5. Various treatments incorporating erosion control mats and plant
wrappings have been tested to establish smooth cordgrass on bay shorelines
(Allen, Webb, and Shirley 1984). The five most promising of these treatments
were evaluated in small replicated demonstration plots at Bolivar Peninsula
in 1984. In addition, two different configurations of tire breakwaters, a
fixed tire breakwater and a FTB, were placed adjacent to the replicated
treatment area for comparison of techniques (Figure B3). The fixed tire
breakwater was a new design consisting of tires strung on poles, whereas the
FTB had previously been used with success in Mobile Bay (Allen, Webb, and
Shirley 1984).
6. After several years of monitoring, the best of the techniques,
erosion contrLl mats, were further tested oin a larger scale in 1988 to
evaluate the potential of this technique to be employed operationally. The
technique was applied to 137 m of sandy dredged material along the bay
shoreline of Bolivar Peninsula. This report describes those efforts in 1984
and 1988 and presents some conclusions and recommendations for stabilizing
dredged material.
B2
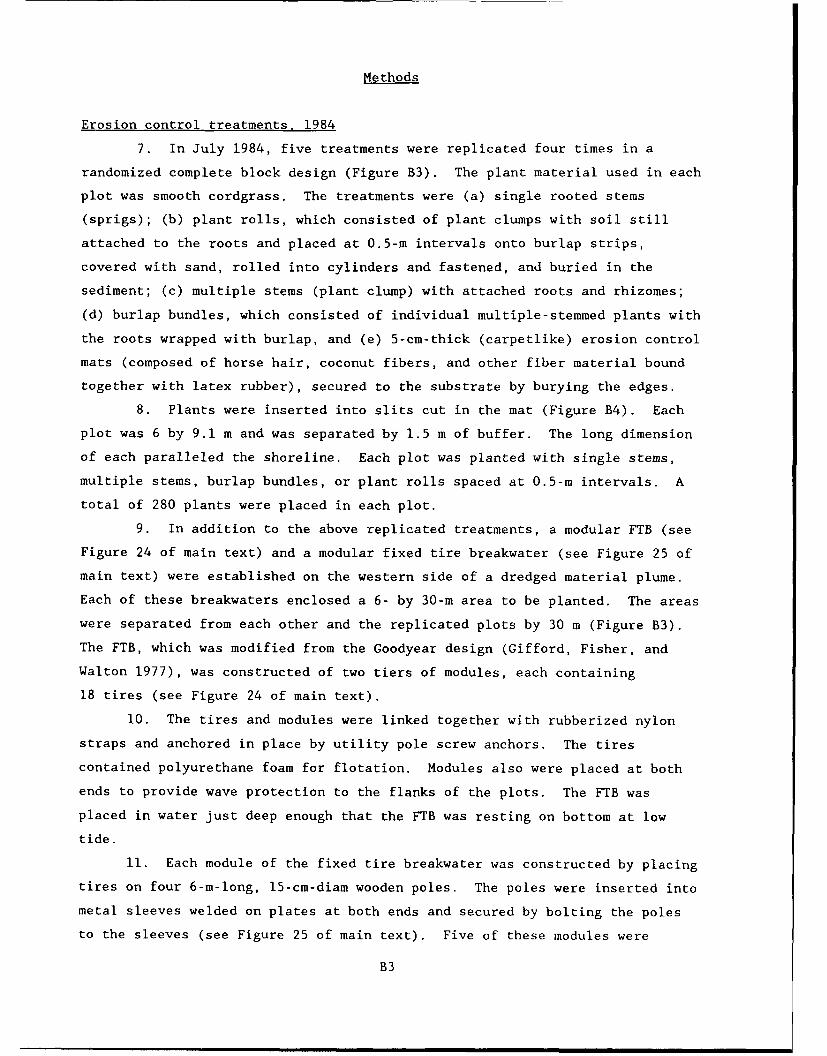
Methods
Erosion control treatments, 1984
7. In July 1984, five treatments were replicated four times in a
randomized complete block design (Figure B3). The plant material used in each
plot was smooth cordgrass. The treatments were (a) single rooted stems
(sprigs); (b) plant rolls, which consisted of plant clumps with soil still
attached to the roots and placed at 0.5-m intervals onto burlap strips,
covered with sand, rolled into cylinders and fastened, and buried in the
sediment; (c) multiple stems (plant clump) with attached roots and rhizomes;
(d) burlap bundles, which consisted of individual multiple-stemmed plants with
the roots wrapped with burlap, and (e) 5-cm-thick (carpetlike) erosion control
mats (composed of horse hair, coconut fibers, and other fiber material bound
together with latex rubber), secured to the substrate by burying the edges.
8. Plants were inserted into slits cut in the mat (Figure B4). Each
plot was 6 by 9.1 m and was separated by 1.5 m of buffer. The long dimension
of each paralleled the shoreline. Each plot was planted with single stems,
multiple stems, burlap bundles, or plant rolls spaced at 0.5-m intervals. A
total of 280 plants were placed in each plot.
9. In addition to the above replicated treatments, a modular FTB (see
Figure 24 of main text) and a modular fixed tire breakwater (see Figure 25 of
main text) were established on the western side of a dredged material plume.
Each of these breakwaters enclosed a 6- by 30-m area to be planted. The areas
were separated from each other and the replicated plots by 30 m (Figure B3).
The FTB, which was modified from the Goodyear design (Gifford, Fisher, and
Walton 1977), was constructed of two tiers of modules, each containing
18 tires (see Figure 24 of main text).
10. The tires and modules were linked together with rubberized nylon
straps and anchored in place by utility pole screw anchors. The tires
contained polyurethane foam for flotation. Modules also were placed at both
ends to provide wave protection to the flanks of the plots. The FTB was
placed in water just deep enough that the FTB was resting on bottom at low
tide.
11. Each module of the fixed tire breakwater was constructed by placing
tires on four 6-m-long, 15-cm-diam wooden poles. The poles were inserted into
metal sleeves welded on plates at both ends and secured by bolting the poles
to the sleeves (see Figure 25 of main text). Five of these modules were
B3
placed parallel to the shoreline, and two additional modules were placed at
each end. The modules were placed at the same topographic elevation as the
FTB. The areas protected by the tire breakwater were also planted with smooth
cordgrass on 0.5-m centers.
12. Evaluation of plant performance for each of the replicated plots
and the area behind each breakwater consisted of observing transplant sur-
vival, stem density, and percent cover. Initially, survival and stem counts
were determined in each area by counting all of the stems, but over time,
density and cover increased and 0.25-m fra.2s were used to estimate density
and percent cover. Percent cover was estimated ocularly as that percentage of
the frame covered by plants.
Mat plantings, 1988
13. Two treatments, mats with plants and control plots (single-stemmed
transplants without mats), were established and replicated on three dredged
material plumes (Figure B5). The erosion control mats were like those used in
the 1984 treatments described above. Each mat was 1.8 by 15 m. For each
replication, 15 mats were joined to form a 7.8- by 45-m plot. A 7.8- by 15-m
control treatment (no mat) was established for each of the three replications.
The longest dimensions of the plots were oriented parallel to the shoreline.
Placement of mats and planting occurred between 7 and 19 June 1988.
14. Because of a shortage of latex glue originally planned for con-
structing each large mat segment, a combination of methods was used for
joining the rr-s together. In replications 1 and 3, 15 mats were overlapped
(10 cm on edges) and sewn together by a 27-kg-test monofilament line, using
upholstery needles, to form a 7.8- by 45-m mat (Figure B5). The outer free
edges were buried to a 15- to 30-cm depth. In replication 2, the edges of
each of 10 mats were overlapped, a single continuous bead of glue (eclectic
6000) was applied with a caulking gun, and the mats were pressed together. A
7.8- by 30-m mat segment was thus formed and the edges buried. The remaining
five mats were not joined, and the edge of each mat was buried (Figure B5).
Shovels or a water jet gun were used to bury mat edges below the sediment
surface.
15. Single-stemmed sprig! of smooth cordgrass gathered from local
borrow areas were inserted into slits cut in each mat on 0.5-m centers. The
control treatments were 7.8- by 15-m plots located near the mats and consisted
of single-stemmed sprigs transplanted on 0.5-m centers using shovels. They
were transplanted without any mats or special protection.
B4
16. Evaluation of treatments, plant performance, and establishment
consisted of initially recording the survival of transplants, stem counts, and
condition of mats at various dates over time. At first, survival and total
stem counts were determined in each 1.8- by 15-m mat segment, but as plant
density and cover increased, 0.25-m 2 frames (five per mat) were employed.
Total stem counts were made in each control treatment throughout the monitor-
ing period. In June 1989, these frames were used to estimate plant density
and percent cover as described above for the 1984 treatments.
Results
Erosion control treatments, 1984
17. Three months after planting on 30 October 1984, transplant survival
was relatively low, less than 26 percent for all treatments in the replicated
study area (Table Bl). Survival was not significantly different statistically
among treatments despite the seemingly greater survival in the mats. By
3 January 1985, survival had decreased further in each treatment. No signi-
ficant differences among treatments occurred, despite the fact that mean
survival was 18.6 percent in mats, 10 percent in multiple stems, but less than
3 percent in the other treatments.
18. During a qualitative evaluation of the site in November 1985, about
1.5 years after planting, notable plant establishment was present only in two
mat plots and one multiple-stem plot. In the two mat plots, the lower halves
had good plant colonization, but the upper portions of the mats had washed
away. The mats appeared to trap sand and hold plant roots in place (Fig-
ure B6). Only a few scattered plants remained in plots containing single
stems, burlap bundles, or plant rolls. Despite the initial low survival,
plants began to spread, and significant colonization of the shoreline occurred
over time.
19. Approximately 2.5 years after planting on 20 November 1986, 6 of
the original 20 plots had greater than 25 percent cover of smooth cordgrass.
Plants had spread in three mat plots, two multiple-stem plots, and one burlap
bundle plot (see Table B2 and Figures B7 and B8).
20. By 1 December 1987, plant establishment varied from complete
coverage in one mat plot and one multiple-stem plot to less than 33 percent
B5
coverage of plants in most other plots. Three of the four mat plots had 35-
to 100-percent cover (Table B2, Figures B7 and B9).
21. The surviving plants continued to spread and, in 1989, the plants
were far outside the original boundaries of the plots (Figure B7). However,
the shoreline had receded behind the establishment stands, leaving the plots
as islands.
Comparison of tire breakwaters
22. The plantings behind the FTB and fixed tire breakwater had poor
initial survival. Failure of plants to survive immediately behind the tires
appeared to be due to rapid sediment accumulation behind the tire breakwaters
that buried some plants. Severe wave action in September 1984 also caused the
top poles of the fixed tire breakwater to break. Both breakwaters sank into
the sediment, and wave action over the breakwaters was severe enough to wash
plants away. Although surviving plants spread rapidly during the summer,
these areas were replanted at the end of July 1985 to further test breakwater
protection after sediment accumulation had apparently stopped.
23. Two years after the initial planting, the plants behind the fixed
tire breakwater had survived and spread to create a stand of smooth cordgrass
behind the four more easterly modules, while wave action prevented plant
establishment on the western side adjacent to the breakwater structure
(Figure BIO). The shoreline had receded 15.2 m from the western side of the
plots. Erosion was occurring as a result of wave action over and around the
fixed tire breakwater. By 26 June 1987, numerous tires were released since
most of the remaining top poles had broken or worked free. Two thirds of the
plants were removed by wave action on the western side. By June 1989, plants
were confined to two small remnant stands within the fixed tire breakwater
area. The lower poles and tires remained imbedded in the sand.
24. The FTB had excellent plant establishment in November 1986, about
2.5 years after the initial planting (Table B2 and Figure B10). Plants
extended completely across the site. However, plants were not growing near
the front line of tires, and plants had not colonized landward or seaward
(Figure Bll). Plant cover varied from 40 to 70 percent within the stand. By
June 1989, plants had colonized down to the tires, which were solidly imbedded
in the sediment, and completely covered the area within the wave protection of
the tires. Plants had not colonized landward, apparently because ot wave
action and resulting erosion from the sides of the area that left it an
island. The tires eventually filled with sediment and sank into the substrate
B6
despite the presence of foam flotation. The plants did not colonize adjacent
to the tire structure until the shifting of the tires ceased.
Mat plantings, 1988
25. On 13 September 1988, approximately 2.5 months after planting but
before Hurricane Gilbert (described below), the mat plots (Figure B5) were in
good condition except for some erosion at the upper edges. There was no
erosion of the mat plots in replication 2 where the mat edges were buried and
not exposed. Some portions of mats were covered -iiri thin layers of shell
fragments, sand, or silt. The percent survival of transnlants was relatively
low. 27.1 percent in the transplanted area compared to 13.8 percent in the
control (Table B3). Survival was not significantly different between areas
(control and planted plots) using a probability significance level of P < 0.5.
26. Goats were observed using the mats as loafing areas and may have
influenced plant survival by crushing or eating plants. Other contributors to
low survival may have been wave action and lack of rainfall, since 1988 was a
record drought year. Percent survival was lowest in the mats at the highest
elevation, followed by the next to highest (Table B4). The low survival at
elevations above mean high water appeared to reflect the dry summer conditions
of 1988.
27. Hurricane Gilbert generated harsh wave conditions in mid-September
1988. Despite the strong waves, the mats were intact when inspected on
15 October 1988. Erosion was notable along the top and bottom edges of mats
in two replications, but the weight of sediment imbedded in mats appeared to
hold them in place despite the exposure of edges. Wave action from Hurricane
Gilbert only slightly reduced the percent survival in the mat treatments while
the percent survival in the control treatments dropped from 23.8 to 10.8 per-
cent (Table B3). The number of stems per planting unit and total stems in the
transplanted area increased slightly from September to October despite the
reduction in percent survival.
28. In June 1989, the mats were generally intact and in satisfactory
condition. However, pieces of mats were torn away by wave action in a number
of locations, particularly on corners. Sediment had generally redeposited to
the elevation level of the mats. In replication 1, approximately 7.6 m of the
western side had been torn loose by wave action. Part of this material was
still attached and was being moved about by waves. The number of stems per
square meter and the total number of stems in the mats had increased greatly,
B7
and were significantly (P < 0.05) greater than the control areas (Table B3).
Plants in control replications 1 and 3 were no longer present.
Cost analysis, 1988 mats
29. The cost of the fiber mats was the most expensive portion of the
planting operation in 1988 (Table B5). Cost to purchase the fiber mat (5 cm
thick by 15 m long by 1.8 m wide) was $3.34 per square meter. Installation of
the mats took additional manpower compared to traditional planting methods
using single stems. Considerable labor was expended in sewing the mats
together. The original plan to glue the mats with natural latex rubber was
not implemented because the vendor could not supply the glue in time to meet
the planting schedule. Therefore, 30 mats were sewn together, 10 were glued,
and 5 were buried individually. The sewing required 9 man-days of labor.
Gluing of mats took much less effort, but the glue is relatively expensive.
The waterproof adhesive was $4.50 per tube, which is enough to glue only two
mats together.
30. Burying the edges of mats was perhaps the most difficult task.
Hand labor was slow, and the water pump technique could be used only when
water covered the edges of plots. The technique was generally effective when
used. Water pumps can be purchased for $600. The labor to transplant is
similar for both the mat and the control area. The major exception is that
there is an additional effort in cutting the holes in the mat prior to
transplanting and in locating the mat holes and placing the plant into the
holes at the time of planting.
Discussion
31. The floating tire breakwater and the mats were the most successful
of the techniques used. The fixed tire breakwater was a failure because of
the pole breakage, release of tires, and poor plant establishment behind it.
The 15-m-long poles presented two problems: (a) the structure was not able to
move when hit by waves and was consequently battered apart and (b) the weight
of the modules made handling of them difficult during construction. In
contrast, the FTB remained intact, and plants established successfully behind
the breakwater. The initial low survival appeared to be related primarily to
sediment accumulation. Planting should be delayed until new deposition behind
the FTB ceases; this delay could improve survival rates.
B8
32. The mats were the most successful of the replicated treatments
tried in 1984, but damage to some of the macs indicated that mat edges were
vulnerable to erosion. Greater lengths of mat were placed parallel to the
shoreline in 1988 than in 1984 to determine the effectiveness of mats when the
ratio of mat edge to surface area was less. The longer mats laid down in 1988
were still intact in August 1989 except for the loss of one portion of one
mat.
33. The mats provided the initial protection needed for establishment
of plants in a high-wave energy climate. However, low survival occurred
despite the presence of mats. The initial low survival probably occurred
because of hurricane-generated waves, summer drought, and use of plots by
feral goats. Since the mats were intact after low survival was determined,
they could have been transplanted. They were not replanted in favor of
monitoring the original transplant development. Since the mats have gener-
ally remained intact and plants have spread, the mats appear to have good
potential for shoreline plant establishment.
34. Cost of the mat treatments could be reduced by focusing on cost-
effective ways of fastening or placing the mats together, anchoring the edges
into the substrate, and reducing material costs. Mats can be placed and
anchored at the same time by using a mechanized ditch-digging device when the
site is not flooded by tides. Then, edges of mats could be placed into the
ditch and buried. When the site is flooded, a hydraulic jet pump could be
used to bury the edges of the mat.
35. Severe erosion in the study area was primarily on the west-
northwest side of each dredged material plume, the direction of longest fetch
and most wave exposure. Wave exposure to the northwest (300-deg azimuth) was
also documented as a direction of severe erosion at another Gulf of Mexico
site (Webb, Allen, and Shirley 1984). Greater survival and spread of plants
on the eastern side of the study area at Bolivar Peninsula (Figure B7) further
indicates that a northwesterly exposure of plots can result in greater
washout. The survival of some plants in burlap bundle and multistem plots
very likely was influenced by protection from adjacent plots, tire break-
waters, and other plants to the west.
B9
Summary and Conclusions
36. Five types of replicated vegetation treatments were tried in 1984
for shoreline erosion control on dredged material plumes deposited on Bolivar
Peninsula. Erosion control mats, carpetlike in appearance, had smooth
cordgrass inserted into them and were the most successful. This material was
further investigated in larger plots in 1988. During the 1988 planting, the
mat material remained intact, despite waves generated by Hurricane Gilbert and
significant erosion of the site. Percent survival of plants, which was lower
than expected, appeared to be associated with the extremely dry summer, the
wave action generated by Hurricane Gilbert, and feral goat activity. The
number of plants in the control treatments continued to decline, while the mat
plots remained intact and plant coverage in those plots continued to expand
throughout the monitoring period. The mats may provide a cost-effective
technique for establishment of plants on high-wave energy shorelines without
posing a problem to navigation. Further monitoring of these sites is encour-
aged to determine whether the plant community continues to establish and
whether it provides long-term stability to the shoreline areas.
37. The area protected by the floating tire breakwater, despite some
initial washout of plants, colonized successfully. The success of the FTB at
this site once again demonstrated that FTBs in gulf coast climates are
effective aids to shoreline marsh establishment. The fixed tire breakwater
was a failure.
B10
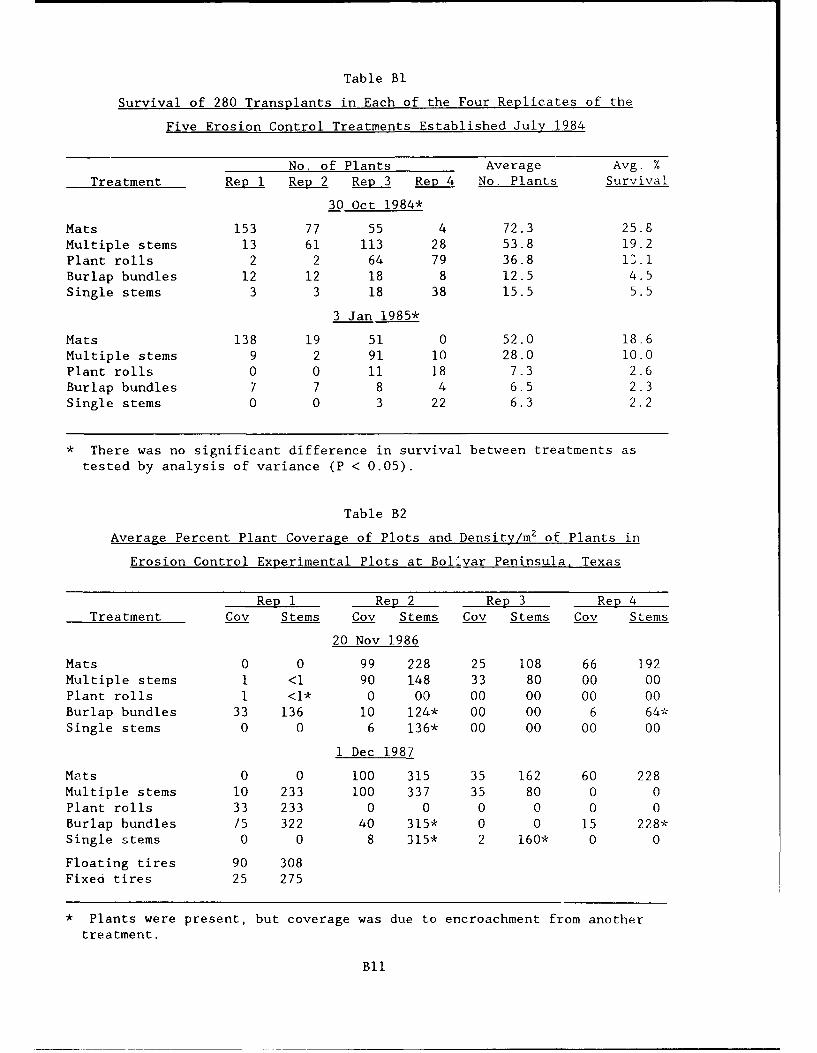
Table B1
Survival of 280 Transplants in Each of the Four Replicates of the
Five Erosion Control Treatments Established July 1984
No. of Plants Average Avg. %
Treatment- Rep 1 Rep 2 Rep 3 Rep 4 No. Plants Survival
30 Oct 1984*
Mats 153 77 55 4 72.3 25.8Multiple stems 13 61 113 28 53.8 19.2Plant rolls 2 2 64 79 36.8 11.1Burlap bundles 12 12 18 8 12.5 4.5Single stems 3 3 18 38 15.5 5.5
3 Jan 1985*
Mats 138 19 51 0 52.0 18.6Multiple stems 9 2 91 10 28.0 10.0Plant rolls 0 0 11 18 7.3 2.6Burlap bundles 7 7 8 4 6.5 2.3Single stems 0 0 3 22 6.3 2.2
* There was no significant difference in survival between treatments as
tested by analysis of variance (P < 0.05).
Table B2
Average Percent Plant Coverage of Plots and Density/m 2 of Plants in
Erosion Control Experimental Plots at Bollvar Peninsula, Texas
Rep 1 Rep 2 Rep 3 Rep 4
Treatment Coy Stems Coy Stems Coy Stems Coy Stems
20 Nov 1986
Mats 0 0 99 228 25 108 66 192Multiple stems 1 <1 90 148 33 80 00 00Plant rolls 1 <1* 0 00 00 00 00 00Burlap bundles 33 136 10 124* 00 00 6 64*Single stems 0 0 6 136* 00 00 00 00
I Dec 1987
Mats 0 0 100 315 35 162 60 228Multiple stems 10 233 100 337 35 80 0 0Plant rolls 33 233 0 0 0 0 0 0Burlap bundles 75 322 40 315* 0 0 15 228*Single stems 0 0 8 315* 2 160* 0 0
Floating tires 90 308
Fixed tires 25 275
* Plants were present, but coverage was due to encroachment from another
treatment.
Bll
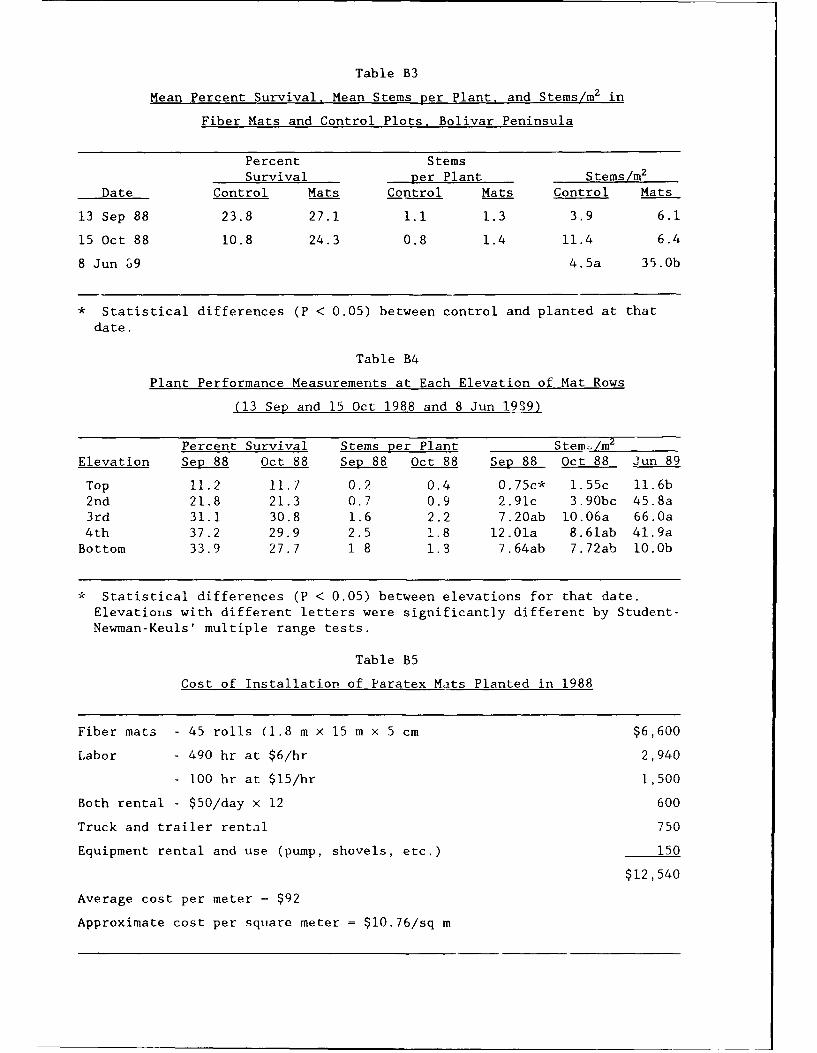
Table B3
Mean Percent Survival, Mean Stems per Plant, and Stems/m 2 in
Fiber Mats and Control Plots, Bolivar Peninsula
Percent StemsSurvival per Plant Stems/m2
Date Control Mats Control Mats Control Mats
13 Sep 88 23.8 27.1 I.1 1.3 3.9 6.1
15 Oct 88 10.8 24.3 0.8 1.4 11.4 6.4
8 Jun 39 4.5a 35.Ob
* Statistical differences (P < 0.05) between control and planted at that
date.
Table B4
Plant Performance Measurements at Each Elevation of Mat Rows
(13 Sep and 15 Oct 1988 and 8 Jun 19S9)
Percent Survival Stems per Plant Stem/m 2
Elevation Sep 88 Oct 88 Sep 88 Oct 88 Sep 88 Oct 88 Jun 89
Top 11.2 11.7 0.2 0.4 0.75c* 1.55c l1.6b2nd 21.8 21.3 0.7 0.9 2.91c 3.90bc 45.8a3rd 31.1 30.8 1.6 2.2 7.20ab l0.06a 66.Oa4th 37.2 29.9 2.5 1.8 12.01a 8.61ab 41.9a
Bottom 33.9 27.7 1 8 1.3 7.64ab 7.72ab l0.Ob
* Statistical differences (P < 0.05) between elevations for that date.
Elevations with different letters were significantly different by Student-Newman-Keuls' multiple range tests.
Table B5
Cost of Installation of Paratex Mats Planted in 1988
Fiber mats - 45 rolls (1.8 m x 15 m x 5 cm $6,600
Labor - 490 hr at $6/hr 2,940
- 100 hr at $15/hr 1,500
Both rental - $50/day x 12 600
Truck and trailer rental 750
Equipment rental and use (pump, shovels, etc.) 150
$12,540
Average cost per meter = $92
Approximate cost per square meter = $10.76/sq m

Figure BI. Fan-shaped plumes of dredged material typical ofunconfined dist,osal operations in the Gulf Intracoastal
Waterway at Bolivar Peninsula, Texas
Figure B2. Salt marsh developed in 1976-77 from use of alarge sandbag breakwater. Photo shows marsh about
4 years after development
B13
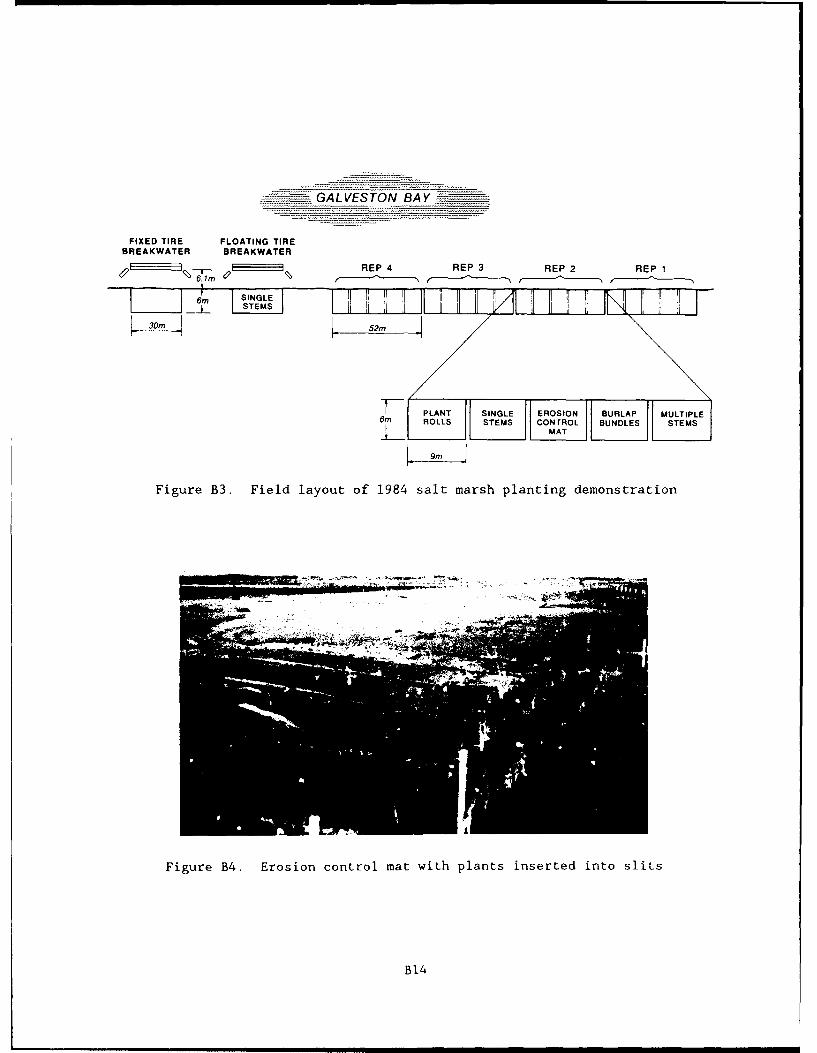
GALVESTON BAY _ _
FIXED TIRE FLOATING TIREBREAKWATER BREAKWATER
e F -- % REP 4 REP 3 REP 2 REP I
6m SINGLE II ,o .i ISTEMS L
3m52m - ,
FT PAN SINGLE EROSION BULP MULTIPLE6m ROL STEMS CONTROL BNLS STEMS
MAT
Figure B3. Field layout of 1984 salt marsh planting demonstration
Figure B4. Erosion control mat with plants inserted into slits
B14
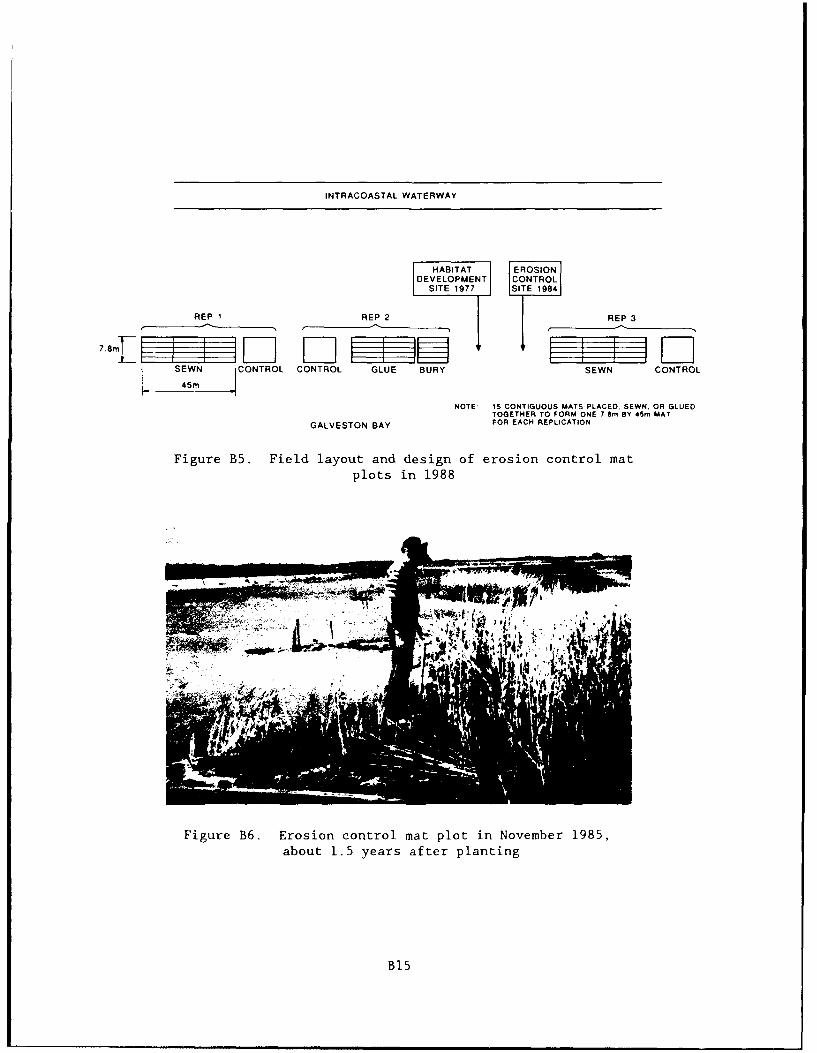
INTRACOASTAL WATERWAY
HABITAT EROSIONDEVELOPMENT CONTROL
SITE 1977 SITE 1984
REP I REP 2 REP 3
o78 m E II-- I-] . . .SEWN CONTROL CONTROL GLUE BURY SEWN CONTROL
45m
NOTE 15 CONTIGUOUS MATS PLACED. SEWN. OR GLUEDTOGETHER TO FORM ONE 7 Sm BY 45m MAT
GALVESTON BAY FOR EACH REPLICATION
Figure B5. Field layout and design of erosion control matplots in 1988
Figure B6. Erosion control mat plot in November 1985,
about 1.5 years after planting
B15
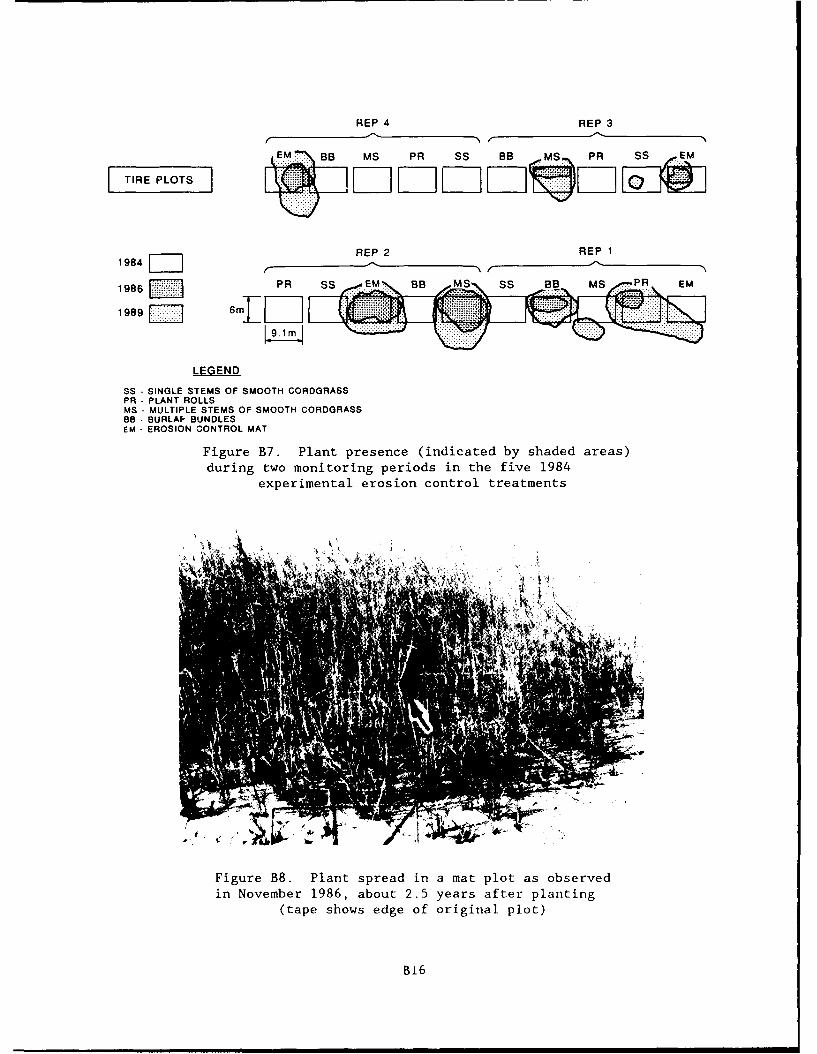
REP 4 REP 3
M.. \B VS PR SS BBI MVS PR 55 E
TfILOTSI ~ I ZDL ~
REP 2 REP 1
1986~ ~~ PR 55 EM'- BB MS SS BB MS ,-PR EM
1989 6 M
LEGEND
SS - SINGLE STEMS OF SMOOTH CORDGRASSPR - PLANT ROLLSMS - MULTIPLE STEMS OF SMOOTH CORDGRASSBB- BURLAP BUNDLESEM - EROSION CONTROL MAT
Figure B7. Plant presence (indicated by shaded areas)
during two monitoring periods in the five 1984
experimental erosion control treatments
~i
Figure B8. Plant spread in a mat plot as observedin November 1986, about 2.5 years after planting
(tape shows edge of original plot)
B16
Figure B9. Erosion control mat as observed onI December 1987, about 3.5 years after
planting
B17
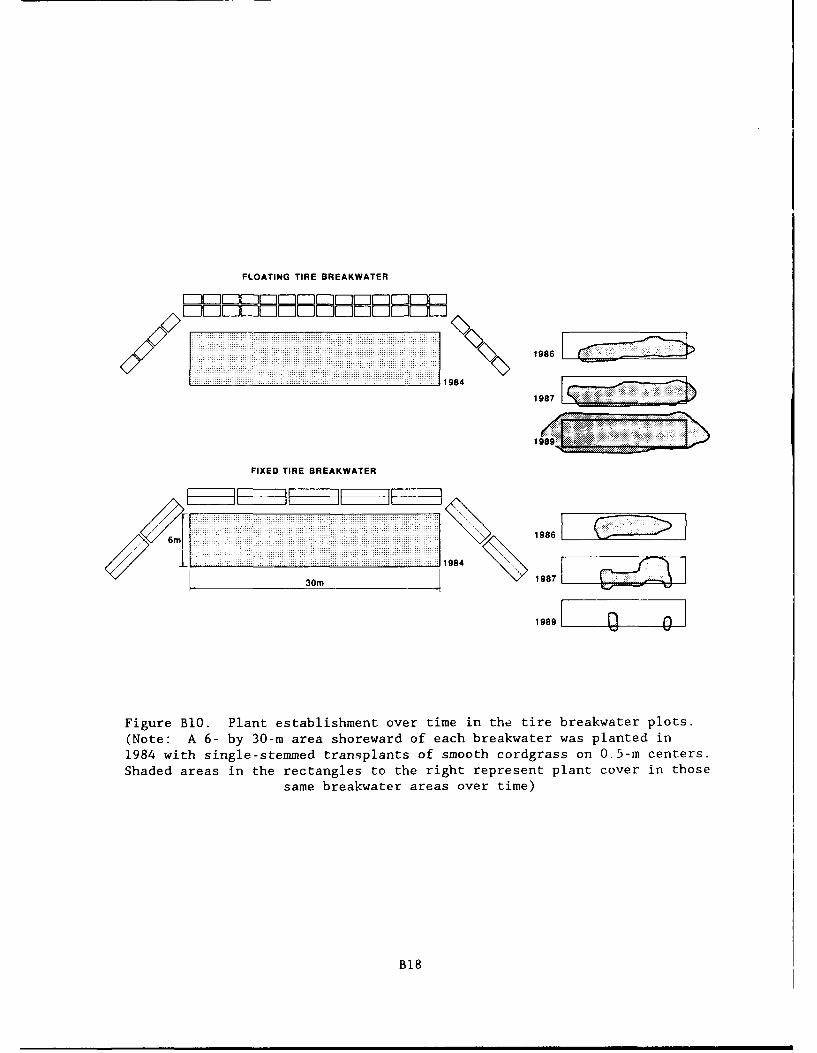
FLOATING TIRE BREAKWATER
1987
1984198 9
FIXED TIRE BREAKWATER
6m 1986L 1 130m 1987
1989 Z~~1I
Figure B10. Plant establishment over time in the tire breakwater plots.(Note: A 6- by 30-m area shoreward of each breakwater was planted in1984 with single-stemmed transplants of smooth cordgrass on 0.5-m centers.Shaded areas in the rectangles to the right represent plant cover in those
same breakwater areas over time)
B18
Figure BIl. Floating tire breakwater area as observedin November 1986, about 2.5 years after planting
B19