guidelines for benchmarking airports -...
TRANSCRIPT
strategictransportation
& tourismsolutions
Guidelines for Benchmarking Airports
Dr. Michael Tretheway Sauder School of Business, Univ of British Columbia
& Ian Kincaid InterVISTAS Consulting Inc.20 November 2009

1
Font Sizes
Headings: 36 points, Arial• Level 1 bullets: 32 points, bold
• Level 2 bullets: 28 points • Level 3 bullets: 24 points

2
Font Sizes
There is a reason why many societies have evolved cultures where the elders sit at the front of the room

3
Overview
A major focus of the paper is on different purposes for benchmarking
• And how this guides the choice of methodology for benchmarking

4
Overview
Issues associated with benchmarking:• Availability and quality of data
• Adjusting the data to provide meaningful comparisons
• Residual benchmarking, with reference to the ATRS study

5
Uses of Benchmarking
Assess managerial or firm performance
Price regulation
National policy assessment
Collaborative benchmarking

6
TO Make Best Use of Limited Time
I will focus on two key issues
• #1 – the role of the airport in the aviation value chain
• And what this means for airport benchmarking
• #2 – some issues in the ATRS benchmarking measure

7
Airport in the Value Chain

8
Airports in Aviation Value Chain
Airport services are an input into the airline production function• KLEM/KLES models of production
• Capital, labour, energy, materials (manufacturing)
• Capital, labour, energy, outside services (services)
• Airport services• Conceptually could be vertically integrated with airline
• One of the largest outside services for an airline
• Is a service which has major impact on other airline inputs

9
Airports in Aviation Value Chain
Airport services are an input into the airline production functionProduction can be modelled by:• Production function • Dual Cost function
• With our without the cost share equations(input demand equations)
• Total Factor Productivity function • With certain restrictions, TFP and Cost function
equivalence • Reveals a subset of parameters of production
10
Airports in Aviation Value Chain
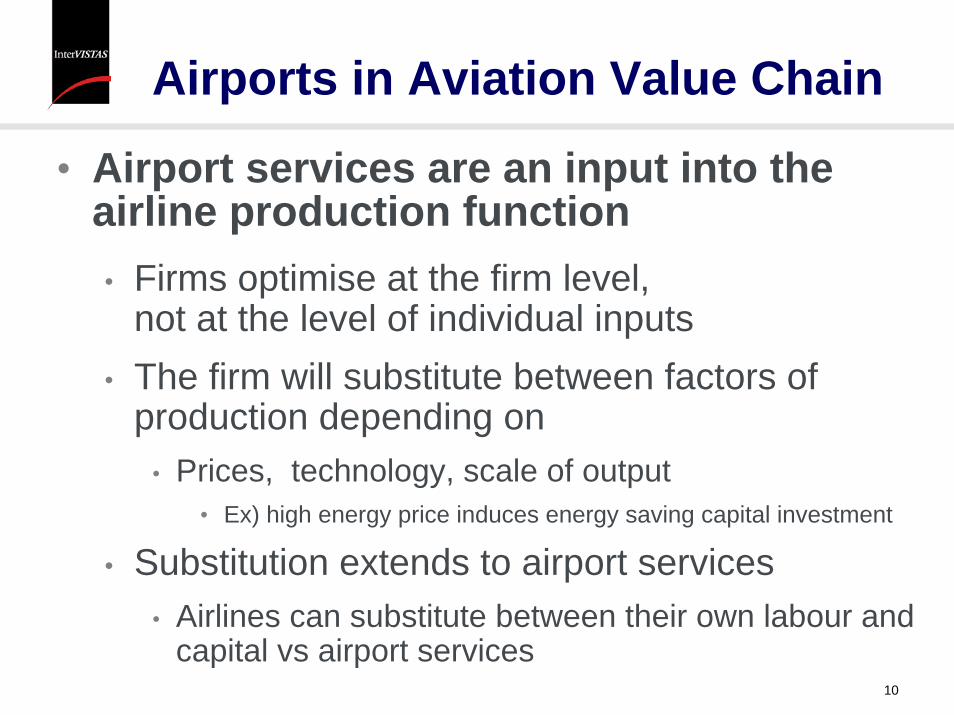
• Airport services are an input into the airline production function• Firms optimise at the firm level,
not at the level of individual inputs• The firm will substitute between factors of
production depending on • Prices, technology, scale of output
• Ex) high energy price induces energy saving capital investment
• Substitution extends to airport services• Airlines can substitute between their own labour and
capital vs airport services

11
Airports in Aviation Value Chain
• Airport services are an input into the airline production function• Substitution extends to airport services
• Airlines can substitute between their own labour and capital vs. airport services
• Example:• Congested airport requires more airline labour and
capital• Airline may be willing to substitute higher airport
resource (which produces less congestion) in order to reduce other airline costs
• It will optimise the balance between KLE and M/S

12
Airports in Aviation Value Chain
Airport services are an input into the airline production function• Example:
Airport A – average 20 minutes delay • Lower airport capital
Lower airport charges
• Will be found to be an efficient airport • For a given level of airport output it uses fewer inputs than airport B
13
Airports in Aviation Value Chain
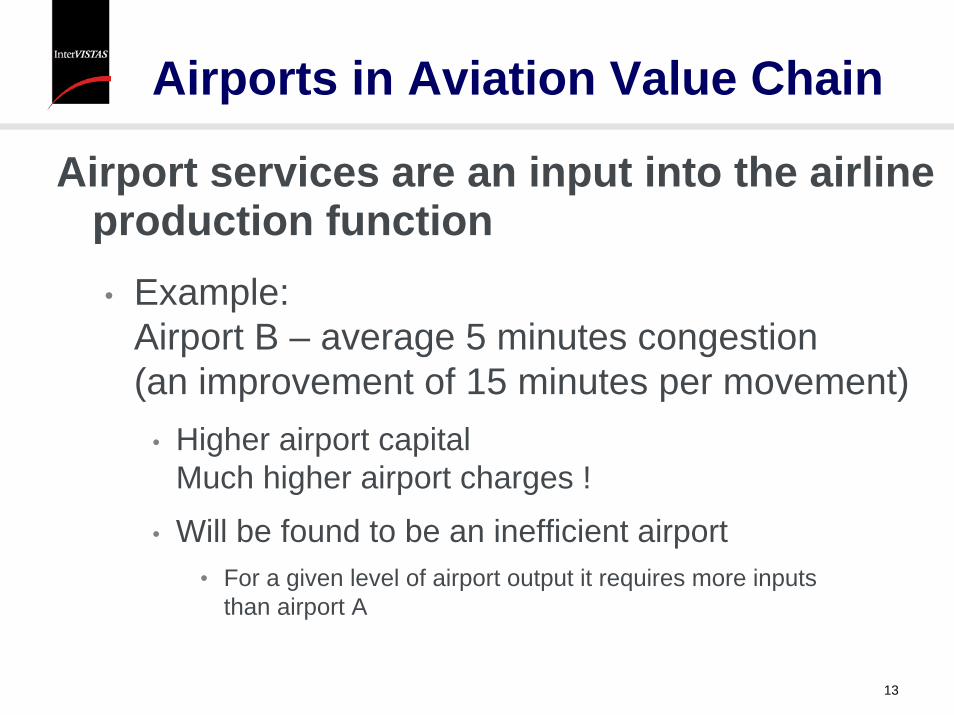
Airport services are an input into the airline production function• Example:
Airport B – average 5 minutes congestion(an improvement of 15 minutes per movement)
• Higher airport capitalMuch higher airport charges !
• Will be found to be an inefficient airport • For a given level of airport output it requires more inputs
than airport A

14
Airports in Aviation Value Chain
Airport services are an input into the airline production function• Impact of Airport B on airline
• Hub airline• 1000 flights per day
• Reducing 15 minute delay per aircraft:• Saves 90,000 block hours per annum
• Equivalent to adding 40 aircraft to fleetor reducing fleet by 40 aircraft
• Annual savings of $350 million (annual capital and operating expense)

15
Airports in Aviation Value Chain
Airport services are an input into the airline production function• How do we deal with this?
• As in any industry, we can model via • quality of output, or
production of externalities
• Because airport congestion is so critical to the production and costs of airlines
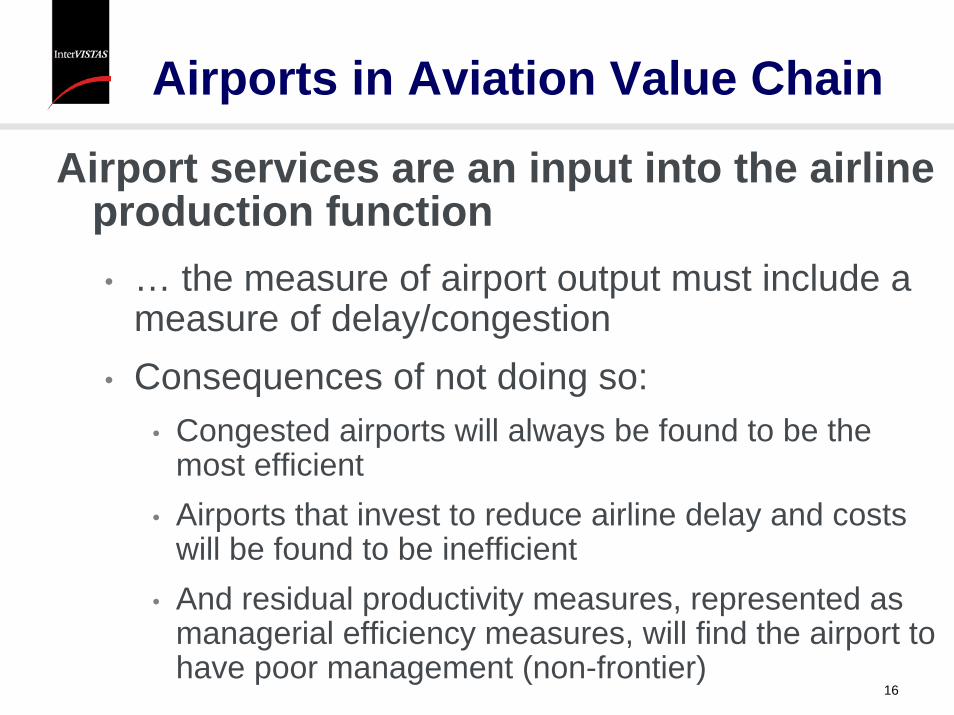
• … the measure of airport output must include a measure of delay/congestion
16
Airports in Aviation Value Chain
Airport services are an input into the airline production function• … the measure of airport output must include a
measure of delay/congestion • Consequences of not doing so:
• Congested airports will always be found to be the most efficient
• Airports that invest to reduce airline delay and costs will be found to be inefficient
• And residual productivity measures, represented as managerial efficiency measures, will find the airport to have poor management (non-frontier)

17
Airports in Aviation Value Chain
Airport services are an input into the airline production function
• What about airport profit maximisation• Profit maximising airports will optimise
• Costs of investment (and operations) to expand capacity
• Willingness to pay of its airline customers for higher quality output
• The level of output that will materialise• At the higher prices
• At the higher quality

18
Airports in Aviation Value Chain
Airport services are an input into the airline production function
• What about non-profit airport • Depends on its “objects” in letters patent
• Economists are often lazy in not inspecting the charter objects of non-profit organisations
• A personal observation• Most non-profit airports are strongly motivated to
reduce congestion
• Congestion is perceived as an organisational failure

19
Airports in Aviation Value Chain
Airport services are an input into the airline production function
• Key point:
• … Airports cannot be benchmarked• Either for managerial purposes
• Or for social welfare maximisation
• Unless congestion/delay is somehow included in the measurement of airport output

20
Airports in Aviation Value Chain
Airport services are an input into the airline production function
• How to measure delay • a) US and some other airports report delay
statistics• b) most airport master plans report delay
statistics• Interpolate between measurements based on traffic
• c) survey of airline dispatchers• Ask to rate airports on 5 point scale
• Would be a major step ahead

21
ATRS

22
ATRS
Peter Drucker:
• “That which is measured, Improves”
• You can’t manage what you don’t measure”

23
ATRS
Mike Tretheway
• “That which is measured incorrectly, never improves”
24
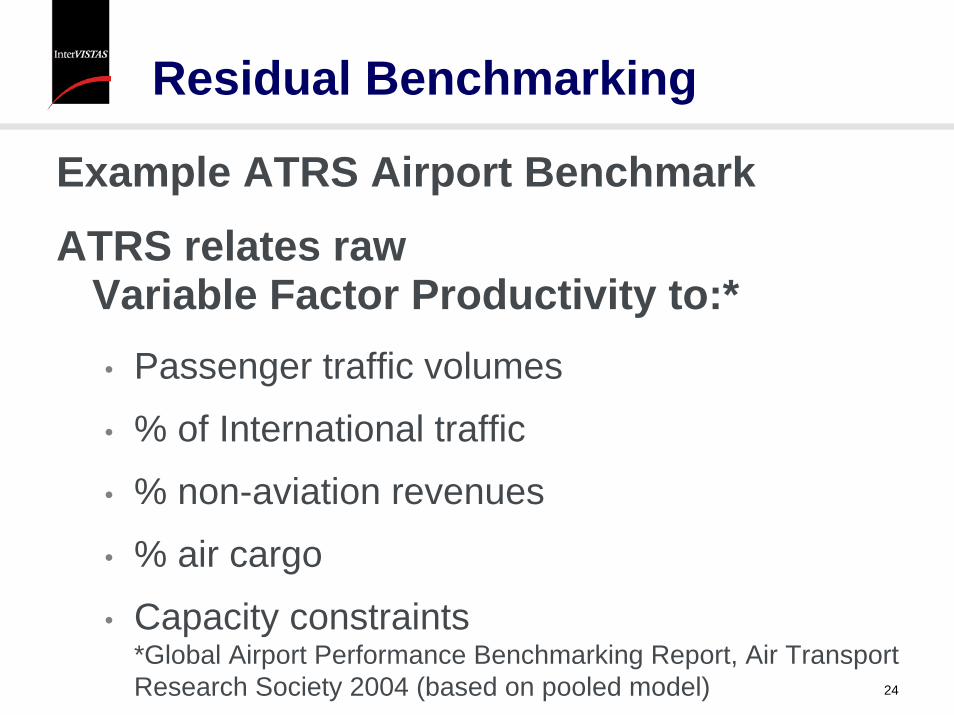
Residual Benchmarking
Example ATRS Airport Benchmark
ATRS relates raw Variable Factor Productivity to:*• Passenger traffic volumes
• % of International traffic
• % non-aviation revenues
• % air cargo
• Capacity constraints*Global Airport Performance Benchmarking Report, Air Transport Research Society 2004 (based on pooled model)

25
ATRS: VFP Regressions
The ATRS study includes computation of residual productivity
• Based on VFP • (variable factor productivity)
• Residual productivity computed• Based on regressions of VFP
• Residual from regression is put forward as a measure of managerial efficiency

26
ATRS VFP regressions
ATRS regressions are incompatible with economic theory
• Total Cost Function• Total Cost = f( output, input prices,
time/technology, other dimensions)• Assumes firm is in long run equilibrium
• Alternative: TFP regression• A Cobb-Douglass TFP equation is equivalent to a
Cobb-Douglass total cost function

27
ATRS VFP regressions
Neoclassical theory
• Variable Cost Function• Variable Cost = f( output,
input prices of variable inputs,level of capital stock, time/technology, other dimensions)
• Does not assume firm is in long run equilibrium

28
ATRS VFP regressions
Neoclassical theory
• Variable Cost Function• VCF must include the level of capital stock
• Unless technology is separable between capital and variable inputs
• This is unlikely, and has not been found in empirical studies of a wide range of industries
• A VCF which excludes the level of capital has no economic interpretation
• NO ECONOMIC INTERPRETATION !

29
ATRS VFP regressions
Neoclassical theory
• Variable Cost Function• VCF must include the level of capital stock
• The lack of capital data does not justify use of VFP (or soft factor productivity)

30
ATRS VFP regressions
VFP regressions• A VFP regression which excludes
the level of capital• Is incompatible with the neoclassical theory of
the firm• Has no economic interpretation• Is likely to produce non-robust results• Is dangerous
• For management• For policy making

31
Residual Benchmarking
The ATRS results do not appear to be robust, e.g., economies of scale:
Newark Airport (EWR)• goes from 4th most productive airport in 2002 • to 2nd worst by 2004
StudyYear
Elasticity of Productivitywith respect to Airport Size
2002 0.352003 .15
.162004 -.18*
*Based on pooled data

32
ATRS VFP regressions
Is it possible to measure airport capital stock?
• Yes• But it may require considerable work
by the economist• Don’t blame airport accountants!
• Method • Christensen-Jorgenson perpetual inventory • Must gather airport investment from range of
sources (financial stmts, AIP/AIF accounts, …)

strategictransportation
& tourismsolutions
Thank You
www.InterVISTAS.com

34
Managerial Performance
Has been used to assess various aspects of airport performance:• Pricing
• Service quality/customer satisfaction
• Unit cost
• Productivity/efficiency (TFP/VFP)
Can also be used to assess specific services:• Ground handling
• Cargo services
• Retail (e.g., vs High Street)

35
Collaborative Benchmarking
Voluntary participation of a group of airports
Examples - learning processes:• IATA Customer Satisfaction (AETRA)
• CAC Small Airports (customer satisfaction)• Conducted by InterVISTAS Consulting
• EUROCONTROL (delays, cost, safety)

36
Collaborative Benchmarking
Voluntary participation of a group of airports
Some use for promotion:• E.g., Number 1 Airport in the World /
North America / Europe, etc.
• Highest score on Question 17b

37
Price regulation
Has potential to overcome information asymmetry issues
Examples:• Irish Airports - used in determination
of the X-Value for price cap regulation of Dublin, Cork, Shannon
• Also has been used in price regulation of electricity in Canada, UK, Chile, Sweden, …

38
Price regulation
Has potential to overcome information asymmetry issues
Critically Important:• Data quality, performance indicators,
comparators
• can make millions of dollars difference

39
National policy
Benchmarking can be used to inform policy, for example:• Australia International Benchmarking (1995)
• Covered utilities, rail, road, aviation, ports
• Impact was largely indirect (informing the debate)

40
National policy
Benchmarking can be used to assess policy changes:• North American rail (Canada vs. U.S.)
• Canada enacted reforms before U.S.
• Canadian success with regulatory reform became basis for US Staggars Act (1980)

41
Summary TablePurpose Types of Measure Level of
AggregationComparators
Assessperformance
Price Customer satisfaction Service quality Unit cost Efficiency
(TFP, VFP, etc)
Airport orindividualservices
Best in class Natural competitors
Collaborativebenchmarking
Price Customer satisfaction Service quality Unit cost Efficiency
(TFP, VFP, etc.)
Airport orindividualservices
Other group members
Priceregulation
Efficiency (TFP, VFP,etc.)
Airport Best in class or similar peer airports
Assess policy Price Service quality Unit cost Efficiency
(TFP, VFP, etc.) Investment Throughput or take-up
National orairport
To inform policy: Best in class Competitor countries Countries that have enact
major policy reform
To assess policy outcomes: Control group of counties that have not enacted
policy change

42
Issues in Benchmarking Airports
Availability and quality of data
Adjusting data to provide meaningful comparisons
Use of residual benchmarking, with reference to the ATRS study

43
Availability/Quality of Data
Differing reporting standards around the world:• Private and not-for-profit airports publish detailed
financial accounts
• Public sector airports may report very little data (buried in govt. accounts)
Differing accounting practices:• U.S. PFCs vs. Canadian AIFs
• Depreciation of infrastructure e.g. BAA runways = 100 years
• Can be adjusted but requires detailed data

44
Availability/Quality of Data
Lack of national airport statistics available from government or associations
Not the case in all transport sectors:• U.S. airline data is very comprehensive
• North America rail statistics
This type of data would be highly valuable for national policy benchmarking in particular

45
Adjusting the data
Need to understand the true causes for observed differences in performance:• Managerial or policy performance?
• Data inconsistencies?
• External factors outside control of managerial (or policy maker)?

46
Adjusting the data
Various factors can impact benchmarking comparisons:• Degree of outsourcing• Weather• Government subsidy/assistance• Traffic mix• Capacity constraints• Cost of living• Service quality• Economies of scale• Congestion

47
Adjusting the data
TRL approach:(Airport Performance Indicators)• Based on a core set of activities - runways, terminals and
retail / food&beverage• Strip out non-core activities such as baggage handling,
parking, other non-aviation activities• Requires judgement and detailed data• Some factors hard to adjust for
(e.g., economies of scale, traffic mix)• Could be handled by selection of comparators
Not always necessary to adjust• Economies of scale could be a policy objective

48
Residual Benchmarking
Another approach to control for differences
Econometric/statistical analysis of indicators
In general, residual benchmarking can be useful but has limitations:• Can be biased by incorrect specification or
selection of “external” factors
• Can be distorted by the selection of sample airports/countries in the study (true of benchmarking in general)

49
Residual Benchmarking
Explanation given for 2004 results:• Economies of scales exhausted in North
American and European airports (in just one year!)
• More likely explanation is that there are problems with data or specification
Other coefficients also unstable year-on-year, e.g., % cargo
Results are specious and should be treated with caution or disregarded

50
Other Issues with ATRS
Does not provide access to data• for scientific verification
ATRS conclusion• statistical results specious
• data unavailable, results cannot be replicated
• does not meet a scientific standard at this time

51
Conclusion
Is benchmarking with limitations better than no benchmarking?• Certainly not without value: can identify best practice,
spur competition and shake up conventional thinking• Also, depends on the use:
• Price regulation requires a high degree of accuracy
• In policy analysis, an imprecise measure giving scale and direction may be sufficient
• Benchmarking can be an effective decision-aid tool but users should be aware of the limitations and the analysis must demonstrate sufficient robustness