guide to quantitative portfolios (qps) · quantitative portfolios, or qps, are single investment...
TRANSCRIPT
Guide to Quantitative Portfolios (QPs)Beyond BetaTM
2 Guide to PMC Quantitative Portfolios
What are Quantitative Portfolios?Quantitative Portfolios, or QPs, are single investment strategies that combine the low-cost and easy access to important drivers of investment return with the customization and tax-efficiency of separately managed accounts (SMAs). There are two varieties of QPs: “Market Series” portfolios are designed to provide beta exposure through tracking well-known market capitalization-weighted indexes. Market QPs can deliver improved after-tax results and added customization of holdings. The “Factor-Enhanced Series” QPs are constructed to deliver exposure to well-known asset pricing factors—such as value and momentum—that financial research has identified as historically generating excess returns.
Key AttributesBecause the investor owns the underlying securities and the associated tax lots, the SMA structure of QPs enables them to provide four primary features:• Cost-efficient exposure to primary drivers of
investment return or excess return• Potential “tax-management alpha”• Ability to customize the portfolio• Exclusive sourcing through independent
advisors
These features can enable an advisor to reduce the impact of tax liabilities for clients, potentially enhance both pre- and after-tax performance, and allow for customized portfolio holdings and tax management.
QPs are available in several formats. The Market Portfolios are offered in a UMA sleeve and three SMA versions: Beta, Tax-Optimized and Custom Tax-Optimized (used primarily in tax-transitions situations). Each of these will be discussed later. The Factor-Enhanced Portfolios are offered in a traditional SMA format.
Cost-Efficient Exposure to Primary Drivers of Investment Return or Excess Return
Factors Driving Stock ReturnsFor several decades, financial researchers have worked to identify the key factors explaining the returns on stocks. One of the earliest results of those efforts, of course, was the Capital Asset Pricing Model (CAPM), the development of which Jack Treynor, Nobel laureate William Sharpe and John Lintner made significant contributions. The CAPM is a so-called single factor model, as it holds that a stock’s return can be explained solely by its relationship, or beta, to the market’s return.
Since the introduction of the CAPM, researchers have focused on identifying factors generating higher expected returns than the market’s return. Factors—also frequently referred to as “dimensions” or “style premia”—are generally considered to be a proxy for a common source of risk, and are typically classified in categories such as statistical, macroeconomic and fundamental. There have been several hundred factors that have been identified. Some of the most well-known of these factors include market capitalization, value, momentum and liquidity. Despite the vast number of factors researchers have tested over the years, Harvey et al (2014) suggest that only a handful—such as value, momentum and liquidity—remain statistically significant over time1.
1 Harvey, Campbell R. and Liu, Yan and Zhu, Heqing (2014). “…and the Cross-Section of Expected Returns,” available at SSRN: http://ssrn.com/abstract=2249314 or http://dx.doi.org/10.2139/ssrn.2249314.
Guide to PMC Quantitative Portfolios 3
Market Series: Efficient and Customizable Exposure to the Market
QPs Can Provide an Attractive SMA Alternative to ETFsAs it has for decades, the debate as to whether active management can consistently add value over a passive, or indexed, portfolio is sure to continue. Some point to the long-term record of success of active managers such as Warren Buffett and others in arguing that active management adds value. Conversely, staunch
proponents of indexing generally agree with Nobel Laureate William Sharpe, who wrote in an oft-cited paper: “Properly measured, the average actively managed dollar must underperform the average passively managed dollar, net of costs. Empirical analyses that appear to refute this principle are guilty of improper measurement.”2 Other research notes that investing is a zero-sum game where, in aggregate, investors will obtain market performance gross of fees, and that there are very few active managers who possess the skill to consistently outperform the market.3 Yet others
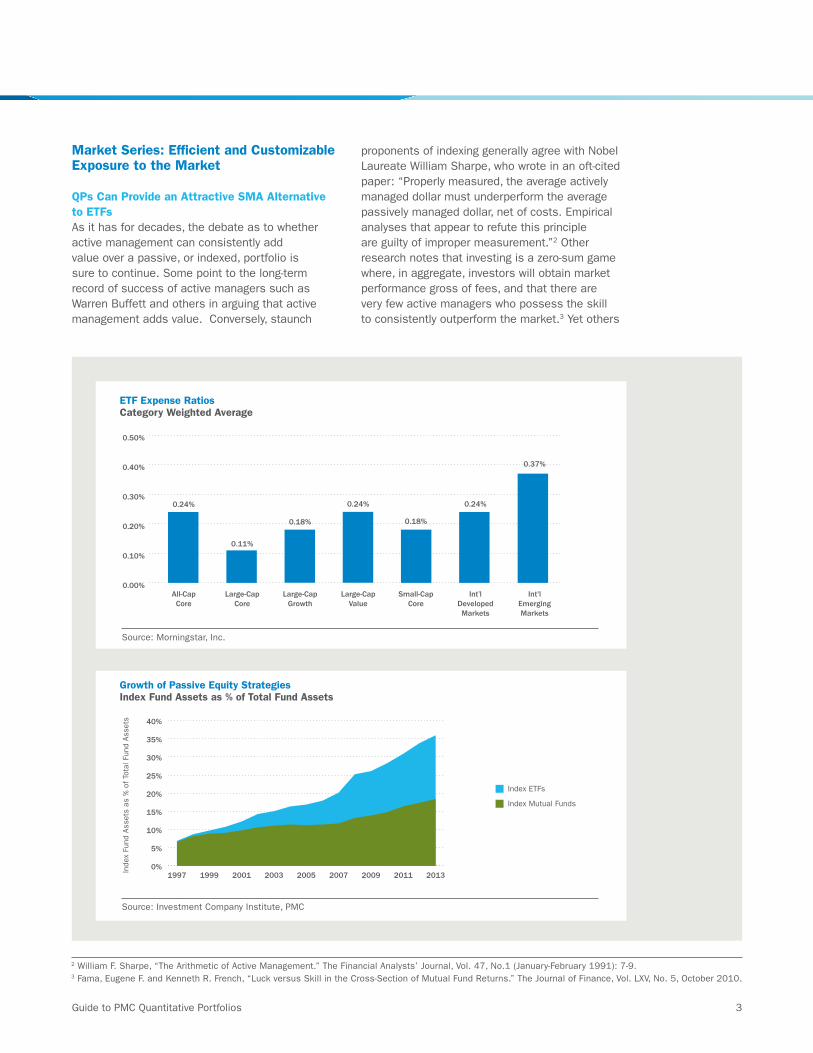
Growth of Passive Equity StrategiesIndex Fund Assets as % of Total Fund Assets
ETF Expense RatiosCategory Weighted Average
2 William F. Sharpe, “The Arithmetic of Active Management.” The Financial Analysts’ Journal, Vol. 47, No.1 (January-February 1991): 7-9.3 Fama, Eugene F. and Kenneth R. French, “Luck versus Skill in the Cross-Section of Mutual Fund Returns.” The Journal of Finance, Vol. LXV, No. 5, October 2010.
0.00%
0.10%
0.20%
0.30%
0.40%
0.50%
All-CapCore
0.24%
Large-CapCore
0.11%
Large-CapGrowth
0.18%
Large-CapValue
0.24%
Small-CapCore
0.18%
Int’lDevelopedMarkets
0.24%
Int'lEmergingMarkets
0.37%
Index ETFs
Index Mutual Funds
Inde
x Fu
nd A
sset
s as
% o
f To
tal F
und
Asse
ts
0%
5%
10%
15%
20%
25%
30%
35%
40%
201320112009200720052003200119991997
Source: Investment Company Institute, PMC
Source: Morningstar, Inc.
4 Guide to PMC Quantitative Portfolios
believe that a “core-satellite” strategy is best, whereby a passive approach is used for a portion of the portfolio—perhaps the large-cap allocation—and an active approach is employed for asset classes deemed less efficient, such as small-cap.
In general, passive portfolios are used by investors who are seeking to obtain exposure to the asset class represented by the underlying index. Historically, indices used for tracking purposes have been the well-known, broad-based benchmarks such as the S&P 500 and Russell indices favored by institutional investors. Over the past several years, however, there has been substantial growth in indices providing exposure to fundamental and other niche factors that investors may wish to target, such as dividend growth opportunities and stock buyback situations.
Implementing Beta StrategiesOnce the decision to employ a passive approach, whether in whole or in part, has been made, investors have a limited number of options when implementing. Institutional investors such as pension plans have often hired managers to
construct and manage indexed portfolios in a separate account structure. Individual investors have generally implemented a passive approach through the use of either index exchange-traded funds (ETFs) or open-end index funds.
But employing a passive approach through an SMA structure may be a superior alternative for individual investors when compared to ETFs or open-end funds for several reasons: cost structures of passive SMAs can be extremely competitive with ETFs, and since SMAs hold individual tickers, tax-management and portfolio composition can be customized to client needs. In addition, the concentrated nature of QPs allows for minimum investment amounts of as low as $60,000, making them useful either as sleeves in Unified Managed Accounts (UMAs) or as standalone SMAs.
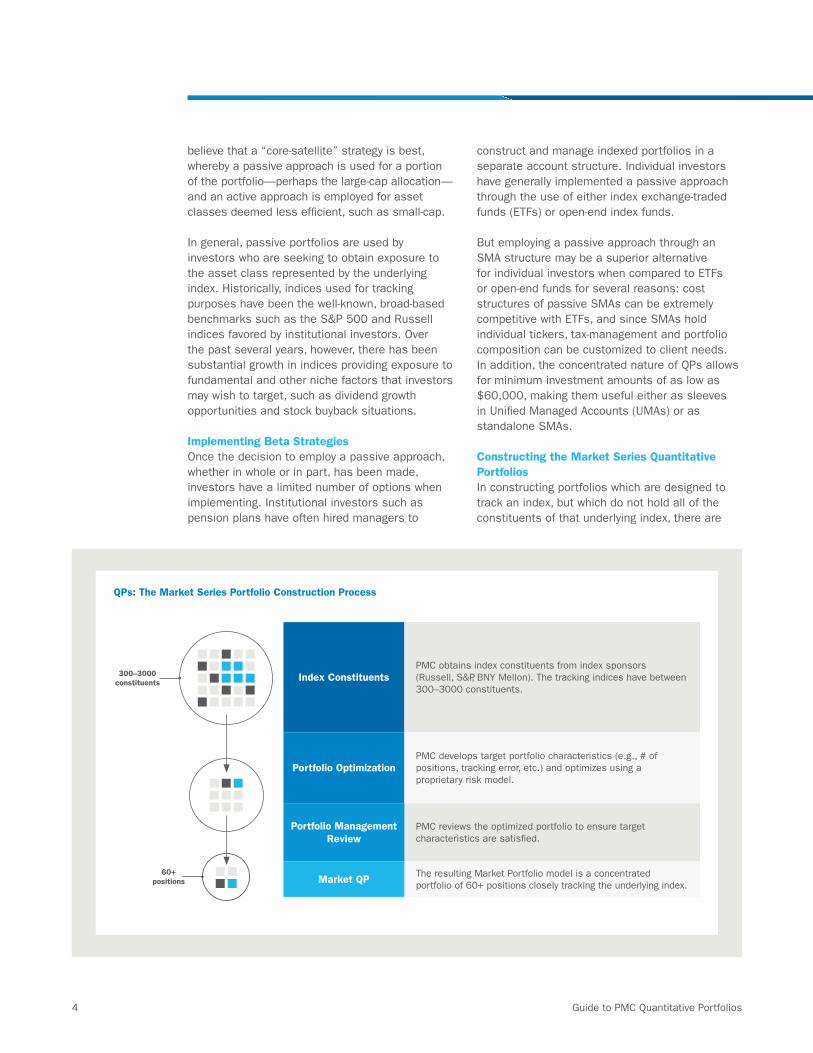
Constructing the Market Series Quantitative PortfoliosIn constructing portfolios which are designed to track an index, but which do not hold all of the constituents of that underlying index, there are
QPs: The Market Series Portfolio Construction Process
60+ positions
300–3000 constituents Index Constituents
PMC obtains index constituents from index sponsors (Russell, S&P, BNY Mellon). The tracking indices have between 300–3000 constituents.
Portfolio OptimizationPMC develops target portfolio characteristics (e.g., # of positions, tracking error, etc.) and optimizes using a proprietary risk model.
Portfolio Management Review
PMC reviews the optimized portfolio to ensure target characteristics are satisfied.
Market QP The resulting Market Portfolio model is a concentrated portfolio of 60+ positions closely tracking the underlying index.
Guide to PMC Quantitative Portfolios 5
several factors that need to be considered. First, an appropriate tracking index must be selected. Ideally, the index should provide comprehensive exposure to the desired asset class or factors. S&P and Russell indices are frequently used for domestic equities because of their wide acceptance as benchmarks for institutional portfolios. For international exposures there are two primary options: indices tracking either foreign ordinary shares or American Depositary Receipts (ADRs). For domestic individual investors, ADR indices are often used because of lower administrative and execution costs.4
Second, if minimizing portfolio turnover is a goal, selecting a benchmark which is rebalanced or reconstituted less frequently would be preferable. Certain index families are reconstituted once per year, while others will be rebalanced more frequently.
Third, the various portfolio mandates or constraints must be established. For example, the construction process should balance the desired level of tracking error5 with any limits on number of holdings or target account size. As the allowable number of holdings and account size increases, more of the tracking index’s constituents can be held in the portfolio, making it easier to reduce the tracking error. The target level of tracking error is generally in the range of less than 0.50% to 2%, depending on the asset class and the desired number of holdings in the portfolio.
Finally, a quantitative risk model is employed to develop a concentrated portfolio that is designed to track the underlying index. The risk model identifies the factor exposures of the index’s constituent securities, and then matches the aggregate exposures of the portfolio with that of the benchmark while remaining within the tracking error and holdings constraints.
Factor-Enhanced Portfolios: Providing Exposure to Factors Producing Excess Returns
QPs with the Potential for Outperforming the BenchmarkWhen applied to investing, a factor is generally considered to be a characteristic common to a group of stocks that helps to explain the risk and return of that group. As mentioned above, there are certain factors that financial research has shown persistently generate a significant excess return, or a risk premium, over a market capitalization-weighted index. Factor investing is the systematic process by which these risk premia are captured in the portfolio construction process. Within the QP family, the Factor-Enhanced Portfolios are constructed to provide exposures to the factors that have historically proven to generate excess returns.
Over the past few decades, researchers have identified and tested several hundred factors that have been claimed to generate excess returns. In
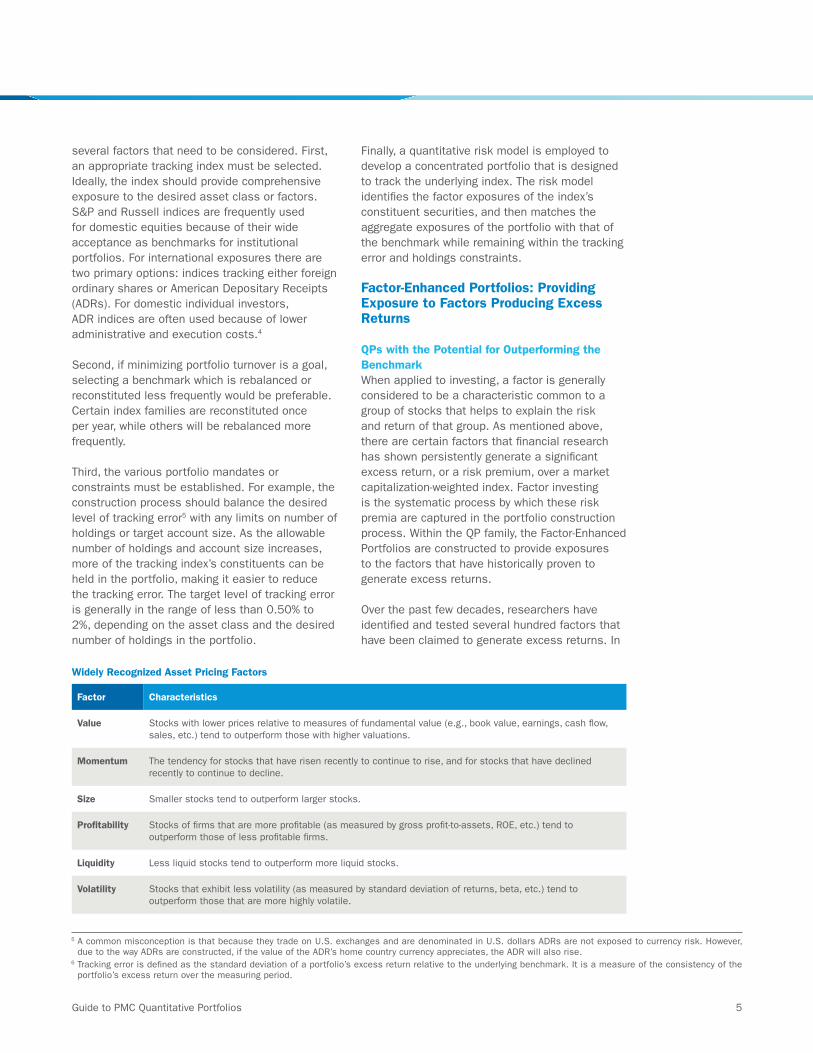
Widely Recognized Asset Pricing Factors
Factor Characteristics
Value Stocks with lower prices relative to measures of fundamental value (e.g., book value, earnings, cash flow, sales, etc.) tend to outperform those with higher valuations.
Momentum The tendency for stocks that have risen recently to continue to rise, and for stocks that have declined recently to continue to decline.
Size Smaller stocks tend to outperform larger stocks.
Profitability Stocks of firms that are more profitable (as measured by gross profit-to-assets, ROE, etc.) tend to outperform those of less profitable firms.
Liquidity Less liquid stocks tend to outperform more liquid stocks.
Volatility Stocks that exhibit less volatility (as measured by standard deviation of returns, beta, etc.) tend to outperform those that are more highly volatile.
5 A common misconception is that because they trade on U.S. exchanges and are denominated in U.S. dollars ADRs are not exposed to currency risk. However, due to the way ADRs are constructed, if the value of the ADR’s home country currency appreciates, the ADR will also rise.
6 Tracking error is defined as the standard deviation of a portfolio’s excess return relative to the underlying benchmark. It is a measure of the consistency of the portfolio’s excess return over the measuring period.
6 Guide to PMC Quantitative Portfolios
a series of seminal papers in the 1990s, Eugene Fama and Kenneth French set forth a model for U.S. equity returns consisting of three factors: (1) a “market” factor (as represented by the market’s excess return); (2) a “value” factor (measured by the ratio of book value-to-market price); and (3) a “size” factor (measured by market capitalization). A fourth factor—momentum (the tendency of a stock’s recent performance trend to continue)—was added based on the work of Carhart6 and Jegadeesh and Titman7. The resulting model is now widely referred to as the “Fama-French four-factor model.” The nearby table provides a short description of some of the most well-known of the factors identified by researchers.
Each of the three non-market factors—value, momentum and size—comprising the Fama-French model generate risk premia—persistent excess risk-adjusted returns over long periods of time. The implication for investors is that embedding these factors in the portfolio construction process can improve risk-adjusted returns.
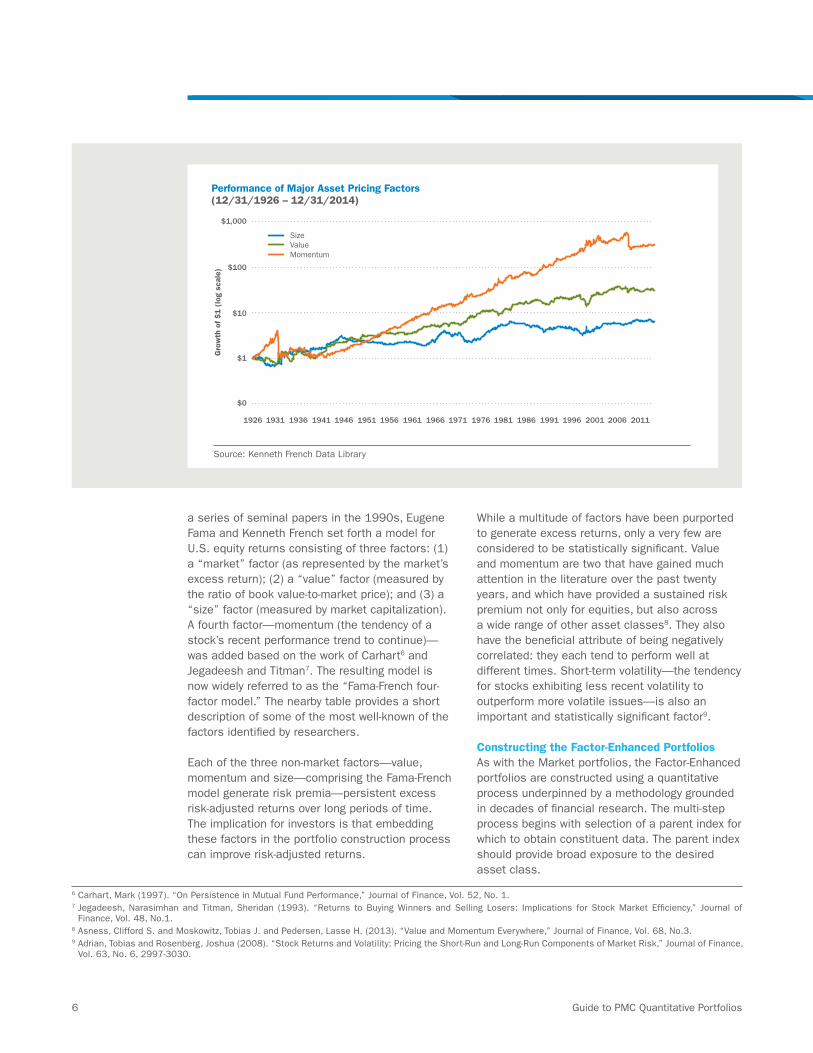
While a multitude of factors have been purported to generate excess returns, only a very few are considered to be statistically significant. Value and momentum are two that have gained much attention in the literature over the past twenty years, and which have provided a sustained risk premium not only for equities, but also across a wide range of other asset classes8. They also have the beneficial attribute of being negatively correlated: they each tend to perform well at different times. Short-term volatility—the tendency for stocks exhibiting less recent volatility to outperform more volatile issues—is also an important and statistically significant factor9.
Constructing the Factor-Enhanced PortfoliosAs with the Market portfolios, the Factor-Enhanced portfolios are constructed using a quantitative process underpinned by a methodology grounded in decades of financial research. The multi-step process begins with selection of a parent index for which to obtain constituent data. The parent index should provide broad exposure to the desired asset class.
Performance of Major Asset Pricing Factors (12/31/1926 – 12/31/2014)
$1,000
$100
$10
$1
$0
MomentumValueSize
1926 1931 1936 1946 1951 1956 1961 1966 1971 1976 1981 1986 1991 1996 2001 2006 20111941
Gro
wth
of $1 (
log
scal
e)
Source: Kenneth French Data Library
6 Carhart, Mark (1997). “On Persistence in Mutual Fund Performance,” Journal of Finance, Vol. 52, No. 1.7 Jegadeesh, Narasimhan and Titman, Sheridan (1993). “Returns to Buying Winners and Selling Losers: Implications for Stock Market Efficiency,” Journal of
Finance, Vol. 48, No.1.8 Asness, Clifford S. and Moskowitz, Tobias J. and Pedersen, Lasse H. (2013). “Value and Momentum Everywhere,” Journal of Finance, Vol. 68, No.3.9 Adrian, Tobias and Rosenberg, Joshua (2008). “Stock Returns and Volatility: Pricing the Short-Run and Long-Run Components of Market Risk,” Journal of Finance,
Vol. 63, No. 6, 2997-3030.
Guide to PMC Quantitative Portfolios 7
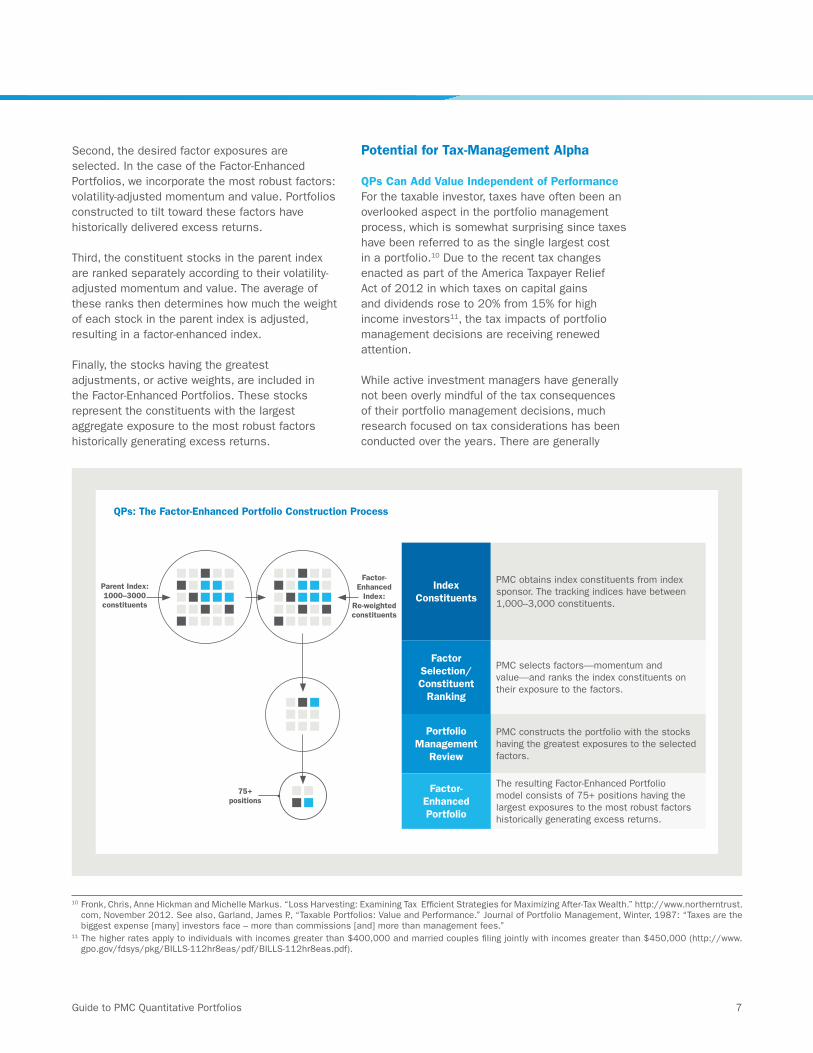
Second, the desired factor exposures are selected. In the case of the Factor-Enhanced Portfolios, we incorporate the most robust factors: volatility-adjusted momentum and value. Portfolios constructed to tilt toward these factors have historically delivered excess returns.
Third, the constituent stocks in the parent index are ranked separately according to their volatility-adjusted momentum and value. The average of these ranks then determines how much the weight of each stock in the parent index is adjusted, resulting in a factor-enhanced index.
Finally, the stocks having the greatest adjustments, or active weights, are included in the Factor-Enhanced Portfolios. These stocks represent the constituents with the largest aggregate exposure to the most robust factors historically generating excess returns.
Potential for Tax-Management Alpha
QPs Can Add Value Independent of PerformanceFor the taxable investor, taxes have often been an overlooked aspect in the portfolio management process, which is somewhat surprising since taxes have been referred to as the single largest cost in a portfolio.10 Due to the recent tax changes enacted as part of the America Taxpayer Relief Act of 2012 in which taxes on capital gains and dividends rose to 20% from 15% for high income investors11, the tax impacts of portfolio management decisions are receiving renewed attention.
While active investment managers have generally not been overly mindful of the tax consequences of their portfolio management decisions, much research focused on tax considerations has been conducted over the years. There are generally
10 Fronk, Chris, Anne Hickman and Michelle Markus. “Loss Harvesting: Examining Tax Efficient Strategies for Maximizing After-Tax Wealth.” http://www.northerntrust.com, November 2012. See also, Garland, James P., “Taxable Portfolios: Value and Performance.” Journal of Portfolio Management, Winter, 1987: “Taxes are the biggest expense [many] investors face – more than commissions [and] more than management fees.”
11 The higher rates apply to individuals with incomes greater than $400,000 and married couples filing jointly with incomes greater than $450,000 (http://www.gpo.gov/fdsys/pkg/BILLS-112hr8eas/pdf/BILLS-112hr8eas.pdf).
QPs: The Factor-Enhanced Portfolio Construction Process
75+ positions
Parent Index:1000–3000constituents
Factor-Enhanced
Index:Re-weighted constituents
Index Constituents
PMC obtains index constituents from index sponsor. The tracking indices have between 1,000–3,000 constituents.
Factor Selection/Constituent
Ranking
PMC selects factors—momentum and value—and ranks the index constituents on their exposure to the factors.
Portfolio Management
Review
PMC constructs the portfolio with the stocks having the greatest exposures to the selected factors.
Factor-Enhanced Portfolio
The resulting Factor-Enhanced Portfolio model consists of 75+ positions having the largest exposures to the most robust factors historically generating excess returns.
8 Guide to PMC Quantitative Portfolios
two broad conclusions reached in these papers: first, whether active or passive management is employed, after-tax, and not pre-tax, returns should be the focus. In a groundbreaking 1993 paper, Jeffrey and Arnott pointed out that most of the effort spent over the years on improving investment performance has been focused on institutional tax-exempt portfolios, even though the majority of investable assets are held in taxable accounts.12 The authors assert that “managing taxable portfolios as if they were tax-exempt is inherently irresponsible, even though doing so is the industry standard.”
A survey of advisors conducted by Horan and Adler (2009) found that 76 percent of taxable clients expect the advisor to manage their portfolios with taxes in mind, but that only 11 percent of advisors report performance on an after-tax basis.13
The second general finding is that, as between tax-managed active and tax-managed passive strategies, the latter will typically provide superior results. One of Jeffrey and Arnott’s (1993) conclusions is that it is very difficult to outperform passive indexing on an after-tax basis. Numerous studies have shown that taxes detract one to three percentage points from the typical active manager’s return on an annual basis, primarily as a result of trading costs stemming from frequent turnover.14 Active managers may have to generate substantial alpha in order to simply meet the portfolio’s tax obligations.
Active Tax Management TacticsProper active tax management is much more comprehensive than simply allowing gains to accumulate. In many instances, a strategy of allowing gains to go unrealized may not be practical. For example, client-driven cash flows into or out of the account will necessitate some level of portfolio turnover. In cases where the portfolio is passively indexed, changes to the underlying benchmark may result in an increase in tracking error that may require portfolio rebalancing.
There are several common principles which should be considered when incorporating active tax management:
1. Consider location of assets when constructing an investment program. When establishing an overall investment program, consideration should be given to asset location. For example, investments that are inherently tax-efficient may be best suited for a taxable account, while those that are less tax-efficient would be candidates for tax-deferred accounts such as IRAs.
2. Defer realization of capital gains. Selling securities at a gain incurs a tax obligation that either needs to be paid or offset (in whole or in part) with losses. By holding a security with an unrealized gain, the tax obligation is deferred. However, risk management and other factors may warrant realizing a gain.
3. Holding period management. Because gains on securities held less than one year are currently taxed at ordinary income tax rates, it may be preferable to postpone gain realization until the one-year holding period has been met, at which time the gains are treated as long-term and are taxed at the lower capital gains tax rate.
4. Harvest losses where possible. Selling securities at a loss is an important tax-management tool because the losses can be used to offset gains in the current or future years. While year-end tax loss harvesting is useful, additional harvesting opportunities often arise throughout the course of the year, and may add to a portfolio’s tax-efficiency. Because loss harvesting necessitates portfolio turnover, the benefit of the loss realization should be weighed against the additional transactions costs.
5. Consider tax lots. One of the benefits of SMA portfolios is that multiple lots of the same security may often be held. In such cases, it may be advantageous to sell the highest-cost lot to minimize the tax impact.
6. Avoid wash sales. A capital loss is disallowed and deferred until later if the same (or substantially identical) security is repurchased within 30 days after being sold for a loss.
7. Consider the investor’s age. The cost basis of an asset is reset upon the death of the owner. This so-called “date of death step-up” in cost basis should be taken into consideration for
12 Jeffrey, Robert H. and Robert D. Arnott, “Is Your Alpha Big Enough to Cover its Taxes?” Journal of Portfolio Management, Spring 1993, Vol. 19, No. 3, 15-25.13 Horan, Stephen M., and David Adler, “Tax-Aware Investment Management Practice.” The Journal of Wealth Management, Fall 2009, Vol. 12, No. 2, 71-88.14 See, e.g., Arnott, Robert, Andrew L. Berkin and Paul Bouchey, “Is Your Alpha Big Enough to Cover Its Taxes: Revisited.” Investments and Wealth Monitor, January/
February 2011.
Guide to PMC Quantitative Portfolios 9
older investors, but may be overridden by other factors for younger investors.
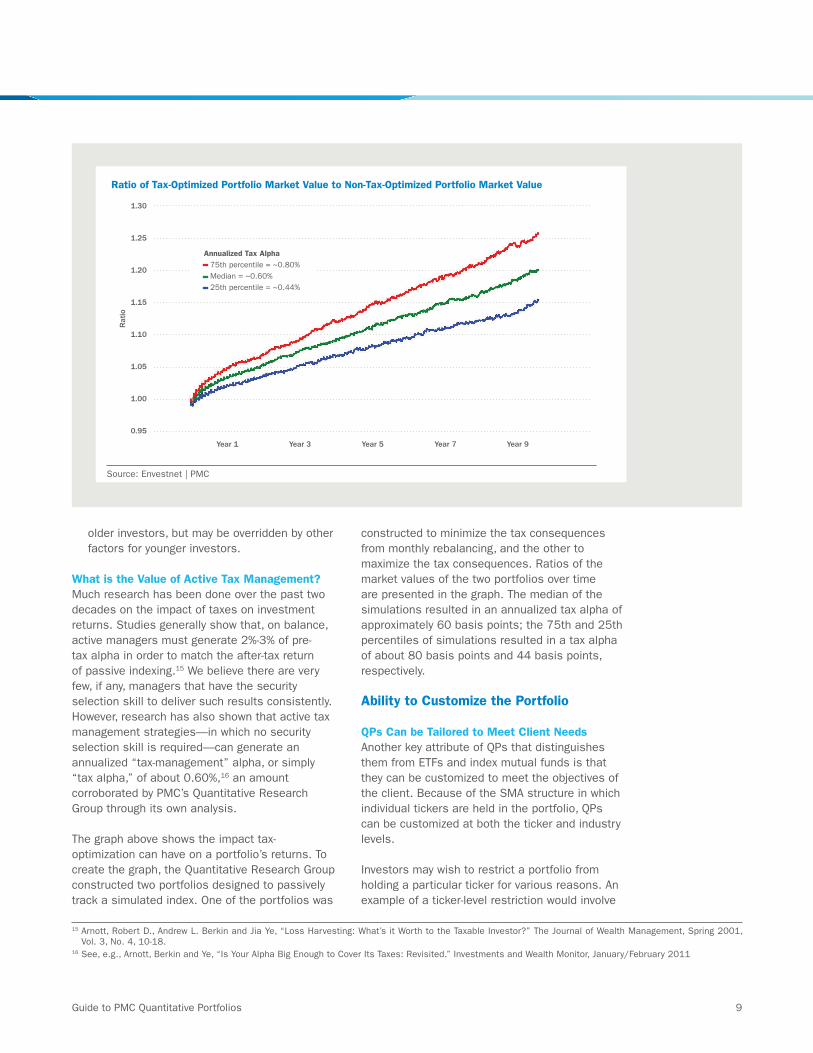
What is the Value of Active Tax Management?Much research has been done over the past two decades on the impact of taxes on investment returns. Studies generally show that, on balance, active managers must generate 2%-3% of pre-tax alpha in order to match the after-tax return of passive indexing.15 We believe there are very few, if any, managers that have the security selection skill to deliver such results consistently. However, research has also shown that active tax management strategies—in which no security selection skill is required—can generate an annualized “tax-management” alpha, or simply “tax alpha,” of about 0.60%,16 an amount corroborated by PMC’s Quantitative Research Group through its own analysis.
The graph above shows the impact tax-optimization can have on a portfolio’s returns. To create the graph, the Quantitative Research Group constructed two portfolios designed to passively track a simulated index. One of the portfolios was
constructed to minimize the tax consequences from monthly rebalancing, and the other to maximize the tax consequences. Ratios of the market values of the two portfolios over time are presented in the graph. The median of the simulations resulted in an annualized tax alpha of approximately 60 basis points; the 75th and 25th percentiles of simulations resulted in a tax alpha of about 80 basis points and 44 basis points, respectively.
Ability to Customize the Portfolio
QPs Can be Tailored to Meet Client NeedsAnother key attribute of QPs that distinguishes them from ETFs and index mutual funds is that they can be customized to meet the objectives of the client. Because of the SMA structure in which individual tickers are held in the portfolio, QPs can be customized at both the ticker and industry levels.
Investors may wish to restrict a portfolio from holding a particular ticker for various reasons. An example of a ticker-level restriction would involve
Ratio of Tax-Optimized Portfolio Market Value to Non-Tax-Optimized Portfolio Market Value
1.30
1.25
1.20
1.15
1.10
1.05
1.00
0.95
Year 1 Year 3 Year 5
Rat
io
Year 7 Year 9
Annualized Tax Alpha– 75th percentile = ~0.80%– Median = ~0.60%– 25th percentile = ~0.44%
Source: Envestnet | PMC
15 Arnott, Robert D., Andrew L. Berkin and Jia Ye, “Loss Harvesting: What’s it Worth to the Taxable Investor?” The Journal of Wealth Management, Spring 2001, Vol. 3, No. 4, 10-18.
16 See, e.g., Arnott, Berkin and Ye, “Is Your Alpha Big Enough to Cover Its Taxes: Revisited.” Investments and Wealth Monitor, January/February 2011
10 Guide to PMC Quantitative Portfolios
an investor who is a CPA, and whose firm is the auditor for a certain publicly traded company. The CPA is likely restricted from owning shares directly in that company, and therefore would need to have a ticker-level restriction placed on his SMA portfolios.
Industry-level restrictions can also arise in certain situations. For example, an employee of a technology firm who has company stock or options may not want to have any additional exposure to that particular industry. Or a bank executive may wish to avoid owning additional shares in financial services companies. Industry-level restrictions can be useful in such situations.
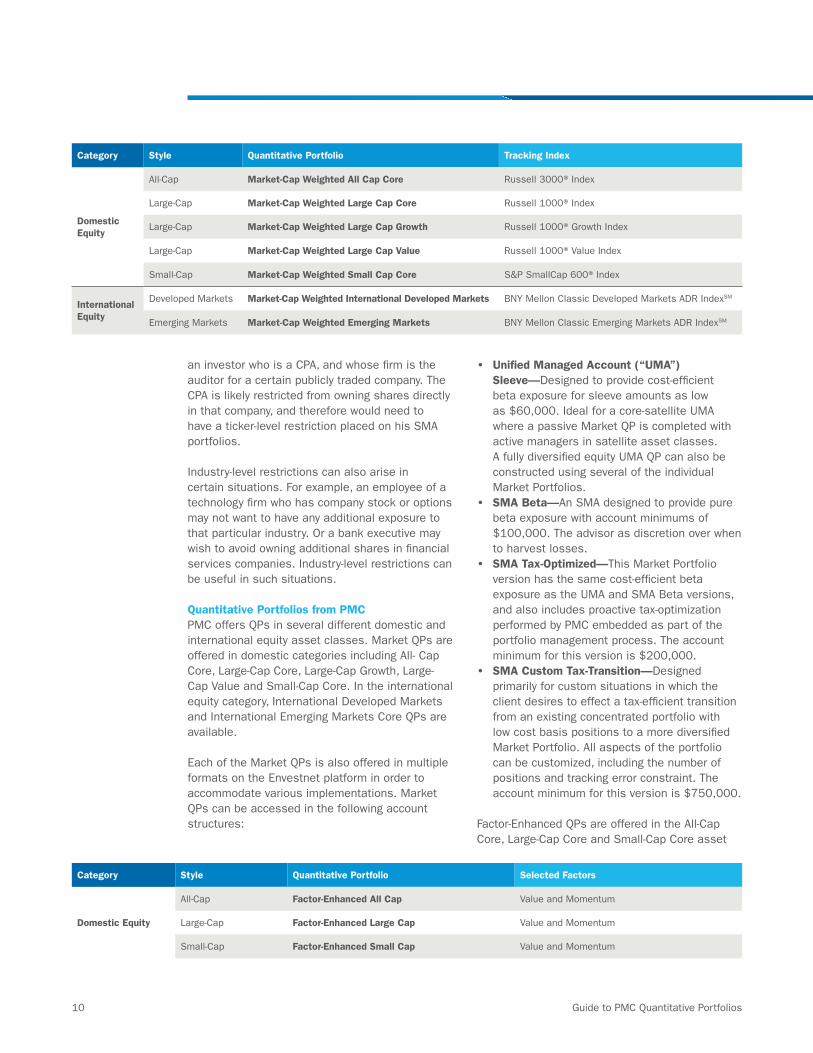
Quantitative Portfolios from PMCPMC offers QPs in several different domestic and international equity asset classes. Market QPs are offered in domestic categories including All- Cap Core, Large-Cap Core, Large-Cap Growth, Large-Cap Value and Small-Cap Core. In the international equity category, International Developed Markets and International Emerging Markets Core QPs are available.
Each of the Market QPs is also offered in multiple formats on the Envestnet platform in order to accommodate various implementations. Market QPs can be accessed in the following account structures:
• Unified Managed Account (“UMA”) Sleeve—Designed to provide cost-efficient beta exposure for sleeve amounts as low as $60,000. Ideal for a core-satellite UMA where a passive Market QP is completed with active managers in satellite asset classes. A fully diversified equity UMA QP can also be constructed using several of the individual Market Portfolios.
• SMA Beta—An SMA designed to provide pure beta exposure with account minimums of $100,000. The advisor as discretion over when to harvest losses.
• SMA Tax-Optimized—This Market Portfolio version has the same cost-efficient beta exposure as the UMA and SMA Beta versions, and also includes proactive tax-optimization performed by PMC embedded as part of the portfolio management process. The account minimum for this version is $200,000.
• SMA Custom Tax-Transition—Designed primarily for custom situations in which the client desires to effect a tax-efficient transition from an existing concentrated portfolio with low cost basis positions to a more diversified Market Portfolio. All aspects of the portfolio can be customized, including the number of positions and tracking error constraint. The account minimum for this version is $750,000.
Factor-Enhanced QPs are offered in the All-Cap Core, Large-Cap Core and Small-Cap Core asset
Category Style Quantitative Portfolio Tracking Index
Domestic Equity
All-Cap Market-Cap Weighted All Cap Core Russell 3000® Index
Large-Cap Market-Cap Weighted Large Cap Core Russell 1000® Index
Large-Cap Market-Cap Weighted Large Cap Growth Russell 1000® Growth Index
Large-Cap Market-Cap Weighted Large Cap Value Russell 1000® Value Index
Small-Cap Market-Cap Weighted Small Cap Core S&P SmallCap 600® Index
International Equity
Developed Markets Market-Cap Weighted International Developed Markets BNY Mellon Classic Developed Markets ADR IndexSM
Emerging Markets Market-Cap Weighted Emerging Markets BNY Mellon Classic Emerging Markets ADR IndexSM
Category Style Quantitative Portfolio Selected Factors
Domestic Equity
All-Cap Factor-Enhanced All Cap Value and Momentum
Large-Cap Factor-Enhanced Large Cap Value and Momentum
Small-Cap Factor-Enhanced Small Cap Value and Momentum
Guide to PMC Quantitative Portfolios 11
classes. There is SMA version of each of the portfolios, with account minimums of $100,000. The models can be incorporated in UMA sleeves, and can also be selected for tax management.
Disclosure
The information, analysis, and opinions expressed herein are for general and educational purposes only. Nothing contained in this weekly review is intended to constitute legal, tax, accounting, securities, or investment advice, nor an opinion regarding the appropriateness of any investment, nor a solicitation of any type. All investments carry a certain risk, and there is no assurance that an investment will provide positive performance over any period of time. An investor may experience loss of principal. Investment decisions should always be made based on the investor’s specific financial needs and objectives, goals, time horizon, and risk tolerance. The asset classes and/or investment strategies described may not be suitable for all investors and investors should consult with an investment advisor to determine the appropriate investment strategy. Past performance is not indicative of future results.
Information obtained from third party sources are believed to be reliable but not guaranteed. Envestnet | PMC™ makes no representation regarding the accuracy or completeness of information provided herein. All opinions and views constitute our judgments as of the date of writing and are subject to change at any time without notice.
Investments in smaller companies carry greater risk than is customarily associated with larger companies for various reasons such as volatility of earnings and prospects, higher failure rates, and limited markets, product lines or financial resources. Investing overseas involves special risks, including the volatility of currency exchange rates and, in some cases, limited geographic focus, political and economic instability, and relatively illiquid markets. Income (bond) securities are subject to interest rate risk, which is the risk that debt securities in a portfolio will decline in value because of increases in market interest rates. Exchange Traded Funds (ETFs) are subject to risks similar to those of stocks, such as market risk. Investing in ETFs may bear indirect fees and expenses charged by ETFs in addition to
its direct fees and expenses, as well as indirectly bearing the principal risks of those ETFs. ETFs may trade at a discount to their net asset value and are subject to the market fluctuations of their underlying investments. Investing in commodities can be volatile and can suffer from periods of prolonged decline in value and may not be suitable for all investors. Index Performance is presented for illustrative purposes only and does not represent the performance of any specific investment product or portfolio. An investment cannot be made directly into an index.
BNY Mellon, BNY Mellon Classic Developed Markets Index, BNY Mellon Classic Emerging Markets Index, BNY Mellon Latin America 35 ADR Index, BNY Mellon BRIC Select ADR Index, and BNY Mellon China Select ADR Index are service marks of The Bank of New York Mellon. These and other associated trademarks and/or service marks have been licensed for use by Envestnet Asset Management, Inc. for use with certain Envestnet Asset Management, Inc. products (“Envestnet Products”). BNY Mellon provides no advice nor recommendations regarding products based on any index licensed by BNY Mellon, including the Envestnet Products and none of the Envestnet Products are sponsored, endorsed, sold or promoted by BNY Mellon, or its respective affiliates, or third party licensors, and BNY Mellon makes no representation, warranty, or condition regarding the advisability of buying, selling, or holding units in the Envestnet Products.
Neither Envestnet, Envestnet | PMC™ nor its representatives render tax, accounting or legal advice. Any tax statements contained herein are not intended or written to be used, and cannot be used, for the purpose of avoiding U.S. federal, state, or local tax penalties. Taxpayers should always seek advice based on their own particular circumstances from an independent tax advisor.

The information, analysis, guidance and opinions expressed herein are for general and educational purposes only and are not intended to constitute legal, tax, securities or investment advice or a recommended course of action in any given situation. Envestnet makes no representation regarding the accuracy or completeness of the information provided. Information obtained from third party resources are believed to be reliable but not guaranteed. All opinions and views constitute our judgments as of the date of writing and are subject to change at any time without notice. Past performance is not indicative of future results.
FOR HOME OFFICE AND ADVISOR USE ONLY-NOT FOR USE WITH THE INVESTING PUBLIC
© 2015 Envestnet, Inc. All rights reserved. PMC-WP-QP-0615
Quantitative PortfoliosBeyond BetaTM