guide to oecd’s trade in value added (tiva) indicators ... · 4.7 exgrpsh: gross exports, partner...
TRANSCRIPT
December 2019
Guide to OECD’s Trade in Value Added (TiVA)
Indicators, 2018 edition
OECD, Directorate for Science, Technology and Innovation
Abstract
This guide presents the Trade in Value Added (TiVA) indicators published by OECD. The
latest indicators were estimated based on the 2018 release of OECD’s annual Inter-Country
Input-Output (ICIO) tables which cover the period 2005 to 2015. The indicators are
provided for 64 economies (including all OECD, European Union and G20 countries as
well as most of East and Southeast Asia) and a selection of region aggregates and, for 36
unique industries and related aggregates (such as total manufactures and total services)
based on the ISIC Rev. 4 classification.
This guide builds on previous versions and is intended for all users, from experienced
Input-Output practitioners familiar with the matrix algebra for generating indicators, to
relative novices who wish to use TiVA indicators in their analyses and just need guidance
on their use and interpretation.
2 GUIDE TO OECD’S TIVA INDICATORS
Table of contents
Abstract 1
1 Introduction 5
2 OECD’s ICIO Tables: basic definitions 5
2.1 The OECD’s Inter-Country Input-Output (ICIO) system 6
Figure 2.1 OECD’s ICIO Basic Structure 6
2.2 Definitions and notation used in this Guide 8
3 An overview of OECD’s TIVA indicators 10
4 Structural Indicators - based on the values presented in ICIO 13
4.1 PROD: Production (gross output), USD million 13
4.2 VALU: Value added, USD million 13
4.3 PROD_VASH: Value added as a share of Gross Output, by industry, percentage 14
4.4 EXGR | EXGR_INT | EXGR_FNL: Gross exports, by industry and by partner country, USD
million (f.o.b.) 16
4.5 IMGR | IMGR_INT | IMGR_FNL: Gross imports, by industry and by partner country, USD
million (f.o.b.) 17
4.6 BALGR: Gross trade balance, by partner country, USD million (f.o.b.) 17
4.7 EXGRpSH: Gross exports, partner shares, by industry, percentage 18
4.8 IMGRpSH: Gross imports, partner shares %, by industry, percentage 18
5 Indicators based on the Origins of Value Added in Gross Exports and Imports 19
5.a Domestic value added content of gross exports 19
5.1 EXGR_DVA: Domestic value added content of gross exports, USD million 19
5.2 EXGR_DVASH: Domestic value added share of gross exports, percentage 19
5.3 EXGR_TDVAIND: Industry domestic value added contribution to gross exports, as a
percentage of total gross exports 20
5.4 EXGR_DVApSH: Domestic value added in gross exports, partner shares, percentage 20
5.b Decomposition of domestic value added content of gross exports 21
5.5 EXGR_DDC: Direct domestic industry value added content of gross exports, USD million 21
5.6 EXGR_IDC: Indirect domestic content of gross exports (originating from domestic
intermediates), USD million 21
5.7 EXGR_RIM: Re-imported domestic value added content of gross exports, USD million 22
5.c Foreign value added content of gross exports (backward participation in GVCs) 23
5.8 EXGR_FVA: Foreign value added content of gross exports, by industry, USD million 23
5.9 EXGR_FVASH: Foreign value added share of gross exports, percentage 23
5.10 EXGR_TFVAIND Industry foreign value added contribution to gross exports, a as a percentage
of total gross exports 25
5.11 DEXFVApSH: Backward participation in GVCs, percentage 26
5.d Domestic value added content of foreign gross exports (forward participation in GVCs) 27
5.12 EXGR_DVAFXSH: Domestic value added embodied in foreign exports as share of gross
exports, percentage 27

GUIDE TO OECD’S TIVA INDICATORS 3
5.13 FEXDVApSH: Forward participation in GVCs, percentage 27
5.e Domestic value added content of intermediate and final gross exports 28
5.14 EXGR_INTDVASH: Domestic value added in exports of intermediate products, as a share of
total gross exports, percentage 28
5.15 EXGR_FNLDVASH: Domestic value added in exports of final products, as a share of total
gross exports, percentage 28
5.16 EXGR_INTDVApSH: Domestic value added in exports of intermediate products, partner
shares, percentage 29
5.f Services value added content of gross exports 29
5.17 EXGR_SERV_DVASH: Domestic services value added share in gross exports, percentage 29
5.18 EXGR_SERV_FVASH: Foreign services value added share in gross exports, percentage 30
5.g Domestic value added in imports 31
5.19 IMGR_DVA: Domestic value added embodied in gross imports, USD million 31
5.20 IMGR_DVASH: Domestic value added share of gross imports, percentage 31
5.h Re-exported intermediate imports 32
5.21 REII: Re-exported intermediate imports, USD million 32
5.22 IMGRINT_REII: Re-exported intermediate imports as a % of total intermediate imports,
percentage 32
6 Indicators based on the origins of Value Added in Final Demand 33
6.1 FFD_DVA: Domestic value added embodied in foreign final demand, USD million 33
6.2 FFD_DVApSH: Domestic value added embodied in foreign final demand, partner shares,
percentage 34
6.3 VALU_FFDDVA: Domestic value added embodied in foreign final demand as a % of total
value added, percentage 34
6.4 DFD_FVA: Foreign value added embodied in domestic final demand, USD million 35
6.5 DFD_FVApSH: Foreign value added embodied in domestic final demand, partner shares,
percentage 35
6.6 BALVAFD: Value added embodied in final demand, balance, USD million 36
6.7 FD_VA | CONS_VA | GFCF_VA: Value added embodied in final demand, consumption and
GFCF, USD million 36
6.8 FD_VASH | CONS_VASH | GFCF_VASH: Value added shares in final demand, consumption
and GFCF, percentage 37
7 Detailed Indicators for Gross Exports, Gross Imports and Final Demand 38
7.1 EXGR_BSCI: Origin of value added in gross exports, USD million 38
7.2 IMGR_BSCI: Origin of value added in gross imports, USD million 39
7.3 FDVA_BSCI: Origin of value added in final demand, USD million 40
7.4 FD_EXGRINT_VA: Gross exports of intermediate products by origin of value added and final
destination, USD million 41
7.5 FD_EXGRFNL_VA: Gross exports of final products by origin of value added and final
destination, USD million 41
7.6 FD_EXGR_VA: Gross exports by origin of value added and final destination, USD million 42
Annex A. OECD ICIO 2018 Database 43

4 GUIDE TO OECD’S TIVA INDICATORS
Tables
Table 2.1 Basic Matrices in OECD’s ICIO and TiVA Indicators 6 Table 3.1 Overview of OECD’s TiVA Indicators and requirements for calculation 11 Table 3.2 OECD TiVA Indicators and their dimensions TiVA Indicators 12 Table A.1 Countries in OECD’s ICIO and TiVA Indicators 44 Table A.2 Regions in OECD’s TiVA Indicators 45 Table A.3 Industries in OECD’s ICIO and TiVA Indicators 46 Table A.4 Industries Aggregates in OECD’s TiVA Indicators 47
Figures
Figure 2-1 OECD’s ICIO Basic Structure 6 Figure 2-2 Obtaining the Leontief Inverse and the Value Added to Output Ratio 7 Figure 2-3 Obtaining the Bilateral Trade Flows 7 Figure 4-1 ICIO 2018, Value added as a share of Gross Output, Total Manufacturing 14
Boxes
Box 1 The choice of TiVA indicators and their dimensions 15 Box 2 Indicators for region aggregates. 24

GUIDE TO OECD’S TIVA INDICATORS 5
1 Introduction
This guide presents the Trade in Value Added (TiVA) indicators published by OECD1. The
latest indicators were estimated using the 2018 release of OECD’s Inter-Country Input-
Output (ICIO) tables covering the years 2005 to 20152. A range of indicators are provided
for 64 economies (including all OECD, European Union and G20 countries as well as most
of East and Southeast Asia) and a selection of region aggregates and, for 36 unique
industries and related aggregates (such as total manufactures and total services.
This guide builds on previous versions and is intended for all users, from experienced
Input-Output practitioners familiar with the matrix algebra for generating indicators, to
relative novices who wish to use TiVA indicators in their analyses and just need guidance
on their use and interpretation.
While the 2016 editions of ICIO and TiVA were based on System of National Accounts,
1993 (1993 SNA) concepts and used an industry list based on the ISIC Rev.3 classification,
the 2018 versions used 2008 SNA concepts and an industry list based on ISIC Rev.4. In
addition, the 2018 edition of TiVA indicators edition includes Kazakhstan as a new
economy. As well as the 64 target economies, an aggregate for the Rest of the World
economies is included in ICIO tables and TiVA for completeness.
Based on OECD’s ICIO, it was also released the Trade in Value Added (TiVA) database
consisting of a set of measures that aim to provide better insights into global production
networks and supply chains than is possible with conventional trade statistics.
2 OECD’s ICIO Tables: basic definitions
This section presents the basic structure of the OECD’s annual ICIO tables and the elements
needed for the calculation of the TiVA indicators.3
The 2018 set of TiVA indicators cover 65 target economies (including an aggregate
representing “the rest of the world”), 17 regions4, 36 industries and 19 industry aggregates5
(see Annex 1). Indicators are provided for all years from 2005 to 2015 with preliminary
estimates for 2016 for a few selected indicators. Indicators may be expressed in USD
million (current prices) or as percentages (shares or ratios).
1 See http://oe.cd/tiva
2 See http://oe.cd/icio
3. For readers new to input-output analysis, the book by Miller, R. and P. Blair (2009). Input-Output Analysis:
Foundations and Extensions. Cambridge: Cambridge University Press, 2nd Edition is recommended.
4. Note that indicators are provided for regional aggregates. Once USD million measures have been calculated for
the 65 economies, aggregation to various regional groupings is carried out before ratios and shares are derived.
5. Note that indicators are provided for aggregate sectors. Once USD million measures have been calculated for the
36 unique industries, summing to aggregate industry sectors is carried before ratios and shares are derived.

6 GUIDE TO OECD’S TIVA INDICATORS
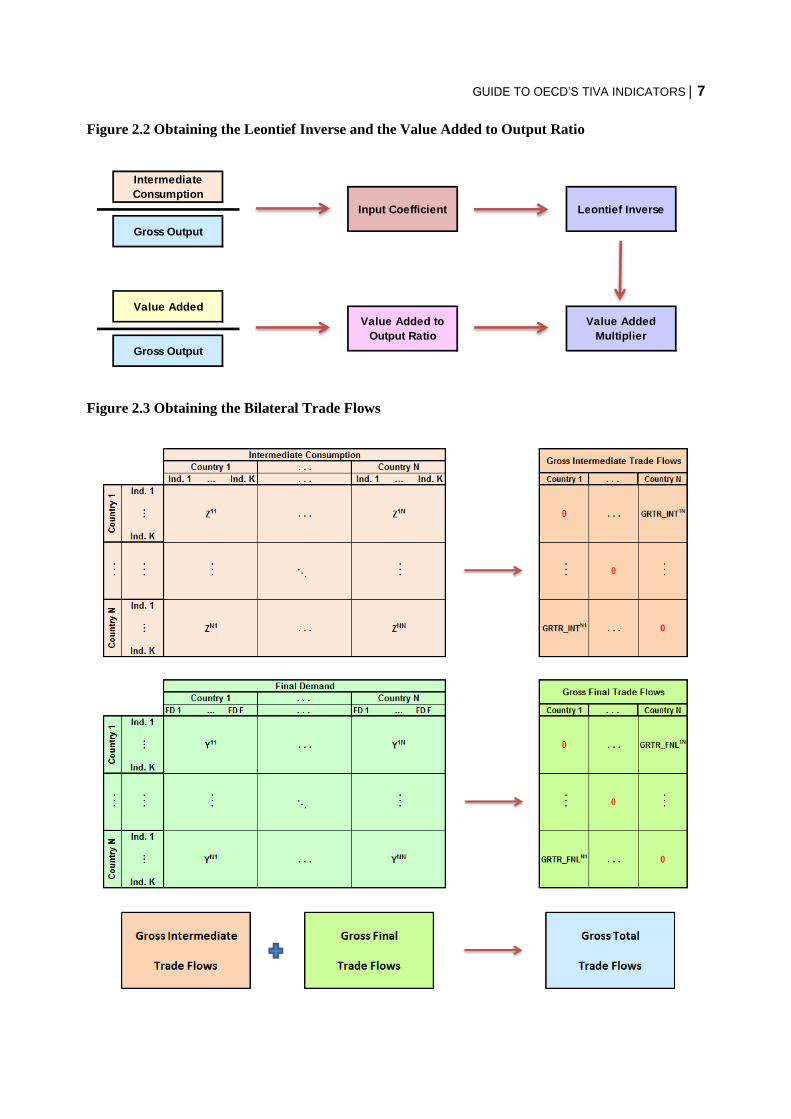
2.1 The OECD’s Inter-Country Input-Output (ICIO) system
The OECD’s ICIO system consists of a set of annual symmetric industry-by-industry global
input-output tables. For each year, several matrices can be generated from the ICIO tables
to calculate TiVA indicators. Table 2.1, Figure 2.1, Figure 2.2 and Figure 2.3 present the
basic structure of the ICIO database and the main matrices need for the estimation of the
TiVA indicators.
Table 2.1 Basic Matrices in OECD’s ICIO and TiVA Indicators
Matrix Size of the matrix Description
W 1 × (𝑁 ∗ 𝐾)
Value added, where 𝑤𝑖𝑟 is the value added (at basic prices) by industry i
(1 to K) in country r (1 to N) plus taxes less subsidies on intermediate
products, so that total value added equals total final demand at basic prices.
X 1 × (𝑁 ∗ 𝐾) Gross output (at basic prices), where 𝑥𝑖
𝑟 is the gross output from
industry i in country r
𝐕 1 × (𝑁 ∗ 𝐾) Value added to output ratio, where 𝑣𝑖
𝑟 = 𝑤𝑖𝑟 𝑥𝑖
𝑟⁄ is the ratio of value
added to gross output by industry i in country r.
𝒁 (𝑁 ∗ 𝐾) × (𝑁 ∗ 𝐾)
Intermediate consumption (at basic prices), where 𝑧𝑖𝑗𝑟𝑠 is the flow of
goods from producing industry i in country r to the purchasing industry j in country s.
𝒀 (𝑁 ∗ 𝐾) × 𝑁
Final demand, where the element 𝒚𝒊𝒓𝒔 represents final demand of country
s for goods and services produced by industry i in country r. Final demand
is separated into Household and Government Final Consumption, Gross
Fixed Capital Formation (GFCF) and changes in inventories.
𝐀 (𝑁 ∗ 𝐾) × (𝑁 ∗ 𝐾) Input coefficients, calculated as 𝑎𝑖𝑗𝑟𝑠 = 𝑧𝑖𝑗
𝑟𝑠 𝑥𝑗𝑠⁄
𝐁 (𝑁 ∗ 𝐾) × (𝑁 ∗ 𝐾)
Leontief inverse, or “output multipliers”, 𝐁 = (𝐈 − 𝐀)−𝟏, where the
element 𝑏𝑖𝑗𝑟𝑠 shows the direct and indirect requirements of inputs from
industry i in country r for the production of one unit of output for demand
by industry j in country s. 𝐆𝐑𝐓𝐑
𝐆𝐑𝐓𝐑_𝐈𝐍𝐓
𝐆𝐑𝐓𝐑_𝐅𝐍𝐋
(𝑁 ∗ 𝐾) × 𝑁
Bilateral gross trade matrices by exporting industry/country and
importing country of intermediate (INT) and final (FNL) goods
GRTR = GRTR_INT + GRTR_FNL
Figure 2.1 OECD’s ICIO Basic Structure
Ind. 1 … Ind. K Ind. 1 … Ind. K FD 1… FD F FD 1… FD F
Ind. 1
Ind. K
Co
un
try 1
Z11 X1
. . . . . .
Y11 . . . Y1NZ1N
Country 1 . . . Country N
. . .
Final DemandIntermediate Consumption
G.O.Country 1 . . . Country N
…
Ind. 1
Ind. K
1. includes taxes less subsidies on intermediate products
. . .
Co
un
try N
. . .
Gross Output
. . .
XN
. . . . . . .
. .
. . .
… ZN1
XN. . .X1
W1 . . .
. . .
Taxes less subsidies on final productsValue Added1 WN
YN1 . . . YNN. . . ZNN
. . .
GUIDE TO OECD’S TIVA INDICATORS 7
Figure 2.2 Obtaining the Leontief Inverse and the Value Added to Output Ratio
Figure 2.3 Obtaining the Bilateral Trade Flows
Intermediate
Consumption
Input Coefficient Leontief Inverse
Gross Output
Value Added
Value Added to
Output Ratio
Gross Output
Value Added
Multiplier

8 GUIDE TO OECD’S TIVA INDICATORS
2.2 Definitions and notation used in this Guide
The TiVA indicators are shown in blue in the equations, while the variables derived from
the ICIO system are shown in black. Visual representations of the indicators are also
provided (see Box 1.)
𝐸𝑋𝐺𝑅𝑐,𝑝 represents a K x 1 vector of gross exports from country c to partner country p for
all K industries, where c ≠ p. 𝐸𝑋𝐺𝑅𝑐 is a K x 1 vector of total exports of country c.
𝑉𝑐 = [𝑣𝑐1 ⋯ 𝑣𝑐𝐾] is a 1 x K row vector with domestic value added shares of output for each
industry i in country c, while 𝑉𝑝 generally represents value added shares of the partner
country p. 𝑉�� denotes the diagonalized matrix of vector 𝑉𝑐, i.e. a K x K matrix with elements
𝑣𝑐1 ⋯ 𝑣𝑐𝐾 on the diagonal and 0 elsewhere.
𝑩 = (𝑰 − 𝑨)−𝟏 , is the global Leontief inverse matrix with NK x NK dimensions, where A
is the global I-O coefficient matrix. 𝐵𝑐,𝑐 is a K x K diagonal block matrix of B representing
total domestic gross output required for one unit increase of country c demand. 𝐵𝑝,𝑐 is also
a K x K block matrix, and it represents the total gross output from country p required for a
one unit increase in country c demand.
Total gross exports and imports in ICIO tables, and hence in TiVA indicators, differ from
official National Accounts statistics due to removal of estimates of re-exports and re-
imports, conversion to a Basic Price valuation and reconciliation of bilateral asymmetries
via balancing under output constraints.
Changes in inventories, acquisitions less disposals of valuables, and expenditure approach
statistical discrepancy for a given country are included in countries’ total final demand. In
other words, there is an implicit assumption that all products consumed within a year are
produced in the same year, and vice versa.
Gross trade and output measures are in current prices, USD millions, with a basic price
valuation.

GUIDE TO OECD’S TIVA INDICATORS 9
Dimensions for each indicator are provided with the following abbreviations:
Country / Region:
Prod cou = Production country
VA src cou = Value added source country
Exp cou = Export country
Imp cou = Import country
FD cou = final demand / destination country
World = all countries which are related to the indicator
Industry:
Prod ind = Production source industry
VA src ind = Value added source industry
Exp ind = Export products producing industry
FD ind = final demand products producing industry
Tot ind = total industry
Supply and Demand Dimensions:
Depending on the indicator, the supply and demand dimensions could refer to
intermediate, final or total goods and services.
10 GUIDE TO OECD’S TIVA INDICATORS
3 An overview of OECD’s TIVA indicators
This section presents an overview of OECD’s TiVA Indicators classified into four groups
according to data requirements:
Structural indicators, based on the values presented in ICIO;
Indicators based on value added, gross exports and gross imports;
Indicators based on value added and final demand;
Detailed indicators, with four dimensions, revealing the origins of value added in
gross exports, gross imports and final demand.
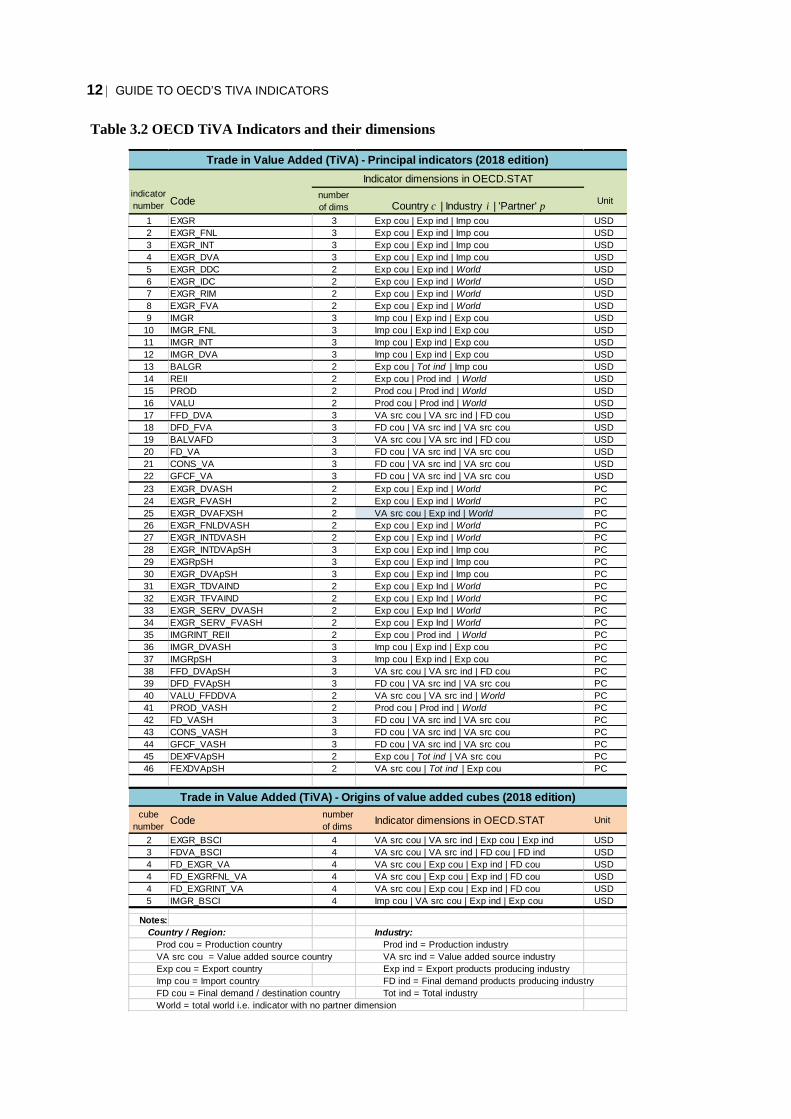
The complete set of indicators, with their respective dimensions, is presented in Table 3.1
and Table 3.2.
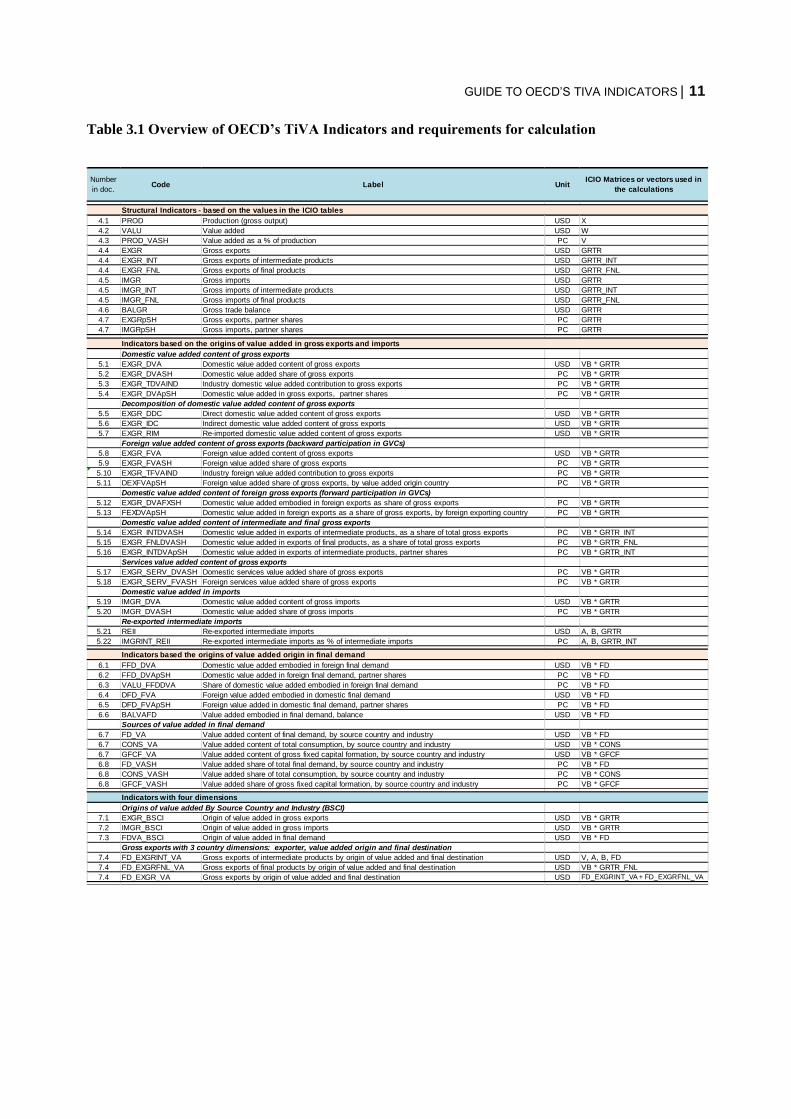
GUIDE TO OECD’S TIVA INDICATORS 11
Table 3.1 Overview of OECD’s TiVA Indicators and requirements for calculation
Structural Indicators - based on the values in the ICIO tables
4.1 PROD Production (gross output) USD X
4.2 VALU Value added USD W
4.3 PROD_VASH Value added as a % of production PC V
4.4 EXGR Gross exports USD GRTR
4.4 EXGR_INT Gross exports of intermediate products USD GRTR_INT
4.4 EXGR_FNL Gross exports of final products USD GRTR_FNL
4.5 IMGR Gross imports USD GRTR
4.5 IMGR_INT Gross imports of intermediate products USD GRTR_INT
4.5 IMGR_FNL Gross imports of final products USD GRTR_FNL
4.6 BALGR Gross trade balance USD GRTR
4.7 EXGRpSH Gross exports, partner shares PC GRTR
4.7 IMGRpSH Gross imports, partner shares PC GRTR
Indicators based on the origins of value added in gross exports and imports
Domestic value added content of gross exports
5.1 EXGR_DVA Domestic value added content of gross exports USD VB * GRTR
5.2 EXGR_DVASH Domestic value added share of gross exports PC VB * GRTR
5.3 EXGR_TDVAIND Industry domestic value added contribution to gross exports PC VB * GRTR
5.4 EXGR_DVApSH Domestic value added in gross exports, partner shares PC VB * GRTR
Decomposition of domestic value added content of gross exports
5.5 EXGR_DDC Direct domestic value added content of gross exports USD VB * GRTR
5.6 EXGR_IDC Indirect domestic value added content of gross exports USD VB * GRTR
5.7 EXGR_RIM Re-imported domestic value added content of gross exports USD VB * GRTR
Foreign value added content of gross exports (backward participation in GVCs)
5.8 EXGR_FVA Foreign value added content of gross exports USD VB * GRTR
5.9 EXGR_FVASH Foreign value added share of gross exports PC VB * GRTR
5.10 EXGR_TFVAIND Industry foreign value added contribution to gross exports PC VB * GRTR
5.11 DEXFVApSH Foreign value added share of gross exports, by value added origin country PC VB * GRTR
Domestic value added content of foreign gross exports (forward participation in GVCs)
5.12 EXGR_DVAFXSH Domestic value added embodied in foreign exports as share of gross exports PC VB * GRTR
5.13 FEXDVApSH Domestic value added in foreign exports as a share of gross exports, by foreign exporting country PC VB * GRTR
Domestic value added content of intermediate and final gross exports
5.14 EXGR_INTDVASH Domestic value added in exports of intermediate products, as a share of total gross exports PC VB * GRTR_INT
5.15 EXGR_FNLDVASH Domestic value added in exports of final products, as a share of total gross exports PC VB * GRTR_FNL
5.16 EXGR_INTDVApSH Domestic value added in exports of intermediate products, partner shares PC VB * GRTR_INT
Services value added content of gross exports
5.17 EXGR_SERV_DVASH Domestic services value added share of gross exports PC VB * GRTR
5.18 EXGR_SERV_FVASH Foreign services value added share of gross exports PC VB * GRTR
Domestic value added in imports
5.19 IMGR_DVA Domestic value added content of gross imports USD VB * GRTR
5.20 IMGR_DVASH Domestic value added share of gross imports PC VB * GRTR
Re-exported intermediate imports
5.21 REII Re-exported intermediate imports USD A, B, GRTR
5.22 IMGRINT_REII Re-exported intermediate imports as % of intermediate imports PC A, B, GRTR_INT
Indicators based the origins of value added origin in final demand
6.1 FFD_DVA Domestic value added embodied in foreign final demand USD VB * FD
6.2 FFD_DVApSH Domestic value added in foreign final demand, partner shares PC VB * FD
6.3 VALU_FFDDVA Share of domestic value added embodied in foreign final demand PC VB * FD
6.4 DFD_FVA Foreign value added embodied in domestic final demand USD VB * FD
6.5 DFD_FVApSH Foreign value added in domestic final demand, partner shares PC VB * FD
6.6 BALVAFD Value added embodied in final demand, balance USD VB * FD
Sources of value added in final demand
6.7 FD_VA Value added content of final demand, by source country and industry USD VB * FD
6.7 CONS_VA Value added content of total consumption, by source country and industry USD VB * CONS
6.7 GFCF_VA Value added content of gross fixed capital formation, by source country and industry USD VB * GFCF
6.8 FD_VASH Value added share of total final demand, by source country and industry PC VB * FD
6.8 CONS_VASH Value added share of total consumption, by source country and industry PC VB * CONS
6.8 GFCF_VASH Value added share of gross fixed capital formation, by source country and industry PC VB * GFCF
Indicators with four dimensions
Origins of value added By Source Country and Industry (BSCI)
7.1 EXGR_BSCI Origin of value added in gross exports USD VB * GRTR
7.2 IMGR_BSCI Origin of value added in gross imports USD VB * GRTR
7.3 FDVA_BSCI Origin of value added in final demand USD VB * FD
Gross exports with 3 country dimensions: exporter, value added origin and final destination
7.4 FD_EXGRINT_VA Gross exports of intermediate products by origin of value added and final destination USD V, A, B, FD
7.4 FD_EXGRFNL_VA Gross exports of final products by origin of value added and final destination USD VB * GRTR_FNL
7.4 FD_EXGR_VA Gross exports by origin of value added and final destination USD FD_EXGRINT_VA + FD_EXGRFNL_VA
Code Label UnitICIO Matrices or vectors used in
the calculations
Number
in doc.
12 GUIDE TO OECD’S TIVA INDICATORS
Table 3.2 OECD TiVA Indicators and their dimensions
indicator
number Codenumber
of dims Country c | Industry i | 'Partner' p Unit
1 EXGR 3 Exp cou | Exp ind | Imp cou USD
2 EXGR_FNL 3 Exp cou | Exp ind | Imp cou USD
3 EXGR_INT 3 Exp cou | Exp ind | Imp cou USD
4 EXGR_DVA 3 Exp cou | Exp ind | Imp cou USD
5 EXGR_DDC 2 Exp cou | Exp ind | World USD
6 EXGR_IDC 2 Exp cou | Exp ind | World USD
7 EXGR_RIM 2 Exp cou | Exp ind | World USD
8 EXGR_FVA 2 Exp cou | Exp ind | World USD
9 IMGR 3 Imp cou | Exp ind | Exp cou USD
10 IMGR_FNL 3 Imp cou | Exp ind | Exp cou USD
11 IMGR_INT 3 Imp cou | Exp ind | Exp cou USD
12 IMGR_DVA 3 Imp cou | Exp ind | Exp cou USD
13 BALGR 2 Exp cou | Tot ind | Imp cou USD
14 REII 2 Exp cou | Prod ind | World USD
15 PROD 2 Prod cou | Prod ind | World USD
16 VALU 2 Prod cou | Prod ind | World USD
17 FFD_DVA 3 VA src cou | VA src ind | FD cou USD
18 DFD_FVA 3 FD cou | VA src ind | VA src cou USD
19 BALVAFD 3 VA src cou | VA src ind | FD cou USD
20 FD_VA 3 FD cou | VA src ind | VA src cou USD
21 CONS_VA 3 FD cou | VA src ind | VA src cou USD
22 GFCF_VA 3 FD cou | VA src ind | VA src cou USD
23 EXGR_DVASH 2 Exp cou | Exp ind | World PC
24 EXGR_FVASH 2 Exp cou | Exp ind | World PC
25 EXGR_DVAFXSH 2 VA src cou | Exp ind | World PC
26 EXGR_FNLDVASH 2 Exp cou | Exp ind | World PC
27 EXGR_INTDVASH 2 Exp cou | Exp ind | World PC
28 EXGR_INTDVApSH 3 Exp cou | Exp ind | Imp cou PC
29 EXGRpSH 3 Exp cou | Exp ind | Imp cou PC
30 EXGR_DVApSH 3 Exp cou | Exp ind | Imp cou PC
31 EXGR_TDVAIND 2 Exp cou | Exp Ind | World PC
32 EXGR_TFVAIND 2 Exp cou | Exp Ind | World PC
33 EXGR_SERV_DVASH 2 Exp cou | Exp Ind | World PC
34 EXGR_SERV_FVASH 2 Exp cou | Exp Ind | World PC
35 IMGRINT_REII 2 Exp cou | Prod ind | World PC
36 IMGR_DVASH 3 Imp cou | Exp ind | Exp cou PC
37 IMGRpSH 3 Imp cou | Exp ind | Exp cou PC
38 FFD_DVApSH 3 VA src cou | VA src ind | FD cou PC
39 DFD_FVApSH 3 FD cou | VA src ind | VA src cou PC
40 VALU_FFDDVA 2 VA src cou | VA src ind | World PC
41 PROD_VASH 2 Prod cou | Prod ind | World PC
42 FD_VASH 3 FD cou | VA src ind | VA src cou PC
43 CONS_VASH 3 FD cou | VA src ind | VA src cou PC
44 GFCF_VASH 3 FD cou | VA src ind | VA src cou PC
45 DEXFVApSH 2 Exp cou | Tot ind | VA src cou PC
46 FEXDVApSH 2 VA src cou | Tot ind | Exp cou PC
cube
numberCode
number
of dimsIndicator dimensions in OECD.STAT Unit
2 EXGR_BSCI 4 VA src cou | VA src ind | Exp cou | Exp ind USD
3 FDVA_BSCI 4 VA src cou | VA src ind | FD cou | FD ind USD
4 FD_EXGR_VA 4 VA src cou | Exp cou | Exp ind | FD cou USD
4 FD_EXGRFNL_VA 4 VA src cou | Exp cou | Exp ind | FD cou USD
4 FD_EXGRINT_VA 4 VA src cou | Exp cou | Exp ind | FD cou USD
5 IMGR_BSCI 4 Imp cou | VA src cou | Exp ind | Exp cou USD
Notes:
Country / Region: Industry:
Prod cou = Production country Prod ind = Production industry
VA src cou = Value added source country VA src ind = Value added source industry
Exp cou = Export country Exp ind = Export products producing industry
Imp cou = Import country FD ind = Final demand products producing industry
FD cou = Final demand / destination country Tot ind = Total industry
World = total world i.e. indicator with no partner dimension
Trade in Value Added (TiVA) - Principal indicators (2018 edition)
Trade in Value Added (TiVA) - Origins of value added cubes (2018 edition)
Indicator dimensions in OECD.STAT

GUIDE TO OECD’S TIVA INDICATORS 13
4 Structural Indicators - based on the values presented in ICIO
4.1 PROD: Production (gross output), USD million
Indicator dimensions: [Prod cou | Prod ind | World]
This indicator is extracted directly from ICIO and defined as the production (gross output)
at basic prices by industry i in country c:
PROD𝑐,𝑖 = Xc,i
The estimates are compatible, to the greatest extent possible, with the latest available
official System of National Accounts, 2008 (2008 SNA) annual statistics.
For most OECD countries, gross output by industry time series are drawn from the
SNA08/ISIC Rev.4 version of the OECD STAN Database (http://oe.cd/stan), or OECD’s
annual National Accounts database, adapted to the industry classification of the ICIO
system. For other countries, particularly non-OECD economies, sources include United
Nations Statistics Division (UNSD) and Eurostat databases as well as National Accounts
statistics published by national statistical institutes.
Where necessary, industry estimates of gross output are calculated by drawing on other
sources such as national Supply and Use tables (SUTs), Input-Output tables and, structural
business statistics (industry survey data) such as UNIDO’s INDSTAT database.
4.2 VALU: Value added, USD million
Indicator dimensions: [Prod cou | Prod ind | World]
This indicator is extracted directly from ICIO and is defined here as production (gross
output) at basic prices minus total intermediate inputs at basic prices. In other words, it
represents value added at basic prices plus any taxes less subsidies on purchases of
intermediate products. Value added by industry i in country c:
VALU𝑐,𝑖 = Wc,i
Value added at basic prices reflects the value that is added by industry i in country c when
producing goods and services. It follows the definition of value added used in the System
of National Accounts, 2008 (2008 SNA) and is equivalent to the difference between the
industry's Production (gross output) at basic prices and the sum of its intermediate inputs
of goods and services in purchasers’ prices.
Value added at basic prices consists of Compensation of employees, Consumption of fixed
capital, and Net operating surplus and mixed income (i.e. profits and income of the self-
employed and family members). It also includes ‘Other taxes, less subsidies, on
Production’ (such as payroll taxes).
The sources for value added are the same as those used for gross output (see above).
14 GUIDE TO OECD’S TIVA INDICATORS
4.3 PROD_VASH: Value added as a share of Gross Output, by industry, percentage
Indicator dimensions: [Prod cou | Prod ind | World]
The value added share is given for each industry in each country, and represents value
added generated by industry i in country c, VALUc,i , as a percentage of gross output,
PRODc,i.
PROD_VASH𝑐,𝑖 =𝐕ALU𝑐,𝑖
PROD𝑐,𝑖 = Vc,i
Industry value added / gross output ratios are a major determinant of a country's shares of
value added embodied in trade and final demand.
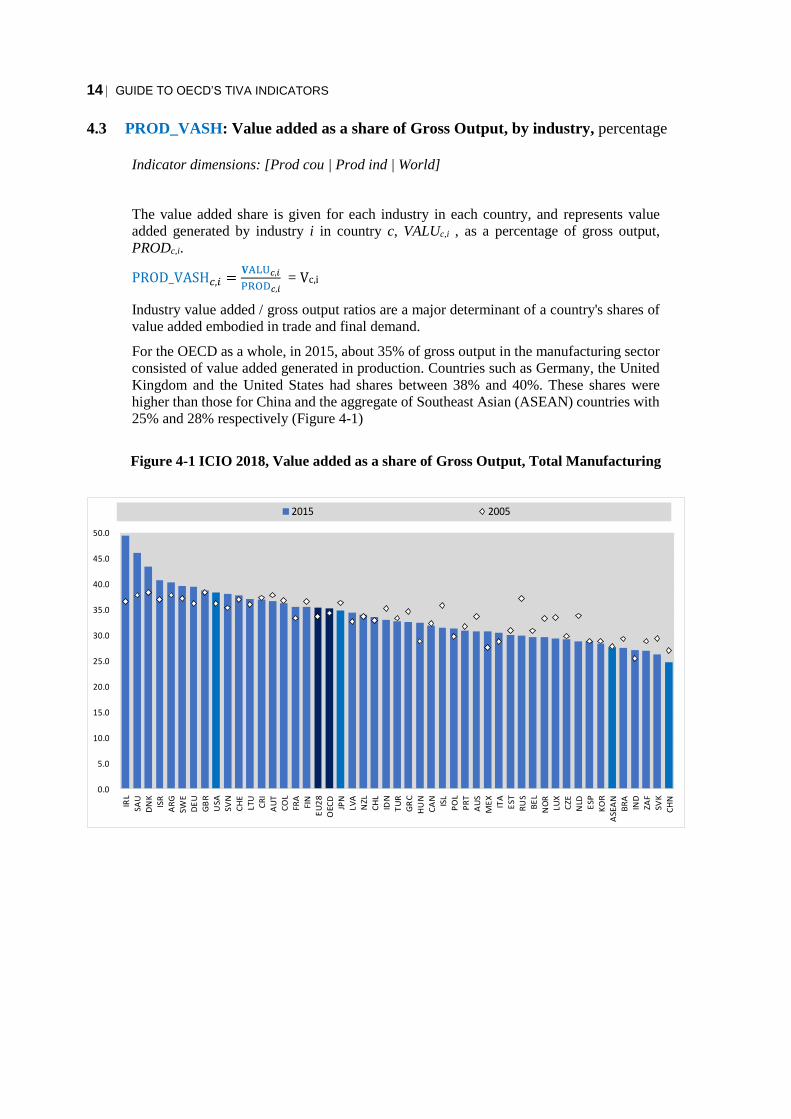
For the OECD as a whole, in 2015, about 35% of gross output in the manufacturing sector
consisted of value added generated in production. Countries such as Germany, the United
Kingdom and the United States had shares between 38% and 40%. These shares were
higher than those for China and the aggregate of Southeast Asian (ASEAN) countries with
25% and 28% respectively (Figure 4-1)
Figure 4-1 ICIO 2018, Value added as a share of Gross Output, Total Manufacturing
0.0
5.0
10.0
15.0
20.0
25.0
30.0
35.0
40.0
45.0
50.0
IRL
SAU
DN
K
ISR
AR
G
SWE
DE
U
GB
R
USA
SVN
CH
E
LTU
CR
I
AU
T
CO
L
FRA
FIN
EU
28
OEC
D
JPN
LVA
NZL
CH
L
IDN
TU
R
GR
C
HU
N
CA
N
ISL
PO
L
PR
T
AU
S
ME
X
ITA
EST
RU
S
BE
L
NO
R
LUX
CZE
NLD ESP
KO
R
ASE
AN
BR
A
IND
ZAF
SVK
CH
N
2015 2005
GUIDE TO OECD’S TIVA INDICATORS 15
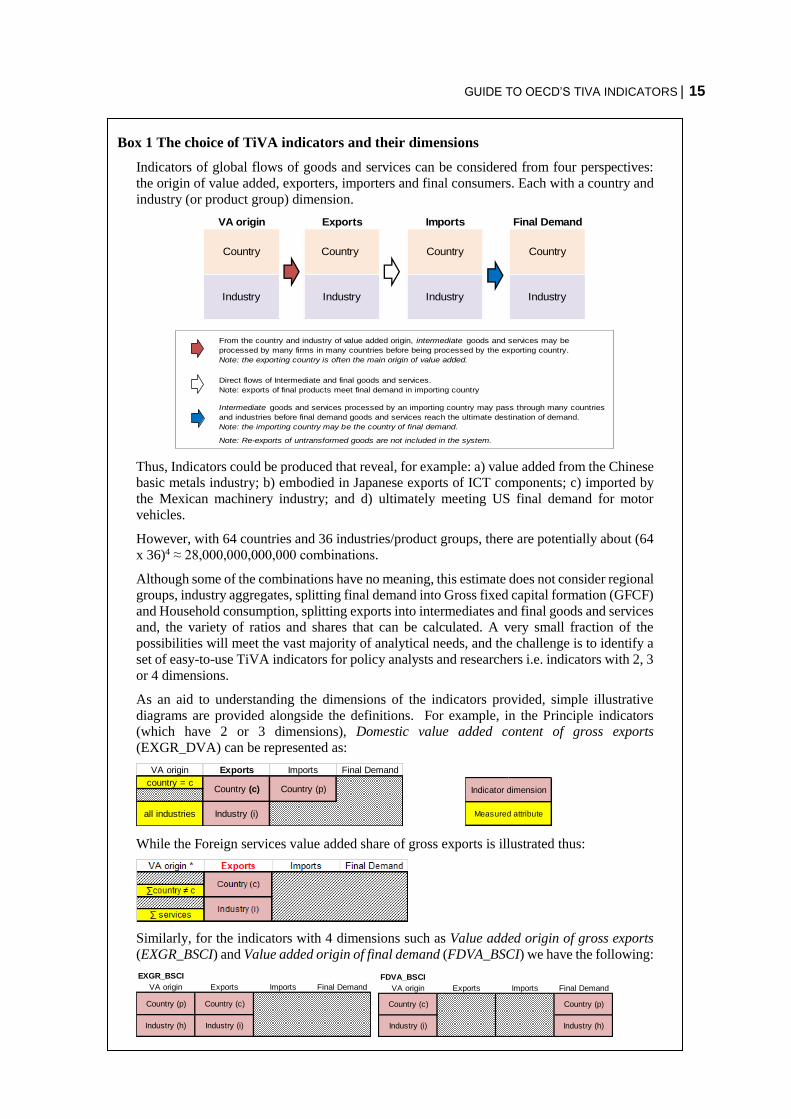
Box 1 The choice of TiVA indicators and their dimensions
Indicators of global flows of goods and services can be considered from four perspectives:
the origin of value added, exporters, importers and final consumers. Each with a country and
industry (or product group) dimension.
Thus, Indicators could be produced that reveal, for example: a) value added from the Chinese
basic metals industry; b) embodied in Japanese exports of ICT components; c) imported by
the Mexican machinery industry; and d) ultimately meeting US final demand for motor
vehicles.
However, with 64 countries and 36 industries/product groups, there are potentially about (64
x 36)4 ≈ 28,000,000,000,000 combinations.
Although some of the combinations have no meaning, this estimate does not consider regional
groups, industry aggregates, splitting final demand into Gross fixed capital formation (GFCF)
and Household consumption, splitting exports into intermediates and final goods and services
and, the variety of ratios and shares that can be calculated. A very small fraction of the
possibilities will meet the vast majority of analytical needs, and the challenge is to identify a
set of easy-to-use TiVA indicators for policy analysts and researchers i.e. indicators with 2, 3
or 4 dimensions.
As an aid to understanding the dimensions of the indicators provided, simple illustrative
diagrams are provided alongside the definitions. For example, in the Principle indicators
(which have 2 or 3 dimensions), Domestic value added content of gross exports
(EXGR_DVA) can be represented as:
While the Foreign services value added share of gross exports is illustrated thus:
Similarly, for the indicators with 4 dimensions such as Value added origin of gross exports
(EXGR_BSCI) and Value added origin of final demand (FDVA_BSCI) we have the following:
Country
Industry
VA origin Exports Imports Final Demand
Country
Industry
Country
Industry
Country
Industry
Note: Re-exports of untransformed goods are not included in the system.
From the country and industry of value added origin, intermediate goods and services may be
processed by many firms in many countries before being processed by the exporting country.
Note: the exporting country is often the main origin of value added.
Direct flows of Intermediate and final goods and services.
Note: exports of final products meet final demand in importing country
Intermediate goods and services processed by an importing country may pass through many countries
and industries before final demand goods and services reach the ultimate destination of demand.
Note: the importing country may be the country of final demand.
VA origin
country = c
Exports
Country (c)
Industry (i)
Imports
Country (p)
Final Demand
all industries
Indicator dimension
Measured attribute
EXGR_BSCI
VA origin Exports Imports Final Demand
Country (c)
Industry (i)
Country (p)
Industry (h)
FDVA_BSCI
VA origin Exports Imports Final Demand
Country (c)
Industry (i)
Country (p)
Industry (h)

16 GUIDE TO OECD’S TIVA INDICATORS
4.4 EXGR | EXGR_INT | EXGR_FNL: Gross exports, by industry and by partner country,
USD million (f.o.b.)
Indicator dimensions:
[Exp cou | Exp ind | Imp cou]
Country c’s total gross exports for a given industry i can be directly calculated from the
ICIO system by summing exports in intermediate goods and services and exports of final
demand goods and services.
EXGR𝑐,𝑖 = ∑ EXGR𝑐,𝑖,𝑝p
= ∑ ( EXGR_INT𝑐,𝑖,𝑝p
+ EXGR_FNL𝑐,𝑖,𝑝)
where EXGR_INT𝑐,𝑖,𝑝 represents gross exports of intermediate goods and services from
domestic industry i in country c to partner country p, and EXGR_FNL𝑐,𝑖,𝑝 is gross exports
of final demand goods and services, where c and p ∈[1,..,N] and c ≠ p. They are calculated
from the gross trade matrices as:
EXGR_INT𝑐,𝑖,𝑝 = GRTR_INT(c−1)∗N+i,p
EXGR_FNL𝑐,𝑖,𝑝 = GRTR_FNL(c−1)∗N+i,p
Note that the gross exports are consistent with official National Accounts estimates of total
exports and imports of goods and services, adjusted for re-exports, as well as estimates for
GDP. However, while National Accounts exports are valued at purchaser’s prices, Gross
exports for TiVA indicators are valued at basic prices in line with the valuation used
throughout the ICIO tables. When transforming exports from purchasers’ prices to basic
prices, one of the main adjustments is the reallocation of the domestic distribution margins,
(inherent in exports of goods at purchasers’ prices) to exports of services (wholesale, retail
and transportation). A consequence is that, for many countries, total exports of services in
the TiVA database may be significantly higher than total exports of services reported in
National Accounts (and Balance of Payments) statistics.
EXGR includes both cross-border flows and direct expenditure by non-residents on the
domestic territory. Estimates of bilateral exports by industry are based on the balanced
trade system drawn from the ICIO database. “Unspecified export destination” (i.e. any
discrepancy between exports and imports) is allocated to the partner “Rest of the World”.
For regions, EXGR excludes intra-regional trade (e.g. for EU28, exports to non-EU28
partners only)
VA origin Exports Imports Final Demand
Country (c) Country (p)
Industry (i)all industries
all countries

GUIDE TO OECD’S TIVA INDICATORS 17
4.5 IMGR | IMGR_INT | IMGR_FNL: Gross imports, by industry and by partner
country, USD million (f.o.b.)
Indicator dimensions:
[Imp cou | Exp ind | Exp cou]
Total imports of country c are measured as:
IMGR𝑐,𝑖 = ∑ IMGR𝑐,𝑖,𝑝𝑝
= ∑ ( IMGR_INT𝑐,𝑖,𝑝p
+ IMGR_FNL𝑐,𝑖,𝑝)
where IMGR_INTc,i,p is gross imports of intermediates by country c from industry i in
country p; and IMGR_FNLc,i,p is gross imports of final demand goods and services.
They can be calculated from the gross trade matrices as:
IMGR_INT𝑐,𝑖,𝑝 = GRTR_INT(𝑝−1)∗N+𝑖,𝑐
IMGR_FNL𝑐,𝑖,𝑝 = GRTR_FNL(𝑝−1)∗N+𝑖,𝑐
See also the notes for the EXGR indicators, which also apply to the IMGR indicators.
4.6 BALGR: Gross trade balance, by partner country, USD million (f.o.b.)
Indicator dimensions:
[Exp cou | Tot ind | Imp cou]
The gross trade balance is the difference between Gross exports, EXGRc,p , and Gross
imports, IMGRc,p and is provided for country c and partner p for total industry.
BALGR𝑐,𝑝 = EXGR𝑐,𝑝 − IMGR𝑐,𝑝
Total goods and services trade balances provided in the TiVA database are generally
aligned with those reported by national statistical offices.
However, differences between TiVA estimates and official national statistics may be
apparent, particularly for bilateral trade balances. There are well documented reasons for
such differences. For example, there are numerous asymmetries in official national trade
statistics (country A’s reported exports from Country B can differ, sometimes significantly,
from Country B’s reported imports from Country A, even when allowing for differences in
valuation). Reasons include: i) the treatment of re-exports and transit trade through major
regional trading hubs such as Belgium, Netherlands, Hong Kong (China), Singapore and
United States: exporters may report their exports by country of consignment while the
importers report the imports by country of origin; and ii) coverage and quality issues
(missing data etc.) that affect official bilateral data particularly for trade in services.
By necessity, to generate a balanced view of bilateral trade by industry (product group) in
the ICIO system, missing data are estimated and exports and imports adjusted to eliminate
asymmetries. The resulting exports matrix is thus a transpose of the imports matrix.
See also notes for EXGR and IMGR.
Exports Imports Final Demand
Country (p) Country (c)
Industry (i)all industries
VA origin
all countries
VA origin Exports Imports Final Demand
all countries Country (c) Country (p)
∑ all industries ∑ all industries

18 GUIDE TO OECD’S TIVA INDICATORS
4.7 EXGRpSH: Gross exports, partner shares, by industry, percentage
Indicator dimensions:
[Exp cou | Exp ind | Imp cou]
The partner shares are calculated for each country, industry and partner country by dividing
by total exports of the industry and country. The industry is the exporting industry.
EXGRpSH𝑐,𝑖,𝑝 =EXGR𝑐,𝑖,𝑝
∑ EXGR𝑐,𝑖,𝑝𝑝× 100
4.8 IMGRpSH: Gross imports, partner shares %, by industry, percentage
Indicator dimensions:
[Imp cou | Exp ind | Exp cou]
The partner shares are calculated for each country, industry and partner country by dividing
by total imports of the industry and country. The industry refers to the exporting industry
(i.e. from country c’s perspective, the industry of origin of the imports).
IMGRpSH𝑐,𝑖,𝑝 =IMGR𝑐,𝑖,𝑝
∑ IMGR𝑐,𝑖,𝑝𝑝× 100
VA origin Exports Imports Final Demand
Country (c) Country (p)
Industry (i)all industries
all countries
Exports Imports Final Demand
Country (p) Country (c)
Industry (i)all industries
VA origin
all countries

GUIDE TO OECD’S TIVA INDICATORS 19
5 Indicators based on the Origins of Value Added in Gross Exports and Imports
5.a Domestic value added content of gross exports
5.1 EXGR_DVA: Domestic value added content of gross exports, USD million
Indicator dimensions:
[Exp cou | Exp ind | Imp cou]
EXGR_DVAc,i,p, Domestic Value Added content of exports, by industry i in country/region
c to partner country/region p, represents the exported value added that has been generated
anywhere in the domestic economy (i.e. not just by the exporting industry).
EXGR_DVA𝑐,𝑖,𝑝 = V𝑐B𝑐,𝑐EXGR𝑐,𝑖,𝑝
Where EXGR𝑐,𝑖,𝑝 is a Kx1 vector with all entries equal to zero except those corresponding
to industry i.
For regions c, EXGR_DVA excludes intra-regional trade (e.g. for EU28, exports to non-
EU28 partners only) and intra-regional value added flows (e.g. German value added in
French exports) are treated as domestic value added. In other words, a region is treated as
a single economy. Alternatively, region averages can be calculated, see Box 2.
The domestic value added content of gross exports can be split further into three
components, direct domestic industry value added (EXGR_DDC, see 5.5), indirect
domestic value added (EXGR_IDC, see 5.6) and re-imported domestic value added
(EXGR_RIM, see 5.7).
5.2 EXGR_DVASH: Domestic value added share of gross exports, percentage
Indicator dimensions:
[Exp cou | Exp ind | World]
The share of domestic value added in gross exports is available by industry for partner
world is defined as domestic value added in gross exports, EXGR_DVAc,i , as a percentage
of total gross exports, EXGRc,i:
EXGR_DVASH𝑐,𝑖 =∑ EXGR_DVA𝑐,𝑖,𝑝𝑝
∑ EXGR𝑐,𝑖,𝑝𝑝× 100
It is a 'DVA intensity measure' and reflects how much value added, generated anywhere in
the domestic economy, is embodied per unit of total gross exports by industry, i.
For regions c, EXGR and EXGR_DVA exclude intra-regional trade (e.g. for EU28, exports
to non-EU28 only) and for EXGR_DVA, intra-region value added flows are treated as
domestic value added. Hence, for EXGR_DVASH, a region is treated as a single economy.
See also the notes for EXGR_DVA and EXGR_TDVAIND
VA origin
country = c
Exports
Country (c)
Industry (i)
Imports
Country (p)
Final Demand
all industries
Imports Final Demand
Country (c)
all industries Industry (i)
country = c
VA origin Exports

20 GUIDE TO OECD’S TIVA INDICATORS
5.3 EXGR_TDVAIND: Industry domestic value added contribution to gross exports, as
a percentage of total gross exports
Indicator dimensions:
[Exp cou | Exp ind | World]
This indicator reflects the share, in total gross exports, of domestic value added in an
industry’s exports. The sum over all industries is the total domestic value added share of
gross exports (EXGR_DVASH)
EXGR_TDVAIND𝑐,𝑖 =∑ EXGR_DVA𝑐,𝑖,𝑝𝑝
∑ EXGR𝑐,𝑖,𝑝,𝑖× 100
While EXGR_DVASHc,i measures the intensity of Domestic value added in an industry's
exports, EXGR_TDVAINDc,i captures the magnitude compared to other industries. Note
that the sum of EXGR_TDVAIND across industries equals EXGR_DVASH for total
industry.
See also the notes for EXGR and EXGR_DVA
5.4 EXGR_DVApSH: Domestic value added in gross exports, partner shares, percentage
Indicator dimensions:
[Exp cou | Exp ind | Imp cou]
For each country and industry, this indicator shows the importing partner distribution of
domestic value added in gross exports.
EXGR_DVApSH𝑐,𝑖,𝑝 =EXGR_DVA𝑐,𝑖,𝑝
∑ EXGR_DVA𝑐,𝑖,𝑝𝑝× 100
See also the notes for EXGR_DVA
VA origin Exports Imports Final Demand
country = cCountry (c)
all industries Industry (i)
Country (p)
VA origin Exports Imports Final Demand
country = cCountry (c)
all industries Industry (i)

GUIDE TO OECD’S TIVA INDICATORS 21
5.b Decomposition of domestic value added content of gross exports
5.5 EXGR_DDC: Direct domestic industry value added content of gross exports, USD
million
Indicator dimensions:
[Exp cou | Exp ind | World]
Direct domestic value added content of exports, EXGR_DDCc,i, measures the direct value
added contribution made by industry i in country c to the production of goods and services
exported by industry i to the world
EXGR_DDCc = VcdiagB𝑐EXGRc
where EXGR_DDCc is a K x 1 vector representing the industry dimension and Ac is a local
I-O coefficient matrix from country c single Input-Output table and B𝑐 = (I − Ac)−1 is the
local Leontief inverse. Matrix diagB𝑐 consists of the diagonal elements of the local
Leontief inverse, i.e. those entries of the matrix displaying the direct requirements.
EXGR_DDCc,i is the i-th element of the Kx1 vector EXGR_DDCc, and gives direct domestic
value added content of gross export of a given industry i.
It does not include domestic value added that has returned, via imports, after previously
being exported (embodied in intermediates) i.e. only the value added directly generated by
domestic industries in producing goods and services prior to export is covered.
5.6 EXGR_IDC: Indirect domestic content of gross exports (originating from domestic
intermediates), USD million
Indicator dimensions:
[Exp cou | Exp ind | World]
Indirect domestic value added content of exports, EXGR_IDCc,i, corresponds to the value
added originating from other, upstream, domestic industries (different from industry i) in
country c that are incorporated in the exports of industry i.
EXGR_IDCc = VcoffdiagB𝑐EXGRc
where EXGR_IDCc, is a K x 1 vector representing the industry dimension and Ac is a local
I-O coefficient matrix from country c single Input-Output table and B𝑐 = (I − Ac)−1 is the
local Leontief inverse. Matrix offdiagB𝑐 is the local Leontief inverse with all diagonal
elements set to zero, thus representing the indirect requirements.
EXGR_IDCc,i is the i-th element of the Kx1 vector EXGR_IDCc, and gives indirect domestic
value added content of gross export of a given industry i.
It does not include domestic value added that has returned, via imports, after previously
being exported (embodied in intermediates) i.e. only the value added directly generated by
domestic industries in producing goods and services prior to export is covered.
VA origin Exports Imports Final Demand
country =cCountry (c)
Industry (i)industry =i
country =cCountry (c)
Industry (i)∑industry ≠ i
VA origin Exports Imports Final Demand

22 GUIDE TO OECD’S TIVA INDICATORS
5.7 EXGR_RIM: Re-imported domestic value added content of gross exports, USD
million
Indicator dimensions:
[Exp cou | Exp ind | World]
Re-imported domestic value added content of exports, EXGR_RIMc.i, measures the
domestic value added content, from any industry in country c, which has been exported for
the production of intermediate goods or services abroad and subsequently embodied in
imports used in the production of exports by industry i in country c.
EXGR_RIMc = EXGR_DVAc − EXGR_DDCc − EXGR_IDCc
where EXGR_RIMc is a K x 1 vector representing the industry dimension, and the other
variables are as defined before.
EXGR_RIMc,i is the i-th element of the Kx1 vector EXGR_RIMc, and gives the re-imported
domestic value added content of gross exports of a given industry i.
all industries
VA origin Exports Imports Final Demand
country =cCountry (c)
Industry (i)
GUIDE TO OECD’S TIVA INDICATORS 23
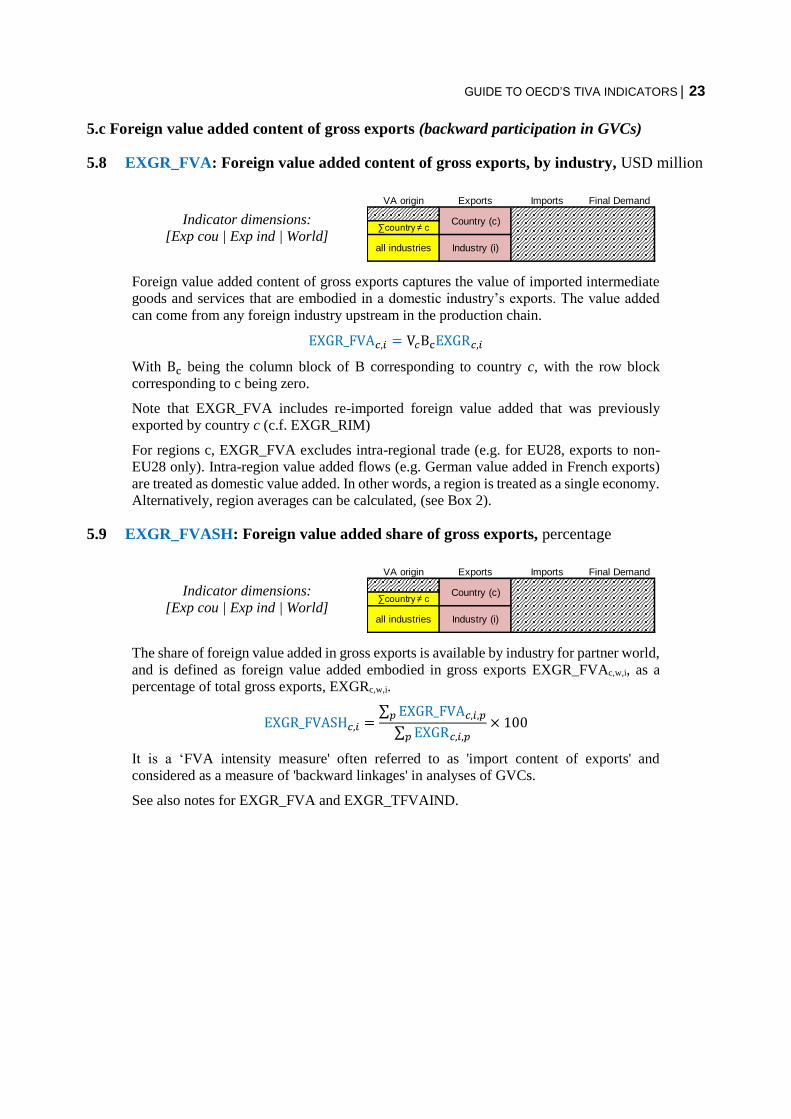
5.c Foreign value added content of gross exports (backward participation in GVCs)
5.8 EXGR_FVA: Foreign value added content of gross exports, by industry, USD million
Indicator dimensions:
[Exp cou | Exp ind | World]
Foreign value added content of gross exports captures the value of imported intermediate
goods and services that are embodied in a domestic industry’s exports. The value added
can come from any foreign industry upstream in the production chain.
EXGR_FVA𝑐,𝑖 = V𝑐BcEXGR𝑐,𝑖
With Bc being the column block of B corresponding to country c, with the row block
corresponding to c being zero.
Note that EXGR_FVA includes re-imported foreign value added that was previously
exported by country c (c.f. EXGR_RIM)
For regions c, EXGR_FVA excludes intra-regional trade (e.g. for EU28, exports to non-
EU28 only). Intra-region value added flows (e.g. German value added in French exports)
are treated as domestic value added. In other words, a region is treated as a single economy.
Alternatively, region averages can be calculated, (see Box 2).
5.9 EXGR_FVASH: Foreign value added share of gross exports, percentage
Indicator dimensions:
[Exp cou | Exp ind | World]
The share of foreign value added in gross exports is available by industry for partner world,
and is defined as foreign value added embodied in gross exports EXGR_FVAc,w,i, as a
percentage of total gross exports, EXGRc,w,i.
EXGR_FVASH𝑐,𝑖 =∑ EXGR_FVA𝑐,𝑖,𝑝𝑝
∑ EXGR𝑐,𝑖,𝑝𝑝× 100
It is a ‘FVA intensity measure' often referred to as 'import content of exports' and
considered as a measure of 'backward linkages' in analyses of GVCs.
See also notes for EXGR_FVA and EXGR_TFVAIND.
Exports Imports Final Demand
Country (c)
Industry (i)
∑country ≠ c
VA origin
all industries
Exports Imports Final Demand
Country (c)
Industry (i)
∑country ≠ c
VA origin
all industries
24 GUIDE TO OECD’S TIVA INDICATORS
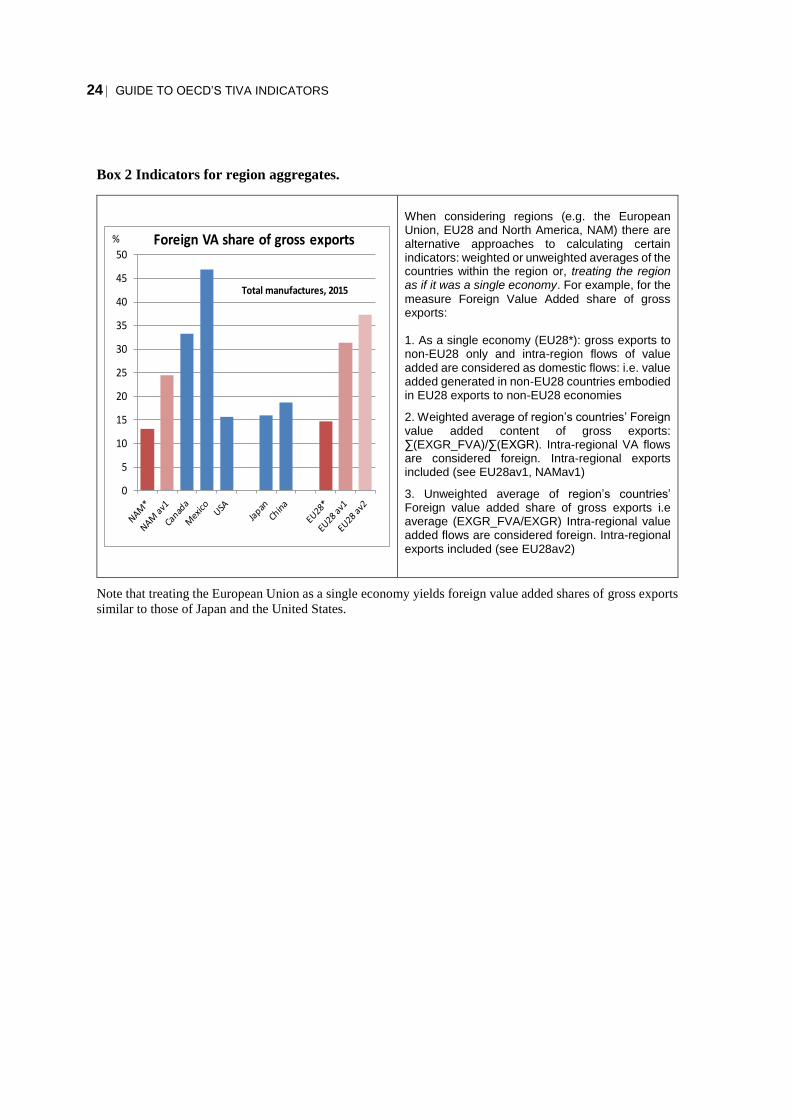
Box 2 Indicators for region aggregates.
When considering regions (e.g. the European Union, EU28 and North America, NAM) there are alternative approaches to calculating certain indicators: weighted or unweighted averages of the countries within the region or, treating the region as if it was a single economy. For example, for the
measure Foreign Value Added share of gross exports: 1. As a single economy (EU28*): gross exports to non-EU28 only and intra-region flows of value added are considered as domestic flows: i.e. value added generated in non-EU28 countries embodied in EU28 exports to non-EU28 economies
2. Weighted average of region’s countries’ Foreign value added content of gross exports: ∑(EXGR_FVA)/∑(EXGR). Intra-regional VA flows are considered foreign. Intra-regional exports included (see EU28av1, NAMav1)
3. Unweighted average of region’s countries’ Foreign value added share of gross exports i.e average (EXGR_FVA/EXGR) Intra-regional value added flows are considered foreign. Intra-regional exports included (see EU28av2)
Note that treating the European Union as a single economy yields foreign value added shares of gross exports
similar to those of Japan and the United States.
0
5
10
15
20
25
30
35
40
45
50Foreign VA share of gross exports
Total manufactures, 2015
%

GUIDE TO OECD’S TIVA INDICATORS 25
5.10 EXGR_TFVAIND Industry foreign value added contribution to gross exports, a as a
percentage of total gross exports
Indicator dimensions:
[Exp cou | Exp ind | World]
This indicator reflects the share, in total gross exports, of foreign value added in an
industry’s exports. The sum over all industries is the total foreign value added share of
gross exports (EXGR_FVASH)
EXGR_TFVAIND𝑐,𝑖 =∑ EXGR_FVA𝑐,𝑖,𝑝p
∑ EXGR𝑐,𝑖,𝑝p,i× 100
While EXGR_FVASHc,i measures the intensity of FVA in an industry's exports,
EXGR_TFVAINDc,i captures the magnitude compared to other industries. Sum of
EXGR_TFVAIND across industries equals EXGR_FVASH for total industry.
Figure: Example of EXGR_FVASH versus EXGR_TFVAIND
VA origin Exports Imports Final Demand
Country (c)
all industries Industry (i)
∑country ≠ c
0
10
20
30
40
50
EXGR_FVASH: denominator = industry exports (intensity)
0
5
10
15
20
25EXGR_TFVAIND: denominator = total exports (magnitude)
26 GUIDE TO OECD’S TIVA INDICATORS
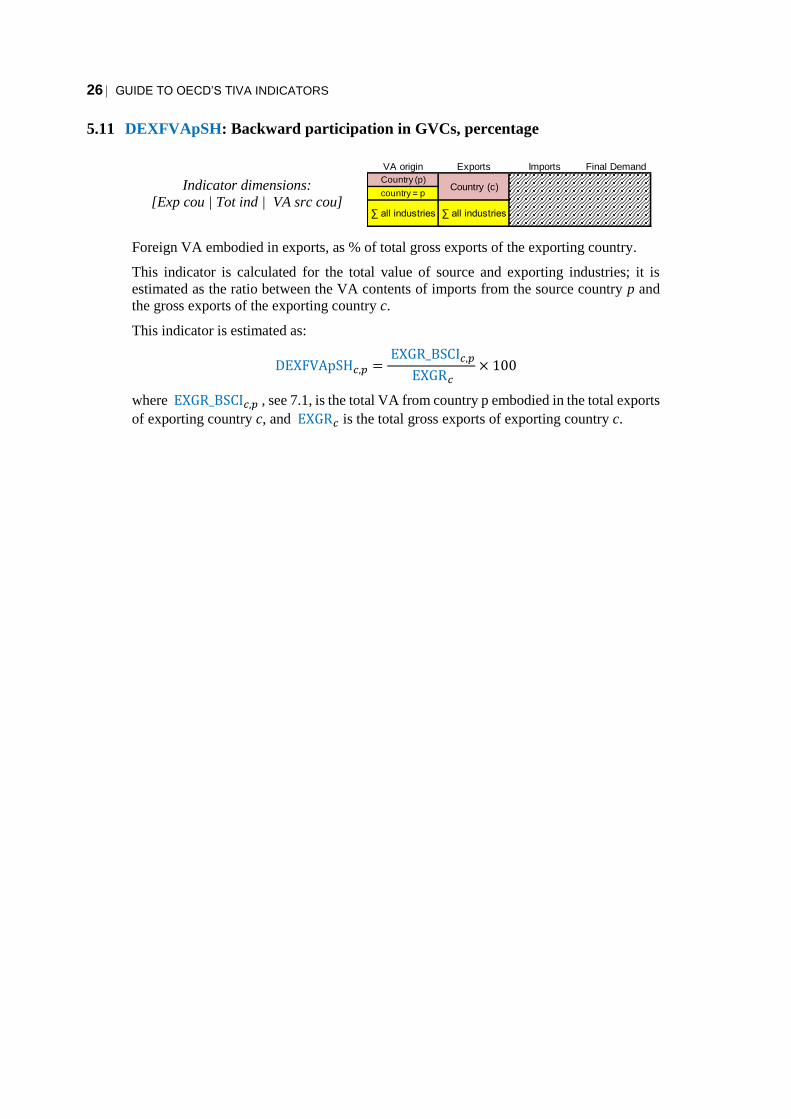
5.11 DEXFVApSH: Backward participation in GVCs, percentage
Indicator dimensions:
[Exp cou | Tot ind | VA src cou]
Foreign VA embodied in exports, as % of total gross exports of the exporting country.
This indicator is calculated for the total value of source and exporting industries; it is
estimated as the ratio between the VA contents of imports from the source country p and
the gross exports of the exporting country c.
This indicator is estimated as:
DEXFVApSH𝑐,𝑝 = EXGR_BSCI𝑐,𝑝
EXGR𝑐× 100
where EXGR_BSCI𝑐,𝑝 , see 7.1, is the total VA from country p embodied in the total exports
of exporting country c, and EXGR𝑐 is the total gross exports of exporting country c.
VA origin Exports Imports Final Demand
Country (c)country = p
∑ all industries ∑ all industries
Country (p)

GUIDE TO OECD’S TIVA INDICATORS 27
5.d Domestic value added content of foreign gross exports (forward participation in
GVCs)
5.12 EXGR_DVAFXSH: Domestic value added embodied in foreign exports as share of gross
exports, percentage
Indicator dimensions:
[VA src cou | Exp ind | World]
This indicator presents the country c domestic value added content embodied in the gross
exports of industry i in foreign countries as a percentage of total gross exports of country
c.
EXGR_DVAFXSHc,i =∑ EXGR_BSCIc,i,pp
EXGRc× 100
Where EXGR_BSCI𝑐,𝑝,𝑖 , see 7.1, is the total VA from country 𝑐 embodied in the total gross
exports of industry i in foreign country p, and EXGR𝑐 is the total gross exports of value
added source country c.
It is often considered as a measure of 'forward linkages' in analyses of GVCs.
5.13 FEXDVApSH: Forward participation in GVCs, percentage
Indicator dimensions:
[VA src cou | Tot ind | Exp cou]
Domestic VA embodied in foreign exports, as a share (%) of total gross exports of the value
added source country.
This indicator is calculated for the total value of source and exporting industries; it is
estimated as being the VA contents of exports originated in the source country, and
embodied in the exports of the exporting country, divided by the gross exports of the source
country.
This indicator is estimated as:
FEXDVApSH𝑐,𝑝 = EXGR_BSCI𝑐,𝑝
EXGR𝑐× 100
where EXGR_BSCI𝑐,𝑝 , see 7.1, is the total VA from country c embodied in the exports of
country p, and EXGRc is the total gross exports of the value added source country c.
VA origin Exports Imports Final Demand
Country (c)∑country ≠ c
Industry (i)
VA origin Exports Imports Final Demand
Country (c)Country (p)
country = c
∑ all industries ∑ all industries
28 GUIDE TO OECD’S TIVA INDICATORS
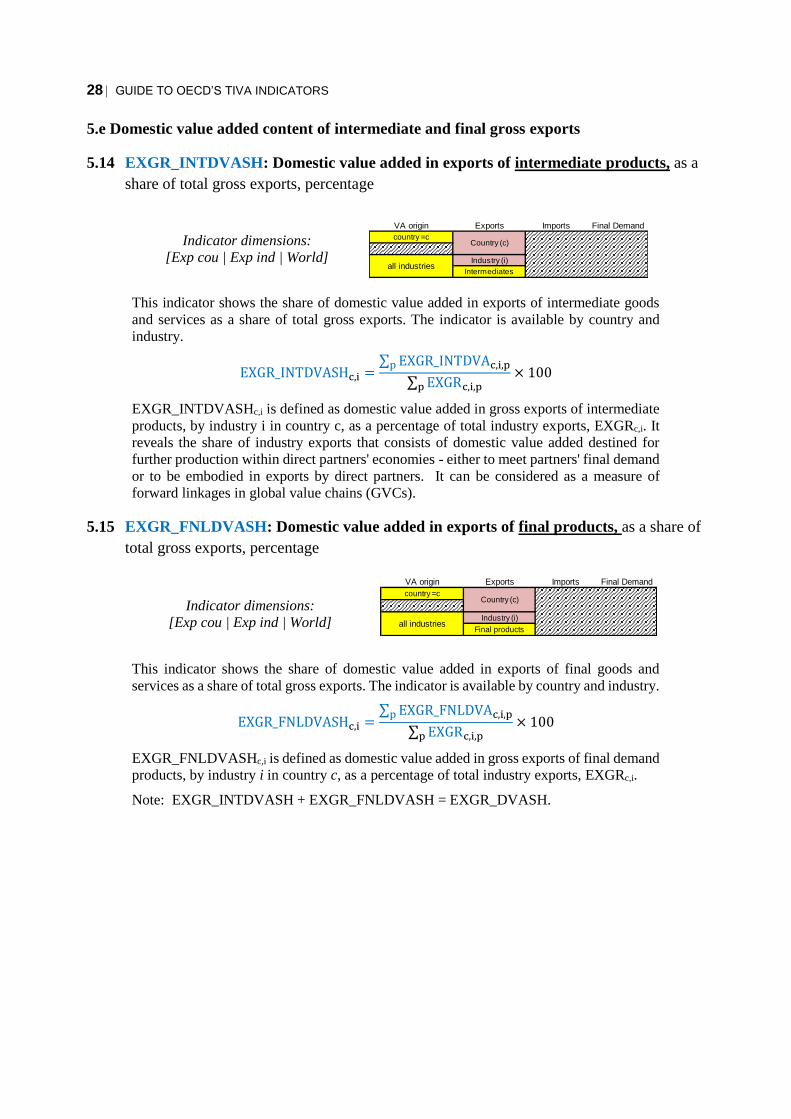
5.e Domestic value added content of intermediate and final gross exports
5.14 EXGR_INTDVASH: Domestic value added in exports of intermediate products, as a
share of total gross exports, percentage
Indicator dimensions:
[Exp cou | Exp ind | World]
This indicator shows the share of domestic value added in exports of intermediate goods
and services as a share of total gross exports. The indicator is available by country and
industry.
EXGR_INTDVASHc,i =∑ EXGR_INTDVAc,i,pp
∑ EXGRc,i,pp× 100
EXGR_INTDVASHc,i is defined as domestic value added in gross exports of intermediate
products, by industry i in country c, as a percentage of total industry exports, EXGRc,i. It
reveals the share of industry exports that consists of domestic value added destined for
further production within direct partners' economies - either to meet partners' final demand
or to be embodied in exports by direct partners. It can be considered as a measure of
forward linkages in global value chains (GVCs).
5.15 EXGR_FNLDVASH: Domestic value added in exports of final products, as a share of
total gross exports, percentage
Indicator dimensions:
[Exp cou | Exp ind | World]
This indicator shows the share of domestic value added in exports of final goods and
services as a share of total gross exports. The indicator is available by country and industry.
EXGR_FNLDVASHc,i =∑ EXGR_FNLDVAc,i,pp
∑ EXGRc,i,pp× 100
EXGR_FNLDVASHc,i is defined as domestic value added in gross exports of final demand
products, by industry i in country c, as a percentage of total industry exports, EXGRc,i.
Note: EXGR_INTDVASH + EXGR_FNLDVASH = EXGR_DVASH.
country =cCountry (c)
all industriesIndustry (i)
Intermediates
VA origin Exports Imports Final Demand
VA origin Exports Imports Final Demand
country =cCountry (c)
all industriesIndustry (i)
Final products

GUIDE TO OECD’S TIVA INDICATORS 29
5.16 EXGR_INTDVApSH: Domestic value added in exports of intermediate products,
partner shares, percentage
Indicator dimensions:
[Exp cou | Exp ind | Imp cou]
This indicator presents, for a given industry i in country c, the domestic value added content
of gross exports of intermediate goods and services (including the direct and upstream
domestic value-added content) to immediate partner country, p, as a percent of total
domestic value added content of gross exports of intermediates i.
EXGR_INTDVApSHc,i,p =EXGR_INTDVAc,i,p
∑ EXGR_INTDVAc,i,pp× 100
5.f Services value added content of gross exports
The indicators dealing with service value added content consider only the service industries
as a source of value added in the exports by all industries. Service industries include
Construction, Wholesale and retail, Accommodation and food services, Transportation
services, Information and communications, Financial and insurance, Real estate,
Professional, scientific and technical services, Administrative and support services, Public
Administration, Health, Education and Personal services i.e. defined a ISIC Rev.4
Divisions 41 to 98
5.17 EXGR_SERV_DVASH: Domestic services value added share in gross exports,
percentage
Indicator dimensions:
[Exp cou | Exp ind | World]
EXGR_SERV_DVASHc,i is the share of value added originating from all domestic service
industries in total gross exports by industry i in country c and defined as :
EXGR_SERV_DVASHc,i =EXGR_SERV_DVAc,i
EXGRc,i× 100
where:
EXGR_SERV_DVAc,i = ∑ Vc,j(Bc,c )jiEXGRc,i
j∈S
Vc,j is the diagonal matrix Vc , with all entries corresponding to industry 𝑖 ≠ 𝑗 equal to zero
and the element corresponding to 𝑗 ∈ S to the value added share of service industry j in
country c. 𝑆 is the set of service industry indices. (Bc,c )ji is ji-th element of Bc,c.
VA origin Exports Imports Final Demand
country = cCountry (c) Country (p)
all industriesIndustry (i)
Intermediates
VA origin Exports Imports Final Demand
country =cCountry (c)
Industry (i)∑ services
30 GUIDE TO OECD’S TIVA INDICATORS
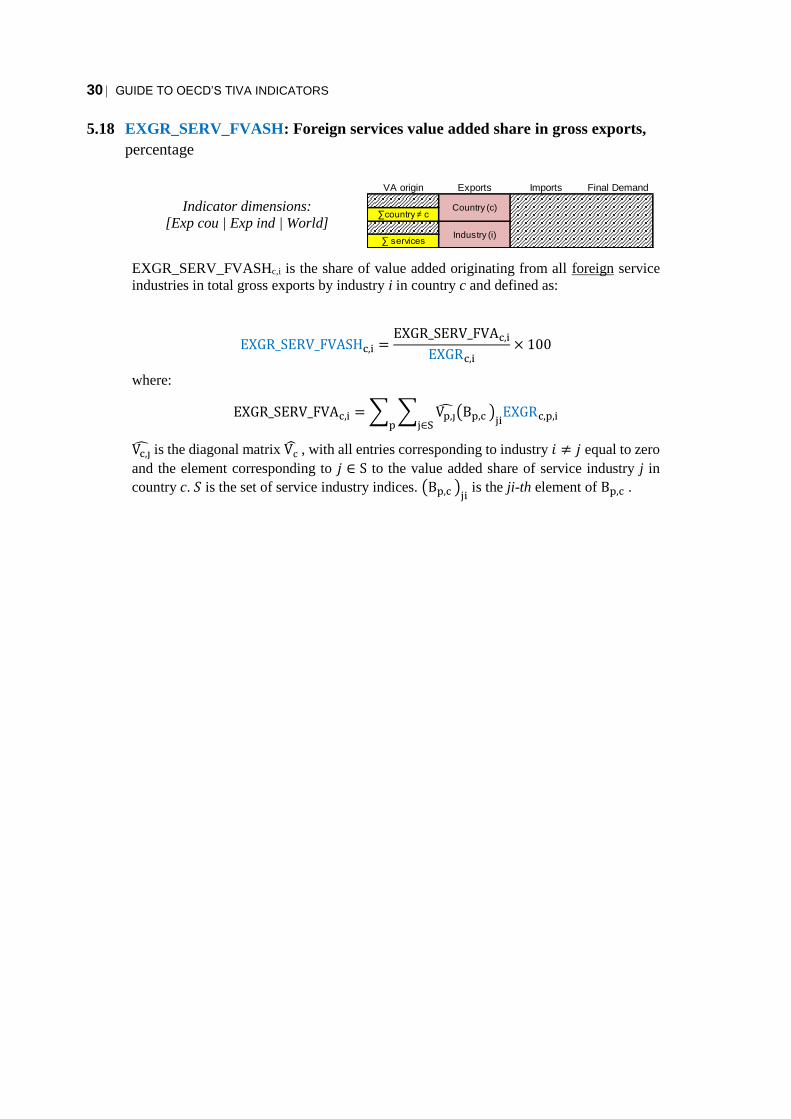
5.18 EXGR_SERV_FVASH: Foreign services value added share in gross exports,
percentage
Indicator dimensions:
[Exp cou | Exp ind | World]
EXGR_SERV_FVASHc,i is the share of value added originating from all foreign service
industries in total gross exports by industry i in country c and defined as:
EXGR_SERV_FVASHc,i =EXGR_SERV_FVAc,i
EXGRc,i× 100
where:
EXGR_SERV_FVAc,i = ∑ ∑ Vp,j(Bp,c )jiEXGRc,p,i
j∈Sp
Vc,j is the diagonal matrix Vc , with all entries corresponding to industry 𝑖 ≠ 𝑗 equal to zero
and the element corresponding to 𝑗 ∈ S to the value added share of service industry j in
country c. 𝑆 is the set of service industry indices. (Bp,c )ji is the ji-th element of Bp,c .
VA origin Exports Imports Final Demand
Country (c)
Industry (i)
∑country ≠ c
∑ services
GUIDE TO OECD’S TIVA INDICATORS 31
5.g Domestic value added in imports
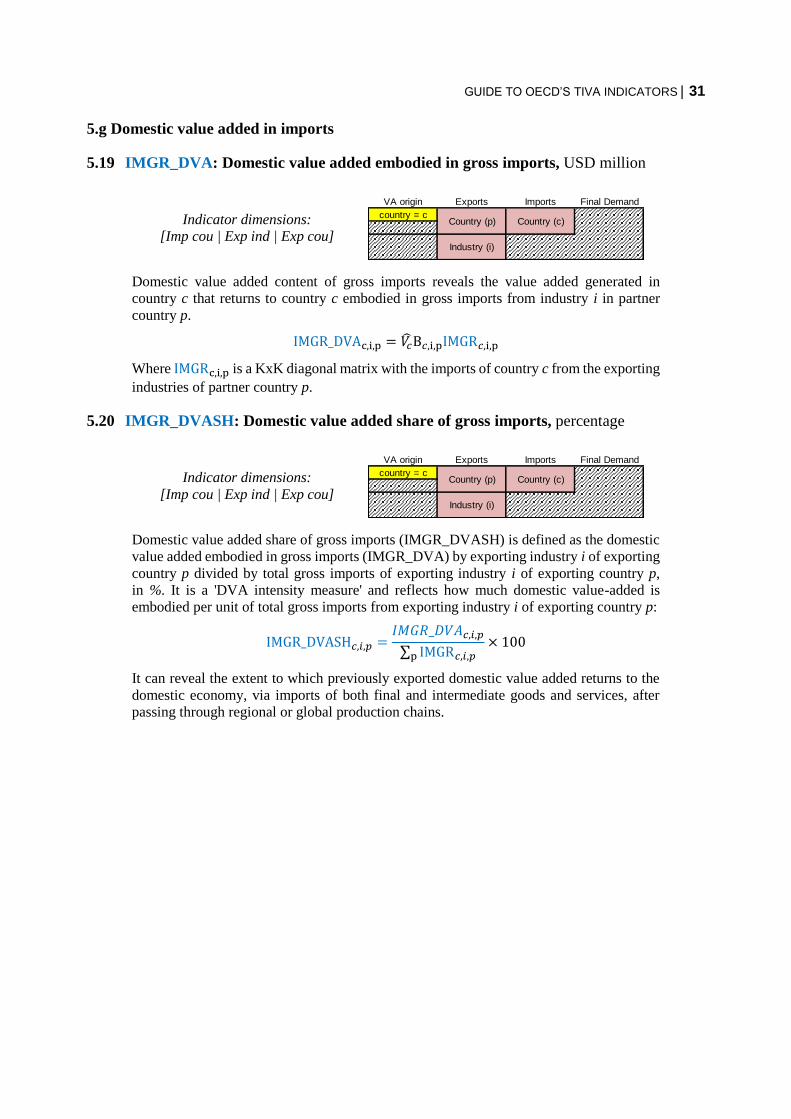
5.19 IMGR_DVA: Domestic value added embodied in gross imports, USD million
Indicator dimensions:
[Imp cou | Exp ind | Exp cou]
Domestic value added content of gross imports reveals the value added generated in
country c that returns to country c embodied in gross imports from industry i in partner
country p.
IMGR_DVAc,i,p = 𝑉��B𝑐,i,pIMGR𝑐,i,p
Where IMGRc,i,p is a KxK diagonal matrix with the imports of country c from the exporting
industries of partner country p.
5.20 IMGR_DVASH: Domestic value added share of gross imports, percentage
Indicator dimensions:
[Imp cou | Exp ind | Exp cou]
Domestic value added share of gross imports (IMGR_DVASH) is defined as the domestic
value added embodied in gross imports (IMGR_DVA) by exporting industry i of exporting
country p divided by total gross imports of exporting industry i of exporting country p,
in %. It is a 'DVA intensity measure' and reflects how much domestic value-added is
embodied per unit of total gross imports from exporting industry i of exporting country p:
IMGR_DVASH𝑐,𝑖,𝑝 =𝐼𝑀𝐺𝑅_𝐷𝑉𝐴𝑐,𝑖,𝑝
∑ IMGR𝑐,𝑖,𝑝p× 100
It can reveal the extent to which previously exported domestic value added returns to the
domestic economy, via imports of both final and intermediate goods and services, after
passing through regional or global production chains.
VA origin Exports Imports Final Demand
country = cCountry (p) Country (c)
Industry (i)
VA origin Exports Imports Final Demand
country = cCountry (p) Country (c)
Industry (i)

32 GUIDE TO OECD’S TIVA INDICATORS
5.h Re-exported intermediate imports
5.21 REII: Re-exported intermediate imports, USD million
Indicator dimensions:
[Exp cou | Prod ind | World]
Imported products which are used as inputs into production processes and then exported
again are referred to as re-exported intermediate products. This indicator is available by
country and exporting industry.
REIIc,i = ∑ 𝐴𝑝,𝑐𝑝
Bc,cEXGRc,i
Ap,c is a K x K off-diagonal block matrix of A giving country c imported intermediate
products sourced from country p required to produce one unit of output.
EXGRc,i is a K x 1 vector, representing total exports of each industry i of country c to all
other countries.
Ap,cBc,cEXGRc, is also a K x 1 vector and refers to intermediate goods and services absorbed
in country c that originated from country p for total exports by country c.
REIIc,i gives total intermediate goods and services absorbed by country c that originated
from all foreign countries in industry i. It reveals the importance of intermediate imports in
the production of goods and services for export and their role as a source for international
competitiveness.
5.22 IMGRINT_REII: Re-exported intermediate imports as a % of total intermediate
imports, percentage
Indicator dimensions:
[Exp cou | Prod ind | World]
Re-exported intermediate imports by exporting industry as a share of intermediate imports
shows how much of the imports are exported.
IMGRINT_REIIc,i =REIIc,i
∑ IMGR_INTc,i,pp
Where ∑ IMGR_INTc,i,pp is total intermediate imports by country c from industry i in
partner p.
This indicator reflects the share of intermediate imports from all partners’ industry i that
are used domestically by country c (both indirectly and directly) in producing goods and
services for export, as a percentage of total intermediate imports (from industry i).
The indicator provides a measure of the importance of intermediate imports to produce
goods and services for export and their role as a source of international competitiveness
imports Exports Imports Final Demand
Country (c)
Industry (i)∑intermediates
imports Exports Imports Final Demand
Country (c)
Industry (i)∑intermediates

GUIDE TO OECD’S TIVA INDICATORS 33
6 Indicators based on the origins of Value Added in Final Demand
6.1 FFD_DVA: Domestic value added embodied in foreign final demand, USD million
Indicator dimensions: [VA src cou | VA src ind | FD cou]
Domestic value added embodied in foreign final demand captures the value added that
industries export both directly, through exports of final goods or services and, indirectly
via exports of intermediates that reach foreign final consumers (households, government,
business investment) through other countries. The measure reflects how domestic
industries (upstream in a value-chain) are connected to consumers in other countries, even
when no direct trade relationship exists. The indicator illustrates therefore the full impact
of final demand in foreign markets on domestic output. It can be interpreted as 'exports of
value added', and is defined as:
FFD_DVAc,p = (�� 𝐁 𝐅𝐃)𝑐,𝑝
Where FFD_DVAc,p is a K x 1 vector. Matrix �� 𝐁 𝐅𝐃 is of size (KN x K) and calculated
from multiplying the three global matrices, ��, the diagonalized value added share of
production PROD_VASH, 𝐁 the global Leontief inverse and 𝐅𝐃 the global final demand
matrix showing the demand of country p (in columns) for goods and services from industry
i in country c (rows), and (�� 𝐁 𝐅𝐃)𝑐,𝑝
is the part of the matrix with K rows (one for each
industry) corresponding to country c and column corresponding to country p. This is only
available for 𝑝 ≠ 𝑐. FFD_DVA is available by value added country, value added industry,
and partner country.
FFD_DVAc,p,i is the i-th element of the K x 1 vector FFD_DVAc,p
FFD_DVAc,p,i shows the value added originating from industry i in country/region c
embodied in the final demand of country/region p.
For regions c, FFD_DVA excludes within-region final demand (e.g. for EU28, final
demand in non-EU28 economies only).
Exports Imports Final Demand
Country (c)
Industry (i)
Country (p) ≠ c
VA origin
34 GUIDE TO OECD’S TIVA INDICATORS
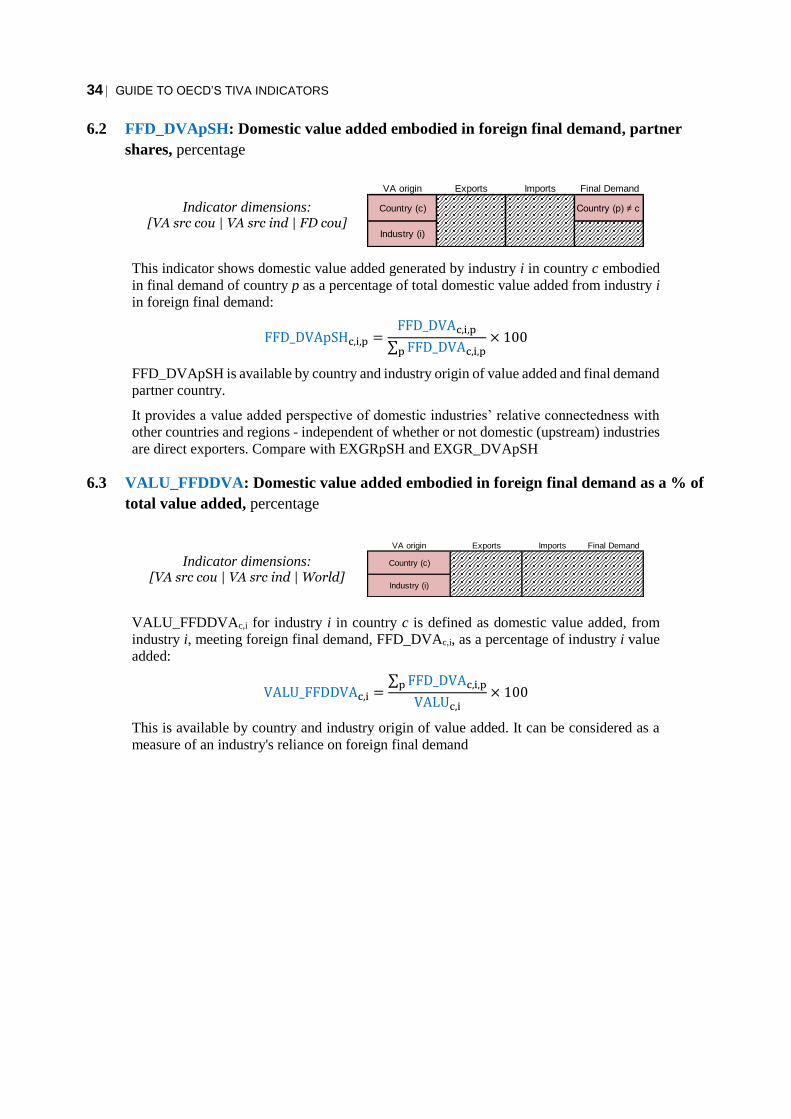
6.2 FFD_DVApSH: Domestic value added embodied in foreign final demand, partner
shares, percentage
Indicator dimensions: [VA src cou | VA src ind | FD cou]
This indicator shows domestic value added generated by industry i in country c embodied
in final demand of country p as a percentage of total domestic value added from industry i
in foreign final demand:
FFD_DVApSHc,i,p =FFD_DVAc,i,p
∑ FFD_DVAc,i,pp× 100
FFD_DVApSH is available by country and industry origin of value added and final demand
partner country.
It provides a value added perspective of domestic industries’ relative connectedness with
other countries and regions - independent of whether or not domestic (upstream) industries
are direct exporters. Compare with EXGRpSH and EXGR_DVApSH
6.3 VALU_FFDDVA: Domestic value added embodied in foreign final demand as a % of
total value added, percentage
Indicator dimensions: [VA src cou | VA src ind | World]
VALU_FFDDVAc,i for industry i in country c is defined as domestic value added, from
industry i, meeting foreign final demand, FFD_DVAc,i, as a percentage of industry i value
added:
VALU_FFDDVAc,i =∑ FFD_DVAc,i,pp
VALUc,i× 100
This is available by country and industry origin of value added. It can be considered as a
measure of an industry's reliance on foreign final demand
Exports Imports Final Demand
Country (c)
Industry (i)
Country (p) ≠ c
VA origin
VA origin Exports Imports Final Demand
Country (c)
Industry (i)

GUIDE TO OECD’S TIVA INDICATORS 35
6.4 DFD_FVA: Foreign value added embodied in domestic final demand, USD million
Indicator dimensions: [FD cou | VA src ind | VA src cou]
Foreign value added embodied in domestic final demand reveals the amount of foreign
value added present in final goods or services purchased by households, government, non-
profit institutions serving households or, as investments. It is the 'import' equivalent of
FFD_DVA and can show how industries abroad (upstream in a value-chain) are connected
to consumers at home, even where no direct trade relationship exists. It can be interpreted
as 'imports of value-added', in such a way:
DFD_FVAp,c = (�� 𝐵 𝐹𝐷)𝑝,𝑐
DFD_FVA𝑝,c is the part of matrix �� 𝐵 𝐹𝐷 with rows corresponding to country p industries
and column c of domestic consumption. This is only available for 𝑝 ≠ 𝑐.
DFD_FVAp,c,i is the i-th element of the K x 1 vector DFD_FVAp,c
DFD_FVAp,c,i shows the value added originating from industry i in country/region p
embodied in the final demand of country/region c.
For regions c, DFD_FVA excludes within-region origin of value added (e.g. for EU28,
foreign value added is non-EU28 origin only).
6.5 DFD_FVApSH: Foreign value added embodied in domestic final demand, partner
shares, percentage
Indicator dimensions: [FD cou | VA src ind | VA src cou]
This indicator shows foreign value added generated by industry i in country p embodied in
domestic final demand of country c as a percentage of total foreign value added from
industry i in domestic final demand
DFD_FVApSH𝑐,𝑖,𝑝 =DFD_FVA𝑐,𝑖,𝑝
∑ DFD_FVA𝑐,𝑖,𝑝p× 100
DFD_FVApSH is available by country and, partner country and industry origin of value
added.
It provides a value added perspective of a domestic economy’s relative connectedness to
production in other countries and regions - independent of whether or not there are direct
imports from foreign (upstream) industries. Compare with IMGRpSH
Imports Final Demand
Country (p) ≠ c Country (c)
Industry (i)
VA origin Exports
Imports Final Demand
Country (p) ≠ c Country (c)
Industry (i)
VA origin Exports
36 GUIDE TO OECD’S TIVA INDICATORS
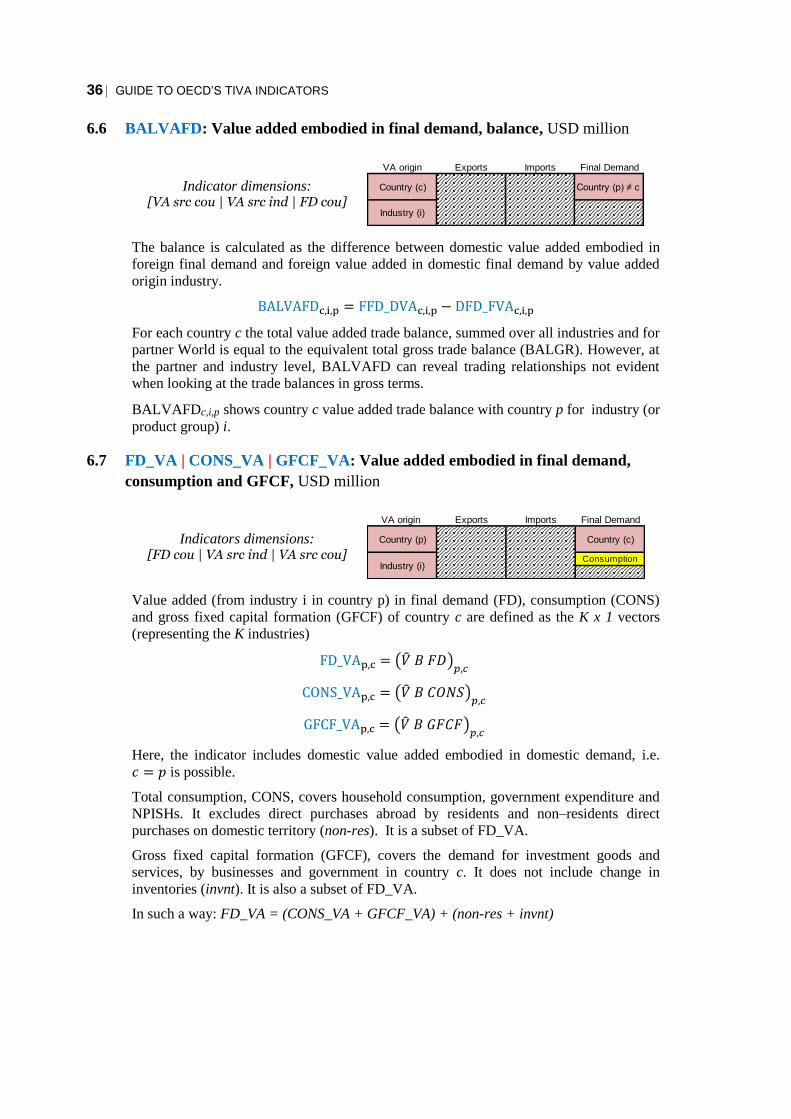
6.6 BALVAFD: Value added embodied in final demand, balance, USD million
Indicator dimensions: [VA src cou | VA src ind | FD cou]
The balance is calculated as the difference between domestic value added embodied in
foreign final demand and foreign value added in domestic final demand by value added
origin industry.
BALVAFDc,i,p = FFD_DVAc,i,p − DFD_FVAc,i,p
For each country c the total value added trade balance, summed over all industries and for
partner World is equal to the equivalent total gross trade balance (BALGR). However, at
the partner and industry level, BALVAFD can reveal trading relationships not evident
when looking at the trade balances in gross terms.
BALVAFDc,i,p shows country c value added trade balance with country p for industry (or
product group) i.
6.7 FD_VA | CONS_VA | GFCF_VA: Value added embodied in final demand,
consumption and GFCF, USD million
Indicators dimensions: [FD cou | VA src ind | VA src cou]
Value added (from industry i in country p) in final demand (FD), consumption (CONS)
and gross fixed capital formation (GFCF) of country c are defined as the K x 1 vectors
(representing the K industries)
FD_VAp,c = (�� 𝐵 𝐹𝐷)𝑝,𝑐
CONS_VAp,c = (�� 𝐵 𝐶𝑂𝑁𝑆)𝑝,𝑐
GFCF_VAp,c = (�� 𝐵 𝐺𝐹𝐶𝐹)𝑝,𝑐
Here, the indicator includes domestic value added embodied in domestic demand, i.e.
𝑐 = 𝑝 is possible.
Total consumption, CONS, covers household consumption, government expenditure and
NPISHs. It excludes direct purchases abroad by residents and non–residents direct
purchases on domestic territory (non-res). It is a subset of FD_VA.
Gross fixed capital formation (GFCF), covers the demand for investment goods and
services, by businesses and government in country c. It does not include change in
inventories (invnt). It is also a subset of FD_VA.
In such a way: FD_VA = (CONS_VA + GFCF_VA) + (non-res + invnt)
Exports Imports Final Demand
Country (c)
Industry (i)
Country (p) ≠ c
VA origin
Industry (i)Consumption
VA origin Exports Imports Final Demand
Country (p) Country (c)

GUIDE TO OECD’S TIVA INDICATORS 37
6.8 FD_VASH | CONS_VASH | GFCF_VASH: Value added shares in final demand,
consumption and GFCF, percentage
Indicators dimensions: [FD cou | VA src ind | VA src cou]
These indicators look on the demand side of the countries, i.e., for the total domestic
demand (final demand, consumption or GFCF) of a country c they show what is the share
of the value added from source country p industry i in country c total value added consumed
and which has its origin in industry i. They are defined as follows:
FD_VASHp,c,i =FD_VA𝑝,c,i
∑ FD_VAp,c,i𝑝 x 100
CONS_VASHp,c,i =CONS_VAp,c,i
∑ CONS_VAp,c,i𝑝 x 100
GFCF_VASHp,c,i =GFCF_VAp,c,i
∑ GFCF_VAp,c,i𝑝x100
Total consumption, CONS, covers household consumption, government expenditure and
NPISHs. It excludes direct purchases abroad by residents. It is a subset of FD_VA.
Gross fixed capital formation (GFCF), covers the demand for investment goods and
services, by businesses and government in country c. It is also a subset of FD_VA.
Industry (i)Consumption
VA origin Exports Imports Final Demand
Country (p) Country (c)

38 GUIDE TO OECD’S TIVA INDICATORS
7 Detailed Indicators for Gross Exports, Gross Imports and Final Demand
7.1 EXGR_BSCI: Origin of value added in gross exports, USD million
Indicators dimensions: [VA src cou | VA src ind | Exp cou | Exp ind]
Origin of value added in gross exports provides estimates of total gross exports by
exporting industry i in country c broken down by the value added generated by source
industry h in country p:
EXGR_BSCI𝑝,h,c,i = (VB EXGR𝑐,i)𝑝,h
Where EXGR𝑐,i is a vector of size KN x 1, with all entries being zero except the entry
corresponding to exports by country c industry i. VB EXGR𝑐,i is a vector of size KN x 1 as
well and (VB EXGR𝑐,i)𝑝,h is the vector element corresponding to value adding in country
p industry h.
This indicator reveals how the value of a country’s gross exports of intermediate and final
products is an accumulation of value generated by many industries in many countries.
Domestic value added origin is shown where source country p=c and, for convenience,
also represented by source country = “DXD: Domestic”.
From this indicator a range of gross exports-based measures can be derived including those
in the main TiVA indicators database such as:
Total gross exports by industry, EXGR𝑐,i: set VA source country, p = World, source
industry, h = DTOTAL;
Total domestic and foreign value added content of gross exports by industry,
EXGR_DVAc,i and EXGR_FVAc,i. For EXGR_DVA, set source country p = DXD
“Domestic”, VA source industry, h = DTOTAL;
Shares of EXGR_DVA and EXGR_FVA in relation to EXGR such as EXGR_DVASHc,i,
EXGR_TDVAINDc,i, and the “GVC backward linkage” indicators EXGR_FVASHc,i and
EXGR_TFVAINDc,i;
“GVC forward linkage” indicators such as EXGR_DVAFXSH;
Service value added contents of gross exports EXGR_SERV_DVASHc,i and
EXGR_SERV_FVASHc,i. Set source industry, h = D41T98 (Total Services including
Construction activities);
For regions, exports exclude intra-regional trade and, intra-regional value added flows are
considered as domestic value added. For example, for exporting region EU28, exports are
to non-EU28 economies and, source country “DXD : domestic” includes value added
originating from Member States.
Note that the same value added originating from industry j in country p can be present in
the gross exports of more than one country c (as embodied value added, from upstream
production, may cross national borders many times). In general, therefore, these estimates
should be viewed from the perspective of the exporting country c and exporting industry i.
VA origin Exports Imports Final Demand
Country (c)
Industry (i)
Country (p)
Industry (h)

GUIDE TO OECD’S TIVA INDICATORS 39
However, for indicators of “GVC forward linkages” a source country p, source industry j
perspective is required.
7.2 IMGR_BSCI: Origin of value added in gross imports, USD million
Indicators dimensions: [Imp cou | VA src cou | Exp ind | Exp cou]
Origin of value added in gross imports provides estimates of the value added in gross
imports by country c of goods and services from industry i originating from partner
country/region p broken down by value added originating from country/region s.
IMGR_BSCIp,c,i,s = ��𝐵 𝐼𝑀𝐺𝑅𝑝,c
Where IMGRp,c is a diagonal matrix of size KNxKN, with the gross imports of country c
from the exporting industries of the partners’ countries p.
In other words, the four dimensions link the imports of country c to the value added from
source country s embodied in the exports of industry i in the exporting country p - thus
revealing how the value of a country’s gross imports of intermediate and final products
from a particular partner is an accumulation of value generated by many countries.
From this indicator a range of gross imports-based measures can be derived including the
following found in the main TiVA indicators database:
Total gross imports by industry, IMGRc,i: set exporting country, p = World and source
country, s = World.
Domestic value added content of gross imports by partner and industry, IMGR_DVAc,p,i:
set source country s = importing country c.
Share of IMGR_DVA in relation to IMGR: IMGR_DVASHc,p,i
Note that the same value added originating from source country s can be present in the
gross imports of more than one importing country c (as embodied value added, from
upstream production, may cross national borders many times). In general, therefore, these
estimates should be viewed from the perspective of an importing country c.
VA origin Exports Imports Final Demand
Country (s) Country (p) Country (c)
Industry (i)

40 GUIDE TO OECD’S TIVA INDICATORS
7.3 FDVA_BSCI: Origin of value added in final demand, USD million
Indicators dimensions: [VA src cou | VA src ind | FD cou | FD ind]
Origin of value added in final demand provides estimates of value added for final demand
in country p for industry h final goods and services broken down by the value added
generated by source industry i in VA source country c.
FDVA_BSCI𝑐,𝑖,𝑝,h = (VB FDp,h)𝑐,i
Where FDp,h is a vector of size KN x 1, with all entries being zero except the entry
corresponding to final demand for goods and services of industry ℎ in country 𝑝. VB FDp,h
is a vector of size KN x 1 as well and (VB FDp,h)𝑐,𝑖
is the vector element corresponding to
value added generate by industry 𝑖 in country c.
In other words, it reveals how the value of final demand goods and services consumed
within a country is an accumulation of value generated by many industries in many
countries.
Domestic value added origin is shown where source country p = c and, for convenience,
also represented by source country = “DXD: Domestic”.
From this indicator a range of final demand-based measures can be derived including those
in the main TiVA indicators database such as:
Domestic value added embodied in foreign final demand, FFD_DVA and related partner
shares FFD_DVApSH;
Foreign value added embodied in domestic final demand, DFD_FVA and related partner
shares DFD_FVApSH.
VA origin Exports Imports Final Demand
Country (c)
Industry (i)
Country (p)
Industry (h)
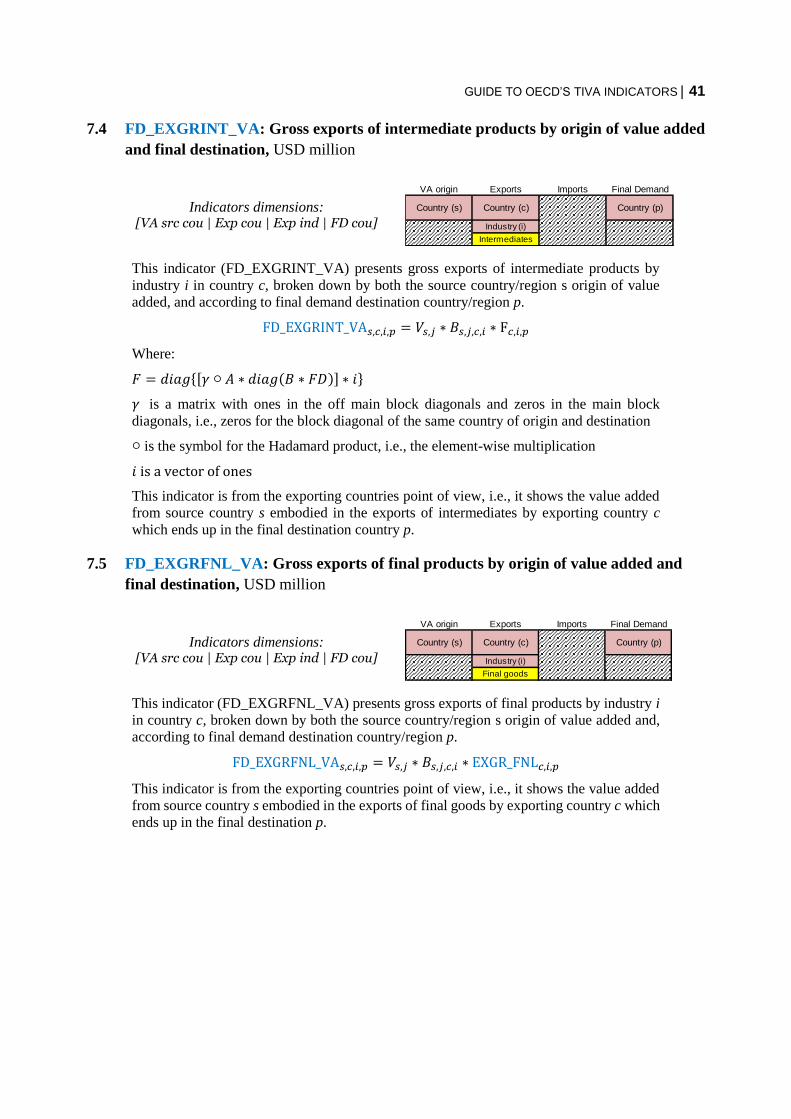
GUIDE TO OECD’S TIVA INDICATORS 41
7.4 FD_EXGRINT_VA: Gross exports of intermediate products by origin of value added
and final destination, USD million
Indicators dimensions: [VA src cou | Exp cou | Exp ind | FD cou]
This indicator (FD_EXGRINT_VA) presents gross exports of intermediate products by
industry i in country c, broken down by both the source country/region s origin of value
added, and according to final demand destination country/region p.
FD_EXGRINT_VA𝑠,𝑐,𝑖,𝑝 = 𝑉𝑠,𝑗 ∗ 𝐵𝑠,𝑗,𝑐,𝑖 ∗ F𝑐,𝑖,𝑝
Where:
𝐹 = 𝑑𝑖𝑎𝑔{[𝛾 ○ 𝐴 ∗ 𝑑𝑖𝑎𝑔(𝐵 ∗ 𝐹𝐷)] ∗ 𝑖}
𝛾 is a matrix with ones in the off main block diagonals and zeros in the main block
diagonals, i.e., zeros for the block diagonal of the same country of origin and destination
○ is the symbol for the Hadamard product, i.e., the element-wise multiplication
𝑖 is a vector of ones
This indicator is from the exporting countries point of view, i.e., it shows the value added
from source country s embodied in the exports of intermediates by exporting country c
which ends up in the final destination country p.
7.5 FD_EXGRFNL_VA: Gross exports of final products by origin of value added and
final destination, USD million
Indicators dimensions: [VA src cou | Exp cou | Exp ind | FD cou]
This indicator (FD_EXGRFNL_VA) presents gross exports of final products by industry i
in country c, broken down by both the source country/region s origin of value added and,
according to final demand destination country/region p.
FD_EXGRFNL_VA𝑠,𝑐,𝑖,𝑝 = 𝑉𝑠,𝑗 ∗ 𝐵𝑠,𝑗,𝑐,𝑖 ∗ EXGR_FNL𝑐,𝑖,𝑝
This indicator is from the exporting countries point of view, i.e., it shows the value added
from source country s embodied in the exports of final goods by exporting country c which
ends up in the final destination p.
Industry (i)
Intermediates
VA origin Exports Imports Final Demand
Country (s) Country (c) Country (p)
Final Demand
Country (s) Country (c) Country (p)
Industry (i)
Final goods
VA origin Exports Imports
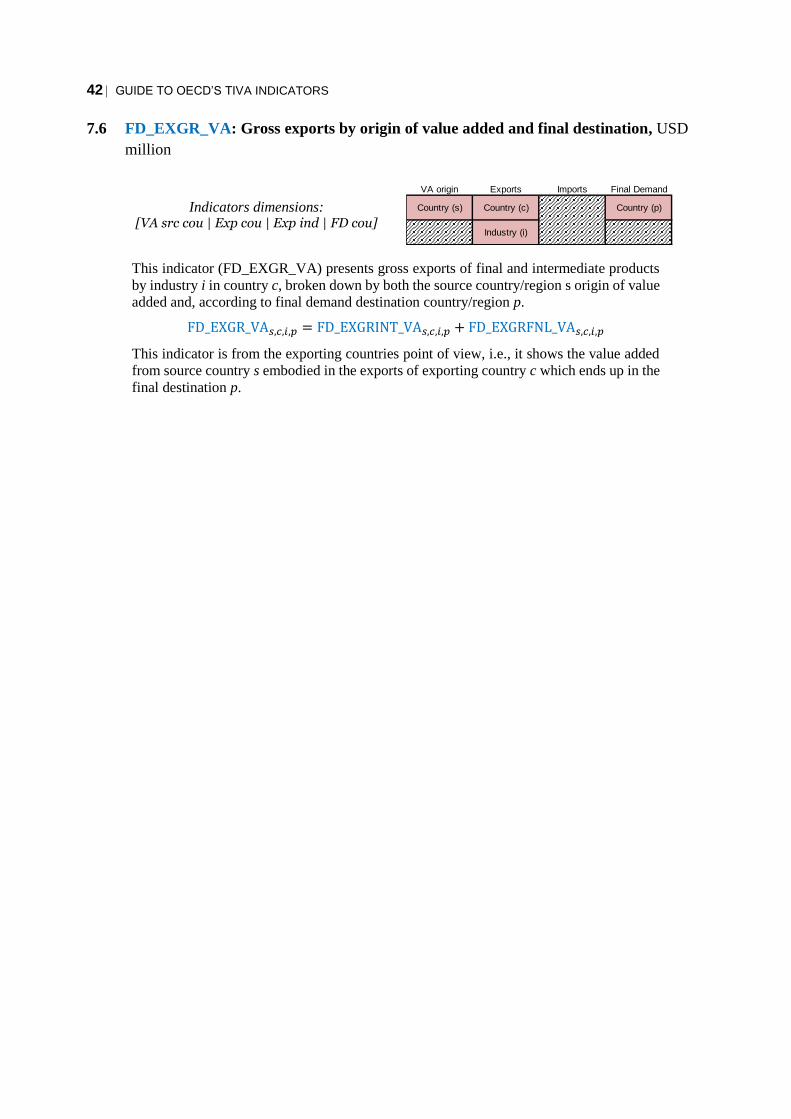
42 GUIDE TO OECD’S TIVA INDICATORS
7.6 FD_EXGR_VA: Gross exports by origin of value added and final destination, USD
million
Indicators dimensions: [VA src cou | Exp cou | Exp ind | FD cou]
This indicator (FD_EXGR_VA) presents gross exports of final and intermediate products
by industry i in country c, broken down by both the source country/region s origin of value
added and, according to final demand destination country/region p.
FD_EXGR_VA𝑠,𝑐,𝑖,𝑝 = FD_EXGRINT_VA𝑠,𝑐,𝑖,𝑝 + FD_EXGRFNL_VA𝑠,𝑐,𝑖,𝑝
This indicator is from the exporting countries point of view, i.e., it shows the value added
from source country s embodied in the exports of exporting country c which ends up in the
final destination p.
Final Demand
Country (s) Country (c) Country (p)
Industry (i)
VA origin Exports Imports

GUIDE TO OECD’S TIVA INDICATORS 43
Annex A. OECD ICIO 2018 Database
The TiVA indicators are estimated for 65 economies (Table A.1), 17 regions (Table A.2),
36 industries (Table A.3), and 19 industries aggregates (Table A.4), covering the years from
2005 to 2015, and for some indicators up to 2016.

44 GUIDE TO OECD’S TIVA INDICATORS
Table A.1 Countries in OECD’s ICIO and TiVA Indicators
1 AUS Australia 37 ARG Argentina
2 AUT Austria 38 BRA Brazil
3 BEL Belgium 39 BRN Brunei Darussalam
4 CAN Canada 40 BGR Bulgaria
5 CHL Chile 41 KHM Cambodia
6 CZE Czech Republic 42 CHN China (People's Republic of)
7 DNK Denmark 43 COL Colombia
8 EST Estonia 44 CRI Costa Rica
9 FIN Finland 45 HRV Croatia
10 FRA France 46 CYP Cyprus2
11 DEU Germany 47 IND India
12 GRC Greece 48 IDN Indonesia
13 HUN Hungary 49 HKG Hong Kong, China
14 ISL Iceland 50 KAZ Kazakhstan
15 IRL Ireland 51 MYS Malaysia
16 ISR Israel152 MLT Malta
17 ITA Italy 53 MAR Morocco
18 JPN Japan 54 PER Peru
19 KOR Korea 55 PHL Philippines
20 LVA Latvia 56 ROU Romania
21 LTU Lithuania 57 RUS Russian Federation
22 LUX Luxembourg 58 SAU Saudi Arabia
23 MEX Mexico 59 SGP Singapore
24 NLD Netherlands 60 ZAF South Africa
25 NZL New Zealand 61 TWN Chinese Taipei
26 NOR Norway 62 THA Thailand
27 POL Poland 63 TUN Tunisia
28 PRT Portugal 64 VNM Viet Nam
29 SVK Slovak Republic 65 ROW Rest of the World
30 SVN Slovenia
31 ESP Spain
32 SWE Sweden
33 CHE Switzerland
34 TUR Turkey
35 GBR United Kingdom
36 USA United States
Notes:
Country
OECD countries
2. Footnote by Turkey: The information in this document with reference to “Cyprus” relates to the southern part of the
Island. There is no single authority representing both Turkish and Greek Cypriot people on the Island. Turkey recognizes
the Turkish Republic of Northern Cyprus (TRNC). Until a lasting and equitable solution is found within the context of the
United Nations, Turkey shall preserve its position concerning the “Cyprus issue”. Footnote by all the European Union
Member States of the OECD and the European Union: The Republic of Cyprus is recognised by all members of the United
Nations with the exception of Turkey. The information in this document relates to the area under the effective control of
the Government of the Republic of Cyprus.
1. The statistical data for Israel are supplied by and under the responsibil ity of the relevant Israeli authorities or third
party. The use of such data by the OECD is without prejudice to the status of the Golan Heights, East Jerusalem and
Israeli settlements in theWest Bank under the terms of international law.
N. Code Country N. Code

GUIDE TO OECD’S TIVA INDICATORS 45
Table A.2 Regions in OECD’s TiVA Indicators
N. Region Heading Country
1 OECD OECD member countries Countries 01 to 36
2 NONOECD Non-OECD economies and aggregates Countries 37 to 65
AUS CAN CHL JPN KOR MEX NZL USA BRN CHN
HKG IDN MYS PER PHL RUS SGP THA TWN VNM
4 ASEAN Association of South East Asian Nations2 BRN IDN KHM MYS PHL SGP THA VNM
5 EASIA Eastern Asia JPN KOR CHN HKG TWN
AUT BEL CZE DNK EST FIN FRA DEU GRC HUN
IRL ITA LVA LTU LUX NLD POL PRT SVK SVN
ESP SWE GBR BGR CYP HRV MLT ROU
AUT BEL DNK FIN FRA DEU GRC IRL ITA LUX
NLD PRT ESP SWE GBR
CZE EST HUN LVA LTU POL SVK SVN BGR CYP
HRV MLT ROU
AUT BEL EST FIN FRA DEU GRC IRL ITA LVA
LTU LUX NLD PRT SVK SVN ESP CYP MLT
AUT BEL FIN FRA DEU GRC IRL ITA LUX NLD
PRT ESP
AUS CAN JPN KOR MEX TUR USA ARG BRA CHN
IND IDN RUS SAU ZAF EU28
World divided into regions
AUT BEL CZE DNK EST FIN FRA DEU GRC HUN
ISL IRL ITA LVA LTU LUX NLD NOR POL PRT
SVK SVN ESP SWE CHE GBR BGR CYP HRV MLT
ROU RUS
JPN KOR BRN CHN HKG IDN KHM MYS PHL SGP
THA TWN VNM
14 ZNAM North American Free Trade Association CAN MEX USA
AUS ISR NZL TUR IND KAZ MAR SAU TUN ZAF
ROW
16 ZSCA South and Central America CHL ARG BRA COL CRI PER
17 WLD World
18 DXD Domestic Dummy partner used in the diagonal for some indicators.
Notes:
1. APEC country not included in 2018 TiVA database: Papua New Guinea
2. ASEAN countries not included in 2018 TiVA database: Lao PDR and Myanmar
ZOTH Other regions
10 EA12 Euro area (12 countries)
ZASI13
APEC Asia-Pacific Economic Cooperation1
OECD countries
12 ZEUR Europe
European Union (28 countries)EU286
European Union (15 countries)
11 G20 Group of Twenty
East and South East Asia
3
15
Euro area (19 countries)EA19
EU157
EU28 excluding EU15EU138
9

46 GUIDE TO OECD’S TIVA INDICATORS
Table A.3 Industries in OECD’s ICIO and TiVA Indicators
N. Code Industry ISIC Rev.4
1 D01T03 Agriculture, hunting, forestry and fishing 01, 02, 03
2 D05T06 Mining and extraction of energy producing products 05, 06
3 D07T08 Mining and quarrying of non-energy producing products 07, 08
4 D09 Services to mining and quarrying 09
5 D10T12 Food products, beverages and tobacco 10, 11, 12
6 D13T15 Textiles, textile products, leather and footwear 13, 14, 15
7 D16 Wood and products of wood and cork 16
8 D17T18 Paper products and printing 17, 18
9 D19 Coke and refined petroleum products 19
10 D20T21 Chemicals and chemical products 20, 21
11 D22 Rubber and plastics products 22
12 D23 Other non-metallic mineral products 23
13 D24 Basic metals 24
14 D25 Fabricated metal products 25
15 D26 Computer, electronic and optical equipment 26
16 D27 Electrical machinery and apparatus, nec 27
17 D28 Machinery and equipment, nec 28
18 D29 Motor vehicles, trailers and semi-trailers 29
19 D30 Other transport equipment 30
20 D31T33 Manufacturing nec; repair of machinery and equipment 31, 32, 33
21 D35T39 Electricity, gas, water supply, sewerage, waste and remediation services 35,36, 37, 38, 39
22 D41T43 Construction 41, 42, 43
23 D45T47 Wholesale and retail trade; repair of motor vehicles 45, 46, 47
24 D49T53 Transportation and storage 49, 50, 51, 52, 53
25 D55T56 Accomodation and food services 55, 56
26 D58T60 Publishing, audiovisual and broadcasting activities 58, 59, 60
27 D61 Telecommunications 61
28 D62T63 IT and other information services 62, 63
29 D64T66 Financial and insurance activities 64, 65, 66
30 D68 Real estate activities 68
31 D69T82 Other business sector services 69, 70, 71, 72, 73, 74, 75, 77, 78, 79, 80, 81, 82
32 D84 Public admin. and defence; compulsory social security 84
33 D85 Education 85
34 D86T88 Health and social work 86, 87, 88
35 D90T96 Other community, social and personal services 90, 91, 92, 93,94,95, 96
36 D97T98 Private households with employed persons 97, 98
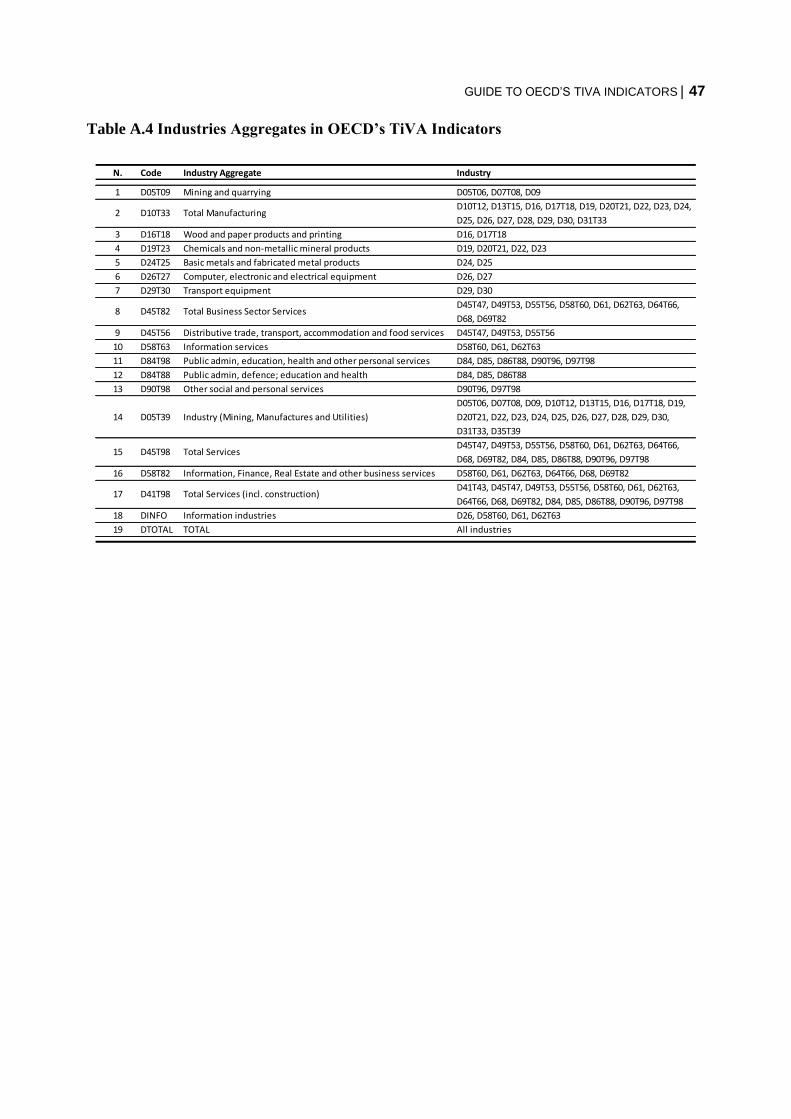
GUIDE TO OECD’S TIVA INDICATORS 47
Table A.4 Industries Aggregates in OECD’s TiVA Indicators
N. Code Industry Aggregate Industry
1 D05T09 Mining and quarrying D05T06, D07T08, D09
D10T12, D13T15, D16, D17T18, D19, D20T21, D22, D23, D24,
D25, D26, D27, D28, D29, D30, D31T33
3 D16T18 Wood and paper products and printing D16, D17T18
4 D19T23 Chemicals and non-metallic mineral products D19, D20T21, D22, D23
5 D24T25 Basic metals and fabricated metal products D24, D25
6 D26T27 Computer, electronic and electrical equipment D26, D27
7 D29T30 Transport equipment D29, D30
D45T47, D49T53, D55T56, D58T60, D61, D62T63, D64T66,
D68, D69T82
9 D45T56 Distributive trade, transport, accommodation and food services D45T47, D49T53, D55T56
10 D58T63 Information services D58T60, D61, D62T63
11 D84T98 Public admin, education, health and other personal services D84, D85, D86T88, D90T96, D97T98
12 D84T88 Public admin, defence; education and health D84, D85, D86T88
13 D90T98 Other social and personal services D90T96, D97T98
D05T06, D07T08, D09, D10T12, D13T15, D16, D17T18, D19,
D20T21, D22, D23, D24, D25, D26, D27, D28, D29, D30,
D31T33, D35T39
D45T47, D49T53, D55T56, D58T60, D61, D62T63, D64T66,
D68, D69T82, D84, D85, D86T88, D90T96, D97T98
16 D58T82 Information, Finance, Real Estate and other business services D58T60, D61, D62T63, D64T66, D68, D69T82
D41T43, D45T47, D49T53, D55T56, D58T60, D61, D62T63,
D64T66, D68, D69T82, D84, D85, D86T88, D90T96, D97T98
18 DINFO Information industries D26, D58T60, D61, D62T63
19 DTOTAL TOTAL All industries
2 D10T33 Total Manufacturing
8 D45T82 Total Business Sector Services
17 D41T98 Total Services (incl. construction)
14 D05T39 Industry (Mining, Manufactures and Utilities)
15 D45T98 Total Services