guide nsx troubleshooting - docs.vmware.com · nsx troubleshooting guide 1 the nsx troubleshooting...
TRANSCRIPT
NSX TroubleshootingGuideUpdate 2Modified on 18 AUG 2016VMware NSX Data Center for vSphere 6.2
NSX Troubleshooting Guide
VMware, Inc. 2
You can find the most up-to-date technical documentation on the VMware website at:
https://docs.vmware.com/
If you have comments about this documentation, submit your feedback to
Copyright © 2010 – 2017 VMware, Inc. All rights reserved. Copyright and trademark information.
VMware, Inc.3401 Hillview Ave.Palo Alto, CA 94304www.vmware.com

Contents
1 NSX Troubleshooting Guide 4
2 Infrastructure Preparation 5
NSX Infrastructure Preparation Steps 7
Checking Communication Channel Health 20
Troubleshooting NSX Manager Issues 21
Recover from an NSX Controller Failure 23
Using the NSX Dashboard 25
Using the show host health-status Command 27
Setting the Logging Level of NSX Components 27
vSphere ESX Agent Manager 29
NSX CLI Cheat Sheet 31
3 Traceflow 41
About Traceflow 41
Use Traceflow for Troubleshooting 43
4 NSX Routing 51
Understanding the Distributed Logical Router 52
Understanding Routing Provided by the Edge Services Gateway 56
ECMP Packet Flow 56
NSX Routing: Prerequisites and Considerations 58
DLR and ESG UIs 61
New NSX Edge (DLR) 63
Typical ESG and DLR UI Operations 67
Troubleshooting NSX Routing 71
5 Edge Appliance Troubleshooting 102
6 Distributed Firewall 116
How to Use the show dfw CLI 116
Troubleshooting Distributed Firewall 118
7 Load Balancing 125
Scenario: Configure a One-Armed Load Balancer 126
Load Balancer Troubleshooting Using the UI 130
Load Balancer Troubleshooting Using the CLI 131
Common Load Balancer Issues 134
VMware, Inc. 3
NSX Troubleshooting Guide 1The NSX Troubleshooting Guide describes how to monitor and troubleshoot the VMware® NSX™ systemby using the NSX Manager user interface, the vSphere Web Client, and other NSX components, asneeded.
Intended AudienceThis manual is intended for anyone who wants to install or use NSX in a VMware vCenter environment.The information in this manual is written for experienced system administrators who are familiar withvirtual machine technology and virtual datacenter operations. This manual assumes familiarity withVMware Infrastructure 5.x, including VMware ESX, vCenter Server, and the vSphere Web Client.
VMware Technical Publications GlossaryVMware Technical Publications provides a glossary of terms that might be unfamiliar to you. Fordefinitions of terms as they are used in VMware technical documentation, go to http://www.vmware.com/support/pubs.
VMware, Inc. 4
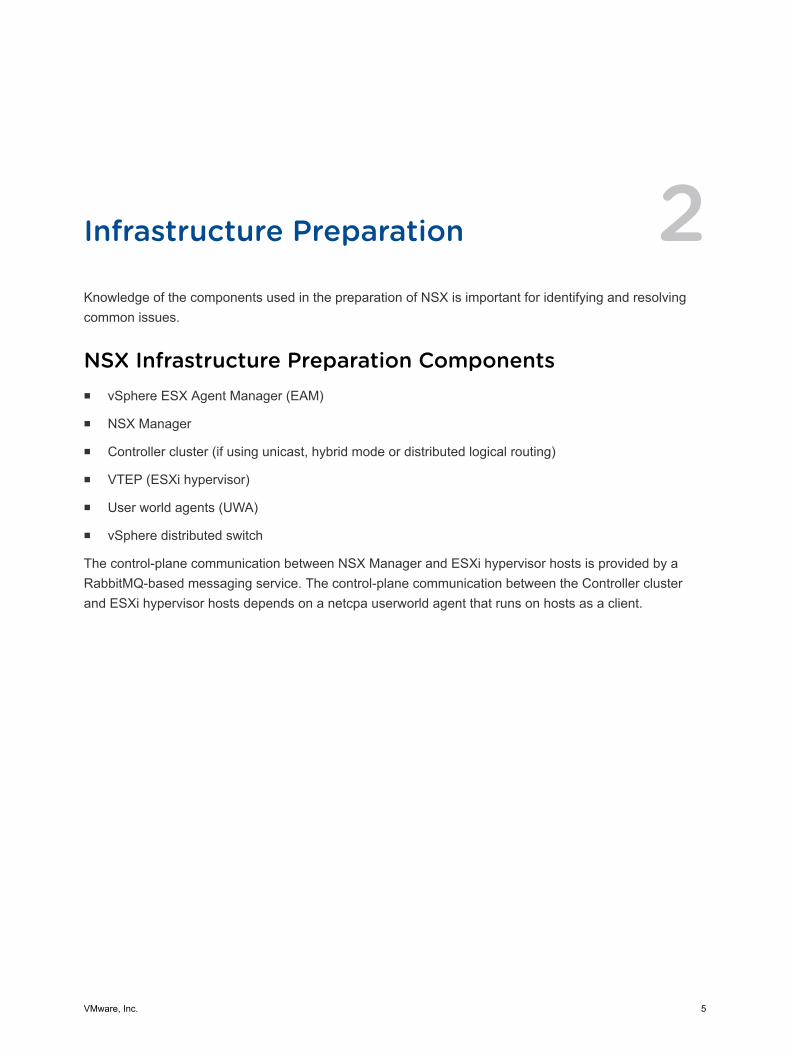
Infrastructure Preparation 2Knowledge of the components used in the preparation of NSX is important for identifying and resolvingcommon issues.
NSX Infrastructure Preparation Componentsn vSphere ESX Agent Manager (EAM)
n NSX Manager
n Controller cluster (if using unicast, hybrid mode or distributed logical routing)
n VTEP (ESXi hypervisor)
n User world agents (UWA)
n vSphere distributed switch
The control-plane communication between NSX Manager and ESXi hypervisor hosts is provided by aRabbitMQ-based messaging service. The control-plane communication between the Controller clusterand ESXi hypervisor hosts depends on a netcpa userworld agent that runs on hosts as a client.
VMware, Inc. 5
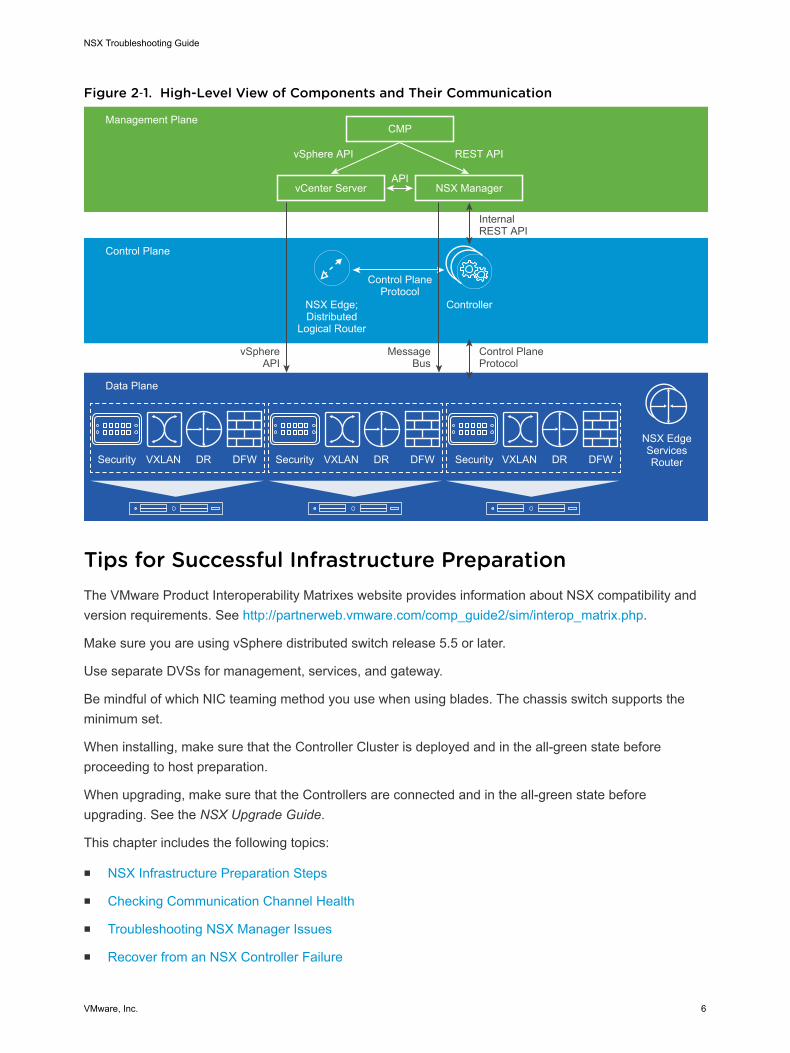
Figure 2‑1. High-Level View of Components and Their Communication
CMP
API
Control Plane Protocol
REST API
Internal REST API
Control PlaneProtocol
MessageBus
vSphereAPI
vSphere API
NSX Edge;Distributed
Logical Router
NSX EdgeServicesRouter
Controller
vCenter Server NSX Manager
Management Plane
Control Plane
Data Plane
Security VXLAN DR DFW Security VXLAN DR DFW Security VXLAN DR DFW
Tips for Successful Infrastructure PreparationThe VMware Product Interoperability Matrixes website provides information about NSX compatibility andversion requirements. See http://partnerweb.vmware.com/comp_guide2/sim/interop_matrix.php.
Make sure you are using vSphere distributed switch release 5.5 or later.
Use separate DVSs for management, services, and gateway.
Be mindful of which NIC teaming method you use when using blades. The chassis switch supports theminimum set.
When installing, make sure that the Controller Cluster is deployed and in the all-green state beforeproceeding to host preparation.
When upgrading, make sure that the Controllers are connected and in the all-green state beforeupgrading. See the NSX Upgrade Guide.
This chapter includes the following topics:
n NSX Infrastructure Preparation Steps
n Checking Communication Channel Health
n Troubleshooting NSX Manager Issues
n Recover from an NSX Controller Failure
NSX Troubleshooting Guide
VMware, Inc. 6
n Using the NSX Dashboard
n Using the show host health-status Command
n Setting the Logging Level of NSX Components
n vSphere ESX Agent Manager
n NSX CLI Cheat Sheet
NSX Infrastructure Preparation StepsNSX preparation is a 4-step process.
1 Connect NSX Manager to vCenter Server. There is a one-to-one relationship between NSX Managerand vCenter Server.
a Register with vCenter Server
2 Deploy NSX Controllers (Only required for logical switching, distributed routing, or edge service. Ifyou are only using distributed firewallm(DFW), controllers are not required).
3 Host Preparation: Installs VIBs for VXLAN, DFW, and DLR on all hosts in the cluster. Configures theRabbit MQ-based messaging infrastructure. Enables firewall. Notifies controllers that hosts are readyfor NSX.
4 Configure IP pool settings and configure VXLAN: Creates a VTEP port group and VMKNICs on allhosts in the cluster. During this step, you can set the transport VLAN ID, teaming policy, and MTU.
Connecting NSX Manager to vCenter ServerA connection between the NSX Manager and the vCenter Server allows NSX Manager to use thevSphere API to perform functions such as deploy service VMs, prepare hosts, and create logical switchportgroups. The connection process installs a web client plug-in for NSX on the Web Client Server.
For the connection to work, you must have DNS and NTP configured on NSX Manager, vCenter Serverand the ESXi hosts. If you added ESXi hosts by name to the vSphere inventory, ensure that DNS servershave been configured on the NSX Manager and name resolution is working. Otherwise, NSX Managercannot resolve the IP addresses. The NTP server must be specified so that the SSO server time and NSXManager time are in sync. On NSX Manager, the drift file at /etc/ntp.drift is included in the techSupport bundle for NSX Manager.
Also the account you use to connect NSX Manager to vCenter Server must have the vCenter role"Administrator." Having the "Administrator" role also enables NSX Manager to register itself with theSecurity Token Service server. When a particular user account is used to connect NSX Manager tovCenter, an “Enterprise Administrator" role for the user is also created on NSX Manager.
Common Issues Related to Connecting NSX Manager to vCenter Servern DNS incorrectly configured on NSX Manager, vCenter Server, or an ESXi host.
n NTP incorrectly configured on NSX Manager, vCenter Server, or an ESXi host.
NSX Troubleshooting Guide
VMware, Inc. 7

n User account without vCenter role of Administrator used to connect NSX Manager to vCenter.
n Network connectivity issues between NSX Manager and vCenter server.
n User logging into vCenter with an account that does not have a role on NSX Manager.
You need to initially log into vCenter with the account you used to link NSX Manager to vCenter Server.Then you can create additional users with roles on NSX Manager using the vCenter Home >Networking & Security > NSX Managers > {IP of NSX Manager} > Manage > Users API.
The first login can take up to 4 minutes while vCenter loads and deploys NSX UI bundles.
Verify Connectivity from NSX Manager to vCenter ServerTo verify connectivity, ping from the NSX virtual appliance and view the ARP and routing tables.
nsxmgr# show arp
IP address HW type Flags HW address Mask Device
192.168.110.31 0x1 0x2 00:50:56:ae:ab:01 * mgmt
192.168.110.2 0x1 0x2 00:50:56:01:20:a5 * mgmt
192.168.110.1 0x1 0x2 00:50:56:01:20:a5 * mgmt
192.168.110.33 0x1 0x2 00:50:56:ae:4f:7c * mgmt
192.168.110.32 0x1 0x2 00:50:56:ae:50:bf * mgmt
192.168.110.10 0x1 0x2 00:50:56:03:19:4e * mgmt
192.168.110.51 0x1 0x2 00:50:56:03:30:2a * mgmt
192.168.110.22 0x1 0x2 00:50:56:01:21:f9 * mgmt
192.168.110.55 0x1 0x2 00:50:56:01:23:21 * mgmt
192.168.110.26 0x1 0x2 00:50:56:01:21:ef * mgmt
192.168.110.54 0x1 0x2 00:50:56:01:22:ef * mgmt
192.168.110.52 0x1 0x2 00:50:56:03:30:16 * mgmt
nsxmgr# show ip route
Codes: K - kernel route, C - connected, S - static,
> - selected route, * - FIB route
S>* 0.0.0.0/0 [1/0] via 192.168.110.1, mgmt
C>* 192.168.110.0/24 is directly connected, mgmt
Look for errors in the NSX Manager log to indicate the reason for not connecting to vCenter Server. Thecommand to view the log is show log manager follow.
Log in to the NSX Manager CLI console, run the command: debug connection IP_of_ESXi_or_VC,and examine the output.
Perform Packet Capture on NSX Manager to View ConnectionsUse the debug packet command: debug packet [capture|display] interface interface filter
NSX Troubleshooting Guide
VMware, Inc. 8
The interface name on NSX Manager is mgmt.
The filter syntax follows this form: "port_80_or_port_443"
The command runs in privileged mode only. To enter privileged mode, run the enable command andprovide the admin password.
Packet capture example:
nsxmgr# en
nsxmgr# debug packet display interface mgmt port_80_or_port_443
tcpdump: verbose output suppressed, use -v or -vv for full protocol decode
listening on mgmt, link-type EN10MB (Ethernet), capture size 262144 bytes
23:40:25.321085 IP 192.168.210.15.54688 > 192.168.210.22.443: Flags [P.], seq 2645022162:2645022199,
ack 2668322748, win 244, options [nop,nop,TS val 1447550948 ecr 365097421], length 37
...
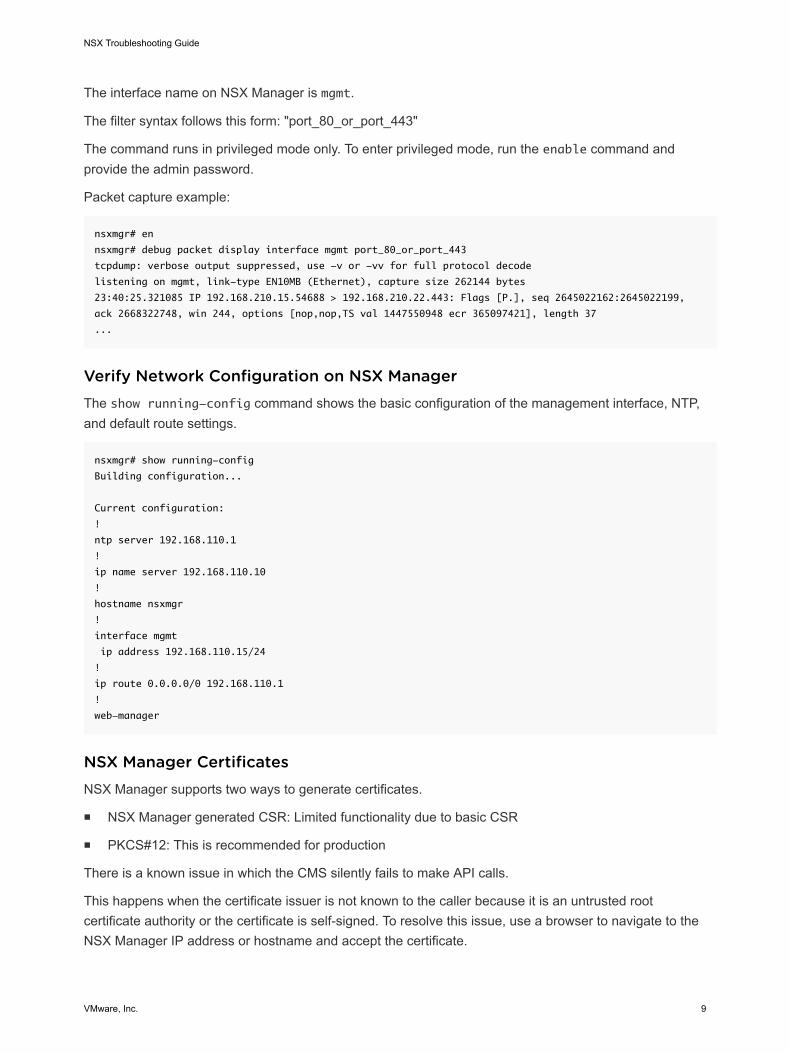
Verify Network Configuration on NSX ManagerThe show running-config command shows the basic configuration of the management interface, NTP,and default route settings.
nsxmgr# show running-config
Building configuration...
Current configuration:
!
ntp server 192.168.110.1
!
ip name server 192.168.110.10
!
hostname nsxmgr
!
interface mgmt
ip address 192.168.110.15/24
!
ip route 0.0.0.0/0 192.168.110.1
!
web-manager
NSX Manager CertificatesNSX Manager supports two ways to generate certificates.
n NSX Manager generated CSR: Limited functionality due to basic CSR
n PKCS#12: This is recommended for production
There is a known issue in which the CMS silently fails to make API calls.
This happens when the certificate issuer is not known to the caller because it is an untrusted rootcertificate authority or the certificate is self-signed. To resolve this issue, use a browser to navigate to theNSX Manager IP address or hostname and accept the certificate.
NSX Troubleshooting Guide
VMware, Inc. 9
Deploying NSX ControllersNSX Controllers are deployed by NSX Manager in OVA format. Having a Controller cluster provides highavailability.
Deploying Controllers requires that NSX Manager, vCenter Server, and ESXi hosts have DNS and NTPconfigured.
A static IP pool must be used to assign IP addresses to each Controller.
It is recommended that you implement DRS anti-affinity rules to keep NSX Controllers on separate hosts.
You must deploy three NSX Controllers.
Common Issues with ControllersDuring the deployment of NSX Controllers, the typical issues that can be encountered are as follows:
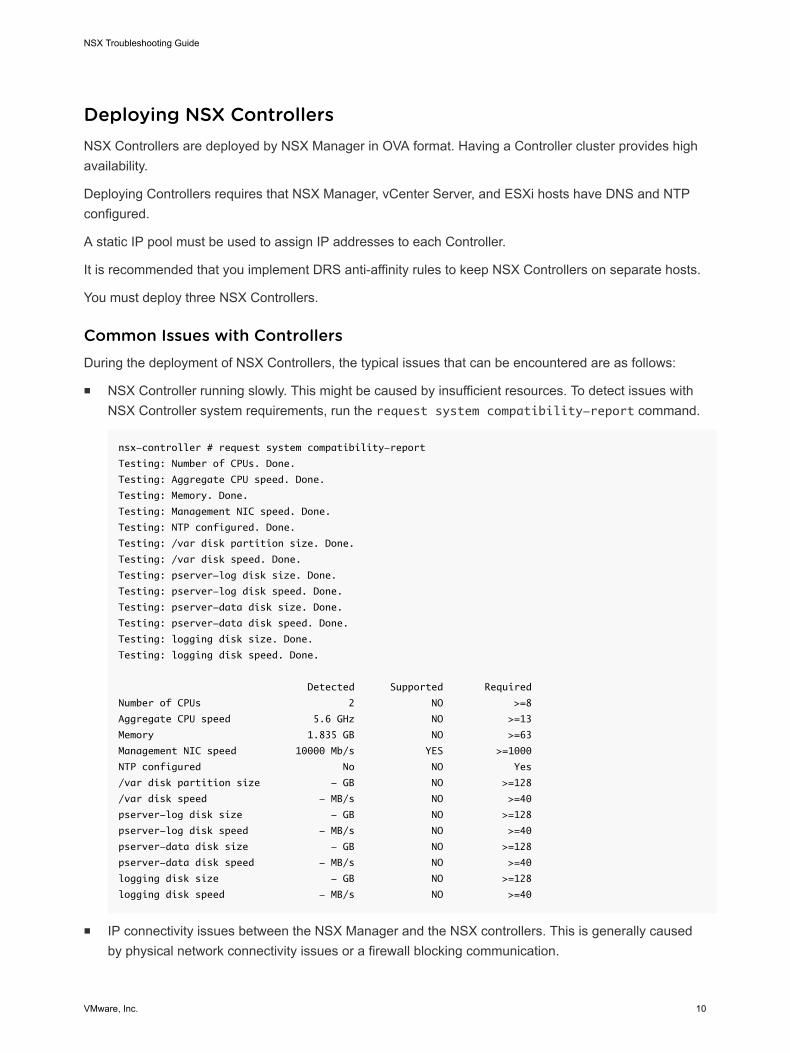
n NSX Controller running slowly. This might be caused by insufficient resources. To detect issues withNSX Controller system requirements, run the request system compatibility-report command.
nsx-controller # request system compatibility-report
Testing: Number of CPUs. Done.
Testing: Aggregate CPU speed. Done.
Testing: Memory. Done.
Testing: Management NIC speed. Done.
Testing: NTP configured. Done.
Testing: /var disk partition size. Done.
Testing: /var disk speed. Done.
Testing: pserver-log disk size. Done.
Testing: pserver-log disk speed. Done.
Testing: pserver-data disk size. Done.
Testing: pserver-data disk speed. Done.
Testing: logging disk size. Done.
Testing: logging disk speed. Done.
Detected Supported Required
Number of CPUs 2 NO >=8
Aggregate CPU speed 5.6 GHz NO >=13
Memory 1.835 GB NO >=63
Management NIC speed 10000 Mb/s YES >=1000
NTP configured No NO Yes
/var disk partition size - GB NO >=128
/var disk speed - MB/s NO >=40
pserver-log disk size - GB NO >=128
pserver-log disk speed - MB/s NO >=40
pserver-data disk size - GB NO >=128
pserver-data disk speed - MB/s NO >=40
logging disk size - GB NO >=128
logging disk speed - MB/s NO >=40
n IP connectivity issues between the NSX Manager and the NSX controllers. This is generally causedby physical network connectivity issues or a firewall blocking communication.
NSX Troubleshooting Guide
VMware, Inc. 10
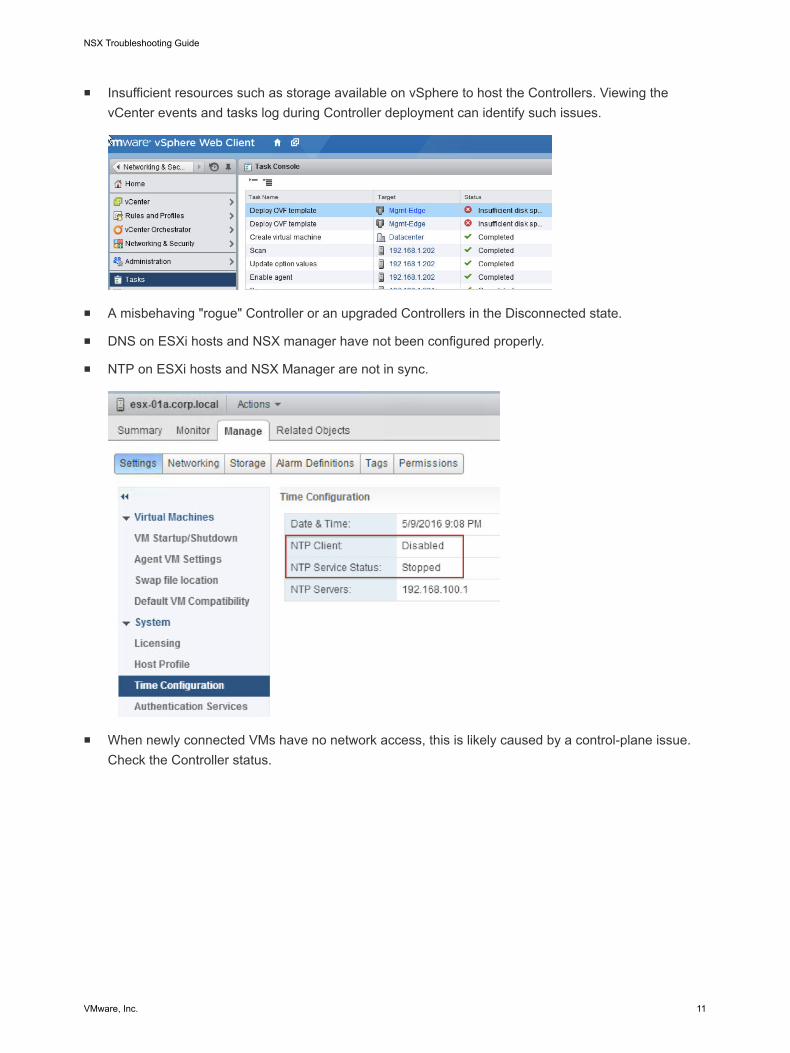
n Insufficient resources such as storage available on vSphere to host the Controllers. Viewing thevCenter events and tasks log during Controller deployment can identify such issues.
n A misbehaving "rogue" Controller or an upgraded Controllers in the Disconnected state.
n DNS on ESXi hosts and NSX manager have not been configured properly.
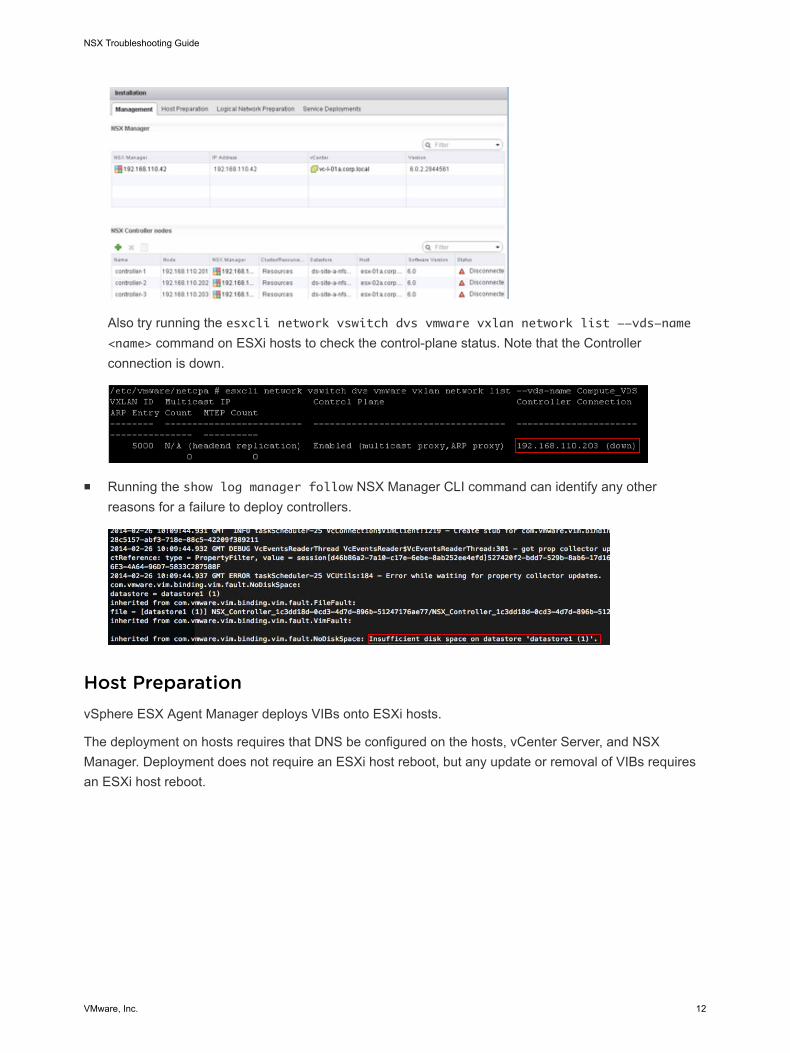
n NTP on ESXi hosts and NSX Manager are not in sync.
n When newly connected VMs have no network access, this is likely caused by a control-plane issue.Check the Controller status.
NSX Troubleshooting Guide
VMware, Inc. 11
Also try running the esxcli network vswitch dvs vmware vxlan network list --vds-name<name> command on ESXi hosts to check the control-plane status. Note that the Controllerconnection is down.
n Running the show log manager follow NSX Manager CLI command can identify any otherreasons for a failure to deploy controllers.
Host PreparationvSphere ESX Agent Manager deploys VIBs onto ESXi hosts.
The deployment on hosts requires that DNS be configured on the hosts, vCenter Server, and NSXManager. Deployment does not require an ESXi host reboot, but any update or removal of VIBs requiresan ESXi host reboot.
NSX Troubleshooting Guide
VMware, Inc. 12
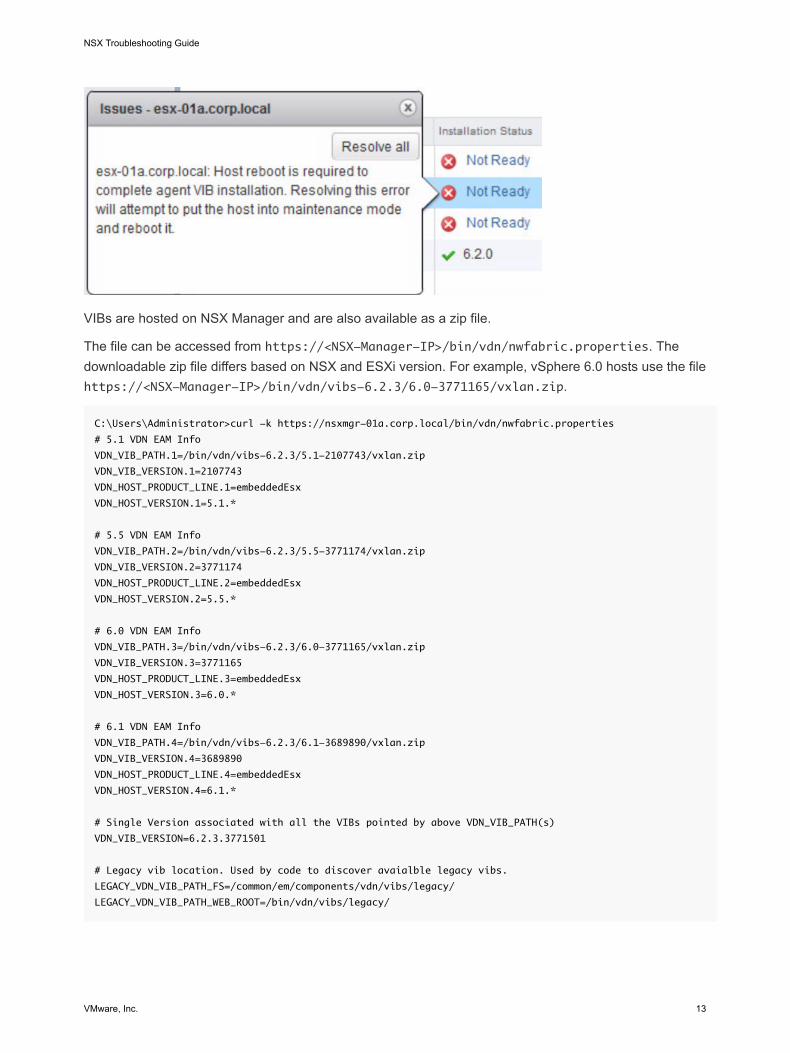
VIBs are hosted on NSX Manager and are also available as a zip file.
The file can be accessed from https://<NSX-Manager-IP>/bin/vdn/nwfabric.properties. Thedownloadable zip file differs based on NSX and ESXi version. For example, vSphere 6.0 hosts use the filehttps://<NSX-Manager-IP>/bin/vdn/vibs-6.2.3/6.0-3771165/vxlan.zip.
C:\Users\Administrator>curl -k https://nsxmgr-01a.corp.local/bin/vdn/nwfabric.properties
# 5.1 VDN EAM Info
VDN_VIB_PATH.1=/bin/vdn/vibs-6.2.3/5.1-2107743/vxlan.zip
VDN_VIB_VERSION.1=2107743
VDN_HOST_PRODUCT_LINE.1=embeddedEsx
VDN_HOST_VERSION.1=5.1.*
# 5.5 VDN EAM Info
VDN_VIB_PATH.2=/bin/vdn/vibs-6.2.3/5.5-3771174/vxlan.zip
VDN_VIB_VERSION.2=3771174
VDN_HOST_PRODUCT_LINE.2=embeddedEsx
VDN_HOST_VERSION.2=5.5.*
# 6.0 VDN EAM Info
VDN_VIB_PATH.3=/bin/vdn/vibs-6.2.3/6.0-3771165/vxlan.zip
VDN_VIB_VERSION.3=3771165
VDN_HOST_PRODUCT_LINE.3=embeddedEsx
VDN_HOST_VERSION.3=6.0.*
# 6.1 VDN EAM Info
VDN_VIB_PATH.4=/bin/vdn/vibs-6.2.3/6.1-3689890/vxlan.zip
VDN_VIB_VERSION.4=3689890
VDN_HOST_PRODUCT_LINE.4=embeddedEsx
VDN_HOST_VERSION.4=6.1.*
# Single Version associated with all the VIBs pointed by above VDN_VIB_PATH(s)
VDN_VIB_VERSION=6.2.3.3771501
# Legacy vib location. Used by code to discover avaialble legacy vibs.
LEGACY_VDN_VIB_PATH_FS=/common/em/components/vdn/vibs/legacy/
LEGACY_VDN_VIB_PATH_WEB_ROOT=/bin/vdn/vibs/legacy/
NSX Troubleshooting Guide
VMware, Inc. 13

The VIB names are:
n esx-vsip
n esx-vxlan
[root@esx-01a:~] esxcli software vib list | grep -e vsip -e vxlan
esx-vsip 6.0.0-0.0.3771165 VMware VMwareCertified
2016-04-20
esx-vxlan 6.0.0-0.0.3771165 VMware VMwareCertified
2016-04-20
Common Issues During Host PreparationDuring the preparation of hosts typical kinds of issues that can be encountered are as follows:
n EAM fails to deploy VIBs.
n Might be due to misconfigured DNS on hosts.
n Might be due to a firewall blocking required ports between ESXi, NSX Manager, and vCenterServer.
n A previous VIB of an older version is already installed. This requires user intervention to reboot hosts.
n NSX Manager and vCenter Server experience communication issues:
n The Host Preparation tab in the Networking and Security Plug-in not showing all hosts properly.
n Check if vCenter Server can enumerate all hosts and clusters.
Host Preparation (VIBs) Troubleshootingn Check communication channel health for the host. See Checking Communication Channel Health.
n Check vSphere ESX Agent Manager for errors.
NSX Troubleshooting Guide
VMware, Inc. 14
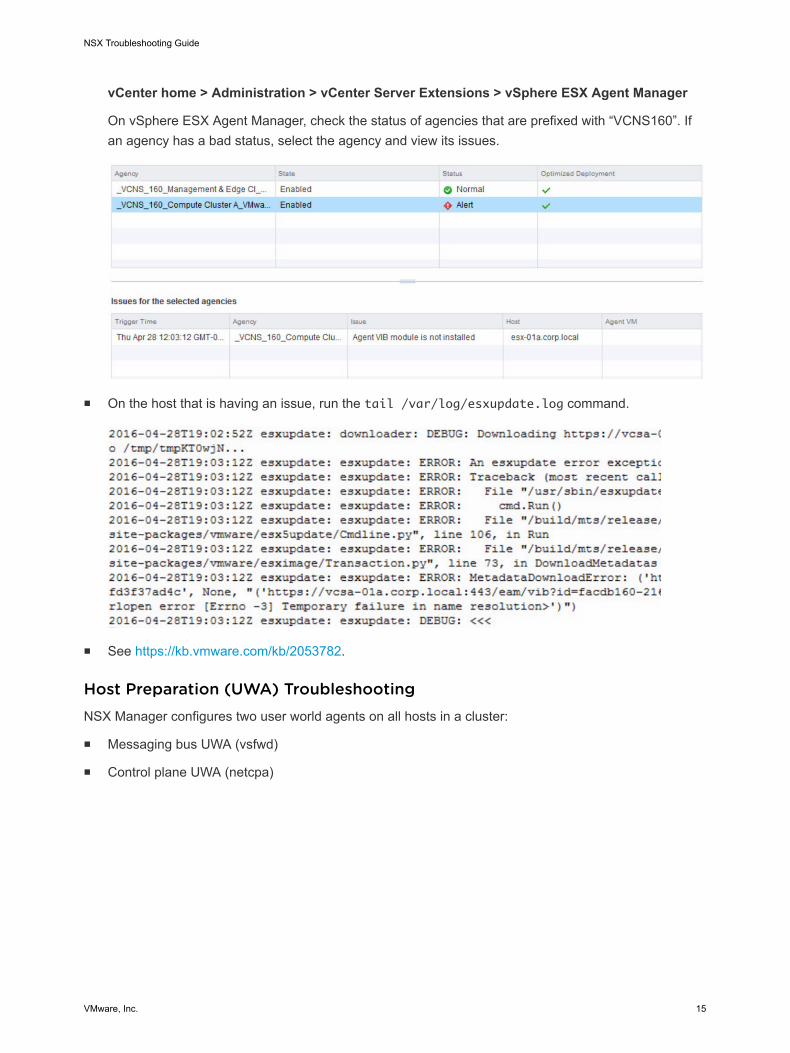
vCenter home > Administration > vCenter Server Extensions > vSphere ESX Agent Manager
On vSphere ESX Agent Manager, check the status of agencies that are prefixed with “VCNS160”. Ifan agency has a bad status, select the agency and view its issues.
n On the host that is having an issue, run the tail /var/log/esxupdate.log command.
n See https://kb.vmware.com/kb/2053782.
Host Preparation (UWA) TroubleshootingNSX Manager configures two user world agents on all hosts in a cluster:
n Messaging bus UWA (vsfwd)
n Control plane UWA (netcpa)
NSX Troubleshooting Guide
VMware, Inc. 15

NSXController
Cluster
NSX Manager
UWA VXLAN
Security
In rare cases, the installation of the VIBs succeeds but for some reason one or both of the user worldagents is not functioning correctly. This could manifest itself as:
n The firewall showing a bad status.
n The control plane between hypervisors and the Controllers being down. Check NSX Manager SystemEvents.
If more than one ESXi host is affected, check the status of message bus service on NSX ManagerAppliance web UI under the Summary tab. If RabbitMQ is stopped, restart it.
NSX Troubleshooting Guide
VMware, Inc. 16
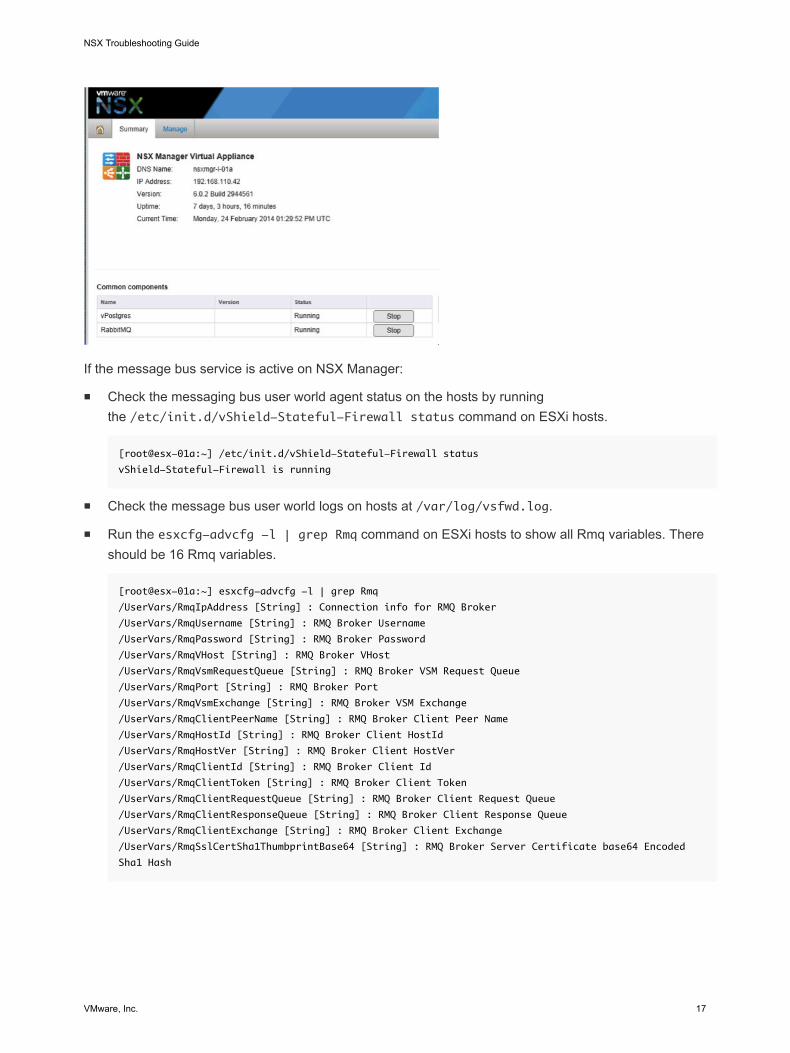
If the message bus service is active on NSX Manager:
n Check the messaging bus user world agent status on the hosts by runningthe /etc/init.d/vShield-Stateful-Firewall status command on ESXi hosts.
[root@esx-01a:~] /etc/init.d/vShield-Stateful-Firewall status
vShield-Stateful-Firewall is running
n Check the message bus user world logs on hosts at /var/log/vsfwd.log.
n Run the esxcfg-advcfg -l | grep Rmq command on ESXi hosts to show all Rmq variables. Thereshould be 16 Rmq variables.
[root@esx-01a:~] esxcfg-advcfg -l | grep Rmq
/UserVars/RmqIpAddress [String] : Connection info for RMQ Broker
/UserVars/RmqUsername [String] : RMQ Broker Username
/UserVars/RmqPassword [String] : RMQ Broker Password
/UserVars/RmqVHost [String] : RMQ Broker VHost
/UserVars/RmqVsmRequestQueue [String] : RMQ Broker VSM Request Queue
/UserVars/RmqPort [String] : RMQ Broker Port
/UserVars/RmqVsmExchange [String] : RMQ Broker VSM Exchange
/UserVars/RmqClientPeerName [String] : RMQ Broker Client Peer Name
/UserVars/RmqHostId [String] : RMQ Broker Client HostId
/UserVars/RmqHostVer [String] : RMQ Broker Client HostVer
/UserVars/RmqClientId [String] : RMQ Broker Client Id
/UserVars/RmqClientToken [String] : RMQ Broker Client Token
/UserVars/RmqClientRequestQueue [String] : RMQ Broker Client Request Queue
/UserVars/RmqClientResponseQueue [String] : RMQ Broker Client Response Queue
/UserVars/RmqClientExchange [String] : RMQ Broker Client Exchange
/UserVars/RmqSslCertSha1ThumbprintBase64 [String] : RMQ Broker Server Certificate base64 Encoded
Sha1 Hash
NSX Troubleshooting Guide
VMware, Inc. 17
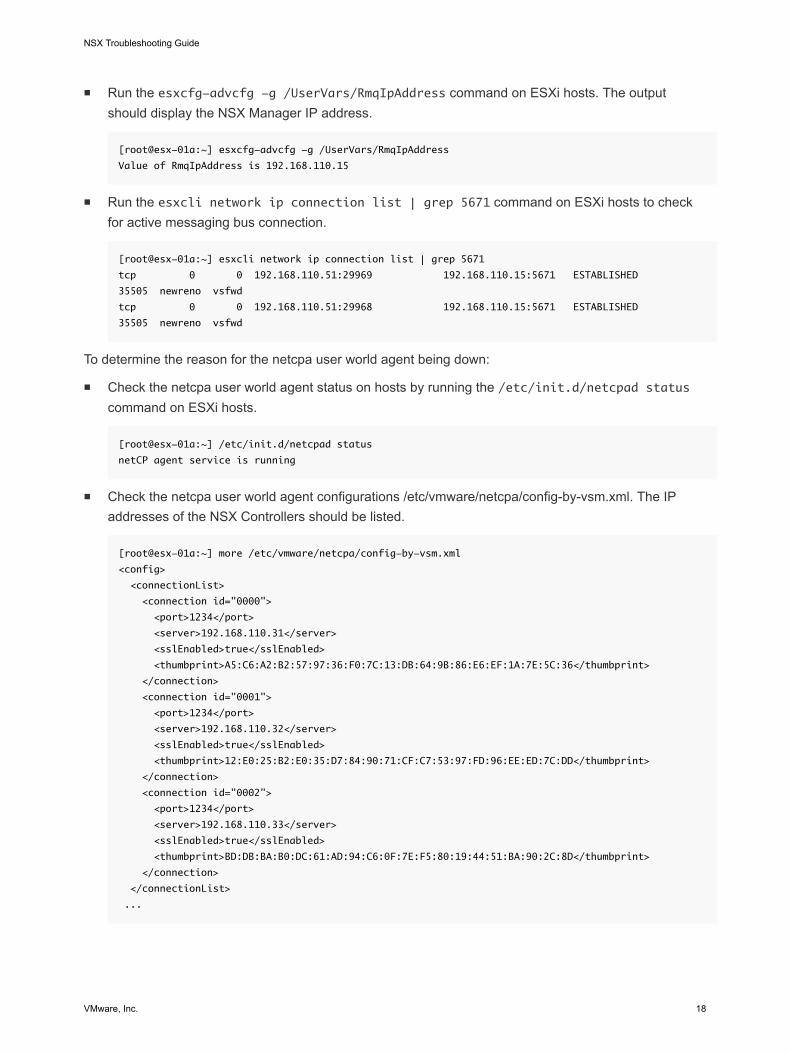
n Run the esxcfg-advcfg -g /UserVars/RmqIpAddress command on ESXi hosts. The outputshould display the NSX Manager IP address.
[root@esx-01a:~] esxcfg-advcfg -g /UserVars/RmqIpAddress
Value of RmqIpAddress is 192.168.110.15
n Run the esxcli network ip connection list | grep 5671 command on ESXi hosts to checkfor active messaging bus connection.
[root@esx-01a:~] esxcli network ip connection list | grep 5671
tcp 0 0 192.168.110.51:29969 192.168.110.15:5671 ESTABLISHED
35505 newreno vsfwd
tcp 0 0 192.168.110.51:29968 192.168.110.15:5671 ESTABLISHED
35505 newreno vsfwd
To determine the reason for the netcpa user world agent being down:
n Check the netcpa user world agent status on hosts by running the /etc/init.d/netcpad statuscommand on ESXi hosts.
[root@esx-01a:~] /etc/init.d/netcpad status
netCP agent service is running
n Check the netcpa user world agent configurations /etc/vmware/netcpa/config-by-vsm.xml. The IPaddresses of the NSX Controllers should be listed.
[root@esx-01a:~] more /etc/vmware/netcpa/config-by-vsm.xml
<config>
<connectionList>
<connection id="0000">
<port>1234</port>
<server>192.168.110.31</server>
<sslEnabled>true</sslEnabled>
<thumbprint>A5:C6:A2:B2:57:97:36:F0:7C:13:DB:64:9B:86:E6:EF:1A:7E:5C:36</thumbprint>
</connection>
<connection id="0001">
<port>1234</port>
<server>192.168.110.32</server>
<sslEnabled>true</sslEnabled>
<thumbprint>12:E0:25:B2:E0:35:D7:84:90:71:CF:C7:53:97:FD:96:EE:ED:7C:DD</thumbprint>
</connection>
<connection id="0002">
<port>1234</port>
<server>192.168.110.33</server>
<sslEnabled>true</sslEnabled>
<thumbprint>BD:DB:BA:B0:DC:61:AD:94:C6:0F:7E:F5:80:19:44:51:BA:90:2C:8D</thumbprint>
</connection>
</connectionList>
...
NSX Troubleshooting Guide
VMware, Inc. 18
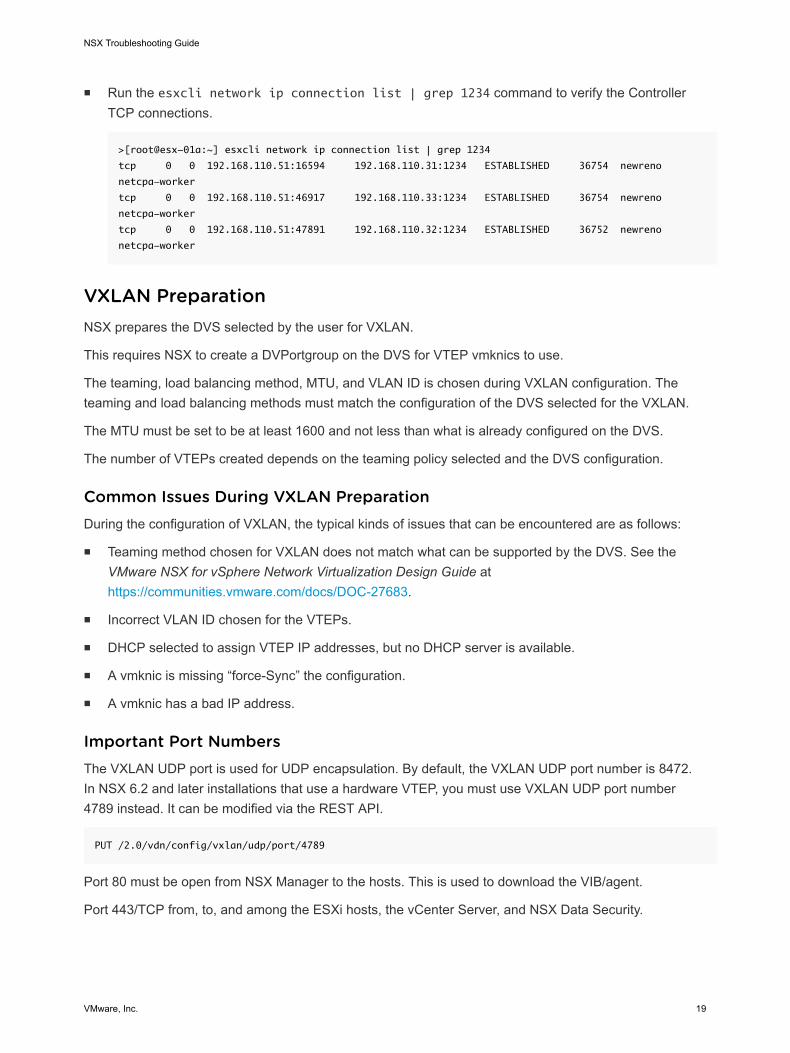
n Run the esxcli network ip connection list | grep 1234 command to verify the ControllerTCP connections.
>[root@esx-01a:~] esxcli network ip connection list | grep 1234
tcp 0 0 192.168.110.51:16594 192.168.110.31:1234 ESTABLISHED 36754 newreno
netcpa-worker
tcp 0 0 192.168.110.51:46917 192.168.110.33:1234 ESTABLISHED 36754 newreno
netcpa-worker
tcp 0 0 192.168.110.51:47891 192.168.110.32:1234 ESTABLISHED 36752 newreno
netcpa-worker
VXLAN PreparationNSX prepares the DVS selected by the user for VXLAN.
This requires NSX to create a DVPortgroup on the DVS for VTEP vmknics to use.
The teaming, load balancing method, MTU, and VLAN ID is chosen during VXLAN configuration. Theteaming and load balancing methods must match the configuration of the DVS selected for the VXLAN.
The MTU must be set to be at least 1600 and not less than what is already configured on the DVS.
The number of VTEPs created depends on the teaming policy selected and the DVS configuration.
Common Issues During VXLAN PreparationDuring the configuration of VXLAN, the typical kinds of issues that can be encountered are as follows:
n Teaming method chosen for VXLAN does not match what can be supported by the DVS. See theVMware NSX for vSphere Network Virtualization Design Guide at https://communities.vmware.com/docs/DOC-27683.
n Incorrect VLAN ID chosen for the VTEPs.
n DHCP selected to assign VTEP IP addresses, but no DHCP server is available.
n A vmknic is missing “force-Sync” the configuration.
n A vmknic has a bad IP address.
Important Port NumbersThe VXLAN UDP port is used for UDP encapsulation. By default, the VXLAN UDP port number is 8472.In NSX 6.2 and later installations that use a hardware VTEP, you must use VXLAN UDP port number4789 instead. It can be modified via the REST API.
PUT /2.0/vdn/config/vxlan/udp/port/4789
Port 80 must be open from NSX Manager to the hosts. This is used to download the VIB/agent.
Port 443/TCP from, to, and among the ESXi hosts, the vCenter Server, and NSX Data Security.
NSX Troubleshooting Guide
VMware, Inc. 19
Additionally, the following ports must be open on NSX Manager:
n 443/TCP: Required for downloading the OVA file on the ESXi host for deployment, for using RESTAPIs, and for the NSX Manager user interface.
n 80/TCP: Required for initiating a connection to the vSphere SDK and for messaging between NSXManager and NSX host modules.
n 1234/TCP: Requred for communication between ESXi Host and NSX Controller Clusters.
n 5671: Required for Rabbit MQ (a messaging bus technology).
n 22/TCP: Required for console access (SSH) to the CLI. By default, this port is closed.
If the hosts in your clusters were upgraded from vCenter Server version 5.0 to 5.5, you must open ports80 and 443 on those hosts for Guest Introspection installation to be successful.
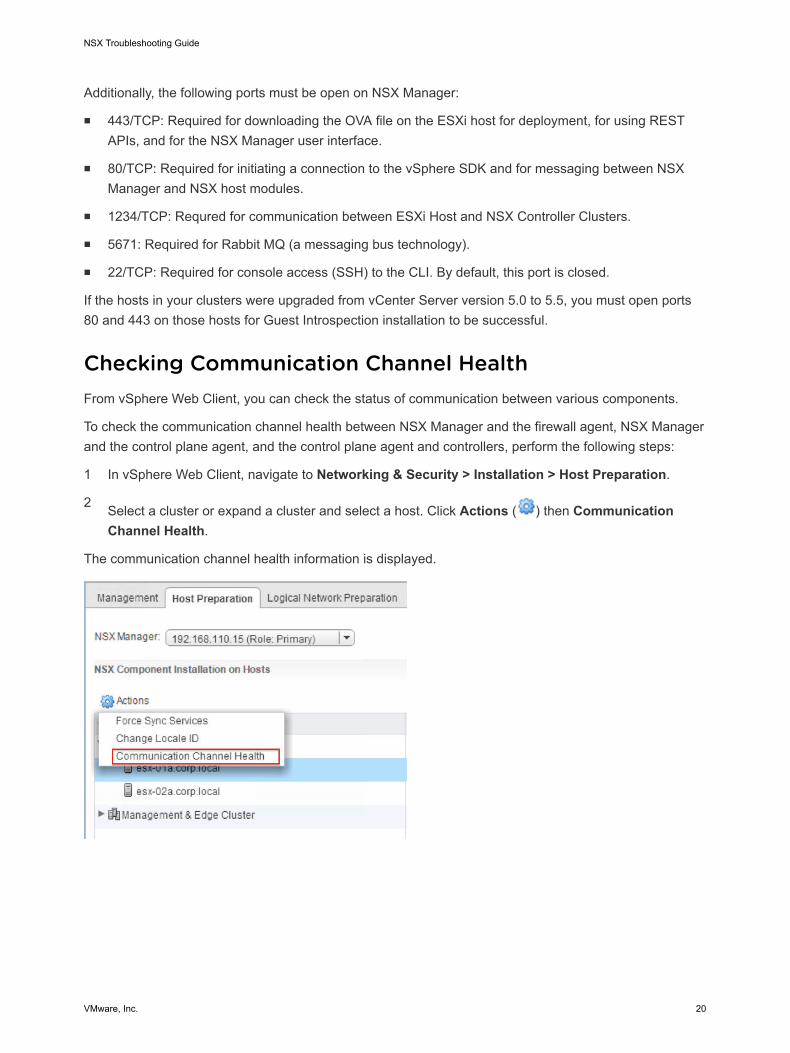
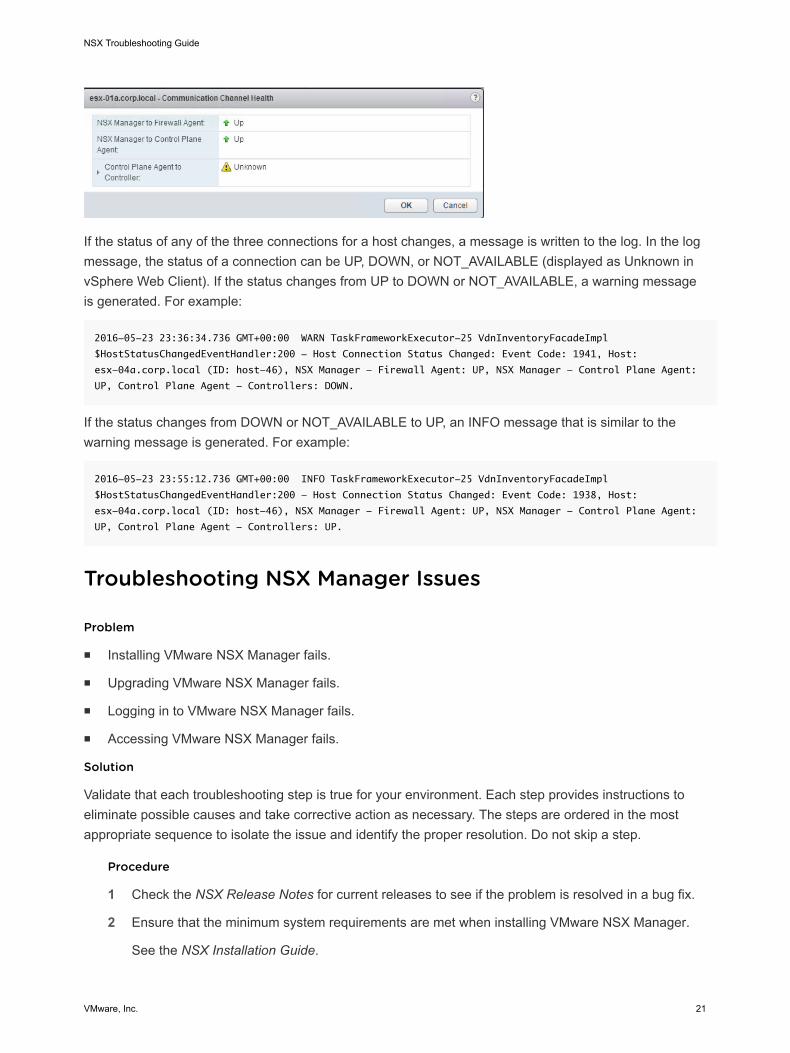
Checking Communication Channel HealthFrom vSphere Web Client, you can check the status of communication between various components.
To check the communication channel health between NSX Manager and the firewall agent, NSX Managerand the control plane agent, and the control plane agent and controllers, perform the following steps:
1 In vSphere Web Client, navigate to Networking & Security > Installation > Host Preparation.
2 Select a cluster or expand a cluster and select a host. Click Actions ( ) then CommunicationChannel Health.
The communication channel health information is displayed.
NSX Troubleshooting Guide
VMware, Inc. 20
If the status of any of the three connections for a host changes, a message is written to the log. In the logmessage, the status of a connection can be UP, DOWN, or NOT_AVAILABLE (displayed as Unknown invSphere Web Client). If the status changes from UP to DOWN or NOT_AVAILABLE, a warning messageis generated. For example:
2016-05-23 23:36:34.736 GMT+00:00 WARN TaskFrameworkExecutor-25 VdnInventoryFacadeImpl
$HostStatusChangedEventHandler:200 - Host Connection Status Changed: Event Code: 1941, Host:
esx-04a.corp.local (ID: host-46), NSX Manager - Firewall Agent: UP, NSX Manager - Control Plane Agent:
UP, Control Plane Agent - Controllers: DOWN.
If the status changes from DOWN or NOT_AVAILABLE to UP, an INFO message that is similar to thewarning message is generated. For example:
2016-05-23 23:55:12.736 GMT+00:00 INFO TaskFrameworkExecutor-25 VdnInventoryFacadeImpl
$HostStatusChangedEventHandler:200 - Host Connection Status Changed: Event Code: 1938, Host:
esx-04a.corp.local (ID: host-46), NSX Manager - Firewall Agent: UP, NSX Manager - Control Plane Agent:
UP, Control Plane Agent - Controllers: UP.
Troubleshooting NSX Manager Issues
Problem
n Installing VMware NSX Manager fails.
n Upgrading VMware NSX Manager fails.
n Logging in to VMware NSX Manager fails.
n Accessing VMware NSX Manager fails.
Solution
Validate that each troubleshooting step is true for your environment. Each step provides instructions toeliminate possible causes and take corrective action as necessary. The steps are ordered in the mostappropriate sequence to isolate the issue and identify the proper resolution. Do not skip a step.
Procedure
1 Check the NSX Release Notes for current releases to see if the problem is resolved in a bug fix.
2 Ensure that the minimum system requirements are met when installing VMware NSX Manager.
See the NSX Installation Guide.
NSX Troubleshooting Guide
VMware, Inc. 21
3 Verify that all required ports are open in NSX Manager.
See the NSX Installation Guide.
4 Installation issues:
n If configuring the lookup service or vCenter Server fails, verify that the NSX Manager andlookup service appliances are in time sync. Use the same NTP server configurations on bothNSX Manager and the lookup service. Also ensure that DNS is properly configured.
n Verify that the OVA file is getting installed correctly. If an NSX OVA file cannot be installed, anerror window in the vSphere client notes where the failure occurred. Also, verify and validatethe MD5 checksum of the downloaded OVA/OVF file.
n Verify that the time on the ESXi hosts is in sync with NSX Manager.
n VMware recommends that you schedule a backup of the NSX Manager data immediatelyafter installing NSX Manager.
5 Upgrade issues:
n Before upgrading, see the latest interoperability information in the Product InteroperabilityMatrixes page.
n VMware recommends that you back up your current configuration and download technicalsupport logs before upgrading.
n A force-resync with the vCenter Server may be required after the NSX Manager upgrade. Todo this, log in to the NSX Manager Web Interface GUI. Then go to Manage vCenterRegistration > NSX Management Service > Edit and re-enter the password for theadministrative user.
6 Performance issues:
n Ensure that the minimum vCPU requirements are met.
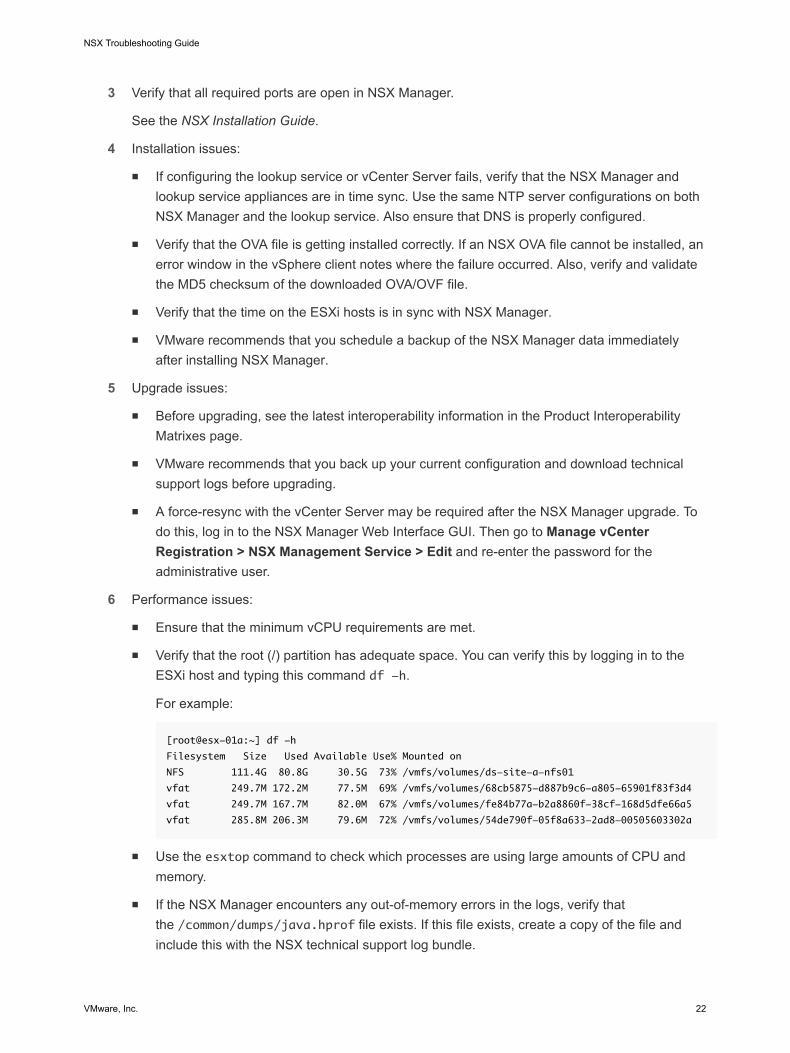
n Verify that the root (/) partition has adequate space. You can verify this by logging in to theESXi host and typing this command df -h.
For example:
[root@esx-01a:~] df -h
Filesystem Size Used Available Use% Mounted on
NFS 111.4G 80.8G 30.5G 73% /vmfs/volumes/ds-site-a-nfs01
vfat 249.7M 172.2M 77.5M 69% /vmfs/volumes/68cb5875-d887b9c6-a805-65901f83f3d4
vfat 249.7M 167.7M 82.0M 67% /vmfs/volumes/fe84b77a-b2a8860f-38cf-168d5dfe66a5
vfat 285.8M 206.3M 79.6M 72% /vmfs/volumes/54de790f-05f8a633-2ad8-00505603302a
n Use the esxtop command to check which processes are using large amounts of CPU andmemory.
n If the NSX Manager encounters any out-of-memory errors in the logs, verify thatthe /common/dumps/java.hprof file exists. If this file exists, create a copy of the file andinclude this with the NSX technical support log bundle.
NSX Troubleshooting Guide
VMware, Inc. 22
n Verify that there are no storage latency issues in the environment.
n Attempt to migrate the NSX Manager to another ESXi host.
7 Connectivity issues:
n If NSX Manager is having connectivity issues either with vCenter Server or the ESXi host, login to the NSX Manager CLI console, run the command: debug connectionIP_of_ESXi_or_VC, and examine the output.
n Verify that the Virtual Center Web management services is started and the browser is not inan error state.
n If the NSX Manager Web User Interface (UI) is not updating, you can attempt to resolve theissue by disabling and then re-enabling the Web services. See https://kb.vmware.com/kb/2126701.
n Verify which port group and uplink NIC is used by the NSX Manager using the esxtopcommand on the ESXi host. For more information, see https://kb.vmware.com/kb/1003893.
n Attempt to migrate the NSX Manager to another ESXi host.
n Check the NSX Manager virtual machine appliance Tasks and Events tab from the vSphereWeb Client under the Monitor tab.
n If the NSX Manager is having connectivity issues with vCenter Server, attempt to migrate theNSX Manager to the same ESXi host where the vCenter Server virtual machine is running toeliminate possible underlying physical network issues.
Note that this only works if both virtual machines are on the same VLAN/port group.
Recover from an NSX Controller FailureIn case of an NSX Controller failure, you may still have two controllers that are working. The clustermajority is maintained, and the control plane continues to function. Even so, it is important to delete allthree controllers and add new ones, so as to maintain a fully functional three-node cluster.
We recommend deleting the controller cluster when one or more of the controllers encounter catastrophic,unrecoverable errors or when one or more of the controller VMs become inaccessible and cannot befixed.
We recommend deleting all controllers in such a case, even if some of the controllers seem healthy. Therecommended process is to create a new controller cluster and use the Update Controller Statemechanism on the NSX Manager to synchronize the state to the controllers.
Procedure
1 Login to vSphere Web Client.
2 From Networking & Security, click Installation > Management.
NSX Troubleshooting Guide
VMware, Inc. 23
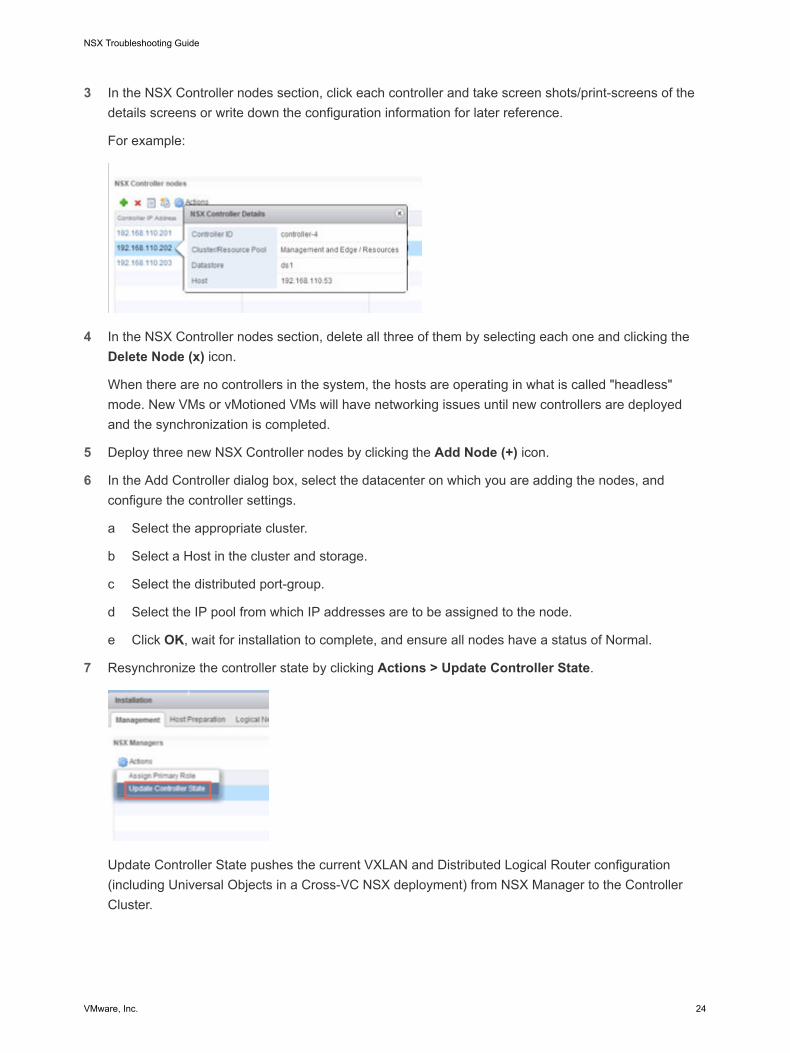
3 In the NSX Controller nodes section, click each controller and take screen shots/print-screens of thedetails screens or write down the configuration information for later reference.
For example:
4 In the NSX Controller nodes section, delete all three of them by selecting each one and clicking theDelete Node (x) icon.
When there are no controllers in the system, the hosts are operating in what is called "headless"mode. New VMs or vMotioned VMs will have networking issues until new controllers are deployedand the synchronization is completed.
5 Deploy three new NSX Controller nodes by clicking the Add Node (+) icon.
6 In the Add Controller dialog box, select the datacenter on which you are adding the nodes, andconfigure the controller settings.
a Select the appropriate cluster.
b Select a Host in the cluster and storage.
c Select the distributed port-group.
d Select the IP pool from which IP addresses are to be assigned to the node.
e Click OK, wait for installation to complete, and ensure all nodes have a status of Normal.
7 Resynchronize the controller state by clicking Actions > Update Controller State.
Update Controller State pushes the current VXLAN and Distributed Logical Router configuration(including Universal Objects in a Cross-VC NSX deployment) from NSX Manager to the ControllerCluster.
NSX Troubleshooting Guide
VMware, Inc. 24
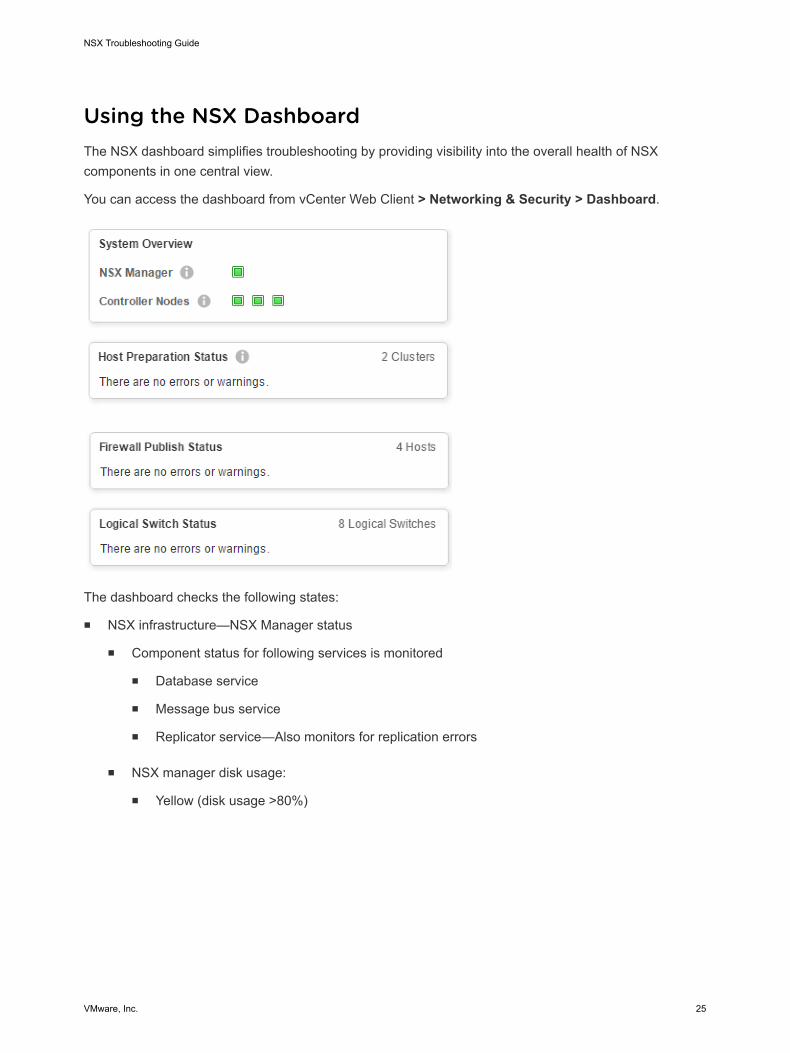
Using the NSX DashboardThe NSX dashboard simplifies troubleshooting by providing visibility into the overall health of NSXcomponents in one central view.
You can access the dashboard from vCenter Web Client > Networking & Security > Dashboard.
The dashboard checks the following states:
n NSX infrastructure—NSX Manager status
n Component status for following services is monitored
n Database service
n Message bus service
n Replicator service—Also monitors for replication errors
n NSX manager disk usage:
n Yellow (disk usage >80%)
NSX Troubleshooting Guide
VMware, Inc. 25
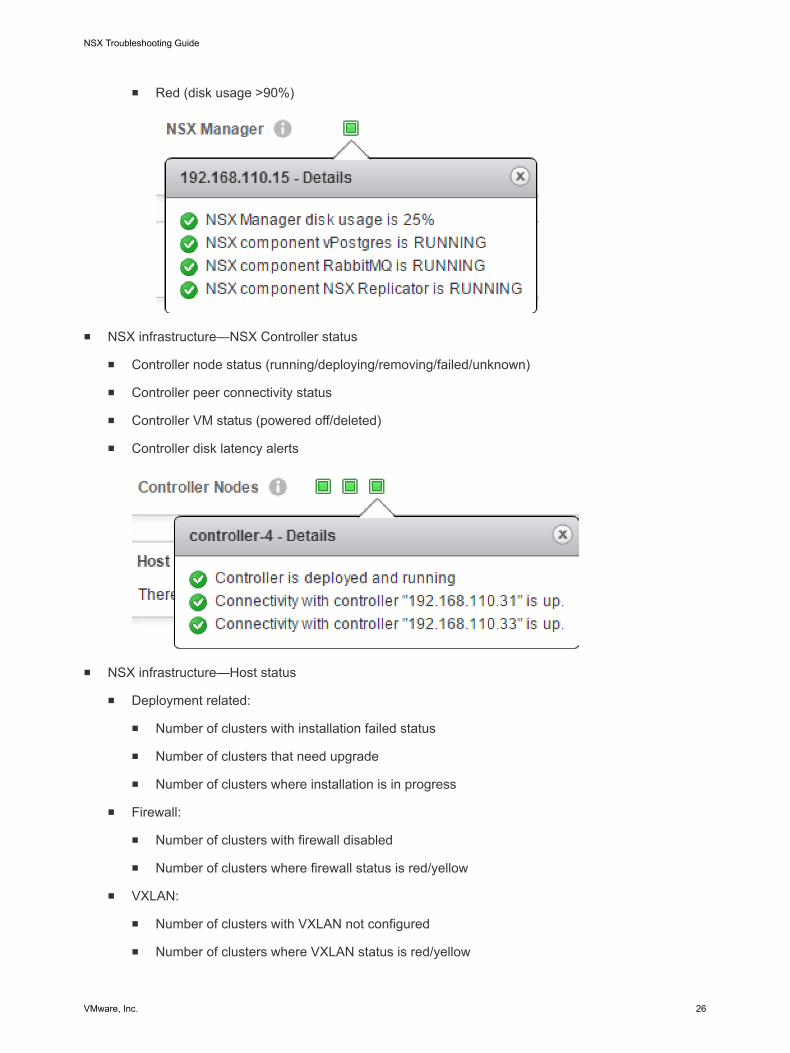
n Red (disk usage >90%)
n NSX infrastructure—NSX Controller status
n Controller node status (running/deploying/removing/failed/unknown)
n Controller peer connectivity status
n Controller VM status (powered off/deleted)
n Controller disk latency alerts
n NSX infrastructure—Host status
n Deployment related:
n Number of clusters with installation failed status
n Number of clusters that need upgrade
n Number of clusters where installation is in progress
n Firewall:
n Number of clusters with firewall disabled
n Number of clusters where firewall status is red/yellow
n VXLAN:
n Number of clusters with VXLAN not configured
n Number of clusters where VXLAN status is red/yellow
NSX Troubleshooting Guide
VMware, Inc. 26

n NSX services—Firewall publish statusn Number of hosts with firewall publish status failed.
n NSX services—Logical Networking statusn Number of logical switches with status Error, Warning
n Flag if backing DVS portgroup is deleted for a virtual wire
Using the show host health-status CommandFrom the NSX Manager central CLI, you can check the health status of each ESXi host.
The health status is reported as critical, unhealthy, or healthy.
For example:
nsxmgr> show host host-30 health-status
status: HEALTHY
nsxmgr> show host host-29 health-status
UNHEALTHY, Standard Switch vSwitch1 has no uplinks.
UNHEALTHY, Storage volume datastore1 has no enough free spaces: 19.% free.
status: UNHEALTHY
nsxmgr> show host host-28 health-status
CRITICAL, VXLAN VDS vds-site-a VNI 200000 multicast addr is not synchronized with VSM: 0.0.0.0.
CRITICAL, VXLAN VDS vds-site-a VNI 200003 multicast addr is not synchronized with VSM: 0.0.0.0.
CRITICAL, VXLAN VDS vds-site-a VNI 5000 multicast addr is not synchronized with VSM: 0.0.0.0.
Status: CRITICAL
The host-check command can also be invoked through the NSX Manager API.
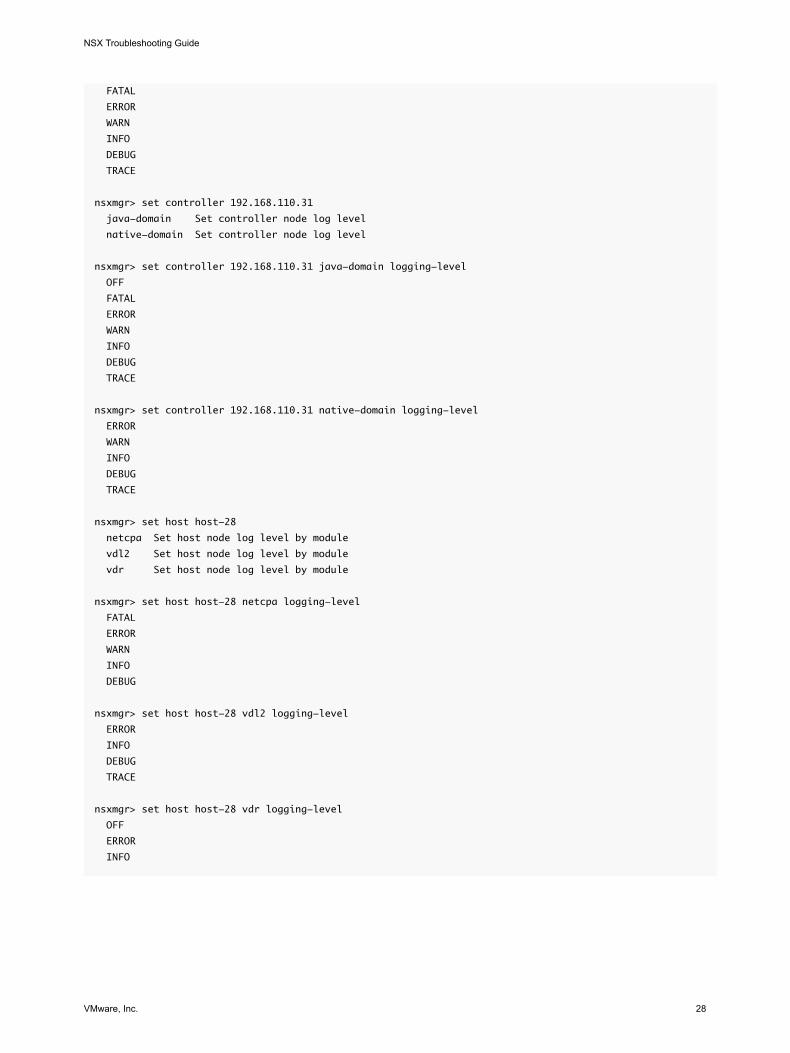
Setting the Logging Level of NSX ComponentsYou can set the logging level for each NSX component.
The supported levels vary by component, as shown here.
nsxmgr> set
hardware-gateway Show Logical Switch Commands
PACKAGE-NAME Set log level
controller Show Logical Switch Commands
host Show Logical Switch Commands
nsxmgr> set hardware-gateway agent 10.1.1.1 logging-level
ERROR
WARN
INFO
DEBUG
TRACE
nsxmgr-01a> set <package-name> logging-level
OFF
NSX Troubleshooting Guide
VMware, Inc. 27
FATAL
ERROR
WARN
INFO
DEBUG
TRACE
nsxmgr> set controller 192.168.110.31
java-domain Set controller node log level
native-domain Set controller node log level
nsxmgr> set controller 192.168.110.31 java-domain logging-level
OFF
FATAL
ERROR
WARN
INFO
DEBUG
TRACE
nsxmgr> set controller 192.168.110.31 native-domain logging-level
ERROR
WARN
INFO
DEBUG
TRACE
nsxmgr> set host host-28
netcpa Set host node log level by module
vdl2 Set host node log level by module
vdr Set host node log level by module
nsxmgr> set host host-28 netcpa logging-level
FATAL
ERROR
WARN
INFO
DEBUG
nsxmgr> set host host-28 vdl2 logging-level
ERROR
INFO
DEBUG
TRACE
nsxmgr> set host host-28 vdr logging-level
OFF
ERROR
INFO
NSX Troubleshooting Guide
VMware, Inc. 28
vSphere ESX Agent ManagervSphere ESX Agent Manager (EAM) automates the process of deploying and managing vSphere ESXAgents, while extending the function of an ESXi host to provide additional services that a vSpheresolution requires.
ESX agents are relevant to NSX troubleshooting, because, for example, an NSX deployment mightrequire a particular network filter or firewall configuration to function. A firewall configuration can use anESX agent to connect to the vSphere hypervisor and extend the host with functions specific to thatconfiguration. For example, the ESX agent can filter network traffic, act as a firewall, or gather otherinformation about the virtual machines on the host.
ESX agent virtual machines are similar to services in Windows or Linux. They start when the operatingsystem starts and they stop when it shuts down. The behavior of ESX agent virtual machines istransparent to the user. A vSphere host reaches the ready state when the ESXi operating system hasstarted and all ESX agent virtual machines have been provisioned and powered on.
To integrate an agent with vSphere ESX Agent Manager and extend the capabilities of an ESXi server, anESX agent must be packaged as an OVF or a VIB module.
EAM allows you to monitor the health of ESX agents and blocks users from performing certain operationson ESX agents that might affect the virtual machines that use them. It also manages the lifecycle of agentVIBs and VMs. For example, ESX Agent Manager can prevent an ESX agent virtual machine from beingpowered off or moved from an ESXi host that contains other virtual machines that use that agent.
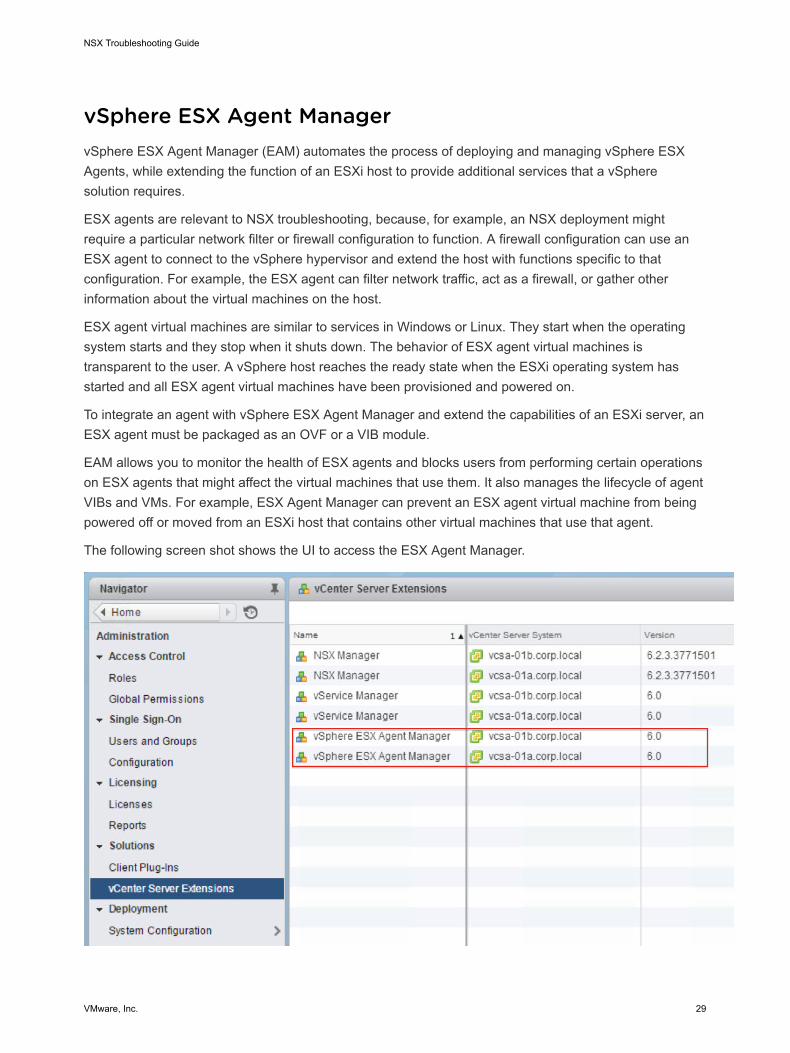
The following screen shot shows the UI to access the ESX Agent Manager.
NSX Troubleshooting Guide
VMware, Inc. 29
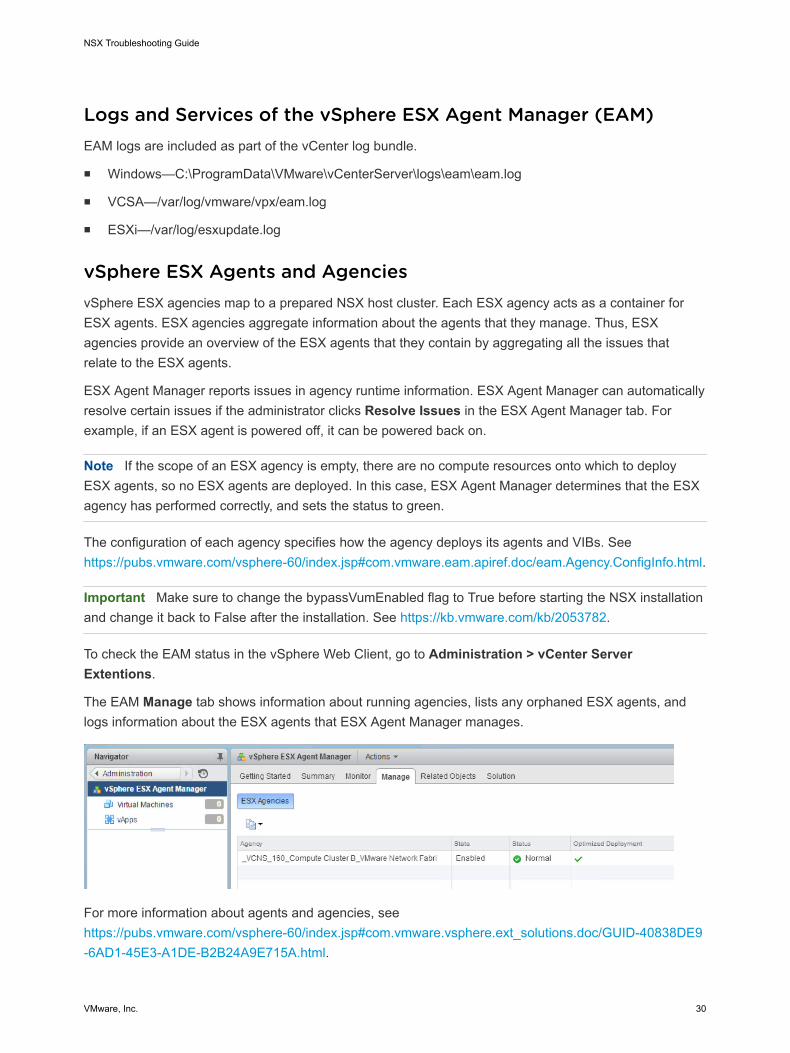
Logs and Services of the vSphere ESX Agent Manager (EAM)EAM logs are included as part of the vCenter log bundle.
n Windows—C:\ProgramData\VMware\vCenterServer\logs\eam\eam.log
n VCSA—/var/log/vmware/vpx/eam.log
n ESXi—/var/log/esxupdate.log
vSphere ESX Agents and AgenciesvSphere ESX agencies map to a prepared NSX host cluster. Each ESX agency acts as a container forESX agents. ESX agencies aggregate information about the agents that they manage. Thus, ESXagencies provide an overview of the ESX agents that they contain by aggregating all the issues thatrelate to the ESX agents.
ESX Agent Manager reports issues in agency runtime information. ESX Agent Manager can automaticallyresolve certain issues if the administrator clicks Resolve Issues in the ESX Agent Manager tab. Forexample, if an ESX agent is powered off, it can be powered back on.
Note If the scope of an ESX agency is empty, there are no compute resources onto which to deployESX agents, so no ESX agents are deployed. In this case, ESX Agent Manager determines that the ESXagency has performed correctly, and sets the status to green.
The configuration of each agency specifies how the agency deploys its agents and VIBs. See https://pubs.vmware.com/vsphere-60/index.jsp#com.vmware.eam.apiref.doc/eam.Agency.ConfigInfo.html.
Important Make sure to change the bypassVumEnabled flag to True before starting the NSX installationand change it back to False after the installation. See https://kb.vmware.com/kb/2053782.
To check the EAM status in the vSphere Web Client, go to Administration > vCenter ServerExtentions.
The EAM Manage tab shows information about running agencies, lists any orphaned ESX agents, andlogs information about the ESX agents that ESX Agent Manager manages.
For more information about agents and agencies, see https://pubs.vmware.com/vsphere-60/index.jsp#com.vmware.vsphere.ext_solutions.doc/GUID-40838DE9-6AD1-45E3-A1DE-B2B24A9E715A.html.
NSX Troubleshooting Guide
VMware, Inc. 30
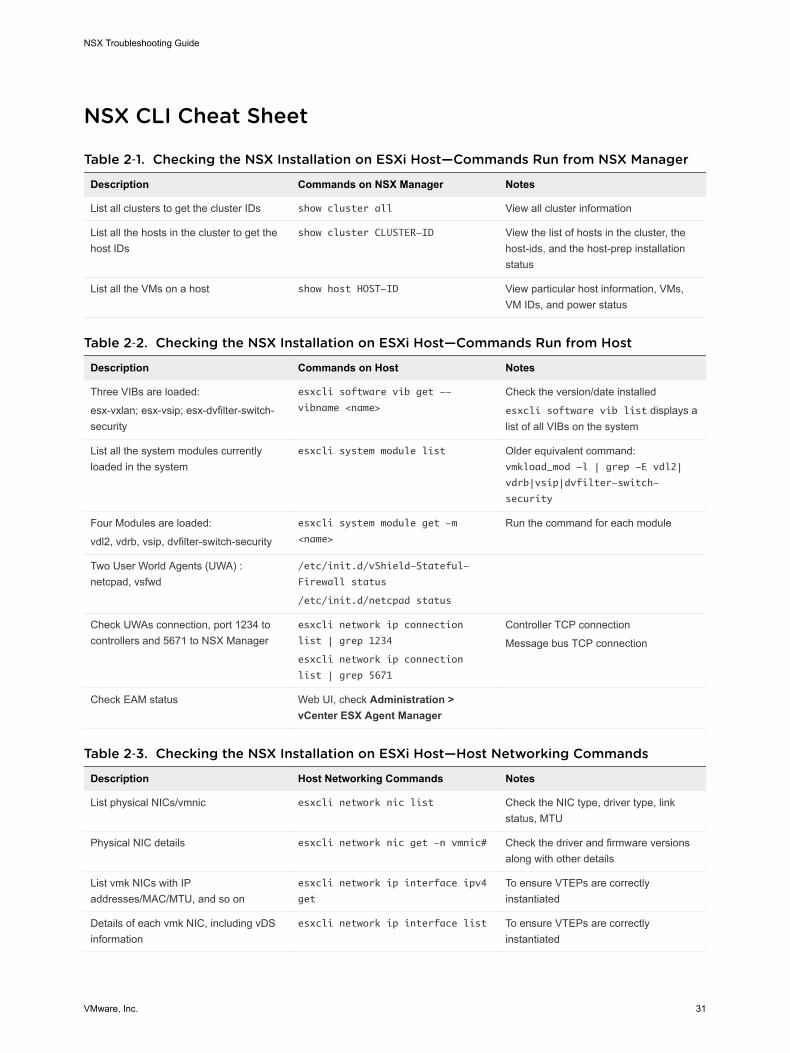
NSX CLI Cheat Sheet
Table 2‑1. Checking the NSX Installation on ESXi Host—Commands Run from NSX Manager
Description Commands on NSX Manager Notes
List all clusters to get the cluster IDs show cluster all View all cluster information
List all the hosts in the cluster to get thehost IDs
show cluster CLUSTER-ID View the list of hosts in the cluster, thehost-ids, and the host-prep installationstatus
List all the VMs on a host show host HOST-ID View particular host information, VMs,VM IDs, and power status
Table 2‑2. Checking the NSX Installation on ESXi Host—Commands Run from Host
Description Commands on Host Notes
Three VIBs are loaded:
esx-vxlan; esx-vsip; esx-dvfilter-switch-security
esxcli software vib get --
vibname <name>
Check the version/date installed
esxcli software vib list displays alist of all VIBs on the system
List all the system modules currentlyloaded in the system
esxcli system module list Older equivalent command:vmkload_mod -l | grep -E vdl2|
vdrb|vsip|dvfilter-switch-
security
Four Modules are loaded:
vdl2, vdrb, vsip, dvfilter-switch-security
esxcli system module get -m
<name>
Run the command for each module
Two User World Agents (UWA) :netcpad, vsfwd
/etc/init.d/vShield-Stateful-
Firewall status
/etc/init.d/netcpad status
Check UWAs connection, port 1234 tocontrollers and 5671 to NSX Manager
esxcli network ip connection
list | grep 1234
esxcli network ip connection
list | grep 5671
Controller TCP connection
Message bus TCP connection
Check EAM status Web UI, check Administration >vCenter ESX Agent Manager
Table 2‑3. Checking the NSX Installation on ESXi Host—Host Networking Commands
Description Host Networking Commands Notes
List physical NICs/vmnic esxcli network nic list Check the NIC type, driver type, linkstatus, MTU
Physical NIC details esxcli network nic get -n vmnic# Check the driver and firmware versionsalong with other details
List vmk NICs with IPaddresses/MAC/MTU, and so on
esxcli network ip interface ipv4
get
To ensure VTEPs are correctlyinstantiated
Details of each vmk NIC, including vDSinformation
esxcli network ip interface list To ensure VTEPs are correctlyinstantiated
NSX Troubleshooting Guide
VMware, Inc. 31
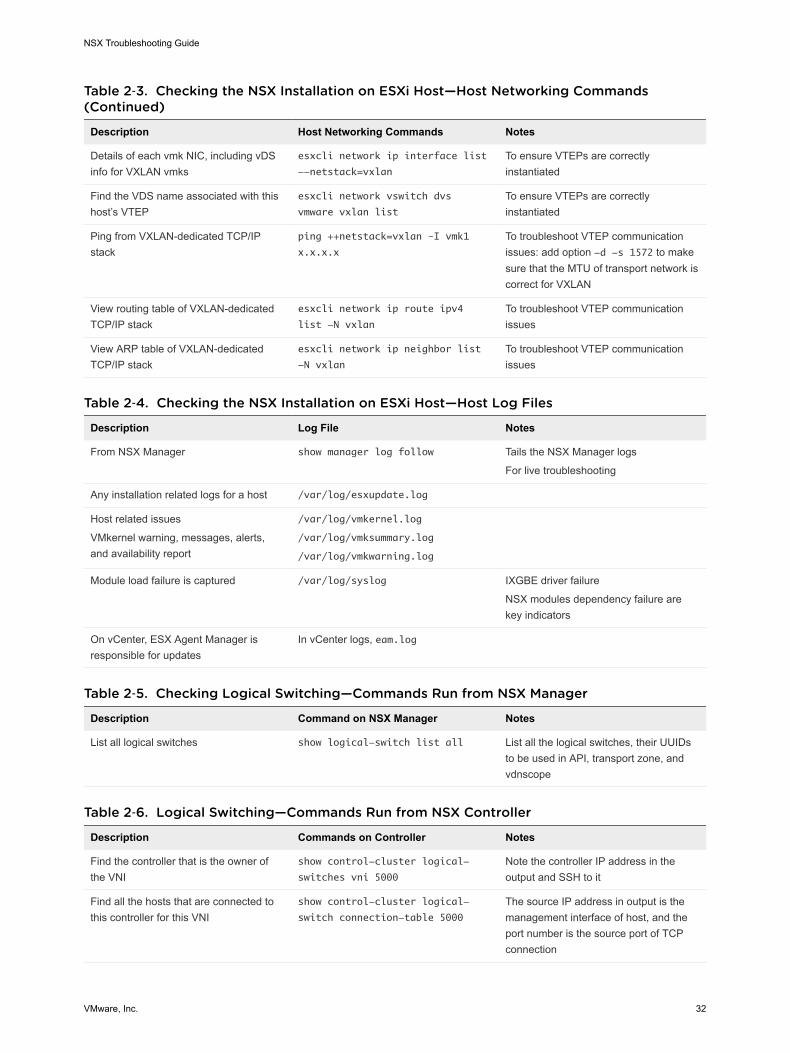
Table 2‑3. Checking the NSX Installation on ESXi Host—Host Networking Commands(Continued)
Description Host Networking Commands Notes
Details of each vmk NIC, including vDSinfo for VXLAN vmks
esxcli network ip interface list
--netstack=vxlan
To ensure VTEPs are correctlyinstantiated
Find the VDS name associated with thishost’s VTEP
esxcli network vswitch dvs
vmware vxlan list
To ensure VTEPs are correctlyinstantiated
Ping from VXLAN-dedicated TCP/IPstack
ping ++netstack=vxlan –I vmk1
x.x.x.x
To troubleshoot VTEP communicationissues: add option -d -s 1572 to makesure that the MTU of transport network iscorrect for VXLAN
View routing table of VXLAN-dedicatedTCP/IP stack
esxcli network ip route ipv4
list -N vxlan
To troubleshoot VTEP communicationissues
View ARP table of VXLAN-dedicatedTCP/IP stack
esxcli network ip neighbor list
-N vxlan
To troubleshoot VTEP communicationissues
Table 2‑4. Checking the NSX Installation on ESXi Host—Host Log Files
Description Log File Notes
From NSX Manager show manager log follow Tails the NSX Manager logs
For live troubleshooting
Any installation related logs for a host /var/log/esxupdate.log
Host related issues
VMkernel warning, messages, alerts,and availability report
/var/log/vmkernel.log
/var/log/vmksummary.log
/var/log/vmkwarning.log
Module load failure is captured /var/log/syslog IXGBE driver failure
NSX modules dependency failure arekey indicators
On vCenter, ESX Agent Manager isresponsible for updates
In vCenter logs, eam.log
Table 2‑5. Checking Logical Switching—Commands Run from NSX Manager
Description Command on NSX Manager Notes
List all logical switches show logical-switch list all List all the logical switches, their UUIDsto be used in API, transport zone, andvdnscope
Table 2‑6. Logical Switching—Commands Run from NSX Controller
Description Commands on Controller Notes
Find the controller that is the owner ofthe VNI
show control-cluster logical-
switches vni 5000
Note the controller IP address in theoutput and SSH to it
Find all the hosts that are connected tothis controller for this VNI
show control-cluster logical-
switch connection-table 5000
The source IP address in output is themanagement interface of host, and theport number is the source port of TCPconnection
NSX Troubleshooting Guide
VMware, Inc. 32
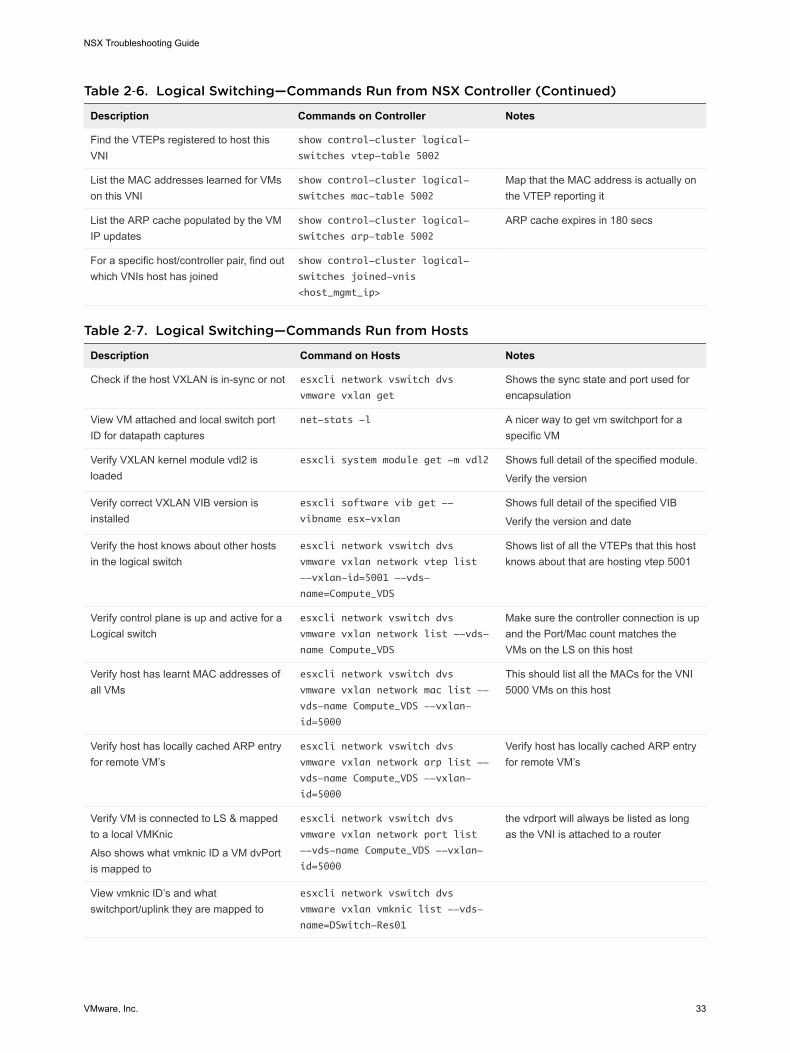
Table 2‑6. Logical Switching—Commands Run from NSX Controller (Continued)
Description Commands on Controller Notes
Find the VTEPs registered to host thisVNI
show control-cluster logical-
switches vtep-table 5002
List the MAC addresses learned for VMson this VNI
show control-cluster logical-
switches mac-table 5002
Map that the MAC address is actually onthe VTEP reporting it
List the ARP cache populated by the VMIP updates
show control-cluster logical-
switches arp-table 5002
ARP cache expires in 180 secs
For a specific host/controller pair, find outwhich VNIs host has joined
show control-cluster logical-
switches joined-vnis
<host_mgmt_ip>
Table 2‑7. Logical Switching—Commands Run from Hosts
Description Command on Hosts Notes
Check if the host VXLAN is in-sync or not esxcli network vswitch dvs
vmware vxlan get
Shows the sync state and port used forencapsulation
View VM attached and local switch portID for datapath captures
net-stats -l A nicer way to get vm switchport for aspecific VM
Verify VXLAN kernel module vdl2 isloaded
esxcli system module get -m vdl2 Shows full detail of the specified module.
Verify the version
Verify correct VXLAN VIB version isinstalled
esxcli software vib get --
vibname esx-vxlan
Shows full detail of the specified VIB
Verify the version and date
Verify the host knows about other hostsin the logical switch
esxcli network vswitch dvs
vmware vxlan network vtep list
--vxlan-id=5001 --vds-
name=Compute_VDS
Shows list of all the VTEPs that this hostknows about that are hosting vtep 5001
Verify control plane is up and active for aLogical switch
esxcli network vswitch dvs
vmware vxlan network list --vds-
name Compute_VDS
Make sure the controller connection is upand the Port/Mac count matches theVMs on the LS on this host
Verify host has learnt MAC addresses ofall VMs
esxcli network vswitch dvs
vmware vxlan network mac list --
vds-name Compute_VDS --vxlan-
id=5000
This should list all the MACs for the VNI5000 VMs on this host
Verify host has locally cached ARP entryfor remote VM’s
esxcli network vswitch dvs
vmware vxlan network arp list --
vds-name Compute_VDS --vxlan-
id=5000
Verify host has locally cached ARP entryfor remote VM’s
Verify VM is connected to LS & mappedto a local VMKnic
Also shows what vmknic ID a VM dvPortis mapped to
esxcli network vswitch dvs
vmware vxlan network port list
--vds-name Compute_VDS --vxlan-
id=5000
the vdrport will always be listed as longas the VNI is attached to a router
View vmknic ID’s and whatswitchport/uplink they are mapped to
esxcli network vswitch dvs
vmware vxlan vmknic list --vds-
name=DSwitch-Res01
NSX Troubleshooting Guide
VMware, Inc. 33
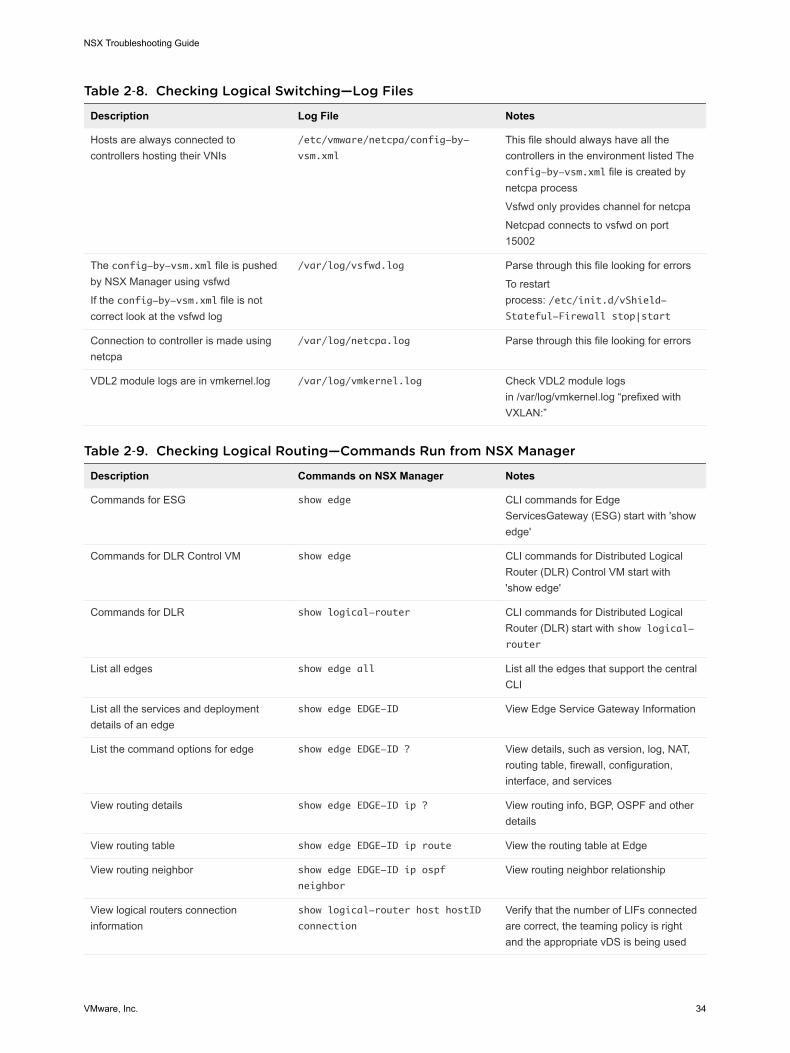
Table 2‑8. Checking Logical Switching—Log Files
Description Log File Notes
Hosts are always connected tocontrollers hosting their VNIs
/etc/vmware/netcpa/config-by-
vsm.xml
This file should always have all thecontrollers in the environment listed Theconfig-by-vsm.xml file is created bynetcpa process
Vsfwd only provides channel for netcpa
Netcpad connects to vsfwd on port15002
The config-by-vsm.xml file is pushedby NSX Manager using vsfwd
If the config-by-vsm.xml file is notcorrect look at the vsfwd log
/var/log/vsfwd.log Parse through this file looking for errors
To restartprocess: /etc/init.d/vShield-Stateful-Firewall stop|start
Connection to controller is made usingnetcpa
/var/log/netcpa.log Parse through this file looking for errors
VDL2 module logs are in vmkernel.log /var/log/vmkernel.log Check VDL2 module logsin /var/log/vmkernel.log “prefixed withVXLAN:”
Table 2‑9. Checking Logical Routing—Commands Run from NSX Manager
Description Commands on NSX Manager Notes
Commands for ESG show edge CLI commands for EdgeServicesGateway (ESG) start with 'showedge'
Commands for DLR Control VM show edge CLI commands for Distributed LogicalRouter (DLR) Control VM start with'show edge'
Commands for DLR show logical-router CLI commands for Distributed LogicalRouter (DLR) start with show logical-router
List all edges show edge all List all the edges that support the centralCLI
List all the services and deploymentdetails of an edge
show edge EDGE-ID View Edge Service Gateway Information
List the command options for edge show edge EDGE-ID ? View details, such as version, log, NAT,routing table, firewall, configuration,interface, and services
View routing details show edge EDGE-ID ip ? View routing info, BGP, OSPF and otherdetails
View routing table show edge EDGE-ID ip route View the routing table at Edge
View routing neighbor show edge EDGE-ID ip ospf
neighbor
View routing neighbor relationship
View logical routers connectioninformation
show logical-router host hostID
connection
Verify that the number of LIFs connectedare correct, the teaming policy is rightand the appropriate vDS is being used
NSX Troubleshooting Guide
VMware, Inc. 34
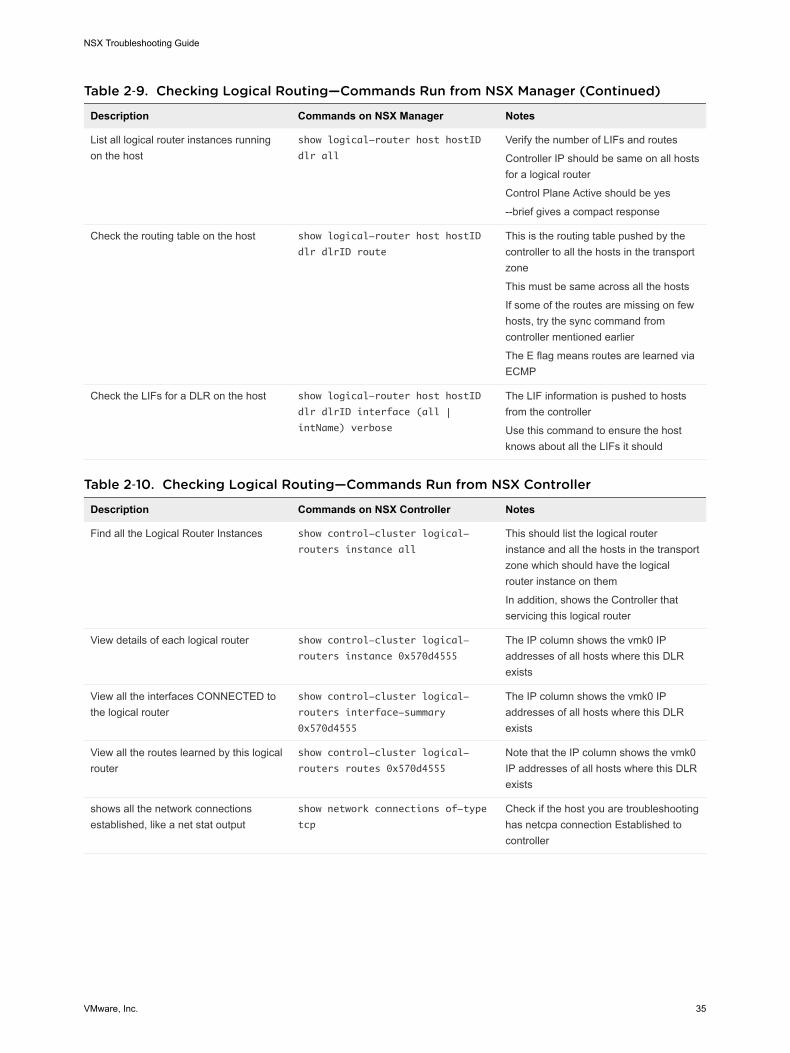
Table 2‑9. Checking Logical Routing—Commands Run from NSX Manager (Continued)
Description Commands on NSX Manager Notes
List all logical router instances runningon the host
show logical-router host hostID
dlr all
Verify the number of LIFs and routes
Controller IP should be same on all hostsfor a logical router
Control Plane Active should be yes
--brief gives a compact response
Check the routing table on the host show logical-router host hostID
dlr dlrID route
This is the routing table pushed by thecontroller to all the hosts in the transportzone
This must be same across all the hosts
If some of the routes are missing on fewhosts, try the sync command fromcontroller mentioned earlier
The E flag means routes are learned viaECMP
Check the LIFs for a DLR on the host show logical-router host hostID
dlr dlrID interface (all |
intName) verbose
The LIF information is pushed to hostsfrom the controller
Use this command to ensure the hostknows about all the LIFs it should
Table 2‑10. Checking Logical Routing—Commands Run from NSX Controller
Description Commands on NSX Controller Notes
Find all the Logical Router Instances show control-cluster logical-
routers instance all
This should list the logical routerinstance and all the hosts in the transportzone which should have the logicalrouter instance on them
In addition, shows the Controller thatservicing this logical router
View details of each logical router show control-cluster logical-
routers instance 0x570d4555
The IP column shows the vmk0 IPaddresses of all hosts where this DLRexists
View all the interfaces CONNECTED tothe logical router
show control-cluster logical-
routers interface-summary
0x570d4555
The IP column shows the vmk0 IPaddresses of all hosts where this DLRexists
View all the routes learned by this logicalrouter
show control-cluster logical-
routers routes 0x570d4555
Note that the IP column shows the vmk0IP addresses of all hosts where this DLRexists
shows all the network connectionsestablished, like a net stat output
show network connections of-type
tcp
Check if the host you are troubleshootinghas netcpa connection Established tocontroller
NSX Troubleshooting Guide
VMware, Inc. 35

Table 2‑10. Checking Logical Routing—Commands Run from NSX Controller (Continued)
Description Commands on NSX Controller Notes
Sync interfaces from controller to host sync control-cluster logical-
routers interface-to-host
<logical-router-id> <host-ip>
Useful if new interface was connected tological router but is not sync'd to all hosts
Sync routes from controller to host sync control-cluster logical-
routers route-to-host <logical-
router-id> <host-ip>
Useful if some routes are missing on fewhosts but are available on majority ofhosts
Table 2‑11. Checking Logical Routing—Commands Run from Edge
DescriptionCommands on Edge or Logical RouterControl VM Notes
View configuration show configuration <global | bgp
| ospf | …>
View the routes learned show ip route Make sure the routing and forwardingtables are in sync
View the forwarding table show ip forwarding Make sure the routing and forwardingtables are in sync
View the vDR interfaces show interface First NIC shown in the output is the vDRinterface
The VDR interface is not a real vNIC onthat VM
All the subnets attached to VDR are oftype INTERNAL
View the other interfaces (management) show interface Management/HA interface is a real vNICon the logical router Control VM
If HA was enabled without specifying anIP address, 169.254.x.x/ 30 is used
If the management interface is given anIP address, it appears here
debug the protocol debug ip ospf
debug ip bgp
Useful to see issues with theconfiguration (such as mismatchedOSPF areas, timers, and wrong ASN)
Note: output is only seen on the Consoleof Edge (not via SSH session)
NSX Troubleshooting Guide
VMware, Inc. 36
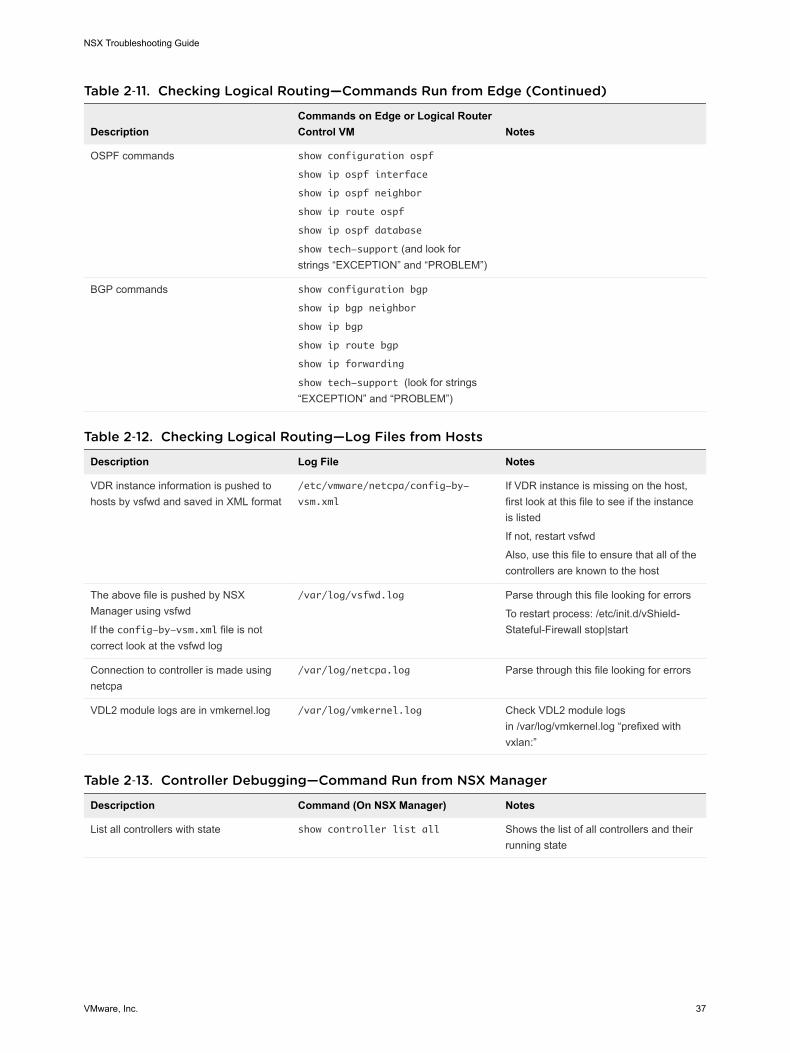
Table 2‑11. Checking Logical Routing—Commands Run from Edge (Continued)
DescriptionCommands on Edge or Logical RouterControl VM Notes
OSPF commands show configuration ospf
show ip ospf interface
show ip ospf neighbor
show ip route ospf
show ip ospf database
show tech-support (and look forstrings “EXCEPTION” and “PROBLEM”)
BGP commands show configuration bgp
show ip bgp neighbor
show ip bgp
show ip route bgp
show ip forwarding
show tech-support (look for strings“EXCEPTION” and “PROBLEM”)
Table 2‑12. Checking Logical Routing—Log Files from Hosts
Description Log File Notes
VDR instance information is pushed tohosts by vsfwd and saved in XML format
/etc/vmware/netcpa/config-by-
vsm.xml
If VDR instance is missing on the host,first look at this file to see if the instanceis listed
If not, restart vsfwd
Also, use this file to ensure that all of thecontrollers are known to the host
The above file is pushed by NSXManager using vsfwd
If the config-by-vsm.xml file is notcorrect look at the vsfwd log
/var/log/vsfwd.log Parse through this file looking for errors
To restart process: /etc/init.d/vShield-Stateful-Firewall stop|start
Connection to controller is made usingnetcpa
/var/log/netcpa.log Parse through this file looking for errors
VDL2 module logs are in vmkernel.log /var/log/vmkernel.log Check VDL2 module logsin /var/log/vmkernel.log “prefixed withvxlan:”
Table 2‑13. Controller Debugging—Command Run from NSX Manager
Descripction Command (On NSX Manager) Notes
List all controllers with state show controller list all Shows the list of all controllers and theirrunning state
NSX Troubleshooting Guide
VMware, Inc. 37
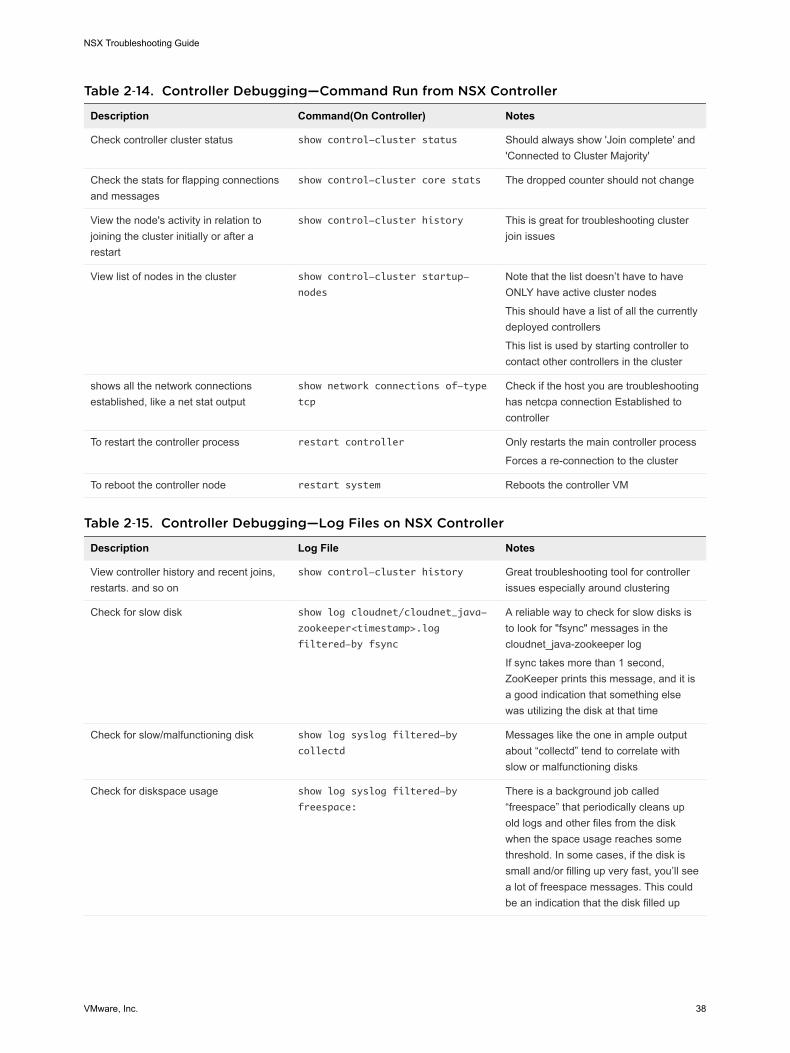
Table 2‑14. Controller Debugging—Command Run from NSX Controller
Description Command(On Controller) Notes
Check controller cluster status show control-cluster status Should always show 'Join complete' and'Connected to Cluster Majority'
Check the stats for flapping connectionsand messages
show control-cluster core stats The dropped counter should not change
View the node's activity in relation tojoining the cluster initially or after arestart
show control-cluster history This is great for troubleshooting clusterjoin issues
View list of nodes in the cluster show control-cluster startup-
nodes
Note that the list doesn’t have to haveONLY have active cluster nodes
This should have a list of all the currentlydeployed controllers
This list is used by starting controller tocontact other controllers in the cluster
shows all the network connectionsestablished, like a net stat output
show network connections of-type
tcp
Check if the host you are troubleshootinghas netcpa connection Established tocontroller
To restart the controller process restart controller Only restarts the main controller process
Forces a re-connection to the cluster
To reboot the controller node restart system Reboots the controller VM
Table 2‑15. Controller Debugging—Log Files on NSX Controller
Description Log File Notes
View controller history and recent joins,restarts. and so on
show control-cluster history Great troubleshooting tool for controllerissues especially around clustering
Check for slow disk show log cloudnet/cloudnet_java-
zookeeper<timestamp>.log
filtered-by fsync
A reliable way to check for slow disks isto look for "fsync" messages in thecloudnet_java-zookeeper log
If sync takes more than 1 second,ZooKeeper prints this message, and it isa good indication that something elsewas utilizing the disk at that time
Check for slow/malfunctioning disk show log syslog filtered-by
collectd
Messages like the one in ample outputabout “collectd” tend to correlate withslow or malfunctioning disks
Check for diskspace usage show log syslog filtered-by
freespace:
There is a background job called“freespace” that periodically cleans upold logs and other files from the diskwhen the space usage reaches somethreshold. In some cases, if the disk issmall and/or filling up very fast, you’ll seea lot of freespace messages. This couldbe an indication that the disk filled up
NSX Troubleshooting Guide
VMware, Inc. 38
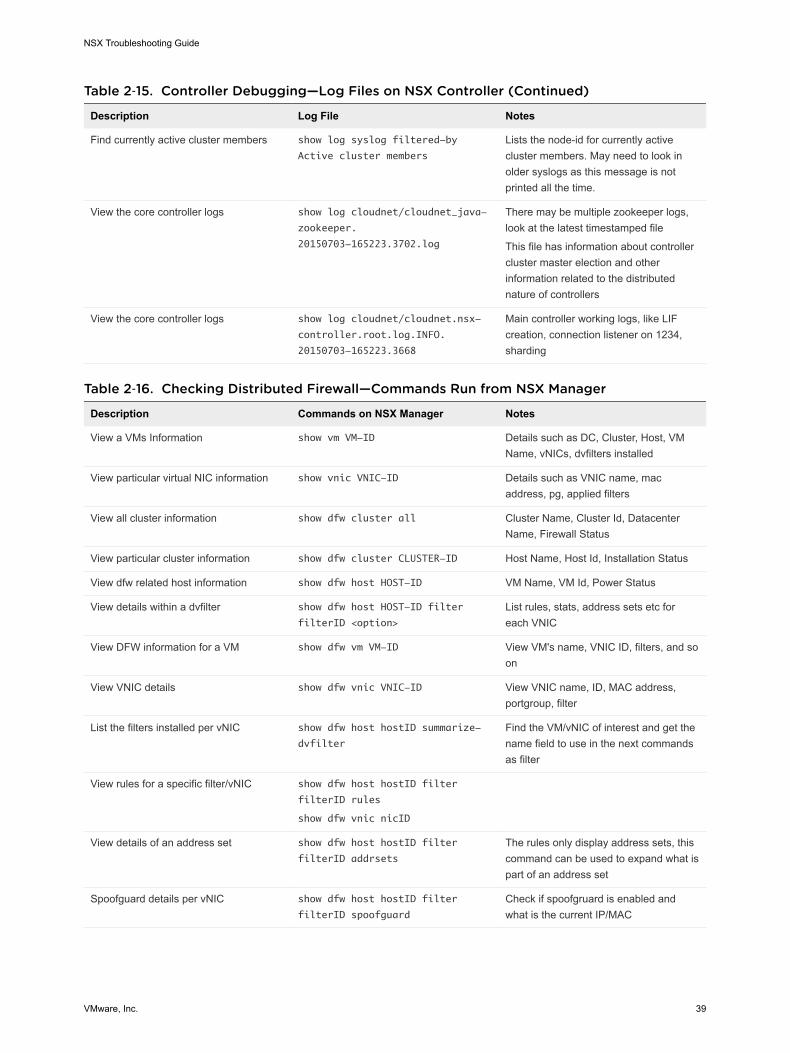
Table 2‑15. Controller Debugging—Log Files on NSX Controller (Continued)
Description Log File Notes
Find currently active cluster members show log syslog filtered-by
Active cluster members
Lists the node-id for currently activecluster members. May need to look inolder syslogs as this message is notprinted all the time.
View the core controller logs show log cloudnet/cloudnet_java-
zookeeper.
20150703-165223.3702.log
There may be multiple zookeeper logs,look at the latest timestamped file
This file has information about controllercluster master election and otherinformation related to the distributednature of controllers
View the core controller logs show log cloudnet/cloudnet.nsx-
controller.root.log.INFO.
20150703-165223.3668
Main controller working logs, like LIFcreation, connection listener on 1234,sharding
Table 2‑16. Checking Distributed Firewall—Commands Run from NSX Manager
Description Commands on NSX Manager Notes
View a VMs Information show vm VM-ID Details such as DC, Cluster, Host, VMName, vNICs, dvfilters installed
View particular virtual NIC information show vnic VNIC-ID Details such as VNIC name, macaddress, pg, applied filters
View all cluster information show dfw cluster all Cluster Name, Cluster Id, DatacenterName, Firewall Status
View particular cluster information show dfw cluster CLUSTER-ID Host Name, Host Id, Installation Status
View dfw related host information show dfw host HOST-ID VM Name, VM Id, Power Status
View details within a dvfilter show dfw host HOST-ID filter
filterID <option>
List rules, stats, address sets etc foreach VNIC
View DFW information for a VM show dfw vm VM-ID View VM's name, VNIC ID, filters, and soon
View VNIC details show dfw vnic VNIC-ID View VNIC name, ID, MAC address,portgroup, filter
List the filters installed per vNIC show dfw host hostID summarize-
dvfilter
Find the VM/vNIC of interest and get thename field to use in the next commandsas filter
View rules for a specific filter/vNIC show dfw host hostID filter
filterID rules
show dfw vnic nicID
View details of an address set show dfw host hostID filter
filterID addrsets
The rules only display address sets, thiscommand can be used to expand what ispart of an address set
Spoofguard details per vNIC show dfw host hostID filter
filterID spoofguard
Check if spoofgruard is enabled andwhat is the current IP/MAC
NSX Troubleshooting Guide
VMware, Inc. 39

Table 2‑16. Checking Distributed Firewall—Commands Run from NSX Manager (Continued)
Description Commands on NSX Manager Notes
View details of flow records show dfw host hostID filter
filterID flows
If flow monitoring is enabled, host sendsflow information periodically to NSXManager
Use this command to see flows per vNIC
View statistics for each rule for a vNIC show dfw host hostID filter
filterID stats
This is useful to see if rules are being hit
Table 2‑17. Checking Distributed Firewall—Commands Run from Hosts
Description Commands on Host Notes
Lists VIBs downloaded on the host esxcli software vib list | grep
vsip
Check to make sure right vib version isdownloaded
Details on system modules currentlyloaded
esxcli system module get -m vsip Check to make sure that the module wasinstalled/loaded
Process list ps | grep vsfwd View if the vsfwd process is running withseveral threads
Deamon command /etc/init.d/vShield-Stateful-
Firewall {start|stop|status|
restart}
Check if the deamon is running andrestart if needed
View network connection esxcli network ip connection
list | grep 5671
Check if the host has TCP connectivity toNSX Manager
Table 2‑18. Checking Distributed Firewall—Log Files on Hosts
Description Log Notes
Process log /var/log/vsfwd.log vsfwd deamon log, useful for vsfwdprocess, NSX Manager connectivity, andRabbitMQ troubleshooting
Packet logs dedicated file /var/log/dfwpktlogs.log Dedicated log file for packet logs
Packet capture at the dvfilter pktcap-uw --dvfilter
nic-1413082-eth0-vmware-sfw.2 --
outfile test.pcap
NSX Troubleshooting Guide
VMware, Inc. 40
Traceflow 3Traceflow is a troubleshooting tool that provides the ability to inject a packet and observe where thatpacket is seen as it passes through the physical and logical network. The observations allow you todetermine information about the network, such as identifying a node that is down or a firewall rule that ispreventing a packet from being received by its destination.
This chapter includes the following topics:n About Traceflow
n Use Traceflow for Troubleshooting
About TraceflowTraceflow injects packets into a vSphere distributed switch (VDS) port and provides various observationpoints along the packet’s path as it traverses physical and logical entities (such as ESXi hosts, logicalswitches, and logical routers) in the overlay and underlay networks. This allows you to identify the path(or paths) a packet takes to reach its destination or, conversely, where a packet is dropped along the way.Each entity reports the packet handling on input and output, so you can determine whether issues occurwhen receiving a packet or when forwarding the packet.
Keep in mind that traceflow is not the same as a ping request/response that goes from guest-VM stack toguest-VM stack. What traceflow does is observe a marked packet as it traverses the overlay network.Each packet is monitored as it crosses the overlay network until it reaches and is deliverable to thedestination guest VM. However, the injected traceflow packet is never actually delivered to the destinationguest VM. This means that a traceflow can be successful even when the guest VM is powered down.
Traceflow supports the following traffic types:
n Layer 2 unicast
n Layer 3 unicast
n Layer 2 broadcast
n Layer 2 multicast
VMware, Inc. 41
You can construct packets with custom header fields and packet sizes. The source for the traceflow isalways a virtual machine virtual NIC (vNIC). The destination endpoint can be any device in the NSXoverlay or in the underlay. However, you cannot select a destination that is north of an NSX edge servicesgateway (ESG). The destination must be on the same subnet or must be reachable through NSXdistributed logical routers.
The traceflow operation is considered Layer 2 if the source and destination vNICs are in the same Layer2 domain. In NSX, this means that they are on the same VXLAN network identifier (VNI or segment ID).This happens, for example, when two VMs are attached to the same logical switch.
If NSX bridging is configured, unknown Layer 2 packets are always be sent to the bridge. Typically, thebridge forwards these packets to a VLAN and reports the traceflow packet as delivered. A packetreported as delivered does not necessarily mean that the trace packet was delivered to the specifieddestination.
For Layer 3 traceflow unicast traffic, the two end points are on different logical switches and have differentVNIs, connected to a distributed logical router (DLR).
For multicast traffic, the source is a VM vNIC, and the destination is a multicast group address.
Traceflow observations may include observations of broadcasted traceflow packets. The ESXi hostbroadcasts a traceflow packet if it does not know the destination host's MAC address. For broadcasttraffic, the source is a VM vNIC. The Layer 2 destination MAC address for broadcast traffic isFF:FF:FF:FF:FF:FF. To create a valid packet for firewall inspection, the broadcast traceflow operationrequires a subnet prefix length. The subnet mask enables NSX to calculate an IP network address for thepacket.
Caution Depending on the number of logical ports in your deployment, multicast and broadcasttraceflow operations might generate high traffic volume.
There are two ways to use traceflow: through the API and through the GUI. The API is the same API thatthe GUI uses, except the API allows you to specify the exact settings within the packet, while the GUI hasmore limited settings.
The GUI allows you to set the following values:
n Protocol---TCP, UDP, ICMP.
n Time-to-live (TTL). The default is 64 hops.
n TCP and UDP source and destination port numbers. The default values are 0.
n TCP flags.
n ICMP ID and sequence number. Both are 0 by default.
n An expiry timeout, in milliseconds (ms), for the traceflow operation. The default is 10,000 ms.
n Ethernet frame size. The default is 128 bytes per frame. The maximum frame size is 1000 bytes perframe.
n Payload encoding. The default is Base64.
NSX Troubleshooting Guide
VMware, Inc. 42
n Payload value.
Use Traceflow for TroubleshootingThere are multiple scenarios in which traceflow is useful.
Traceflow is useful in the following scenarios:
n Troubleshooting network failures to see the exact path that traffic takes
n Performance monitoring to see link utilization
n Network planning to see how a network will behave when it is in production
Prerequisites
n Traceflow operations require communication among vCenter, NSX Manager, the NSX Controllercluster and the netcpa user world agents on the hosts.
n For Traceflow to work as expected, make sure that the controller cluster is connected and in healthystate.
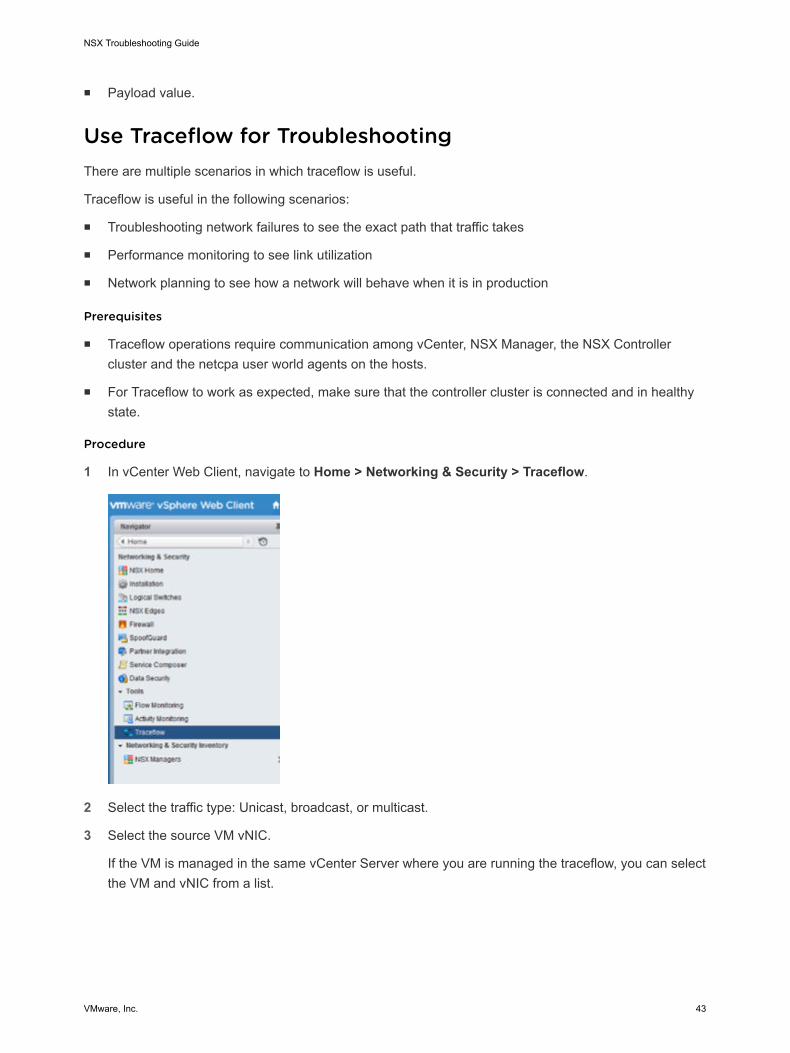
Procedure
1 In vCenter Web Client, navigate to Home > Networking & Security > Traceflow.
2 Select the traffic type: Unicast, broadcast, or multicast.
3 Select the source VM vNIC.
If the VM is managed in the same vCenter Server where you are running the traceflow, you can selectthe VM and vNIC from a list.
NSX Troubleshooting Guide
VMware, Inc. 43

4 For a unicast traceflow, enter the destination vNIC information.
The destination can be a vNIC of any device in the NSX overlay or underlay, such as a host, a VM, alogical router, or an edge services gateway. If the destination is a VM that is running VMware Toolsand is managed in the same vCenter Server from which you are running the traceflow, you can selectthe VM and vNIC from a list.
Otherwise, you must enter the destination IP address (and the MAC address for a unicast Layer 2traceflow). You can gather this information from the device itself in the device console or in an SSHsession. For example, if it is a Linux VM, you can get its IP and MAC address by running theifconfig command in the Linux terminal. For a logical router or edge services gateway, you cangather the information from the show interface CLI command.
5 For a Layer 2 broadcast traceflow, enter the subnet prefix length.
The packet is switched based on MAC address only. The destination MAC address isFF:FF:FF:FF:FF:FF.
Both the source and destination IP addresses are required to make the IP packet valid for firewallinspection.
6 For a Layer 2 multicast traceflow, enter the multicast group address.
The packet is switched based on MAC address only.
Both the source and destination IP addresses are required to make the IP packet valid. In the case ofmulticast, the MAC address is deduced from the IP address.
7 Configure other required and optional settings.
8 Click Trace.
Example: ScenariosThe following example shows a Layer 2 traceflow involving two VMs that are running on a single ESXihost. The two VMs are connected to a single logical switch.
NSX Troubleshooting Guide
VMware, Inc. 44
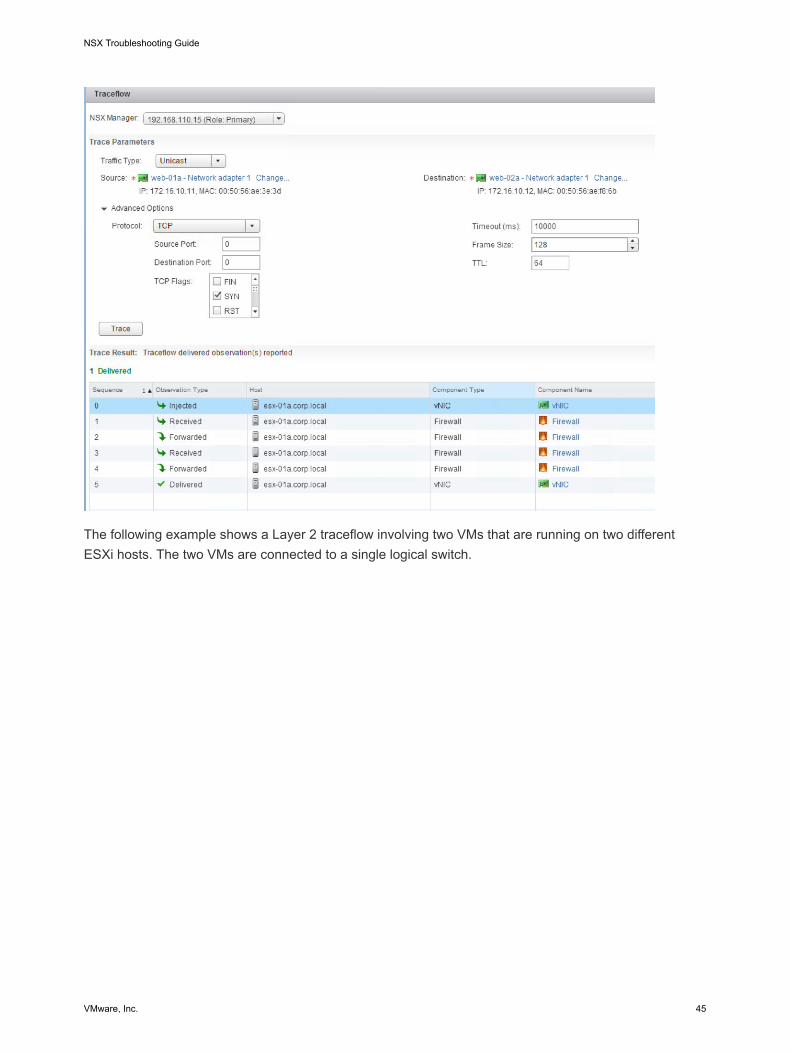
The following example shows a Layer 2 traceflow involving two VMs that are running on two differentESXi hosts. The two VMs are connected to a single logical switch.
NSX Troubleshooting Guide
VMware, Inc. 45
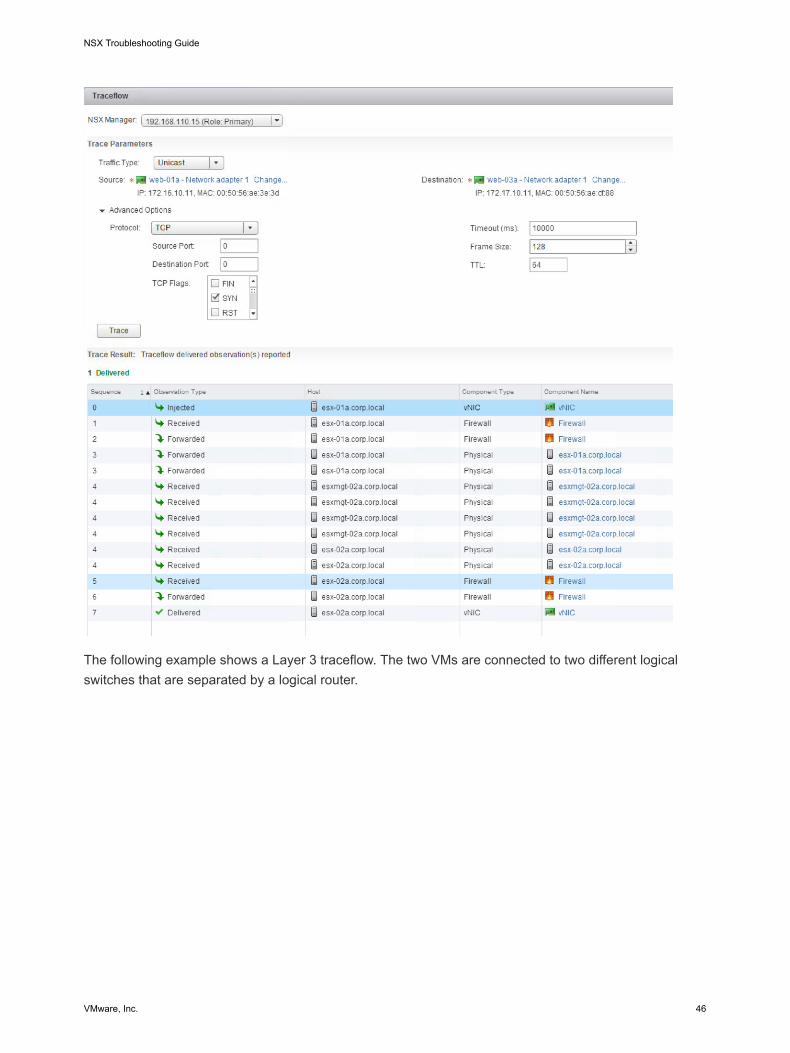
The following example shows a Layer 3 traceflow. The two VMs are connected to two different logicalswitches that are separated by a logical router.
NSX Troubleshooting Guide
VMware, Inc. 46
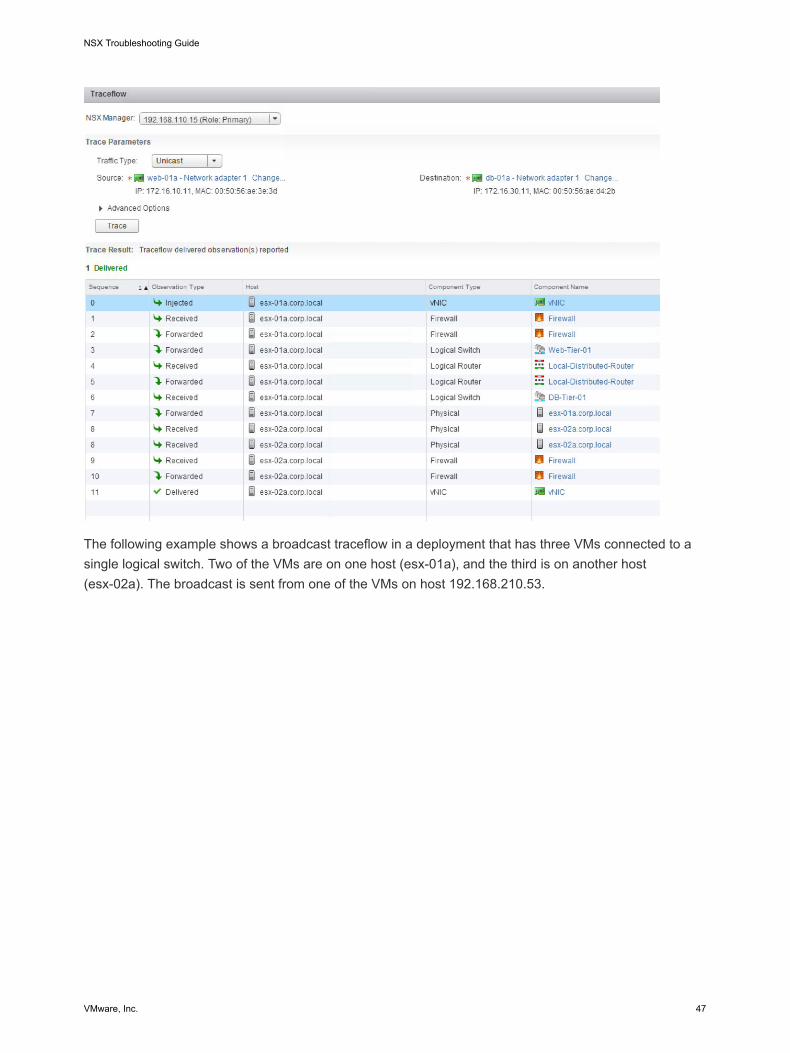
The following example shows a broadcast traceflow in a deployment that has three VMs connected to asingle logical switch. Two of the VMs are on one host (esx-01a), and the third is on another host(esx-02a). The broadcast is sent from one of the VMs on host 192.168.210.53.
NSX Troubleshooting Guide
VMware, Inc. 47
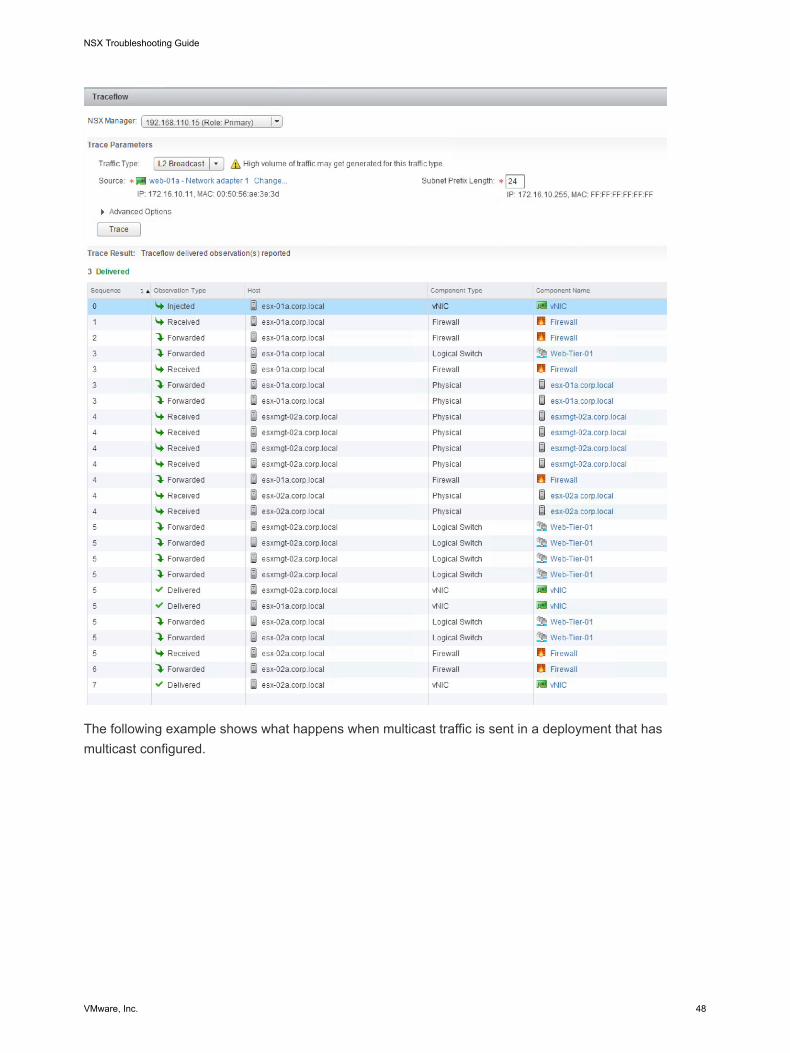
The following example shows what happens when multicast traffic is sent in a deployment that hasmulticast configured.
NSX Troubleshooting Guide
VMware, Inc. 48
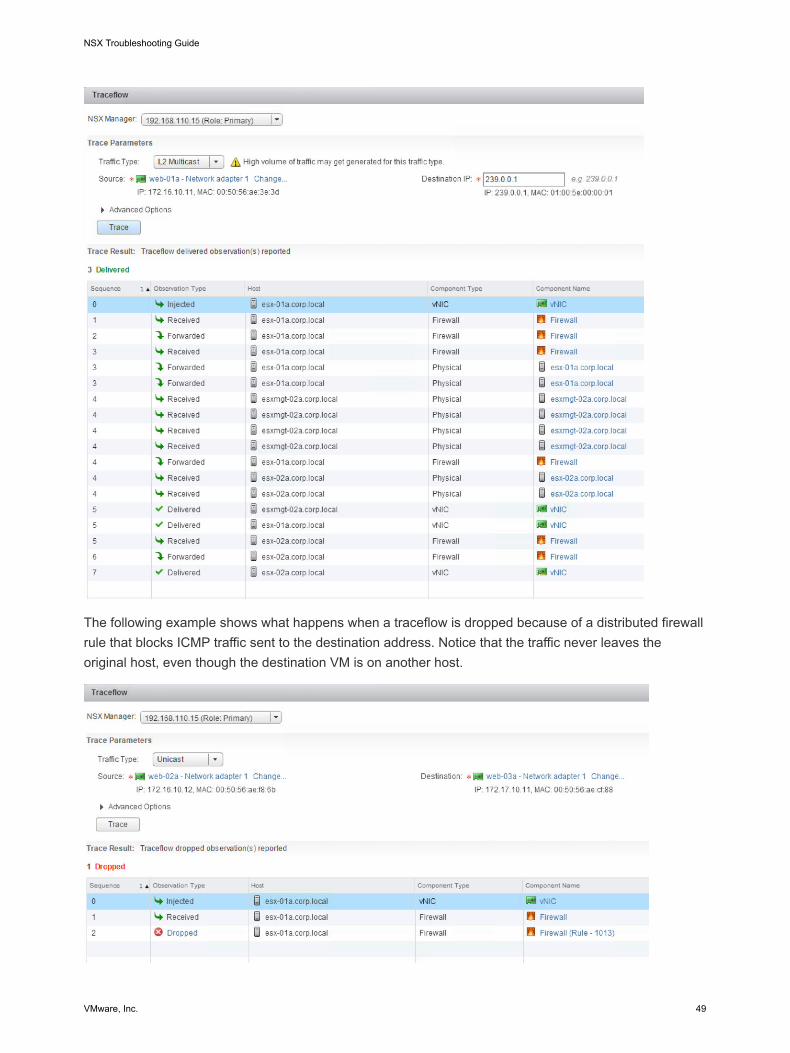
The following example shows what happens when a traceflow is dropped because of a distributed firewallrule that blocks ICMP traffic sent to the destination address. Notice that the traffic never leaves theoriginal host, even though the destination VM is on another host.
NSX Troubleshooting Guide
VMware, Inc. 49
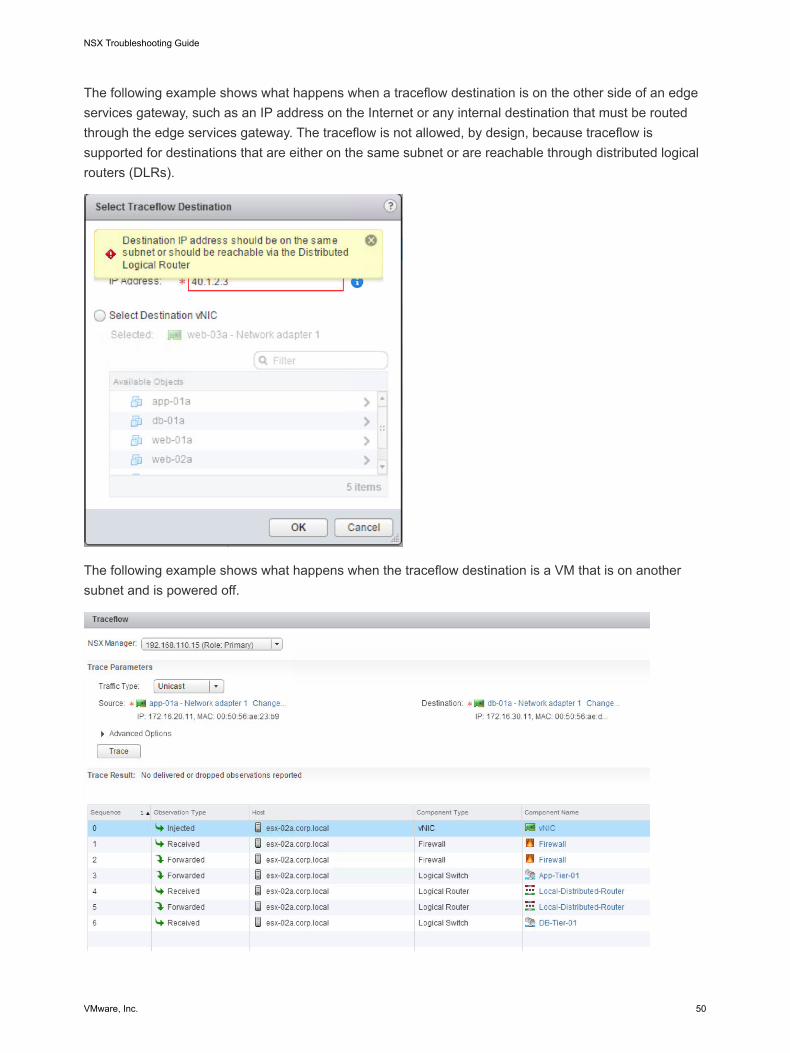
The following example shows what happens when a traceflow destination is on the other side of an edgeservices gateway, such as an IP address on the Internet or any internal destination that must be routedthrough the edge services gateway. The traceflow is not allowed, by design, because traceflow issupported for destinations that are either on the same subnet or are reachable through distributed logicalrouters (DLRs).
The following example shows what happens when the traceflow destination is a VM that is on anothersubnet and is powered off.
NSX Troubleshooting Guide
VMware, Inc. 50

NSX Routing 4NSX has two types of routing subsystems, optimised for two key needs.
The NSX routing subsystems are:
n Routing within the logical space, also known as “East – West” routing, provided by the DistributedLogical Router (DLR);
n Routing between the physical and logical space, also known as “North – South” routing, provided bythe Edge Services Gateways (ESG).
Both provide options for horizontal scaling.
You can scale-out distributed E-W routing via the DLR.
The DLR supports running a single dynamic routing protocol at a time (OSPF or BGP), while the ESGsupports running both routing protocols at the same time. The reason for this is the DLR is designed to bes a “stub” router, with a single path out, which means more advanced routing configurations are typicallynot required.
Both the DLR and the ESG support having a combination of static and dynamic routes.
Both the DLR and the ESG support ECMP routes.
Both provide L3 domain separation, meaning that each instance of a Distributed Logical Router or anEdge Services Gateway has its own L3 configuration, similar to an L3VPN VRF.
VMware, Inc. 51
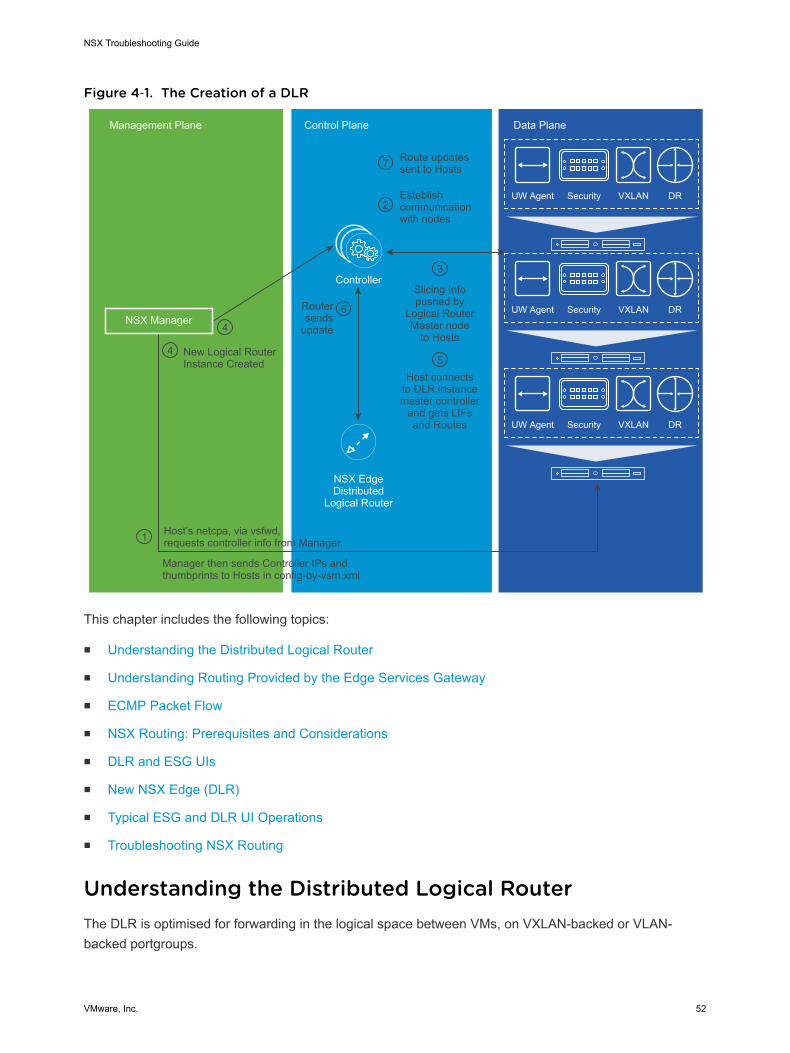
Figure 4‑1. The Creation of a DLR
NSX EdgeDistributed
Logical Router
Host’s netcpa, via vsfwd, requests controller info from Manager.
New Logical Router Instance Created
Routersends
update
Manager then sends Controller IPs andthumbprints to Hosts in config-by-vsm.xml
Controller
1
Route updatessent to Hosts7
Establish communicationwith nodes
2
Slicing Infopushed by
Logical Router Master node
to Hosts
3
Host connectsto DLR instancemaster controller
and gets LIFsand Routes
5
4
6
4
Management Plane Control Plane Data Plane
Security VXLAN DRUW Agent
Security VXLAN DRUW Agent
Security VXLAN DRUW Agent
NSX Manager
This chapter includes the following topics:
n Understanding the Distributed Logical Router
n Understanding Routing Provided by the Edge Services Gateway
n ECMP Packet Flow
n NSX Routing: Prerequisites and Considerations
n DLR and ESG UIs
n New NSX Edge (DLR)
n Typical ESG and DLR UI Operations
n Troubleshooting NSX Routing
Understanding the Distributed Logical RouterThe DLR is optimised for forwarding in the logical space between VMs, on VXLAN-backed or VLAN-backed portgroups.
NSX Troubleshooting Guide
VMware, Inc. 52
The DLR has the following properties:
n High performance, low overhead first-hop routing:
n Scales linearly with the number of hosts
n Supports 8-way ECMP on uplink
n Up to 1,000 DLR instances per host
n Up to 999 logical interfaces (LIFs) on each DLR (8 x uplink + 991 internal) + 1 x management
n Up to 10,000 LIFs per host distributed across all DLR instances (not enforced by NSX Manager)
Keep in mind the following caveats:
n Cannot connect more than one DLR to any given VLAN or VXLAN.
n Cannot run more than one routing protocol on each DLR.
n If OSPF is used, cannot run it on more than one DLR uplink.
n To route between VXLAN and VLAN, the transport zone must span single DVS.
The DLR’s design at a high level is analogous to a modular router chassis, in the following ways:
n ESXi hosts are like line cards:
n They have ports with connected end stations (VMs).
n This is where the forwarding decisions are made.
n The DLR Control VM is like a Route Processor Engine:
n It runs dynamic routing protocols to exchange routing information with the rest of the network.
n It computes forwarding tables for “line cards” based on the configuration of interfaces, staticroutes, and dynamic routing information.
n It programs these forwarding tables into the “line cards” (via the Controller Cluster, to enablescale and resiliency).
n The physical network connecting ESXi hosts together is like a backplane:
n It carries VLAN-encapsulated or VXLAN-encapsulated data between the “line cards.”
High-Level DLR Packet FlowEach ESXi host has its own copy of each configured DLR instance. Each DLR instance has its ownunique set of tables containing the information needed to forward packets. This information issynchronized across all hosts where this DLR instance exists. Instances of an individual DLR acrossdifferent hosts have exactly the same information.
Routing is always handled by a DLR instance on the same host where the source VM is running. Thismeans that when source and destination VMs are on different hosts, the DLR instance that providesrouting between them sees packets only in one direction, from source VM to destination. Return traffic isonly seen by the corresponding instance of the same DLR on the destination VM’s host.
NSX Troubleshooting Guide
VMware, Inc. 53
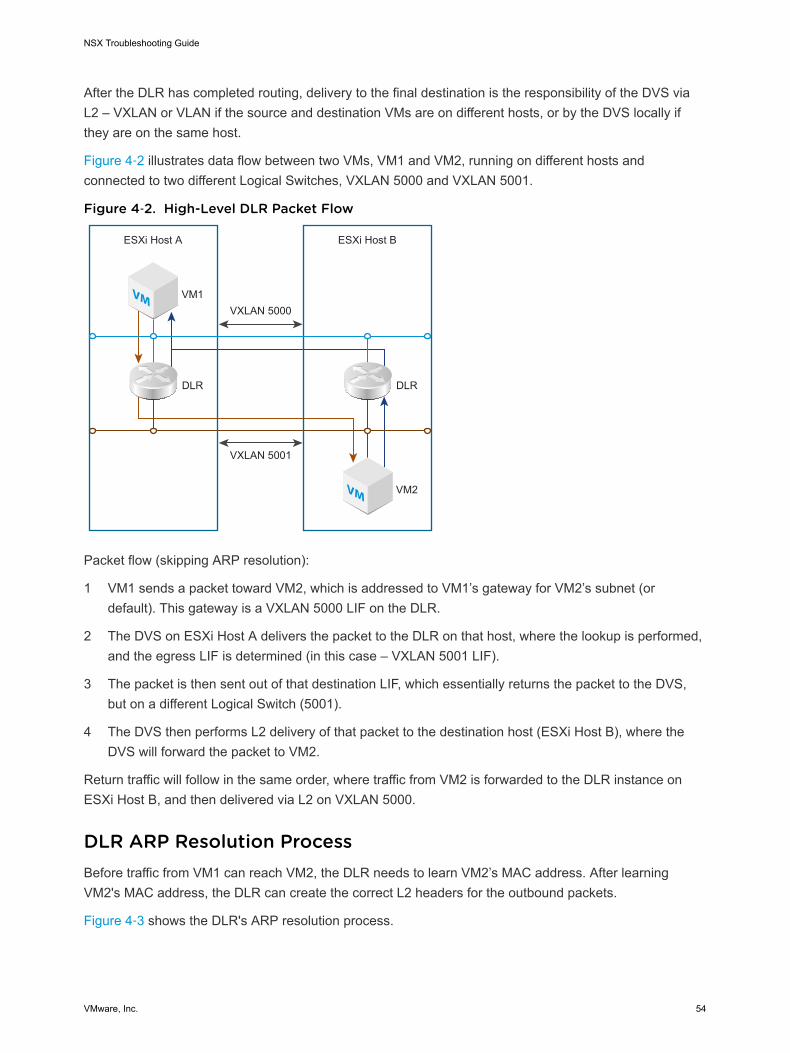
After the DLR has completed routing, delivery to the final destination is the responsibility of the DVS viaL2 – VXLAN or VLAN if the source and destination VMs are on different hosts, or by the DVS locally ifthey are on the same host.
Figure 4‑2 illustrates data flow between two VMs, VM1 and VM2, running on different hosts andconnected to two different Logical Switches, VXLAN 5000 and VXLAN 5001.
Figure 4‑2. High-Level DLR Packet Flow
VM
VM
ESXi Host A
VXLAN 5000
VXLAN 5001
DLR
VM1
VM2
ESXi Host B
DLR
Packet flow (skipping ARP resolution):
1 VM1 sends a packet toward VM2, which is addressed to VM1’s gateway for VM2’s subnet (ordefault). This gateway is a VXLAN 5000 LIF on the DLR.
2 The DVS on ESXi Host A delivers the packet to the DLR on that host, where the lookup is performed,and the egress LIF is determined (in this case – VXLAN 5001 LIF).
3 The packet is then sent out of that destination LIF, which essentially returns the packet to the DVS,but on a different Logical Switch (5001).
4 The DVS then performs L2 delivery of that packet to the destination host (ESXi Host B), where theDVS will forward the packet to VM2.
Return traffic will follow in the same order, where traffic from VM2 is forwarded to the DLR instance onESXi Host B, and then delivered via L2 on VXLAN 5000.
DLR ARP Resolution ProcessBefore traffic from VM1 can reach VM2, the DLR needs to learn VM2’s MAC address. After learningVM2's MAC address, the DLR can create the correct L2 headers for the outbound packets.
Figure 4‑3 shows the DLR's ARP resolution process.
NSX Troubleshooting Guide
VMware, Inc. 54
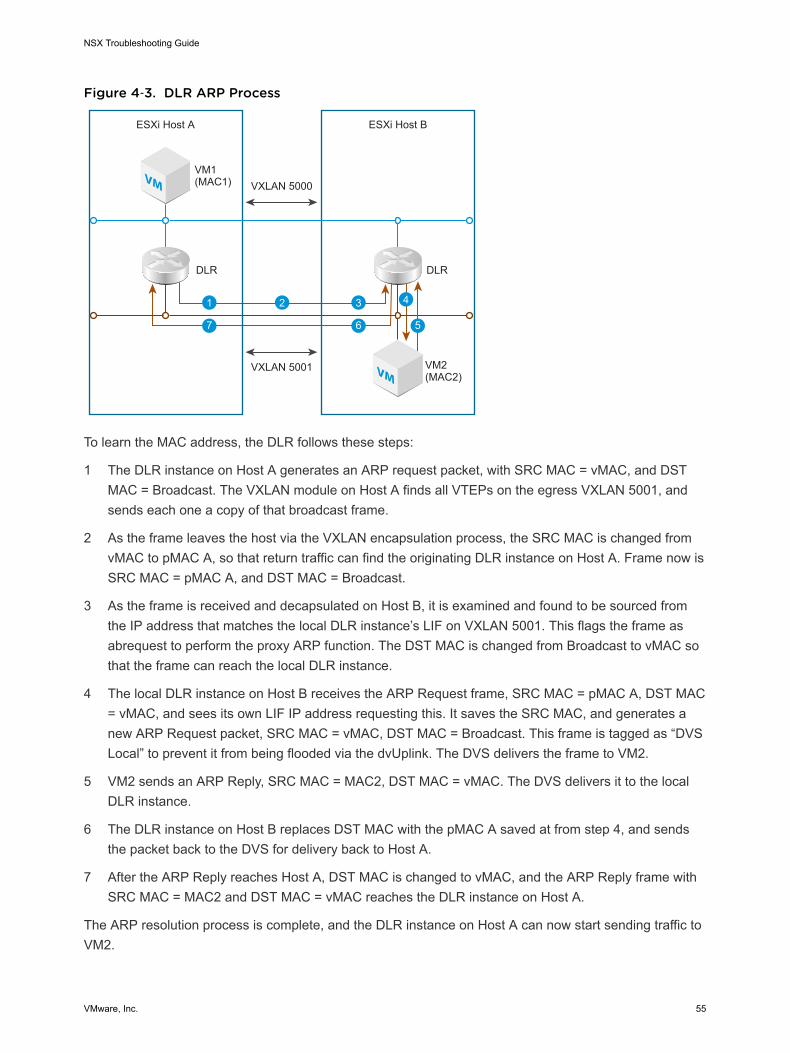
Figure 4‑3. DLR ARP Process
VM
VM
ESXi Host A
VXLAN 5000
VXLAN 5001
DLR
1 2 3
VM1(MAC1)
ESXi Host B
DLR
VM2(MAC2)
4
567
To learn the MAC address, the DLR follows these steps:
1 The DLR instance on Host A generates an ARP request packet, with SRC MAC = vMAC, and DSTMAC = Broadcast. The VXLAN module on Host A finds all VTEPs on the egress VXLAN 5001, andsends each one a copy of that broadcast frame.
2 As the frame leaves the host via the VXLAN encapsulation process, the SRC MAC is changed fromvMAC to pMAC A, so that return traffic can find the originating DLR instance on Host A. Frame now isSRC MAC = pMAC A, and DST MAC = Broadcast.
3 As the frame is received and decapsulated on Host B, it is examined and found to be sourced fromthe IP address that matches the local DLR instance’s LIF on VXLAN 5001. This flags the frame asabrequest to perform the proxy ARP function. The DST MAC is changed from Broadcast to vMAC sothat the frame can reach the local DLR instance.
4 The local DLR instance on Host B receives the ARP Request frame, SRC MAC = pMAC A, DST MAC= vMAC, and sees its own LIF IP address requesting this. It saves the SRC MAC, and generates anew ARP Request packet, SRC MAC = vMAC, DST MAC = Broadcast. This frame is tagged as “DVSLocal” to prevent it from being flooded via the dvUplink. The DVS delivers the frame to VM2.
5 VM2 sends an ARP Reply, SRC MAC = MAC2, DST MAC = vMAC. The DVS delivers it to the localDLR instance.
6 The DLR instance on Host B replaces DST MAC with the pMAC A saved at from step 4, and sendsthe packet back to the DVS for delivery back to Host A.
7 After the ARP Reply reaches Host A, DST MAC is changed to vMAC, and the ARP Reply frame withSRC MAC = MAC2 and DST MAC = vMAC reaches the DLR instance on Host A.
The ARP resolution process is complete, and the DLR instance on Host A can now start sending traffic toVM2.
NSX Troubleshooting Guide
VMware, Inc. 55
Understanding Routing Provided by the Edge ServicesGatewayThe second subsystem of NSX Routing is provided by Edge Services Gateway.
The ESG is essentially a router in a virtual machine. It is delivered in an appliance-like form factor withfour sizes, with its complete lifecycle managed by the NSX Manager. The ESG’s primary use case is as aperimeter router, where it is deployed between multiple DLRs and between the physical world and thevirtualized network.
The ESG has the following properties:
n Each ESG can have up to 10 vNIC interfaces, or 200 trunk sub-interfaces.
n Each ESG supports 8-way ECMP for path redundancy and scalability.
ECMP Packet FlowSuppose two ESGs are deployed to provide a DLR instance with 2-way ECMP uplinks with the physicalenvironment.
Figure 4‑4 shows the ESG and DLR packet flow when equal-cost multipath (ECMP) routing is enabledbetween two ESGs and the physical infrastructure.
VM1 thus has access to 2x bi-directional throughput compared with a deployment with a single ESG.
VM1 is connected to a Logical Switch with the VNI 5000.
The DLR has two LIFs – Internal on VNI 5000, and Uplink on VNI 5001.
The DLR has ECMP enabled and is receiving equal cost routes toward the IP subnet of VLAN 20 from apair of ESGs, ESG A and ESG B via a dynamic routing protocol (BGP or OSPF).
The two ESGs are connected to a VLAN-backed dvPortgroup associated with VLAN 10, where a physicalrouter that provides connectivity to VLAN 20 is also connected.
The ESGs receive external routes for VLAN 20, via a dynamic routing protocol from the physical router.
The physical router in exchange learns about the IP subnet associated with VXLAN 5000 from bothESGs, and performs ECMP load balancing for the traffic toward VMs in that subnet.
NSX Troubleshooting Guide
VMware, Inc. 56
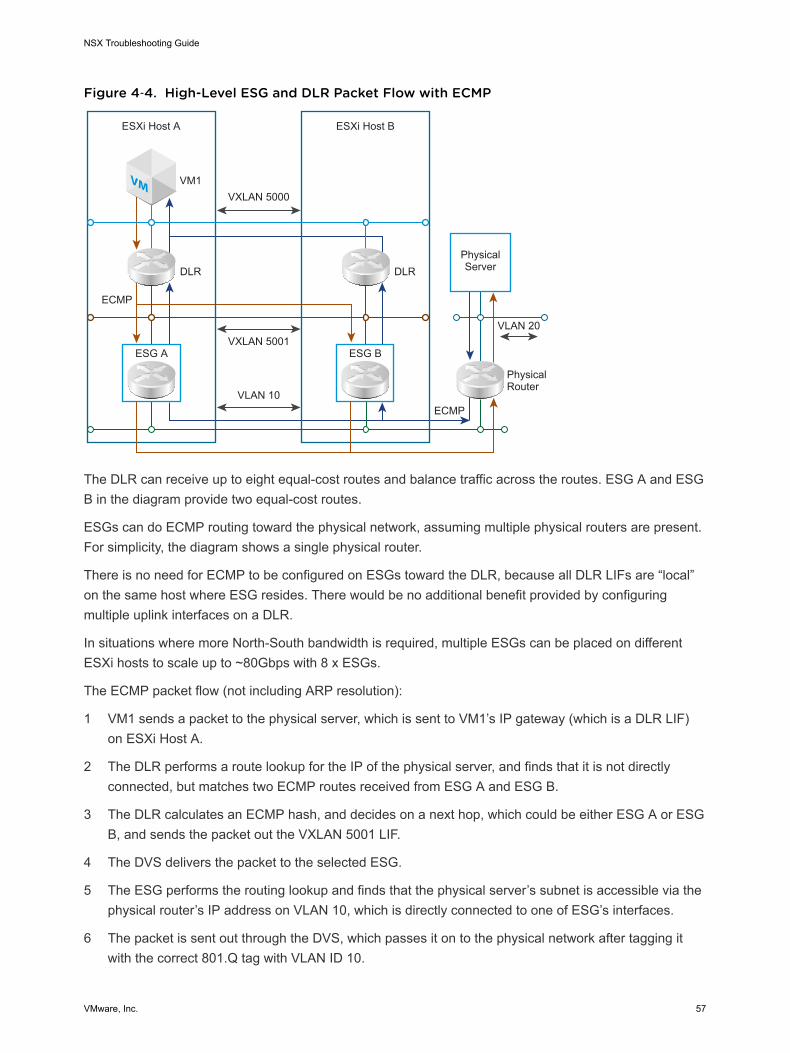
Figure 4‑4. High-Level ESG and DLR Packet Flow with ECMP
VM
ESXi Host A
VXLAN 5000
VLAN 10
VLAN 20
Physical Router
VXLAN 5001
DLR
ESG A
PhysicalServer
ESG B
VM1
ESXi Host B
DLR
ECMP
ECMP
The DLR can receive up to eight equal-cost routes and balance traffic across the routes. ESG A and ESGB in the diagram provide two equal-cost routes.
ESGs can do ECMP routing toward the physical network, assuming multiple physical routers are present.For simplicity, the diagram shows a single physical router.
There is no need for ECMP to be configured on ESGs toward the DLR, because all DLR LIFs are “local”on the same host where ESG resides. There would be no additional benefit provided by configuringmultiple uplink interfaces on a DLR.
In situations where more North-South bandwidth is required, multiple ESGs can be placed on differentESXi hosts to scale up to ~80Gbps with 8 x ESGs.
The ECMP packet flow (not including ARP resolution):
1 VM1 sends a packet to the physical server, which is sent to VM1’s IP gateway (which is a DLR LIF)on ESXi Host A.
2 The DLR performs a route lookup for the IP of the physical server, and finds that it is not directlyconnected, but matches two ECMP routes received from ESG A and ESG B.
3 The DLR calculates an ECMP hash, and decides on a next hop, which could be either ESG A or ESGB, and sends the packet out the VXLAN 5001 LIF.
4 The DVS delivers the packet to the selected ESG.
5 The ESG performs the routing lookup and finds that the physical server’s subnet is accessible via thephysical router’s IP address on VLAN 10, which is directly connected to one of ESG’s interfaces.
6 The packet is sent out through the DVS, which passes it on to the physical network after tagging itwith the correct 801.Q tag with VLAN ID 10.
NSX Troubleshooting Guide
VMware, Inc. 57
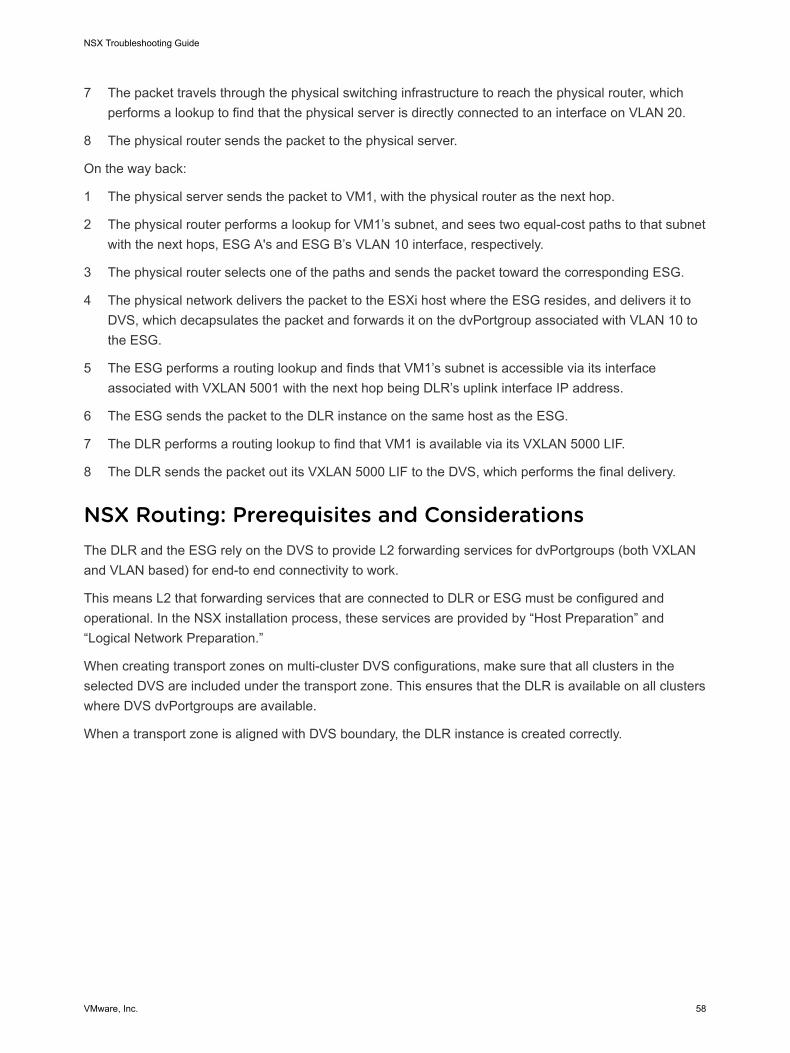
7 The packet travels through the physical switching infrastructure to reach the physical router, whichperforms a lookup to find that the physical server is directly connected to an interface on VLAN 20.
8 The physical router sends the packet to the physical server.
On the way back:
1 The physical server sends the packet to VM1, with the physical router as the next hop.
2 The physical router performs a lookup for VM1’s subnet, and sees two equal-cost paths to that subnetwith the next hops, ESG A's and ESG B’s VLAN 10 interface, respectively.
3 The physical router selects one of the paths and sends the packet toward the corresponding ESG.
4 The physical network delivers the packet to the ESXi host where the ESG resides, and delivers it toDVS, which decapsulates the packet and forwards it on the dvPortgroup associated with VLAN 10 tothe ESG.
5 The ESG performs a routing lookup and finds that VM1’s subnet is accessible via its interfaceassociated with VXLAN 5001 with the next hop being DLR’s uplink interface IP address.
6 The ESG sends the packet to the DLR instance on the same host as the ESG.
7 The DLR performs a routing lookup to find that VM1 is available via its VXLAN 5000 LIF.
8 The DLR sends the packet out its VXLAN 5000 LIF to the DVS, which performs the final delivery.
NSX Routing: Prerequisites and ConsiderationsThe DLR and the ESG rely on the DVS to provide L2 forwarding services for dvPortgroups (both VXLANand VLAN based) for end-to end connectivity to work.
This means L2 that forwarding services that are connected to DLR or ESG must be configured andoperational. In the NSX installation process, these services are provided by “Host Preparation” and“Logical Network Preparation.”
When creating transport zones on multi-cluster DVS configurations, make sure that all clusters in theselected DVS are included under the transport zone. This ensures that the DLR is available on all clusterswhere DVS dvPortgroups are available.
When a transport zone is aligned with DVS boundary, the DLR instance is created correctly.
NSX Troubleshooting Guide
VMware, Inc. 58
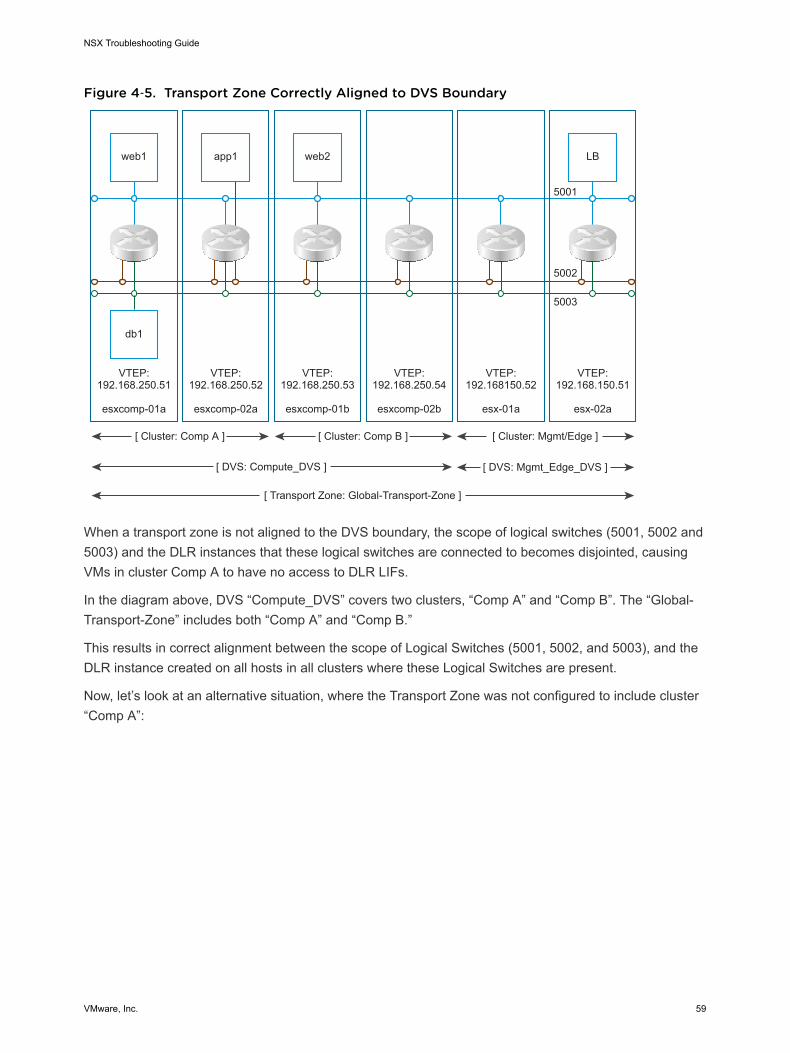
Figure 4‑5. Transport Zone Correctly Aligned to DVS Boundary
[ Cluster: Comp A ]
VTEP:192.168.250.51
esxcomp-01a
VTEP:192.168.250.52
esxcomp-02a
VTEP:192.168.250.53
esxcomp-01b
VTEP:192.168.250.54
esxcomp-02b
VTEP:192.168150.52
esx-01a
VTEP:192.168.150.51
esx-02a
5001
5002
5003
[ DVS: Compute_DVS ]
[ Cluster: Comp B ]
[ Transport Zone: Global-Transport-Zone ]
[ Cluster: Mgmt/Edge ]
[ DVS: Mgmt_Edge_DVS ]
web1 app1 web2 LB
db1
When a transport zone is not aligned to the DVS boundary, the scope of logical switches (5001, 5002 and5003) and the DLR instances that these logical switches are connected to becomes disjointed, causingVMs in cluster Comp A to have no access to DLR LIFs.
In the diagram above, DVS “Compute_DVS” covers two clusters, “Comp A” and “Comp B”. The “Global-Transport-Zone” includes both “Comp A” and “Comp B.”
This results in correct alignment between the scope of Logical Switches (5001, 5002, and 5003), and theDLR instance created on all hosts in all clusters where these Logical Switches are present.
Now, let’s look at an alternative situation, where the Transport Zone was not configured to include cluster“Comp A”:
NSX Troubleshooting Guide
VMware, Inc. 59
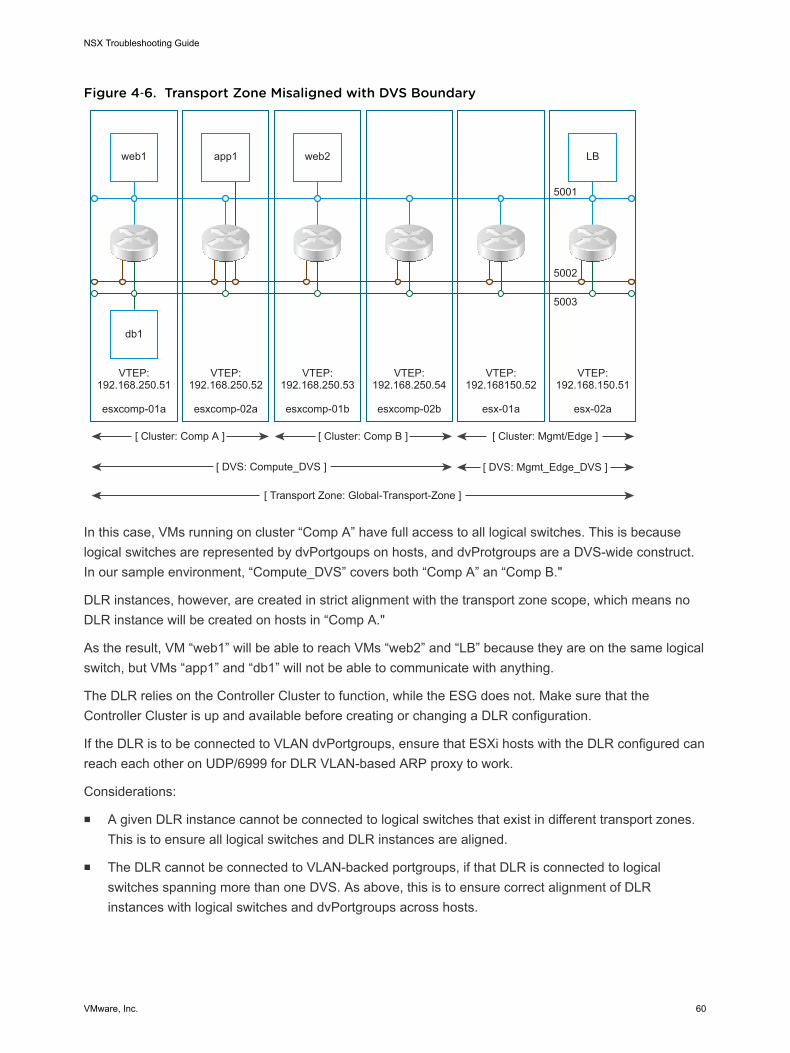
Figure 4‑6. Transport Zone Misaligned with DVS Boundary
[ Cluster: Comp A ]
VTEP:192.168.250.51
esxcomp-01a
VTEP:192.168.250.52
esxcomp-02a
VTEP:192.168.250.53
esxcomp-01b
VTEP:192.168.250.54
esxcomp-02b
VTEP:192.168150.52
esx-01a
VTEP:192.168.150.51
esx-02a
5001
5002
5003
[ DVS: Compute_DVS ]
[ Cluster: Comp B ]
[ Transport Zone: Global-Transport-Zone ]
[ Cluster: Mgmt/Edge ]
[ DVS: Mgmt_Edge_DVS ]
web1 app1 web2 LB
db1
In this case, VMs running on cluster “Comp A” have full access to all logical switches. This is becauselogical switches are represented by dvPortgoups on hosts, and dvProtgroups are a DVS-wide construct.In our sample environment, “Compute_DVS” covers both “Comp A” an “Comp B."
DLR instances, however, are created in strict alignment with the transport zone scope, which means noDLR instance will be created on hosts in “Comp A."
As the result, VM “web1” will be able to reach VMs “web2” and “LB” because they are on the same logicalswitch, but VMs “app1” and “db1” will not be able to communicate with anything.
The DLR relies on the Controller Cluster to function, while the ESG does not. Make sure that theController Cluster is up and available before creating or changing a DLR configuration.
If the DLR is to be connected to VLAN dvPortgroups, ensure that ESXi hosts with the DLR configured canreach each other on UDP/6999 for DLR VLAN-based ARP proxy to work.
Considerations:
n A given DLR instance cannot be connected to logical switches that exist in different transport zones.This is to ensure all logical switches and DLR instances are aligned.
n The DLR cannot be connected to VLAN-backed portgroups, if that DLR is connected to logicalswitches spanning more than one DVS. As above, this is to ensure correct alignment of DLRinstances with logical switches and dvPortgroups across hosts.
NSX Troubleshooting Guide
VMware, Inc. 60
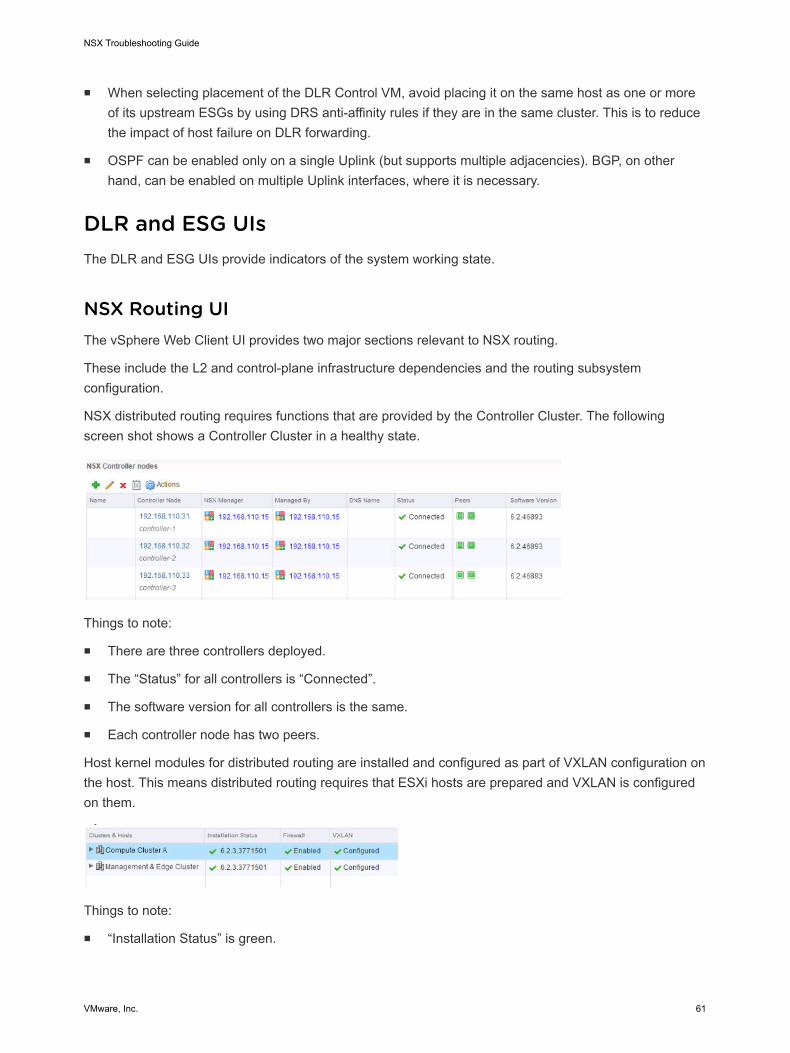
n When selecting placement of the DLR Control VM, avoid placing it on the same host as one or moreof its upstream ESGs by using DRS anti-affinity rules if they are in the same cluster. This is to reducethe impact of host failure on DLR forwarding.
n OSPF can be enabled only on a single Uplink (but supports multiple adjacencies). BGP, on otherhand, can be enabled on multiple Uplink interfaces, where it is necessary.
DLR and ESG UIsThe DLR and ESG UIs provide indicators of the system working state.
NSX Routing UIThe vSphere Web Client UI provides two major sections relevant to NSX routing.
These include the L2 and control-plane infrastructure dependencies and the routing subsystemconfiguration.
NSX distributed routing requires functions that are provided by the Controller Cluster. The followingscreen shot shows a Controller Cluster in a healthy state.
Things to note:
n There are three controllers deployed.
n The “Status” for all controllers is “Connected”.
n The software version for all controllers is the same.
n Each controller node has two peers.
Host kernel modules for distributed routing are installed and configured as part of VXLAN configuration onthe host. This means distributed routing requires that ESXi hosts are prepared and VXLAN is configuredon them.
Things to note:
n “Installation Status” is green.
NSX Troubleshooting Guide
VMware, Inc. 61
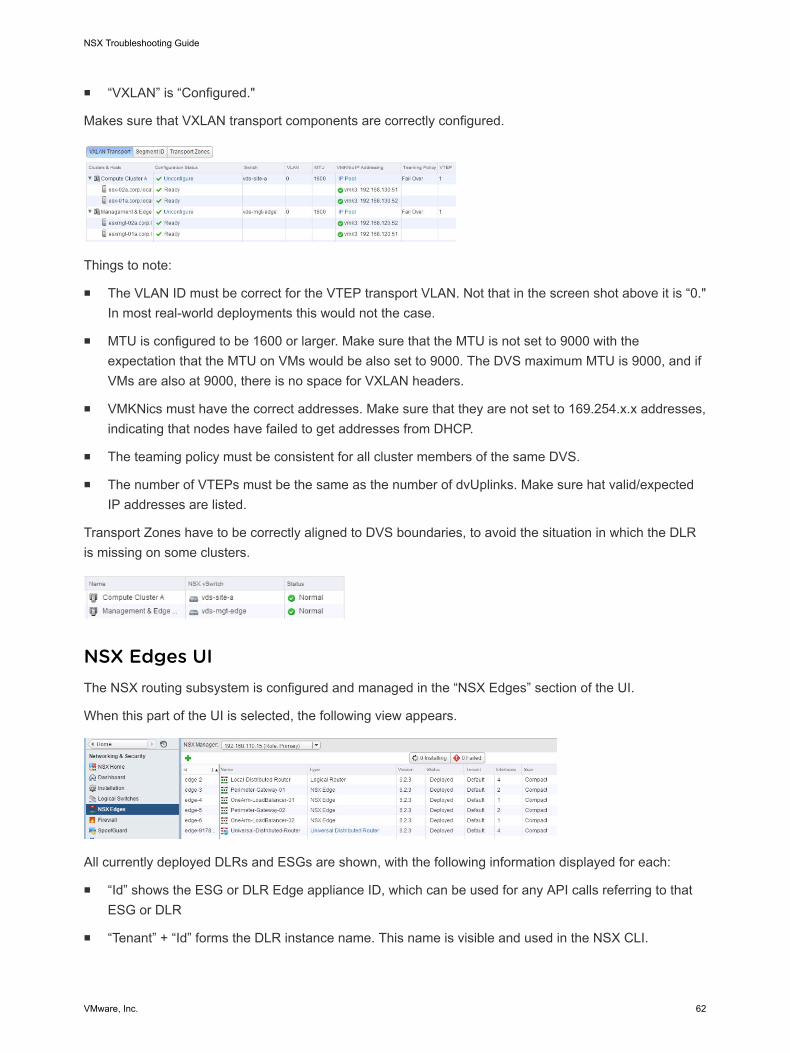
n “VXLAN” is “Configured."
Makes sure that VXLAN transport components are correctly configured.
Things to note:
n The VLAN ID must be correct for the VTEP transport VLAN. Not that in the screen shot above it is “0."In most real-world deployments this would not the case.
n MTU is configured to be 1600 or larger. Make sure that the MTU is not set to 9000 with theexpectation that the MTU on VMs would be also set to 9000. The DVS maximum MTU is 9000, and ifVMs are also at 9000, there is no space for VXLAN headers.
n VMKNics must have the correct addresses. Make sure that they are not set to 169.254.x.x addresses,indicating that nodes have failed to get addresses from DHCP.
n The teaming policy must be consistent for all cluster members of the same DVS.
n The number of VTEPs must be the same as the number of dvUplinks. Make sure hat valid/expectedIP addresses are listed.
Transport Zones have to be correctly aligned to DVS boundaries, to avoid the situation in which the DLRis missing on some clusters.
NSX Edges UIThe NSX routing subsystem is configured and managed in the “NSX Edges” section of the UI.
When this part of the UI is selected, the following view appears.
All currently deployed DLRs and ESGs are shown, with the following information displayed for each:
n “Id” shows the ESG or DLR Edge appliance ID, which can be used for any API calls referring to thatESG or DLR
n “Tenant” + “Id” forms the DLR instance name. This name is visible and used in the NSX CLI.
NSX Troubleshooting Guide
VMware, Inc. 62
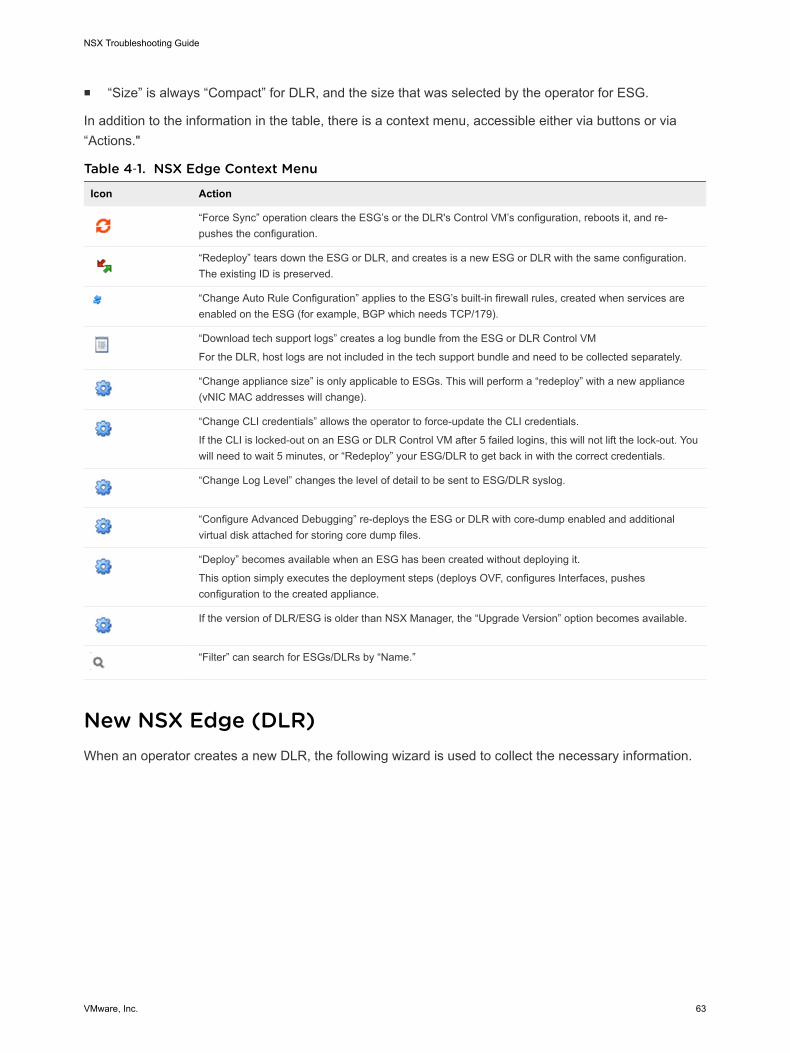
n “Size” is always “Compact” for DLR, and the size that was selected by the operator for ESG.
In addition to the information in the table, there is a context menu, accessible either via buttons or via“Actions."
Table 4‑1. NSX Edge Context Menu
Icon Action
“Force Sync” operation clears the ESG’s or the DLR's Control VM’s configuration, reboots it, and re-pushes the configuration.
“Redeploy” tears down the ESG or DLR, and creates is a new ESG or DLR with the same configuration.The existing ID is preserved.
“Change Auto Rule Configuration” applies to the ESG’s built-in firewall rules, created when services areenabled on the ESG (for example, BGP which needs TCP/179).
“Download tech support logs” creates a log bundle from the ESG or DLR Control VM
For the DLR, host logs are not included in the tech support bundle and need to be collected separately.
“Change appliance size” is only applicable to ESGs. This will perform a “redeploy” with a new appliance(vNIC MAC addresses will change).
“Change CLI credentials” allows the operator to force-update the CLI credentials.
If the CLI is locked-out on an ESG or DLR Control VM after 5 failed logins, this will not lift the lock-out. Youwill need to wait 5 minutes, or “Redeploy” your ESG/DLR to get back in with the correct credentials.
“Change Log Level” changes the level of detail to be sent to ESG/DLR syslog.
“Configure Advanced Debugging” re-deploys the ESG or DLR with core-dump enabled and additionalvirtual disk attached for storing core dump files.
“Deploy” becomes available when an ESG has been created without deploying it.
This option simply executes the deployment steps (deploys OVF, configures Interfaces, pushesconfiguration to the created appliance.
If the version of DLR/ESG is older than NSX Manager, the “Upgrade Version” option becomes available.
“Filter” can search for ESGs/DLRs by “Name.”
New NSX Edge (DLR)When an operator creates a new DLR, the following wizard is used to collect the necessary information.
NSX Troubleshooting Guide
VMware, Inc. 63
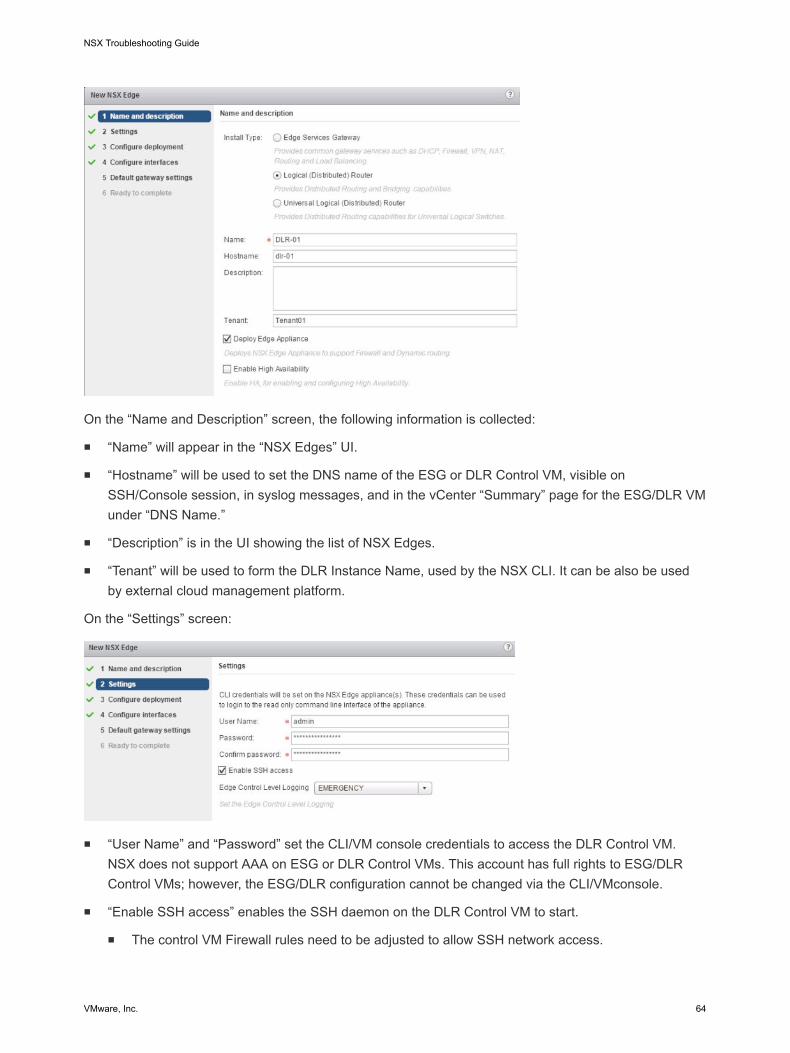
On the “Name and Description” screen, the following information is collected:
n “Name” will appear in the “NSX Edges” UI.
n “Hostname” will be used to set the DNS name of the ESG or DLR Control VM, visible onSSH/Console session, in syslog messages, and in the vCenter “Summary” page for the ESG/DLR VMunder “DNS Name.”
n “Description” is in the UI showing the list of NSX Edges.
n “Tenant” will be used to form the DLR Instance Name, used by the NSX CLI. It can be also be usedby external cloud management platform.
On the “Settings” screen:
n “User Name” and “Password” set the CLI/VM console credentials to access the DLR Control VM.NSX does not support AAA on ESG or DLR Control VMs. This account has full rights to ESG/DLRControl VMs; however, the ESG/DLR configuration cannot be changed via the CLI/VMconsole.
n “Enable SSH access” enables the SSH daemon on the DLR Control VM to start.
n The control VM Firewall rules need to be adjusted to allow SSH network access.
NSX Troubleshooting Guide
VMware, Inc. 64
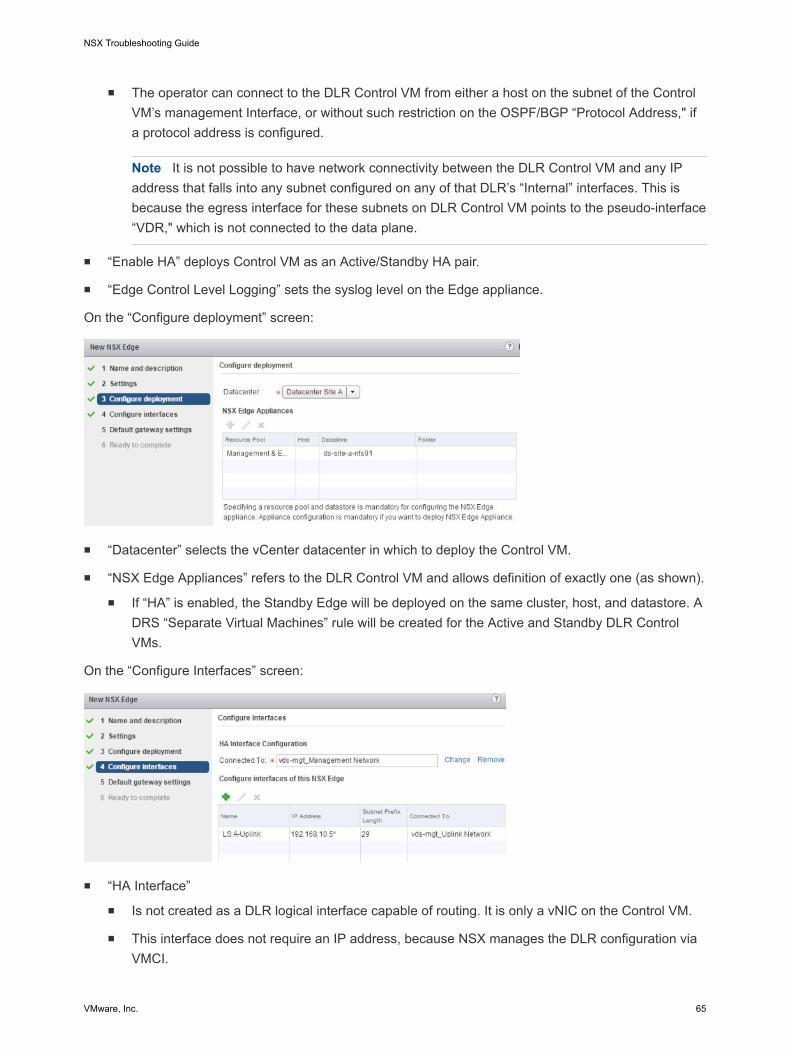
n The operator can connect to the DLR Control VM from either a host on the subnet of the ControlVM’s management Interface, or without such restriction on the OSPF/BGP “Protocol Address," ifa protocol address is configured.
Note It is not possible to have network connectivity between the DLR Control VM and any IPaddress that falls into any subnet configured on any of that DLR’s “Internal” interfaces. This isbecause the egress interface for these subnets on DLR Control VM points to the pseudo-interface“VDR," which is not connected to the data plane.
n “Enable HA” deploys Control VM as an Active/Standby HA pair.
n “Edge Control Level Logging” sets the syslog level on the Edge appliance.
On the “Configure deployment” screen:
n “Datacenter” selects the vCenter datacenter in which to deploy the Control VM.
n “NSX Edge Appliances” refers to the DLR Control VM and allows definition of exactly one (as shown).
n If “HA” is enabled, the Standby Edge will be deployed on the same cluster, host, and datastore. ADRS “Separate Virtual Machines” rule will be created for the Active and Standby DLR ControlVMs.
On the “Configure Interfaces” screen:
n “HA Interface”
n Is not created as a DLR logical interface capable of routing. It is only a vNIC on the Control VM.
n This interface does not require an IP address, because NSX manages the DLR configuration viaVMCI.
NSX Troubleshooting Guide
VMware, Inc. 65
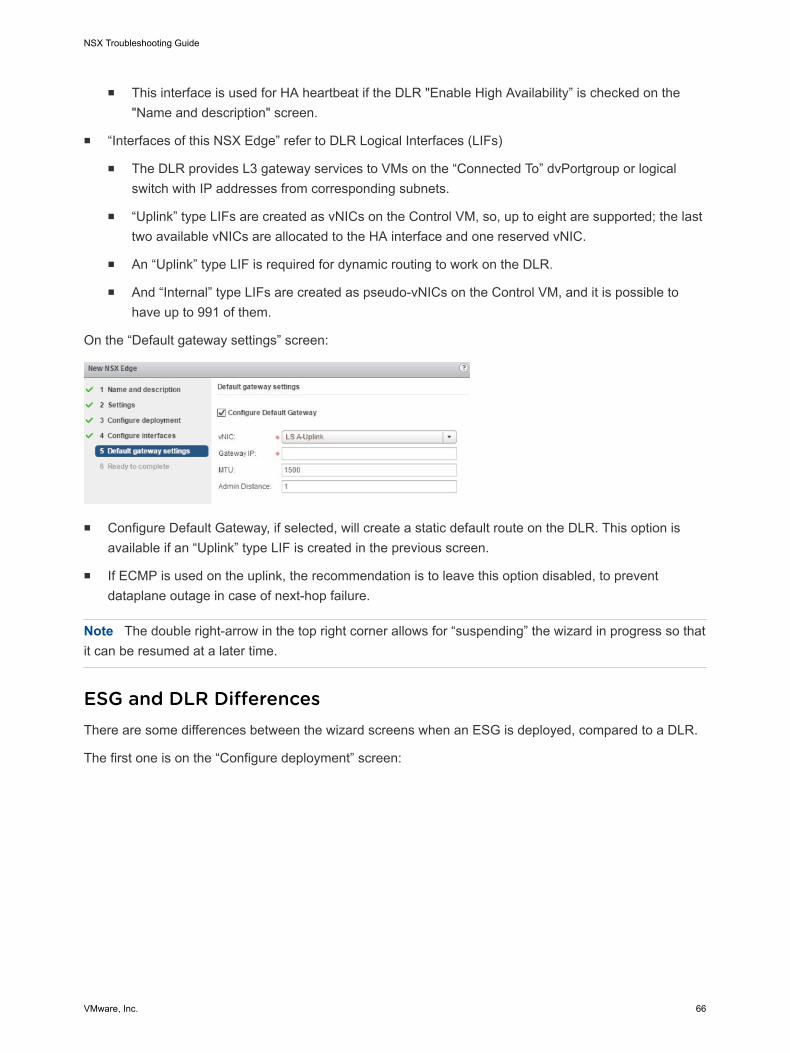
n This interface is used for HA heartbeat if the DLR "Enable High Availability” is checked on the"Name and description" screen.
n “Interfaces of this NSX Edge” refer to DLR Logical Interfaces (LIFs)
n The DLR provides L3 gateway services to VMs on the “Connected To” dvPortgroup or logicalswitch with IP addresses from corresponding subnets.
n “Uplink” type LIFs are created as vNICs on the Control VM, so, up to eight are supported; the lasttwo available vNICs are allocated to the HA interface and one reserved vNIC.
n An “Uplink” type LIF is required for dynamic routing to work on the DLR.
n And “Internal” type LIFs are created as pseudo-vNICs on the Control VM, and it is possible tohave up to 991 of them.
On the “Default gateway settings” screen:
n Configure Default Gateway, if selected, will create a static default route on the DLR. This option isavailable if an “Uplink” type LIF is created in the previous screen.
n If ECMP is used on the uplink, the recommendation is to leave this option disabled, to preventdataplane outage in case of next-hop failure.
Note The double right-arrow in the top right corner allows for “suspending” the wizard in progress so thatit can be resumed at a later time.
ESG and DLR DifferencesThere are some differences between the wizard screens when an ESG is deployed, compared to a DLR.
The first one is on the “Configure deployment” screen:
NSX Troubleshooting Guide
VMware, Inc. 66
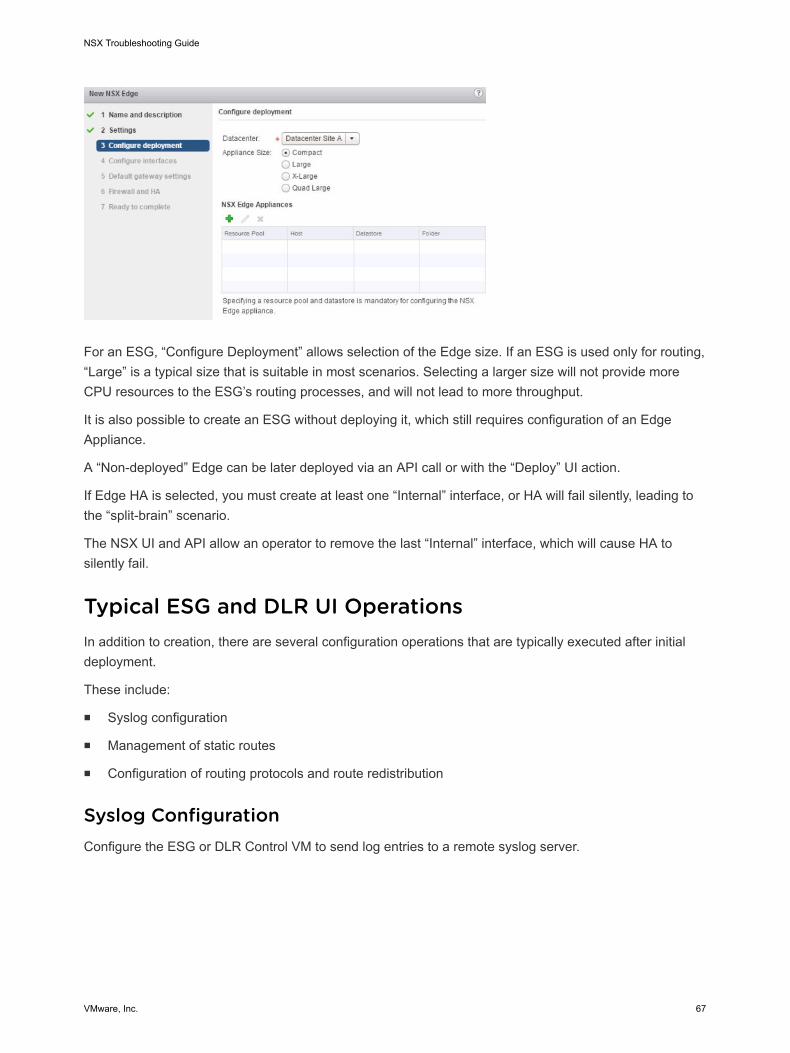
For an ESG, “Configure Deployment” allows selection of the Edge size. If an ESG is used only for routing,“Large” is a typical size that is suitable in most scenarios. Selecting a larger size will not provide moreCPU resources to the ESG’s routing processes, and will not lead to more throughput.
It is also possible to create an ESG without deploying it, which still requires configuration of an EdgeAppliance.
A “Non-deployed” Edge can be later deployed via an API call or with the “Deploy” UI action.
If Edge HA is selected, you must create at least one “Internal” interface, or HA will fail silently, leading tothe “split-brain” scenario.
The NSX UI and API allow an operator to remove the last “Internal” interface, which will cause HA tosilently fail.
Typical ESG and DLR UI OperationsIn addition to creation, there are several configuration operations that are typically executed after initialdeployment.
These include:
n Syslog configuration
n Management of static routes
n Configuration of routing protocols and route redistribution
Syslog ConfigurationConfigure the ESG or DLR Control VM to send log entries to a remote syslog server.
NSX Troubleshooting Guide
VMware, Inc. 67
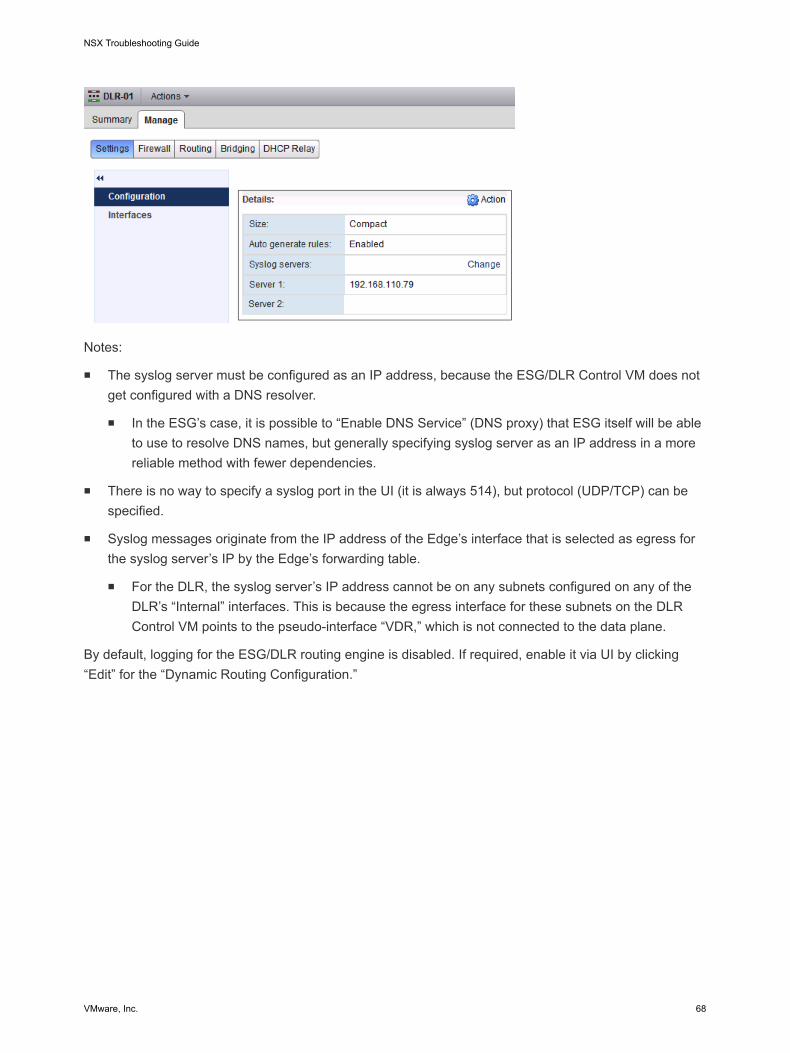
Notes:
n The syslog server must be configured as an IP address, because the ESG/DLR Control VM does notget configured with a DNS resolver.
n In the ESG’s case, it is possible to “Enable DNS Service” (DNS proxy) that ESG itself will be ableto use to resolve DNS names, but generally specifying syslog server as an IP address in a morereliable method with fewer dependencies.
n There is no way to specify a syslog port in the UI (it is always 514), but protocol (UDP/TCP) can bespecified.
n Syslog messages originate from the IP address of the Edge’s interface that is selected as egress forthe syslog server’s IP by the Edge’s forwarding table.
n For the DLR, the syslog server’s IP address cannot be on any subnets configured on any of theDLR’s “Internal” interfaces. This is because the egress interface for these subnets on the DLRControl VM points to the pseudo-interface “VDR,” which is not connected to the data plane.
By default, logging for the ESG/DLR routing engine is disabled. If required, enable it via UI by clicking“Edit” for the “Dynamic Routing Configuration.”
NSX Troubleshooting Guide
VMware, Inc. 68
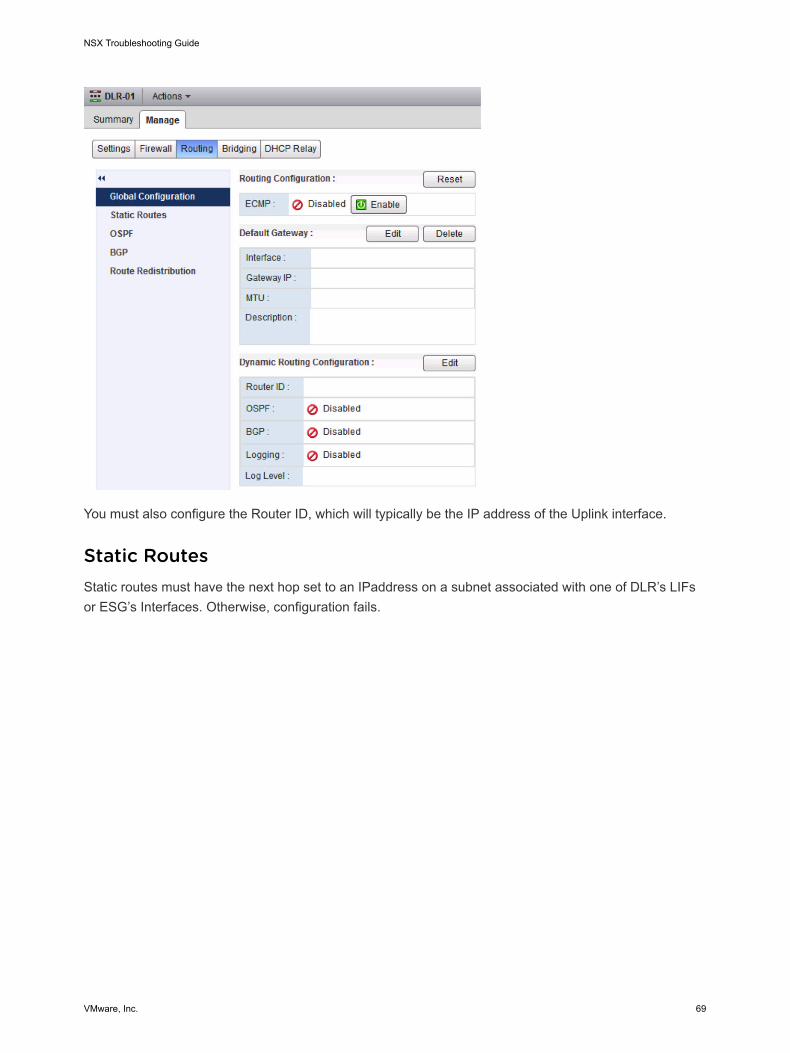
You must also configure the Router ID, which will typically be the IP address of the Uplink interface.
Static RoutesStatic routes must have the next hop set to an IPaddress on a subnet associated with one of DLR’s LIFsor ESG’s Interfaces. Otherwise, configuration fails.
NSX Troubleshooting Guide
VMware, Inc. 69
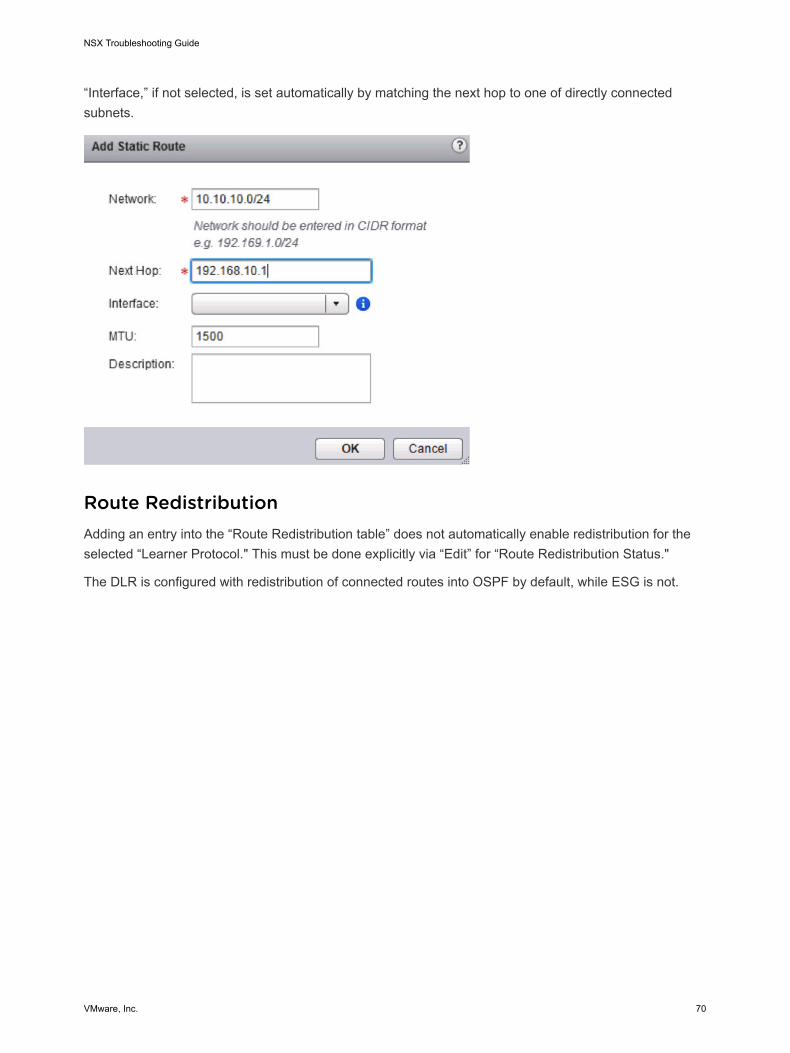
“Interface,” if not selected, is set automatically by matching the next hop to one of directly connectedsubnets.
Route RedistributionAdding an entry into the “Route Redistribution table” does not automatically enable redistribution for theselected “Learner Protocol." This must be done explicitly via “Edit” for “Route Redistribution Status."
The DLR is configured with redistribution of connected routes into OSPF by default, while ESG is not.
NSX Troubleshooting Guide
VMware, Inc. 70
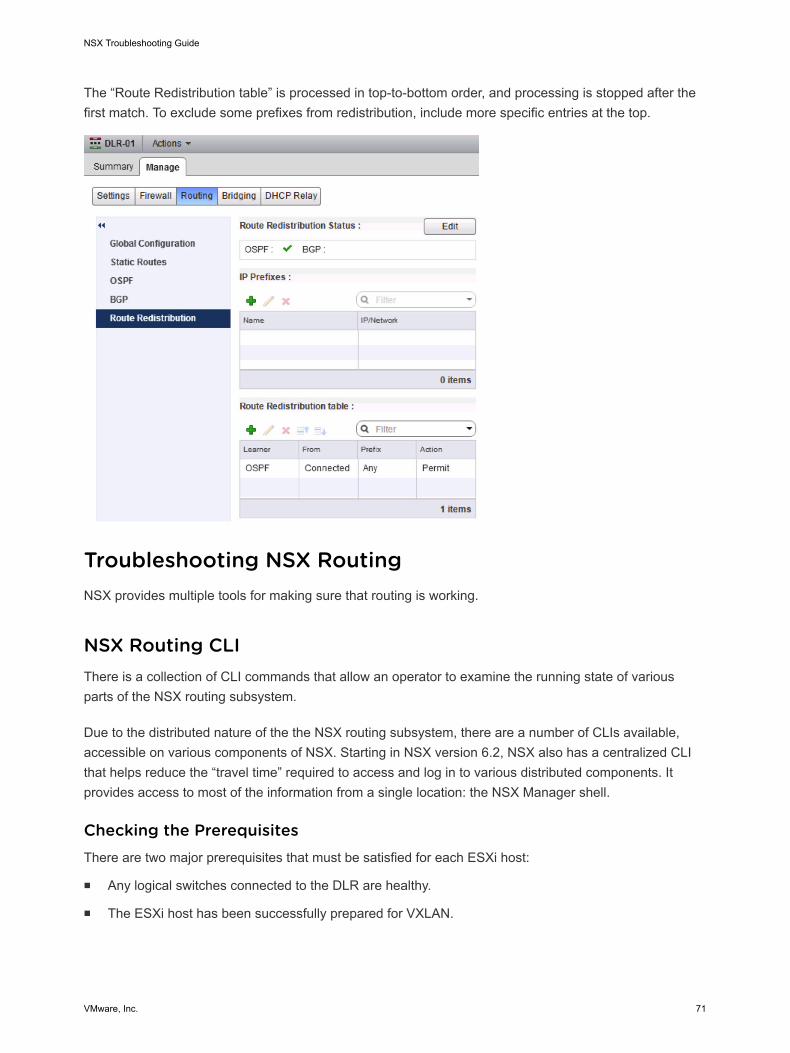
The “Route Redistribution table” is processed in top-to-bottom order, and processing is stopped after thefirst match. To exclude some prefixes from redistribution, include more specific entries at the top.
Troubleshooting NSX RoutingNSX provides multiple tools for making sure that routing is working.
NSX Routing CLIThere is a collection of CLI commands that allow an operator to examine the running state of variousparts of the NSX routing subsystem.
Due to the distributed nature of the the NSX routing subsystem, there are a number of CLIs available,accessible on various components of NSX. Starting in NSX version 6.2, NSX also has a centralized CLIthat helps reduce the “travel time” required to access and log in to various distributed components. Itprovides access to most of the information from a single location: the NSX Manager shell.
Checking the PrerequisitesThere are two major prerequisites that must be satisfied for each ESXi host:
n Any logical switches connected to the DLR are healthy.
n The ESXi host has been successfully prepared for VXLAN.
NSX Troubleshooting Guide
VMware, Inc. 71
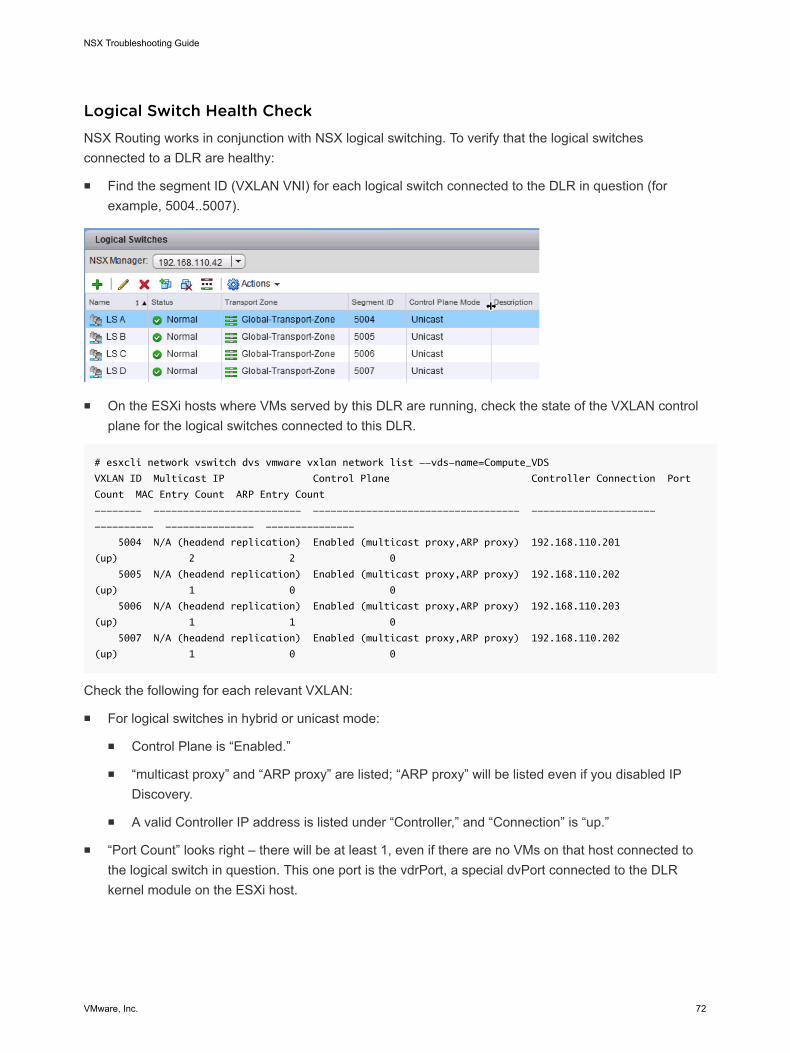
Logical Switch Health CheckNSX Routing works in conjunction with NSX logical switching. To verify that the logical switchesconnected to a DLR are healthy:
n Find the segment ID (VXLAN VNI) for each logical switch connected to the DLR in question (forexample, 5004..5007).
n On the ESXi hosts where VMs served by this DLR are running, check the state of the VXLAN controlplane for the logical switches connected to this DLR.
# esxcli network vswitch dvs vmware vxlan network list --vds-name=Compute_VDS
VXLAN ID Multicast IP Control Plane Controller Connection Port
Count MAC Entry Count ARP Entry Count
-------- ------------------------- ----------------------------------- ---------------------
---------- --------------- ---------------
5004 N/A (headend replication) Enabled (multicast proxy,ARP proxy) 192.168.110.201
(up) 2 2 0
5005 N/A (headend replication) Enabled (multicast proxy,ARP proxy) 192.168.110.202
(up) 1 0 0
5006 N/A (headend replication) Enabled (multicast proxy,ARP proxy) 192.168.110.203
(up) 1 1 0
5007 N/A (headend replication) Enabled (multicast proxy,ARP proxy) 192.168.110.202
(up) 1 0 0
Check the following for each relevant VXLAN:
n For logical switches in hybrid or unicast mode:
n Control Plane is “Enabled.”
n “multicast proxy” and “ARP proxy” are listed; “ARP proxy” will be listed even if you disabled IPDiscovery.
n A valid Controller IP address is listed under “Controller,” and “Connection” is “up.”
n “Port Count” looks right – there will be at least 1, even if there are no VMs on that host connected tothe logical switch in question. This one port is the vdrPort, a special dvPort connected to the DLRkernel module on the ESXi host.
NSX Troubleshooting Guide
VMware, Inc. 72
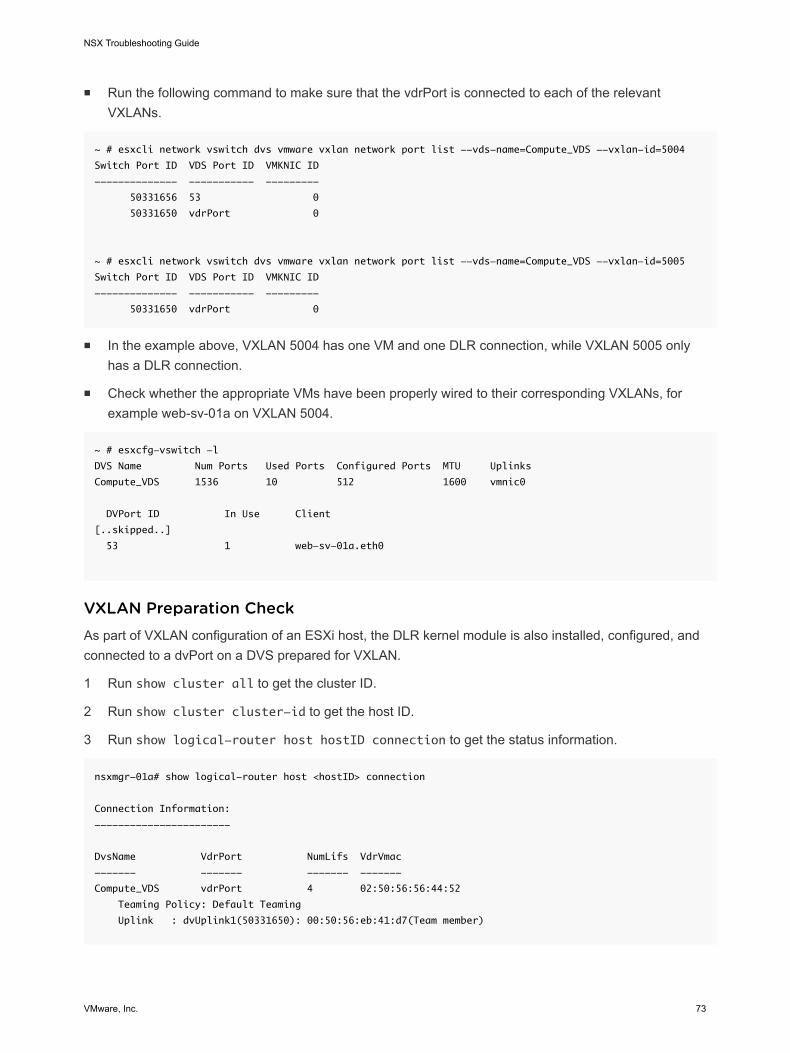
n Run the following command to make sure that the vdrPort is connected to each of the relevantVXLANs.
~ # esxcli network vswitch dvs vmware vxlan network port list --vds-name=Compute_VDS --vxlan-id=5004
Switch Port ID VDS Port ID VMKNIC ID
-------------- ----------- ---------
50331656 53 0
50331650 vdrPort 0
~ # esxcli network vswitch dvs vmware vxlan network port list --vds-name=Compute_VDS --vxlan-id=5005
Switch Port ID VDS Port ID VMKNIC ID
-------------- ----------- ---------
50331650 vdrPort 0
n In the example above, VXLAN 5004 has one VM and one DLR connection, while VXLAN 5005 onlyhas a DLR connection.
n Check whether the appropriate VMs have been properly wired to their corresponding VXLANs, forexample web-sv-01a on VXLAN 5004.
~ # esxcfg-vswitch -l
DVS Name Num Ports Used Ports Configured Ports MTU Uplinks
Compute_VDS 1536 10 512 1600 vmnic0
DVPort ID In Use Client
[..skipped..]
53 1 web-sv-01a.eth0
VXLAN Preparation CheckAs part of VXLAN configuration of an ESXi host, the DLR kernel module is also installed, configured, andconnected to a dvPort on a DVS prepared for VXLAN.
1 Run show cluster all to get the cluster ID.
2 Run show cluster cluster-id to get the host ID.
3 Run show logical-router host hostID connection to get the status information.
nsxmgr-01a# show logical-router host <hostID> connection
Connection Information:
-----------------------
DvsName VdrPort NumLifs VdrVmac
------- ------- ------- -------
Compute_VDS vdrPort 4 02:50:56:56:44:52
Teaming Policy: Default Teaming
Uplink : dvUplink1(50331650): 00:50:56:eb:41:d7(Team member)
NSX Troubleshooting Guide
VMware, Inc. 73
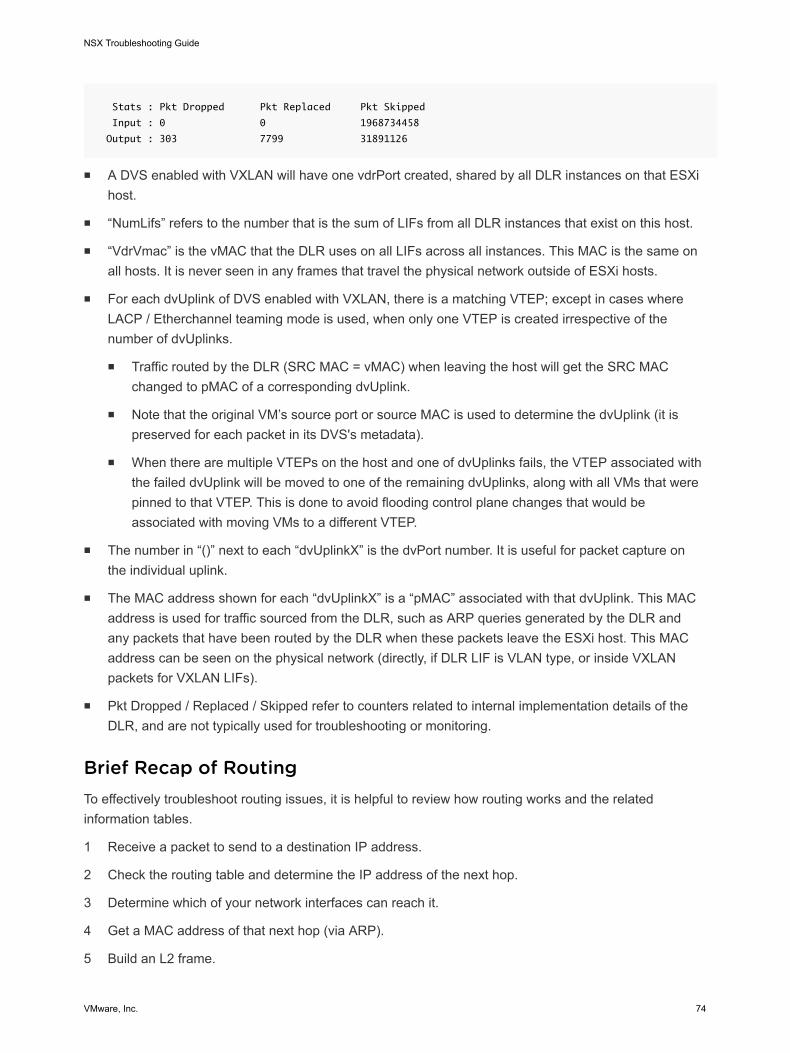
Stats : Pkt Dropped Pkt Replaced Pkt Skipped
Input : 0 0 1968734458
Output : 303 7799 31891126
n A DVS enabled with VXLAN will have one vdrPort created, shared by all DLR instances on that ESXihost.
n “NumLifs” refers to the number that is the sum of LIFs from all DLR instances that exist on this host.
n “VdrVmac” is the vMAC that the DLR uses on all LIFs across all instances. This MAC is the same onall hosts. It is never seen in any frames that travel the physical network outside of ESXi hosts.
n For each dvUplink of DVS enabled with VXLAN, there is a matching VTEP; except in cases whereLACP / Etherchannel teaming mode is used, when only one VTEP is created irrespective of thenumber of dvUplinks.
n Traffic routed by the DLR (SRC MAC = vMAC) when leaving the host will get the SRC MACchanged to pMAC of a corresponding dvUplink.
n Note that the original VM’s source port or source MAC is used to determine the dvUplink (it ispreserved for each packet in its DVS's metadata).
n When there are multiple VTEPs on the host and one of dvUplinks fails, the VTEP associated withthe failed dvUplink will be moved to one of the remaining dvUplinks, along with all VMs that werepinned to that VTEP. This is done to avoid flooding control plane changes that would beassociated with moving VMs to a different VTEP.
n The number in “()” next to each “dvUplinkX” is the dvPort number. It is useful for packet capture onthe individual uplink.
n The MAC address shown for each “dvUplinkX” is a “pMAC” associated with that dvUplink. This MACaddress is used for traffic sourced from the DLR, such as ARP queries generated by the DLR andany packets that have been routed by the DLR when these packets leave the ESXi host. This MACaddress can be seen on the physical network (directly, if DLR LIF is VLAN type, or inside VXLANpackets for VXLAN LIFs).
n Pkt Dropped / Replaced / Skipped refer to counters related to internal implementation details of theDLR, and are not typically used for troubleshooting or monitoring.
Brief Recap of RoutingTo effectively troubleshoot routing issues, it is helpful to review how routing works and the relatedinformation tables.
1 Receive a packet to send to a destination IP address.
2 Check the routing table and determine the IP address of the next hop.
3 Determine which of your network interfaces can reach it.
4 Get a MAC address of that next hop (via ARP).
5 Build an L2 frame.
NSX Troubleshooting Guide
VMware, Inc. 74
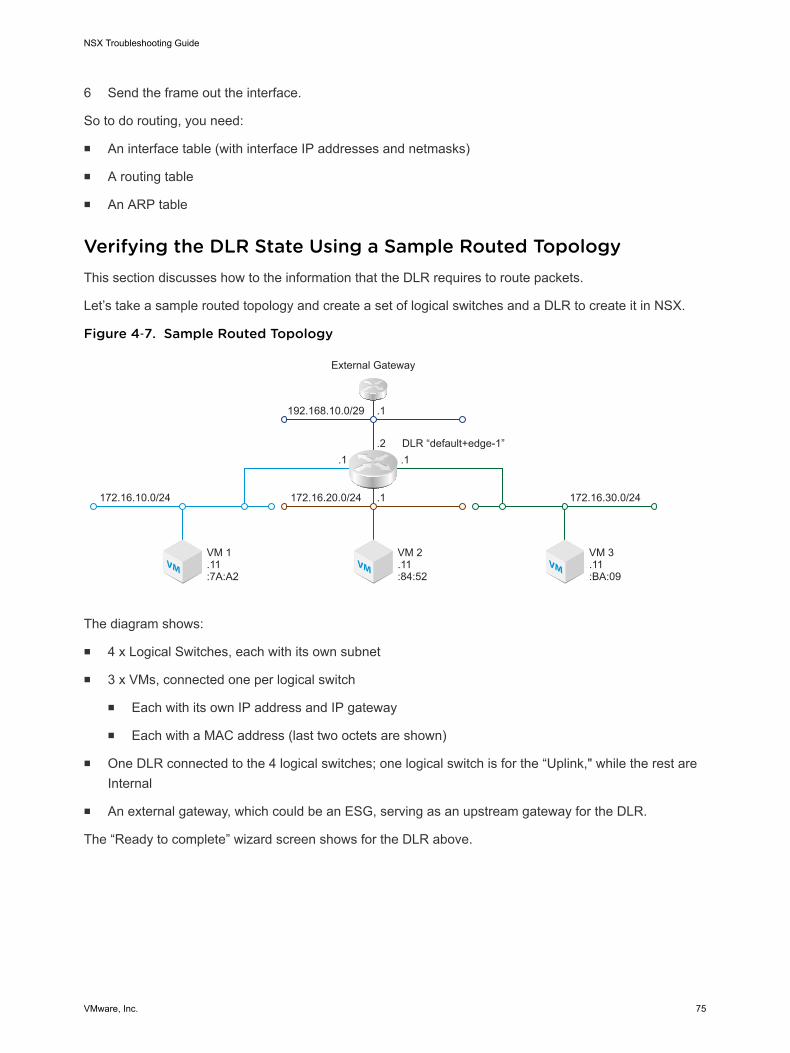
6 Send the frame out the interface.
So to do routing, you need:
n An interface table (with interface IP addresses and netmasks)
n A routing table
n An ARP table
Verifying the DLR State Using a Sample Routed TopologyThis section discusses how to the information that the DLR requires to route packets.
Let’s take a sample routed topology and create a set of logical switches and a DLR to create it in NSX.
Figure 4‑7. Sample Routed Topology
VMVM VM
External Gateway
192.168.10.0/29
DLR “default+edge-1”
172.16.20.0/24
.1
.1
.1.1
VM 2.11:84:52
172.16.30.0/24
VM 3.11:BA:09
172.16.10.0/24
VM 1.11:7A:A2
.2
The diagram shows:
n 4 x Logical Switches, each with its own subnet
n 3 x VMs, connected one per logical switch
n Each with its own IP address and IP gateway
n Each with a MAC address (last two octets are shown)
n One DLR connected to the 4 logical switches; one logical switch is for the “Uplink," while the rest areInternal
n An external gateway, which could be an ESG, serving as an upstream gateway for the DLR.
The “Ready to complete” wizard screen shows for the DLR above.
NSX Troubleshooting Guide
VMware, Inc. 75
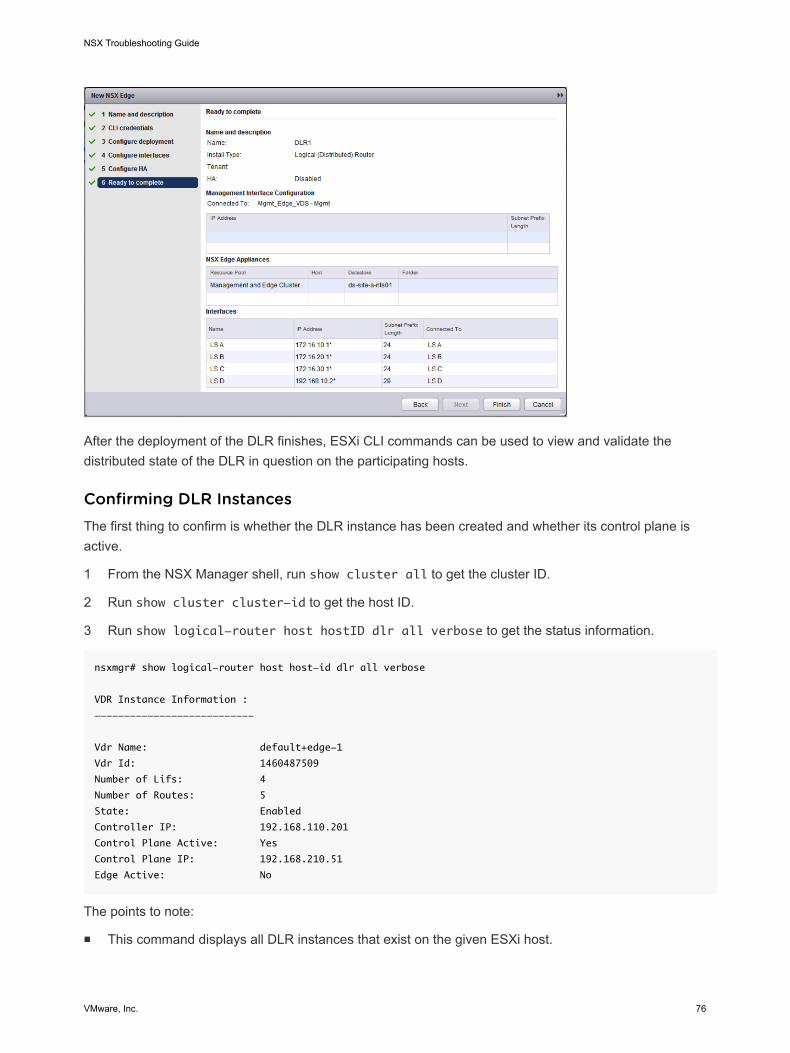
After the deployment of the DLR finishes, ESXi CLI commands can be used to view and validate thedistributed state of the DLR in question on the participating hosts.
Confirming DLR InstancesThe first thing to confirm is whether the DLR instance has been created and whether its control plane isactive.
1 From the NSX Manager shell, run show cluster all to get the cluster ID.
2 Run show cluster cluster-id to get the host ID.
3 Run show logical-router host hostID dlr all verbose to get the status information.
nsxmgr# show logical-router host host-id dlr all verbose
VDR Instance Information :
---------------------------
Vdr Name: default+edge-1
Vdr Id: 1460487509
Number of Lifs: 4
Number of Routes: 5
State: Enabled
Controller IP: 192.168.110.201
Control Plane Active: Yes
Control Plane IP: 192.168.210.51
Edge Active: No
The points to note:
n This command displays all DLR instances that exist on the given ESXi host.
NSX Troubleshooting Guide
VMware, Inc. 76
n “Vdr Name” consists of “Tenant” “+ “Edge Id." In the example, “Tenant” was not specified, so the word“default” is used. The “Edge Id” is “edge-1," which can be seen in the NSX UI.
n In cases where there are many DLR instances on a host, a method for finding the right instance isto look for the “Edge ID” displayed in the UI “NSX Edges."
n “Vdr Id” is useful for further lookups, including logs.
n “Number of Lifs” refers to the LIFs that exist on this individual DLR instance.
n “Number of Routes” is in this case 5, which consists of 4 x directly connected routes (one for eachLIF), and a default route.
n “State,” “Controller IP,” and “Control Plane Active” refer to the state of the DLR’s control plane andmust list the correct Controller IP, with Control Plane Active: Yes. Remember, the DLR functionrequires working Controllers; the output above shows what is expected for a healthy DLR instance.
n “Control Plane IP” refers to the IP address that the ESXi host uses to talk to the Controller. This IP isalways the one associated with the ESXi host’s Management vmknic, which in most cases is vmk0.
n “Edge Active” shows whether or not this host is the one where the Control VM for this DLR instance isrunning and in Active state.
n The placement of the Active DLR Control VM determines which ESXi host is used to performNSX L2 bridging, if it is enabled.
n There is also a “brief” version of the above command that produces a compressed output useful for aquick overview. Note that “Vdr Id” is displayed in hexadecimal format here:
nsxmgr# show logical-router host host-id dlr all brief
VDR Instance Information :
---------------------------
State Legend: [A: Active], [D: Deleting], [X: Deleted], [I: Init]
State Legend: [SF-R: Soft Flush Route], [SF-L: Soft Flush LIF]
Vdr Name Vdr Id #Lifs #Routes State Controller Ip CP Ip
-------- ------- ----- ------- ----- ------------- ------
default+edge-1 0x570d4555 4 5 A 192.168.110.201 192.168.210.51
The “Soft Flush” states refer to short-lived transient states of the LIF lifecycle and is not normally seen ina healthy DLR.
DLR’s Logical InterfacesAfter establishing the that the DLR has been created, make sure that all of the DLR's logical interfacesare present and have the correct configuration.
1 From the NSX Manager shell, run show cluster all to get the cluster ID.
2 Run show cluster cluster-id to get the host ID.
3 Run show logical-router host hostID dlr all brief to get the dlrID (Vdr Name).
NSX Troubleshooting Guide
VMware, Inc. 77
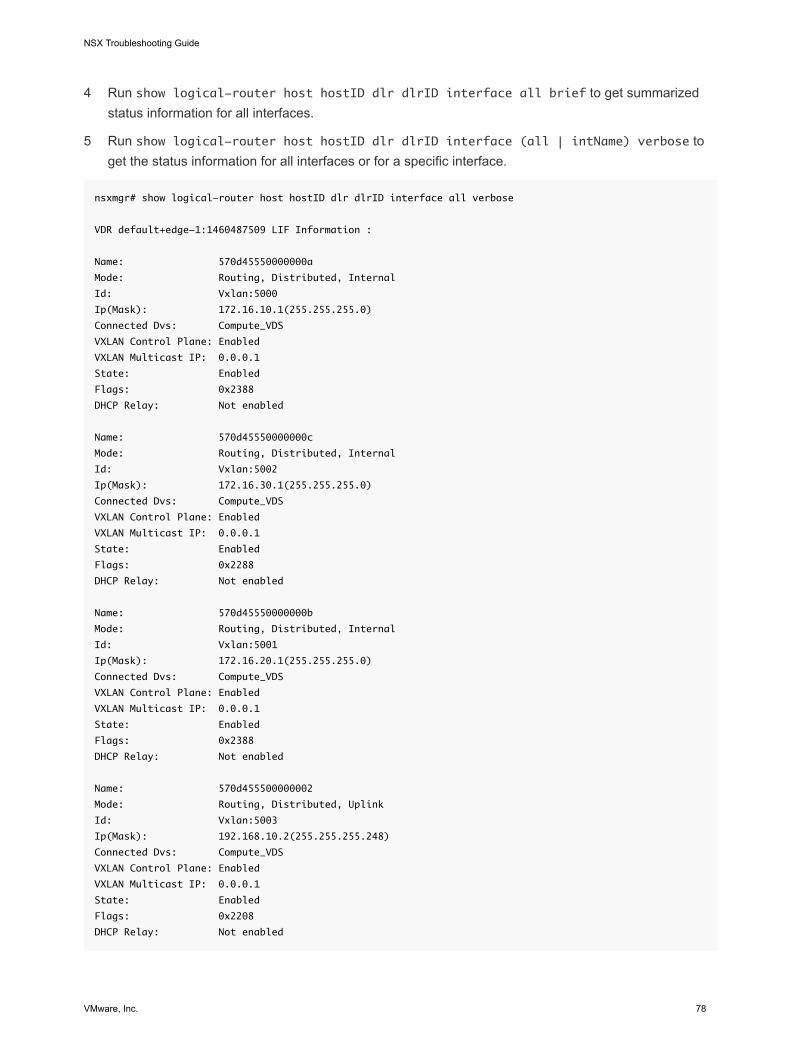
4 Run show logical-router host hostID dlr dlrID interface all brief to get summarizedstatus information for all interfaces.
5 Run show logical-router host hostID dlr dlrID interface (all | intName) verbose toget the status information for all interfaces or for a specific interface.
nsxmgr# show logical-router host hostID dlr dlrID interface all verbose
VDR default+edge-1:1460487509 LIF Information :
Name: 570d45550000000a
Mode: Routing, Distributed, Internal
Id: Vxlan:5000
Ip(Mask): 172.16.10.1(255.255.255.0)
Connected Dvs: Compute_VDS
VXLAN Control Plane: Enabled
VXLAN Multicast IP: 0.0.0.1
State: Enabled
Flags: 0x2388
DHCP Relay: Not enabled
Name: 570d45550000000c
Mode: Routing, Distributed, Internal
Id: Vxlan:5002
Ip(Mask): 172.16.30.1(255.255.255.0)
Connected Dvs: Compute_VDS
VXLAN Control Plane: Enabled
VXLAN Multicast IP: 0.0.0.1
State: Enabled
Flags: 0x2288
DHCP Relay: Not enabled
Name: 570d45550000000b
Mode: Routing, Distributed, Internal
Id: Vxlan:5001
Ip(Mask): 172.16.20.1(255.255.255.0)
Connected Dvs: Compute_VDS
VXLAN Control Plane: Enabled
VXLAN Multicast IP: 0.0.0.1
State: Enabled
Flags: 0x2388
DHCP Relay: Not enabled
Name: 570d455500000002
Mode: Routing, Distributed, Uplink
Id: Vxlan:5003
Ip(Mask): 192.168.10.2(255.255.255.248)
Connected Dvs: Compute_VDS
VXLAN Control Plane: Enabled
VXLAN Multicast IP: 0.0.0.1
State: Enabled
Flags: 0x2208
DHCP Relay: Not enabled
NSX Troubleshooting Guide
VMware, Inc. 78
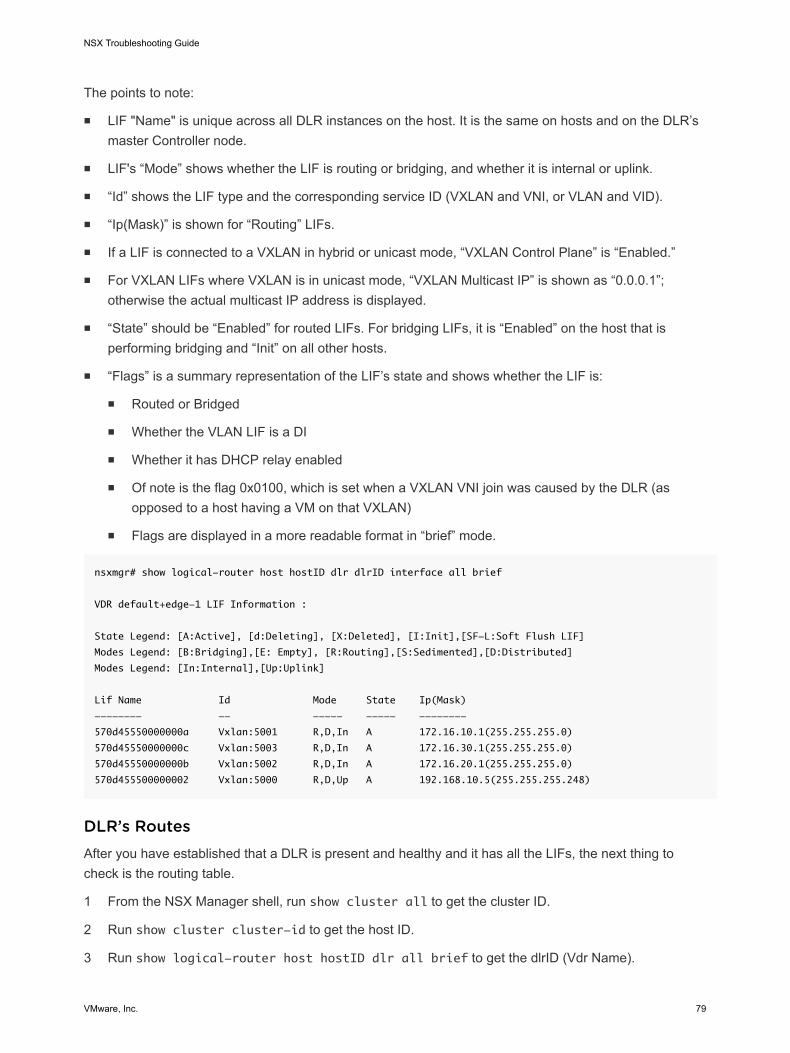
The points to note:
n LIF "Name" is unique across all DLR instances on the host. It is the same on hosts and on the DLR’smaster Controller node.
n LIF's “Mode” shows whether the LIF is routing or bridging, and whether it is internal or uplink.
n “Id” shows the LIF type and the corresponding service ID (VXLAN and VNI, or VLAN and VID).
n “Ip(Mask)” is shown for “Routing” LIFs.
n If a LIF is connected to a VXLAN in hybrid or unicast mode, “VXLAN Control Plane” is “Enabled.”
n For VXLAN LIFs where VXLAN is in unicast mode, “VXLAN Multicast IP” is shown as “0.0.0.1”;otherwise the actual multicast IP address is displayed.
n “State” should be “Enabled” for routed LIFs. For bridging LIFs, it is “Enabled” on the host that isperforming bridging and “Init” on all other hosts.
n “Flags” is a summary representation of the LIF’s state and shows whether the LIF is:
n Routed or Bridged
n Whether the VLAN LIF is a DI
n Whether it has DHCP relay enabled
n Of note is the flag 0x0100, which is set when a VXLAN VNI join was caused by the DLR (asopposed to a host having a VM on that VXLAN)
n Flags are displayed in a more readable format in “brief” mode.
nsxmgr# show logical-router host hostID dlr dlrID interface all brief
VDR default+edge-1 LIF Information :
State Legend: [A:Active], [d:Deleting], [X:Deleted], [I:Init],[SF-L:Soft Flush LIF]
Modes Legend: [B:Bridging],[E: Empty], [R:Routing],[S:Sedimented],[D:Distributed]
Modes Legend: [In:Internal],[Up:Uplink]
Lif Name Id Mode State Ip(Mask)
-------- -- ----- ----- --------
570d45550000000a Vxlan:5001 R,D,In A 172.16.10.1(255.255.255.0)
570d45550000000c Vxlan:5003 R,D,In A 172.16.30.1(255.255.255.0)
570d45550000000b Vxlan:5002 R,D,In A 172.16.20.1(255.255.255.0)
570d455500000002 Vxlan:5000 R,D,Up A 192.168.10.5(255.255.255.248)
DLR’s RoutesAfter you have established that a DLR is present and healthy and it has all the LIFs, the next thing tocheck is the routing table.
1 From the NSX Manager shell, run show cluster all to get the cluster ID.
2 Run show cluster cluster-id to get the host ID.
3 Run show logical-router host hostID dlr all brief to get the dlrID (Vdr Name).
NSX Troubleshooting Guide
VMware, Inc. 79
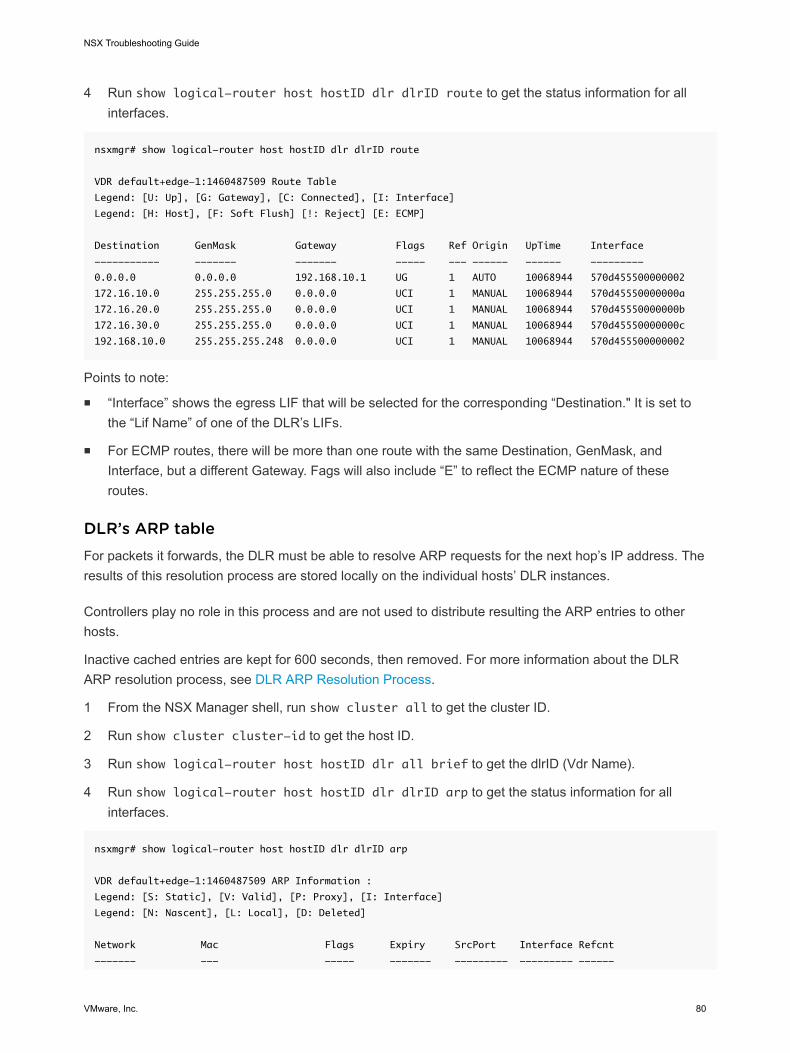
4 Run show logical-router host hostID dlr dlrID route to get the status information for allinterfaces.
nsxmgr# show logical-router host hostID dlr dlrID route
VDR default+edge-1:1460487509 Route Table
Legend: [U: Up], [G: Gateway], [C: Connected], [I: Interface]
Legend: [H: Host], [F: Soft Flush] [!: Reject] [E: ECMP]
Destination GenMask Gateway Flags Ref Origin UpTime Interface
----------- ------- ------- ----- --- ------ ------ ---------
0.0.0.0 0.0.0.0 192.168.10.1 UG 1 AUTO 10068944 570d455500000002
172.16.10.0 255.255.255.0 0.0.0.0 UCI 1 MANUAL 10068944 570d45550000000a
172.16.20.0 255.255.255.0 0.0.0.0 UCI 1 MANUAL 10068944 570d45550000000b
172.16.30.0 255.255.255.0 0.0.0.0 UCI 1 MANUAL 10068944 570d45550000000c
192.168.10.0 255.255.255.248 0.0.0.0 UCI 1 MANUAL 10068944 570d455500000002
Points to note:
n “Interface” shows the egress LIF that will be selected for the corresponding “Destination." It is set tothe “Lif Name” of one of the DLR’s LIFs.
n For ECMP routes, there will be more than one route with the same Destination, GenMask, andInterface, but a different Gateway. Fags will also include “E” to reflect the ECMP nature of theseroutes.
DLR’s ARP tableFor packets it forwards, the DLR must be able to resolve ARP requests for the next hop’s IP address. Theresults of this resolution process are stored locally on the individual hosts’ DLR instances.
Controllers play no role in this process and are not used to distribute resulting the ARP entries to otherhosts.
Inactive cached entries are kept for 600 seconds, then removed. For more information about the DLRARP resolution process, see DLR ARP Resolution Process.
1 From the NSX Manager shell, run show cluster all to get the cluster ID.
2 Run show cluster cluster-id to get the host ID.
3 Run show logical-router host hostID dlr all brief to get the dlrID (Vdr Name).
4 Run show logical-router host hostID dlr dlrID arp to get the status information for allinterfaces.
nsxmgr# show logical-router host hostID dlr dlrID arp
VDR default+edge-1:1460487509 ARP Information :
Legend: [S: Static], [V: Valid], [P: Proxy], [I: Interface]
Legend: [N: Nascent], [L: Local], [D: Deleted]
Network Mac Flags Expiry SrcPort Interface Refcnt
------- --- ----- ------- --------- --------- ------
NSX Troubleshooting Guide
VMware, Inc. 80
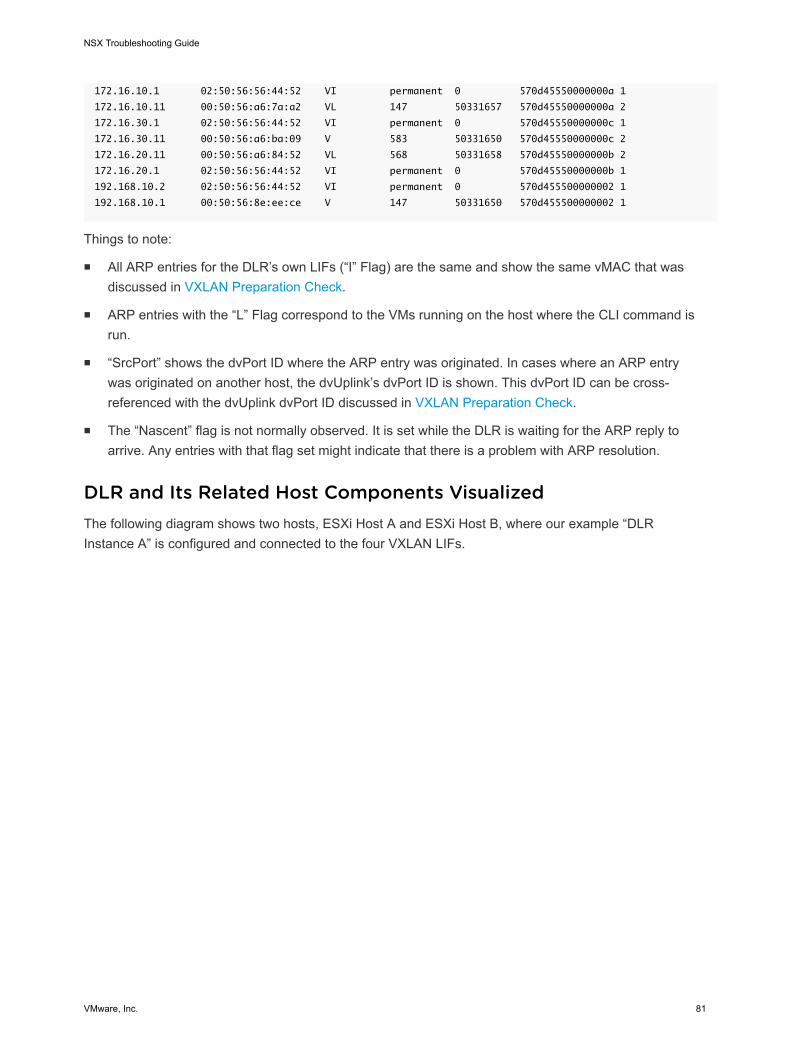
172.16.10.1 02:50:56:56:44:52 VI permanent 0 570d45550000000a 1
172.16.10.11 00:50:56:a6:7a:a2 VL 147 50331657 570d45550000000a 2
172.16.30.1 02:50:56:56:44:52 VI permanent 0 570d45550000000c 1
172.16.30.11 00:50:56:a6:ba:09 V 583 50331650 570d45550000000c 2
172.16.20.11 00:50:56:a6:84:52 VL 568 50331658 570d45550000000b 2
172.16.20.1 02:50:56:56:44:52 VI permanent 0 570d45550000000b 1
192.168.10.2 02:50:56:56:44:52 VI permanent 0 570d455500000002 1
192.168.10.1 00:50:56:8e:ee:ce V 147 50331650 570d455500000002 1
Things to note:
n All ARP entries for the DLR’s own LIFs (“I” Flag) are the same and show the same vMAC that wasdiscussed in VXLAN Preparation Check.
n ARP entries with the “L” Flag correspond to the VMs running on the host where the CLI command isrun.
n “SrcPort” shows the dvPort ID where the ARP entry was originated. In cases where an ARP entrywas originated on another host, the dvUplink’s dvPort ID is shown. This dvPort ID can be cross-referenced with the dvUplink dvPort ID discussed in VXLAN Preparation Check.
n The “Nascent” flag is not normally observed. It is set while the DLR is waiting for the ARP reply toarrive. Any entries with that flag set might indicate that there is a problem with ARP resolution.
DLR and Its Related Host Components VisualizedThe following diagram shows two hosts, ESXi Host A and ESXi Host B, where our example “DLRInstance A” is configured and connected to the four VXLAN LIFs.
NSX Troubleshooting Guide
VMware, Inc. 81
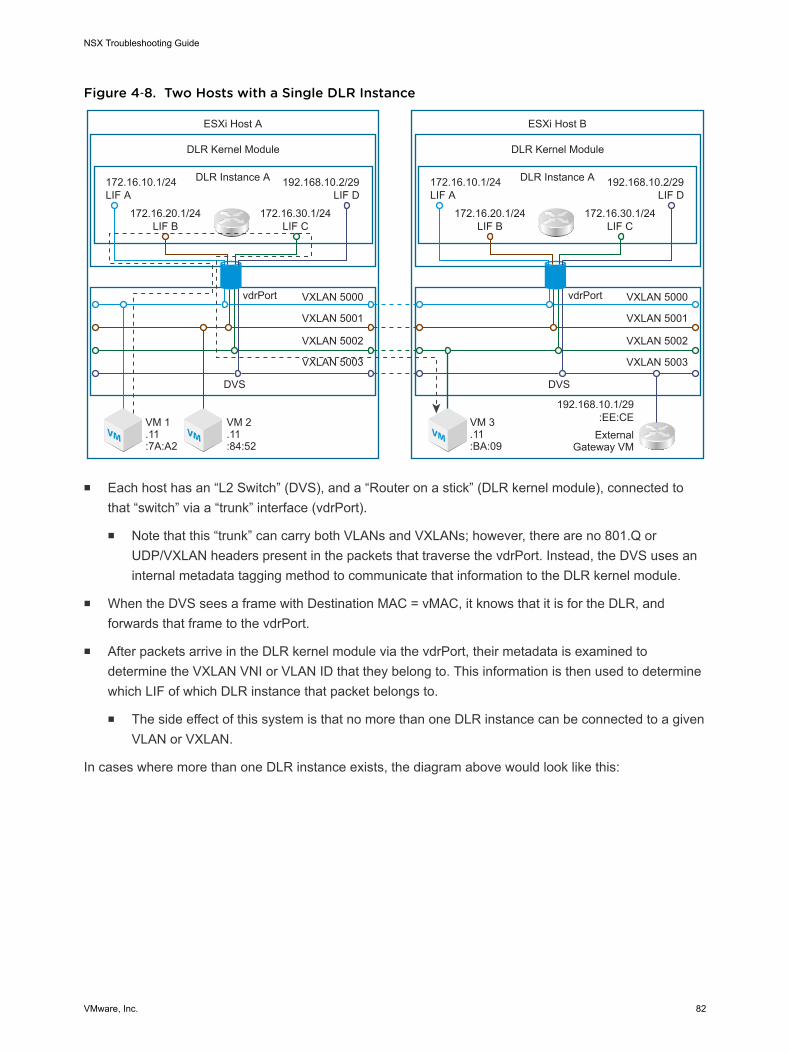
Figure 4‑8. Two Hosts with a Single DLR Instance
VM VM VM
ESXi Host A
DLR Kernel Module
DLR Instance ALIF A
LIF B
vdrPort
LIF C
LIF D172.16.10.1/24
172.16.20.1/24 172.16.30.1/24
192.168.10.2/29
VXLAN 5000
VXLAN 5001
VXLAN 5002
VXLAN 5003
DVS
VM 1.11:7A:A2
VM 2.11:84:52
External Gateway VM
ESXi Host B
DLR Kernel Module
DLR Instance ALIF A
LIF B
vdrPort
LIF C
LIF D172.16.10.1/24
172.16.20.1/24 172.16.30.1/24
:EE:CE192.168.10.1/29
192.168.10.2/29
VXLAN 5000
VXLAN 5001
VXLAN 5002
VXLAN 5003
DVS
VM 3.11:BA:09
n Each host has an “L2 Switch” (DVS), and a “Router on a stick” (DLR kernel module), connected tothat “switch” via a “trunk” interface (vdrPort).
n Note that this “trunk” can carry both VLANs and VXLANs; however, there are no 801.Q orUDP/VXLAN headers present in the packets that traverse the vdrPort. Instead, the DVS uses aninternal metadata tagging method to communicate that information to the DLR kernel module.
n When the DVS sees a frame with Destination MAC = vMAC, it knows that it is for the DLR, andforwards that frame to the vdrPort.
n After packets arrive in the DLR kernel module via the vdrPort, their metadata is examined todetermine the VXLAN VNI or VLAN ID that they belong to. This information is then used to determinewhich LIF of which DLR instance that packet belongs to.
n The side effect of this system is that no more than one DLR instance can be connected to a givenVLAN or VXLAN.
In cases where more than one DLR instance exists, the diagram above would look like this:
NSX Troubleshooting Guide
VMware, Inc. 82

Figure 4‑9. Two Hosts with Two DLR Instances
VM VM VM VMVM
ESXi Host A
DLR Kernel Module
DLR Instance A
LIF A LIF B
vdrPort
IP A / vMAC IP B / vMAC
DLR Instance B
LIF C LIF DIP C / vMAC IP D / vMAC
DLR Instance A
LIF A LIF BIP A / vMAC IP B / vMAC
DLR Instance B
LIF C LIF DIP C / vMAC IP D / vMAC
VXLAN A
VXLAN B
VXLAN C
VLAN D
VXLAN A
VXLAN B
VXLAN C
VLAN D
DVS
VM 1IP 1MAC 1
VM 2IP 2MAC 2
VM 4IP 4MAC 4
ESXi Host B
DLR Kernel Module
vdrPort
DVS
VM 3IP 3MAC 3
VM 5IP 5MAC 5
This would correspond to a network topology with two independent routing domains, operating incomplete separation from each other, potentially with overlapping IP addresses.
Figure 4‑10. Network Topology Corresponding with Two Hosts and Two DLR Instances
Subnet A
Subnet B
IF A
IF B
RTR A
IF C
IF D
RTR B
Subnet C
Subnet D
SVR 2IP 2
MAC 2
SVR 1IP 1
MAC 1
SVR 3IP 3
MAC 3
SVR 4IP 4
MAC 4
SVR 5IP 5
MAC 5
Distributed Routing Subsystem ArchitectureDLR instances on ESXi hosts have access to all information needed to perform L3 routing.
n Networks are directly connected (learned from the interfaces’ configuration)
n Next hops for each subnet (looked up in routing table)
NSX Troubleshooting Guide
VMware, Inc. 83
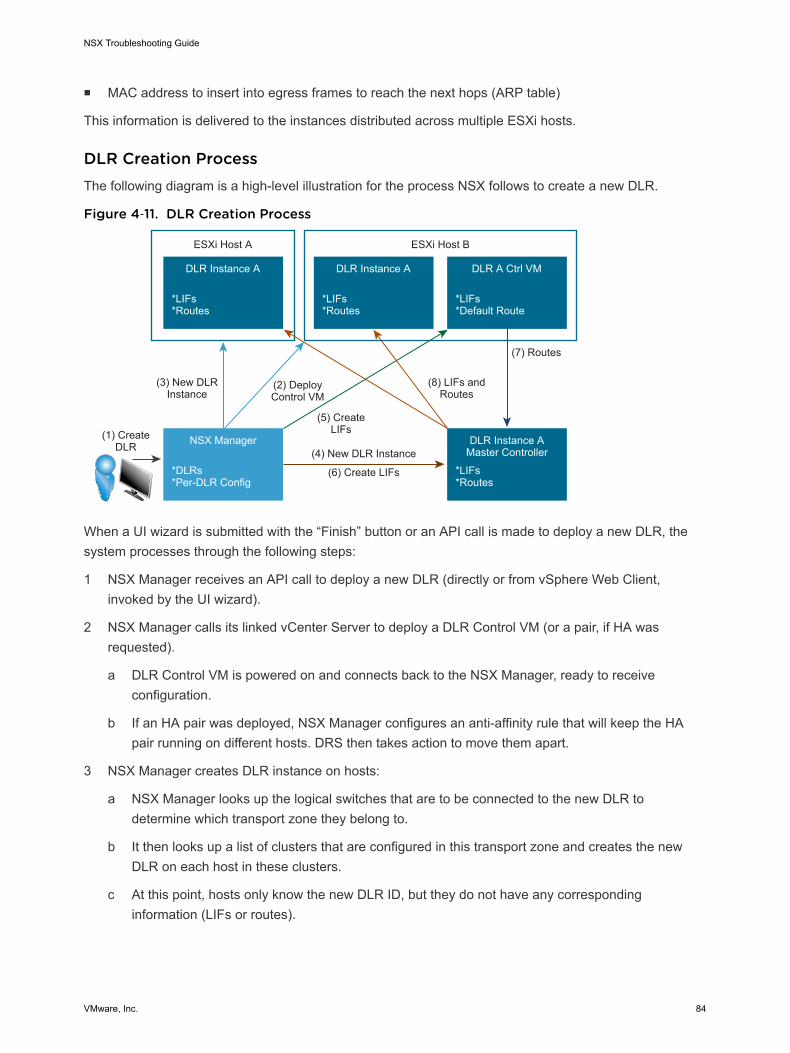
n MAC address to insert into egress frames to reach the next hops (ARP table)
This information is delivered to the instances distributed across multiple ESXi hosts.
DLR Creation ProcessThe following diagram is a high-level illustration for the process NSX follows to create a new DLR.
Figure 4‑11. DLR Creation Process
NSX Manager
*DLRs*Per-DLR Config
DLR Instance A
ESXi Host A ESXi Host B
*LIFs*Routes
DLR Instance A
*LIFs*Routes
DLR A Ctrl VM
*LIFs*Default Route
DLR Instance AMaster Controller
*LIFs*Routes
(1) CreateDLR
(2) DeployControl VM
(3) New DLRInstance
(8) LIFs andRoutes
(5) CreateLIFs
(4) New DLR Instance
(6) Create LIFs
(7) Routes
When a UI wizard is submitted with the “Finish” button or an API call is made to deploy a new DLR, thesystem processes through the following steps:
1 NSX Manager receives an API call to deploy a new DLR (directly or from vSphere Web Client,invoked by the UI wizard).
2 NSX Manager calls its linked vCenter Server to deploy a DLR Control VM (or a pair, if HA wasrequested).
a DLR Control VM is powered on and connects back to the NSX Manager, ready to receiveconfiguration.
b If an HA pair was deployed, NSX Manager configures an anti-affinity rule that will keep the HApair running on different hosts. DRS then takes action to move them apart.
3 NSX Manager creates DLR instance on hosts:
a NSX Manager looks up the logical switches that are to be connected to the new DLR todetermine which transport zone they belong to.
b It then looks up a list of clusters that are configured in this transport zone and creates the newDLR on each host in these clusters.
c At this point, hosts only know the new DLR ID, but they do not have any correspondinginformation (LIFs or routes).
NSX Troubleshooting Guide
VMware, Inc. 84
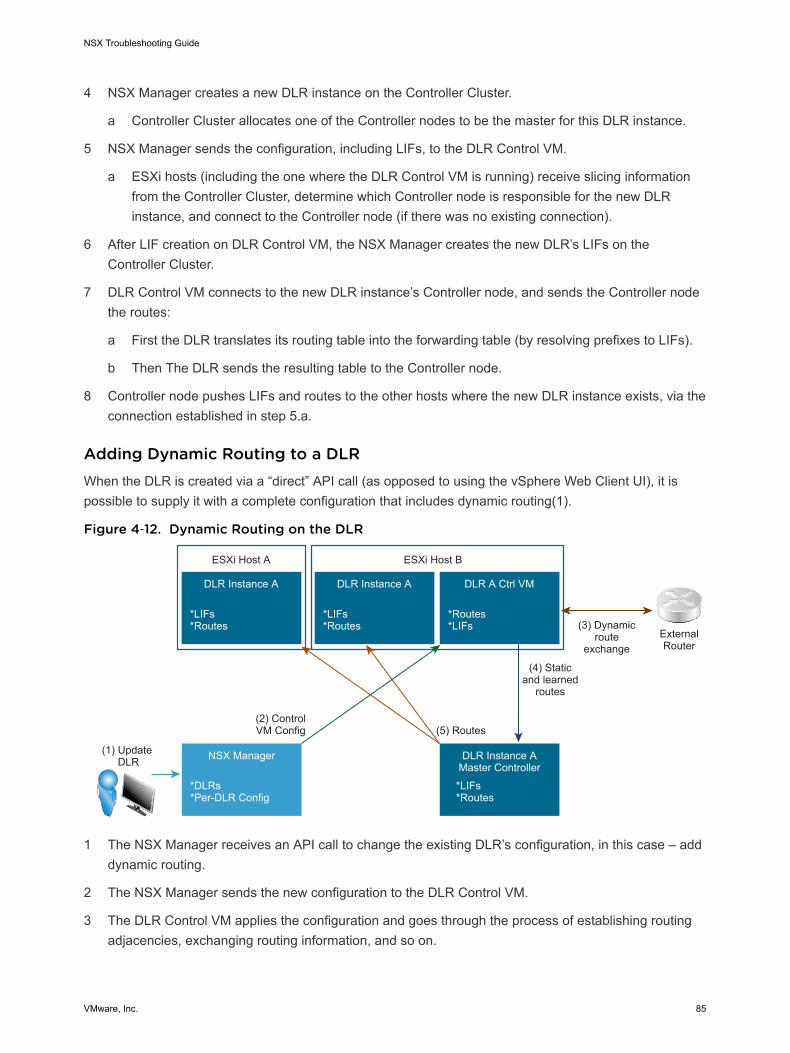
4 NSX Manager creates a new DLR instance on the Controller Cluster.
a Controller Cluster allocates one of the Controller nodes to be the master for this DLR instance.
5 NSX Manager sends the configuration, including LIFs, to the DLR Control VM.
a ESXi hosts (including the one where the DLR Control VM is running) receive slicing informationfrom the Controller Cluster, determine which Controller node is responsible for the new DLRinstance, and connect to the Controller node (if there was no existing connection).
6 After LIF creation on DLR Control VM, the NSX Manager creates the new DLR’s LIFs on theController Cluster.
7 DLR Control VM connects to the new DLR instance’s Controller node, and sends the Controller nodethe routes:
a First the DLR translates its routing table into the forwarding table (by resolving prefixes to LIFs).
b Then The DLR sends the resulting table to the Controller node.
8 Controller node pushes LIFs and routes to the other hosts where the new DLR instance exists, via theconnection established in step 5.a.
Adding Dynamic Routing to a DLRWhen the DLR is created via a “direct” API call (as opposed to using the vSphere Web Client UI), it ispossible to supply it with a complete configuration that includes dynamic routing(1).
Figure 4‑12. Dynamic Routing on the DLR
DLR A Ctrl VM
NSX Manager
*DLRs*Per-DLR Config
DLR Instance A
ESXi Host A ESXi Host B
*LIFs*Routes
DLR Instance A
*LIFs*Routes
*Routes*LIFs
DLR Instance AMaster Controller*LIFs*Routes
ExternalRouter
(1) Update DLR
(2) ControlVM Config (5) Routes
(3) Dynamicroute
exchange
(4) Staticand learned
routes
1 The NSX Manager receives an API call to change the existing DLR’s configuration, in this case – adddynamic routing.
2 The NSX Manager sends the new configuration to the DLR Control VM.
3 The DLR Control VM applies the configuration and goes through the process of establishing routingadjacencies, exchanging routing information, and so on.
NSX Troubleshooting Guide
VMware, Inc. 85
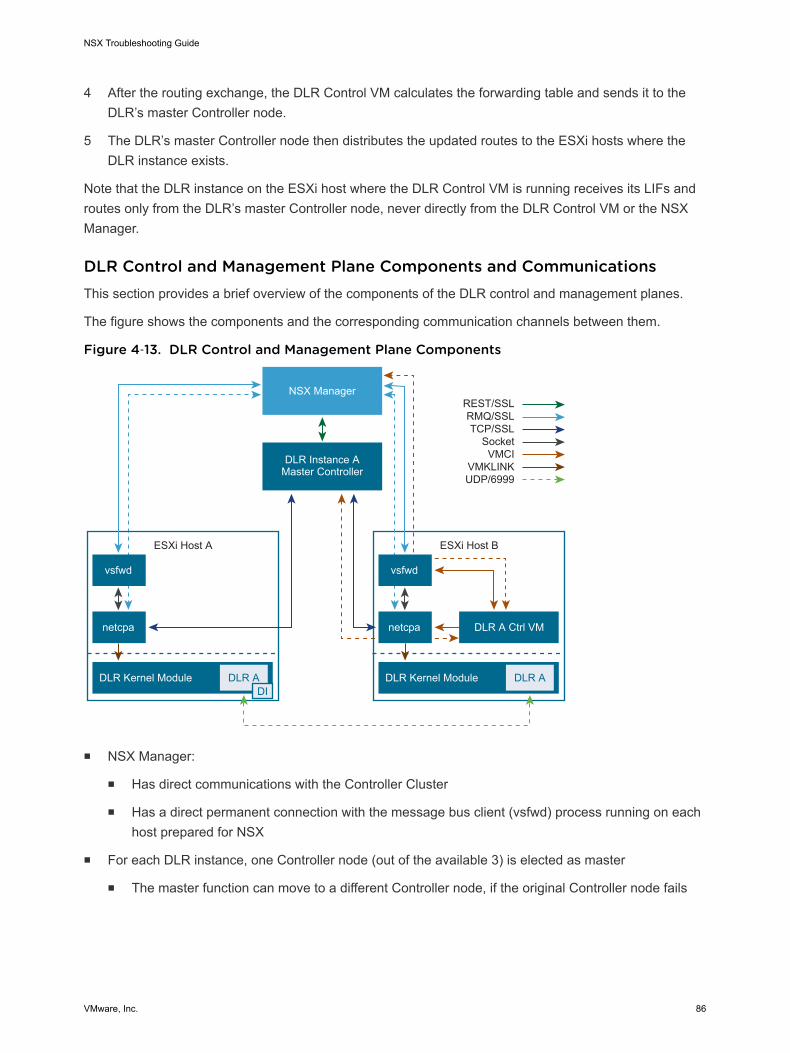
4 After the routing exchange, the DLR Control VM calculates the forwarding table and sends it to theDLR’s master Controller node.
5 The DLR’s master Controller node then distributes the updated routes to the ESXi hosts where theDLR instance exists.
Note that the DLR instance on the ESXi host where the DLR Control VM is running receives its LIFs androutes only from the DLR’s master Controller node, never directly from the DLR Control VM or the NSXManager.
DLR Control and Management Plane Components and CommunicationsThis section provides a brief overview of the components of the DLR control and management planes.
The figure shows the components and the corresponding communication channels between them.
Figure 4‑13. DLR Control and Management Plane Components
NSX Manager
vsfwd
netcpa
DLR Kernel Module DLR ADI
ESXi Host A
vsfwd
netcpa
DLR Kernel Module DLR A
ESXi Host B
REST/SSLRMQ/SSLTCP/SSL
SocketVMCI
VMKLINKUDP/6999
DLR A Ctrl VM
DLR Instance AMaster Controller
n NSX Manager:
n Has direct communications with the Controller Cluster
n Has a direct permanent connection with the message bus client (vsfwd) process running on eachhost prepared for NSX
n For each DLR instance, one Controller node (out of the available 3) is elected as master
n The master function can move to a different Controller node, if the original Controller node fails
NSX Troubleshooting Guide
VMware, Inc. 86
n Each ESXi host runs two User World Agents (UWA): message bus client (vsfwd) and control planeagent (netcpa)
n netcpa requires information from the NSX Manager to function (for example, where to findControllers and how to authenticate to them); this information is accessed via the message busconnection provided by vsfwd
n netcpa also communicates with the DLR kernel module to program it with the relevant informationit receives from Controllers
n For each DLR instance, there is a DLR Control VM, which is running on one of the ESXi hosts; theDLR Control VM has two communication channels:
n VMCI channel to the NSX Manager via vsfwd, which is used for configuring the Control VM
n VMCI channel to the DLR master Controller via netcpa, which is used to send the DLR’s routingtable to the Controller
n In cases where the DLR has a VLAN LIF, one of the participating ESXi hosts is nominated by theController as a designated instance (DI). The DLR kernel module on other ESXi hosts requests thatthe DI perform proxy ARP queries on the associated VLAN.
NSX Routing Subsystem ComponentsThe NSX routing subsystem is enabled by multiple components.
n NSX Manager
n Cluster of Controllers
n ESXi host modules (kernel and UWA)
n DLR Control VMs
n ESGs
NSX ManagerNSX Manager provides the following functions relevant to NSX routing:
n Acts as a centralized management plane, providing the unified API access point for all NSXmanagement operations
n Installs the Distributed Routing Kernel Module and User World Agents on hosts to prepare them forNSX functions
n Creates/destroys DLRs and DLR LIFs
n Deploys/deletes DLR Control VM and ESG via vCenter
n Configures the Controller Cluster via a REST API and hosts via a message bus:
n Provides host Control Plane agents with the IP addresses of Controllers
n Generates and distributes to hosts and controllers the certificates to secure control planecommunications
NSX Troubleshooting Guide
VMware, Inc. 87
n Configures ESGs and DLR Control VMs via the message bus
n Note that ESGs can be deployed on unprepared hosts, in which case VIX will be used in lieu ofthe message bus
Cluster of ControllersNSX distributed routing requires Controllers, clustered for scale and availability, which provide thefollowing functions:
n Support VXLAN and distributed routing control plane
n Provide CLI interface for statistics and runtime states
n Elect a master controller node for each DLR instance
n Master node receives routing information from the DLR Control VM and distributes it to the hosts
n Sends LIF table to the hosts
n Keeps track of the host where DLR Control VM resides
n Selects designated instance for VLAN LIFs and communicates this information to hosts; monitorsDI host via control plane keepalives (timeout is 30 seconds, and detection time can be 20-40seconds), sends hosts an update if the selected DI host disappears
ESXi host modulesNSX routing directly utilizes two User World Agents (UWA) and a routing kernel module and also relies onthe VXLAN kernel module for VXLAN connectivity.
Here is a summary of what each of these components does:
n Control Plane Agent (netcpa) is a TCP (SSL) client that communicates with the Controller using thecontrol plane protocol. It might connect to multiple controllers. netcpa communicates with theMessage Bus Client (vsfwd) to retrieve control plane related information from NSX Manager.
n netcpa packaging and deployment:
n The agent is packaged into the VXLAN VIB (vSphere installation bundle)
n Installed by NSX Manager via EAM (ESX Agency Manager) during host preparation
n Runs as a service daemon on ESXi netcpa
n Can be started / stopped / queried via its startup script /etc/init.d/netcpad
n Can be restarted remotely via Networking and Security UI Installation -> Host Preparation ->Installation Status, on individual hosts or on a whole cluster
n DLR Kernel Module (vdrb) integrates with DVS to enable L3 forwarding
n Configured by netcpa
n Installed as part of the VXLAN VIB deployment
n Connects to DVS via the special trunk called “vdrPort," which supports both VLANs and VXLANs
NSX Troubleshooting Guide
VMware, Inc. 88

n Holds information about DLR instances, with per-instance:
n LIF and Route tables
n host-local ARP cache
n Message Bus Client (vsfwd) is used by netcpa, ESGs, and DLR Control VMs to communicate with theNSX Manager
n vsfwd obtains NSX Manager’s IP address from /UserVars/RmqIpAddress set by vCenter viavpxa/hosd and logs into the Message Bus server using per-host credentials stored inother /UserVars/Rmq* variables
n netcpa running on an ESXi host relies on vsfwd to do the following:
n Obtain host’s control plane SSL private key and certificate from NSX Manager. These are thenstored in /etc/vmware/ssl/rui-for-netcpa.*
n Get IP addresses and SSL thumbprints of Controllers from NSX Manager. These are then storedin /etc/vmware/netcpa/config-by-vsm.xml.
n Create and delete DLR instances on its host on instruction from NSX Manager
n Packaging and deployment
n Same as netcpa, it’s a part of the VXLAN VIB
n Runs as a service daemon on ESXi vsfwd
n Can be started / stopped / queried via its startup script /etc/init.d/ vShield-Stateful-Firewall
n ESGs and DLR Control VMs use VMCI channel to vsfwd to receive configuration from NSX Manager
DLR Control VMs and ESGsn DLR Control VM is a “route processor” for its DLR instance
n Has a “placeholder” or a “real vNIC” interfaces for each DLR LIF, along with IP configuration
n Can run one of two available dynamic routing protocol (BGP or OSPF) and/or use static routes
n Requires at least one “Uplink” LIF to be able to run OSPF or BGP
n Computes forwarding table from directly connected (LIF) subnets, static, and dynamic routes, andsends it via its VMCI link to netcpa to the DLR instance’s master Controller
n Supports HA in Active/Standby VM pair configuration
n ESG is a self-contained router in a VM
n Completely independent from the NSX DLR routing subsystem (no NSX control plane integration)
n Typically used as an upstream gateway for one or more DLRs
n Supports more than one concurrently running dynamic routing protocol
NSX Troubleshooting Guide
VMware, Inc. 89
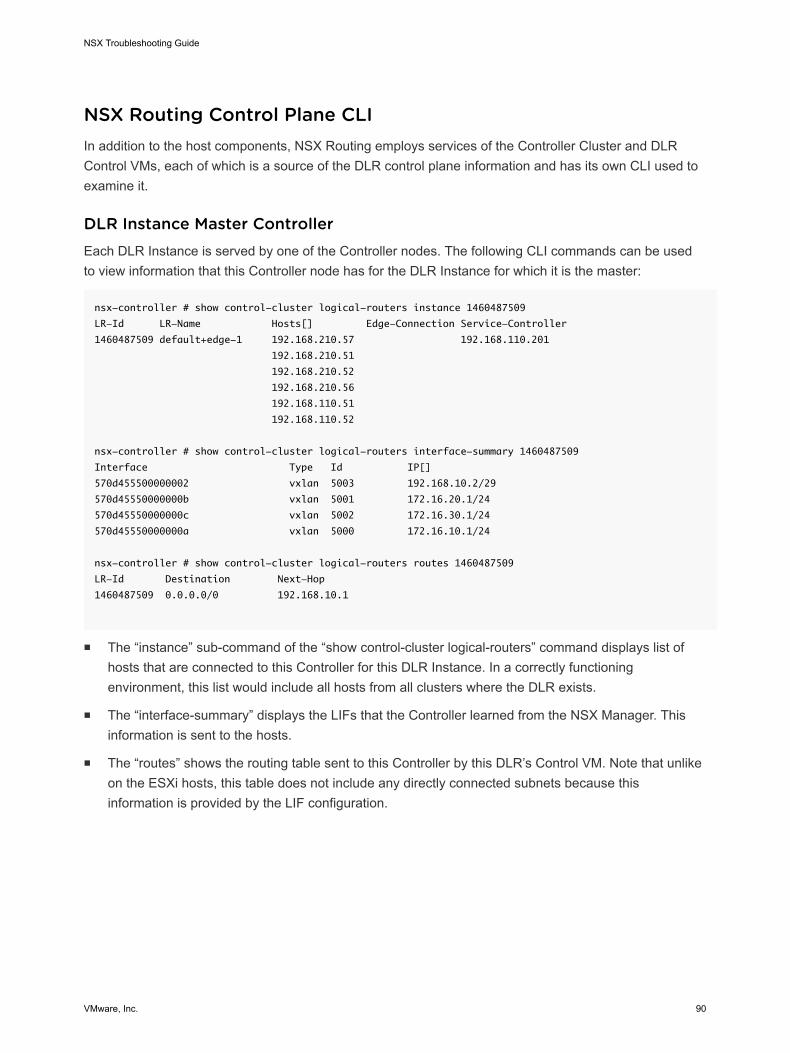
NSX Routing Control Plane CLIIn addition to the host components, NSX Routing employs services of the Controller Cluster and DLRControl VMs, each of which is a source of the DLR control plane information and has its own CLI used toexamine it.
DLR Instance Master ControllerEach DLR Instance is served by one of the Controller nodes. The following CLI commands can be usedto view information that this Controller node has for the DLR Instance for which it is the master:
nsx-controller # show control-cluster logical-routers instance 1460487509
LR-Id LR-Name Hosts[] Edge-Connection Service-Controller
1460487509 default+edge-1 192.168.210.57 192.168.110.201
192.168.210.51
192.168.210.52
192.168.210.56
192.168.110.51
192.168.110.52
nsx-controller # show control-cluster logical-routers interface-summary 1460487509
Interface Type Id IP[]
570d455500000002 vxlan 5003 192.168.10.2/29
570d45550000000b vxlan 5001 172.16.20.1/24
570d45550000000c vxlan 5002 172.16.30.1/24
570d45550000000a vxlan 5000 172.16.10.1/24
nsx-controller # show control-cluster logical-routers routes 1460487509
LR-Id Destination Next-Hop
1460487509 0.0.0.0/0 192.168.10.1
n The “instance” sub-command of the “show control-cluster logical-routers” command displays list ofhosts that are connected to this Controller for this DLR Instance. In a correctly functioningenvironment, this list would include all hosts from all clusters where the DLR exists.
n The “interface-summary” displays the LIFs that the Controller learned from the NSX Manager. Thisinformation is sent to the hosts.
n The “routes” shows the routing table sent to this Controller by this DLR’s Control VM. Note that unlikeon the ESXi hosts, this table does not include any directly connected subnets because thisinformation is provided by the LIF configuration.
NSX Troubleshooting Guide
VMware, Inc. 90
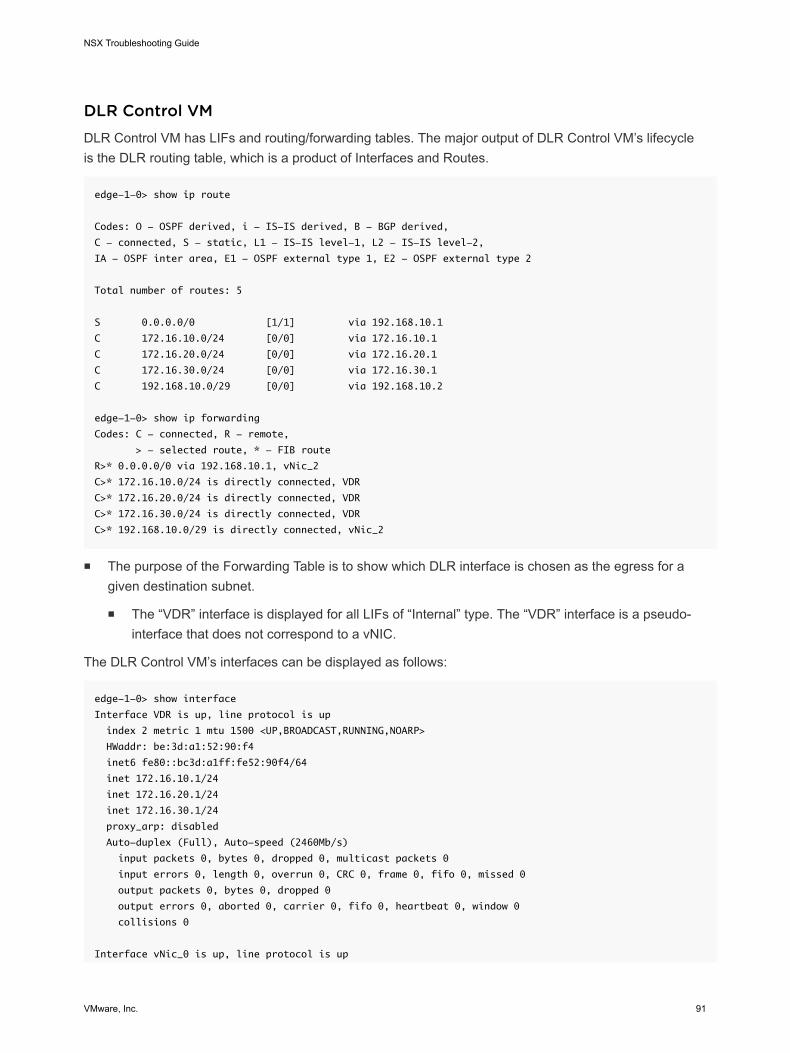
DLR Control VMDLR Control VM has LIFs and routing/forwarding tables. The major output of DLR Control VM’s lifecycleis the DLR routing table, which is a product of Interfaces and Routes.
edge-1-0> show ip route
Codes: O - OSPF derived, i - IS-IS derived, B - BGP derived,
C - connected, S - static, L1 - IS-IS level-1, L2 - IS-IS level-2,
IA - OSPF inter area, E1 - OSPF external type 1, E2 - OSPF external type 2
Total number of routes: 5
S 0.0.0.0/0 [1/1] via 192.168.10.1
C 172.16.10.0/24 [0/0] via 172.16.10.1
C 172.16.20.0/24 [0/0] via 172.16.20.1
C 172.16.30.0/24 [0/0] via 172.16.30.1
C 192.168.10.0/29 [0/0] via 192.168.10.2
edge-1-0> show ip forwarding
Codes: C - connected, R - remote,
> - selected route, * - FIB route
R>* 0.0.0.0/0 via 192.168.10.1, vNic_2
C>* 172.16.10.0/24 is directly connected, VDR
C>* 172.16.20.0/24 is directly connected, VDR
C>* 172.16.30.0/24 is directly connected, VDR
C>* 192.168.10.0/29 is directly connected, vNic_2
n The purpose of the Forwarding Table is to show which DLR interface is chosen as the egress for agiven destination subnet.
n The “VDR” interface is displayed for all LIFs of “Internal” type. The “VDR” interface is a pseudo-interface that does not correspond to a vNIC.
The DLR Control VM’s interfaces can be displayed as follows:
edge-1-0> show interface
Interface VDR is up, line protocol is up
index 2 metric 1 mtu 1500 <UP,BROADCAST,RUNNING,NOARP>
HWaddr: be:3d:a1:52:90:f4
inet6 fe80::bc3d:a1ff:fe52:90f4/64
inet 172.16.10.1/24
inet 172.16.20.1/24
inet 172.16.30.1/24
proxy_arp: disabled
Auto-duplex (Full), Auto-speed (2460Mb/s)
input packets 0, bytes 0, dropped 0, multicast packets 0
input errors 0, length 0, overrun 0, CRC 0, frame 0, fifo 0, missed 0
output packets 0, bytes 0, dropped 0
output errors 0, aborted 0, carrier 0, fifo 0, heartbeat 0, window 0
collisions 0
Interface vNic_0 is up, line protocol is up
NSX Troubleshooting Guide
VMware, Inc. 91
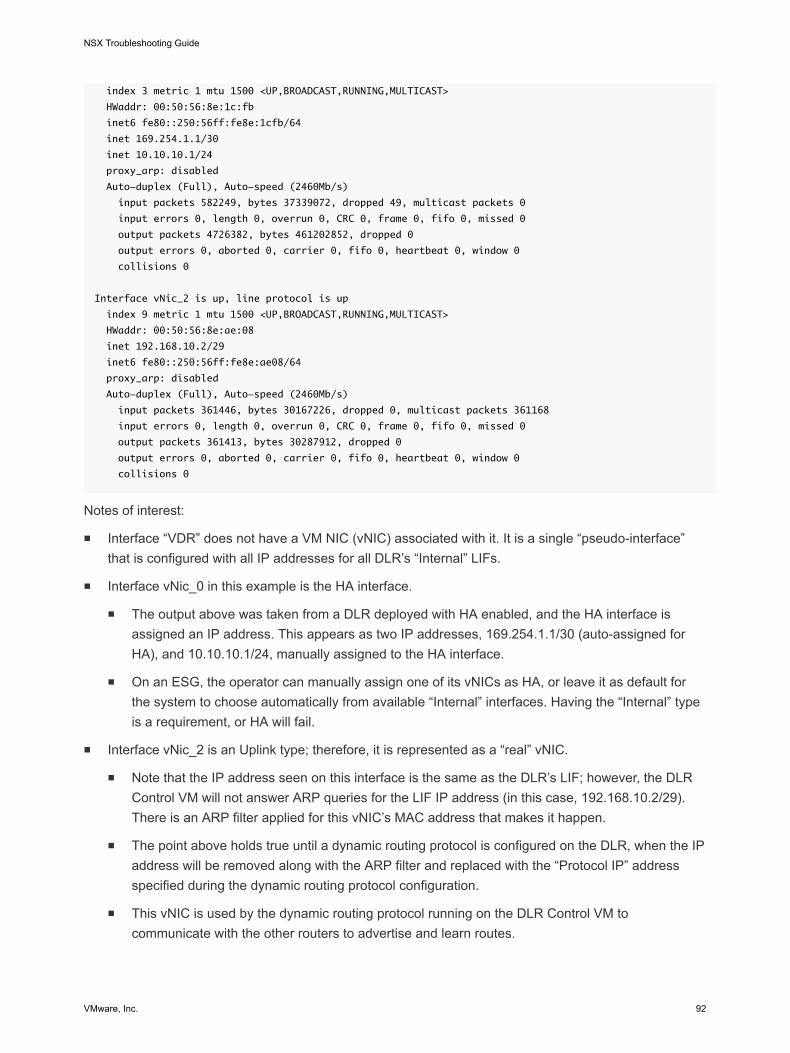
index 3 metric 1 mtu 1500 <UP,BROADCAST,RUNNING,MULTICAST>
HWaddr: 00:50:56:8e:1c:fb
inet6 fe80::250:56ff:fe8e:1cfb/64
inet 169.254.1.1/30
inet 10.10.10.1/24
proxy_arp: disabled
Auto-duplex (Full), Auto-speed (2460Mb/s)
input packets 582249, bytes 37339072, dropped 49, multicast packets 0
input errors 0, length 0, overrun 0, CRC 0, frame 0, fifo 0, missed 0
output packets 4726382, bytes 461202852, dropped 0
output errors 0, aborted 0, carrier 0, fifo 0, heartbeat 0, window 0
collisions 0
Interface vNic_2 is up, line protocol is up
index 9 metric 1 mtu 1500 <UP,BROADCAST,RUNNING,MULTICAST>
HWaddr: 00:50:56:8e:ae:08
inet 192.168.10.2/29
inet6 fe80::250:56ff:fe8e:ae08/64
proxy_arp: disabled
Auto-duplex (Full), Auto-speed (2460Mb/s)
input packets 361446, bytes 30167226, dropped 0, multicast packets 361168
input errors 0, length 0, overrun 0, CRC 0, frame 0, fifo 0, missed 0
output packets 361413, bytes 30287912, dropped 0
output errors 0, aborted 0, carrier 0, fifo 0, heartbeat 0, window 0
collisions 0
Notes of interest:
n Interface “VDR” does not have a VM NIC (vNIC) associated with it. It is a single “pseudo-interface”that is configured with all IP addresses for all DLR’s “Internal” LIFs.
n Interface vNic_0 in this example is the HA interface.
n The output above was taken from a DLR deployed with HA enabled, and the HA interface isassigned an IP address. This appears as two IP addresses, 169.254.1.1/30 (auto-assigned forHA), and 10.10.10.1/24, manually assigned to the HA interface.
n On an ESG, the operator can manually assign one of its vNICs as HA, or leave it as default forthe system to choose automatically from available “Internal” interfaces. Having the “Internal” typeis a requirement, or HA will fail.
n Interface vNic_2 is an Uplink type; therefore, it is represented as a “real” vNIC.
n Note that the IP address seen on this interface is the same as the DLR’s LIF; however, the DLRControl VM will not answer ARP queries for the LIF IP address (in this case, 192.168.10.2/29).There is an ARP filter applied for this vNIC’s MAC address that makes it happen.
n The point above holds true until a dynamic routing protocol is configured on the DLR, when the IPaddress will be removed along with the ARP filter and replaced with the “Protocol IP” addressspecified during the dynamic routing protocol configuration.
n This vNIC is used by the dynamic routing protocol running on the DLR Control VM tocommunicate with the other routers to advertise and learn routes.
NSX Troubleshooting Guide
VMware, Inc. 92
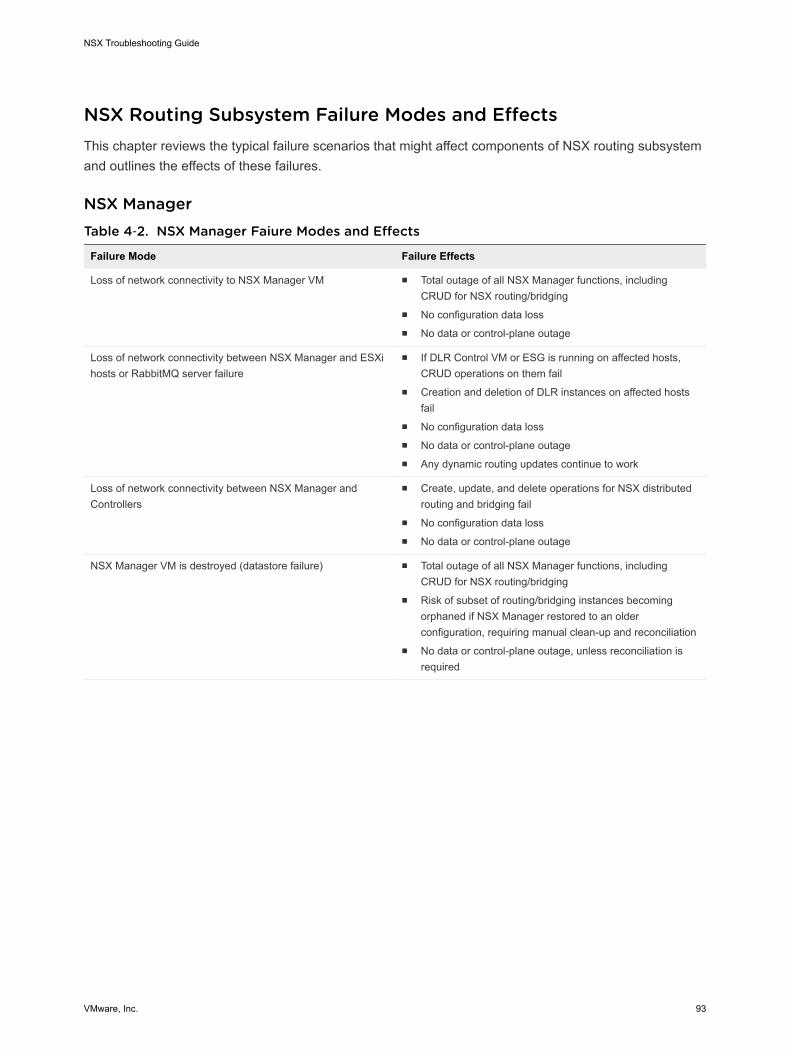
NSX Routing Subsystem Failure Modes and EffectsThis chapter reviews the typical failure scenarios that might affect components of NSX routing subsystemand outlines the effects of these failures.
NSX ManagerTable 4‑2. NSX Manager Faiure Modes and Effects
Failure Mode Failure Effects
Loss of network connectivity to NSX Manager VM n Total outage of all NSX Manager functions, includingCRUD for NSX routing/bridging
n No configuration data lossn No data or control-plane outage
Loss of network connectivity between NSX Manager and ESXihosts or RabbitMQ server failure
n If DLR Control VM or ESG is running on affected hosts,CRUD operations on them fail
n Creation and deletion of DLR instances on affected hostsfail
n No configuration data lossn No data or control-plane outagen Any dynamic routing updates continue to work
Loss of network connectivity between NSX Manager andControllers
n Create, update, and delete operations for NSX distributedrouting and bridging fail
n No configuration data lossn No data or control-plane outage
NSX Manager VM is destroyed (datastore failure) n Total outage of all NSX Manager functions, includingCRUD for NSX routing/bridging
n Risk of subset of routing/bridging instances becomingorphaned if NSX Manager restored to an olderconfiguration, requiring manual clean-up and reconciliation
n No data or control-plane outage, unless reconciliation isrequired
NSX Troubleshooting Guide
VMware, Inc. 93
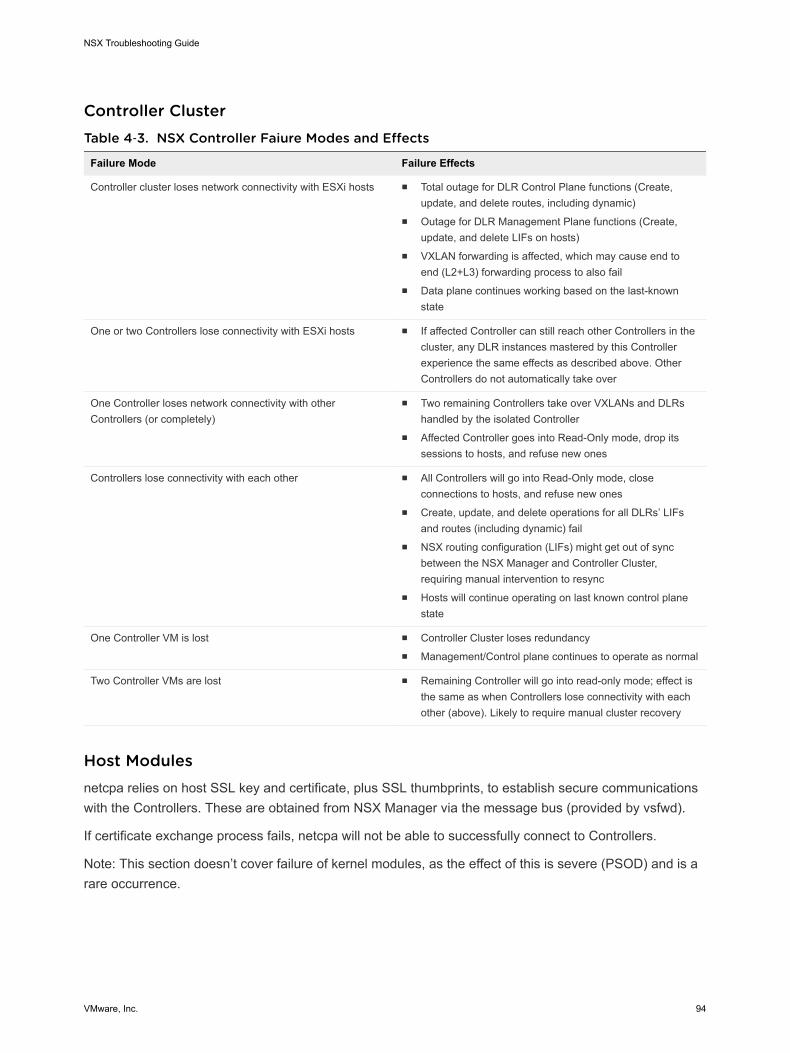
Controller ClusterTable 4‑3. NSX Controller Faiure Modes and Effects
Failure Mode Failure Effects
Controller cluster loses network connectivity with ESXi hosts n Total outage for DLR Control Plane functions (Create,update, and delete routes, including dynamic)
n Outage for DLR Management Plane functions (Create,update, and delete LIFs on hosts)
n VXLAN forwarding is affected, which may cause end toend (L2+L3) forwarding process to also fail
n Data plane continues working based on the last-knownstate
One or two Controllers lose connectivity with ESXi hosts n If affected Controller can still reach other Controllers in thecluster, any DLR instances mastered by this Controllerexperience the same effects as described above. OtherControllers do not automatically take over
One Controller loses network connectivity with otherControllers (or completely)
n Two remaining Controllers take over VXLANs and DLRshandled by the isolated Controller
n Affected Controller goes into Read-Only mode, drop itssessions to hosts, and refuse new ones
Controllers lose connectivity with each other n All Controllers will go into Read-Only mode, closeconnections to hosts, and refuse new ones
n Create, update, and delete operations for all DLRs’ LIFsand routes (including dynamic) fail
n NSX routing configuration (LIFs) might get out of syncbetween the NSX Manager and Controller Cluster,requiring manual intervention to resync
n Hosts will continue operating on last known control planestate
One Controller VM is lost n Controller Cluster loses redundancyn Management/Control plane continues to operate as normal
Two Controller VMs are lost n Remaining Controller will go into read-only mode; effect isthe same as when Controllers lose connectivity with eachother (above). Likely to require manual cluster recovery
Host Modulesnetcpa relies on host SSL key and certificate, plus SSL thumbprints, to establish secure communicationswith the Controllers. These are obtained from NSX Manager via the message bus (provided by vsfwd).
If certificate exchange process fails, netcpa will not be able to successfully connect to Controllers.
Note: This section doesn’t cover failure of kernel modules, as the effect of this is severe (PSOD) and is arare occurrence.
NSX Troubleshooting Guide
VMware, Inc. 94
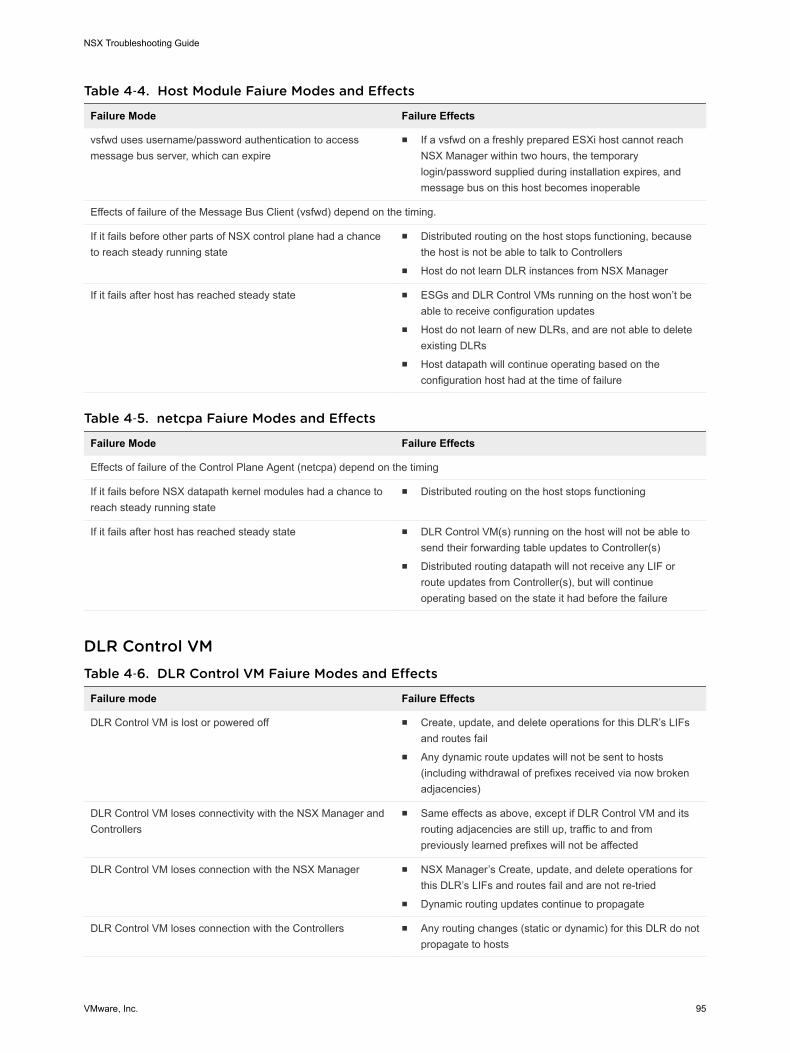
Table 4‑4. Host Module Faiure Modes and Effects
Failure Mode Failure Effects
vsfwd uses username/password authentication to accessmessage bus server, which can expire
n If a vsfwd on a freshly prepared ESXi host cannot reachNSX Manager within two hours, the temporarylogin/password supplied during installation expires, andmessage bus on this host becomes inoperable
Effects of failure of the Message Bus Client (vsfwd) depend on the timing.
If it fails before other parts of NSX control plane had a chanceto reach steady running state
n Distributed routing on the host stops functioning, becausethe host is not be able to talk to Controllers
n Host do not learn DLR instances from NSX Manager
If it fails after host has reached steady state n ESGs and DLR Control VMs running on the host won’t beable to receive configuration updates
n Host do not learn of new DLRs, and are not able to deleteexisting DLRs
n Host datapath will continue operating based on theconfiguration host had at the time of failure
Table 4‑5. netcpa Faiure Modes and Effects
Failure Mode Failure Effects
Effects of failure of the Control Plane Agent (netcpa) depend on the timing
If it fails before NSX datapath kernel modules had a chance toreach steady running state
n Distributed routing on the host stops functioning
If it fails after host has reached steady state n DLR Control VM(s) running on the host will not be able tosend their forwarding table updates to Controller(s)
n Distributed routing datapath will not receive any LIF orroute updates from Controller(s), but will continueoperating based on the state it had before the failure
DLR Control VMTable 4‑6. DLR Control VM Faiure Modes and Effects
Failure mode Failure Effects
DLR Control VM is lost or powered off n Create, update, and delete operations for this DLR’s LIFsand routes fail
n Any dynamic route updates will not be sent to hosts(including withdrawal of prefixes received via now brokenadjacencies)
DLR Control VM loses connectivity with the NSX Manager andControllers
n Same effects as above, except if DLR Control VM and itsrouting adjacencies are still up, traffic to and frompreviously learned prefixes will not be affected
DLR Control VM loses connection with the NSX Manager n NSX Manager’s Create, update, and delete operations forthis DLR’s LIFs and routes fail and are not re-tried
n Dynamic routing updates continue to propagate
DLR Control VM loses connection with the Controllers n Any routing changes (static or dynamic) for this DLR do notpropagate to hosts
NSX Troubleshooting Guide
VMware, Inc. 95
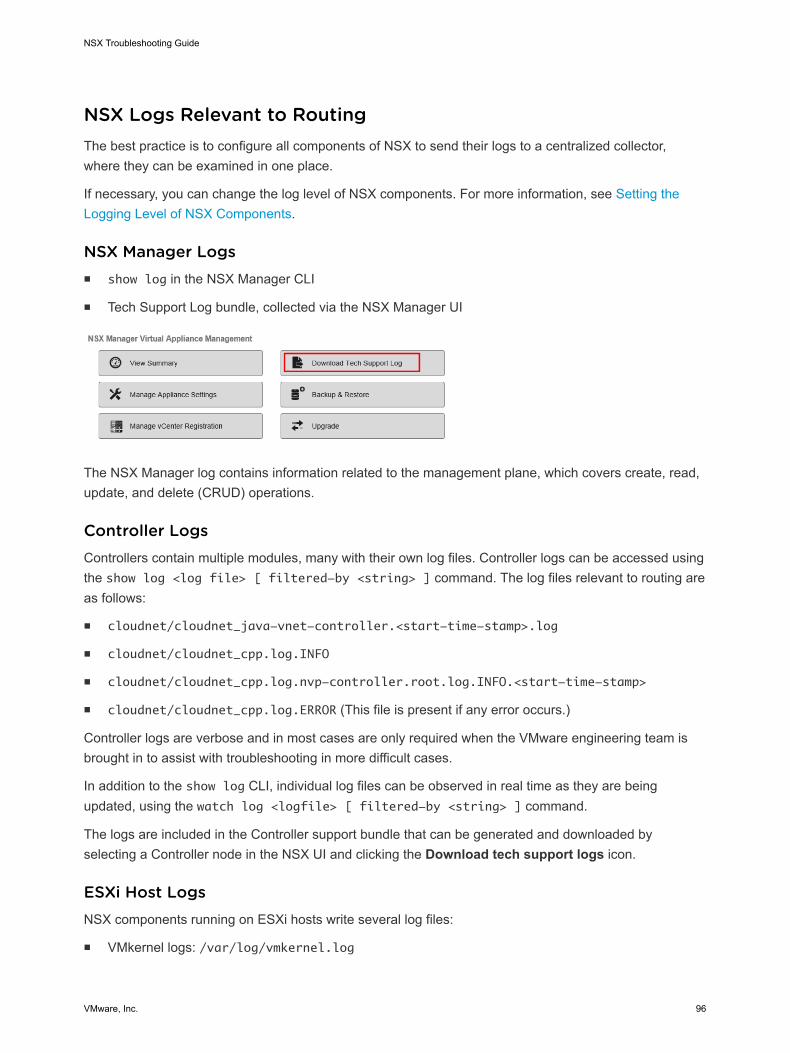
NSX Logs Relevant to RoutingThe best practice is to configure all components of NSX to send their logs to a centralized collector,where they can be examined in one place.
If necessary, you can change the log level of NSX components. For more information, see Setting theLogging Level of NSX Components.
NSX Manager Logsn show log in the NSX Manager CLI
n Tech Support Log bundle, collected via the NSX Manager UI
The NSX Manager log contains information related to the management plane, which covers create, read,update, and delete (CRUD) operations.
Controller LogsControllers contain multiple modules, many with their own log files. Controller logs can be accessed usingthe show log <log file> [ filtered-by <string> ] command. The log files relevant to routing areas follows:
n cloudnet/cloudnet_java-vnet-controller.<start-time-stamp>.log
n cloudnet/cloudnet_cpp.log.INFO
n cloudnet/cloudnet_cpp.log.nvp-controller.root.log.INFO.<start-time-stamp>
n cloudnet/cloudnet_cpp.log.ERROR (This file is present if any error occurs.)
Controller logs are verbose and in most cases are only required when the VMware engineering team isbrought in to assist with troubleshooting in more difficult cases.
In addition to the show log CLI, individual log files can be observed in real time as they are beingupdated, using the watch log <logfile> [ filtered-by <string> ] command.
The logs are included in the Controller support bundle that can be generated and downloaded byselecting a Controller node in the NSX UI and clicking the Download tech support logs icon.
ESXi Host LogsNSX components running on ESXi hosts write several log files:
n VMkernel logs: /var/log/vmkernel.log
NSX Troubleshooting Guide
VMware, Inc. 96

n Control Plane Agent logs: /var/log/netcpa.log
n Message Bus Client logs: /var/log/vsfwd.log
The logs can also be collected as part of the VM support bundle generated from vCenter Server.
ESG/DLR Control VM LogsThere are two ways to access log files on the ESG and DLR Control VMs—to display them using a CLI orto download the tech support bundle, using the CLI or UI.
The CLI command to display logs is show log [ follow | reverse ].
To download tech-support bundle:
n From the CLI, enter enable mode, then run the export tech-support <[ scp | ftp ]> <URI>command.
n From the vSphere Web Client, select the Download Tech Support Logs option in the Actionsmenu.
Other Useful Files and Their LocationsWhile not strictly logs, there are a number of files that can be helpful in understanding andtroubleshooting NSX routing.
n The control plane agent configuration, /etc/vmware/netcpa/config-by-vsm.xml contains theinformation about the following components:
n Controllers IP addresses, TCP ports, certificate thumbprints, SSL enable/disable
n dvUplinks on the DVS enabled with VXLAN (teaming policy, names, UUID)
n DLR instances the host knows about (DLR ID, name)
n The control plane agent configuration, /etc/vmware/netcpa/netcpa.xml contains variousconfiguration options for netcpa, including logging level (which by default is info).
n Control plane certificate files: /etc/vmware/ssl/rui-for-netcpa.*
n Two files: host certificate and host private key
n Used for authenticating host connections to Controllers
All of these files are created by netcpa using information it receives from NSX Manager via the messagebus connection provided by vsfwd.
NSX Troubleshooting Guide
VMware, Inc. 97
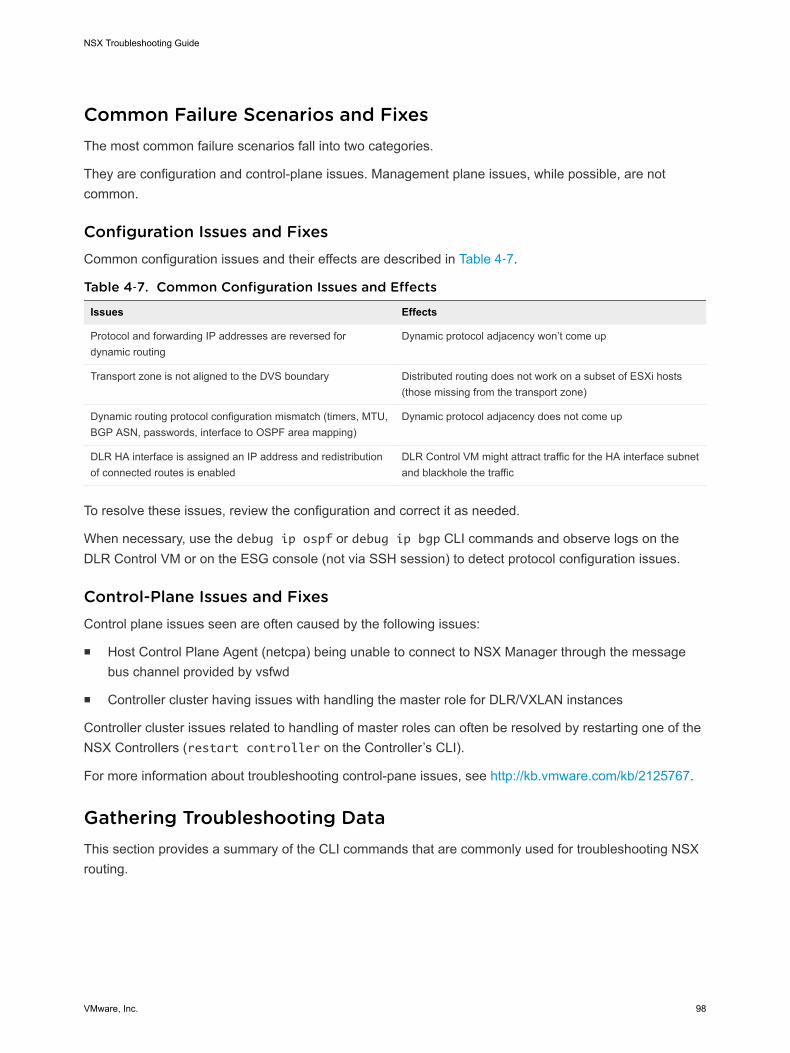
Common Failure Scenarios and FixesThe most common failure scenarios fall into two categories.
They are configuration and control-plane issues. Management plane issues, while possible, are notcommon.
Configuration Issues and FixesCommon configuration issues and their effects are described in Table 4‑7.
Table 4‑7. Common Configuration Issues and Effects
Issues Effects
Protocol and forwarding IP addresses are reversed fordynamic routing
Dynamic protocol adjacency won’t come up
Transport zone is not aligned to the DVS boundary Distributed routing does not work on a subset of ESXi hosts(those missing from the transport zone)
Dynamic routing protocol configuration mismatch (timers, MTU,BGP ASN, passwords, interface to OSPF area mapping)
Dynamic protocol adjacency does not come up
DLR HA interface is assigned an IP address and redistributionof connected routes is enabled
DLR Control VM might attract traffic for the HA interface subnetand blackhole the traffic
To resolve these issues, review the configuration and correct it as needed.
When necessary, use the debug ip ospf or debug ip bgp CLI commands and observe logs on theDLR Control VM or on the ESG console (not via SSH session) to detect protocol configuration issues.
Control-Plane Issues and FixesControl plane issues seen are often caused by the following issues:
n Host Control Plane Agent (netcpa) being unable to connect to NSX Manager through the messagebus channel provided by vsfwd
n Controller cluster having issues with handling the master role for DLR/VXLAN instances
Controller cluster issues related to handling of master roles can often be resolved by restarting one of theNSX Controllers (restart controller on the Controller’s CLI).
For more information about troubleshooting control-pane issues, see http://kb.vmware.com/kb/2125767.
Gathering Troubleshooting DataThis section provides a summary of the CLI commands that are commonly used for troubleshooting NSXrouting.
NSX Troubleshooting Guide
VMware, Inc. 98

NSX ManagerStarting in NSX 6.2, commands that were formerly run from the NSX Controller and other NSXcomponents to troubleshoot NSX routing are now run directly from the NSX Manager.
n List of DLR instances
n List of LIFs for each DLR instance
n List of Routes for each DLR instance
n List of MAC addresses for each DLR bridging instance
n Interfaces
n Routing and forwarding tables
n State of dynamic routing protocols (OSPF or BGP)
n Configuration sent to the DLR Control VM or ESG by the NSX Manager
DLR Control VM and ESGThe DLR Control VM and ESG provide functionality to capture packets on their interfaces. Packet capturecan assist with troubleshooting routing protocol problems.
1 Run show interfaces to list the interface names.
2 Run debug packet [ display | capture ] interface <interface name>.
n If using capture, packets are saved into a .pcap file.
3 Run debug show files to list saved capture files.
4 Run debug copy [ scp | ftp ] ... to download captures for offline analysis.
dlr-01-0> debug packet capture interface vNic_2
tcpdump: listening on vNic_2, link-type EN10MB (Ethernet), capture size 65535 bytes
43 packets captured
48 packets received by filter
0 packets dropped by kernel
dlr-01-0> debug show files
total 4.0K
-rw------- 1 3.6K Mar 30 23:49 tcpdump_vNic_2.0
dlr-01-0> debug copy
scp use scp to copy
ftp use ftp to copy
dlr-01-0> debug copy scp
URL user@<remote-host>:<path-to>
NSX Troubleshooting Guide
VMware, Inc. 99
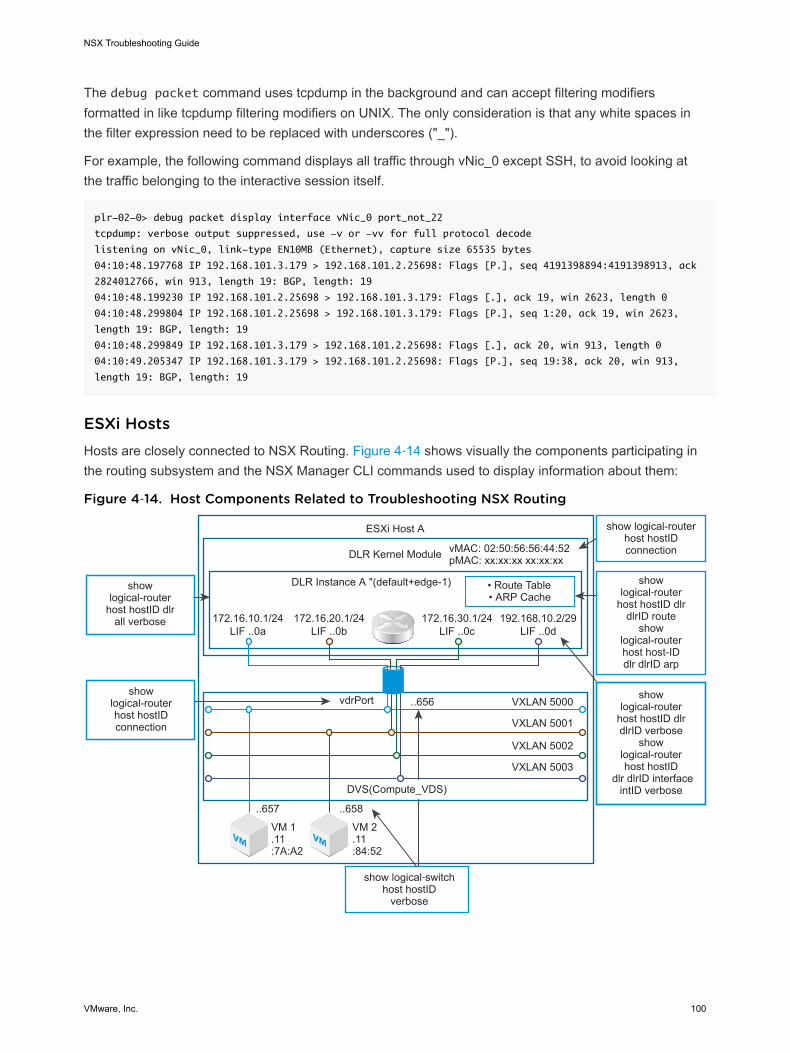
The debug packet command uses tcpdump in the background and can accept filtering modifiersformatted in like tcpdump filtering modifiers on UNIX. The only consideration is that any white spaces inthe filter expression need to be replaced with underscores ("_").
For example, the following command displays all traffic through vNic_0 except SSH, to avoid looking atthe traffic belonging to the interactive session itself.
plr-02-0> debug packet display interface vNic_0 port_not_22
tcpdump: verbose output suppressed, use -v or -vv for full protocol decode
listening on vNic_0, link-type EN10MB (Ethernet), capture size 65535 bytes
04:10:48.197768 IP 192.168.101.3.179 > 192.168.101.2.25698: Flags [P.], seq 4191398894:4191398913, ack
2824012766, win 913, length 19: BGP, length: 19
04:10:48.199230 IP 192.168.101.2.25698 > 192.168.101.3.179: Flags [.], ack 19, win 2623, length 0
04:10:48.299804 IP 192.168.101.2.25698 > 192.168.101.3.179: Flags [P.], seq 1:20, ack 19, win 2623,
length 19: BGP, length: 19
04:10:48.299849 IP 192.168.101.3.179 > 192.168.101.2.25698: Flags [.], ack 20, win 913, length 0
04:10:49.205347 IP 192.168.101.3.179 > 192.168.101.2.25698: Flags [P.], seq 19:38, ack 20, win 913,
length 19: BGP, length: 19
ESXi HostsHosts are closely connected to NSX Routing. Figure 4‑14 shows visually the components participating inthe routing subsystem and the NSX Manager CLI commands used to display information about them:
Figure 4‑14. Host Components Related to Troubleshooting NSX Routing
VM VM
ESXi Host A
DLR Kernel Module
DLR Instance A "(default+edge-1)
LIF ..0a LIF ..0b
vdrPort ..656
LIF ..0c LIF ..0d172.16.10.1/24 172.16.20.1/24 172.16.30.1/24
• Route Table• ARP Cache
192.168.10.2/29
VXLAN 5000
VXLAN 5001
VXLAN 5002
VXLAN 5003
DVS(Compute_VDS)
..657
VM 1.11:7A:A2
VM 2.11:84:52
..658
show logical‐router
host hostID dlr dlrID route
show logical-routerhost host-ID dlr dlrID arp
show logical-router
host hostID dlr dlrID verbose
show logical-routerhost hostID
dlr dlrID interface intID verbose
show logical-router
host hostID dlr all verbose
vMAC: 02:50:56:56:44:52pMAC: xx:xx:xx xx:xx:xx
show logical-router host hostID connection
showlogical-router host hostID connection
show logical‐switch host hostID
verbose
NSX Troubleshooting Guide
VMware, Inc. 100
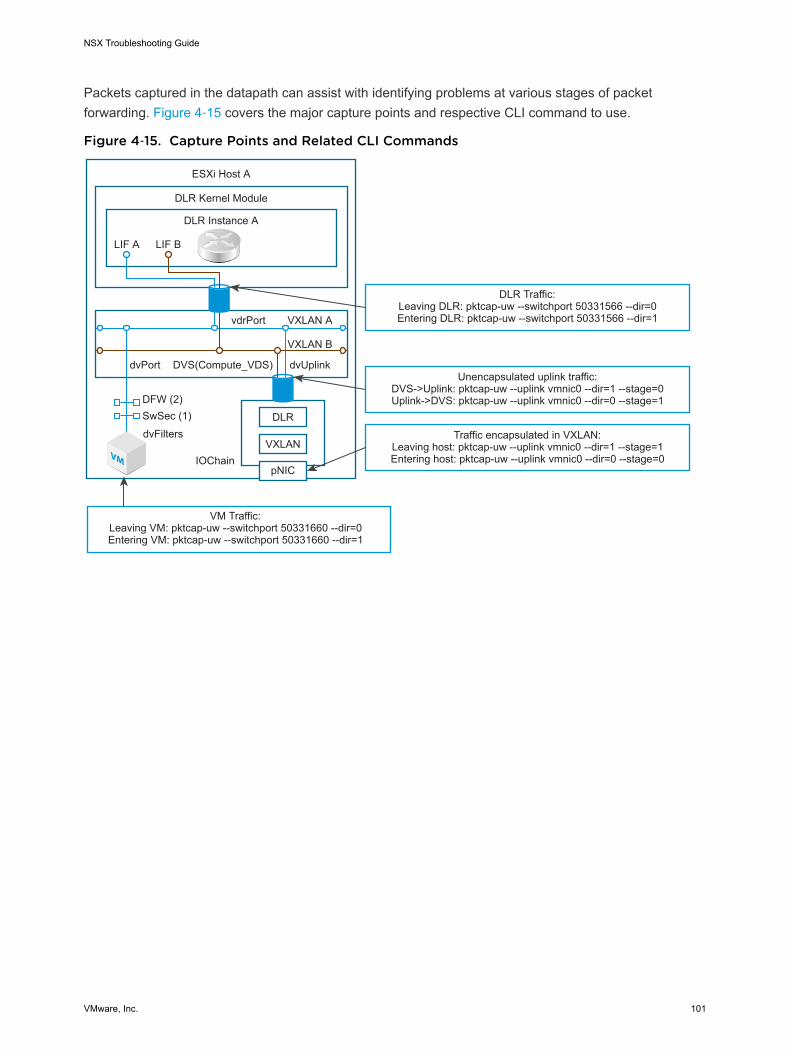
Packets captured in the datapath can assist with identifying problems at various stages of packetforwarding. Figure 4‑15 covers the major capture points and respective CLI command to use.
Figure 4‑15. Capture Points and Related CLI Commands
VM
ESXi Host A
DLR Kernel Module
DLR Instance A
LIF A LIF B
vdrPort VXLAN A
VXLAN B
dvUplinkDVS(Compute_VDS)dvPort
dvFilters
IOChain
DLR
VXLAN
pNIC
DFW (2)SwSec (1)
DLR Traffic: Leaving DLR: pktcap-uw --switchport 50331566 --dir=0Entering DLR: pktcap-uw --switchport 50331566 --dir=1
Unencapsulated uplink traffic: DVS->Uplink: pktcap-uw --uplink vmnic0 --dir=1 --stage=0Uplink->DVS: pktcap-uw --uplink vmnic0 --dir=0 --stage=1
Traffic encapsulated in VXLAN:Leaving host: pktcap-uw --uplink vmnic0 --dir=1 --stage=1Entering host: pktcap-uw --uplink vmnic0 --dir=0 --stage=0
VM Traffic:Leaving VM: pktcap-uw --switchport 50331660 --dir=0Entering VM: pktcap-uw --switchport 50331660 --dir=1
NSX Troubleshooting Guide
VMware, Inc. 101
Edge ApplianceTroubleshooting 5This topic provides information for understanding and troubleshooting the VMware NSX Edge appliance.
To troubleshoot issues with an NSX Edge appliance, validate that each troubleshooting step below is truefor your environment. Each step provides instructions or a link to a document, to eliminate possiblecauses and take corrective action as necessary. The steps are ordered in the most appropriate sequenceto isolate the issue and identify the proper resolution. Do not skip a step.
Check the release notes for current releases to see if the problem is resolved.
Ensure that the minimum system requirements are met when installing VMware NSX Edge. See the NSXInstallation Guide.
Installation and Upgrade issuesn Verify that the issue you are encountering is not related to the "Would Block" issue. For more
information, see https://kb.vmware.com/kb/2107951.
n If the upgrade or redeploy succeeds but there is no connectivity for the Edge interface, verifyconnectivity on the back-end Layer 2 switch. See https://kb.vmware.com/kb/2135285.
n If deployment or upgrade of the Edge fails with the error:
/sbin/ifconfig vNic_1 up failed : SIOCSIFFLAGS: Invalid argument
OR
n If the deployment or upgrade succeeds, but there is no connectivity on the Edge interfaces:
n Running the show interface command as well as Edge Support logs displays entries similar to:
vNic_0: <NO-CARRIER,BROADCAST,MULTICAST,UP> mtu 1500 qdisc mq state DOWN qlen 1000
link/ether 00:50:56:32:05:03 brd ff:ff:ff:ff:ff:ff
inet 21.12.227.244/23 scope global vNic_0
inet6 fe80::250:56ff:fe32:503/64 scope link tentative dadfailed
valid_lft forever preferred_lft forever
In both cases, the host switch is not ready or has some issues. To resolve, investigate the hostswitch.
VMware, Inc. 102
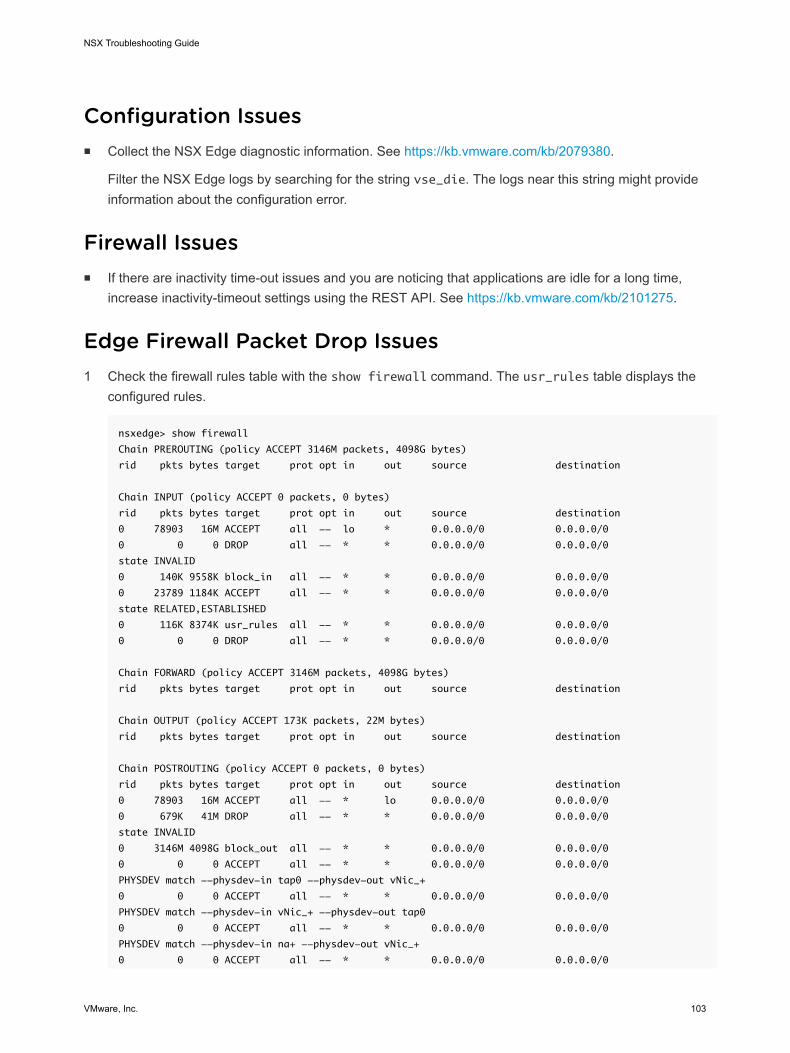
Configuration Issuesn Collect the NSX Edge diagnostic information. See https://kb.vmware.com/kb/2079380.
Filter the NSX Edge logs by searching for the string vse_die. The logs near this string might provideinformation about the configuration error.
Firewall Issuesn If there are inactivity time-out issues and you are noticing that applications are idle for a long time,
increase inactivity-timeout settings using the REST API. See https://kb.vmware.com/kb/2101275.
Edge Firewall Packet Drop Issues1 Check the firewall rules table with the show firewall command. The usr_rules table displays the
configured rules.
nsxedge> show firewall
Chain PREROUTING (policy ACCEPT 3146M packets, 4098G bytes)
rid pkts bytes target prot opt in out source destination
Chain INPUT (policy ACCEPT 0 packets, 0 bytes)
rid pkts bytes target prot opt in out source destination
0 78903 16M ACCEPT all -- lo * 0.0.0.0/0 0.0.0.0/0
0 0 0 DROP all -- * * 0.0.0.0/0 0.0.0.0/0
state INVALID
0 140K 9558K block_in all -- * * 0.0.0.0/0 0.0.0.0/0
0 23789 1184K ACCEPT all -- * * 0.0.0.0/0 0.0.0.0/0
state RELATED,ESTABLISHED
0 116K 8374K usr_rules all -- * * 0.0.0.0/0 0.0.0.0/0
0 0 0 DROP all -- * * 0.0.0.0/0 0.0.0.0/0
Chain FORWARD (policy ACCEPT 3146M packets, 4098G bytes)
rid pkts bytes target prot opt in out source destination
Chain OUTPUT (policy ACCEPT 173K packets, 22M bytes)
rid pkts bytes target prot opt in out source destination
Chain POSTROUTING (policy ACCEPT 0 packets, 0 bytes)
rid pkts bytes target prot opt in out source destination
0 78903 16M ACCEPT all -- * lo 0.0.0.0/0 0.0.0.0/0
0 679K 41M DROP all -- * * 0.0.0.0/0 0.0.0.0/0
state INVALID
0 3146M 4098G block_out all -- * * 0.0.0.0/0 0.0.0.0/0
0 0 0 ACCEPT all -- * * 0.0.0.0/0 0.0.0.0/0
PHYSDEV match --physdev-in tap0 --physdev-out vNic_+
0 0 0 ACCEPT all -- * * 0.0.0.0/0 0.0.0.0/0
PHYSDEV match --physdev-in vNic_+ --physdev-out tap0
0 0 0 ACCEPT all -- * * 0.0.0.0/0 0.0.0.0/0
PHYSDEV match --physdev-in na+ --physdev-out vNic_+
0 0 0 ACCEPT all -- * * 0.0.0.0/0 0.0.0.0/0
NSX Troubleshooting Guide
VMware, Inc. 103
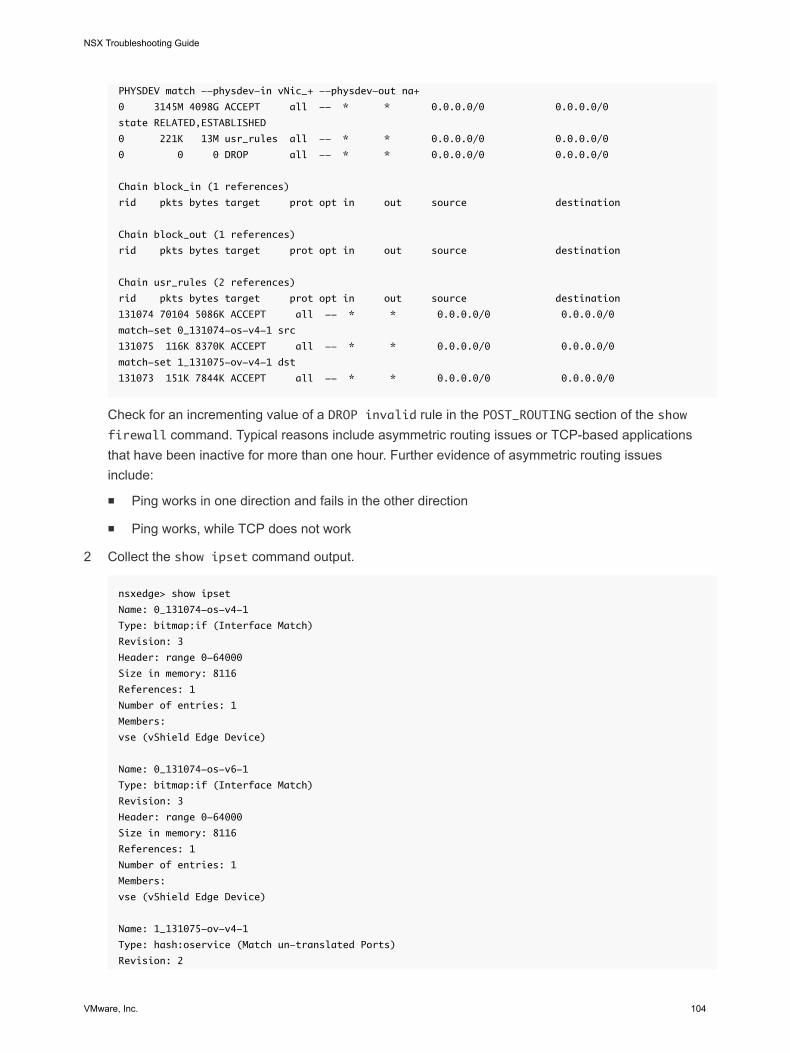
PHYSDEV match --physdev-in vNic_+ --physdev-out na+
0 3145M 4098G ACCEPT all -- * * 0.0.0.0/0 0.0.0.0/0
state RELATED,ESTABLISHED
0 221K 13M usr_rules all -- * * 0.0.0.0/0 0.0.0.0/0
0 0 0 DROP all -- * * 0.0.0.0/0 0.0.0.0/0
Chain block_in (1 references)
rid pkts bytes target prot opt in out source destination
Chain block_out (1 references)
rid pkts bytes target prot opt in out source destination
Chain usr_rules (2 references)
rid pkts bytes target prot opt in out source destination
131074 70104 5086K ACCEPT all -- * * 0.0.0.0/0 0.0.0.0/0
match-set 0_131074-os-v4-1 src
131075 116K 8370K ACCEPT all -- * * 0.0.0.0/0 0.0.0.0/0
match-set 1_131075-ov-v4-1 dst
131073 151K 7844K ACCEPT all -- * * 0.0.0.0/0 0.0.0.0/0
Check for an incrementing value of a DROP invalid rule in the POST_ROUTING section of the showfirewall command. Typical reasons include asymmetric routing issues or TCP-based applicationsthat have been inactive for more than one hour. Further evidence of asymmetric routing issuesinclude:
n Ping works in one direction and fails in the other direction
n Ping works, while TCP does not work
2 Collect the show ipset command output.
nsxedge> show ipset
Name: 0_131074-os-v4-1
Type: bitmap:if (Interface Match)
Revision: 3
Header: range 0-64000
Size in memory: 8116
References: 1
Number of entries: 1
Members:
vse (vShield Edge Device)
Name: 0_131074-os-v6-1
Type: bitmap:if (Interface Match)
Revision: 3
Header: range 0-64000
Size in memory: 8116
References: 1
Number of entries: 1
Members:
vse (vShield Edge Device)
Name: 1_131075-ov-v4-1
Type: hash:oservice (Match un-translated Ports)
Revision: 2
NSX Troubleshooting Guide
VMware, Inc. 104
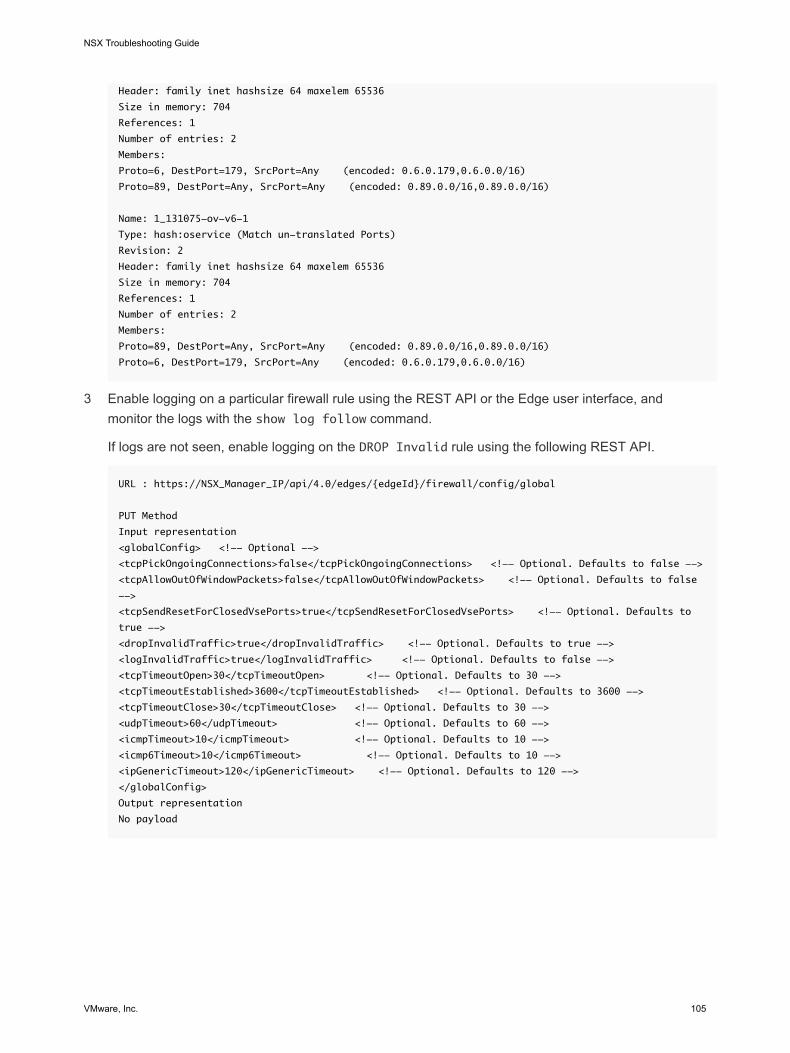
Header: family inet hashsize 64 maxelem 65536
Size in memory: 704
References: 1
Number of entries: 2
Members:
Proto=6, DestPort=179, SrcPort=Any (encoded: 0.6.0.179,0.6.0.0/16)
Proto=89, DestPort=Any, SrcPort=Any (encoded: 0.89.0.0/16,0.89.0.0/16)
Name: 1_131075-ov-v6-1
Type: hash:oservice (Match un-translated Ports)
Revision: 2
Header: family inet hashsize 64 maxelem 65536
Size in memory: 704
References: 1
Number of entries: 2
Members:
Proto=89, DestPort=Any, SrcPort=Any (encoded: 0.89.0.0/16,0.89.0.0/16)
Proto=6, DestPort=179, SrcPort=Any (encoded: 0.6.0.179,0.6.0.0/16)
3 Enable logging on a particular firewall rule using the REST API or the Edge user interface, andmonitor the logs with the show log follow command.
If logs are not seen, enable logging on the DROP Invalid rule using the following REST API.
URL : https://NSX_Manager_IP/api/4.0/edges/{edgeId}/firewall/config/global
PUT Method
Input representation
<globalConfig> <!-- Optional -->
<tcpPickOngoingConnections>false</tcpPickOngoingConnections> <!-- Optional. Defaults to false -->
<tcpAllowOutOfWindowPackets>false</tcpAllowOutOfWindowPackets> <!-- Optional. Defaults to false
-->
<tcpSendResetForClosedVsePorts>true</tcpSendResetForClosedVsePorts> <!-- Optional. Defaults to
true -->
<dropInvalidTraffic>true</dropInvalidTraffic> <!-- Optional. Defaults to true -->
<logInvalidTraffic>true</logInvalidTraffic> <!-- Optional. Defaults to false -->
<tcpTimeoutOpen>30</tcpTimeoutOpen> <!-- Optional. Defaults to 30 -->
<tcpTimeoutEstablished>3600</tcpTimeoutEstablished> <!-- Optional. Defaults to 3600 -->
<tcpTimeoutClose>30</tcpTimeoutClose> <!-- Optional. Defaults to 30 -->
<udpTimeout>60</udpTimeout> <!-- Optional. Defaults to 60 -->
<icmpTimeout>10</icmpTimeout> <!-- Optional. Defaults to 10 -->
<icmp6Timeout>10</icmp6Timeout> <!-- Optional. Defaults to 10 -->
<ipGenericTimeout>120</ipGenericTimeout> <!-- Optional. Defaults to 120 -->
</globalConfig>
Output representation
No payload
NSX Troubleshooting Guide
VMware, Inc. 105
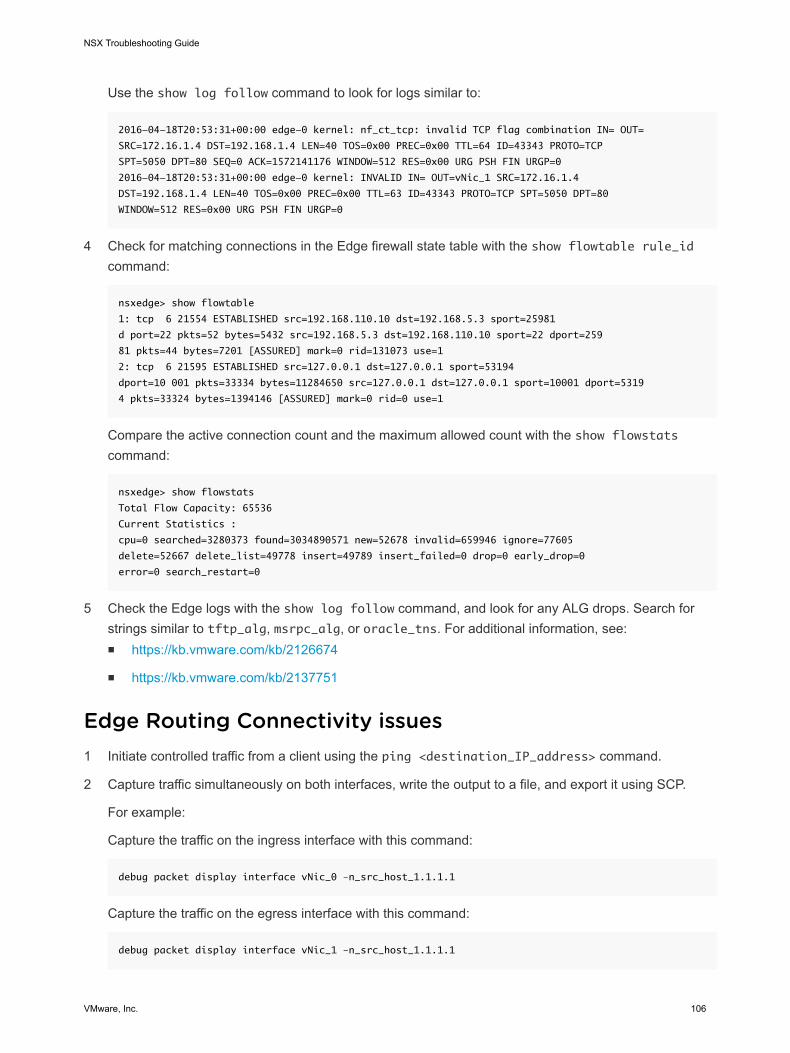
Use the show log follow command to look for logs similar to:
2016-04-18T20:53:31+00:00 edge-0 kernel: nf_ct_tcp: invalid TCP flag combination IN= OUT=
SRC=172.16.1.4 DST=192.168.1.4 LEN=40 TOS=0x00 PREC=0x00 TTL=64 ID=43343 PROTO=TCP
SPT=5050 DPT=80 SEQ=0 ACK=1572141176 WINDOW=512 RES=0x00 URG PSH FIN URGP=0
2016-04-18T20:53:31+00:00 edge-0 kernel: INVALID IN= OUT=vNic_1 SRC=172.16.1.4
DST=192.168.1.4 LEN=40 TOS=0x00 PREC=0x00 TTL=63 ID=43343 PROTO=TCP SPT=5050 DPT=80
WINDOW=512 RES=0x00 URG PSH FIN URGP=0
4 Check for matching connections in the Edge firewall state table with the show flowtable rule_idcommand:
nsxedge> show flowtable
1: tcp 6 21554 ESTABLISHED src=192.168.110.10 dst=192.168.5.3 sport=25981
d port=22 pkts=52 bytes=5432 src=192.168.5.3 dst=192.168.110.10 sport=22 dport=259
81 pkts=44 bytes=7201 [ASSURED] mark=0 rid=131073 use=1
2: tcp 6 21595 ESTABLISHED src=127.0.0.1 dst=127.0.0.1 sport=53194
dport=10 001 pkts=33334 bytes=11284650 src=127.0.0.1 dst=127.0.0.1 sport=10001 dport=5319
4 pkts=33324 bytes=1394146 [ASSURED] mark=0 rid=0 use=1
Compare the active connection count and the maximum allowed count with the show flowstatscommand:
nsxedge> show flowstats
Total Flow Capacity: 65536
Current Statistics :
cpu=0 searched=3280373 found=3034890571 new=52678 invalid=659946 ignore=77605
delete=52667 delete_list=49778 insert=49789 insert_failed=0 drop=0 early_drop=0
error=0 search_restart=0
5 Check the Edge logs with the show log follow command, and look for any ALG drops. Search forstrings similar to tftp_alg, msrpc_alg, or oracle_tns. For additional information, see:n https://kb.vmware.com/kb/2126674
n https://kb.vmware.com/kb/2137751
Edge Routing Connectivity issues1 Initiate controlled traffic from a client using the ping <destination_IP_address> command.
2 Capture traffic simultaneously on both interfaces, write the output to a file, and export it using SCP.
For example:
Capture the traffic on the ingress interface with this command:
debug packet display interface vNic_0 –n_src_host_1.1.1.1
Capture the traffic on the egress interface with this command:
debug packet display interface vNic_1 –n_src_host_1.1.1.1
NSX Troubleshooting Guide
VMware, Inc. 106
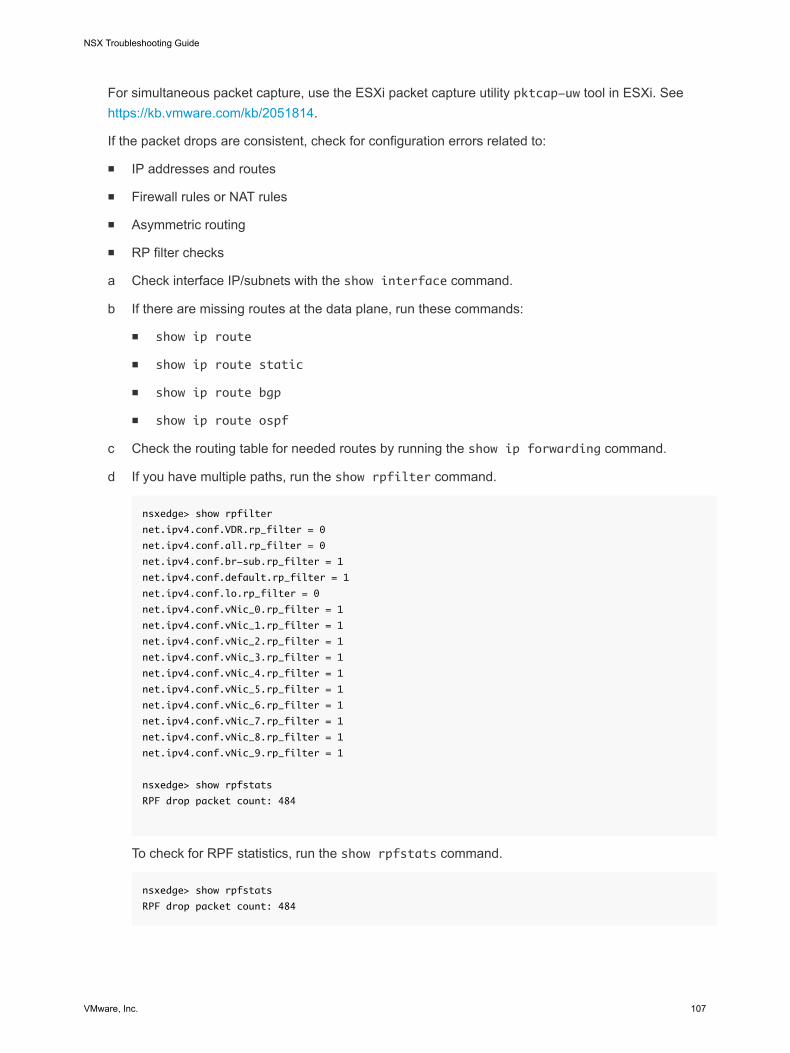
For simultaneous packet capture, use the ESXi packet capture utility pktcap-uw tool in ESXi. See https://kb.vmware.com/kb/2051814.
If the packet drops are consistent, check for configuration errors related to:
n IP addresses and routes
n Firewall rules or NAT rules
n Asymmetric routing
n RP filter checks
a Check interface IP/subnets with the show interface command.
b If there are missing routes at the data plane, run these commands:
n show ip route
n show ip route static
n show ip route bgp
n show ip route ospf
c Check the routing table for needed routes by running the show ip forwarding command.
d If you have multiple paths, run the show rpfilter command.
nsxedge> show rpfilter
net.ipv4.conf.VDR.rp_filter = 0
net.ipv4.conf.all.rp_filter = 0
net.ipv4.conf.br-sub.rp_filter = 1
net.ipv4.conf.default.rp_filter = 1
net.ipv4.conf.lo.rp_filter = 0
net.ipv4.conf.vNic_0.rp_filter = 1
net.ipv4.conf.vNic_1.rp_filter = 1
net.ipv4.conf.vNic_2.rp_filter = 1
net.ipv4.conf.vNic_3.rp_filter = 1
net.ipv4.conf.vNic_4.rp_filter = 1
net.ipv4.conf.vNic_5.rp_filter = 1
net.ipv4.conf.vNic_6.rp_filter = 1
net.ipv4.conf.vNic_7.rp_filter = 1
net.ipv4.conf.vNic_8.rp_filter = 1
net.ipv4.conf.vNic_9.rp_filter = 1
nsxedge> show rpfstats
RPF drop packet count: 484
To check for RPF statistics, run the show rpfstats command.
nsxedge> show rpfstats
RPF drop packet count: 484
NSX Troubleshooting Guide
VMware, Inc. 107
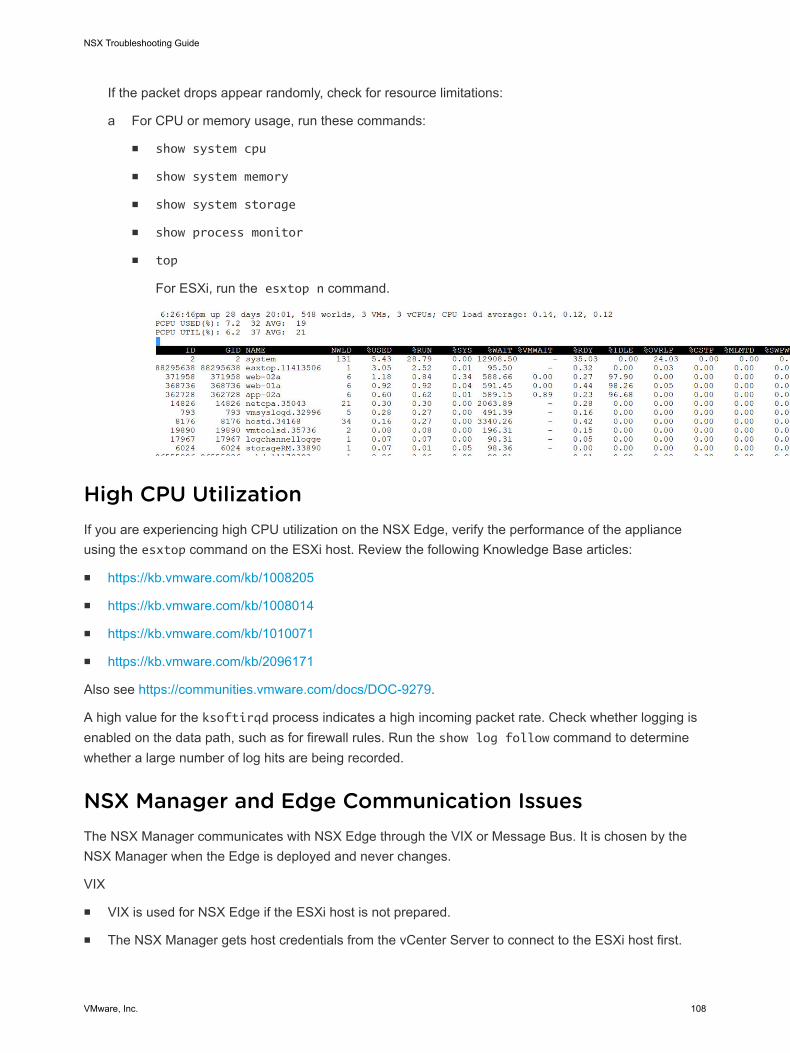
If the packet drops appear randomly, check for resource limitations:
a For CPU or memory usage, run these commands:
n show system cpu
n show system memory
n show system storage
n show process monitor
n top
For ESXi, run the esxtop n command.
High CPU UtilizationIf you are experiencing high CPU utilization on the NSX Edge, verify the performance of the applianceusing the esxtop command on the ESXi host. Review the following Knowledge Base articles:
n https://kb.vmware.com/kb/1008205
n https://kb.vmware.com/kb/1008014
n https://kb.vmware.com/kb/1010071
n https://kb.vmware.com/kb/2096171
Also see https://communities.vmware.com/docs/DOC-9279.
A high value for the ksoftirqd process indicates a high incoming packet rate. Check whether logging isenabled on the data path, such as for firewall rules. Run the show log follow command to determinewhether a large number of log hits are being recorded.
NSX Manager and Edge Communication IssuesThe NSX Manager communicates with NSX Edge through the VIX or Message Bus. It is chosen by theNSX Manager when the Edge is deployed and never changes.
VIX
n VIX is used for NSX Edge if the ESXi host is not prepared.
n The NSX Manager gets host credentials from the vCenter Server to connect to the ESXi host first.
NSX Troubleshooting Guide
VMware, Inc. 108
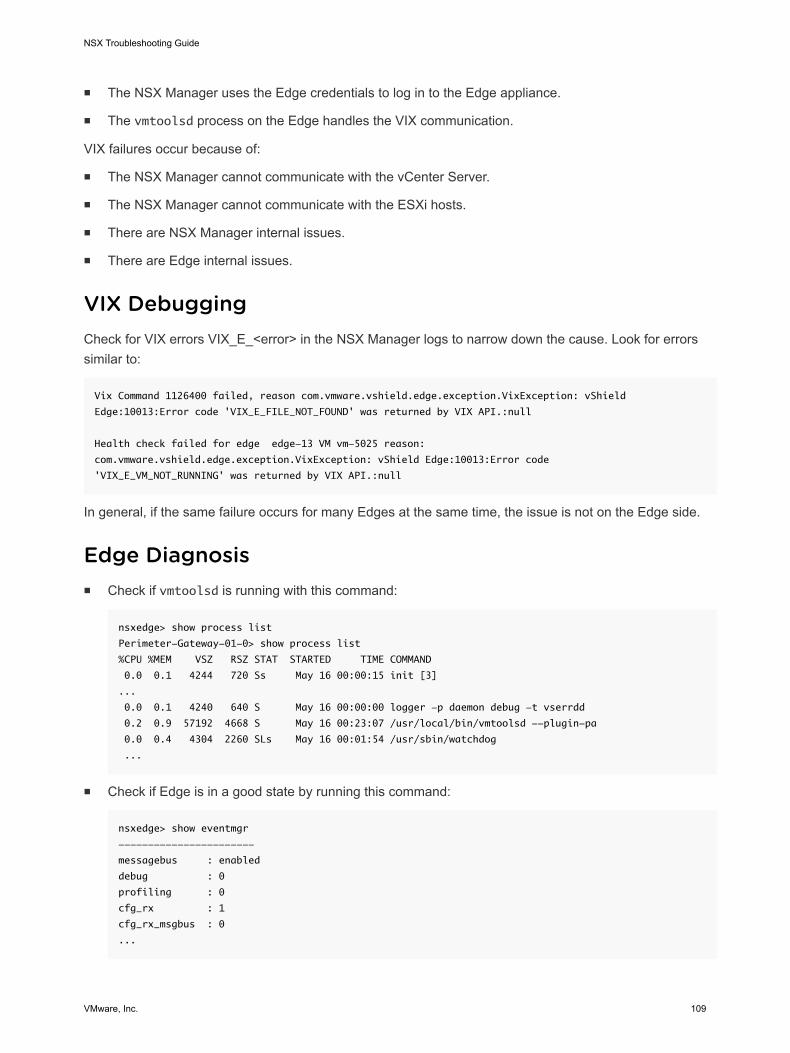
n The NSX Manager uses the Edge credentials to log in to the Edge appliance.
n The vmtoolsd process on the Edge handles the VIX communication.
VIX failures occur because of:
n The NSX Manager cannot communicate with the vCenter Server.
n The NSX Manager cannot communicate with the ESXi hosts.
n There are NSX Manager internal issues.
n There are Edge internal issues.
VIX DebuggingCheck for VIX errors VIX_E_<error> in the NSX Manager logs to narrow down the cause. Look for errorssimilar to:
Vix Command 1126400 failed, reason com.vmware.vshield.edge.exception.VixException: vShield
Edge:10013:Error code 'VIX_E_FILE_NOT_FOUND' was returned by VIX API.:null
Health check failed for edge edge-13 VM vm-5025 reason:
com.vmware.vshield.edge.exception.VixException: vShield Edge:10013:Error code
'VIX_E_VM_NOT_RUNNING' was returned by VIX API.:null
In general, if the same failure occurs for many Edges at the same time, the issue is not on the Edge side.
Edge Diagnosisn Check if vmtoolsd is running with this command:
nsxedge> show process list
Perimeter-Gateway-01-0> show process list
%CPU %MEM VSZ RSZ STAT STARTED TIME COMMAND
0.0 0.1 4244 720 Ss May 16 00:00:15 init [3]
...
0.0 0.1 4240 640 S May 16 00:00:00 logger -p daemon debug -t vserrdd
0.2 0.9 57192 4668 S May 16 00:23:07 /usr/local/bin/vmtoolsd --plugin-pa
0.0 0.4 4304 2260 SLs May 16 00:01:54 /usr/sbin/watchdog
...
n Check if Edge is in a good state by running this command:
nsxedge> show eventmgr
-----------------------
messagebus : enabled
debug : 0
profiling : 0
cfg_rx : 1
cfg_rx_msgbus : 0
...
NSX Troubleshooting Guide
VMware, Inc. 109
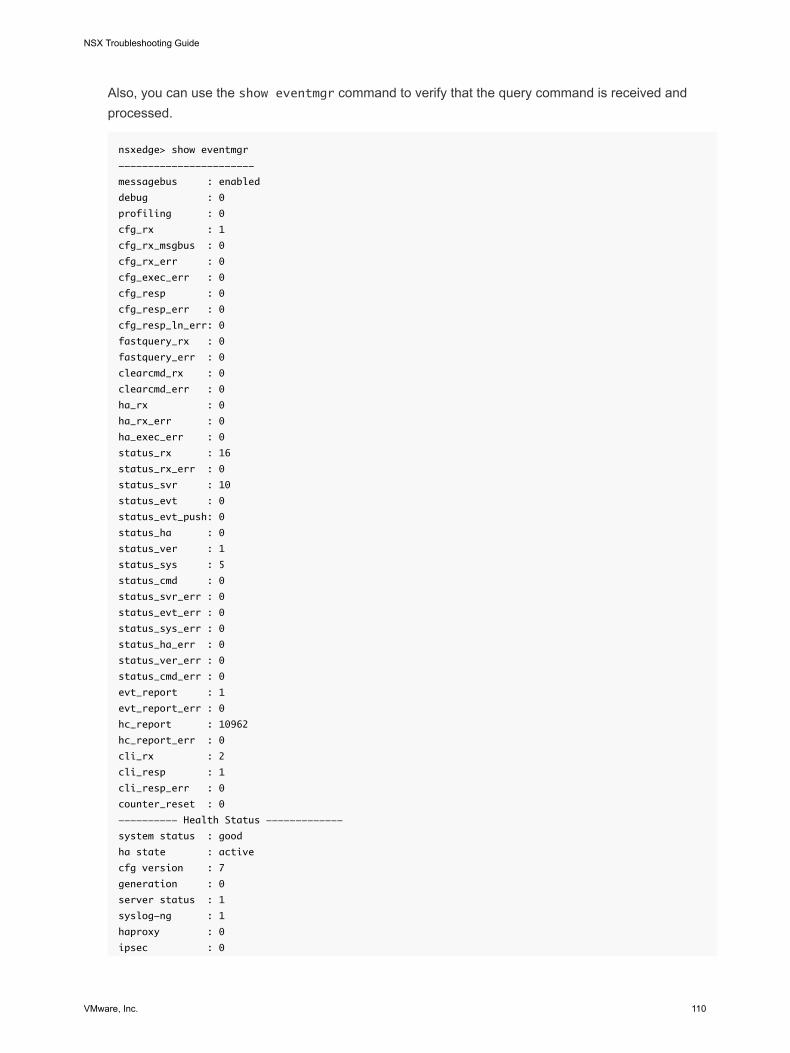
Also, you can use the show eventmgr command to verify that the query command is received andprocessed.
nsxedge> show eventmgr
-----------------------
messagebus : enabled
debug : 0
profiling : 0
cfg_rx : 1
cfg_rx_msgbus : 0
cfg_rx_err : 0
cfg_exec_err : 0
cfg_resp : 0
cfg_resp_err : 0
cfg_resp_ln_err: 0
fastquery_rx : 0
fastquery_err : 0
clearcmd_rx : 0
clearcmd_err : 0
ha_rx : 0
ha_rx_err : 0
ha_exec_err : 0
status_rx : 16
status_rx_err : 0
status_svr : 10
status_evt : 0
status_evt_push: 0
status_ha : 0
status_ver : 1
status_sys : 5
status_cmd : 0
status_svr_err : 0
status_evt_err : 0
status_sys_err : 0
status_ha_err : 0
status_ver_err : 0
status_cmd_err : 0
evt_report : 1
evt_report_err : 0
hc_report : 10962
hc_report_err : 0
cli_rx : 2
cli_resp : 1
cli_resp_err : 0
counter_reset : 0
---------- Health Status -------------
system status : good
ha state : active
cfg version : 7
generation : 0
server status : 1
syslog-ng : 1
haproxy : 0
ipsec : 0
NSX Troubleshooting Guide
VMware, Inc. 110
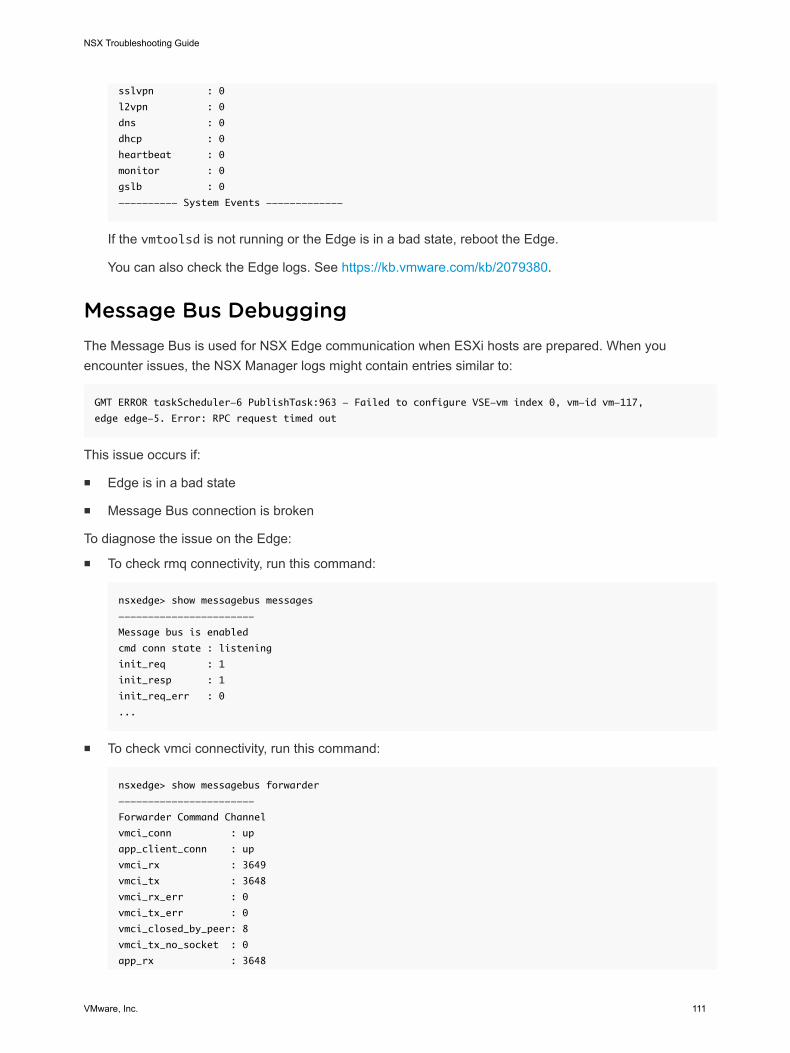
sslvpn : 0
l2vpn : 0
dns : 0
dhcp : 0
heartbeat : 0
monitor : 0
gslb : 0
---------- System Events -------------
If the vmtoolsd is not running or the Edge is in a bad state, reboot the Edge.
You can also check the Edge logs. See https://kb.vmware.com/kb/2079380.
Message Bus DebuggingThe Message Bus is used for NSX Edge communication when ESXi hosts are prepared. When youencounter issues, the NSX Manager logs might contain entries similar to:
GMT ERROR taskScheduler-6 PublishTask:963 - Failed to configure VSE-vm index 0, vm-id vm-117,
edge edge-5. Error: RPC request timed out
This issue occurs if:
n Edge is in a bad state
n Message Bus connection is broken
To diagnose the issue on the Edge:
n To check rmq connectivity, run this command:
nsxedge> show messagebus messages
-----------------------
Message bus is enabled
cmd conn state : listening
init_req : 1
init_resp : 1
init_req_err : 0
...
n To check vmci connectivity, run this command:
nsxedge> show messagebus forwarder
-----------------------
Forwarder Command Channel
vmci_conn : up
app_client_conn : up
vmci_rx : 3649
vmci_tx : 3648
vmci_rx_err : 0
vmci_tx_err : 0
vmci_closed_by_peer: 8
vmci_tx_no_socket : 0
app_rx : 3648
NSX Troubleshooting Guide
VMware, Inc. 111
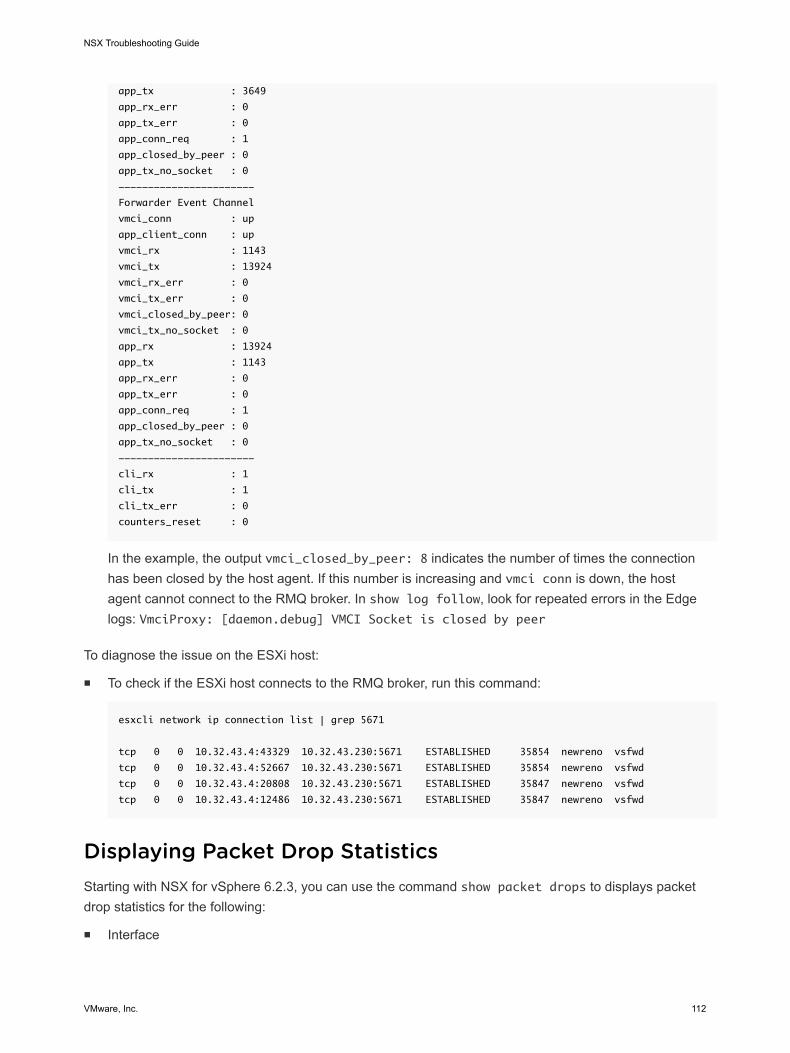
app_tx : 3649
app_rx_err : 0
app_tx_err : 0
app_conn_req : 1
app_closed_by_peer : 0
app_tx_no_socket : 0
-----------------------
Forwarder Event Channel
vmci_conn : up
app_client_conn : up
vmci_rx : 1143
vmci_tx : 13924
vmci_rx_err : 0
vmci_tx_err : 0
vmci_closed_by_peer: 0
vmci_tx_no_socket : 0
app_rx : 13924
app_tx : 1143
app_rx_err : 0
app_tx_err : 0
app_conn_req : 1
app_closed_by_peer : 0
app_tx_no_socket : 0
-----------------------
cli_rx : 1
cli_tx : 1
cli_tx_err : 0
counters_reset : 0
In the example, the output vmci_closed_by_peer: 8 indicates the number of times the connectionhas been closed by the host agent. If this number is increasing and vmci conn is down, the hostagent cannot connect to the RMQ broker. In show log follow, look for repeated errors in the Edgelogs: VmciProxy: [daemon.debug] VMCI Socket is closed by peer
To diagnose the issue on the ESXi host:
n To check if the ESXi host connects to the RMQ broker, run this command:
esxcli network ip connection list | grep 5671
tcp 0 0 10.32.43.4:43329 10.32.43.230:5671 ESTABLISHED 35854 newreno vsfwd
tcp 0 0 10.32.43.4:52667 10.32.43.230:5671 ESTABLISHED 35854 newreno vsfwd
tcp 0 0 10.32.43.4:20808 10.32.43.230:5671 ESTABLISHED 35847 newreno vsfwd
tcp 0 0 10.32.43.4:12486 10.32.43.230:5671 ESTABLISHED 35847 newreno vsfwd
Displaying Packet Drop StatisticsStarting with NSX for vSphere 6.2.3, you can use the command show packet drops to displays packetdrop statistics for the following:
n Interface
NSX Troubleshooting Guide
VMware, Inc. 112
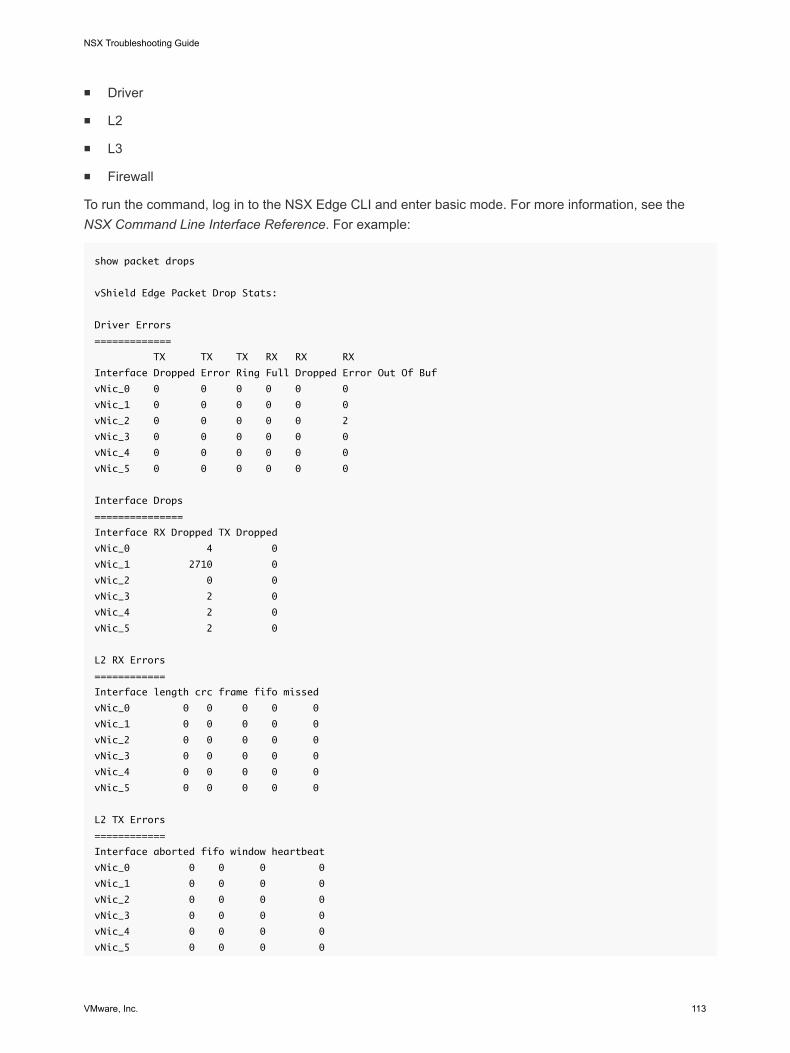
n Driver
n L2
n L3
n Firewall
To run the command, log in to the NSX Edge CLI and enter basic mode. For more information, see theNSX Command Line Interface Reference. For example:
show packet drops
vShield Edge Packet Drop Stats:
Driver Errors
=============
TX TX TX RX RX RX
Interface Dropped Error Ring Full Dropped Error Out Of Buf
vNic_0 0 0 0 0 0 0
vNic_1 0 0 0 0 0 0
vNic_2 0 0 0 0 0 2
vNic_3 0 0 0 0 0 0
vNic_4 0 0 0 0 0 0
vNic_5 0 0 0 0 0 0
Interface Drops
===============
Interface RX Dropped TX Dropped
vNic_0 4 0
vNic_1 2710 0
vNic_2 0 0
vNic_3 2 0
vNic_4 2 0
vNic_5 2 0
L2 RX Errors
============
Interface length crc frame fifo missed
vNic_0 0 0 0 0 0
vNic_1 0 0 0 0 0
vNic_2 0 0 0 0 0
vNic_3 0 0 0 0 0
vNic_4 0 0 0 0 0
vNic_5 0 0 0 0 0
L2 TX Errors
============
Interface aborted fifo window heartbeat
vNic_0 0 0 0 0
vNic_1 0 0 0 0
vNic_2 0 0 0 0
vNic_3 0 0 0 0
vNic_4 0 0 0 0
vNic_5 0 0 0 0
NSX Troubleshooting Guide
VMware, Inc. 113
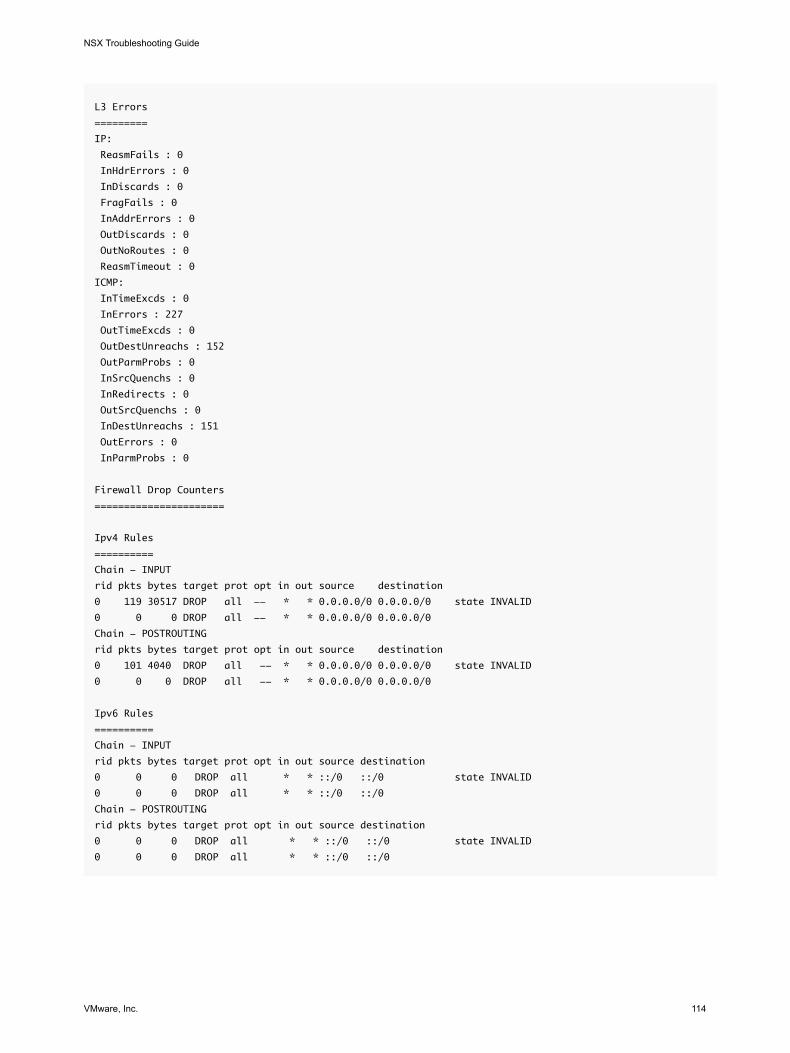
L3 Errors
=========
IP:
ReasmFails : 0
InHdrErrors : 0
InDiscards : 0
FragFails : 0
InAddrErrors : 0
OutDiscards : 0
OutNoRoutes : 0
ReasmTimeout : 0
ICMP:
InTimeExcds : 0
InErrors : 227
OutTimeExcds : 0
OutDestUnreachs : 152
OutParmProbs : 0
InSrcQuenchs : 0
InRedirects : 0
OutSrcQuenchs : 0
InDestUnreachs : 151
OutErrors : 0
InParmProbs : 0
Firewall Drop Counters
======================
Ipv4 Rules
==========
Chain - INPUT
rid pkts bytes target prot opt in out source destination
0 119 30517 DROP all -- * * 0.0.0.0/0 0.0.0.0/0 state INVALID
0 0 0 DROP all -- * * 0.0.0.0/0 0.0.0.0/0
Chain - POSTROUTING
rid pkts bytes target prot opt in out source destination
0 101 4040 DROP all -- * * 0.0.0.0/0 0.0.0.0/0 state INVALID
0 0 0 DROP all -- * * 0.0.0.0/0 0.0.0.0/0
Ipv6 Rules
==========
Chain - INPUT
rid pkts bytes target prot opt in out source destination
0 0 0 DROP all * * ::/0 ::/0 state INVALID
0 0 0 DROP all * * ::/0 ::/0
Chain - POSTROUTING
rid pkts bytes target prot opt in out source destination
0 0 0 DROP all * * ::/0 ::/0 state INVALID
0 0 0 DROP all * * ::/0 ::/0
NSX Troubleshooting Guide
VMware, Inc. 114
Expected Behavior When Managing NSX EdgeIn vSphere Web Client, when you configure L2 VPN on an ESX Edge and add, remove, or modify SiteConfiguration Details, this action will cause all existing connections to be disconnected andreconnected. This behavior is expected.
NSX Troubleshooting Guide
VMware, Inc. 115
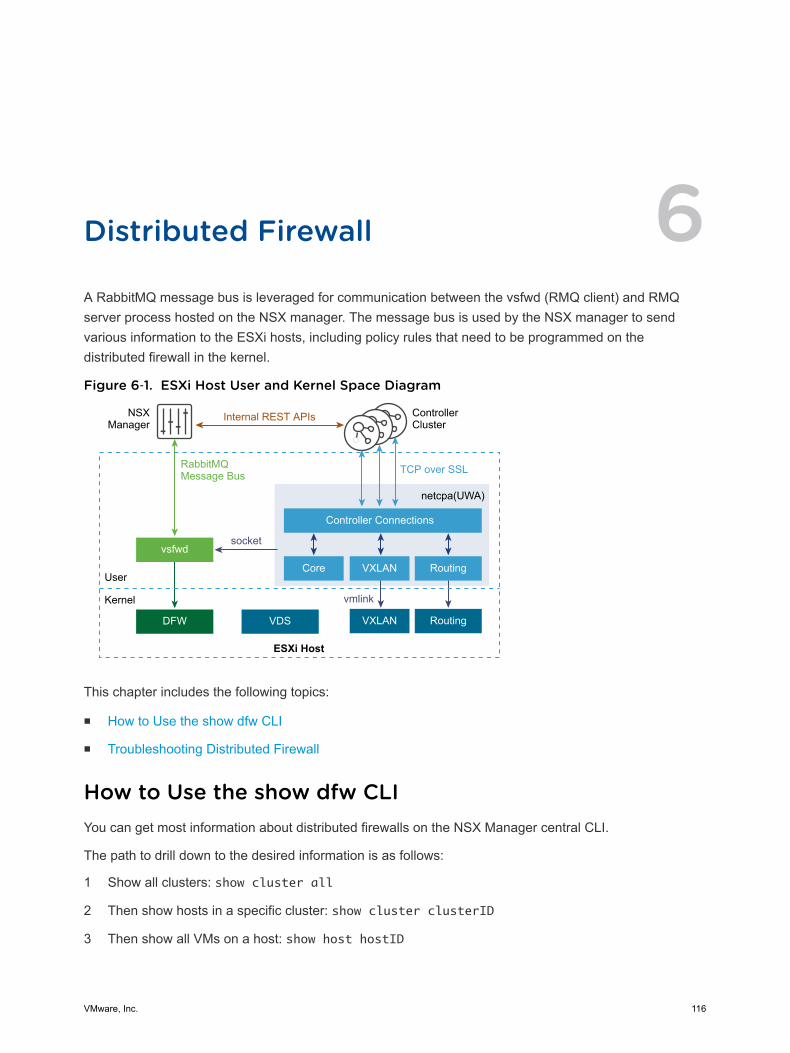
Distributed Firewall 6A RabbitMQ message bus is leveraged for communication between the vsfwd (RMQ client) and RMQserver process hosted on the NSX manager. The message bus is used by the NSX manager to sendvarious information to the ESXi hosts, including policy rules that need to be programmed on thedistributed firewall in the kernel.
Figure 6‑1. ESXi Host User and Kernel Space Diagram
NSXManager
ESXi Host
User
Kernel
ControllerCluster
TCP over SSLRabbitMQ Message Bus
Internal REST APIs
socket
vmlink
netcpa(UWA)
vsfwd
DFW VDS
Controller Connections
Core VXLAN Routing
VXLAN Routing
This chapter includes the following topics:
n How to Use the show dfw CLI
n Troubleshooting Distributed Firewall
How to Use the show dfw CLIYou can get most information about distributed firewalls on the NSX Manager central CLI.
The path to drill down to the desired information is as follows:
1 Show all clusters: show cluster all
2 Then show hosts in a specific cluster: show cluster clusterID
3 Then show all VMs on a host: show host hostID
VMware, Inc. 116
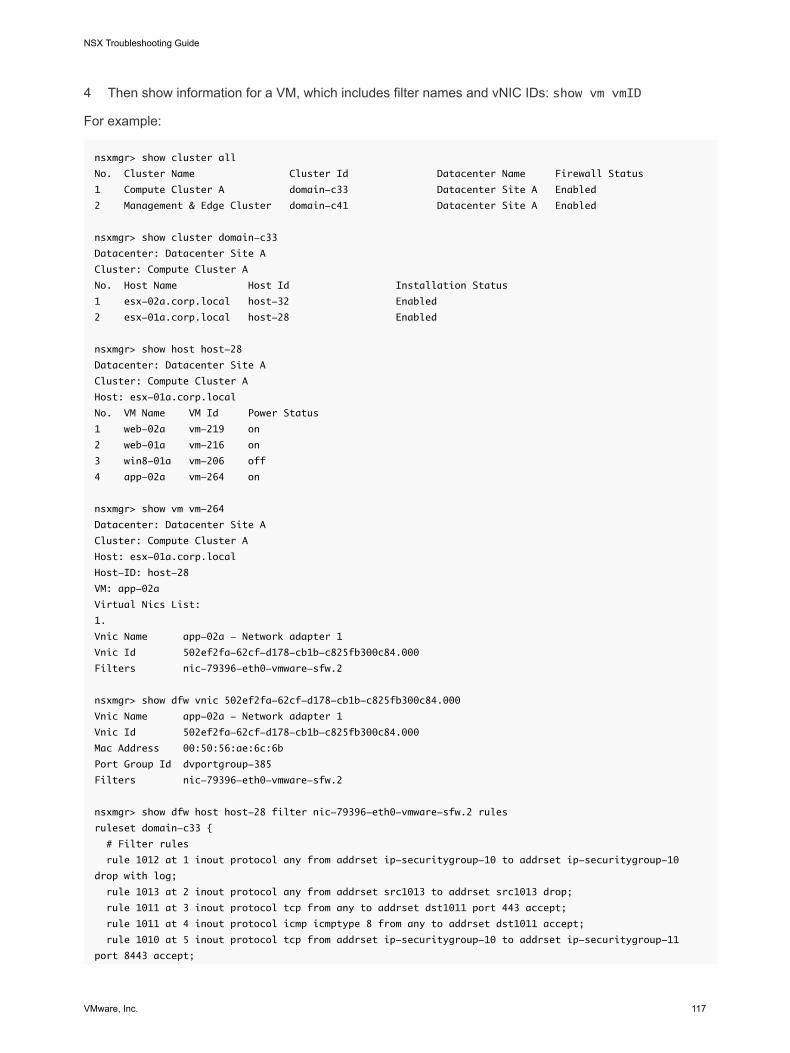
4 Then show information for a VM, which includes filter names and vNIC IDs: show vm vmID
For example:
nsxmgr> show cluster all
No. Cluster Name Cluster Id Datacenter Name Firewall Status
1 Compute Cluster A domain-c33 Datacenter Site A Enabled
2 Management & Edge Cluster domain-c41 Datacenter Site A Enabled
nsxmgr> show cluster domain-c33
Datacenter: Datacenter Site A
Cluster: Compute Cluster A
No. Host Name Host Id Installation Status
1 esx-02a.corp.local host-32 Enabled
2 esx-01a.corp.local host-28 Enabled
nsxmgr> show host host-28
Datacenter: Datacenter Site A
Cluster: Compute Cluster A
Host: esx-01a.corp.local
No. VM Name VM Id Power Status
1 web-02a vm-219 on
2 web-01a vm-216 on
3 win8-01a vm-206 off
4 app-02a vm-264 on
nsxmgr> show vm vm-264
Datacenter: Datacenter Site A
Cluster: Compute Cluster A
Host: esx-01a.corp.local
Host-ID: host-28
VM: app-02a
Virtual Nics List:
1.
Vnic Name app-02a - Network adapter 1
Vnic Id 502ef2fa-62cf-d178-cb1b-c825fb300c84.000
Filters nic-79396-eth0-vmware-sfw.2
nsxmgr> show dfw vnic 502ef2fa-62cf-d178-cb1b-c825fb300c84.000
Vnic Name app-02a - Network adapter 1
Vnic Id 502ef2fa-62cf-d178-cb1b-c825fb300c84.000
Mac Address 00:50:56:ae:6c:6b
Port Group Id dvportgroup-385
Filters nic-79396-eth0-vmware-sfw.2
nsxmgr> show dfw host host-28 filter nic-79396-eth0-vmware-sfw.2 rules
ruleset domain-c33 {
# Filter rules
rule 1012 at 1 inout protocol any from addrset ip-securitygroup-10 to addrset ip-securitygroup-10
drop with log;
rule 1013 at 2 inout protocol any from addrset src1013 to addrset src1013 drop;
rule 1011 at 3 inout protocol tcp from any to addrset dst1011 port 443 accept;
rule 1011 at 4 inout protocol icmp icmptype 8 from any to addrset dst1011 accept;
rule 1010 at 5 inout protocol tcp from addrset ip-securitygroup-10 to addrset ip-securitygroup-11
port 8443 accept;
NSX Troubleshooting Guide
VMware, Inc. 117
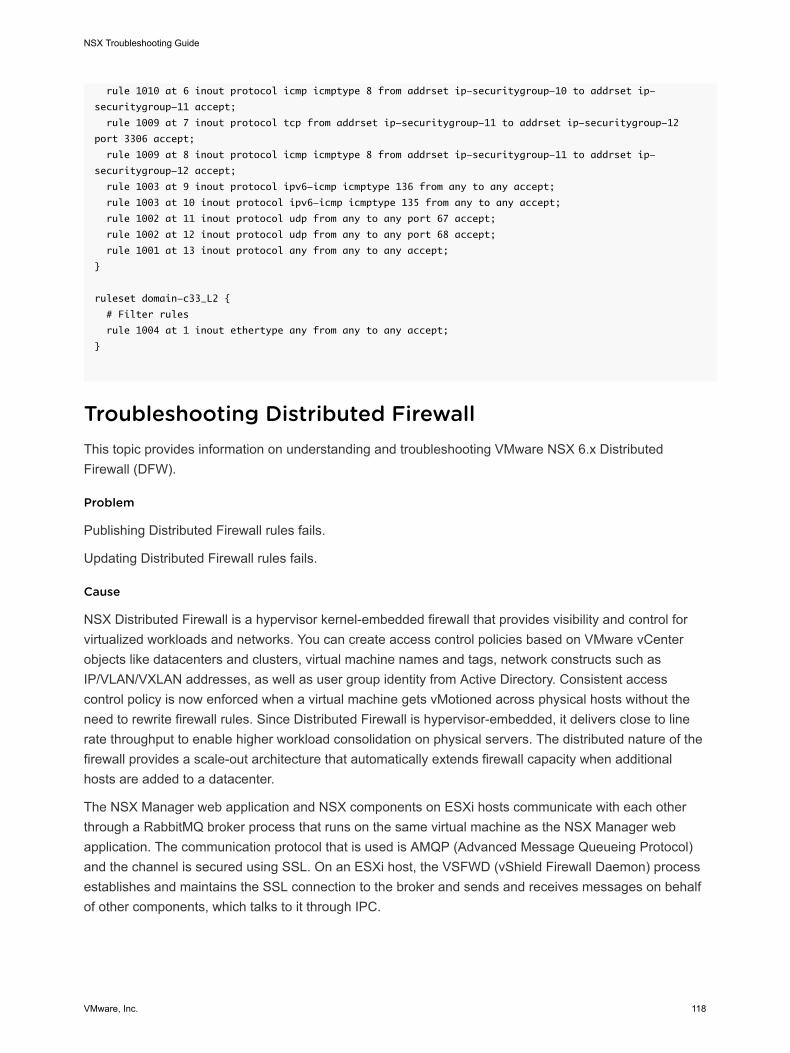
rule 1010 at 6 inout protocol icmp icmptype 8 from addrset ip-securitygroup-10 to addrset ip-
securitygroup-11 accept;
rule 1009 at 7 inout protocol tcp from addrset ip-securitygroup-11 to addrset ip-securitygroup-12
port 3306 accept;
rule 1009 at 8 inout protocol icmp icmptype 8 from addrset ip-securitygroup-11 to addrset ip-
securitygroup-12 accept;
rule 1003 at 9 inout protocol ipv6-icmp icmptype 136 from any to any accept;
rule 1003 at 10 inout protocol ipv6-icmp icmptype 135 from any to any accept;
rule 1002 at 11 inout protocol udp from any to any port 67 accept;
rule 1002 at 12 inout protocol udp from any to any port 68 accept;
rule 1001 at 13 inout protocol any from any to any accept;
}
ruleset domain-c33_L2 {
# Filter rules
rule 1004 at 1 inout ethertype any from any to any accept;
}
Troubleshooting Distributed FirewallThis topic provides information on understanding and troubleshooting VMware NSX 6.x DistributedFirewall (DFW).
Problem
Publishing Distributed Firewall rules fails.
Updating Distributed Firewall rules fails.
Cause
NSX Distributed Firewall is a hypervisor kernel-embedded firewall that provides visibility and control forvirtualized workloads and networks. You can create access control policies based on VMware vCenterobjects like datacenters and clusters, virtual machine names and tags, network constructs such asIP/VLAN/VXLAN addresses, as well as user group identity from Active Directory. Consistent accesscontrol policy is now enforced when a virtual machine gets vMotioned across physical hosts without theneed to rewrite firewall rules. Since Distributed Firewall is hypervisor-embedded, it delivers close to linerate throughput to enable higher workload consolidation on physical servers. The distributed nature of thefirewall provides a scale-out architecture that automatically extends firewall capacity when additionalhosts are added to a datacenter.
The NSX Manager web application and NSX components on ESXi hosts communicate with each otherthrough a RabbitMQ broker process that runs on the same virtual machine as the NSX Manager webapplication. The communication protocol that is used is AMQP (Advanced Message Queueing Protocol)and the channel is secured using SSL. On an ESXi host, the VSFWD (vShield Firewall Daemon) processestablishes and maintains the SSL connection to the broker and sends and receives messages on behalfof other components, which talks to it through IPC.
NSX Troubleshooting Guide
VMware, Inc. 118
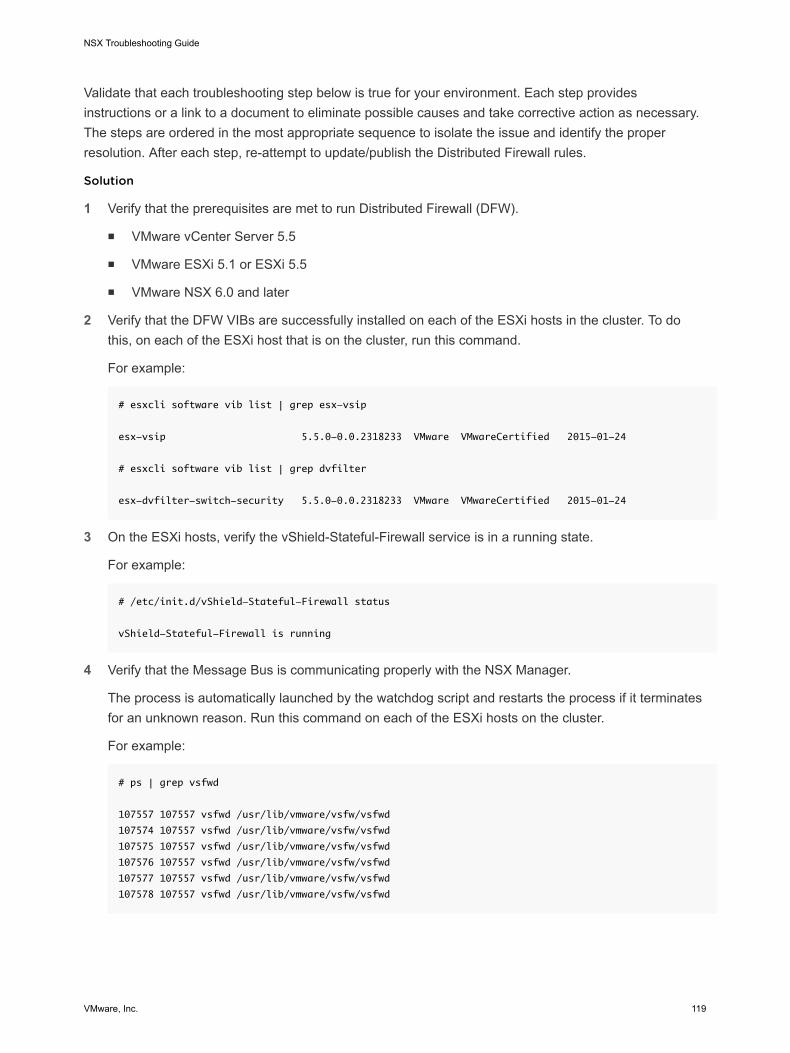
Validate that each troubleshooting step below is true for your environment. Each step providesinstructions or a link to a document to eliminate possible causes and take corrective action as necessary.The steps are ordered in the most appropriate sequence to isolate the issue and identify the properresolution. After each step, re-attempt to update/publish the Distributed Firewall rules.
Solution
1 Verify that the prerequisites are met to run Distributed Firewall (DFW).
n VMware vCenter Server 5.5
n VMware ESXi 5.1 or ESXi 5.5
n VMware NSX 6.0 and later
2 Verify that the DFW VIBs are successfully installed on each of the ESXi hosts in the cluster. To dothis, on each of the ESXi host that is on the cluster, run this command.
For example:
# esxcli software vib list | grep esx-vsip
esx-vsip 5.5.0-0.0.2318233 VMware VMwareCertified 2015-01-24
# esxcli software vib list | grep dvfilter
esx-dvfilter-switch-security 5.5.0-0.0.2318233 VMware VMwareCertified 2015-01-24
3 On the ESXi hosts, verify the vShield-Stateful-Firewall service is in a running state.
For example:
# /etc/init.d/vShield-Stateful-Firewall status
vShield-Stateful-Firewall is running
4 Verify that the Message Bus is communicating properly with the NSX Manager.
The process is automatically launched by the watchdog script and restarts the process if it terminatesfor an unknown reason. Run this command on each of the ESXi hosts on the cluster.
For example:
# ps | grep vsfwd
107557 107557 vsfwd /usr/lib/vmware/vsfw/vsfwd
107574 107557 vsfwd /usr/lib/vmware/vsfw/vsfwd
107575 107557 vsfwd /usr/lib/vmware/vsfw/vsfwd
107576 107557 vsfwd /usr/lib/vmware/vsfw/vsfwd
107577 107557 vsfwd /usr/lib/vmware/vsfw/vsfwd
107578 107557 vsfwd /usr/lib/vmware/vsfw/vsfwd
NSX Troubleshooting Guide
VMware, Inc. 119
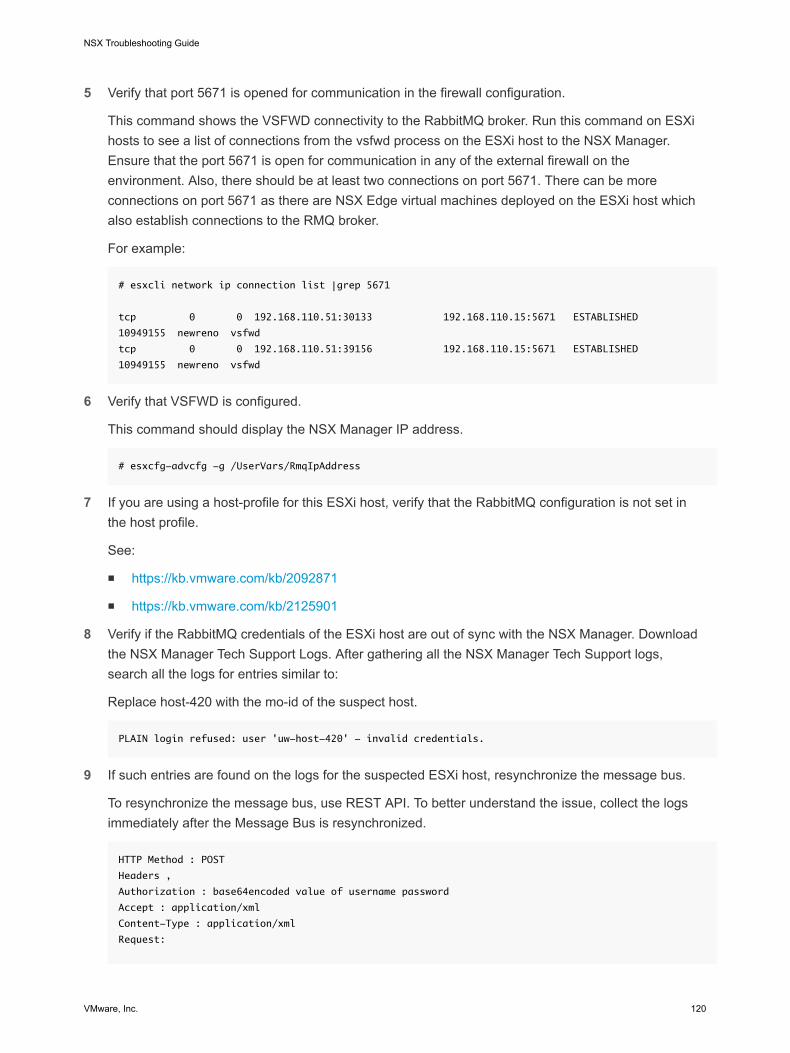
5 Verify that port 5671 is opened for communication in the firewall configuration.
This command shows the VSFWD connectivity to the RabbitMQ broker. Run this command on ESXihosts to see a list of connections from the vsfwd process on the ESXi host to the NSX Manager.Ensure that the port 5671 is open for communication in any of the external firewall on theenvironment. Also, there should be at least two connections on port 5671. There can be moreconnections on port 5671 as there are NSX Edge virtual machines deployed on the ESXi host whichalso establish connections to the RMQ broker.
For example:
# esxcli network ip connection list |grep 5671
tcp 0 0 192.168.110.51:30133 192.168.110.15:5671 ESTABLISHED
10949155 newreno vsfwd
tcp 0 0 192.168.110.51:39156 192.168.110.15:5671 ESTABLISHED
10949155 newreno vsfwd
6 Verify that VSFWD is configured.
This command should display the NSX Manager IP address.
# esxcfg-advcfg -g /UserVars/RmqIpAddress
7 If you are using a host-profile for this ESXi host, verify that the RabbitMQ configuration is not set inthe host profile.
See:
n https://kb.vmware.com/kb/2092871
n https://kb.vmware.com/kb/2125901
8 Verify if the RabbitMQ credentials of the ESXi host are out of sync with the NSX Manager. Downloadthe NSX Manager Tech Support Logs. After gathering all the NSX Manager Tech Support logs,search all the logs for entries similar to:
Replace host-420 with the mo-id of the suspect host.
PLAIN login refused: user 'uw-host-420' - invalid credentials.
9 If such entries are found on the logs for the suspected ESXi host, resynchronize the message bus.
To resynchronize the message bus, use REST API. To better understand the issue, collect the logsimmediately after the Message Bus is resynchronized.
HTTP Method : POST
Headers ,
Authorization : base64encoded value of username password
Accept : application/xml
Content-Type : application/xml
Request:
NSX Troubleshooting Guide
VMware, Inc. 120
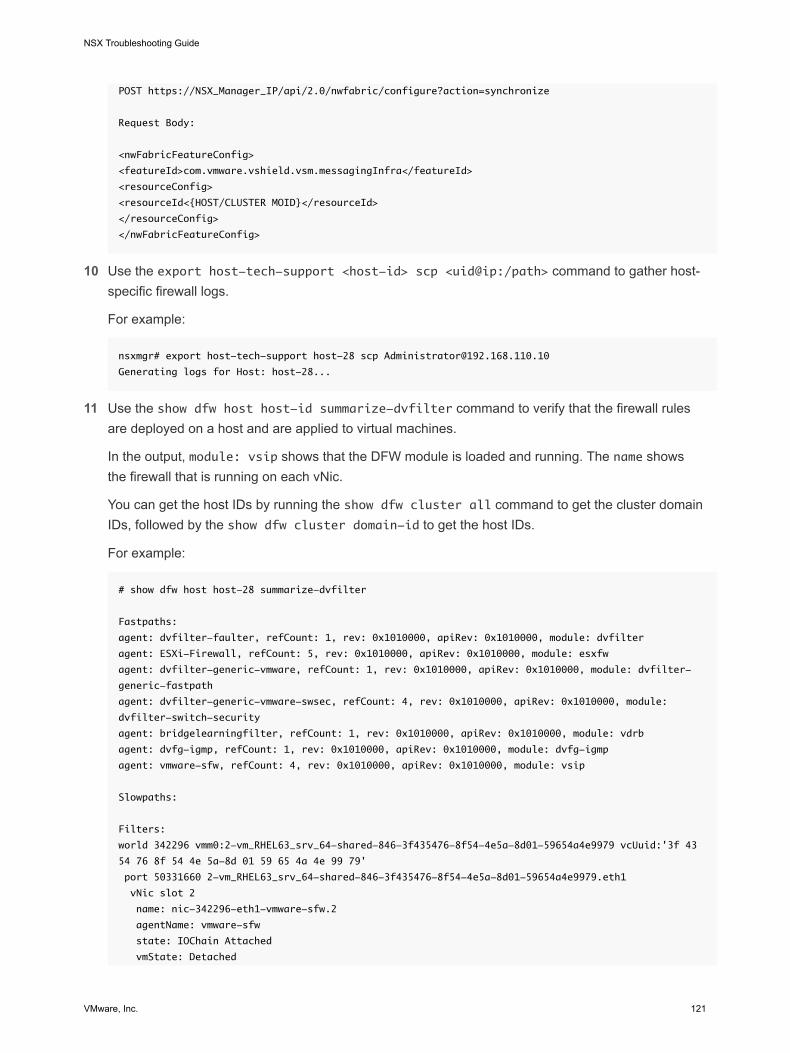
POST https://NSX_Manager_IP/api/2.0/nwfabric/configure?action=synchronize
Request Body:
<nwFabricFeatureConfig>
<featureId>com.vmware.vshield.vsm.messagingInfra</featureId>
<resourceConfig>
<resourceId<{HOST/CLUSTER MOID}</resourceId>
</resourceConfig>
</nwFabricFeatureConfig>
10 Use the export host-tech-support <host-id> scp <uid@ip:/path> command to gather host-specific firewall logs.
For example:
nsxmgr# export host-tech-support host-28 scp [email protected]
Generating logs for Host: host-28...
11 Use the show dfw host host-id summarize-dvfilter command to verify that the firewall rulesare deployed on a host and are applied to virtual machines.
In the output, module: vsip shows that the DFW module is loaded and running. The name showsthe firewall that is running on each vNic.
You can get the host IDs by running the show dfw cluster all command to get the cluster domainIDs, followed by the show dfw cluster domain-id to get the host IDs.
For example:
# show dfw host host-28 summarize-dvfilter
Fastpaths:
agent: dvfilter-faulter, refCount: 1, rev: 0x1010000, apiRev: 0x1010000, module: dvfilter
agent: ESXi-Firewall, refCount: 5, rev: 0x1010000, apiRev: 0x1010000, module: esxfw
agent: dvfilter-generic-vmware, refCount: 1, rev: 0x1010000, apiRev: 0x1010000, module: dvfilter-
generic-fastpath
agent: dvfilter-generic-vmware-swsec, refCount: 4, rev: 0x1010000, apiRev: 0x1010000, module:
dvfilter-switch-security
agent: bridgelearningfilter, refCount: 1, rev: 0x1010000, apiRev: 0x1010000, module: vdrb
agent: dvfg-igmp, refCount: 1, rev: 0x1010000, apiRev: 0x1010000, module: dvfg-igmp
agent: vmware-sfw, refCount: 4, rev: 0x1010000, apiRev: 0x1010000, module: vsip
Slowpaths:
Filters:
world 342296 vmm0:2-vm_RHEL63_srv_64-shared-846-3f435476-8f54-4e5a-8d01-59654a4e9979 vcUuid:'3f 43
54 76 8f 54 4e 5a-8d 01 59 65 4a 4e 99 79'
port 50331660 2-vm_RHEL63_srv_64-shared-846-3f435476-8f54-4e5a-8d01-59654a4e9979.eth1
vNic slot 2
name: nic-342296-eth1-vmware-sfw.2
agentName: vmware-sfw
state: IOChain Attached
vmState: Detached
NSX Troubleshooting Guide
VMware, Inc. 121
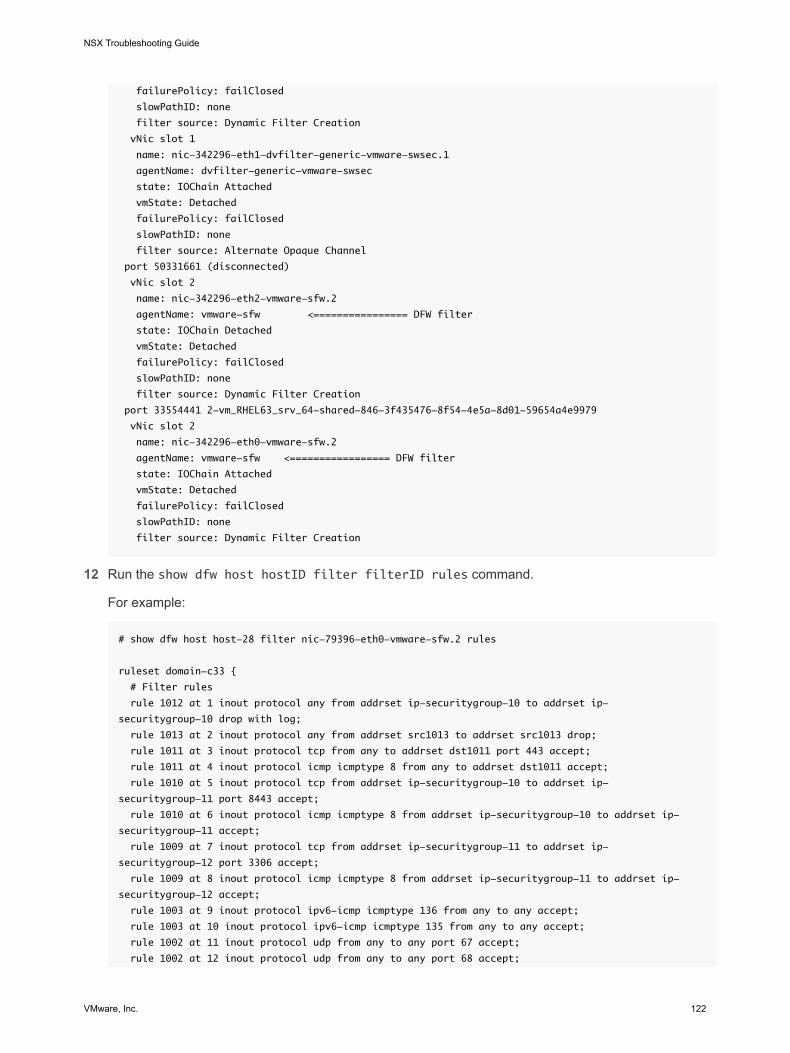
failurePolicy: failClosed
slowPathID: none
filter source: Dynamic Filter Creation
vNic slot 1
name: nic-342296-eth1-dvfilter-generic-vmware-swsec.1
agentName: dvfilter-generic-vmware-swsec
state: IOChain Attached
vmState: Detached
failurePolicy: failClosed
slowPathID: none
filter source: Alternate Opaque Channel
port 50331661 (disconnected)
vNic slot 2
name: nic-342296-eth2-vmware-sfw.2
agentName: vmware-sfw <================ DFW filter
state: IOChain Detached
vmState: Detached
failurePolicy: failClosed
slowPathID: none
filter source: Dynamic Filter Creation
port 33554441 2-vm_RHEL63_srv_64-shared-846-3f435476-8f54-4e5a-8d01-59654a4e9979
vNic slot 2
name: nic-342296-eth0-vmware-sfw.2
agentName: vmware-sfw <================= DFW filter
state: IOChain Attached
vmState: Detached
failurePolicy: failClosed
slowPathID: none
filter source: Dynamic Filter Creation
12 Run the show dfw host hostID filter filterID rules command.
For example:
# show dfw host host-28 filter nic-79396-eth0-vmware-sfw.2 rules
ruleset domain-c33 {
# Filter rules
rule 1012 at 1 inout protocol any from addrset ip-securitygroup-10 to addrset ip-
securitygroup-10 drop with log;
rule 1013 at 2 inout protocol any from addrset src1013 to addrset src1013 drop;
rule 1011 at 3 inout protocol tcp from any to addrset dst1011 port 443 accept;
rule 1011 at 4 inout protocol icmp icmptype 8 from any to addrset dst1011 accept;
rule 1010 at 5 inout protocol tcp from addrset ip-securitygroup-10 to addrset ip-
securitygroup-11 port 8443 accept;
rule 1010 at 6 inout protocol icmp icmptype 8 from addrset ip-securitygroup-10 to addrset ip-
securitygroup-11 accept;
rule 1009 at 7 inout protocol tcp from addrset ip-securitygroup-11 to addrset ip-
securitygroup-12 port 3306 accept;
rule 1009 at 8 inout protocol icmp icmptype 8 from addrset ip-securitygroup-11 to addrset ip-
securitygroup-12 accept;
rule 1003 at 9 inout protocol ipv6-icmp icmptype 136 from any to any accept;
rule 1003 at 10 inout protocol ipv6-icmp icmptype 135 from any to any accept;
rule 1002 at 11 inout protocol udp from any to any port 67 accept;
rule 1002 at 12 inout protocol udp from any to any port 68 accept;
NSX Troubleshooting Guide
VMware, Inc. 122
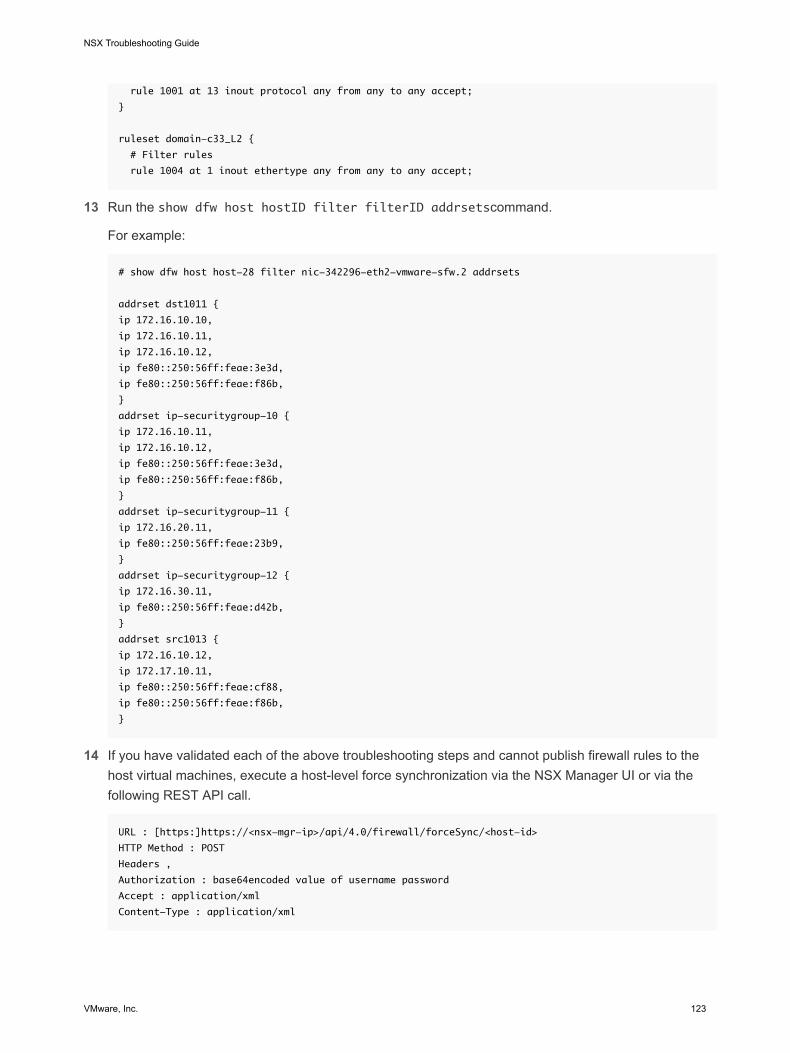
rule 1001 at 13 inout protocol any from any to any accept;
}
ruleset domain-c33_L2 {
# Filter rules
rule 1004 at 1 inout ethertype any from any to any accept;
13 Run the show dfw host hostID filter filterID addrsetscommand.
For example:
# show dfw host host-28 filter nic-342296-eth2-vmware-sfw.2 addrsets
addrset dst1011 {
ip 172.16.10.10,
ip 172.16.10.11,
ip 172.16.10.12,
ip fe80::250:56ff:feae:3e3d,
ip fe80::250:56ff:feae:f86b,
}
addrset ip-securitygroup-10 {
ip 172.16.10.11,
ip 172.16.10.12,
ip fe80::250:56ff:feae:3e3d,
ip fe80::250:56ff:feae:f86b,
}
addrset ip-securitygroup-11 {
ip 172.16.20.11,
ip fe80::250:56ff:feae:23b9,
}
addrset ip-securitygroup-12 {
ip 172.16.30.11,
ip fe80::250:56ff:feae:d42b,
}
addrset src1013 {
ip 172.16.10.12,
ip 172.17.10.11,
ip fe80::250:56ff:feae:cf88,
ip fe80::250:56ff:feae:f86b,
}
14 If you have validated each of the above troubleshooting steps and cannot publish firewall rules to thehost virtual machines, execute a host-level force synchronization via the NSX Manager UI or via thefollowing REST API call.
URL : [https:]https://<nsx-mgr-ip>/api/4.0/firewall/forceSync/<host-id>
HTTP Method : POST
Headers ,
Authorization : base64encoded value of username password
Accept : application/xml
Content-Type : application/xml
NSX Troubleshooting Guide
VMware, Inc. 123
Notes:
n Ensure that VMware Tools is running on the virtual machines if firewall rules do not use IP addresses.For more information, see https://kb.vmware.com/kb/2084048.
VMware NSX 6.2.0 introduced the option to discover the virtual machine IP address using DHCPsnooping or ARP snooping. These new discovery mechanisms enable NSX to enforce IP address-based security rules on virtual machines that do not have VMware Tools installed. For moreinformation, see the NSX 6.2.0 Release Notes.
DFW is activated as soon as the host preparation process is completed. If a virtual machine needs noDFW service at all, it can be added in the exclusion list functionality (by default, NSX Manager, NSXControllers and Edge Services Gateways are automatically excluded from DFW function). There is apossibility that the vCenter Server access gets blocked after creating a Deny All rule in DFW. Formore information, see https://kb.vmware.com/kb/2079620.
n When troubleshooting VMware NSX 6.x Distributed Firewall (DFW) with VMware Technical Support,these are required:
n Output of the command show dfw host hostID summarize-dvfilter on each of the ESXihost on the cluster.
n Distributed Firewall Configuration from the Networking and Security > Firewall > General taband click Export Configuration. This exports the Distributed Firewall configuration to an XMLformat.
n NSX Manager logs. For more information, see https://kb.vmware.com/kb/2074678.
n vCenter Server logs. For more information, see https://kb.vmware.com/kb/1011641.
NSX Troubleshooting Guide
VMware, Inc. 124
Load Balancing 7The NSX Edge load balancer enables network traffic to follow multiple paths to a specific destination. Itdistributes incoming service requests evenly among multiple servers in such a way that the loaddistribution is transparent to users. There are two types of load balancing services to configure in NSX, aone-armed mode, also known as a proxy mode, or the Inline mode, otherwise known as the transparentmode.
NSX load balancing features are as follows:
n Protocols: TCP, HTTP, HTTPS
n Algorithms: Weighted round robin, IP hash, URI, least connection
n SSL termination with AES-NI acceleration
n SSL bridging (cient-side SSL + server-side SSL)
n SSL certificates management
n X-header forwarding for client identification
n L4/L7 transparent mode
n Connection throttling
n Enable/disable individual servers (pool members) for maintenance
n Health check methods (TCP, HTTP, HTTPS)
n Enhanced health check monitor
n Persistence/sticky methods: SourceIP, MSRDP, COOKIE, SSLSESSIONID
n One-arm mode
n URL rewrite and redirection
n Application rules for iRule type traffic shaping or content switching
n HA session sticky support for L7 proxy load balancing
n IPv6 support
n Enhanced load balancer CLI for troubleshooting
n Available on all flavors of Edge
VMware, Inc. 125
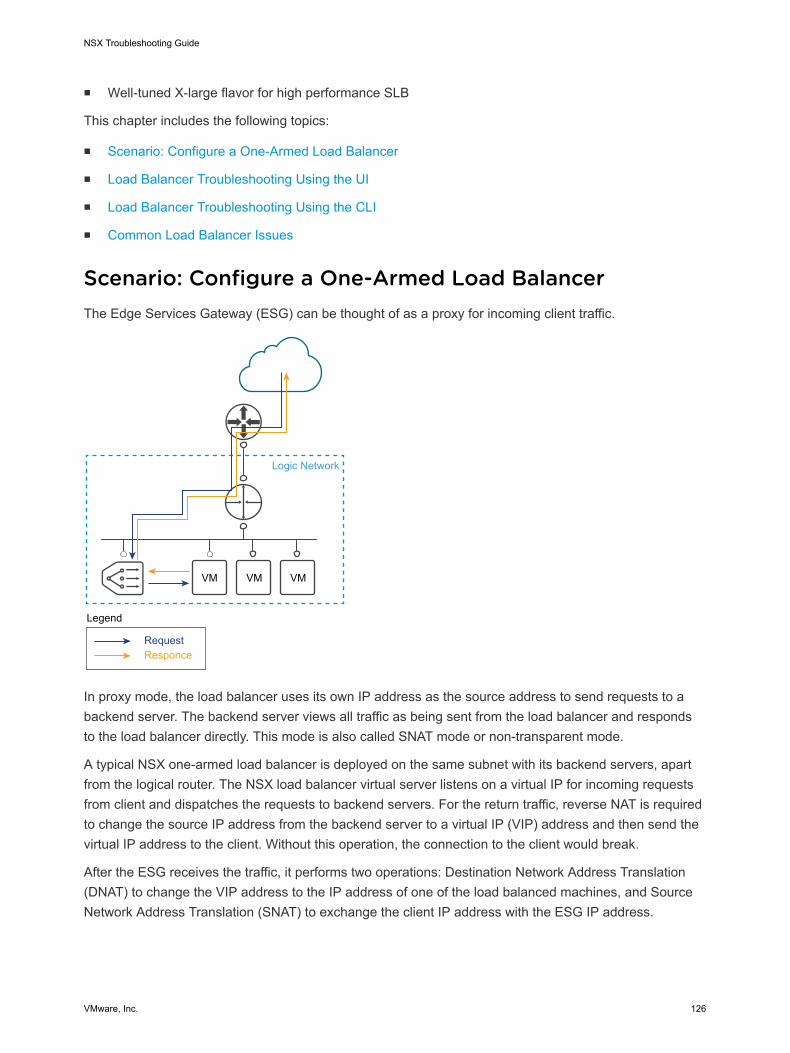
n Well-tuned X-large flavor for high performance SLB
This chapter includes the following topics:
n Scenario: Configure a One-Armed Load Balancer
n Load Balancer Troubleshooting Using the UI
n Load Balancer Troubleshooting Using the CLI
n Common Load Balancer Issues
Scenario: Configure a One-Armed Load BalancerThe Edge Services Gateway (ESG) can be thought of as a proxy for incoming client traffic.
VM VM VM
Legend
Logic Network
RequestResponce
In proxy mode, the load balancer uses its own IP address as the source address to send requests to abackend server. The backend server views all traffic as being sent from the load balancer and respondsto the load balancer directly. This mode is also called SNAT mode or non-transparent mode.
A typical NSX one-armed load balancer is deployed on the same subnet with its backend servers, apartfrom the logical router. The NSX load balancer virtual server listens on a virtual IP for incoming requestsfrom client and dispatches the requests to backend servers. For the return traffic, reverse NAT is requiredto change the source IP address from the backend server to a virtual IP (VIP) address and then send thevirtual IP address to the client. Without this operation, the connection to the client would break.
After the ESG receives the traffic, it performs two operations: Destination Network Address Translation(DNAT) to change the VIP address to the IP address of one of the load balanced machines, and SourceNetwork Address Translation (SNAT) to exchange the client IP address with the ESG IP address.
NSX Troubleshooting Guide
VMware, Inc. 126
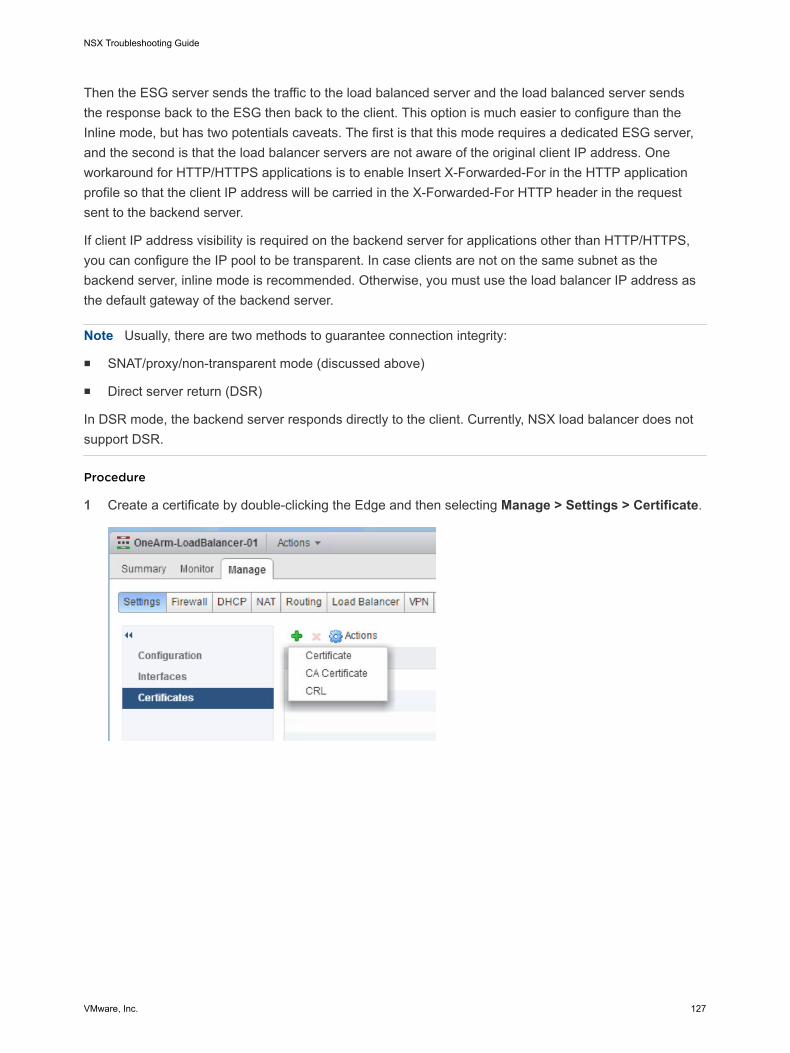
Then the ESG server sends the traffic to the load balanced server and the load balanced server sendsthe response back to the ESG then back to the client. This option is much easier to configure than theInline mode, but has two potentials caveats. The first is that this mode requires a dedicated ESG server,and the second is that the load balancer servers are not aware of the original client IP address. Oneworkaround for HTTP/HTTPS applications is to enable Insert X-Forwarded-For in the HTTP applicationprofile so that the client IP address will be carried in the X-Forwarded-For HTTP header in the requestsent to the backend server.
If client IP address visibility is required on the backend server for applications other than HTTP/HTTPS,you can configure the IP pool to be transparent. In case clients are not on the same subnet as thebackend server, inline mode is recommended. Otherwise, you must use the load balancer IP address asthe default gateway of the backend server.
Note Usually, there are two methods to guarantee connection integrity:
n SNAT/proxy/non-transparent mode (discussed above)
n Direct server return (DSR)
In DSR mode, the backend server responds directly to the client. Currently, NSX load balancer does notsupport DSR.
Procedure
1 Create a certificate by double-clicking the Edge and then selecting Manage > Settings > Certificate.
NSX Troubleshooting Guide
VMware, Inc. 127
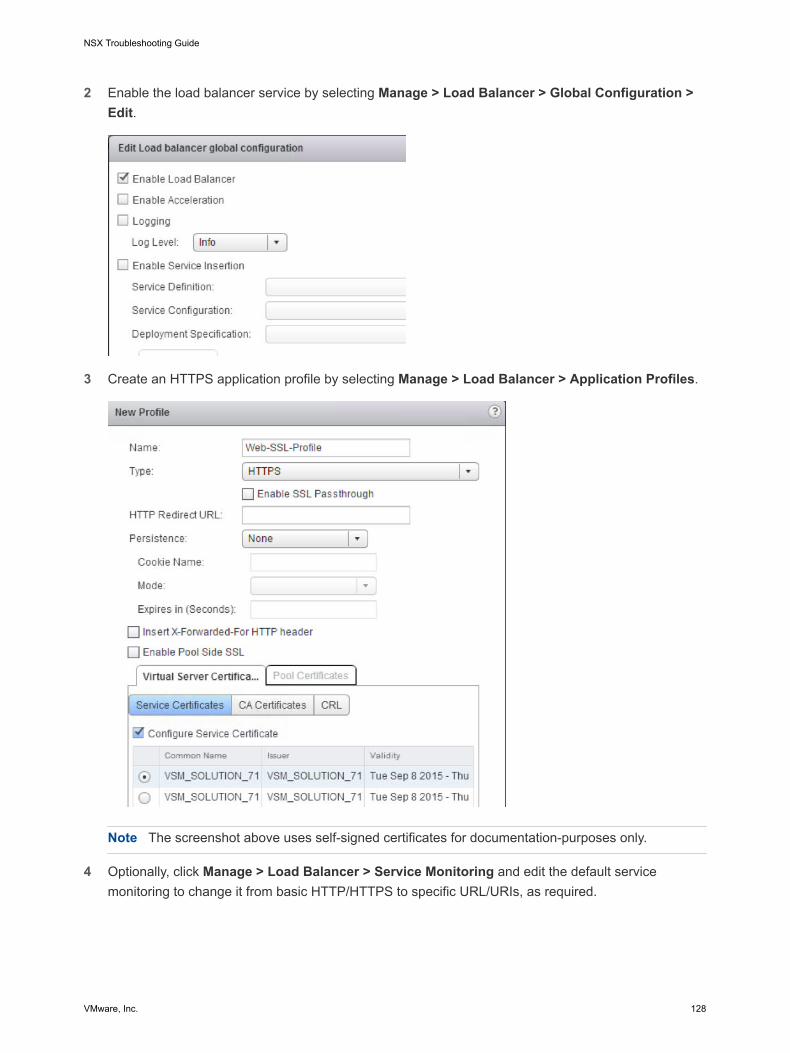
2 Enable the load balancer service by selecting Manage > Load Balancer > Global Configuration >Edit.
3 Create an HTTPS application profile by selecting Manage > Load Balancer > Application Profiles.
Note The screenshot above uses self-signed certificates for documentation-purposes only.
4 Optionally, click Manage > Load Balancer > Service Monitoring and edit the default servicemonitoring to change it from basic HTTP/HTTPS to specific URL/URIs, as required.
NSX Troubleshooting Guide
VMware, Inc. 128
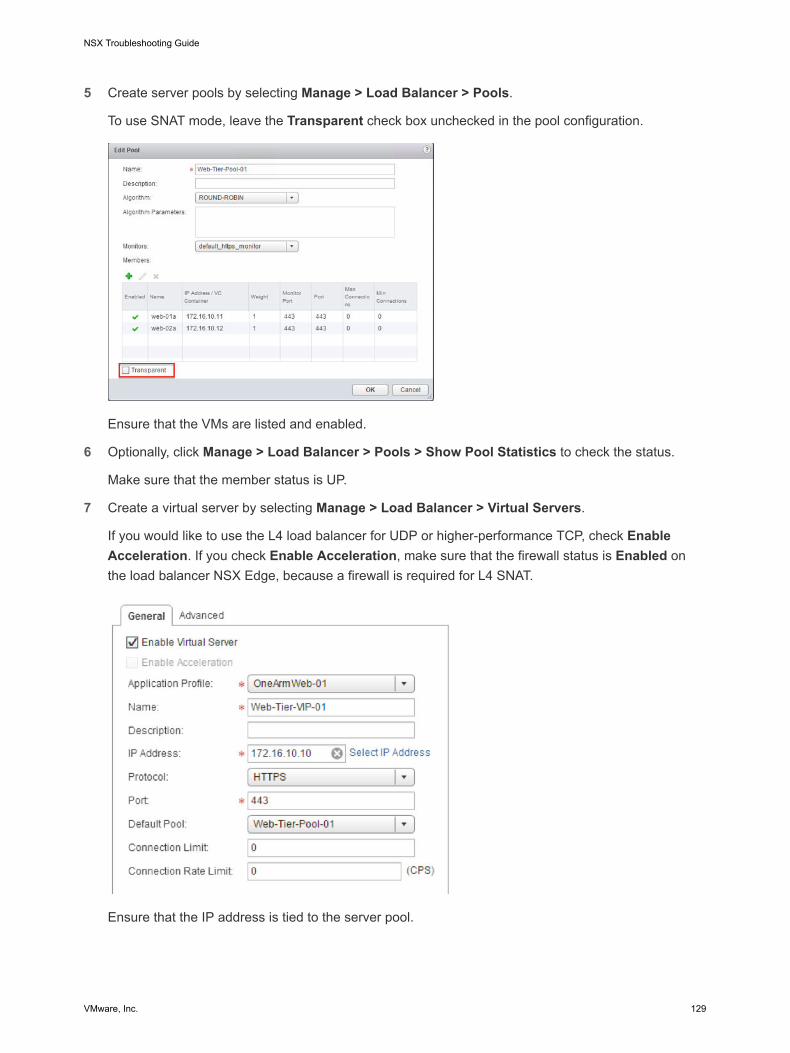
5 Create server pools by selecting Manage > Load Balancer > Pools.
To use SNAT mode, leave the Transparent check box unchecked in the pool configuration.
Ensure that the VMs are listed and enabled.
6 Optionally, click Manage > Load Balancer > Pools > Show Pool Statistics to check the status.
Make sure that the member status is UP.
7 Create a virtual server by selecting Manage > Load Balancer > Virtual Servers.
If you would like to use the L4 load balancer for UDP or higher-performance TCP, check EnableAcceleration. If you check Enable Acceleration, make sure that the firewall status is Enabled onthe load balancer NSX Edge, because a firewall is required for L4 SNAT.
Ensure that the IP address is tied to the server pool.
NSX Troubleshooting Guide
VMware, Inc. 129
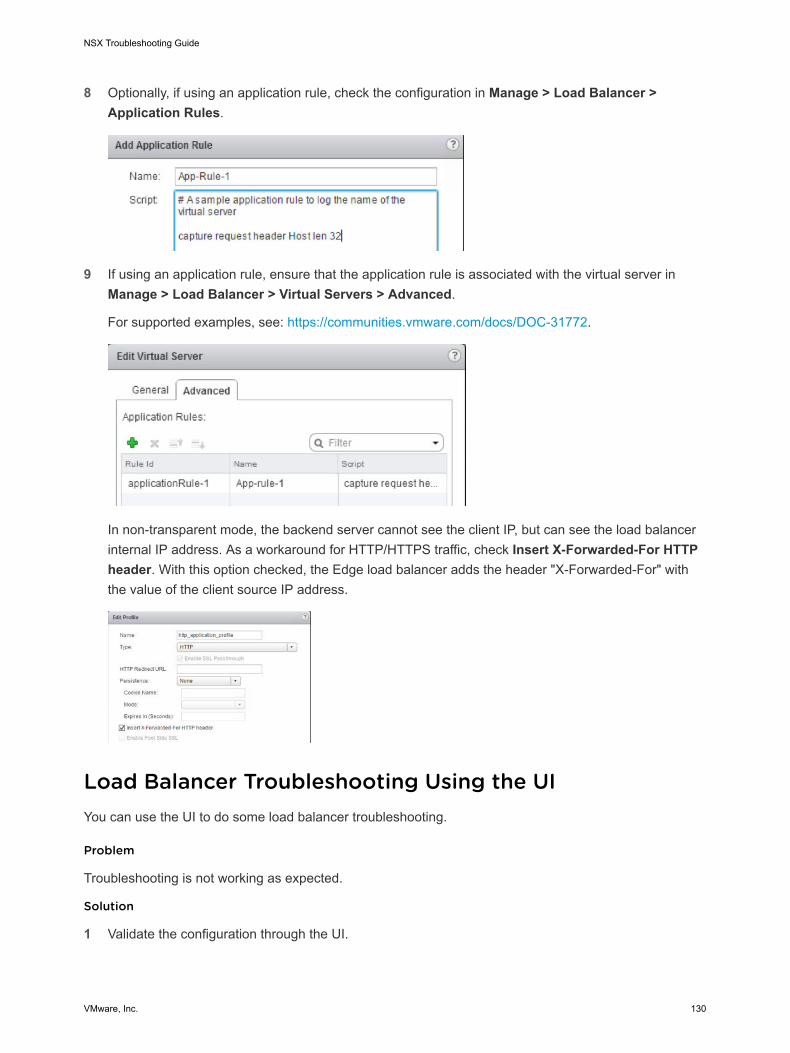
8 Optionally, if using an application rule, check the configuration in Manage > Load Balancer >Application Rules.
9 If using an application rule, ensure that the application rule is associated with the virtual server inManage > Load Balancer > Virtual Servers > Advanced.
For supported examples, see: https://communities.vmware.com/docs/DOC-31772.
In non-transparent mode, the backend server cannot see the client IP, but can see the load balancerinternal IP address. As a workaround for HTTP/HTTPS traffic, check Insert X-Forwarded-For HTTPheader. With this option checked, the Edge load balancer adds the header "X-Forwarded-For" withthe value of the client source IP address.
Load Balancer Troubleshooting Using the UIYou can use the UI to do some load balancer troubleshooting.
Problem
Troubleshooting is not working as expected.
Solution
1 Validate the configuration through the UI.
NSX Troubleshooting Guide
VMware, Inc. 130
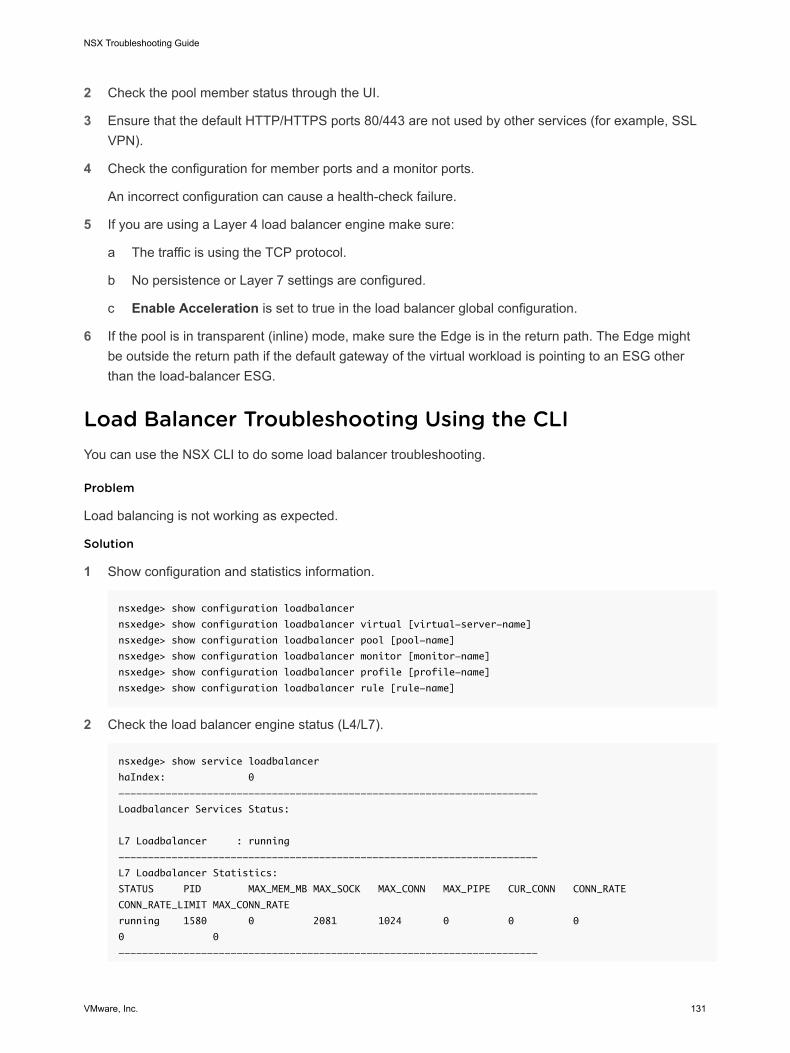
2 Check the pool member status through the UI.
3 Ensure that the default HTTP/HTTPS ports 80/443 are not used by other services (for example, SSLVPN).
4 Check the configuration for member ports and a monitor ports.
An incorrect configuration can cause a health-check failure.
5 If you are using a Layer 4 load balancer engine make sure:
a The traffic is using the TCP protocol.
b No persistence or Layer 7 settings are configured.
c Enable Acceleration is set to true in the load balancer global configuration.
6 If the pool is in transparent (inline) mode, make sure the Edge is in the return path. The Edge mightbe outside the return path if the default gateway of the virtual workload is pointing to an ESG otherthan the load-balancer ESG.
Load Balancer Troubleshooting Using the CLIYou can use the NSX CLI to do some load balancer troubleshooting.
Problem
Load balancing is not working as expected.
Solution
1 Show configuration and statistics information.
nsxedge> show configuration loadbalancer
nsxedge> show configuration loadbalancer virtual [virtual-server-name]
nsxedge> show configuration loadbalancer pool [pool-name]
nsxedge> show configuration loadbalancer monitor [monitor-name]
nsxedge> show configuration loadbalancer profile [profile-name]
nsxedge> show configuration loadbalancer rule [rule-name]
2 Check the load balancer engine status (L4/L7).
nsxedge> show service loadbalancer
haIndex: 0
-----------------------------------------------------------------------
Loadbalancer Services Status:
L7 Loadbalancer : running
-----------------------------------------------------------------------
L7 Loadbalancer Statistics:
STATUS PID MAX_MEM_MB MAX_SOCK MAX_CONN MAX_PIPE CUR_CONN CONN_RATE
CONN_RATE_LIMIT MAX_CONN_RATE
running 1580 0 2081 1024 0 0 0
0 0
-----------------------------------------------------------------------
NSX Troubleshooting Guide
VMware, Inc. 131

L4 Loadbalancer Statistics:
MAX_CONN ACT_CONN INACT_CONN TOTAL_CONN
0 0 0 0
Prot LocalAddress:Port Scheduler Flags
-> RemoteAddress:Port Forward Weight ActiveConn InActConn
3 Check the load balancer pool status (L4/L7).
nsxedge> show service loadbalancer pool
-----------------------------------------------------------------------
Loadbalancer Pool Statistics:
POOL Web-Tier-Pool-01
| LB METHOD round-robin
| LB PROTOCOL L7
| Transparent disabled
| SESSION (cur, max, total) = (0, 0, 0)
| BYTES in = (0), out = (0)
+->POOL MEMBER: Web-Tier-Pool-01/web-01a, STATUS: UP
| | HEALTH MONITOR = BUILT-IN, default_https_monitor:L7OK
| | | LAST STATE CHANGE: 2016-05-16 07:02:00
| | SESSION (cur, max, total) = (0, 0, 0)
| | BYTES in = (0), out = (0)
+->POOL MEMBER: Web-Tier-Pool-01/web-02a, STATUS: UP
| | HEALTH MONITOR = BUILT-IN, default_https_monitor:L7OK
| | | LAST STATE CHANGE: 2016-05-16 07:02:01
| | SESSION (cur, max, total) = (0, 0, 0)
| | BYTES in = (0), out = (0)
4 Check the load balancer object statistics (VIPs, pools, members).
Specify the name of the virtual server.
nsxedge> show service loadbalancer virtual Web-Tier-VIP-01
-----------------------------------------------------------------------
Loadbalancer VirtualServer Statistics:
VIRTUAL Web-Tier-VIP-01
| ADDRESS [172.16.10.10]:443
| SESSION (cur, max, total) = (0, 0, 0)
| RATE (cur, max, limit) = (0, 0, 0)
| BYTES in = (0), out = (0)
+->POOL Web-Tier-Pool-01
| LB METHOD round-robin
| LB PROTOCOL L7
| Transparent disabled
| SESSION (cur, max, total) = (0, 0, 0)
| BYTES in = (0), out = (0)
+->POOL MEMBER: Web-Tier-Pool-01/web-01a, STATUS: UP
| | HEALTH MONITOR = BUILT-IN, default_https_monitor:L7OK
| | | LAST STATE CHANGE: 2016-05-16 07:02:00
NSX Troubleshooting Guide
VMware, Inc. 132
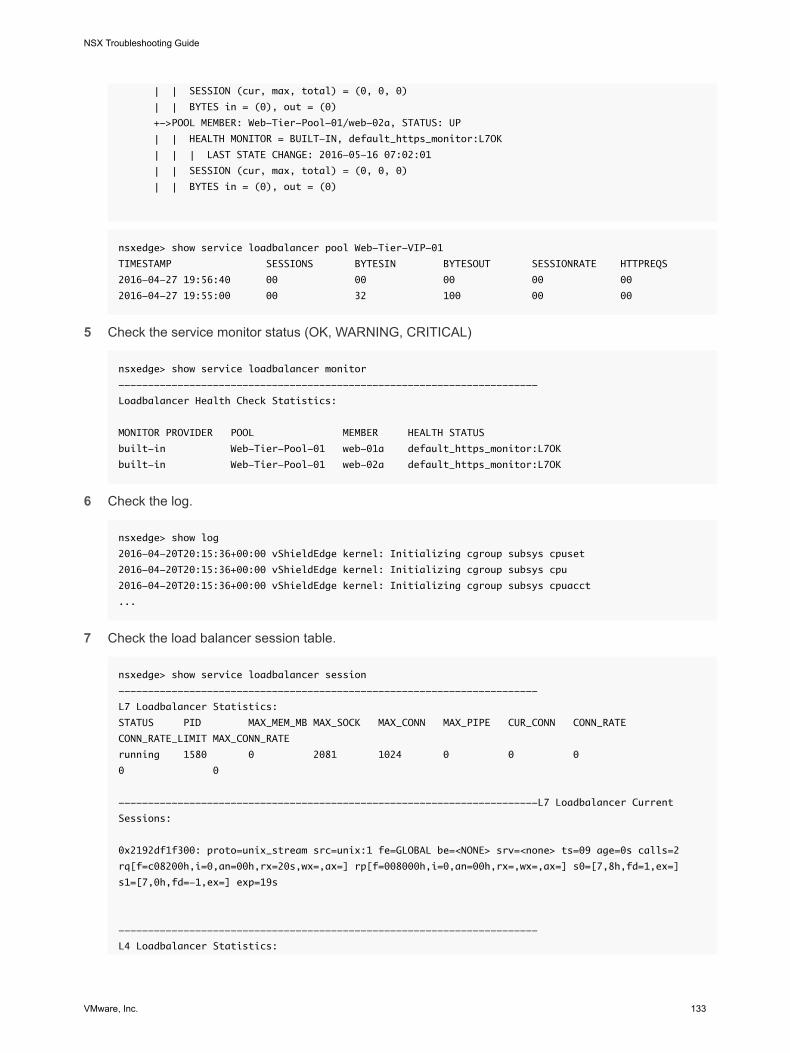
| | SESSION (cur, max, total) = (0, 0, 0)
| | BYTES in = (0), out = (0)
+->POOL MEMBER: Web-Tier-Pool-01/web-02a, STATUS: UP
| | HEALTH MONITOR = BUILT-IN, default_https_monitor:L7OK
| | | LAST STATE CHANGE: 2016-05-16 07:02:01
| | SESSION (cur, max, total) = (0, 0, 0)
| | BYTES in = (0), out = (0)
nsxedge> show service loadbalancer pool Web-Tier-VIP-01
TIMESTAMP SESSIONS BYTESIN BYTESOUT SESSIONRATE HTTPREQS
2016-04-27 19:56:40 00 00 00 00 00
2016-04-27 19:55:00 00 32 100 00 00
5 Check the service monitor status (OK, WARNING, CRITICAL)
nsxedge> show service loadbalancer monitor
-----------------------------------------------------------------------
Loadbalancer Health Check Statistics:
MONITOR PROVIDER POOL MEMBER HEALTH STATUS
built-in Web-Tier-Pool-01 web-01a default_https_monitor:L7OK
built-in Web-Tier-Pool-01 web-02a default_https_monitor:L7OK
6 Check the log.
nsxedge> show log
2016-04-20T20:15:36+00:00 vShieldEdge kernel: Initializing cgroup subsys cpuset
2016-04-20T20:15:36+00:00 vShieldEdge kernel: Initializing cgroup subsys cpu
2016-04-20T20:15:36+00:00 vShieldEdge kernel: Initializing cgroup subsys cpuacct
...
7 Check the load balancer session table.
nsxedge> show service loadbalancer session
-----------------------------------------------------------------------
L7 Loadbalancer Statistics:
STATUS PID MAX_MEM_MB MAX_SOCK MAX_CONN MAX_PIPE CUR_CONN CONN_RATE
CONN_RATE_LIMIT MAX_CONN_RATE
running 1580 0 2081 1024 0 0 0
0 0
-----------------------------------------------------------------------L7 Loadbalancer Current
Sessions:
0x2192df1f300: proto=unix_stream src=unix:1 fe=GLOBAL be=<NONE> srv=<none> ts=09 age=0s calls=2
rq[f=c08200h,i=0,an=00h,rx=20s,wx=,ax=] rp[f=008000h,i=0,an=00h,rx=,wx=,ax=] s0=[7,8h,fd=1,ex=]
s1=[7,0h,fd=-1,ex=] exp=19s
-----------------------------------------------------------------------
L4 Loadbalancer Statistics:
NSX Troubleshooting Guide
VMware, Inc. 133
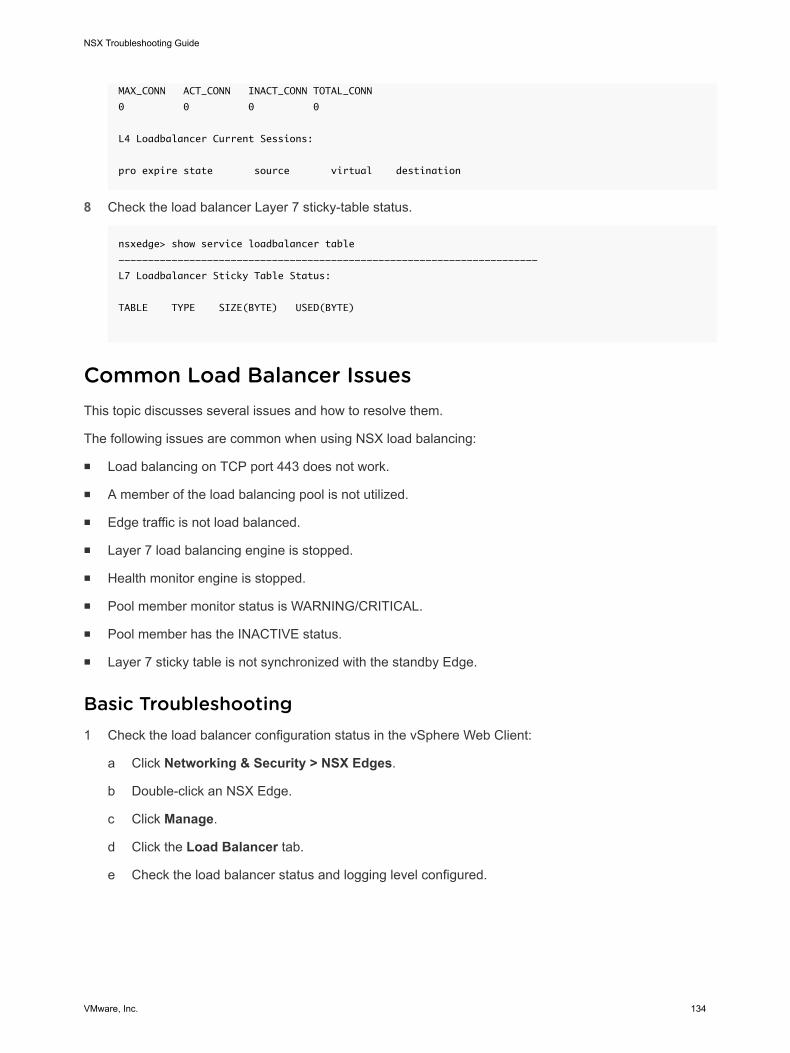
MAX_CONN ACT_CONN INACT_CONN TOTAL_CONN
0 0 0 0
L4 Loadbalancer Current Sessions:
pro expire state source virtual destination
8 Check the load balancer Layer 7 sticky-table status.
nsxedge> show service loadbalancer table
-----------------------------------------------------------------------
L7 Loadbalancer Sticky Table Status:
TABLE TYPE SIZE(BYTE) USED(BYTE)
Common Load Balancer IssuesThis topic discusses several issues and how to resolve them.
The following issues are common when using NSX load balancing:
n Load balancing on TCP port 443 does not work.
n A member of the load balancing pool is not utilized.
n Edge traffic is not load balanced.
n Layer 7 load balancing engine is stopped.
n Health monitor engine is stopped.
n Pool member monitor status is WARNING/CRITICAL.
n Pool member has the INACTIVE status.
n Layer 7 sticky table is not synchronized with the standby Edge.
Basic Troubleshooting1 Check the load balancer configuration status in the vSphere Web Client:
a Click Networking & Security > NSX Edges.
b Double-click an NSX Edge.
c Click Manage.
d Click the Load Balancer tab.
e Check the load balancer status and logging level configured.
NSX Troubleshooting Guide
VMware, Inc. 134
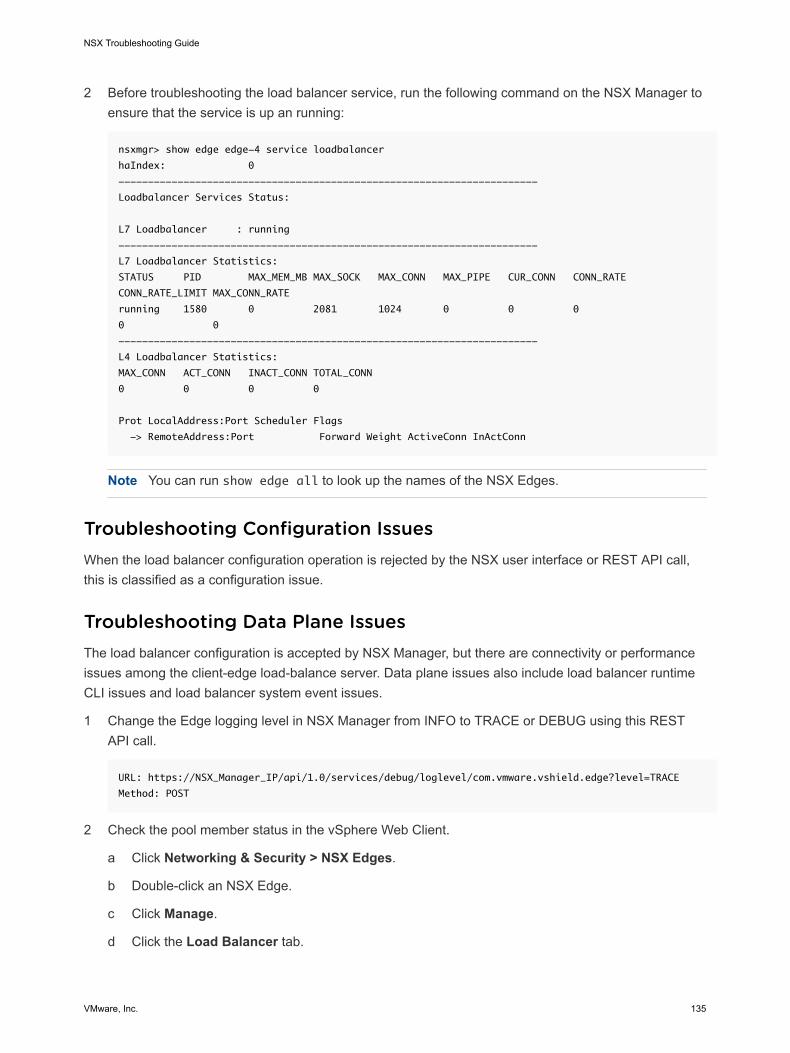
2 Before troubleshooting the load balancer service, run the following command on the NSX Manager toensure that the service is up an running:
nsxmgr> show edge edge-4 service loadbalancer
haIndex: 0
-----------------------------------------------------------------------
Loadbalancer Services Status:
L7 Loadbalancer : running
-----------------------------------------------------------------------
L7 Loadbalancer Statistics:
STATUS PID MAX_MEM_MB MAX_SOCK MAX_CONN MAX_PIPE CUR_CONN CONN_RATE
CONN_RATE_LIMIT MAX_CONN_RATE
running 1580 0 2081 1024 0 0 0
0 0
-----------------------------------------------------------------------
L4 Loadbalancer Statistics:
MAX_CONN ACT_CONN INACT_CONN TOTAL_CONN
0 0 0 0
Prot LocalAddress:Port Scheduler Flags
-> RemoteAddress:Port Forward Weight ActiveConn InActConn
Note You can run show edge all to look up the names of the NSX Edges.
Troubleshooting Configuration IssuesWhen the load balancer configuration operation is rejected by the NSX user interface or REST API call,this is classified as a configuration issue.
Troubleshooting Data Plane IssuesThe load balancer configuration is accepted by NSX Manager, but there are connectivity or performanceissues among the client-edge load-balance server. Data plane issues also include load balancer runtimeCLI issues and load balancer system event issues.
1 Change the Edge logging level in NSX Manager from INFO to TRACE or DEBUG using this RESTAPI call.
URL: https://NSX_Manager_IP/api/1.0/services/debug/loglevel/com.vmware.vshield.edge?level=TRACE
Method: POST
2 Check the pool member status in the vSphere Web Client.
a Click Networking & Security > NSX Edges.
b Double-click an NSX Edge.
c Click Manage.
d Click the Load Balancer tab.
NSX Troubleshooting Guide
VMware, Inc. 135
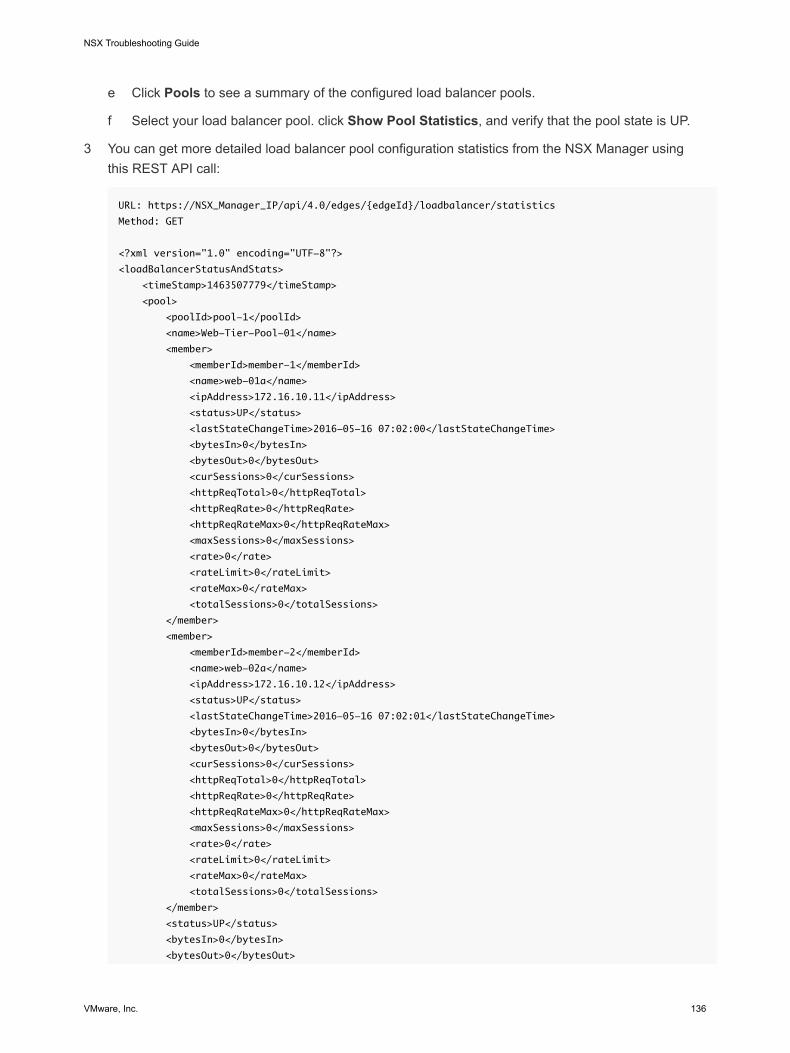
e Click Pools to see a summary of the configured load balancer pools.
f Select your load balancer pool. click Show Pool Statistics, and verify that the pool state is UP.
3 You can get more detailed load balancer pool configuration statistics from the NSX Manager usingthis REST API call:
URL: https://NSX_Manager_IP/api/4.0/edges/{edgeId}/loadbalancer/statistics
Method: GET
<?xml version="1.0" encoding="UTF-8"?>
<loadBalancerStatusAndStats>
<timeStamp>1463507779</timeStamp>
<pool>
<poolId>pool-1</poolId>
<name>Web-Tier-Pool-01</name>
<member>
<memberId>member-1</memberId>
<name>web-01a</name>
<ipAddress>172.16.10.11</ipAddress>
<status>UP</status>
<lastStateChangeTime>2016-05-16 07:02:00</lastStateChangeTime>
<bytesIn>0</bytesIn>
<bytesOut>0</bytesOut>
<curSessions>0</curSessions>
<httpReqTotal>0</httpReqTotal>
<httpReqRate>0</httpReqRate>
<httpReqRateMax>0</httpReqRateMax>
<maxSessions>0</maxSessions>
<rate>0</rate>
<rateLimit>0</rateLimit>
<rateMax>0</rateMax>
<totalSessions>0</totalSessions>
</member>
<member>
<memberId>member-2</memberId>
<name>web-02a</name>
<ipAddress>172.16.10.12</ipAddress>
<status>UP</status>
<lastStateChangeTime>2016-05-16 07:02:01</lastStateChangeTime>
<bytesIn>0</bytesIn>
<bytesOut>0</bytesOut>
<curSessions>0</curSessions>
<httpReqTotal>0</httpReqTotal>
<httpReqRate>0</httpReqRate>
<httpReqRateMax>0</httpReqRateMax>
<maxSessions>0</maxSessions>
<rate>0</rate>
<rateLimit>0</rateLimit>
<rateMax>0</rateMax>
<totalSessions>0</totalSessions>
</member>
<status>UP</status>
<bytesIn>0</bytesIn>
<bytesOut>0</bytesOut>
NSX Troubleshooting Guide
VMware, Inc. 136
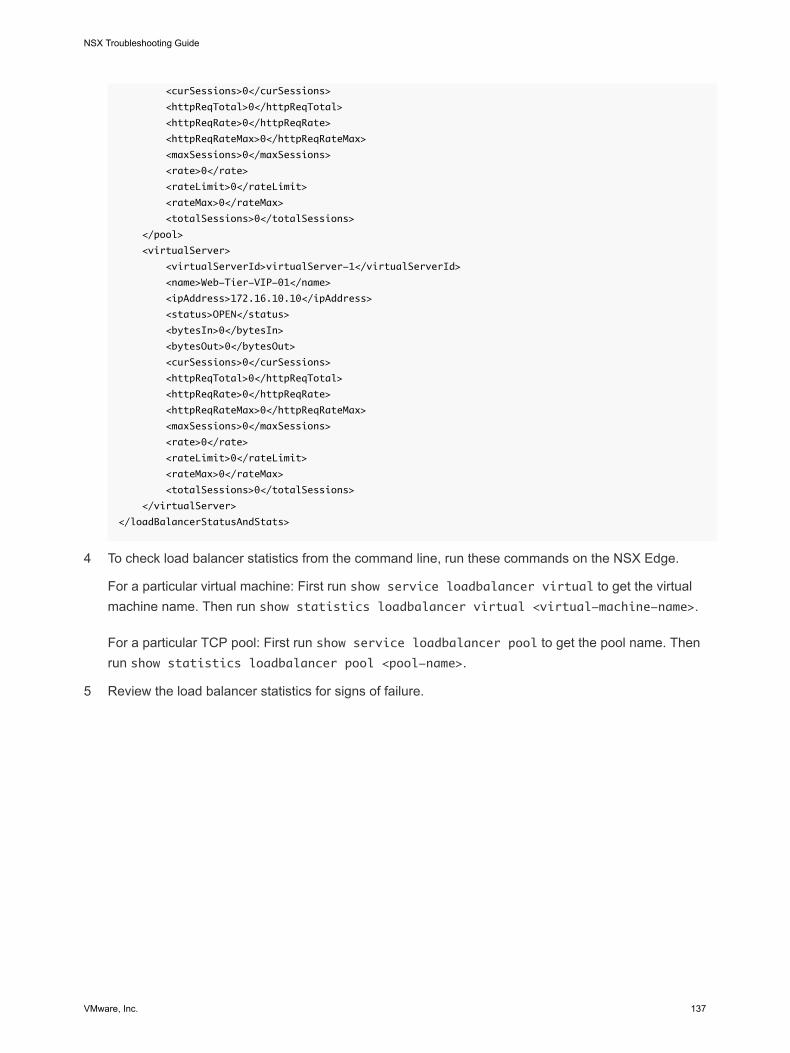
<curSessions>0</curSessions>
<httpReqTotal>0</httpReqTotal>
<httpReqRate>0</httpReqRate>
<httpReqRateMax>0</httpReqRateMax>
<maxSessions>0</maxSessions>
<rate>0</rate>
<rateLimit>0</rateLimit>
<rateMax>0</rateMax>
<totalSessions>0</totalSessions>
</pool>
<virtualServer>
<virtualServerId>virtualServer-1</virtualServerId>
<name>Web-Tier-VIP-01</name>
<ipAddress>172.16.10.10</ipAddress>
<status>OPEN</status>
<bytesIn>0</bytesIn>
<bytesOut>0</bytesOut>
<curSessions>0</curSessions>
<httpReqTotal>0</httpReqTotal>
<httpReqRate>0</httpReqRate>
<httpReqRateMax>0</httpReqRateMax>
<maxSessions>0</maxSessions>
<rate>0</rate>
<rateLimit>0</rateLimit>
<rateMax>0</rateMax>
<totalSessions>0</totalSessions>
</virtualServer>
</loadBalancerStatusAndStats>
4 To check load balancer statistics from the command line, run these commands on the NSX Edge.
For a particular virtual machine: First run show service loadbalancer virtual to get the virtualmachine name. Then run show statistics loadbalancer virtual <virtual-machine-name>.
For a particular TCP pool: First run show service loadbalancer pool to get the pool name. Thenrun show statistics loadbalancer pool <pool-name>.
5 Review the load balancer statistics for signs of failure.
NSX Troubleshooting Guide
VMware, Inc. 137