gs 5101: introduction to geographical information systems……. · what is gis geographical...
TRANSCRIPT

GS 5101: Introduction to Geographical Information Systems…….
New Experience for your Data ….

Course Content Introduction to GIS, Definitions of GIS and Overview,
History and concepts of GIS, Development of GIS, Scope and application areas
Geographical Entities, Attribute data, Linking spatial and attribute data
Mapping concepts, Map elements, Map scales and representation, Map projections and coordinate systems
Spatial Data Models, raster vs vector, Raster data Models, Spatial Relationships, GIS Data Analysis, Raster data analysis tools
Practical and Case Studies
Laboratory Sessions: Introduction to Arc GIS, Strength of Arc GIS, Some hands-on session in introducing the ARC GIS environment

Course Information
Course Goals and Objectives: The goal of this course is to provide you the
opportunity to learn and master basic and fundamental GIS concepts necessary for further GIS education or experiences.
By the end of the course, you should be able to do the following: Comprehend and explain the concepts related to GIS data
characteristics and models, and the GIS process: defining the purpose, building and managing the database, analyzing the data, and producing the output.
Propose simple GIS applications and analysis.
Evaluate the appropriate use of simple GIS applications and analysis given certain conditions.
Discuss implications of GIS applications for research, problem solving, and decision support.

Course Evaluation
Mid semester examination 25%
End Semester examination 30%
Assignments 40%
Attendance 5%

What is a GIS ?
Concepts are most important Software can be learned more easily
What remains constant:
Spatial analysis concepts are relatively stable
All GIS software programs support basic analysis concepts
What changes frequently
Tools, user interfaces, inclusion of additional capabilities (e.g., 3D, spatial statistics)
Data formats
Focus must be on concepts not software training

Spatial is Special
Almost all human activities and decisions involve
a geographic component
Technical reasons why geographic information is
special [Longley et al. (2001) Box 1.2]
Multidimensional (at least 2 coordinates to define a location)
Voluminous
Often must be projected onto flat surface
Requires special methods of analysis

Geographic problems
Problems that involve an aspect of location
Information used to solve the problem
Solutions themselves
Classifying geographic problems
Spatial scale
Intent or purpose
Temporal scale
Examples Location of a new highway
Management of forests
Precision agriculture

Systems, Science, Studies What does it mean to be “doing GIS”?
What’s the “S” in GIS
Using the tools and helping to build the tools of geographic information systems (GISystems)
Studying the theory and concepts that lie behind GIS and other geographic information technologies (GIScience)
Study the societal context of geographic information – legal context, issues of privacy, economics of geographic information (GIStudies)

What is a GIS ?
GIS is a System of computer software,
hardware and data, and personnel to help
manipulate, analyze and present information
that is tied to a spatial location –
• spatial location – usually a geographic location
• information – visualization of analysis of data
• system - linking software, hardware, data
• personnel – a thinking explorer who is key to the
power of GIS-

What is a GIS ?
“A GIS is a computer-based system that provides the following four sets of capabilities to handle geo-referenced data: 1. Input
2. Data management (storage and retrieval)
3. Manipulation and analysis
4. Output.”
(Aronoff, 1989)

What is GIS
Geographical Information Systems
Simple: Tables and Maps
“a powerful set of tools for collecting, storing, retrieving at will,
transforming and displaying spatial data from the real world”
(Burrough, 1986)
“any manual or computer based set of procedures used to store
and manipulate geographically referenced data” (Aronoff 1989)
“a decision support system involving the integration of spatially
referenced data in a problem solving environment” (Cowen 1988)
“Systems that know how to deal with stuff in space” (Herrington
1998)
The common ground between information processing and the many
fields using spatial analysis techniques. (Tomlinson, 1972)

A method to visualize, manipulate, analyze, and display spatial data to study the world
“Smart Maps” linking a database to the map, creating dynamic displays

Photographic Image
Scanned Drawing
Parcels within a half mile buffer of Park and Central
Analysis
Data Table
A map with a database behind it…

Street Network layer: lines Land Parcels layer: polygons
Raster (image) Layer
Digital Ortho Photograph Layer:
Digital Ortho photo: combines the
visual properties of a photograph
with the positional accuracy of a
map, in computer readable form.
Vector
Layers
Layers
Projection: State Plane, North Central Texas Zone, NAD 83
Resolution: 0.5 meters
Accuracy: 1.0 meters
Scale: see scale bar

GPS – Global Positioning System
A static map – paper or digital
Maps are often a “product”
of a GIS
A way to visualize the
analysis
A software package

Base Mapping
Concepts of analytical geometry, coordinate systems and related mathematics were understood prior to 1587, relationship between a graphed line and equation was understood during 1600-1650 and the concepts were redrawn…..

First Recorded Concept of Overlaying ……. Mid 19th century, Irish railway Commissioners’ Report show an Atlas made by overlaying or superimposing population, traffic flow, geology and topography on the same base map….
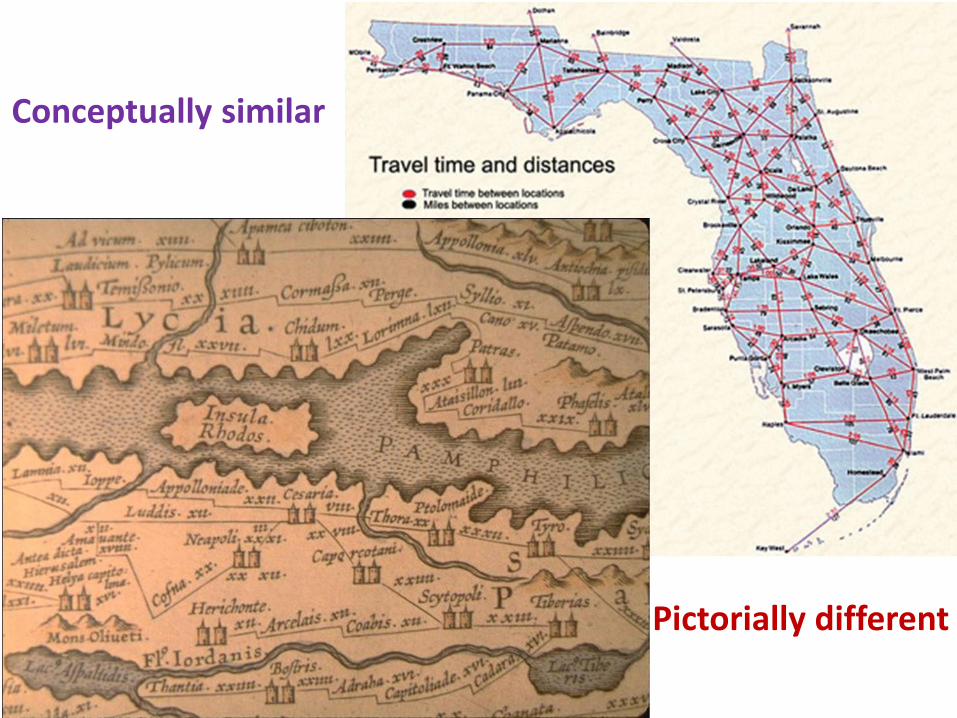
Conceptually similar
Pictorially different


Dr John Snow
USE of DOT MAPS Dr John Snow is known as the‘Father of GIS’ because of the famous case of the 1854 Cholera outbreak in London’s Broad Street region.
He conceived the hypothesis that cholera was transmitted through the drinking of polluted water, rather than through the air, as was commonly believed. He noticed that the outbreak appeared to be centred on a public drinking water pump in Broad Street – and if this hypothesis was correct, the pattern shown on the map would reflect the locations of people who drank the pump’s water.
At the time of the breakout, cholera was not understood to be geographically related. However, as soon as location of deaths was introduced into the picture it was clear that this was a geographical problem.

“The human activity of graphically translating one's perception of his/her world is now generally recognized as being a universally acquired skill [all peoples, all cultures] and one that pre-dates virtually all other forms of written communication.” - J. Siebold

Contemporary GIS
Father of Modern GIS: Dr. Roger Tomlinson
Purpose: to analyse data collected by Canada Land Inventory (CLI) to produce statistics to be used in developing land mgt plans


200 A.D.
500 A.D.
1200 A.D.
1700 A.D.
1800 A.D.
1900 A.D.
GIS towards Geo-technology and Geo-informatics
New Age of the Digital Map
…utilizing Remote Sensing (RS), Geographic Information Systems (GIS) and Global Positioning System (GPS)
”Maps are numbers first, pictures later”
We have been mapping for
thousands of years
(pictograph with map elements)
30,000 B.C.
Stone Maya
Astrological Chart
(1st Century)
Manual Mapping
(8th Century)
Early 16th Century
Aerial Photo (from balloon late 1800s)
Manual Mapping Tools
(20th Century)
1963 A.D. … a 50 year time slice at the
transition from paper maps to digital mapped data—
Evolution of
Geoinformatics (RS, GIS, GPS)
2013 A.D.
1963 2013 The most radically transformative 50 years of mapping history
(Adopted from Barry, 2010 and Revised)

Mainframe
GIS
Computer
Cartography
CAD/Remote Sensing
GIS Developments Government
.
Org
.)
R & D in GIS
GIS
in Commercial Agencies
GPS
Multi Media & Spatial Information Systems
DSS, 4D GIS
INTERNET GIS
/ WEB GIS
Traditional GIS Desktop GIS I’NET GIS
Development Paradigm in GIS
Internet GIS 1995-
Desktop GIS 1980-1995
Traditional GIS 1960-80
Open Source GIS/
Open platform GIS
Cloud Computing
Mobile mapping-2005
Open GIS-2006
Open GIS
1965 1975 1985 1995 2005 1963
3D GIS

(Adopted from Mills, 2015)

Software Evolution and Innovations

GIS Fundamentals
GIS, GPS, RS
GIS Applications


1963

GISc Beyond 2000

History of GIS The Pioneers
1960’s:
Canada Geographic Information System
dominated by technical problems
1970’s:
major activities in universities
introduction of topology in GIS

History of GIS The Breakthrough
1980’s:
introduction of personal computer
progress in spatial data modeling and data structures
first commercial systems
breakthrough in government planning organizations
reliable systems

History of GIS The ubiquitous GIS and the road ahead
1990’s:
breakthrough also on local levels (municipalities, geo-marketing)
spatial information science
object orientation
large databases
trends
3D and temporal GIS

What is a GIS ?
Geography - Physical geography (physical representation of real world: roads, buildings
- Human geography (settlements_
- spatial geography (lat/lon, grid reference)

What is a GIS ?
Information – valuable (value adding process)
water measurements to water shortage map
System – hardware, software, user and user ineteractions, data

What is a GIS ?
A combination of hardware and software for -Acquisition and verification (data capture) -Compilation -Storage -Updating and Changing -Management and Exchange -Retrieval and Presentation -Manipulation -Analysis and combination of geographic data or data with spatial reference.

What does a GIS?
A GIS works with objects, their attributes, and the relationships among the objects.
The objects are stored in a database using geometric entities (volumes, areas, lines, points), their attributes and the relationships between them (topology).

Characteristics of Geographic Data
Spatial data: features orientation shape, size & structure
Non-Spatial data: Information about various attributes like area, length &
population

What is a GIS ?
Non spatial data
Spatial data
MIS, Traditional DSS Multi-criteria information Domain
CAD, DMM Graphical Illustration Domain
DBMS Uni-dimensional data Domain
GIS Geo-spatial Domain
Low High
High

Characteristics of Spatial Data
spatial reference
attributes
spatial relationships
temporal component
metadata (information about data)
where?
what?
how?
when?

Representation of spatial data

Data Manipulation and Analysis

GIS Questions….
What is at......? (Locational question ; what exists at a
particular location)
Who owns the lot at
3233 Texas Street ?

Where is it.....? (Conditional question ;
which locations satisfy certain conditions)
Where are houses
located that you might
consider buying ?
GIS Questions….

Which data are related ........? (Relational question :
analyzes the spatial relationship between objects of
geographic features)
GIS Questions….
What kinds of patterns exist for motor
vehicle accidents- Where do they occur
and at what times?

What if.......? (Model based question ; computes and
displays an optimum path, a suitable land, risky area against
disasters etc. based on model)
GIS Questions….
If you wanted to
open a new facility,
where would you
locate it ?

GIS Questions….
How has it changed........? (Trend question; identifies geographic
occurrence or trends that have changed or in the process of changing)

Types of queries
Questions Answers GISfunctions
What is…? Display of data as maps,reports and tables, e.g., Whatare the name and the addressof the owner of that parcel ofland?
Storageand queryfunctions
Whatpattern…?
A pattern in the data, e.g., allparcels with an area greaterthan 2000m
2
Queryfunctionswithconstraints
What … if…? A prediction about the data ata certain time or at a certainlocation
Modelingfunctions

So why have a GIS instead of using paper maps?
•GIS uses the analytical power of the computer to complete complex tasks which would be impossible or impractical using paper maps.
•GIS uses the computer's storage power to manage large datasets.
•GIS allows the integration of many different types of data from many different sources (maps, tabular data, aerial photos, elevation models, satellite imagery, CAD data, linear measurements, etc.) within an integrated storage, management, analysis, and display environment. Many of these data types are not easily represented on paper maps.
•GIS registers a variety of different data to the same coordinate space, which allows for the analysis of the combination of different layers (e.g., slope, forests, distance to streams,). Frequently with paper maps, different thematic maps appear on different map sheets that are in different scales or use different representation frameworks.
•Digital data are more stable than paper media, easier to copy, and easier to distribute. Many web sites exist that distribute digital geospatial data.
•Digitally created maps are more easily updated than paper maps (change the data and print a new copy).

So why have a GIS instead of using paper maps?
•GIS makes it easy to reproduce maps. A single digital map file can be printed at will and multiple times. The same graphics file can be distributed over the net for users around the world.
•GIS allows the creation and use of "one-time" maps (whereas paper maps generally need to be printed and sold by the thousands to recapture the cost of production). For example, a map can be prepared with GIS specifically for a particular public presentation; the map may never be used after that presentation.
•GIS allows individual users to tailor their map displays for their own purposes, rather than having to settle for a general-purpose paper map.
•GIS eliminates some user bias in measurement or analytical processes (the computer repeats measurement and analytical processes identically, whereas people often repeat processes with random or systematic errors).
•GIS brings new tools for thinking differently about the world and its interrelationship.

What can GIS do?
•Locate geographic features based on their properties (e.g., "Where are DS Divisions within Kandy district of population greater than 5000, but less than 10,000?").
•Identify properties of geographic features based on their location (e.g., "How many people live in the towns within 20 km of Kandy?").
•Calculate the loss of timber volume &/or revenue due to riparian management zone buffers under River basin management laws.
•Determine a good location of a supermarket, based on the demographics and land-use/availability of the Peradeniya area.
•Generate optimal routing and scheduling for Agro-chemical delivery and service. •Determine the ground area covered by a new cellular phone network. Locate "holes" in cellular coverage.
•Delineate watershed boundaries for the major tributaries of the Mahaweli River, and generate land-cover area statistics for those watersheds.

What can GIS do?
•Predict vegetation types for the Hantana Forest based on elevation, slope, and aspect.
•Predict landslide hazard for forest harvest units, based on slope, precipitation, and soil type.
•Create a relative-difficulty map for bicycle routes Peradeniya campus.
•Locate "hot spots" for crimes, and help determine if there is a relationship between crimes and low income for households in the communities around Peradeniya.
•Determine areas within Hantana in which exist a high abundance of forest fires, located within 1 km from roads.
•Make colorful, interesting, and informative maps.

Example 1: Where is a given feature or set of features? "Where are forest stands greater than 100 years of age?" In the following dialog, I have specified a query asking for stands whose age in 1998 ("Age_1998") is greater than 100 years.
The query looks up records in a database that match the query expression. Here is the result of the query:
The records that have matched the query criteria are displayed on the map in the default selection color of yellow.

Example 2: What features are at a given location? "What is the age of the forest near the 1050 Road?" The process is similar to the selection of stands within a certain age range, except first a particular road (the 1050 Road) is selected.
Once the road is selected, we can use the spatial location of the selected road to make yet another selection against forest stands. The spatial selection will be all stands within 5 m of the selected road segment.

The following graphic shows a series of selected stands near the 1050 Road. The stands show up on the map in the selection color of yellow. To the lower left, the attribute table for the stands layer shows records for the selected stands. The age in 1998 is displayed in one of the fields. At the upper left is a selection of all the attributes of one particular stand.

Example 3: Where are areas that meet a given complex set of criteria? "What parts of the forest are located on > 30% slope, closer than 100 ft to a stream, and farther than 50 ft from a road?" The following graphic displays 10% slope classes. These were generated by a simple process performed on a digital elevation model.

These three datasets are merged; all properties of each dataset are stored in the final output. Each yellow polygon is coded for its status in each buffer type, as well as its slope class. Here is a display of a selection of polygons meeting our specified criteria:

Example 4: How can GIS calculate distance of features? “How far away is a bird nest from the rest of the patch of nesting habitat?” Conceptually, calculating the distance of a point to a polygon is simple. It is the distance from every place within the patch to the nest. Here is a simplified view of a stand, its landing, and several lines representing that distance. When you consider that there are really an infinite number of these distances, the problem becomes operationally quite a bit more complicated to solve.
What we will do is create a group of cells that represent each stand. We than calculate the distance from the nest to each cell center, and then take the mean of all these distances. This is done on a stand-by-stand basis. Each stand's average nest distance is recorded, and along with the size of the patch can be used to help generate an understanding of how birds select nest locations in different patch types. Here we see the cells along with a road and the nest for a single forested patch.

This patch has an average distance of nest to patch of 686 ft. Using a custom looping program, this distance is easily calculated for each patch within a planning area

Example 5: How can watershed analysis data be generated within a GIS? "What are the road and stream densities (mi / sq. mi) for the forest area? First, we eliminate roads and streams that are not within the forest area. This image shows streams and roads clipped to the administrative boundary of Pack Forest.
Then we summarize the forest area (in square miles) and summarize the stream and road length (in miles). The quotient of (stream length / forest area) is the stream density, and (road length / forest area) is the road density:
area
length
density
forest 6.67 mi ^2
roads 54 mi
8.13 mi / mi^2
streams 31 mi
4.62 mi / mi^2

Spatial data layers

Spatial Data Models
Field-based models (e.g. RASTER) Continuous spatial phenomena
For every point in space a value of the field can be determined
Composite model
Object-based models (e.g. VECTOR) Space is populated by well distinguishable,
discrete, bounded objects, geo-relational model
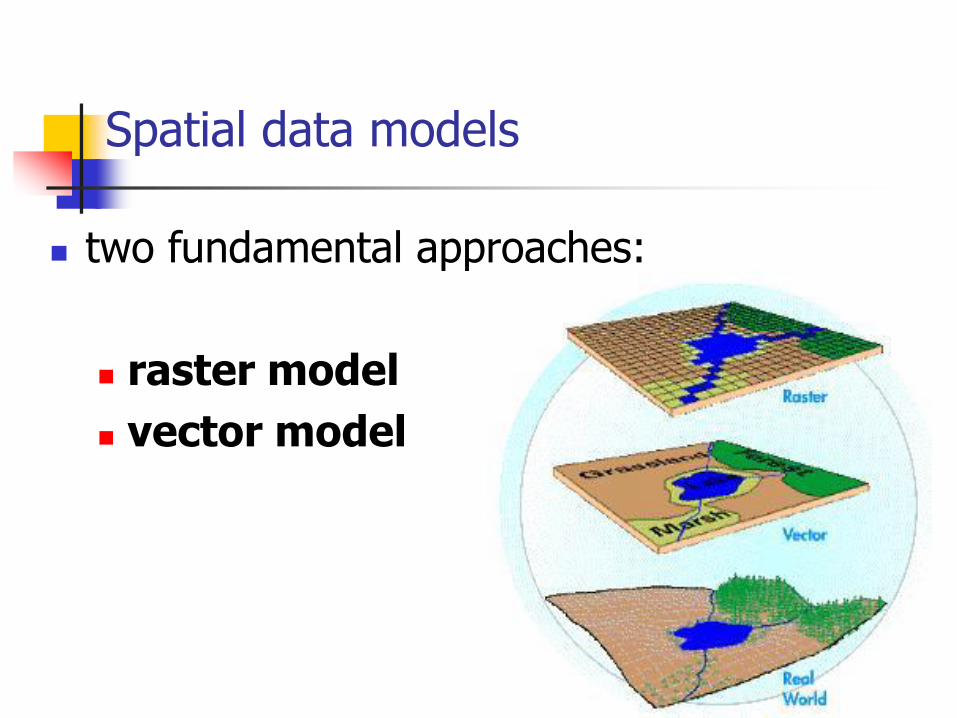
Spatial data models
two fundamental approaches:
raster model
vector model

The 2 basic data structures in any fully-functional GIS are: Vector, e.g.,
ArcInfo Coverages ArcGIS Shape Files CAD (AutoCAD DXF & DWG, or MicroStation DGN files) ASCII coordinate data
Raster, e.g., ArcInfo Grids Images Digital Elevation Models (DEMs) generic raster datasets
Spatial data models

Raster view of the world...

A raster dataset with cells half as large (e.g., 10 m on a side instead of 20 m on a side) may take up 4 times as much storage space, because it takes four 10 m cells to fit in the space of a single 20 m cell. The following image shows the difference in cell sizes, area, and number of cells for two configurations of the same total area:

Raster view of the world...
Tessellation
Raster Features
Sampling

raster model
The entity information is
explicitly recorded for a
basic data unit
(cell, grid or pixel)

• digital orthophoto
• digital elevation model (DEM)_
A few different types of raster data

Vector model
In a vector-based GIS data are handled as:
Points X,Y coordinate pair + label
Lines series of points
Areas line(s) forming their boundary (series of polygons)
line
feature
area
feature point feature

vector model

Points: represent discrete point features
airports are point features each point is stored as a
coordinate pair
each point location has a record in the table

Lines: represent linear features
roads are linear features
each road segment has a record in the table

Polygons: represent bounded areas
each bounded polygon has a record in the table
landforms and water are polygonal features