gs 3 consulting sean georget josh safronetz dana stoughton dave sullivan february 2008
TRANSCRIPT
Business Plan
GS3 Consulting Sean Georget Josh Safronetz Dana Stoughton Dave Sullivan
February 2008

Live Xtreme
• Industry Analysis•Goals and Objectives•Operations Plan•Human Resource Plan•Marketing Plan• Finance Plan• Conclusion
Agenda

“Clark’s Xtreme Sports Company is committed to being the premier Extreme Sporting Goods Store in Saskatoon and area, by serving the alternative sport enthusiasts and providing merchandise of exceptional quality and value in a friendly, service-oriented environment.”
Mission Statement
Establish an image and name High end alternative sporting goods Support local Extreme Sport athletes Maximizes sales at $480,000 by year 5 Monthly sales of $20 per square foot of retail space
20% return on equity
Goals and Objectives

• Location• Store Floor Plan• Average Business Cycles• Supply Analysis• Capital Budget•Operational Expenses
Operations Plan

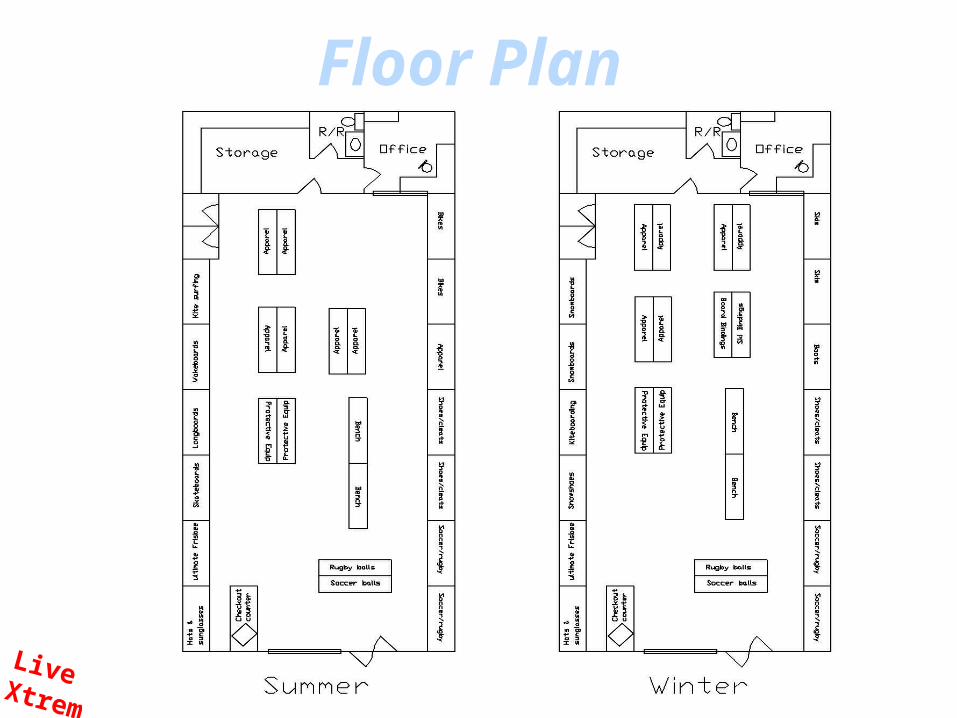
Floor Plan

• Average Business Cycles• Average Day• Average Week• Average Month• Average Year
• Supply Analysis
Operations Plan

DescriptionRemodeling $4,000Sales Equipment
Shelves, racks, displays $5,000Cash Register $800Check-out Counter $500Offi ce Equipment $1,000
Total Sales Equipment Costs $7,300Working Capital
Overhead 7,560 Labour and Manager 8,471 Marketing 5,258
Inventory $80,000Accounts Payable $19,048
Total Net Working Capital $82,241Total Capital Required $93,541
Estimated Costs
Capital Budget

Variable Overhead CostsMaintenance $300
Total Variable Overhead $300
Fixed Overhead Costs Rent $24,000Utilities $2,400Insurance $5,000Business License $200Capital Cost Allowance $1,015Telephone $600
Total Fixed Overhead $33,215
Total Overhead $33,515
Operating Expense

Human Resource PlanJob Description• General Manager• Direct Sales Staff
• Scheduling• Training• Labour Costs
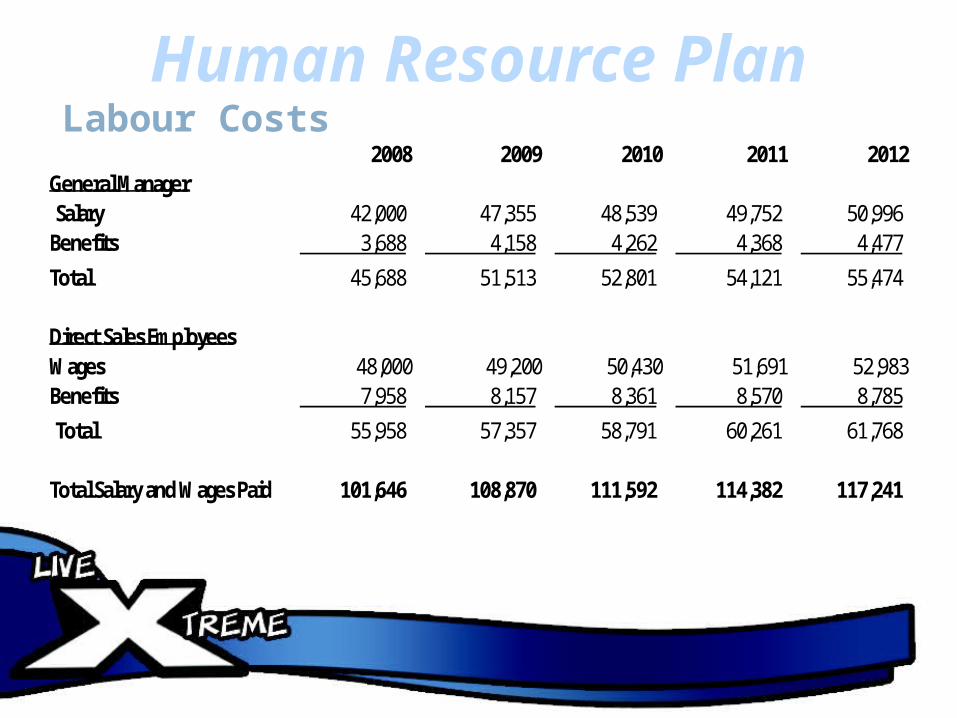
Human Resource PlanLabour Costs
2008 2009 2010 2011 2012General ManagerSalary 42,000 47,355 48,539 49,752 50,996
Benefits 3,688 4,158 4,262 4,368 4,477
Total 45,688 51,513 52,801 54,121 55,474
Direct Sales EmployeesWages 48,000 49,200 50,430 51,691 52,983Benefits 7,958 8,157 8,361 8,570 8,785
Total 55,958 57,357 58,791 60,261 61,768
Total Salary and Wages Paid 101,646 108,870 111,592 114,382 117,241
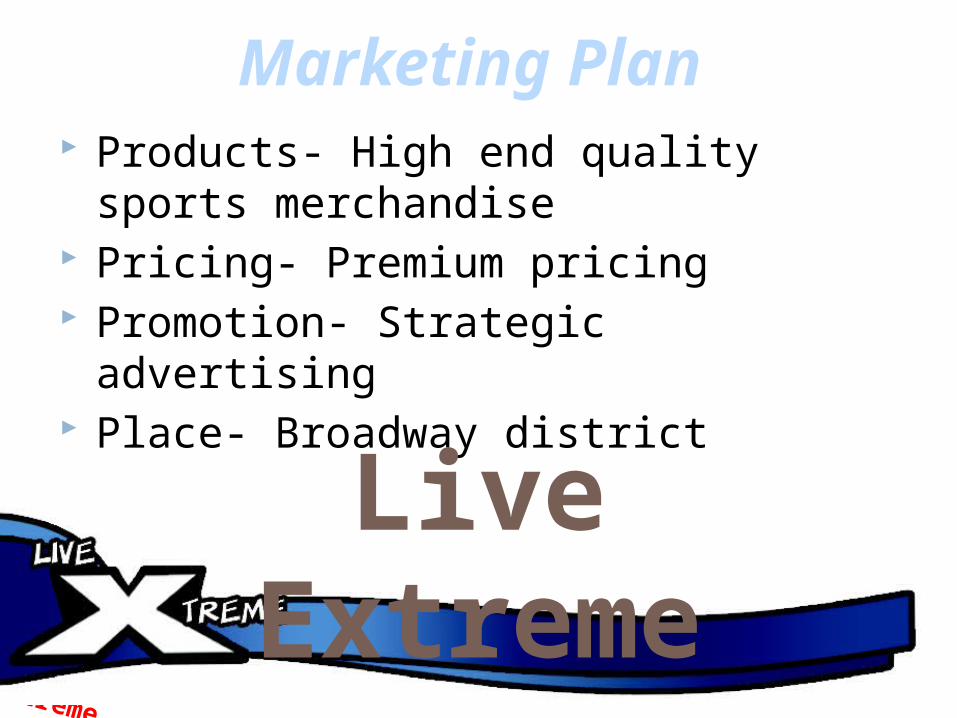
Products- High end quality sports merchandise
Pricing- Premium pricing Promotion- Strategic advertising Place- Broadway district
Marketing Plan
Live Extreme

Segmentation, Targeting, & Position◦ Saskatoon and area residents◦ Above average income◦ Serious competitors◦ Health and wellness◦ Sports teams
Marketing Plan
http://youtube.com/watch?v=WCNk9u2p3PI

Projected Sales Revenues and Marketing Expenses
2007 2008 2009 2010 2011 -
50,000
100,000
150,000
200,000
250,000
300,000
350,000
400,000
450,000
500,000
Sales Revenue
Marketing Salaries
Marketing Expenses
Year
$
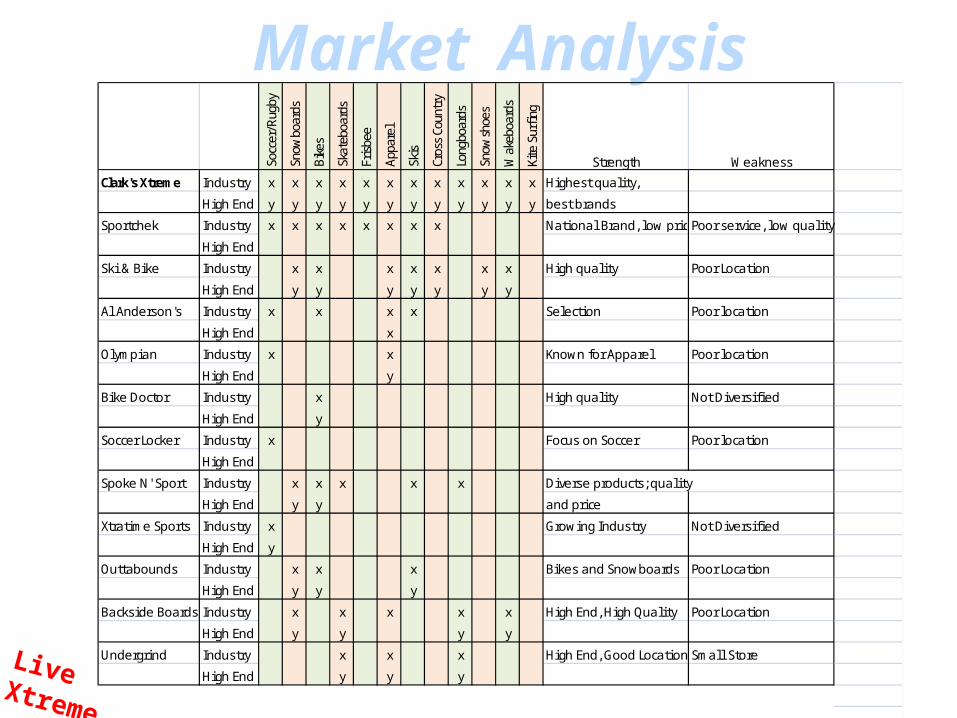
Market Analysis
Socc
er/R
ugby
Snow
boar
ds
Bike
s
Skat
eboa
rds
Fris
bee
Appa
rel
Skis
Cros
s Co
untr
y
Long
boar
ds
Snow
shoe
s
Wak
eboa
rds
Kite
Sur
fing
Strength Weakness
Clark's Xtreme Industry x x x x x x x x x x x x Highest qual i ty,
High End y y y y y y y y y y y y best brands
Sportchek Industry x x x x x x x x National Brand, low pricePoor service, low qual i ty
High End
Ski & Bike Industry x x x x x x x High qual i ty Poor Location
High End y y y y y y y
Al Anderson's Industry x x x x Selection Poor location
High End x
Olympian Industry x x Known for Apparel Poor location
High End y
Bike Doctor Industry x High qual i ty Not Divers ifi ed
High End y
Soccer Locker Industry x Focus on Soccer Poor location
High End
Spoke N' Sport Industry x x x x x Diverse products ; qual i ty
High End y y and price
Xtratime Sports Industry x Growing Industry Not Divers ifi ed
High End y
Outtabounds Industry x x x Bikes and Snowboards Poor Location
High End y y y
Backs ide Boards Industry x x x x x High End, High Qual i ty Poor Location
High End y y y y
Undergrind Industry x x x High End, Good Location Smal l Store
High End y y y
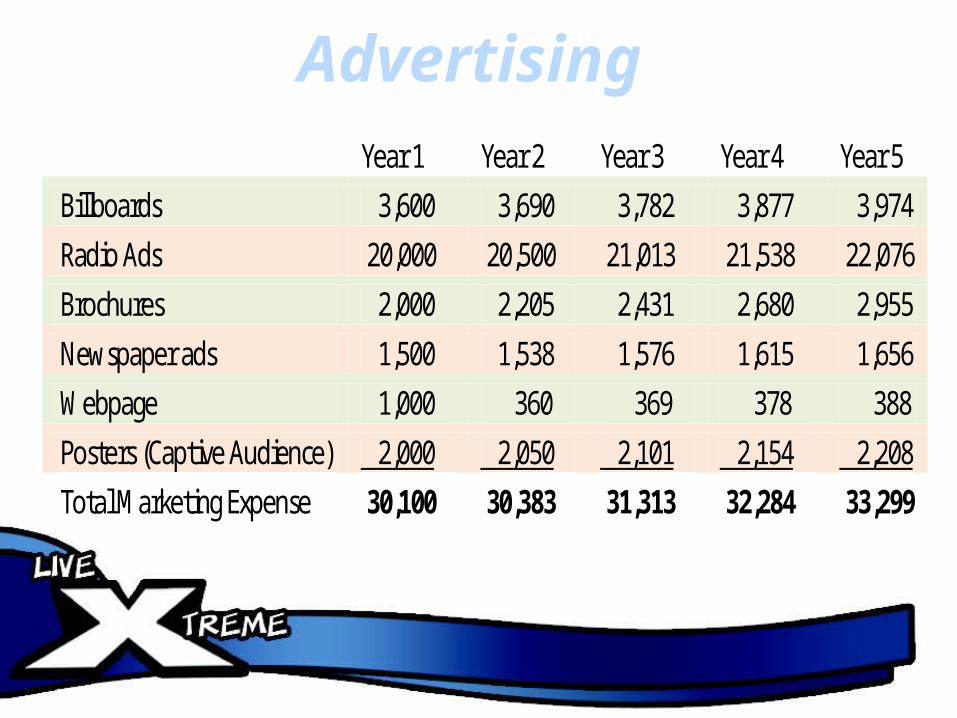
Advertising
Year 1 Year 2 Year 3 Year 4 Year 5
Billboards 3,600 3,690 3,782 3,877 3,974 Radio Ads 20,000 20,500 21,013 21,538 22,076 Brochures 2,000 2,205 2,431 2,680 2,955
Newspaper ads 1,500 1,538 1,576 1,615 1,656 Webpage 1,000 360 369 378 388
Posters (Captive Audience) 2,000 2,050 2,101 2,154 2,208 Total Marketing Expense 30,100 30,383 31,313 32,284 33,299
◦ $30,000 Equity◦ $60,000 Long Term Debt◦ $10,000 Cash on hand
Finances
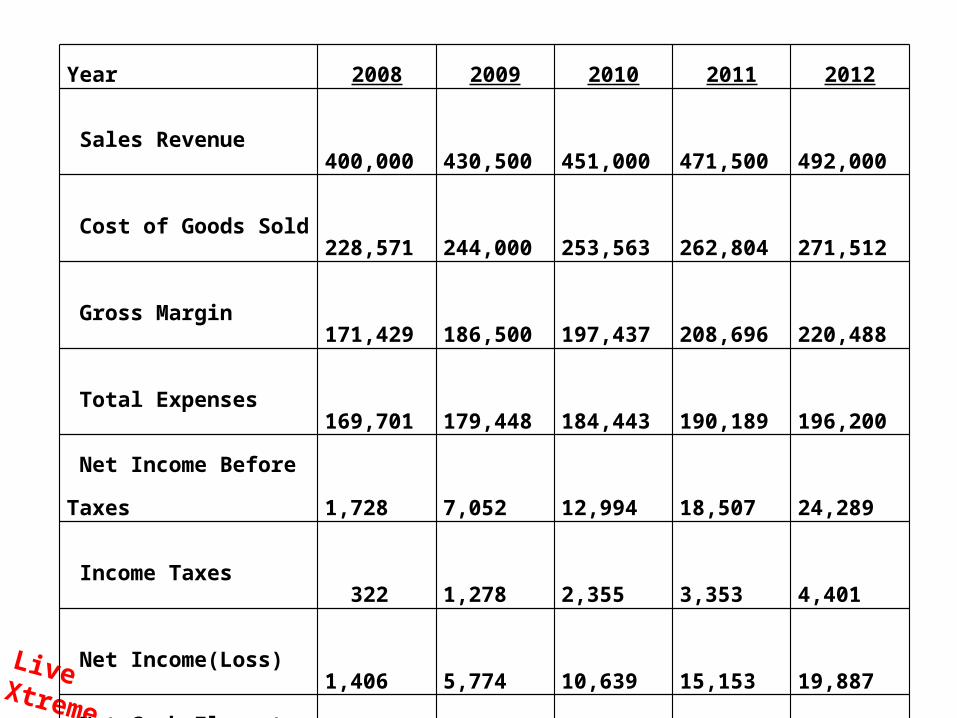
Year 2008 2009 2010 2011 2012
Sales Revenue 400,000 430,500 451,000 471,500 492,000
Cost of Goods Sold 228,571 244,000 253,563 262,804 271,512
Gross Margin 171,429 186,500 197,437 208,696 220,488
Total Expenses 169,701 179,448 184,443 190,189 196,200
Net Income Before
Taxes 1,728 7,052 12,994 18,507 24,289
Income Taxes 322 1,278 2,355 3,353 4,401
Net Income(Loss) 1,406 5,774 10,639 15,153 19,887
Net Cash Flows to
Equity 17,853 4,218 5,675 7,430 54,546
Net Present Value
(NPV) 16,595
IRR 38%

Cost of Debt Markup Labour Wage Sales Inventory-20%
0%
20%
40%
60%
80%
100%
120%
103%
-8%
16%
-5%
88%
62%
-4%
8%
-3%
26%
IRR = 0% NPV = 0
Sensitivity Analysis

Variable Base Case Worst Case Best Case
Sales (Year 1) 400,000 300,000 500,000
Mark up 75% 65% 85%
Wage/hr 12.00 15.00 10.00
Interest Rates 7.4% 10.0% 5.0%
Scenario NPV IRRAvg Annual
Cash Flow
Avg Annual
Net Income
Base Case 16,595 38% 8,808 10,572
Worst Case (297,500) n/a (65,926) (63,582)
Best Case 283,203 249% 72,204 73,502
Scenario Analysis
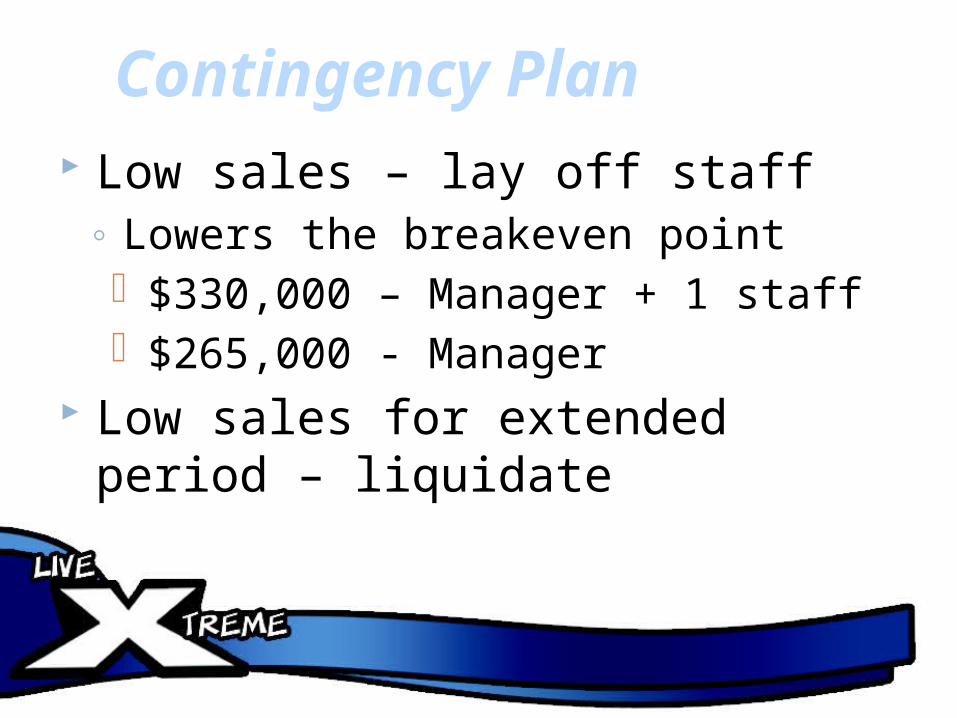
Contingency Plan Low sales – lay off staff◦ Lowers the breakeven point $330,000 – Manager + 1 staff $265,000 - Manager
Low sales for extended period – liquidate
Conclusion Business is viable
◦IRR= 38% Incorporate
◦Limit liability◦Tax implications
Sales are critical!◦Brand image◦Reputation◦Premium Product

Questions?