growth team membership asia pacific 2010 marketing priorities survey results
TRANSCRIPT
Growth Team MembershipTM: Asia Pacific Marketing Priorities 2010
Survey Results
October 2009
2
What is Growth Team Membership™?
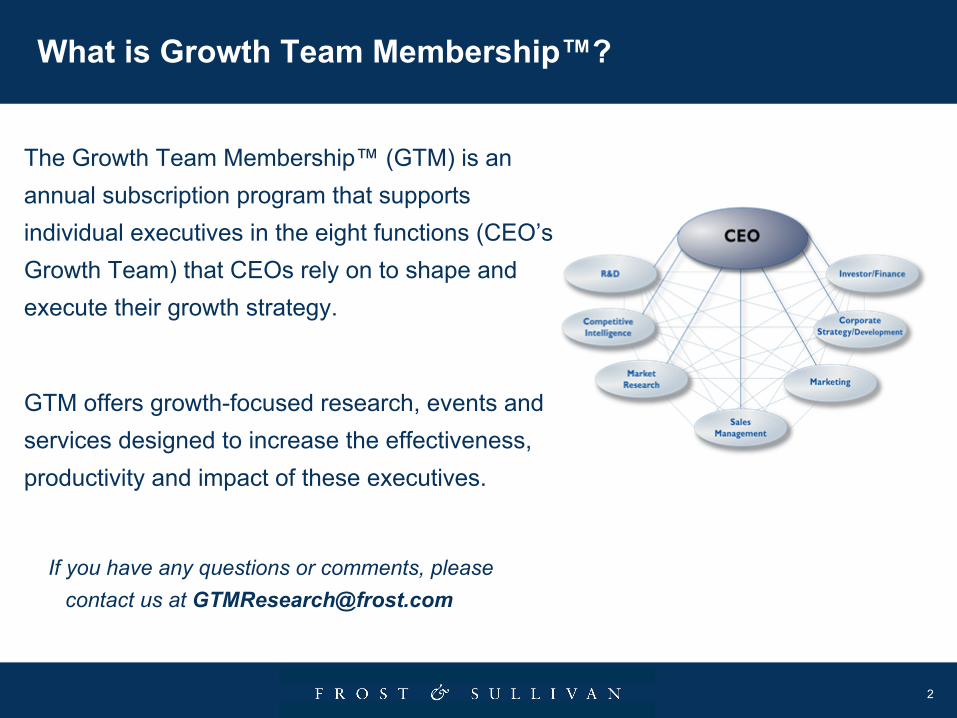
The Growth Team Membership™
(GTM) is an annual subscription program that supports individual executives in the eight functions (CEO’s Growth Team) that CEOs rely on to shape and execute their growth strategy.
GTM offers growth-focused research, events and services designed to increase the effectiveness, productivity and impact of these executives.
If you have any questions or comments, please contact us at [email protected]
3
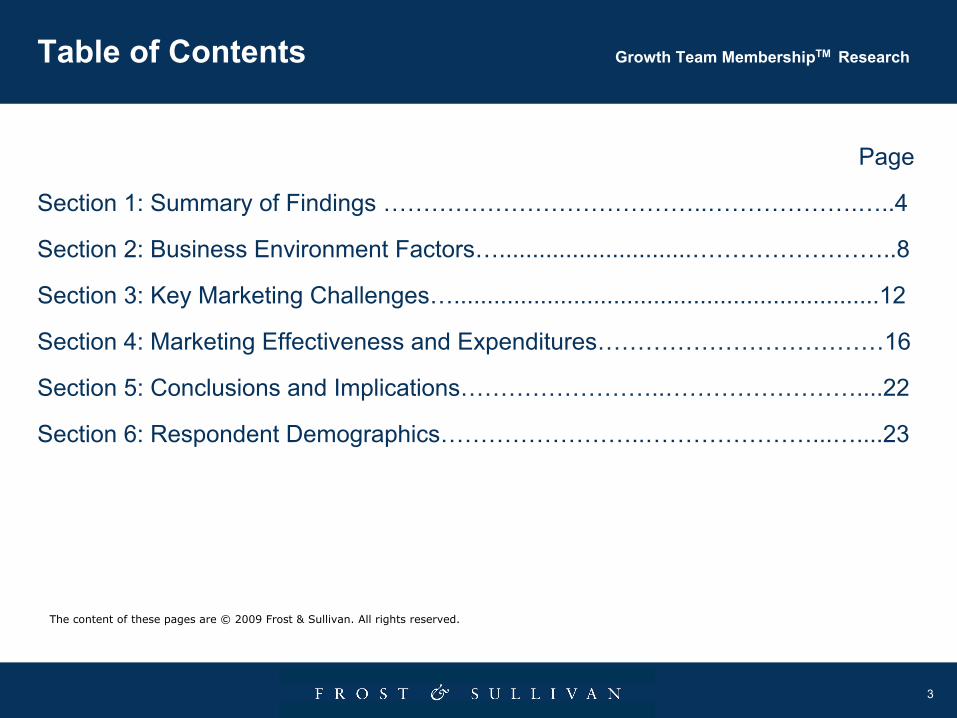
Table of Contents Growth Team MembershipTM Research
Page
Section 1: Summary of Findings …………………………………..……………….…..4
Section 2: Business Environment Factors….............................……………………..8
Section 3: Key Marketing Challenges…................................................................12
Section 4: Marketing Effectiveness and Expenditures………………………………16
Section 5: Conclusions and Implications……………………..……………………....22
Section 6: Respondent Demographics……………………..…………………...…....23
The content of these pages are ©
2009 Frost & Sullivan. All rights reserved.
4
Summary of Findings Growth Team MembershipTM Research
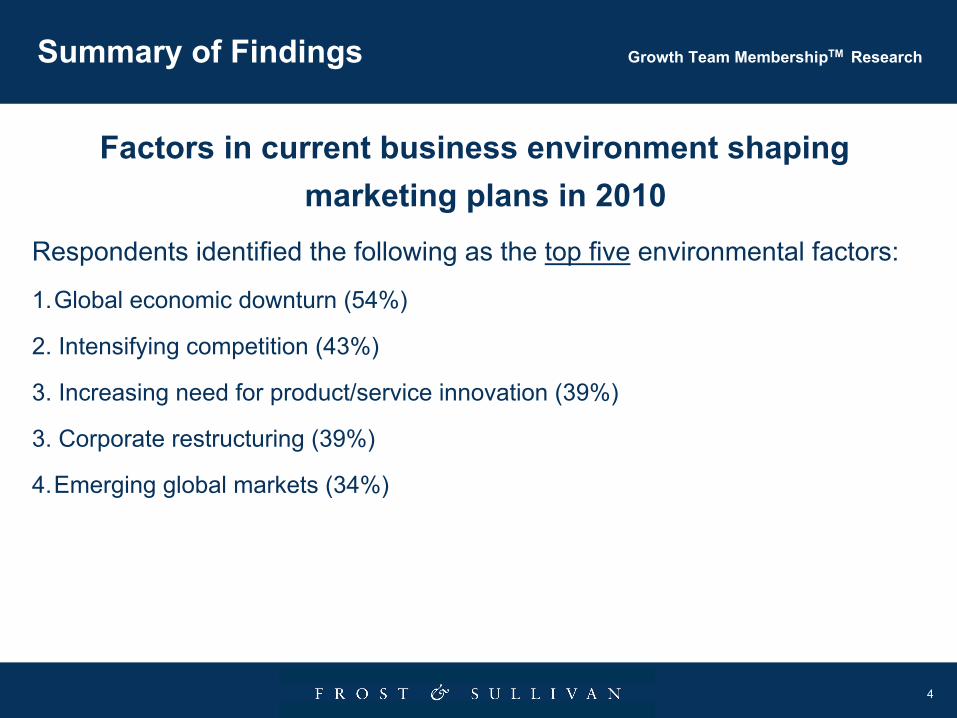
Factors in current business environment shaping marketing plans in 2010
Respondents identified the following as the top five
environmental factors:
1.Global economic downturn (54%)
2. Intensifying competition (43%)
3. Increasing need for product/service innovation (39%)
3. Corporate restructuring (39%)
4.Emerging global markets (34%)
5
Summary of Findings continued Growth Team MembershipTM Research
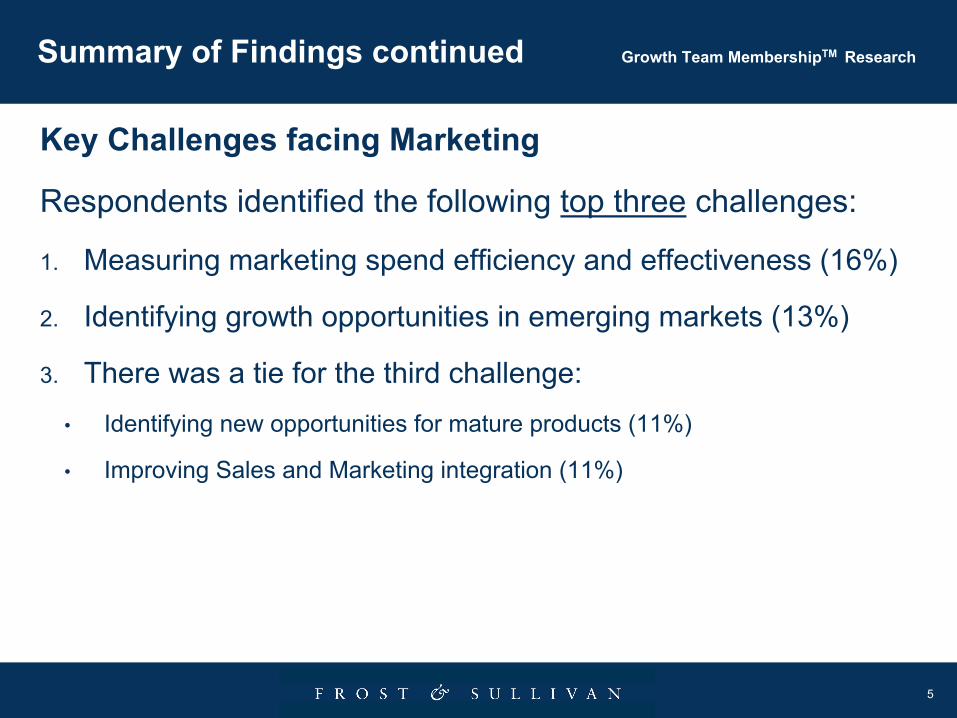
Key Challenges facing Marketing
Respondents identified the following top three
challenges:
1.
Measuring marketing spend efficiency and effectiveness (16%)
2.
Identifying growth opportunities in emerging markets (13%)
3.
There was a tie for the third challenge:
•
Identifying new opportunities for mature products (11%)
•
Improving Sales and Marketing integration (11%)
6
Summary of Findings continued Growth Team MembershipTM Research
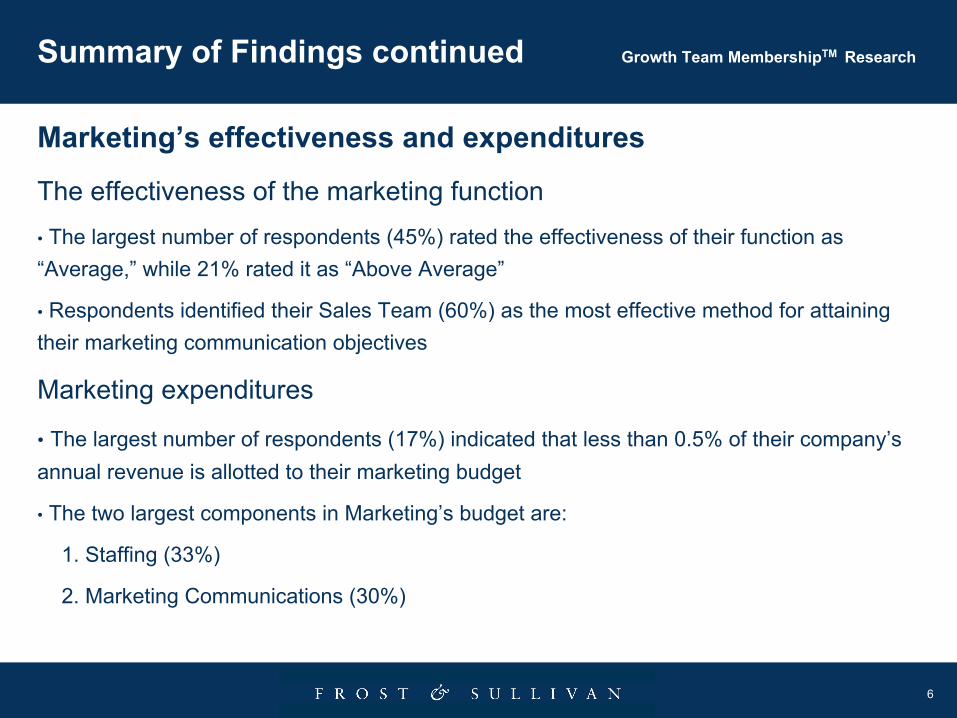
Marketing’s effectiveness and expenditures
The effectiveness of the marketing function•
The largest number of respondents (45%) rated the effectiveness
of their function as “Average,”
while 21% rated it as “Above Average”
•
Respondents identified their Sales Team (60%) as the most effective method for attaining their marketing communication objectives
Marketing expenditures
•
The largest number of respondents (17%) indicated that less than
0.5% of their company’s annual revenue is allotted to their marketing budget
• The two largest components in Marketing’s budget are:
1. Staffing (33%)
2. Marketing Communications (30%)
7
Summary of Findings continued Growth Team MembershipTM Research
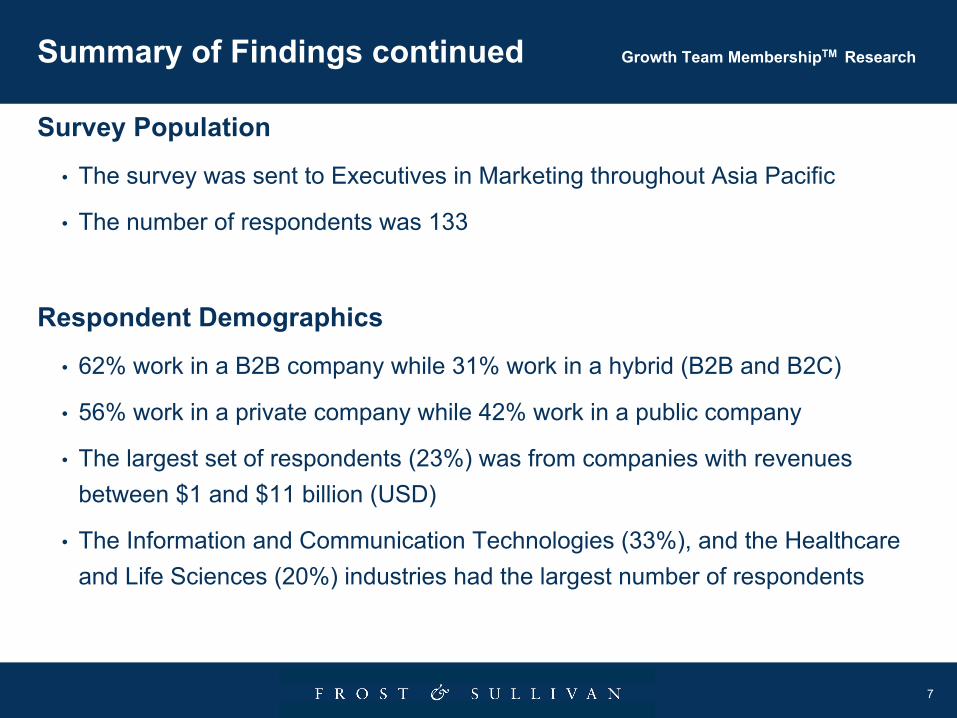
Survey Population
•
The survey was sent to Executives in Marketing throughout Asia Pacific
•
The number of respondents was 133
Respondent Demographics
•
62% work in a B2B company while 31% work in a hybrid (B2B and B2C)
•
56% work in a private company while 42% work in a public company
•
The largest set of respondents (23%) was from companies with revenues between $1 and $11 billion (USD)
•
The Information and Communication Technologies (33%), and the Healthcare and Life Sciences (20%) industries had the largest number of respondents
8
Growth Team MembershipTM Research
Business Environment Factors
9
Top Five Business Environment Factors Growth Team MembershipTM Research
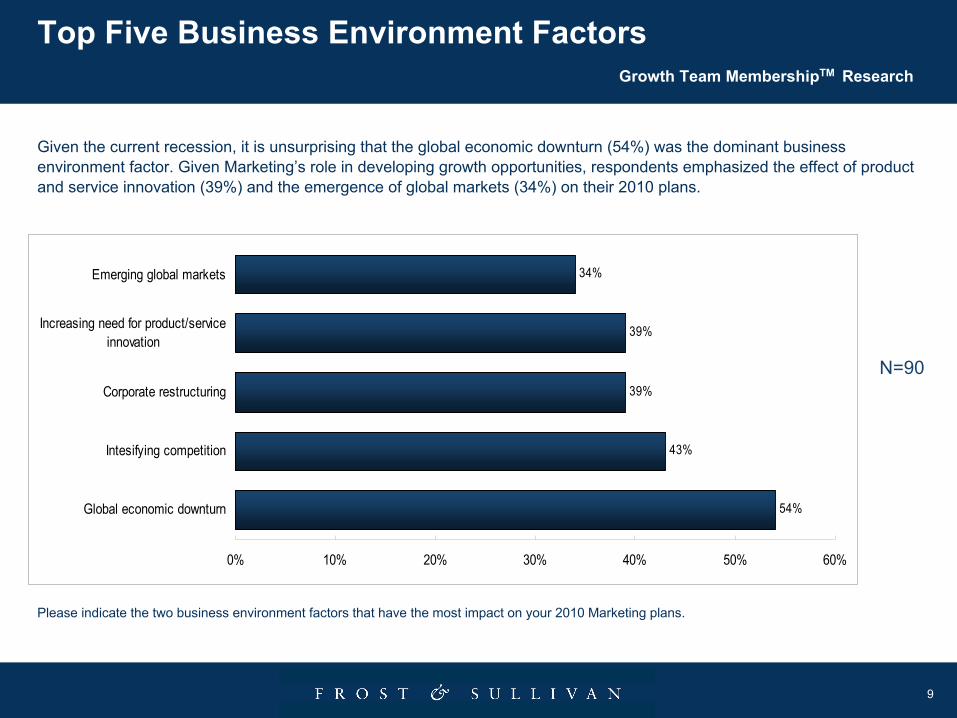
Given the current recession, it is unsurprising that the global economic downturn (54%) was the dominant business environment factor. Given Marketing’s role in developing growth opportunities, respondents emphasized the effect of product and service innovation (39%) and the emergence of global markets
(34%) on their 2010 plans.
Please indicate the two business environment factors that have the most impact on your 2010 Marketing plans.
N=90
54%
43%
39%
39%
34%
0% 10% 20% 30% 40% 50% 60%
Global economic downturn
Intesifying competition
Corporate restructuring
Increasing need for product/serviceinnovation
Emerging global markets
10
Business Environment Impact on Marketing Growth Team MembershipTM Research
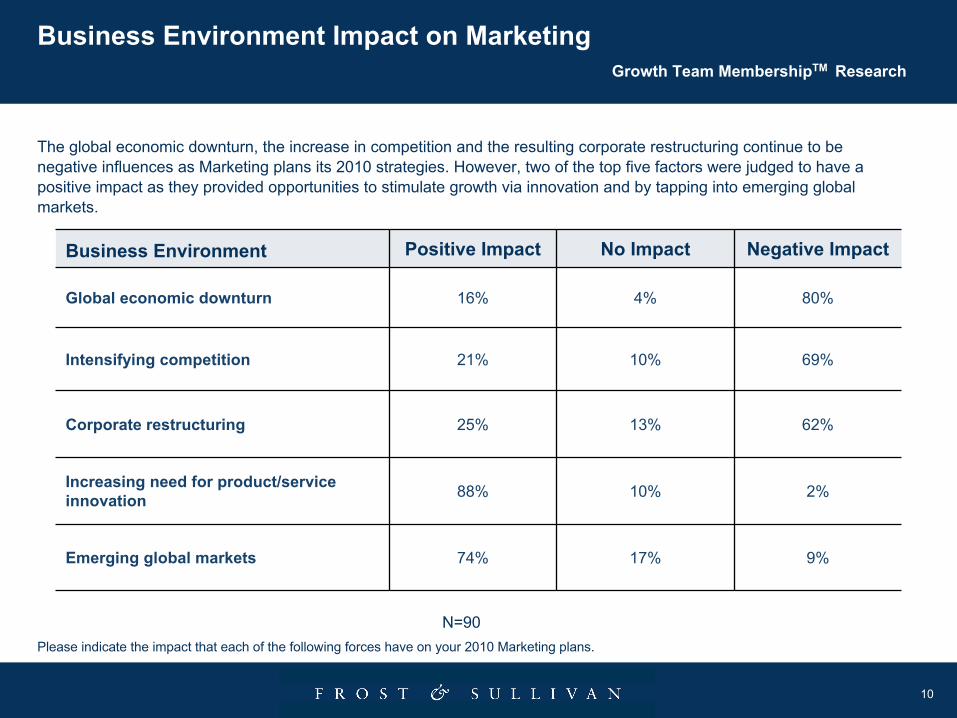
The global economic downturn, the increase in competition and the resulting corporate restructuring continue to be negative influences as Marketing plans its 2010 strategies. However, two of the top five factors were judged to have a positive impact as they provided opportunities to stimulate growth via innovation and by tapping into emerging global markets.
N=90Please indicate the impact that each of the following forces have on your 2010 Marketing plans.
Business Environment Positive Impact No Impact Negative Impact
Global economic downturn 16% 4% 80%
Intensifying competition 21% 10% 69%
Corporate restructuring 25% 13% 62%
Increasing need for product/service innovation 88% 10% 2%
Emerging global markets 74% 17% 9%
11
Direction of the Business Environment in the Next Six Months Growth Team MembershipTM Research
7%3%
12%12% 10%
28%
13%
50%
35%
49%
32%
19%19%
4% 5%
0%
10%
20%
30%
40%
50%
60%
National Economy IT Spending Unemployment
Worsening 2 Neutral 4 Improving
N=90
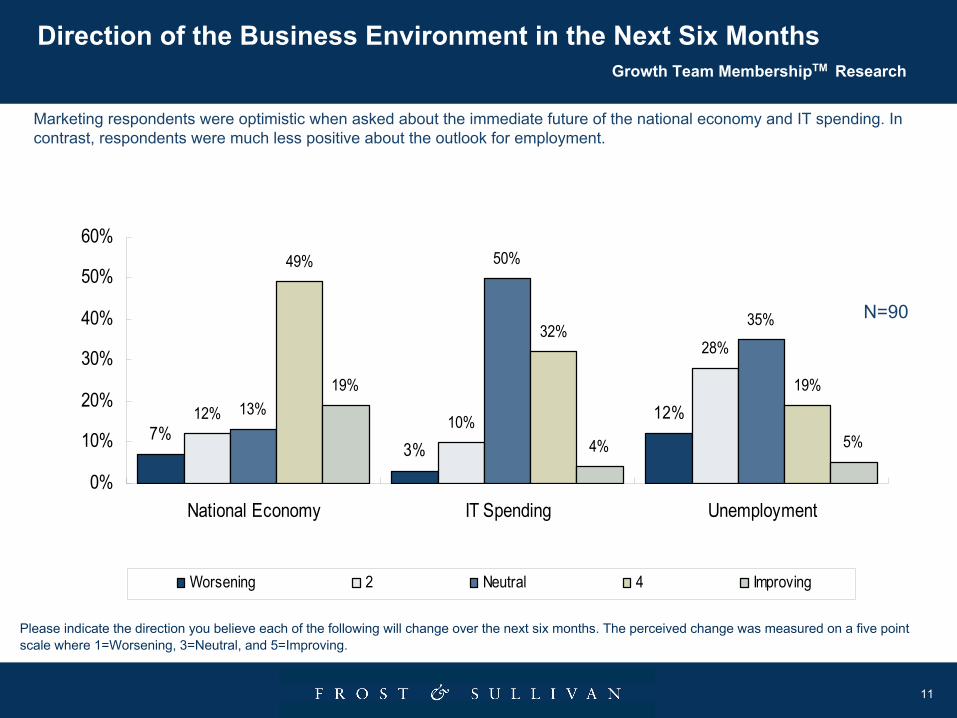
Please indicate the direction you believe each of the following will change over the next six months. The perceived change was measured on a five point scale where 1=Worsening, 3=Neutral, and 5=Improving.
Marketing respondents were optimistic when asked about the immediate future of the national economy and IT spending. In contrast, respondents were much less positive about the outlook for employment.

12
Growth Team MembershipTM Research
Key Marketing Challenges
13
Top Three Key Marketing Challenges Growth Team MembershipTM Research
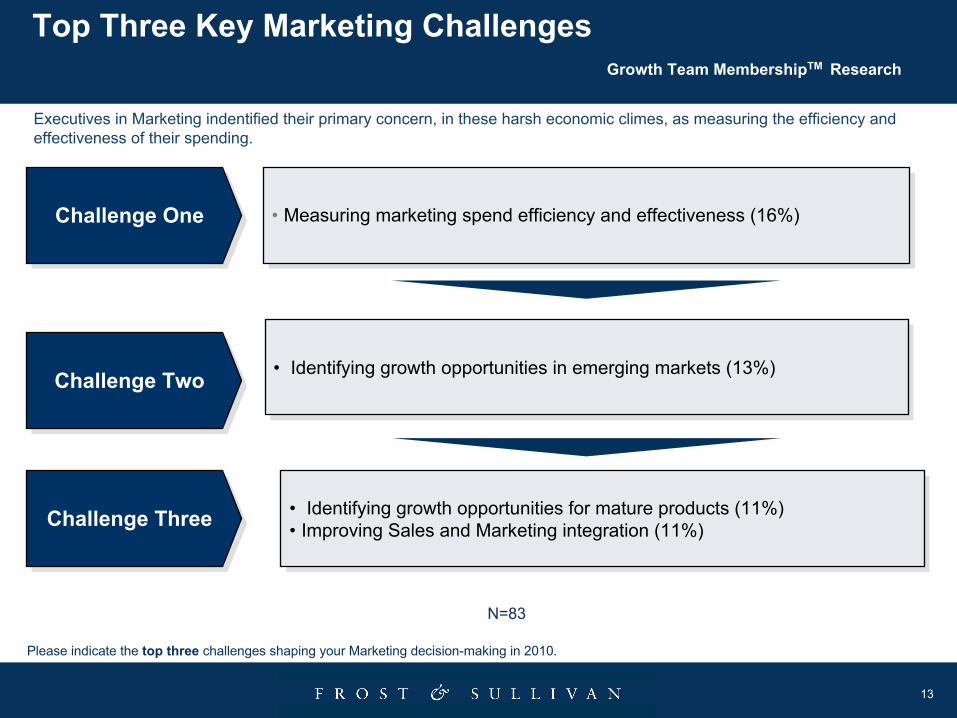
Challenge OneChallenge One •
Measuring marketing spend efficiency and effectiveness (16%)•
Measuring marketing spend efficiency and effectiveness (16%)
Challenge Two Challenge Two •
Identifying growth opportunities in emerging markets (13%)•
Identifying growth opportunities in emerging markets (13%)
Challenge ThreeChallenge Three
Executives in Marketing indentified their primary concern, in these harsh economic climes, as measuring the efficiency and effectiveness of their spending.
Please indicate the top three
challenges shaping your Marketing decision-making in 2010.
N=83
•
Identifying growth opportunities for mature products (11%)•
Improving Sales and Marketing integration (11%)•
Identifying growth opportunities for mature products (11%)•
Improving Sales and Marketing integration (11%)
14
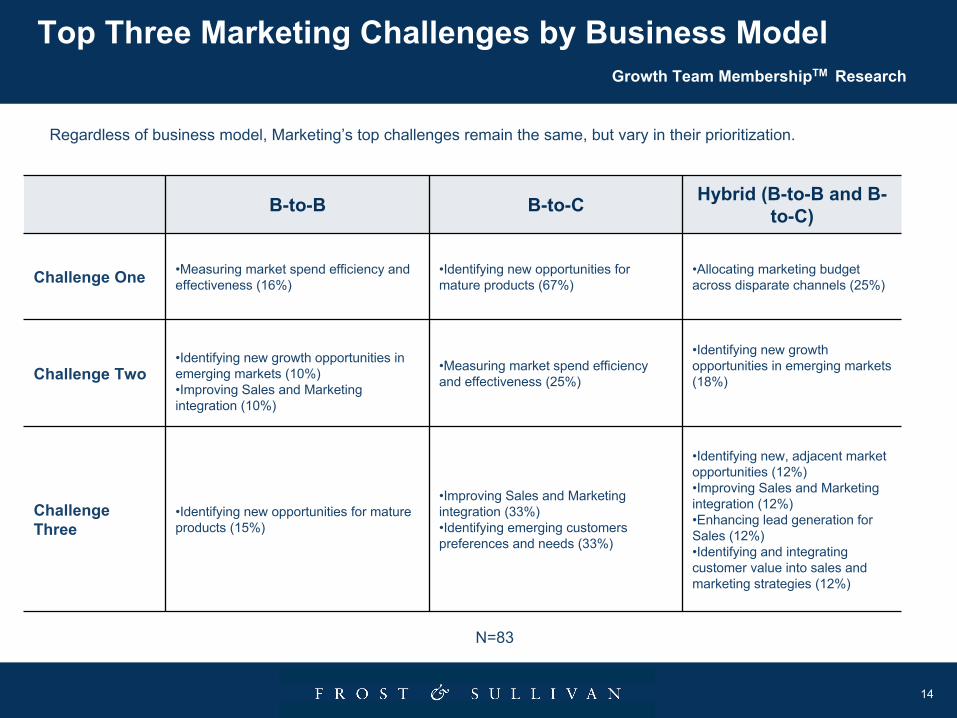
Top Three Marketing Challenges by Business Model Growth Team MembershipTM Research
B-to-B B-to-C Hybrid (B-to-B and B-
to-C)
Challenge One •Measuring market spend efficiency and effectiveness (16%)
•Identifying new opportunities for mature products (67%)
•Allocating marketing budget across disparate channels (25%)
Challenge Two •Identifying new growth opportunities in emerging markets (10%)•Improving Sales and Marketing integration (10%)
•Measuring market spend efficiency and effectiveness (25%)
•Identifying new growth opportunities in emerging markets (18%)
Challenge Three
•Identifying new opportunities for mature products (15%)
•Improving Sales and Marketing integration (33%)•Identifying emerging customers preferences and needs (33%)
•Identifying new, adjacent market opportunities (12%)•Improving Sales and Marketing integration (12%)•Enhancing lead generation for Sales (12%)•Identifying and integrating customer value into sales and marketing strategies (12%)
N=83
Regardless of business model, Marketing’s top challenges remain the same, but vary in their prioritization.
15
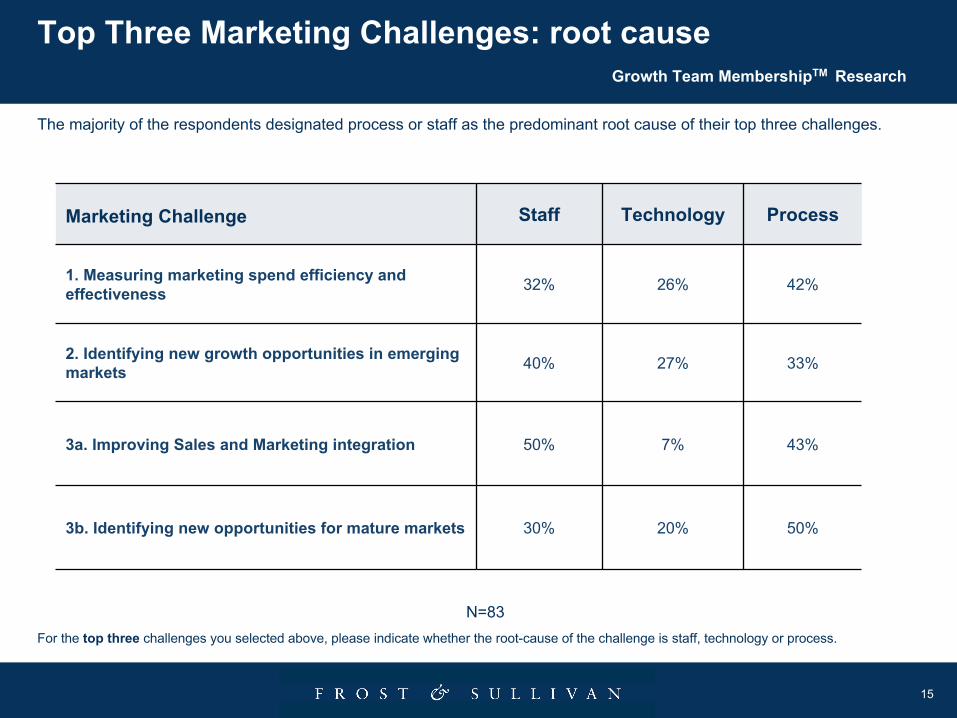
Top Three Marketing Challenges: root cause Growth Team MembershipTM Research
The majority of the respondents designated process or staff as the predominant root cause of their top three challenges.
N=83For the top three
challenges you selected above, please indicate whether the root-cause of the challenge is staff, technology or process.
Marketing Challenge Staff Technology Process
1. Measuring marketing spend efficiency and effectiveness 32% 26% 42%
2. Identifying new growth opportunities in emerging markets 40% 27% 33%
3a. Improving Sales and Marketing integration 50% 7% 43%
3b. Identifying new opportunities for mature markets 30% 20% 50%
16
Growth Team MembershipTM Research
Marketing Effectiveness and Expenditures
17
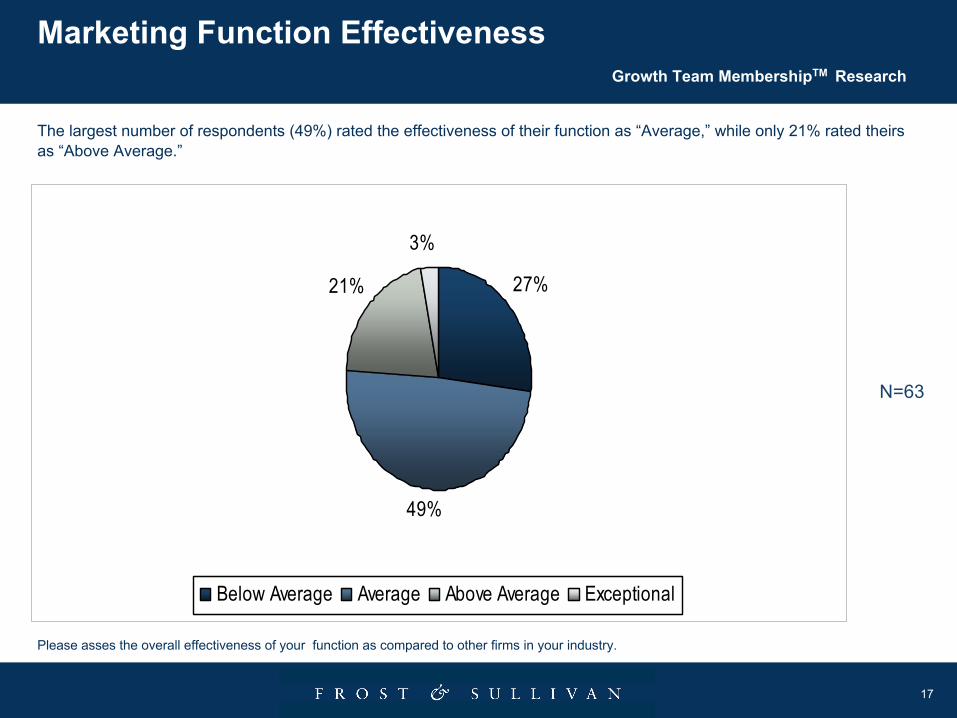
Marketing Function Effectiveness Growth Team MembershipTM Research
The largest number of respondents (49%) rated the effectiveness of their function as “Average,”
while only 21% rated theirs as “Above Average.”
Please asses the overall effectiveness of your function as compared to other firms in your industry.
N=63
27%21%
3%
49%
Below Average Average Above Average Exceptional
18
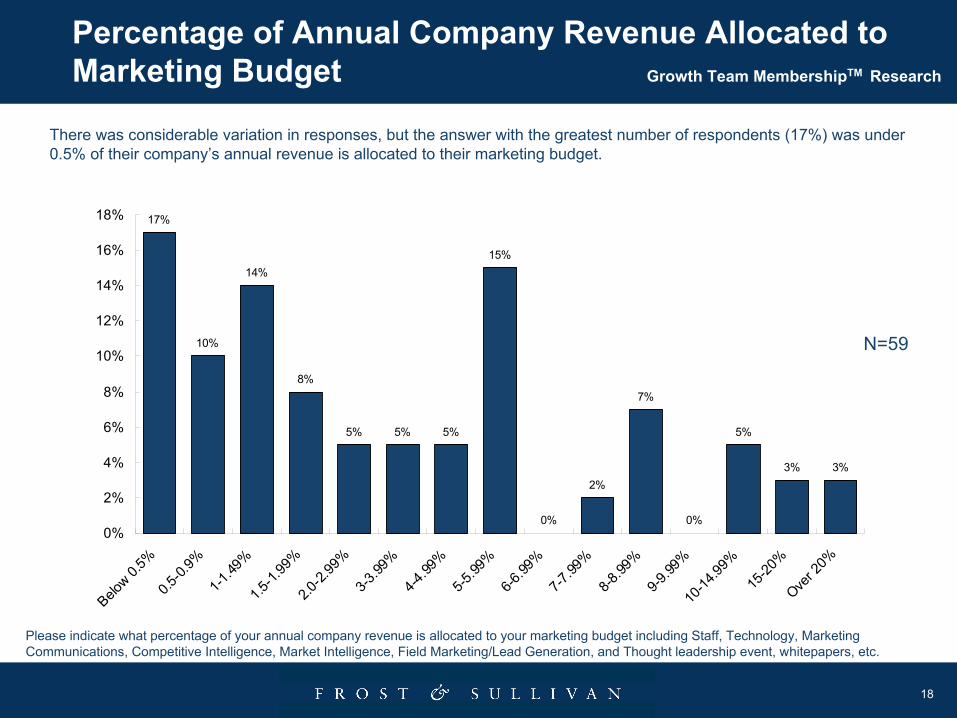
Percentage of Annual Company Revenue Allocated to Marketing Budget Growth Team MembershipTM Research
N=59
Please indicate what percentage of your annual company revenue is allocated to your marketing budget including Staff, Technology, Marketing Communications, Competitive Intelligence, Market Intelligence, Field Marketing/Lead Generation, and Thought leadership event, whitepapers, etc.
17%
14%
8%
5% 5% 5%
15%
0%
2%
7%
0%
5%
3% 3%
10%
0%
2%
4%
6%
8%
10%
12%
14%
16%
18%
Below 0.
5%0.5
-0.9%
1-1.49
%1.5
-1.99
%2.0
-2.99
%3-3
.99%
4-4.99
%5-5
.99%
6-6.99
%7-7
.99%
8-8.99
%9-9
.99%
10-14
.99%
15-20
%Ove
r 20%
There was considerable variation in responses, but the answer with the greatest number of respondents (17%) was under 0.5% of their company’s annual revenue is allocated to their marketing budget.
19
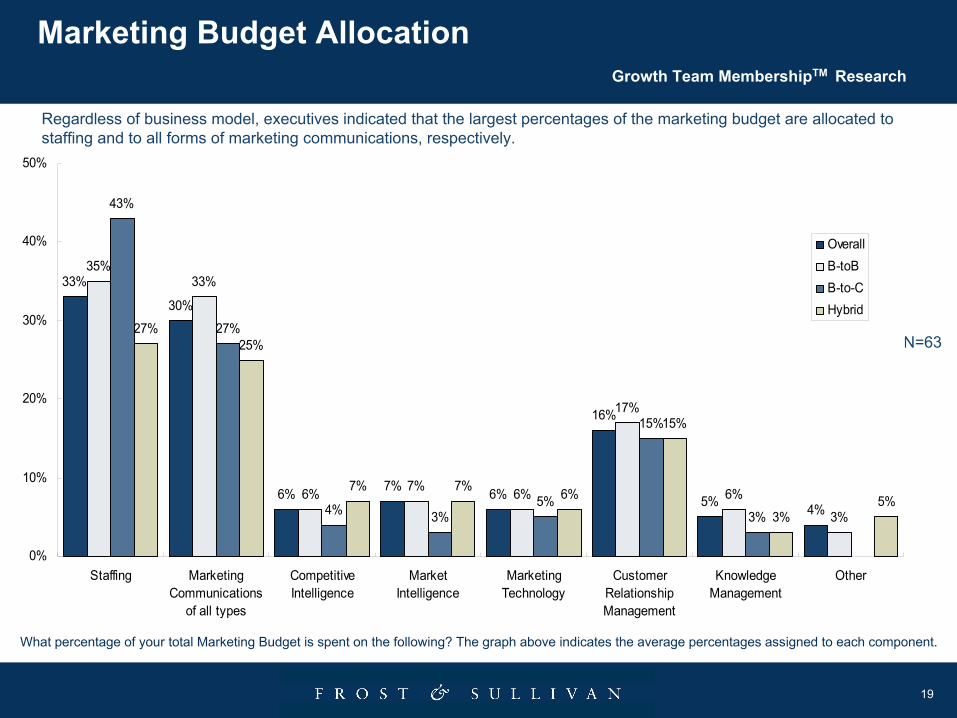
Marketing Budget Allocation Growth Team MembershipTM Research
N=63
What percentage of your total Marketing Budget is spent on the following? The graph above indicates the average percentages assigned to each component.
Regardless of business model, executives indicated that the largest percentages of the marketing budget are allocated to staffing and to all forms of marketing communications, respectively.
33%
30%
6% 7% 6%
16%
5% 4%
35%33%
6% 7% 6%
17%
6%
3%
43%
27%
4% 3%5%
15%
3%
27%25%
7% 7% 6%
15%
3%5%
0%
10%
20%
30%
40%
50%
Staffing MarketingCommunications
of all types
CompetitiveIntelligence
MarketIntelligence
MarketingTechnology
CustomerRelationshipManagement
KnowledgeManagement
Other
OverallB-toBB-to-CHybrid
20
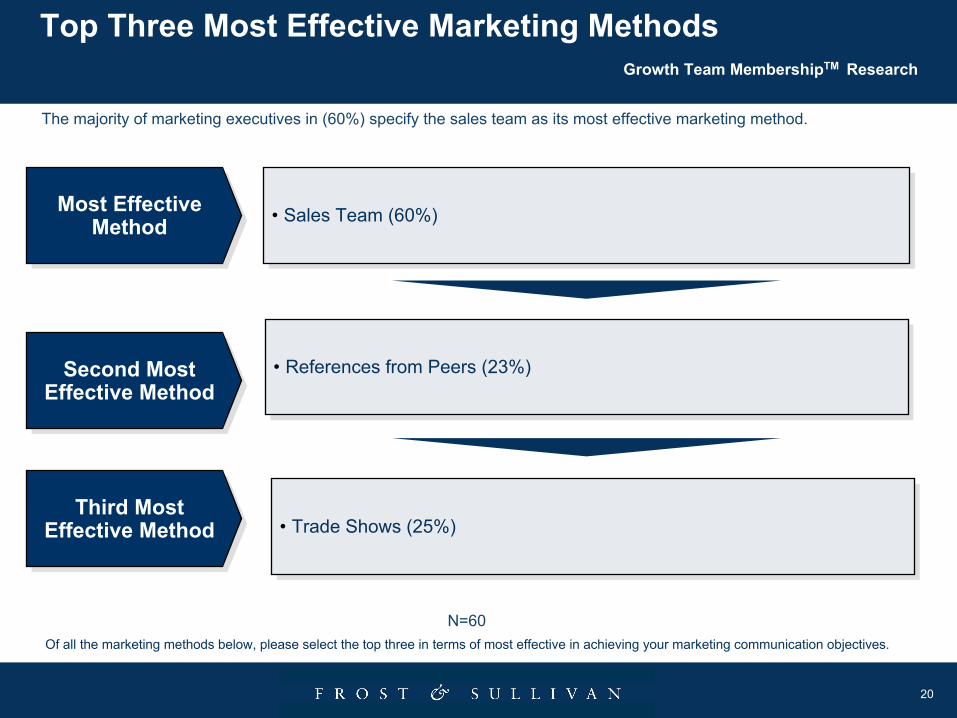
Top Three Most Effective Marketing Methods Growth Team MembershipTM Research
Most Effective Method
Most Effective Method •
Sales Team (60%)•
Sales Team (60%)
Second Most Effective Method
Second Most Effective Method
•
References from Peers (23%)•
References from Peers (23%)
Third Most Effective Method
Third Most Effective Method
The majority of marketing executives in (60%) specify the sales team as its most effective marketing method.
Of all the marketing methods below, please select the top three in terms of most effective in achieving your marketing communication objectives.
N=60
•
Trade Shows (25%)•
Trade Shows (25%)
21
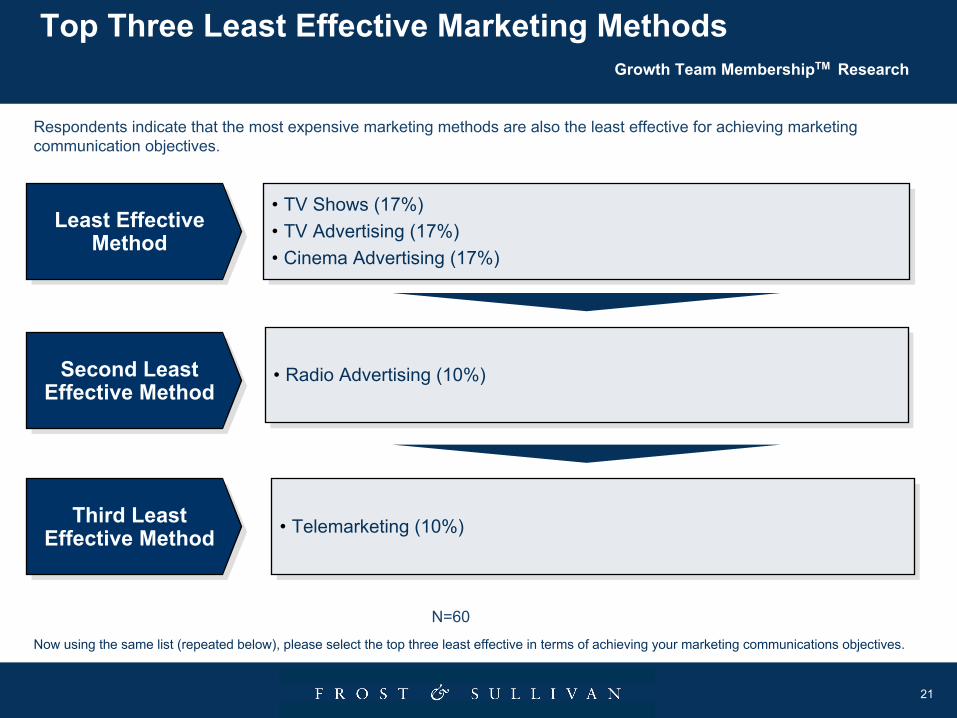
Top Three Least Effective Marketing Methods Growth Team MembershipTM Research
Least Effective Method
Least Effective Method
•
TV Shows (17%)•
TV Advertising (17%)•
Cinema Advertising (17%)
•
TV Shows (17%)•
TV Advertising (17%)•
Cinema Advertising (17%)
Second Least Effective Method
Second Least Effective Method •
Radio Advertising (10%)•
Radio Advertising (10%)
Third Least Effective Method
Third Least Effective Method
Respondents indicate that the most expensive marketing methods are also the least effective for achieving marketing communication objectives.
Now using the same list (repeated below), please select the top three least effective in terms of achieving your marketing communications objectives.
N=60
•
Telemarketing (10%)•
Telemarketing (10%)
22
Conclusions and Implications Growth Team MembershipTM Research
Business EnvironmentMarketing executives are predominantly concerned with the current economic downturn and the corporate restructuring and intensified competition it engenders. However, emerging global markets and innovation are seen as positive channels for potential growth.
Key Marketing ChallengesMarketing’s principal challenge, measuring the effectiveness and efficiency of spend, reflects the recession’s impact on Marketing: cost cutting, budgetary scrutiny, and doing more with less resources. The pressure to identify growth in a restrained market is evident in Marketing’s other challenges: identifying new avenues of growth for mature products, and tapping into emerging markets.
Given Marketing’s indication that their Sales Team is their most effective marketing asset, another key challenge to overcome is improving Marketing’s relationship with Sales. Addressing the root-
causes of these challenges necessitates Marketing enhancing their processes and staffing.
Moving ForwardThe Growth Team MembershipTM
is focusing its Best Practice Guidebooks to address the key issues that have been identified in this survey.
If you have any questions or comments please contact us at [email protected]

23
Growth Team MembershipTM Research
Respondent Demographics
24
Demographics: Enterprise Type Growth Team MembershipTM Research
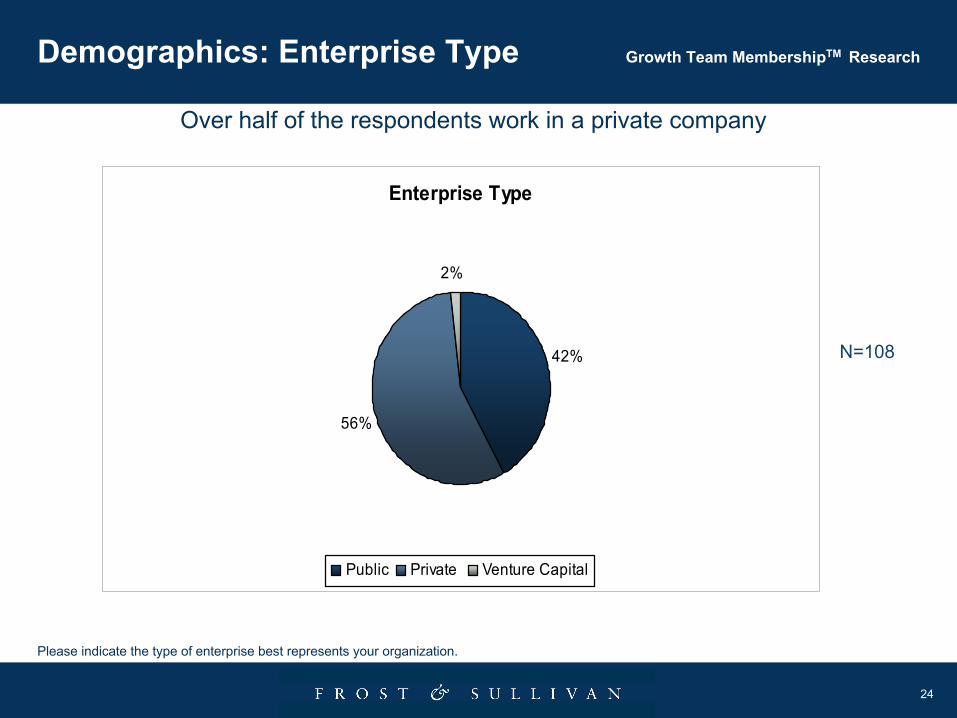
Over half of the respondents work in a private company
Please indicate the type of enterprise best represents your organization.
N=108
Enterprise Type
42%
2%
56%
Public Private Venture Capital
25
Demographics: Business Model Growth Team MembershipTM Research
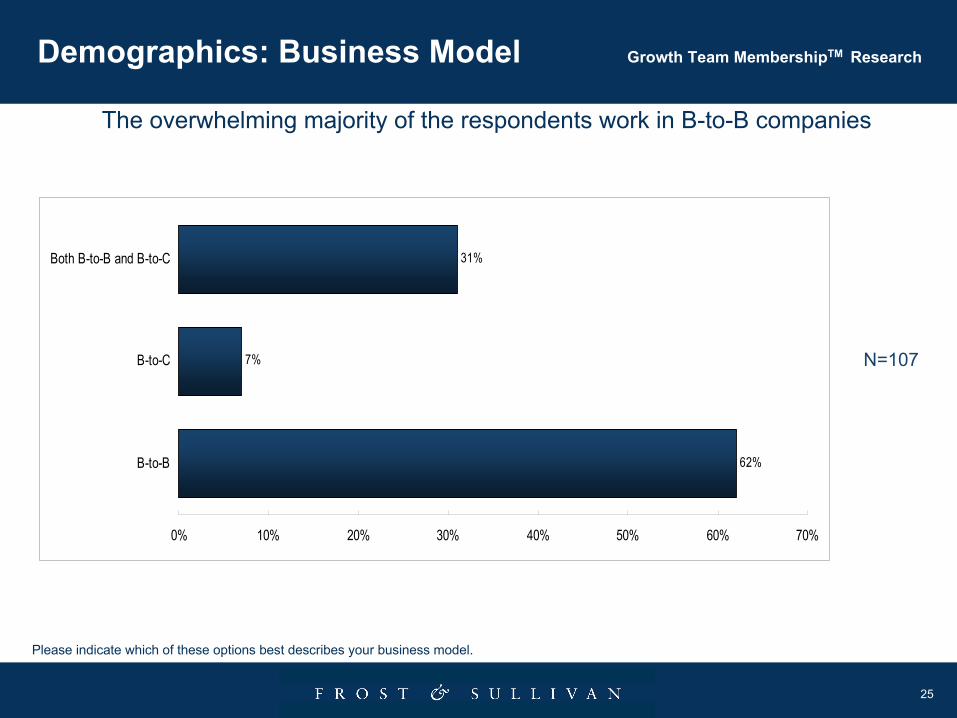
The overwhelming majority of the respondents work in B-to-B companies
Please indicate which of these options best describes your business model.
N=107
62%
7%
31%
0% 10% 20% 30% 40% 50% 60% 70%
B-to-B
B-to-C
Both B-to-B and B-to-C
26
Demographics: Company Revenue Growth Team MembershipTM Research
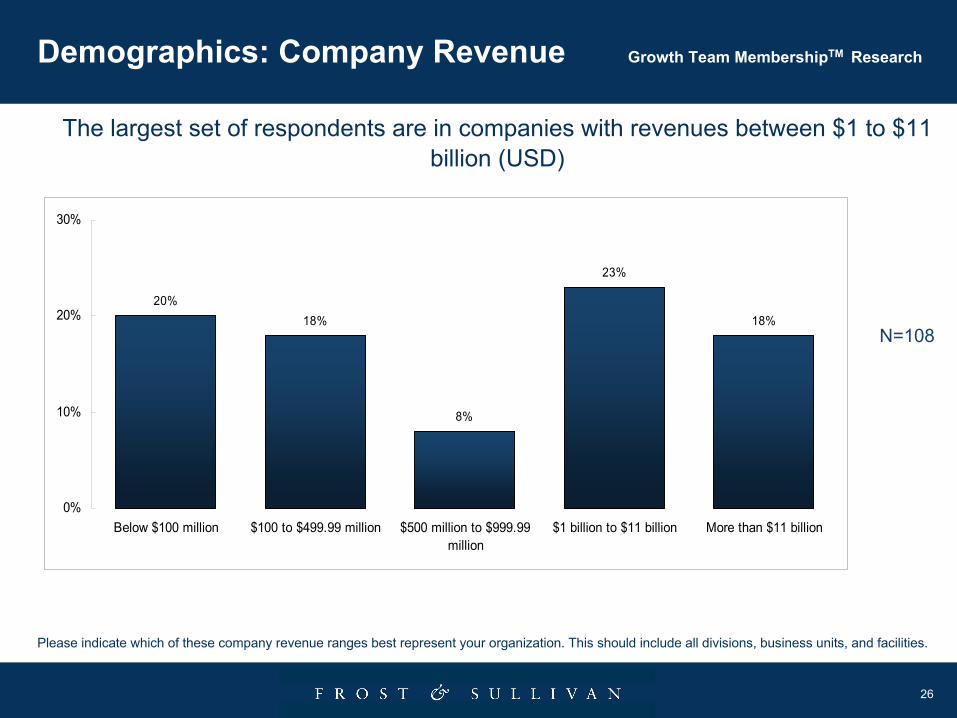
The largest set of respondents are in companies with revenues between $1 to $11 billion (USD)
Please indicate which of these company revenue ranges best represent your organization. This should include all divisions, business units, and facilities.
N=108
20%18%
8%
23%
18%
0%
10%
20%
30%
Below $100 million $100 to $499.99 million $500 million to $999.99million
$1 billion to $11 billion More than $11 billion
27
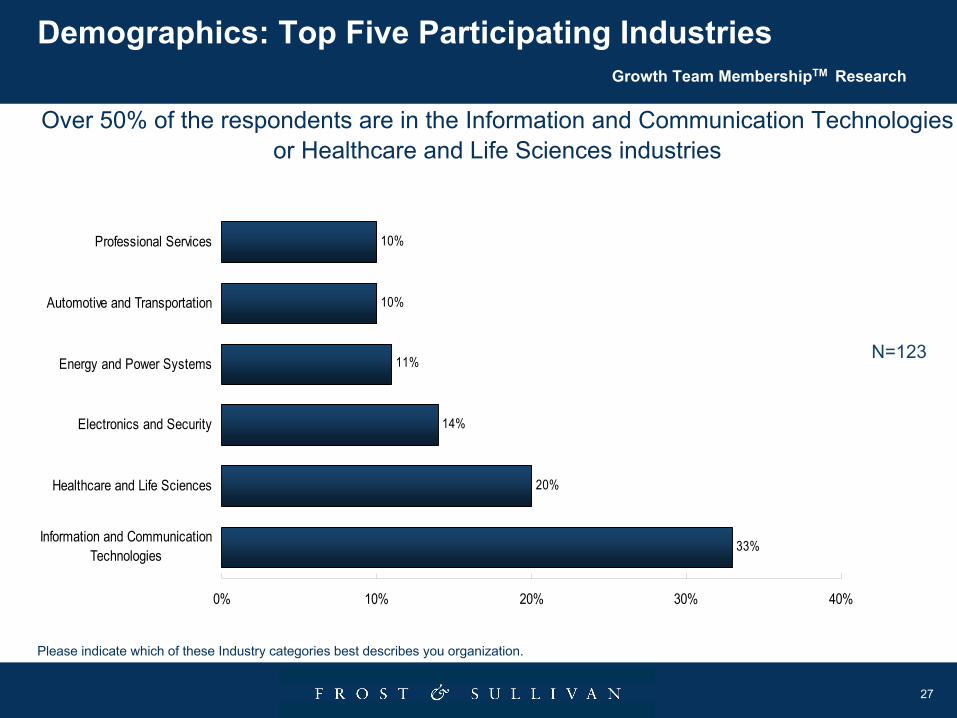
Demographics: Top Five Participating Industries Growth Team MembershipTM Research
Over 50% of the respondents are in the Information and Communication Technologies or Healthcare and Life Sciences industries
Please indicate which of these Industry categories best describes you organization.
N=123
33%
20%
14%
11%
10%
10%
0% 10% 20% 30% 40%
Information and CommunicationTechnologies
Healthcare and Life Sciences
Electronics and Security
Energy and Power Systems
Automotive and Transportation
Professional Services