growing, fast and slow - instituto fernand braudel de...
TRANSCRIPT
Growing, Fast and SlowSpeech given by Andrew G. Haldane, Chief Economist at the Bank of England, on
University of East Anglia
17 February 2015
With this brilliant analysis of the long-term trajectory of the world economy, we introduce a series of Occasional Papers that may interest members and friends of the Fernand Braudel Institute of World Economics.
Tonight, I want to discuss economic growth. This may sound like standard fare. In the media, economists spend much of their time discussing growth and its statistical counterpart, Gross Domestic Product or GDP. At least for some, this focus is misplaced. For example, it is increasingly well-recognised that GDP is a partial, and often imperfect, measure of societal well-being. As Einstein said, not all that can be counted counts.
But even if it is not all that counts, sustained economic growth remains the single most important determinant of rising societal living standards. To bring that point to life, consider two economies – China and Italy. As recently as 1990, the aggregate annual income of these two economies was roughly equal. Now let’s run these economies forward, with China growing at more than 10% per year, Italy by less than 1% per year.
By 2014, what do we find? Due to the magic of compound interest, China is now almost eight times the size of Italy. Indeed, China creates a new economy the size of Italy every 18 months; an economy the size of Portugal every quarter; an economy the size of Greece every
month; and an economy the size of Cyprus every week. Those things that can be counted sometimes really do count.
Today’s policy debates bear testimony to that. Since the financial crisis, global growth has under-performed. In the decade prior to it, advanced economy growth averaged 3% per year. In the period since, it has averaged just 1%. The world has
grown fast, then slow. That has led some to fear “secular stagnation” – a lengthy period of sub-par growth. The self-
same concerns were voiced at the time of the Great Depression in the 1930s.
The economic jury is still out on whether recent rates of growth are a
temporary post-crisis dip or a longer-lasting valley in our economic fortunes. Pessimists point to high levels of debt and inequality, worsening demographics and stagnating levels of educational attainment.5 Optimists appeal
to a new industrial revolution in digital technology. Given its importance to living standards, this debate is one of the key issues of our time.
Some insight into that debate can be provided by looking
at patterns of growth through a long lens. Over long runs of history, it is possible to
detect distinct phase shifts in growth. Some growth epochs have seen secular stagnation, others secular innovation.
Understanding the determinants of these growth phases - sociological and technological –
Guilherme Kramer
2
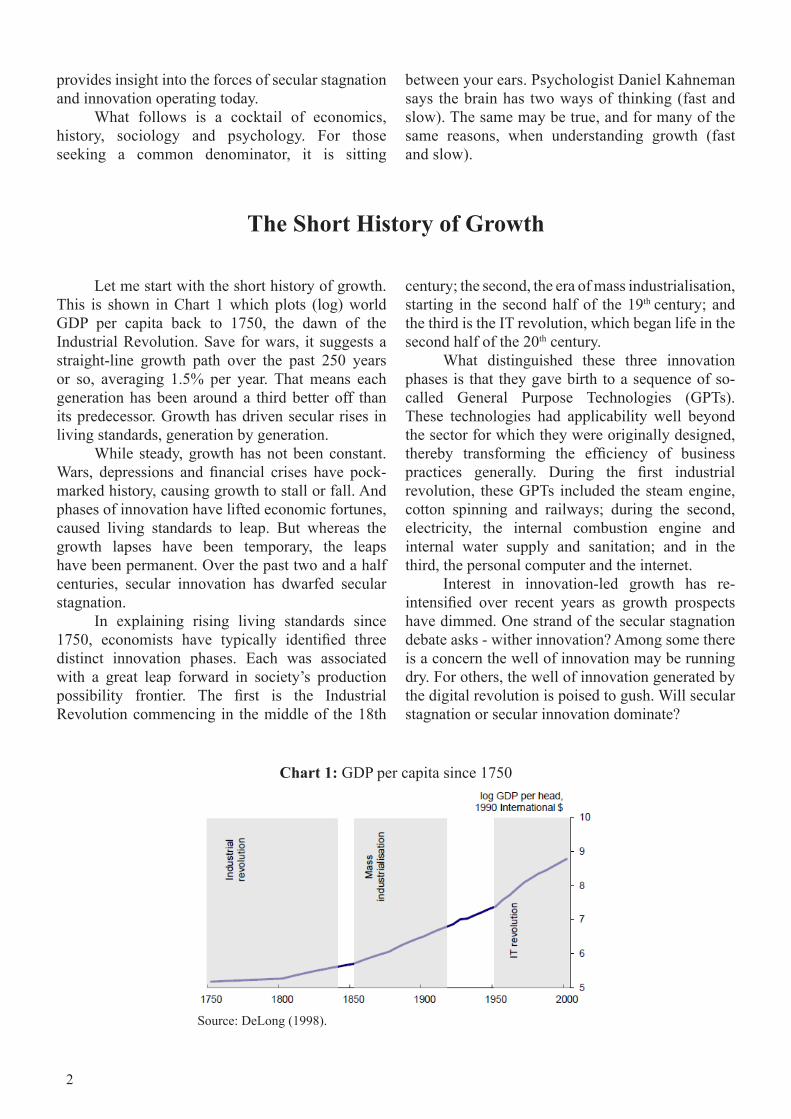
Let me start with the short history of growth. This is shown in Chart 1 which plots (log) world GDP per capita back to 1750, the dawn of the Industrial Revolution. Save for wars, it suggests a straight-line growth path over the past 250 years or so, averaging 1.5% per year. That means each generation has been around a third better off than its predecessor. Growth has driven secular rises in living standards, generation by generation.
While steady, growth has not been constant. Wars, depressions and financial crises have pock-marked history, causing growth to stall or fall. And phases of innovation have lifted economic fortunes, caused living standards to leap. But whereas the growth lapses have been temporary, the leaps have been permanent. Over the past two and a half centuries, secular innovation has dwarfed secular stagnation.
In explaining rising living standards since 1750, economists have typically identified three distinct innovation phases. Each was associated with a great leap forward in society’s production possibility frontier. The first is the Industrial Revolution commencing in the middle of the 18th
The Short History of Growth
Chart 1: GDP per capita since 1750
Source: DeLong (1998).
century; the second, the era of mass industrialisation, starting in the second half of the 19th century; and the third is the IT revolution, which began life in the second half of the 20th century.
What distinguished these three innovation phases is that they gave birth to a sequence of so-called General Purpose Technologies (GPTs). These technologies had applicability well beyond the sector for which they were originally designed, thereby transforming the efficiency of business practices generally. During the first industrial revolution, these GPTs included the steam engine, cotton spinning and railways; during the second, electricity, the internal combustion engine and internal water supply and sanitation; and in the third, the personal computer and the internet.
Interest in innovation-led growth has re-intensified over recent years as growth prospects have dimmed. One strand of the secular stagnation debate asks - wither innovation? Among some there is a concern the well of innovation may be running dry. For others, the well of innovation generated by the digital revolution is poised to gush. Will secular stagnation or secular innovation dominate?
provides insight into the forces of secular stagnation and innovation operating today.
What follows is a cocktail of economics, history, sociology and psychology. For those seeking a common denominator, it is sitting
between your ears. Psychologist Daniel Kahneman says the brain has two ways of thinking (fast and slow). The same may be true, and for many of the same reasons, when understanding growth (fast and slow).
3
To begin to address that question, let’s start by taking a longer look at the past. One reason for doing so is that the long history of growth looks rather different than the short. Secularly rising living standards have become the social and economic norm. No-one can recall a time when the growth escalator has moved anything other than upwards.
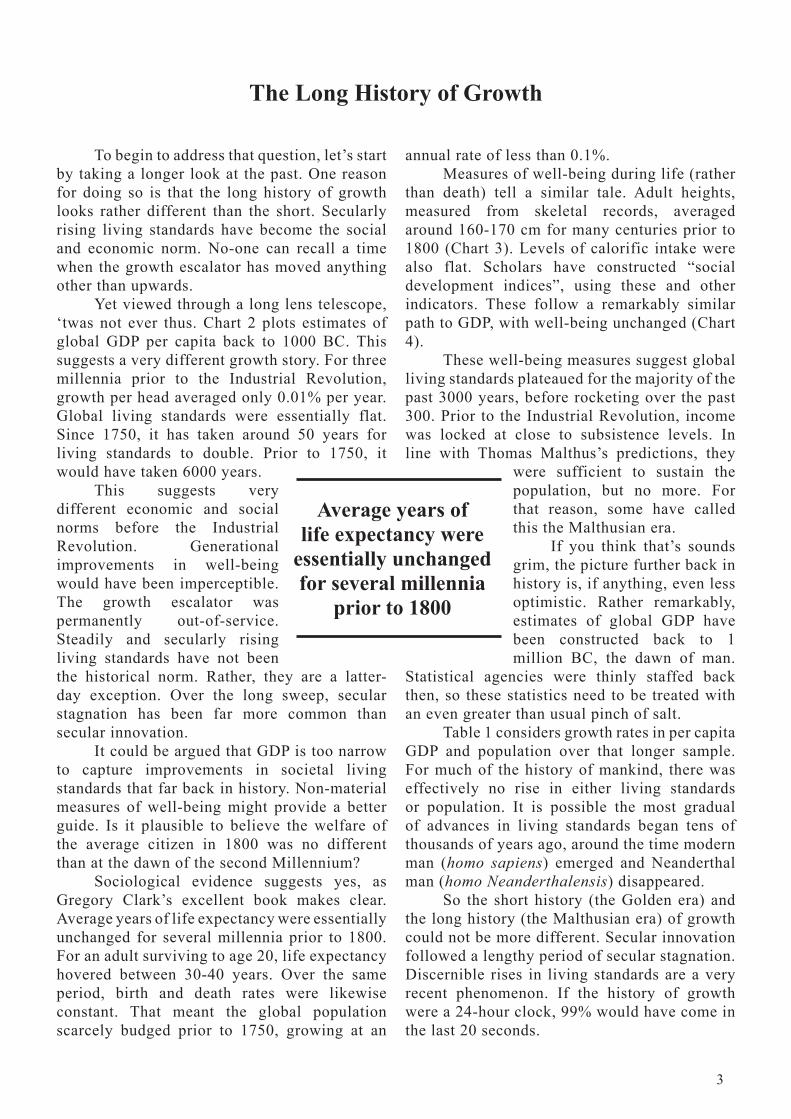
Yet viewed through a long lens telescope, ‘twas not ever thus. Chart 2 plots estimates of global GDP per capita back to 1000 BC. This suggests a very different growth story. For three millennia prior to the Industrial Revolution, growth per head averaged only 0.01% per year. Global living standards were essentially flat. Since 1750, it has taken around 50 years for living standards to double. Prior to 1750, it would have taken 6000 years.
This suggests very different economic and social norms before the Industrial Revolution. Generational improvements in well-being would have been imperceptible. The growth escalator was permanently out-of-service. Steadily and secularly rising living standards have not been the historical norm. Rather, they are a latter-day exception. Over the long sweep, secular stagnation has been far more common than secular innovation.
It could be argued that GDP is too narrow to capture improvements in societal living standards that far back in history. Non-material measures of well-being might provide a better guide. Is it plausible to believe the welfare of the average citizen in 1800 was no different than at the dawn of the second Millennium?
Sociological evidence suggests yes, as Gregory Clark’s excellent book makes clear. Average years of life expectancy were essentially unchanged for several millennia prior to 1800. For an adult surviving to age 20, life expectancy hovered between 30-40 years. Over the same period, birth and death rates were likewise constant. That meant the global population scarcely budged prior to 1750, growing at an
The Long History of Growth
annual rate of less than 0.1%.Measures of well-being during life (rather
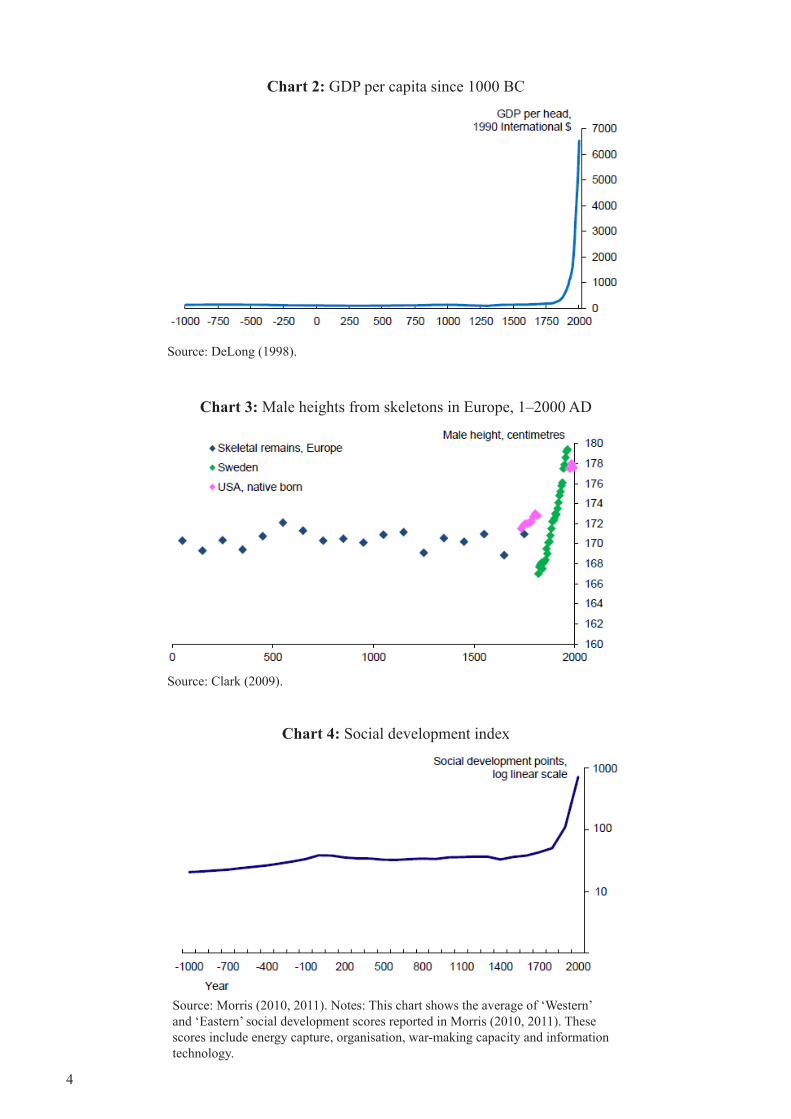
than death) tell a similar tale. Adult heights, measured from skeletal records, averaged around 160-170 cm for many centuries prior to 1800 (Chart 3). Levels of calorific intake were also flat. Scholars have constructed “social development indices”, using these and other indicators. These follow a remarkably similar path to GDP, with well-being unchanged (Chart 4).
These well-being measures suggest global living standards plateaued for the majority of the past 3000 years, before rocketing over the past 300. Prior to the Industrial Revolution, income was locked at close to subsistence levels. In line with Thomas Malthus’s predictions, they
were sufficient to sustain the population, but no more. For that reason, some have called this the Malthusian era.
If you think that’s sounds grim, the picture further back in history is, if anything, even less optimistic. Rather remarkably, estimates of global GDP have been constructed back to 1 million BC, the dawn of man.
Statistical agencies were thinly staffed back then, so these statistics need to be treated with an even greater than usual pinch of salt.
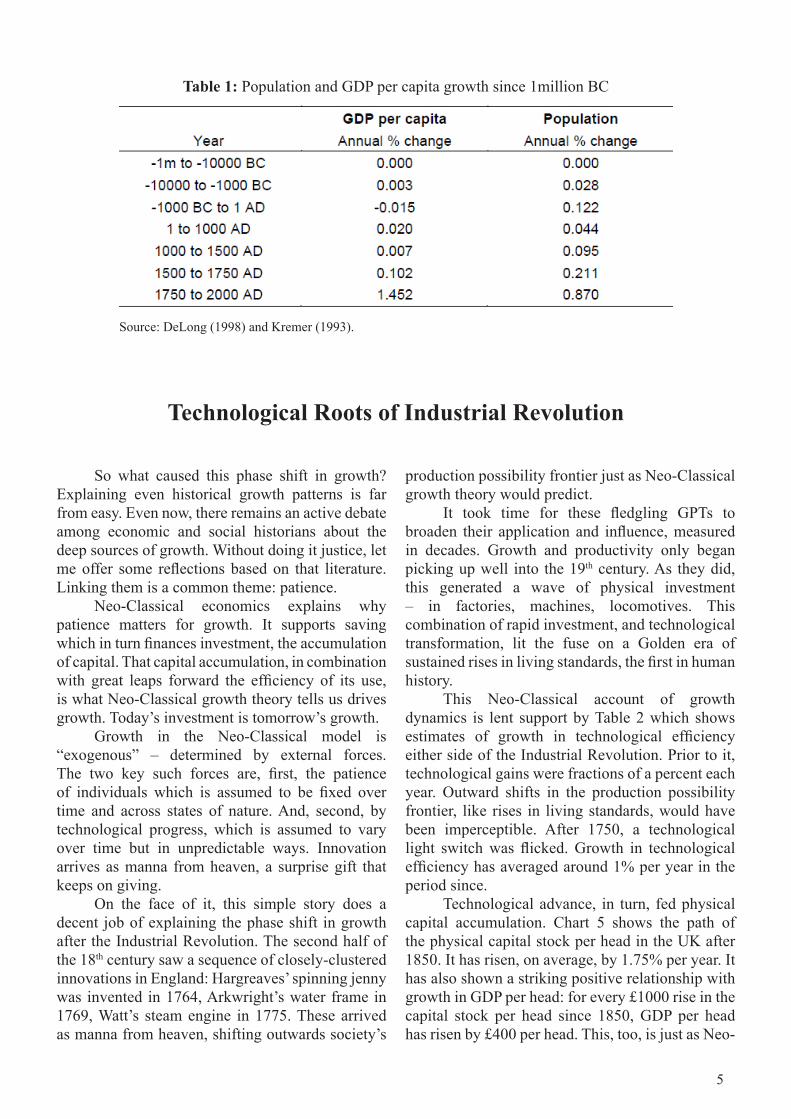
Table 1 considers growth rates in per capita GDP and population over that longer sample. For much of the history of mankind, there was effectively no rise in either living standards or population. It is possible the most gradual of advances in living standards began tens of thousands of years ago, around the time modern man (homo sapiens) emerged and Neanderthal man (homo Neanderthalensis) disappeared.
So the short history (the Golden era) and the long history (the Malthusian era) of growth could not be more different. Secular innovation followed a lengthy period of secular stagnation. Discernible rises in living standards are a very recent phenomenon. If the history of growth were a 24-hour clock, 99% would have come in the last 20 seconds.
Average years of life expectancy were
essentially unchanged for several millennia
prior to 1800
4
Chart 2: GDP per capita since 1000 BC
Source: DeLong (1998).
Chart 3: Male heights from skeletons in Europe, 1–2000 AD
Source: Clark (2009).
Source: Morris (2010, 2011). Notes: This chart shows the average of ‘Western’ and ‘Eastern’ social development scores reported in Morris (2010, 2011). These scores include energy capture, organisation, war-making capacity and information technology.
Chart 4: Social development index
5
So what caused this phase shift in growth? Explaining even historical growth patterns is far from easy. Even now, there remains an active debate among economic and social historians about the deep sources of growth. Without doing it justice, let me offer some reflections based on that literature. Linking them is a common theme: patience.
Neo-Classical economics explains why patience matters for growth. It supports saving which in turn finances investment, the accumulation of capital. That capital accumulation, in combination with great leaps forward the efficiency of its use, is what Neo-Classical growth theory tells us drives growth. Today’s investment is tomorrow’s growth.
Growth in the Neo-Classical model is “exogenous” – determined by external forces. The two key such forces are, first, the patience of individuals which is assumed to be fixed over time and across states of nature. And, second, by technological progress, which is assumed to vary over time but in unpredictable ways. Innovation arrives as manna from heaven, a surprise gift that keeps on giving.
On the face of it, this simple story does a decent job of explaining the phase shift in growth after the Industrial Revolution. The second half of the 18th century saw a sequence of closely-clustered innovations in England: Hargreaves’ spinning jenny was invented in 1764, Arkwright’s water frame in 1769, Watt’s steam engine in 1775. These arrived as manna from heaven, shifting outwards society’s
Technological Roots of Industrial Revolution
Table 1: Population and GDP per capita growth since 1million BC
Source: DeLong (1998) and Kremer (1993).
production possibility frontier just as Neo-Classical growth theory would predict.
It took time for these fledgling GPTs to broaden their application and influence, measured in decades. Growth and productivity only began picking up well into the 19th century. As they did, this generated a wave of physical investment – in factories, machines, locomotives. This combination of rapid investment, and technological transformation, lit the fuse on a Golden era of sustained rises in living standards, the first in human history.
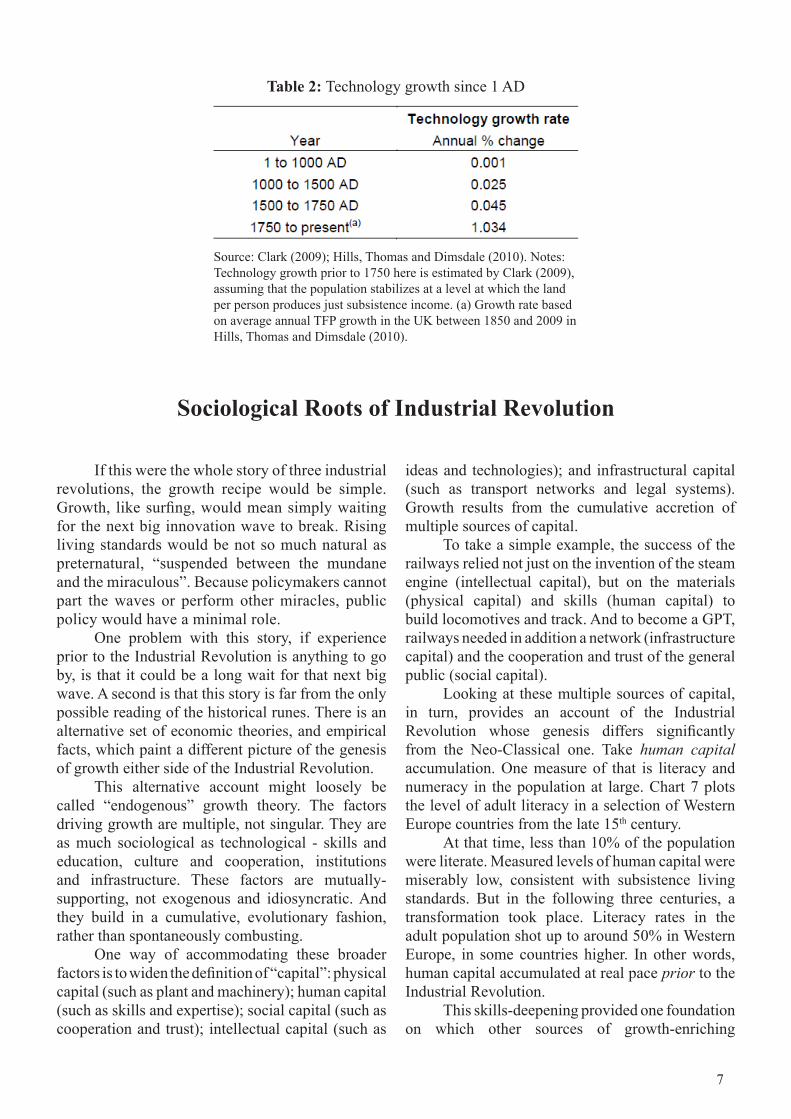
This Neo-Classical account of growth dynamics is lent support by Table 2 which shows estimates of growth in technological efficiency either side of the Industrial Revolution. Prior to it, technological gains were fractions of a percent each year. Outward shifts in the production possibility frontier, like rises in living standards, would have been imperceptible. After 1750, a technological light switch was flicked. Growth in technological efficiency has averaged around 1% per year in the period since.
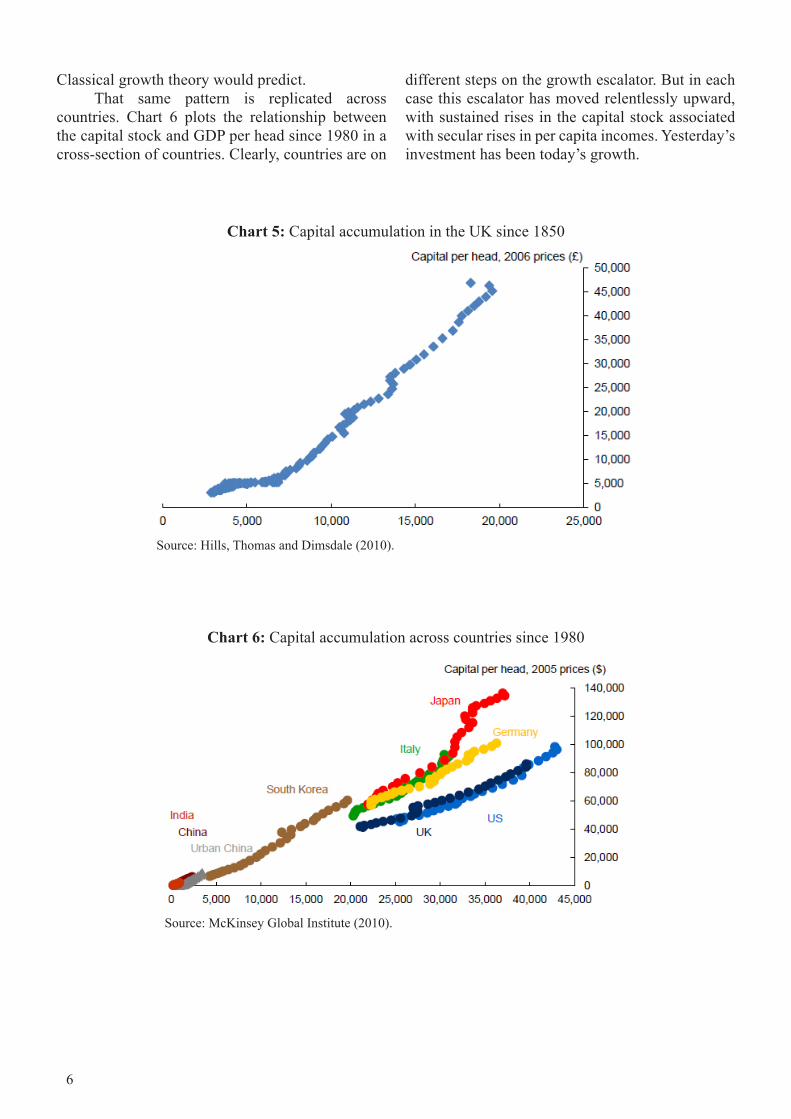
Technological advance, in turn, fed physical capital accumulation. Chart 5 shows the path of the physical capital stock per head in the UK after 1850. It has risen, on average, by 1.75% per year. It has also shown a striking positive relationship with growth in GDP per head: for every £1000 rise in the capital stock per head since 1850, GDP per head has risen by £400 per head. This, too, is just as Neo-
6
Classical growth theory would predict. That same pattern is replicated across
countries. Chart 6 plots the relationship between the capital stock and GDP per head since 1980 in a cross-section of countries. Clearly, countries are on
Chart 5: Capital accumulation in the UK since 1850
Source: Hills, Thomas and Dimsdale (2010).
Chart 6: Capital accumulation across countries since 1980
Source: McKinsey Global Institute (2010).
different steps on the growth escalator. But in each case this escalator has moved relentlessly upward, with sustained rises in the capital stock associated with secular rises in per capita incomes. Yesterday’s investment has been today’s growth.
7
If this were the whole story of three industrial revolutions, the growth recipe would be simple. Growth, like surfing, would mean simply waiting for the next big innovation wave to break. Rising living standards would be not so much natural as preternatural, “suspended between the mundane and the miraculous”. Because policymakers cannot part the waves or perform other miracles, public policy would have a minimal role.
One problem with this story, if experience prior to the Industrial Revolution is anything to go by, is that it could be a long wait for that next big wave. A second is that this story is far from the only possible reading of the historical runes. There is an alternative set of economic theories, and empirical facts, which paint a different picture of the genesis of growth either side of the Industrial Revolution.
This alternative account might loosely be called “endogenous” growth theory. The factors driving growth are multiple, not singular. They are as much sociological as technological - skills and education, culture and cooperation, institutions and infrastructure. These factors are mutually-supporting, not exogenous and idiosyncratic. And they build in a cumulative, evolutionary fashion, rather than spontaneously combusting.
One way of accommodating these broader factors is to widen the definition of “capital”: physical capital (such as plant and machinery); human capital (such as skills and expertise); social capital (such as cooperation and trust); intellectual capital (such as
Sociological Roots of Industrial Revolution
Table 2: Technology growth since 1 AD
Source: Clark (2009); Hills, Thomas and Dimsdale (2010). Notes: Technology growth prior to 1750 here is estimated by Clark (2009), assuming that the population stabilizes at a level at which the land per person produces just subsistence income. (a) Growth rate based on average annual TFP growth in the UK between 1850 and 2009 in Hills, Thomas and Dimsdale (2010).
ideas and technologies); and infrastructural capital (such as transport networks and legal systems). Growth results from the cumulative accretion of multiple sources of capital.
To take a simple example, the success of the railways relied not just on the invention of the steam engine (intellectual capital), but on the materials (physical capital) and skills (human capital) to build locomotives and track. And to become a GPT, railways needed in addition a network (infrastructure capital) and the cooperation and trust of the general public (social capital).
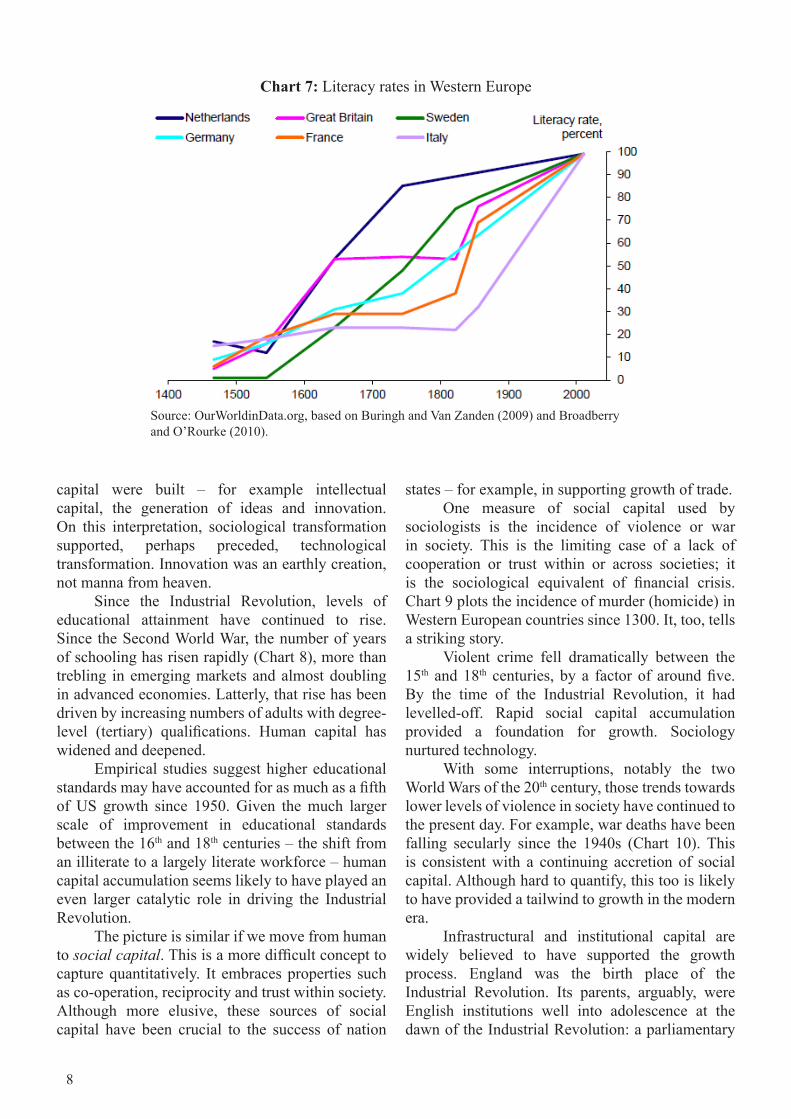
Looking at these multiple sources of capital, in turn, provides an account of the Industrial Revolution whose genesis differs significantly from the Neo-Classical one. Take human capital accumulation. One measure of that is literacy and numeracy in the population at large. Chart 7 plots the level of adult literacy in a selection of Western Europe countries from the late 15th century.
At that time, less than 10% of the population were literate. Measured levels of human capital were miserably low, consistent with subsistence living standards. But in the following three centuries, a transformation took place. Literacy rates in the adult population shot up to around 50% in Western Europe, in some countries higher. In other words, human capital accumulated at real pace prior to the Industrial Revolution.
This skills-deepening provided one foundation on which other sources of growth-enriching
8
capital were built – for example intellectual capital, the generation of ideas and innovation. On this interpretation, sociological transformation supported, perhaps preceded, technological transformation. Innovation was an earthly creation, not manna from heaven.
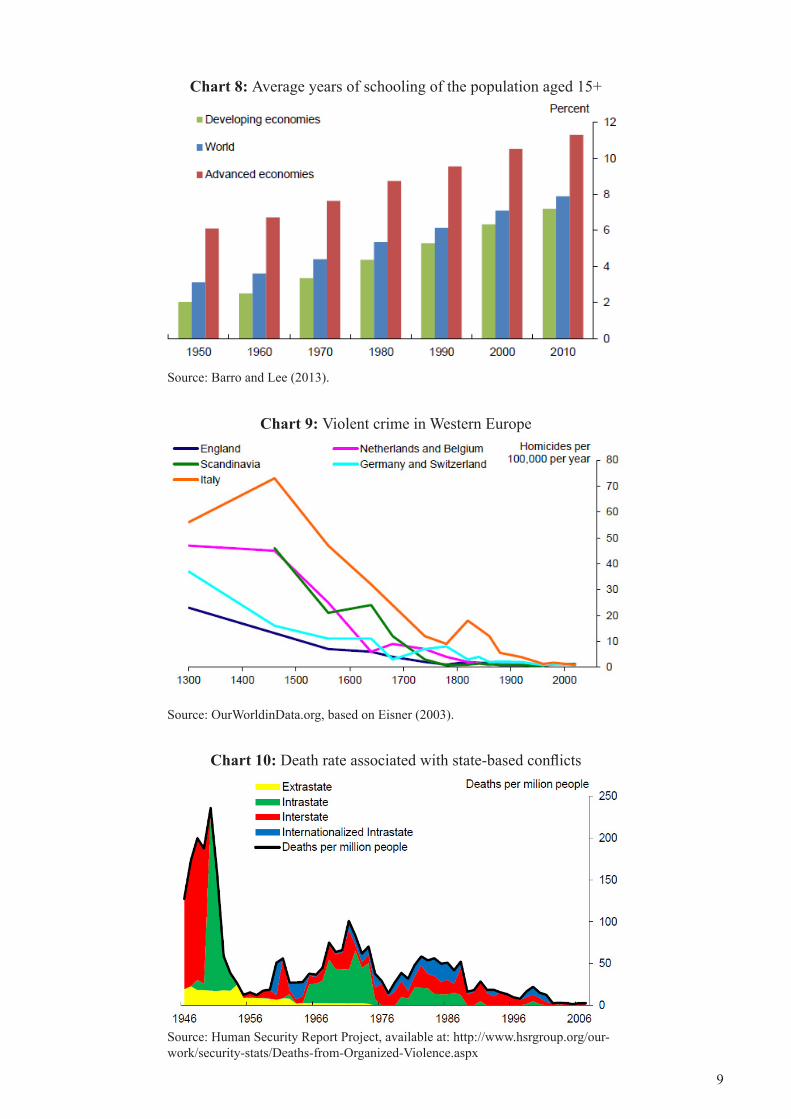
Since the Industrial Revolution, levels of educational attainment have continued to rise. Since the Second World War, the number of years of schooling has risen rapidly (Chart 8), more than trebling in emerging markets and almost doubling in advanced economies. Latterly, that rise has been driven by increasing numbers of adults with degree-level (tertiary) qualifications. Human capital has widened and deepened.
Empirical studies suggest higher educational standards may have accounted for as much as a fifth of US growth since 1950. Given the much larger scale of improvement in educational standards between the 16th and 18th centuries – the shift from an illiterate to a largely literate workforce – human capital accumulation seems likely to have played an even larger catalytic role in driving the Industrial Revolution.
The picture is similar if we move from human to social capital. This is a more difficult concept to capture quantitatively. It embraces properties such as co-operation, reciprocity and trust within society. Although more elusive, these sources of social capital have been crucial to the success of nation
Source: OurWorldinData.org, based on Buringh and Van Zanden (2009) and Broadberry and O’Rourke (2010).
Chart 7: Literacy rates in Western Europe
states – for example, in supporting growth of trade.One measure of social capital used by
sociologists is the incidence of violence or war in society. This is the limiting case of a lack of cooperation or trust within or across societies; it is the sociological equivalent of financial crisis. Chart 9 plots the incidence of murder (homicide) in Western European countries since 1300. It, too, tells a striking story.
Violent crime fell dramatically between the 15th and 18th centuries, by a factor of around five. By the time of the Industrial Revolution, it had levelled-off. Rapid social capital accumulation provided a foundation for growth. Sociology nurtured technology.
With some interruptions, notably the two World Wars of the 20th century, those trends towards lower levels of violence in society have continued to the present day. For example, war deaths have been falling secularly since the 1940s (Chart 10). This is consistent with a continuing accretion of social capital. Although hard to quantify, this too is likely to have provided a tailwind to growth in the modern era.
Infrastructural and institutional capital are widely believed to have supported the growth process. England was the birth place of the Industrial Revolution. Its parents, arguably, were English institutions well into adolescence at the dawn of the Industrial Revolution: a parliamentary
9
Chart 8: Average years of schooling of the population aged 15+
Source: Barro and Lee (2013).
Chart 9: Violent crime in Western Europe
Source: OurWorldinData.org, based on Eisner (2003).
Chart 10: Death rate associated with state-based conflicts
Source: Human Security Report Project, available at: http://www.hsrgroup.org/our-work/security-stats/Deaths-from-Organized-Violence.aspx
10
system from the 11th and 12th centuries; a legal and judicial system from the 12th and 13th centuries; a central bank, the Bank of England, from the end of 17th century.
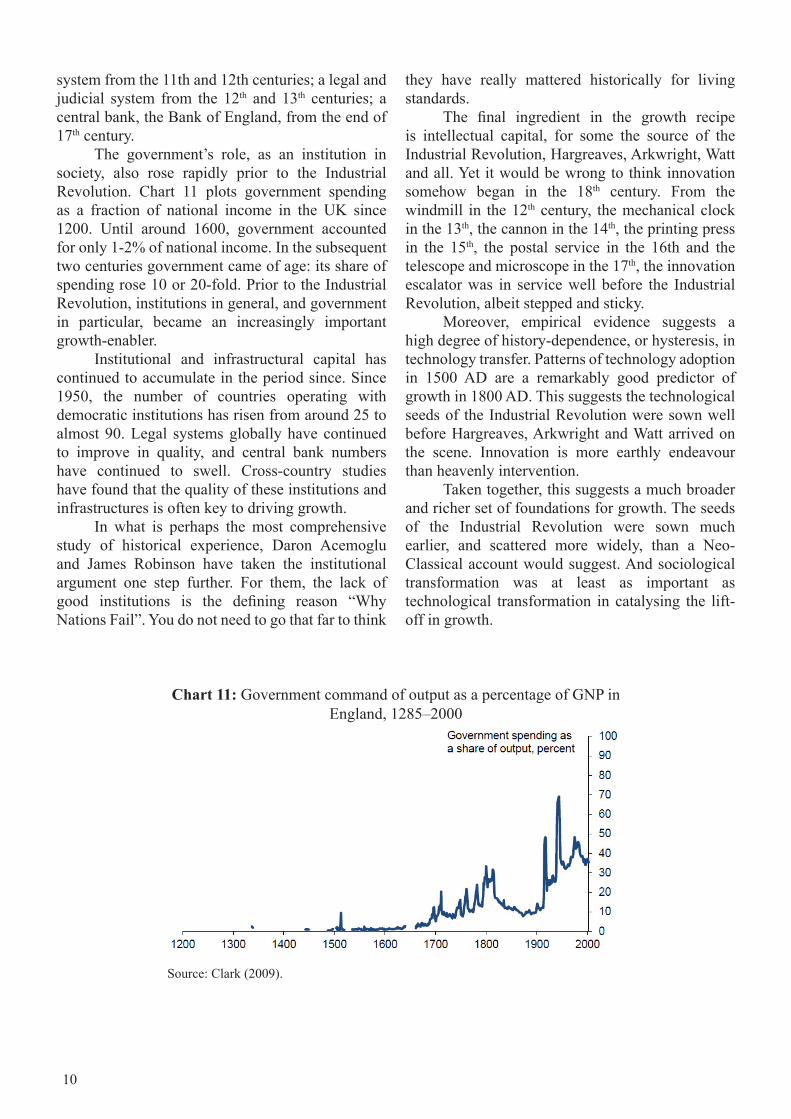
The government’s role, as an institution in society, also rose rapidly prior to the Industrial Revolution. Chart 11 plots government spending as a fraction of national income in the UK since 1200. Until around 1600, government accounted for only 1-2% of national income. In the subsequent two centuries government came of age: its share of spending rose 10 or 20-fold. Prior to the Industrial Revolution, institutions in general, and government in particular, became an increasingly important growth-enabler.
Institutional and infrastructural capital has continued to accumulate in the period since. Since 1950, the number of countries operating with democratic institutions has risen from around 25 to almost 90. Legal systems globally have continued to improve in quality, and central bank numbers have continued to swell. Cross-country studies have found that the quality of these institutions and infrastructures is often key to driving growth.
In what is perhaps the most comprehensive study of historical experience, Daron Acemoglu and James Robinson have taken the institutional argument one step further. For them, the lack of good institutions is the defining reason “Why Nations Fail”. You do not need to go that far to think
Chart 11: Government command of output as a percentage of GNP in England, 1285–2000
Source: Clark (2009).
they have really mattered historically for living standards.
The final ingredient in the growth recipe is intellectual capital, for some the source of the Industrial Revolution, Hargreaves, Arkwright, Watt and all. Yet it would be wrong to think innovation somehow began in the 18th century. From the windmill in the 12th century, the mechanical clock in the 13th, the cannon in the 14th, the printing press in the 15th, the postal service in the 16th and the telescope and microscope in the 17th, the innovation escalator was in service well before the Industrial Revolution, albeit stepped and sticky.
Moreover, empirical evidence suggests a high degree of history-dependence, or hysteresis, in technology transfer. Patterns of technology adoption in 1500 AD are a remarkably good predictor of growth in 1800 AD. This suggests the technological seeds of the Industrial Revolution were sown well before Hargreaves, Arkwright and Watt arrived on the scene. Innovation is more earthly endeavour than heavenly intervention.
Taken together, this suggests a much broader and richer set of foundations for growth. The seeds of the Industrial Revolution were sown much earlier, and scattered more widely, than a Neo-Classical account would suggest. And sociological transformation was at least as important as technological transformation in catalysing the lift-off in growth.
11
Even if you accept this multi-faceted explanation of growth - part sociological, part technological – why did societies suddenly begin accumulating capital at particular points in history? What prompted that initial investment in skills, co-operation, institutions, infrastructure? One answer may lie inside our own heads. For those technological and sociological trends may, in turn, have caused a re-wiring of our brains.
Underlying all investment decisions are what economists call “rates of time preference” – and what non-economists call patience: the willingness to defer gratification today for the benefit of tomorrow, to save rather than spend, stick rather than twist. One simple, economy-wide, measure of societal patience is found in the pattern of interest rates.
Interest rates proxy society’s willingness to save or stick. The less willing they are to do so – the greater their impatience - the higher the compensation they require. That compensation takes the form of a higher interest rate. So, for a given level of saving, an impatient society will have higher interest rates than a patient one.
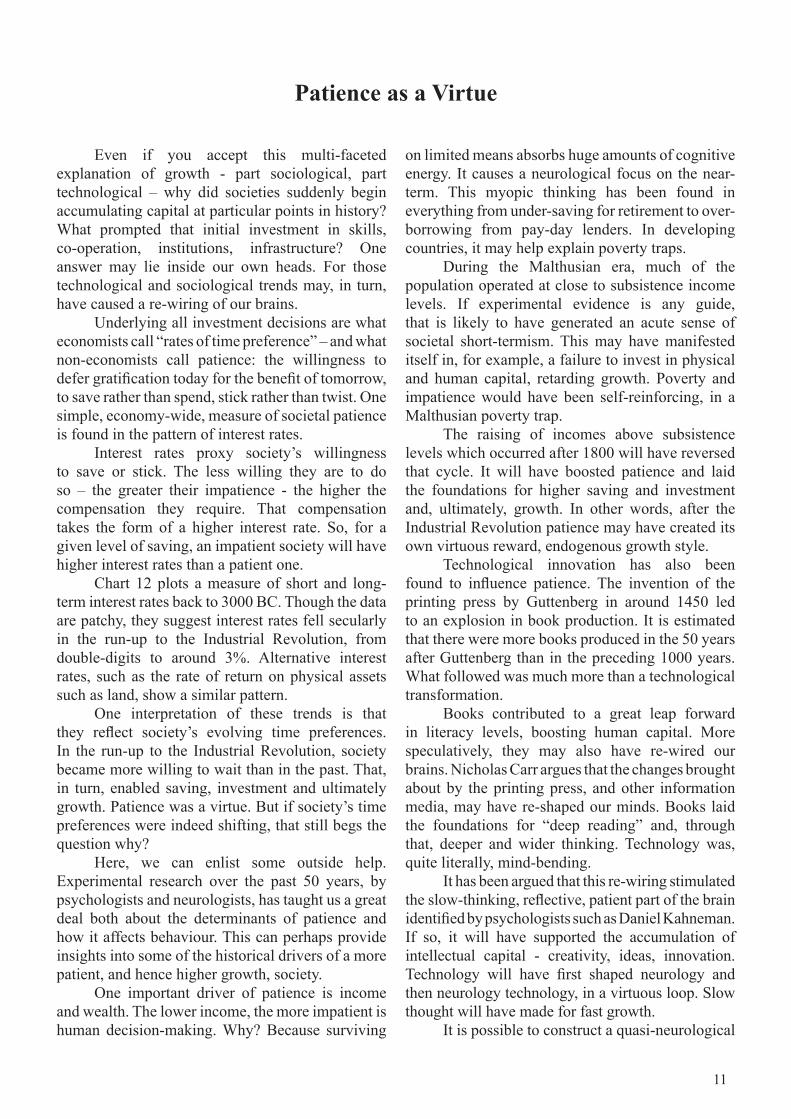
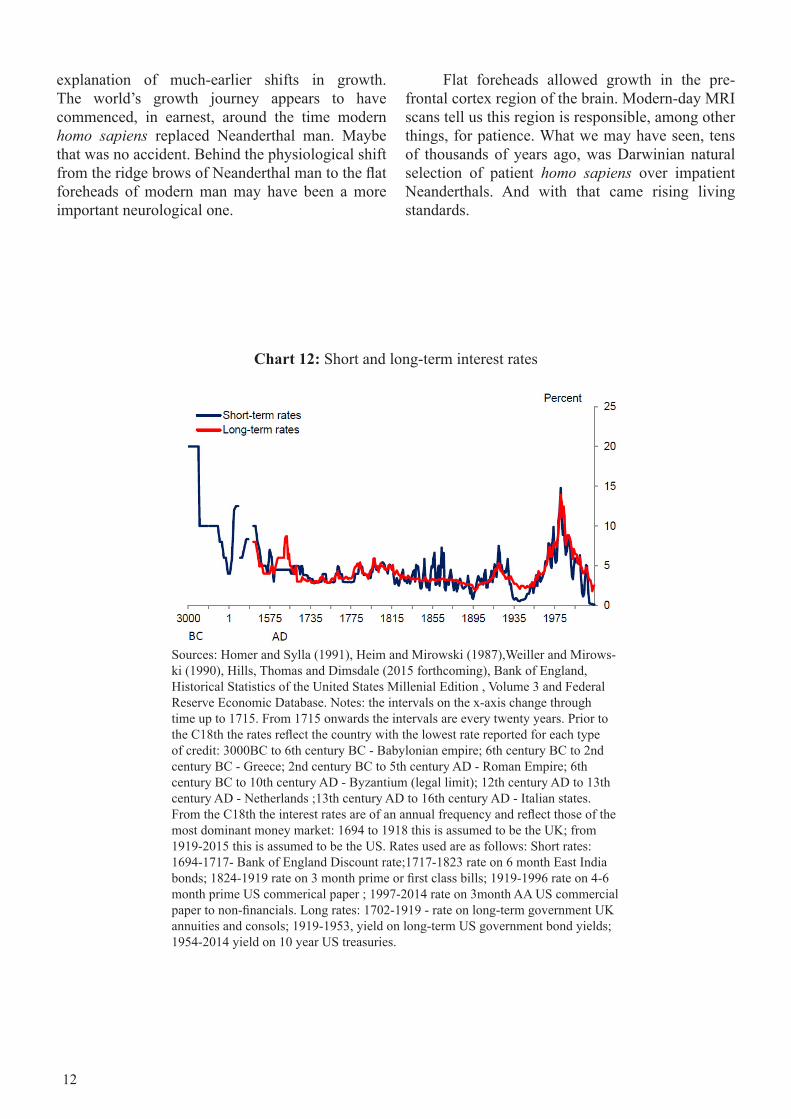
Chart 12 plots a measure of short and long-term interest rates back to 3000 BC. Though the data are patchy, they suggest interest rates fell secularly in the run-up to the Industrial Revolution, from double-digits to around 3%. Alternative interest rates, such as the rate of return on physical assets such as land, show a similar pattern.
One interpretation of these trends is that they reflect society’s evolving time preferences. In the run-up to the Industrial Revolution, society became more willing to wait than in the past. That, in turn, enabled saving, investment and ultimately growth. Patience was a virtue. But if society’s time preferences were indeed shifting, that still begs the question why?
Here, we can enlist some outside help. Experimental research over the past 50 years, by psychologists and neurologists, has taught us a great deal both about the determinants of patience and how it affects behaviour. This can perhaps provide insights into some of the historical drivers of a more patient, and hence higher growth, society.
One important driver of patience is income and wealth. The lower income, the more impatient is human decision-making. Why? Because surviving
Patience as a Virtue
on limited means absorbs huge amounts of cognitive energy. It causes a neurological focus on the near-term. This myopic thinking has been found in everything from under-saving for retirement to over-borrowing from pay-day lenders. In developing countries, it may help explain poverty traps.
During the Malthusian era, much of the population operated at close to subsistence income levels. If experimental evidence is any guide, that is likely to have generated an acute sense of societal short-termism. This may have manifested itself in, for example, a failure to invest in physical and human capital, retarding growth. Poverty and impatience would have been self-reinforcing, in a Malthusian poverty trap.
The raising of incomes above subsistence levels which occurred after 1800 will have reversed that cycle. It will have boosted patience and laid the foundations for higher saving and investment and, ultimately, growth. In other words, after the Industrial Revolution patience may have created its own virtuous reward, endogenous growth style.
Technological innovation has also been found to influence patience. The invention of the printing press by Guttenberg in around 1450 led to an explosion in book production. It is estimated that there were more books produced in the 50 years after Guttenberg than in the preceding 1000 years. What followed was much more than a technological transformation.
Books contributed to a great leap forward in literacy levels, boosting human capital. More speculatively, they may also have re-wired our brains. Nicholas Carr argues that the changes brought about by the printing press, and other information media, may have re-shaped our minds. Books laid the foundations for “deep reading” and, through that, deeper and wider thinking. Technology was, quite literally, mind-bending.
It has been argued that this re-wiring stimulated the slow-thinking, reflective, patient part of the brain identified by psychologists such as Daniel Kahneman. If so, it will have supported the accumulation of intellectual capital - creativity, ideas, innovation. Technology will have first shaped neurology and then neurology technology, in a virtuous loop. Slow thought will have made for fast growth.
It is possible to construct a quasi-neurological
12
explanation of much-earlier shifts in growth. The world’s growth journey appears to have commenced, in earnest, around the time modern homo sapiens replaced Neanderthal man. Maybe that was no accident. Behind the physiological shift from the ridge brows of Neanderthal man to the flat foreheads of modern man may have been a more important neurological one.
Chart 12: Short and long-term interest rates
Sources: Homer and Sylla (1991), Heim and Mirowski (1987),Weiller and Mirows-ki (1990), Hills, Thomas and Dimsdale (2015 forthcoming), Bank of England, Historical Statistics of the United States Millenial Edition , Volume 3 and Federal Reserve Economic Database. Notes: the intervals on the x-axis change through time up to 1715. From 1715 onwards the intervals are every twenty years. Prior to the C18th the rates reflect the country with the lowest rate reported for each type of credit: 3000BC to 6th century BC - Babylonian empire; 6th century BC to 2nd century BC - Greece; 2nd century BC to 5th century AD - Roman Empire; 6th century BC to 10th century AD - Byzantium (legal limit); 12th century AD to 13th century AD - Netherlands ;13th century AD to 16th century AD - Italian states. From the C18th the interest rates are of an annual frequency and reflect those of the most dominant money market: 1694 to 1918 this is assumed to be the UK; from 1919-2015 this is assumed to be the US. Rates used are as follows: Short rates: 1694-1717- Bank of England Discount rate;1717-1823 rate on 6 month East India bonds; 1824-1919 rate on 3 month prime or first class bills; 1919-1996 rate on 4-6 month prime US commerical paper ; 1997-2014 rate on 3month AA US commercial paper to non-financials. Long rates: 1702-1919 - rate on long-term government UK annuities and consols; 1919-1953, yield on long-term US government bond yields; 1954-2014 yield on 10 year US treasuries.
Flat foreheads allowed growth in the pre-frontal cortex region of the brain. Modern-day MRI scans tell us this region is responsible, among other things, for patience. What we may have seen, tens of thousands of years ago, was Darwinian natural selection of patient homo sapiens over impatient Neanderthals. And with that came rising living standards.

13
From the distant past, then, to the present and future. Today’s great debate is where next for growth. The sunny uplands of innovation-led growth, as after the Industrial Revolution? Or the foggy lowlands of stagnant growth, as before it? Which of the secular forces – innovation versus stagnation – will dominate? And if growth is going back to the future, on which side of the Industrial Revolution will it land?
The balance of these arguments matters greatly for future well-being and public policy. Indeed, it is hard to think of anything that matters much more. More parochially, for central banks setting monetary policy one of the key judgements is the appropriate “neutral” level of interest rates. You can think of this as the interest rate that would align desired saving and investment over the medium term.
But what is the “neutral” level of interest rates today? Secular innovation might imply a level at or above its historical average of 2-3%, in line with historical growth rates. But secular stagnation may imply a level much lower than in the past, possibly even negative. In monetary policy, this is
The Secular Struggle - Innovation or Stagnation?
the difference between chalk and cheese, success and failure.
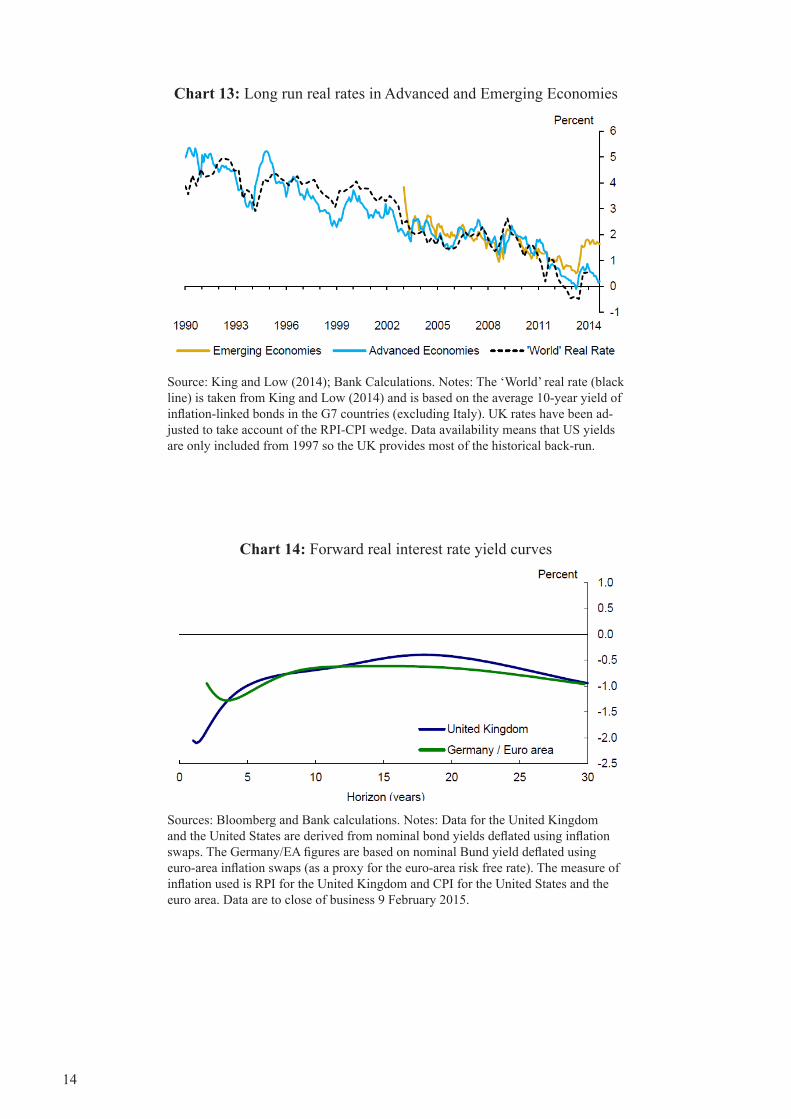
In this respect, the behaviour of global real interest rates over the past 30 years is remarkable. Chart 13 plots a measure of real interest rates since 1990, in advanced and emerging economies. Both have exhibited the same secular downward trend, falling by around two percentage points per decade. Today, they are around zero.
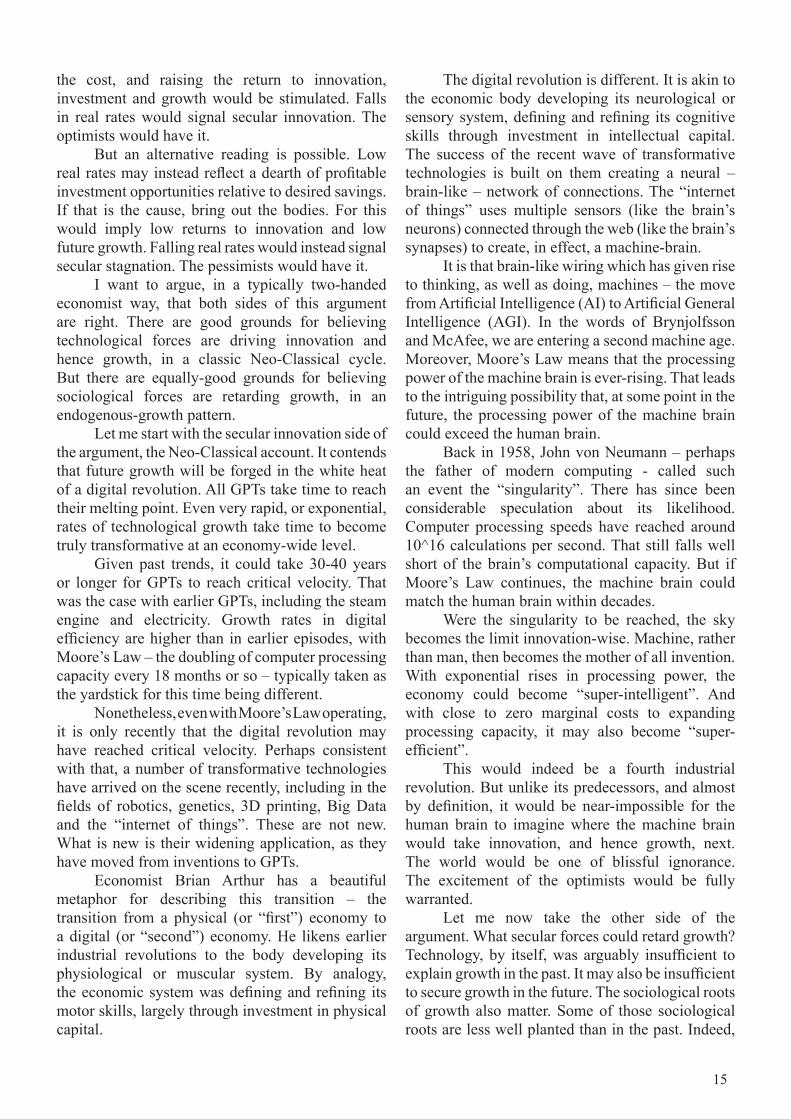
For some advanced countries, the pattern is even more striking. Chart 14 plots the real interest rates expected over the next 30 years in the UK and euro-area. For both, real rates are expected to remain negative for the next three decades. Investors are willing to pay governments for the privilege of lending to them for the next 30 years – a negative rate of time preference. This pattern has no historical precedent.
One interpretation is society having become significantly more patient, as in the lead up to the Industrial Revolution: higher global saving relative to investment would lower global real interest rates. If that is the cause, bring out the bunting. By lowering
14
Chart 13: Long run real rates in Advanced and Emerging Economies
Source: King and Low (2014); Bank Calculations. Notes: The ‘World’ real rate (black line) is taken from King and Low (2014) and is based on the average 10-year yield of inflation-linked bonds in the G7 countries (excluding Italy). UK rates have been ad-justed to take account of the RPI-CPI wedge. Data availability means that US yields are only included from 1997 so the UK provides most of the historical back-run.
Chart 14: Forward real interest rate yield curves
Sources: Bloomberg and Bank calculations. Notes: Data for the United Kingdom and the United States are derived from nominal bond yields deflated using inflation swaps. The Germany/EA figures are based on nominal Bund yield deflated using euro-area inflation swaps (as a proxy for the euro-area risk free rate). The measure of inflation used is RPI for the United Kingdom and CPI for the United States and the euro area. Data are to close of business 9 February 2015.
15
the cost, and raising the return to innovation, investment and growth would be stimulated. Falls in real rates would signal secular innovation. The optimists would have it.
But an alternative reading is possible. Low real rates may instead reflect a dearth of profitable investment opportunities relative to desired savings. If that is the cause, bring out the bodies. For this would imply low returns to innovation and low future growth. Falling real rates would instead signal secular stagnation. The pessimists would have it.
I want to argue, in a typically two-handed economist way, that both sides of this argument are right. There are good grounds for believing technological forces are driving innovation and hence growth, in a classic Neo-Classical cycle. But there are equally-good grounds for believing sociological forces are retarding growth, in an endogenous-growth pattern.
Let me start with the secular innovation side of the argument, the Neo-Classical account. It contends that future growth will be forged in the white heat of a digital revolution. All GPTs take time to reach their melting point. Even very rapid, or exponential, rates of technological growth take time to become truly transformative at an economy-wide level.
Given past trends, it could take 30-40 years or longer for GPTs to reach critical velocity. That was the case with earlier GPTs, including the steam engine and electricity. Growth rates in digital efficiency are higher than in earlier episodes, with Moore’s Law – the doubling of computer processing capacity every 18 months or so – typically taken as the yardstick for this time being different.
Nonetheless, even with Moore’s Law operating, it is only recently that the digital revolution may have reached critical velocity. Perhaps consistent with that, a number of transformative technologies have arrived on the scene recently, including in the fields of robotics, genetics, 3D printing, Big Data and the “internet of things”. These are not new. What is new is their widening application, as they have moved from inventions to GPTs.
Economist Brian Arthur has a beautiful metaphor for describing this transition – the transition from a physical (or “first”) economy to a digital (or “second”) economy. He likens earlier industrial revolutions to the body developing its physiological or muscular system. By analogy, the economic system was defining and refining its motor skills, largely through investment in physical capital.
The digital revolution is different. It is akin to the economic body developing its neurological or sensory system, defining and refining its cognitive skills through investment in intellectual capital. The success of the recent wave of transformative technologies is built on them creating a neural – brain-like – network of connections. The “internet of things” uses multiple sensors (like the brain’s neurons) connected through the web (like the brain’s synapses) to create, in effect, a machine-brain.
It is that brain-like wiring which has given rise to thinking, as well as doing, machines – the move from Artificial Intelligence (AI) to Artificial General Intelligence (AGI). In the words of Brynjolfsson and McAfee, we are entering a second machine age. Moreover, Moore’s Law means that the processing power of the machine brain is ever-rising. That leads to the intriguing possibility that, at some point in the future, the processing power of the machine brain could exceed the human brain.
Back in 1958, John von Neumann – perhaps the father of modern computing - called such an event the “singularity”. There has since been considerable speculation about its likelihood. Computer processing speeds have reached around 10^16 calculations per second. That still falls well short of the brain’s computational capacity. But if Moore’s Law continues, the machine brain could match the human brain within decades.
Were the singularity to be reached, the sky becomes the limit innovation-wise. Machine, rather than man, then becomes the mother of all invention. With exponential rises in processing power, the economy could become “super-intelligent”. And with close to zero marginal costs to expanding processing capacity, it may also become “super-efficient”.
This would indeed be a fourth industrial revolution. But unlike its predecessors, and almost by definition, it would be near-impossible for the human brain to imagine where the machine brain would take innovation, and hence growth, next. The world would be one of blissful ignorance. The excitement of the optimists would be fully warranted.
Let me now take the other side of the argument. What secular forces could retard growth? Technology, by itself, was arguably insufficient to explain growth in the past. It may also be insufficient to secure growth in the future. The sociological roots of growth also matter. Some of those sociological roots are less well planted than in the past. Indeed,
16
in some cases technology may have contributed to an uprooting.
Take social capital. While violent crime and war are hopefully in secular decline, other measures of social capital are depreciating. One diagnostic is rising levels of social inequality. The income share of the top 1% of earners has doubled in the UK and US since 1980. Patterns of wealth inequality are, if anything, even more striking.
Recent evidence suggests such a depreciation of social capital, through rising inequality, slows growth. Cross-country studies by the IMF and OECD have found a significant and sustained drag from inequality on growth. The IMF study estimates that a one percentage point rise in a country’s Gini coefficient – a measure income distribution – lowers growth by around 0.1 percentage point.
Let’s apply that to some real data. The Gini coefficient in the US has risen by eight percentage points since 1980. That suggests inequality could have been a drag on past US growth of almost one percentage point each year. In an era of low growth, that is a strikingly strong headwind from lower levels of social capital.
And looking ahead, it is possible that sociological headwind could strengthen. One of the causes of rising inequality in advanced economies is believed to be the loss of middle-skill jobs, at least relative to high and low-skill jobs. There has been a “hollowing out” in employment. Technological advance – the mechanisation of middle-skill tasks - is believed to have contributed importantly to these trends. Intelligent robots could substitute for lower-skilled tasks. If the capacity of the machine brain approached, or surpassed, the human brain, higher-skilled jobs could also be at risk. Where this leaves trends in employment, inequality and social capital is unclear. But, most likely, this would be far from blissful ignorance.
A second secular headwind, closely related to rising inequality, concerns human capital. Inequality may retard growth because it damps investment in education, in particular by poorer households. Studies show parental income is crucial in determining children’s educational performance. If inequality is generational and self-perpetuating, so too will be its impact on growth.
US evidence suggests striking, and rising, differences in educational attainment across different socio-economic groups. Prior to 1970, rising high school completion rates permanently raised the productivity of US workers. Latterly,
those improvements have stalled and, for some, have reversed. The US is slipping down the international league tables of educational attainment.
There is evidence the UK could be following suit. The UK is currently below average for literacy and numeracy skills across OECD countries. Between 2003 and 2011, although the proportion of adults with literacy skills increased from 44% to 57%, those with numeracy skills decreased from 26% to 22%. To put that in perspective, 17 million adults in England have numerical skills only equal to those of a primary school child.
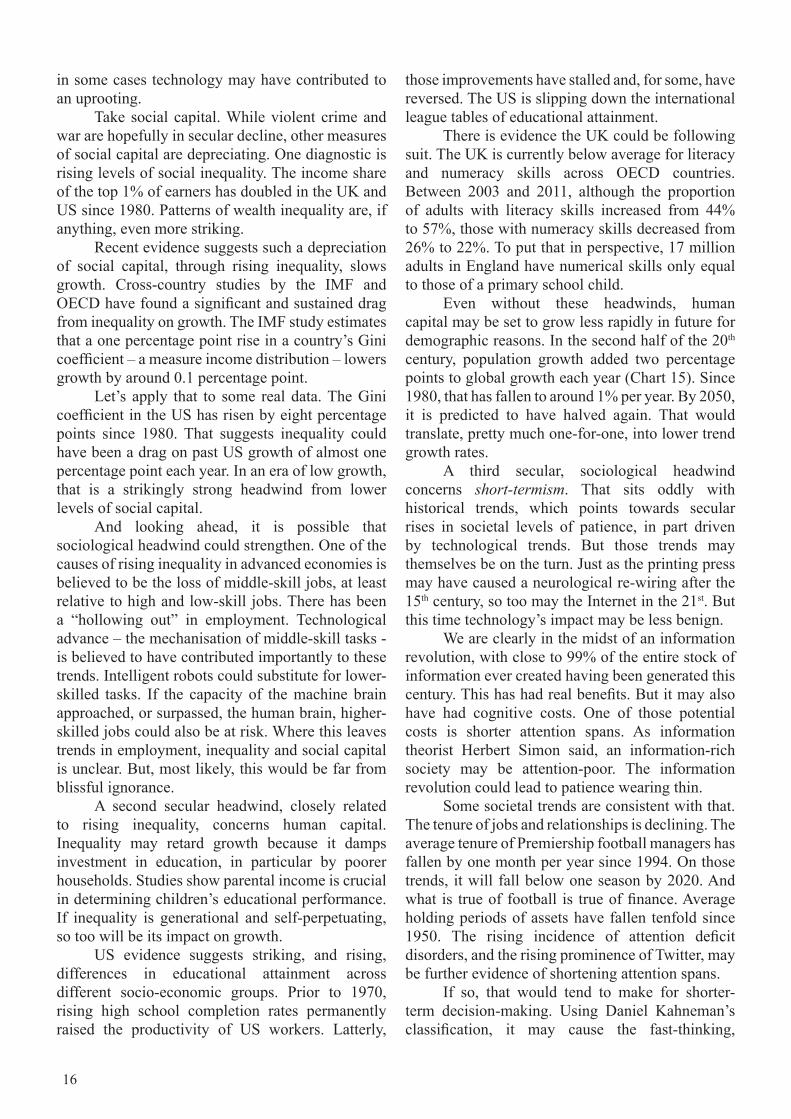
Even without these headwinds, human capital may be set to grow less rapidly in future for demographic reasons. In the second half of the 20th century, population growth added two percentage points to global growth each year (Chart 15). Since 1980, that has fallen to around 1% per year. By 2050, it is predicted to have halved again. That would translate, pretty much one-for-one, into lower trend growth rates.
A third secular, sociological headwind concerns short-termism. That sits oddly with historical trends, which points towards secular rises in societal levels of patience, in part driven by technological trends. But those trends may themselves be on the turn. Just as the printing press may have caused a neurological re-wiring after the 15th century, so too may the Internet in the 21st. But this time technology’s impact may be less benign.
We are clearly in the midst of an information revolution, with close to 99% of the entire stock of information ever created having been generated this century. This has had real benefits. But it may also have had cognitive costs. One of those potential costs is shorter attention spans. As information theorist Herbert Simon said, an information-rich society may be attention-poor. The information revolution could lead to patience wearing thin.
Some societal trends are consistent with that. The tenure of jobs and relationships is declining. The average tenure of Premiership football managers has fallen by one month per year since 1994. On those trends, it will fall below one season by 2020. And what is true of football is true of finance. Average holding periods of assets have fallen tenfold since 1950. The rising incidence of attention deficit disorders, and the rising prominence of Twitter, may be further evidence of shortening attention spans.
If so, that would tend to make for shorter-term decision-making. Using Daniel Kahneman’s classification, it may cause the fast-thinking,
17
reflexive, impatient part of the brain to expand its influence. If so, that would tend to raise societal levels of impatience and slow the accumulation of all types of capital. This could harm medium-term growth. Fast thought could make for slow growth.
Psychological studies have shown that impatience in children can significantly impair educational attainment and thus future income prospects. Impatience has also been found to reduce creativity among individuals, thereby putting a brake on intellectual capital accumulation. Innovation and research are potential casualties from short-termism.
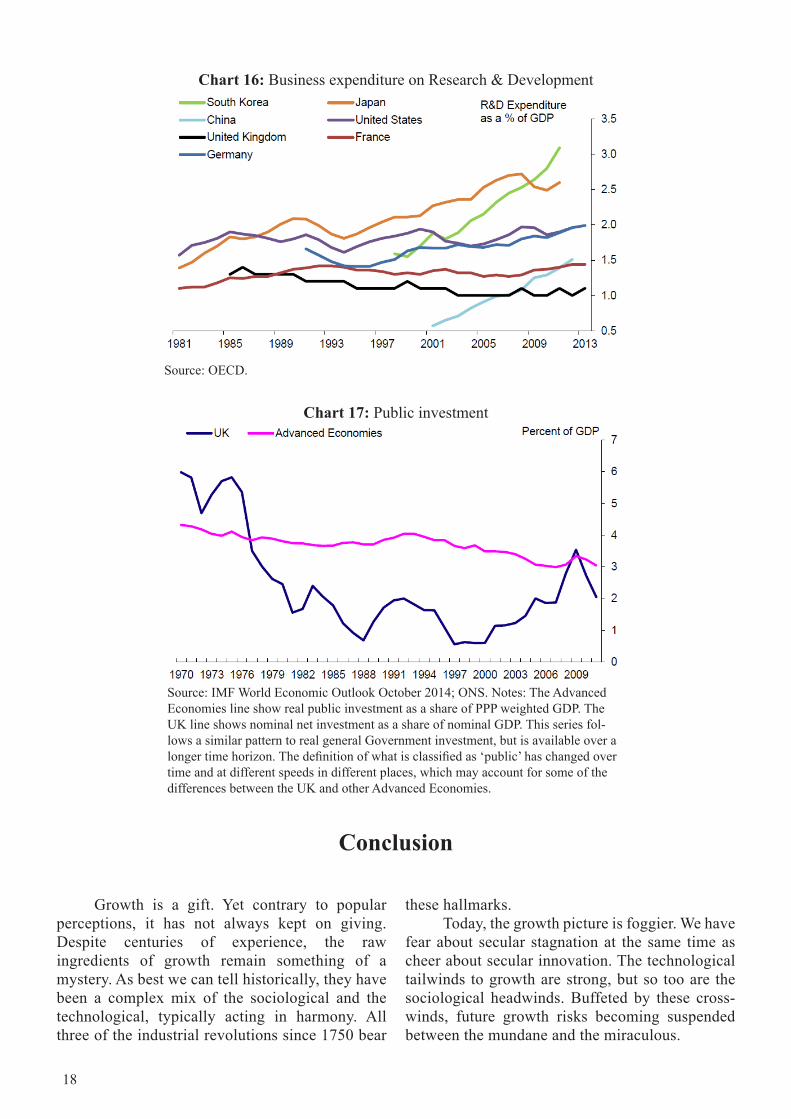
There is evidence suggesting just that. Investment by public companies is often found to be deferred or ignored to meet the short-term needs of shareholders. Research and development spending by UK companies has been falling for a decade. They are towards the bottom of the international research and development league table (Chart 16).
If short-termism is on the rise, this puts at risk skills-building, innovation and future growth.
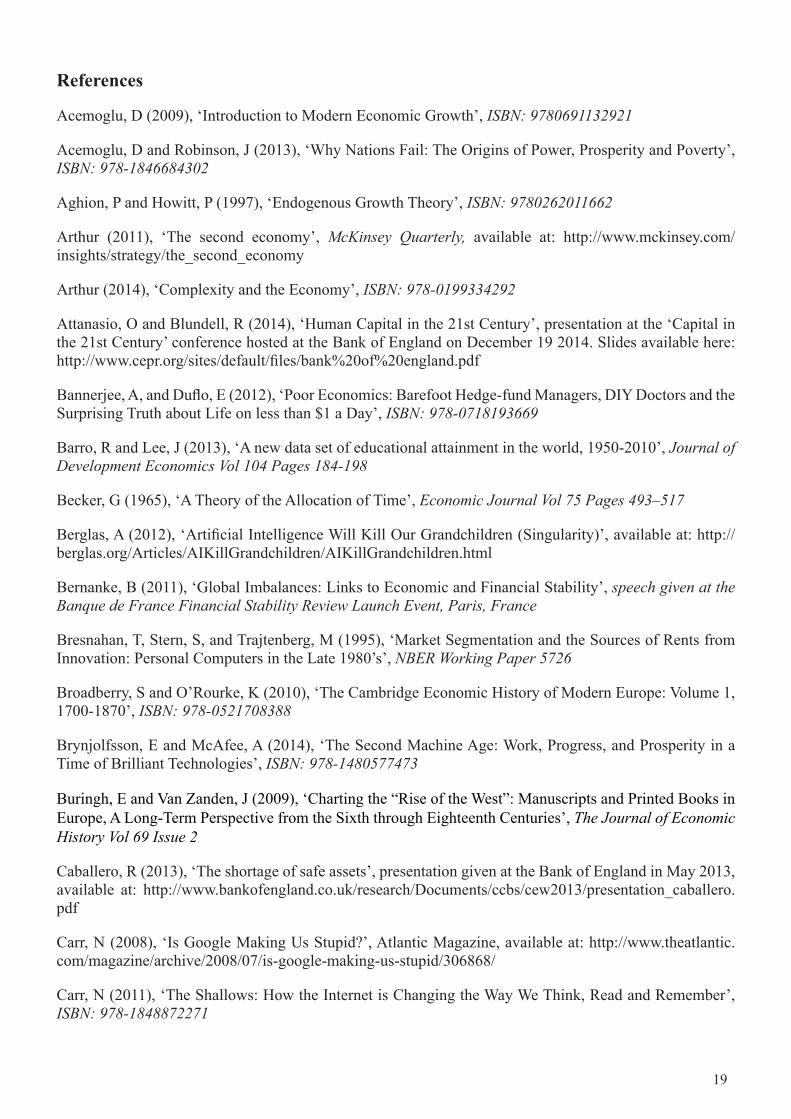
A final ingredient is infrastructure capital. Here again, investment trends are not encouraging. In advanced economies, public investment has been on a gently downwards path for the past three decades (Chart 17). In the UK, public investment relative to GDP is a third of its level in 1970. There has been no deepening in the global capital stock for a generation, if anything the opposite. Given the role public investment has often played in the past in supporting private innovation, this is not an entirely comforting picture.
In sum, if history and empirical evidence is any guide, this cocktail of sociological factors, individually and in combination, could restrain growth. They could jeopardise the promise of the fourth industrial revolution. Pessimists’ concerns would be warranted.
Chart 15: Population growth
Source: United Nations population projections (http://esa.un.org/wpp/) for 1950 onwards; The Maddison-Project (http://www.ggdc.net/maddison/maddison-project/home.htm) prior to 1950.
18
Chart 17: Public investment
Source: IMF World Economic Outlook October 2014; ONS. Notes: The Advanced Economies line show real public investment as a share of PPP weighted GDP. The UK line shows nominal net investment as a share of nominal GDP. This series fol-lows a similar pattern to real general Government investment, but is available over a longer time horizon. The definition of what is classified as ‘public’ has changed over time and at different speeds in different places, which may account for some of the differences between the UK and other Advanced Economies.
Growth is a gift. Yet contrary to popular perceptions, it has not always kept on giving. Despite centuries of experience, the raw ingredients of growth remain something of a mystery. As best we can tell historically, they have been a complex mix of the sociological and the technological, typically acting in harmony. All three of the industrial revolutions since 1750 bear
Conclusion
these hallmarks.Today, the growth picture is foggier. We have
fear about secular stagnation at the same time as cheer about secular innovation. The technological tailwinds to growth are strong, but so too are the sociological headwinds. Buffeted by these cross-winds, future growth risks becoming suspended between the mundane and the miraculous.
Chart 16: Business expenditure on Research & Development
Source: OECD.
19
References
Acemoglu, D (2009), ‘Introduction to Modern Economic Growth’, ISBN: 9780691132921
Acemoglu, D and Robinson, J (2013), ‘Why Nations Fail: The Origins of Power, Prosperity and Poverty’, ISBN: 978-1846684302
Aghion, P and Howitt, P (1997), ‘Endogenous Growth Theory’, ISBN: 9780262011662
Arthur (2011), ‘The second economy’, McKinsey Quarterly, available at: http://www.mckinsey.com/insights/strategy/the_second_economy
Arthur (2014), ‘Complexity and the Economy’, ISBN: 978-0199334292
Attanasio, O and Blundell, R (2014), ‘Human Capital in the 21st Century’, presentation at the ‘Capital in the 21st Century’ conference hosted at the Bank of England on December 19 2014. Slides available here: http://www.cepr.org/sites/default/files/bank%20of%20england.pdf
Bannerjee, A, and Duflo, E (2012), ‘Poor Economics: Barefoot Hedge-fund Managers, DIY Doctors and the Surprising Truth about Life on less than $1 a Day’, ISBN: 978-0718193669
Barro, R and Lee, J (2013), ‘A new data set of educational attainment in the world, 1950-2010’, Journal of Development Economics Vol 104 Pages 184-198
Becker, G (1965), ‘A Theory of the Allocation of Time’, Economic Journal Vol 75 Pages 493–517
Berglas, A (2012), ‘Artificial Intelligence Will Kill Our Grandchildren (Singularity)’, available at: http://berglas.org/Articles/AIKillGrandchildren/AIKillGrandchildren.html
Bernanke, B (2011), ‘Global Imbalances: Links to Economic and Financial Stability’, speech given at the Banque de France Financial Stability Review Launch Event, Paris, France
Bresnahan, T, Stern, S, and Trajtenberg, M (1995), ‘Market Segmentation and the Sources of Rents from Innovation: Personal Computers in the Late 1980’s’, NBER Working Paper 5726
Broadberry, S and O’Rourke, K (2010), ‘The Cambridge Economic History of Modern Europe: Volume 1, 1700-1870’, ISBN: 978-0521708388
Brynjolfsson, E and McAfee, A (2014), ‘The Second Machine Age: Work, Progress, and Prosperity in a Time of Brilliant Technologies’, ISBN: 978-1480577473
Buringh, E and Van Zanden, J (2009), ‘Charting the “Rise of the West”: Manuscripts and Printed Books in Europe, A Long-Term Perspective from the Sixth through Eighteenth Centuries’, The Journal of Economic History Vol 69 Issue 2
Caballero, R (2013), ‘The shortage of safe assets’, presentation given at the Bank of England in May 2013, available at: http://www.bankofengland.co.uk/research/Documents/ccbs/cew2013/presentation_caballero.pdf
Carr, N (2008), ‘Is Google Making Us Stupid?’, Atlantic Magazine, available at: http://www.theatlantic.com/magazine/archive/2008/07/is-google-making-us-stupid/306868/
Carr, N (2011), ‘The Shallows: How the Internet is Changing the Way We Think, Read and Remember’, ISBN: 978-1848872271
20
Cass, D (1965), ‘Growth in an Aggregative Model of Capital Accumulation’, The Review of Economic Studies, Vol 32, No 3.
Chui, M, Löffler, M and Roberts, R (2010), ‘The internet of things’, McKinsey Quarterly, available at: http://www.mckinsey.com/insights/high_tech_telecoms_internet/the_internet_of_things
Clark, G (2009), ‘A Farewell to Alms: A Brief Economic History of the World’, ISBN: 978-0691141282
Comin, D, Easterly, W, and Gong, E (2010), ‘Was the Wealth of Nations Determined in 1000 BC?’, American Economic Journal: Macroeconomics: Vol 2 No 3
Cowen, T (2011), ‘The Great Stagnation: How America Ate All The Low-Hanging Fruit of Modern History, Got Sick, and Will (Eventually) Feel Better’, Penguin eSpecial from Dutton
Davies, R, Haldane, A, Nielsen, M, and Pezzini, S (2014), ‘Measuring the costs of short-termism’, Journal of Financial Stability Vol 12 Pages 16-25
DeLong, B (1998), ‘Estimates of World GDP, One Million BC to Present’, available at: http://delong.typepad.com/print/20061012_LRWGDP.pdf
Eichengreen, B (2014), ‘Secular stagnation: A review of the issues’, in VoxEU (2014)
Eisner, M (2003), ‘Long-Term Historical Trends in Violent Crime’, Crime and Justice Vol 30 Pages 83–142
Fernald, J and Jones, C (2014), ‘The future of US economic growth’, Federal Reserve Bank of San Francisco Working Paper Series, available at: http://www.frbsf.org/economic-research/files/wp2014-02.pdf
Frey, C and Osbourne, M (2013), ‘The future of employment: how susceptible are jobs to computerisation?’, Oxford Martin, available at: http://www.oxfordmartin.ox.ac.uk/downloads/academic/The_Future_of_Employment.pdf
Gordon, R (2012), ‘Is US Economic Growth Over? Faltering innovation confronts the six headwinds’, NBER Working Paper 18315, available at: http://www.nber.org/papers/w18315.pdf
Gordon, R (2014), ‘The turtle’s progress: secular stagnation meets the headwinds’, in VoxEU (2014)
Haldane, A (2014), ‘Twin Peaks’, Speech given at the Kenilworth Chamber of Trade Business Breakfast, available at: http://www.bankofengland.co.uk/publications/Documents/speeches/2014/speech764.pdf
Hansen, A (1939), ‘Progress and Declining Population Growth’, The American Economic Review Vol XXIX No 1
Hansson, I and Stuart, C (1990), ‘Malthusian Selection of Preferences’, The American Economic Review Vol 80 No 3
Heim, C and Mirowski, P (1987), ‘Interest rates and crowding-out during Britain’s industrial revolution’, Journal of Economic History Vol 47 Pages 117-139
Hills, S, Thomas, R and Dimsdale, N (2010), ‘The UK recession in context — what do three centuries of data tell us?’, Bank of England Quarterly Bulletin 2010 Q4
Hills, Thomas and Dimsdale (2015 forthcoming), Bank of England
Homer, S and Sylla, R (1991), ‘A history of interest rates’, ISBN: 978-0471732839
21
Hutton, W (2015), ‘How Good We Can Be: Ending the Mercenary Society and Building a Great Country’, ISBN: 978-1408705315
IMF (2014), ‘Redistribution, Inequality, and Growth’, IMF Staff Discussion Note, available at: http://www.imf.org/external/pubs/ft/sdn/2014/sdn1402.pdf
Hall, R and Jones, C (1999), ‘Why do some countries produce so much more output per worker than others?’, Quarterly Journal of Economics Vol 114
Kahneman, D (2012), ‘Thinking, Fast and Slow’, ISBN: 978-0141033570
King, M and Low, D (2014), ‘Measuring the ‘world’ real interest rate’, NBER Working Paper 19887
Koopmans, T (1965), ‘On the Concept of Optimal Economic Growth’, Volume 28 of Pontificiae Academiae Scientiarum scripta varia
Kremer (1993), ‘Population growth and technological change: One Million BC to 1990’, The Quarterly Journal of Economics Vol 108 No 3
Levine, R and Renelt, D (1992), ‘A sensitivity analysis of cross-country growth regressions’, The American Economic Review Vol 82 Issue 4
Malthus, T (1798), ‘An Essay on the Principle of Population’, reprinted in 2010 as ISBN: 978-1450535540
Mazzucato, M (2013), ‘The entrepreneurial state’, ISBN: 978-0857282521
McKinsey Global Institute (2010), ‘Farewell to cheap capital: the implications of long-term shifts in global investment and saving’, available at: http://www.mckinsey.com/insights/global_capital_markets/farewell_cheap_capital
Mischel, W (2014), ‘The Marshmallow Test: Mastering Self-Control’, ISBN: 978-1469249087
Mokyr, J (2014), ‘Secular stagnation? Not in your life’, in VoxEU (2014).
Morris, I (2010), ‘Social Development’, available at: http://www.ianmorris.org
Morris, I (2011), ‘Why the West Rules - For Now: The Patterns of History and what they reveal about the Future’, ISBN: 978-1846682087
Mullanaithan, S, and Shafir, E (2014), ‘Scarcity: The New Science of Having Less and How It Defines Our Lives’, ISBN: 978-1250056115
Nordhaus, W (2015), comments made as discussant in ‘The Economics of Secular Stagnation’ session at the annual AEA meeting on 3 January 2015, available at: https://www.aeaweb.org/webcasts/2015/index.php
OECD (2014) , ‘Trends in Income Inequality and its Impact on Economic Growth’, OECD Social, Employment and Migration Working Papers No. 163, available at: http://www.oecd.org/els/soc/trends-in-income-inequality-and-its-impact-on-economic-growth-SEM-WP163.pdf
Piketty, T (2014), ‘Capital in the Twenty-First Century’, ISBN: 978-0674430006
Pinker, S (2012), ‘The Better Angels of Our Nature: A History of Violence and Humanity’, ISBN: 978-0141034645
22
Putnam, R (2000), ‘Bowling Alone: The Collapse and Revival of American Community’, ISBN: 978-0743203043
Ramsey, F (1928), ‘A Mathematical Theory of Saving’, Economic Journal Vol 38 No 152
Rebelo, S (1991), ‘Long-run policy analysis and long-run growth’, The Journal of Political Economy Vol 99 No 3
Romer, P (1986), ‘Increasing Returns and Long-run Growth’, Journal of Political Economy Vol 94 Pages 1002-37
Sachs, J (2014), ‘Sustainable Development Economics’, available at: http://www.project-syndicate.org/commentary/promote-sustainable-development-economics-by-jeffrey-d-sachs-2014-11
Simon, H (1971), ‘Designing organizations for an information-rich world’, in: Martin Greenberger, ‘Computers, Communication, and the Public Interest’, pp 38-52, John Hopkins Press
Solow, R (1956), ‘A Contribution to the Theory of Economic Growth’, The Quarterly Journal of Economics Vol 70 No 1
Stanislaw, U (1958), ‘Tribute to John von Neumann’, Bulletin of the American Mathematical Society
Stiglitz, J, Sen, A and Fitoussi, JP (2009), ‘Report by the Commission on the Measurement of Economic Performance and Social Progress’, available at: http://www.stiglitz-sen-fitoussi.fr/en/index.htm
Summers, L (2014), ‘U.S. Economic Prospects: Secular Stagnation, Hysteresis, and the Zero Lower Bound’, Business Economics Vol 49 No 2
Summers, L and Balls, E (2015), ‘Report of the Commission on Inclusive Prosperity’, Convened by the Center for American Progress, available at: https://cdn.americanprogress.org/wp-content/uploads/2015/01/IPC-PDF-full.pdf
Swann, T (1956), ‘Economic Growth and Capital Accumulation’, Economic Record Volume 32, Issue 2
Syverson, C (2013), ‘Will history repeat itself? Comments on ‘Is the information technology revolution over?’, International Productivity Monitor Pages 37-40
Tabellini, G (2010), ‘Culture and institutions: economic development in the regions of Europe’, Journal of the European Economic Association Vol 8 Issue 4
Urminsky, Oleg and Zauberman, Gal (2014), ‘The psychology of intertemporal preferences’, To appear in the ‘Wiley-Blackwell Handbook of Judgment and Decision Making’.
VoxEU (2014), ‘Secular Stagnation: Facts, Causes and Cures’, available at: http://www.voxeu.org/sites/default/files/Vox_secular_stagnation.pdf
Wang, Mei, Marc Oliver Rieger and Thorsten Hens (2011), ‘How time preferences differ: Evidence from 45 countries’, NHH Discussion paper, FOR 18
Weiller, K and Mirowski, P (1990), ‘Rates of interest in 18th century England’, Explorations in Economic History Vol 27 Issue 1