group synergiesuntapped potential for telecoms to … · group synergies offer significant untapped...
TRANSCRIPT
GROUP SYNERGIES UNTAPPED POTENTIAL FOR TELECOMS TO REALIZE NEXT-LEVEL EFFICIENCY
2
Group synergies offer significant untapped potential for telecoms to realize the required next-level efficiency. Efficiencies can be achieved both through centralization in traditional back-end functions such as Finance and HR, as well as through standardization and sharing of best-practices in local front-end functions. The complexity and time required to implement sustainable group change means that net savings take 2-3 years to achieve. The need to deliver on mid-term cost savings plans makes group synergies a “hot topic” for operators today.
INITIAL SITUATION
The market for telecommunications has reached saturation across the globe, with revenue expected to grow by
only 1-3% per annum from 2015 to 2018. The outlook is more negative for Europe than for Asia, where growth is still
expected (if slowing).
At the same time, providers worldwide face increasing pressure on margins from multiple directions, such as increasing
regulatory pressure on prices and the rise of competing “over-the-top” services to name only two. Significant cash
requirements for investment, driven by increasing subscriber voice and data usage and increasingly short technology
cycles, such as FTTH, LTE, VDSL and vectoring, which cannot be recouped by revenue and ARPU increases, have
increased the need for bottom-line efficiencies additionally.
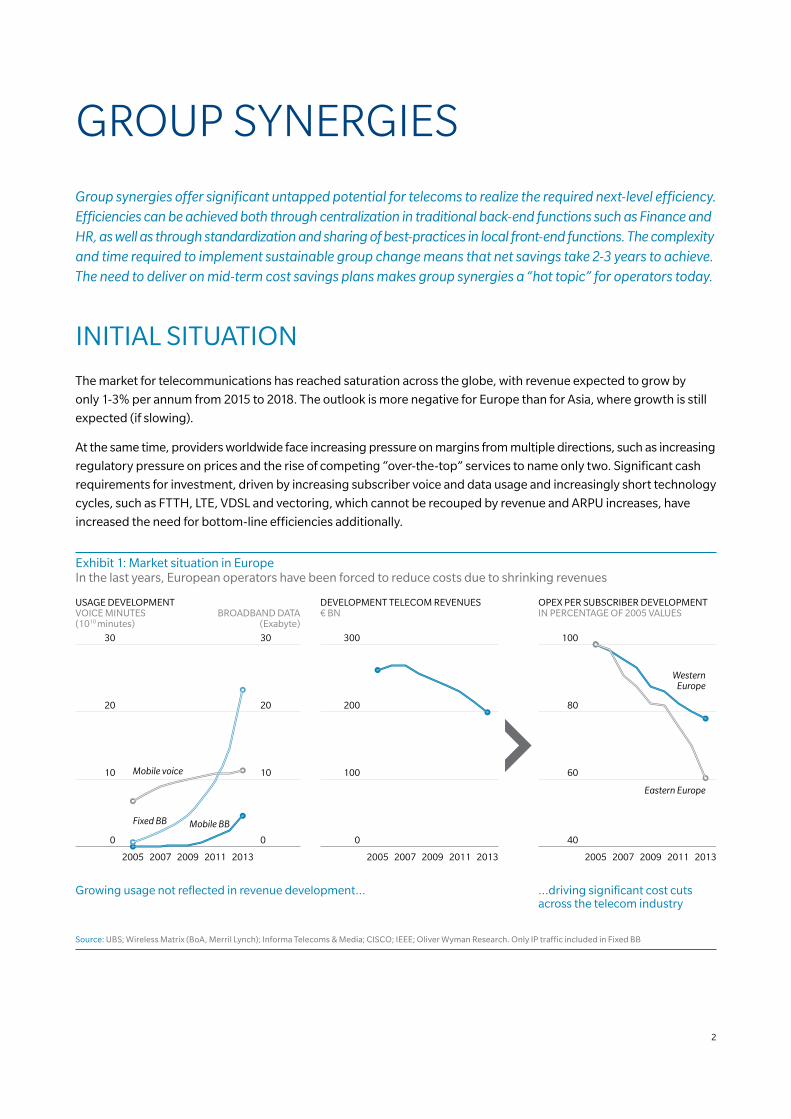
Exhibit 1: Market situation in Europe In the last years, European operators have been forced to reduce costs due to shrinking revenues
10
20
0
30
10
20
0
30
USAGE DEVELOPMENTVOICE MINUTES(1010 minutes)
BROADBAND DATA(Exabyte)
Growing usage not reflected in revenue development…
2005 201320112007 2009
100
200
0
300
DEVELOPMENT TELECOM REVENUES€ BN
Mobile voice
2005 201320112007 2009
60
80
40
100
OPEX PER SUBSCRIBER DEVELOPMENT IN PERCENTAGE OF 2005 VALUES
…driving significant cost cutsacross the telecom industry
WesternEurope
Eastern Europe
Fixed BB Mobile BB
2005 201320112007 2009
Source: UBS; Wireless Matrix (BoA, Merril Lynch); Informa Telecoms & Media; CISCO; IEEE; Oliver Wyman Research. Only IP traffic included in Fixed BB
GROUP SYNERGIES
3
Telecommunications operators, especially in Europe, have gone to considerable lengths to stabilize their profits.
They have achieved impressive results, for example driving down the average OPEX per subscriber by over 30% in
Eastern Europe, despite growing usage volumes (see Exhibit 1).
The operational “fat” (from incumbent’s state-owned legacies, for example) has been removed, and opportunities to
get low-hanging efficiencies have long been realized – however, the cost pressure will continue.
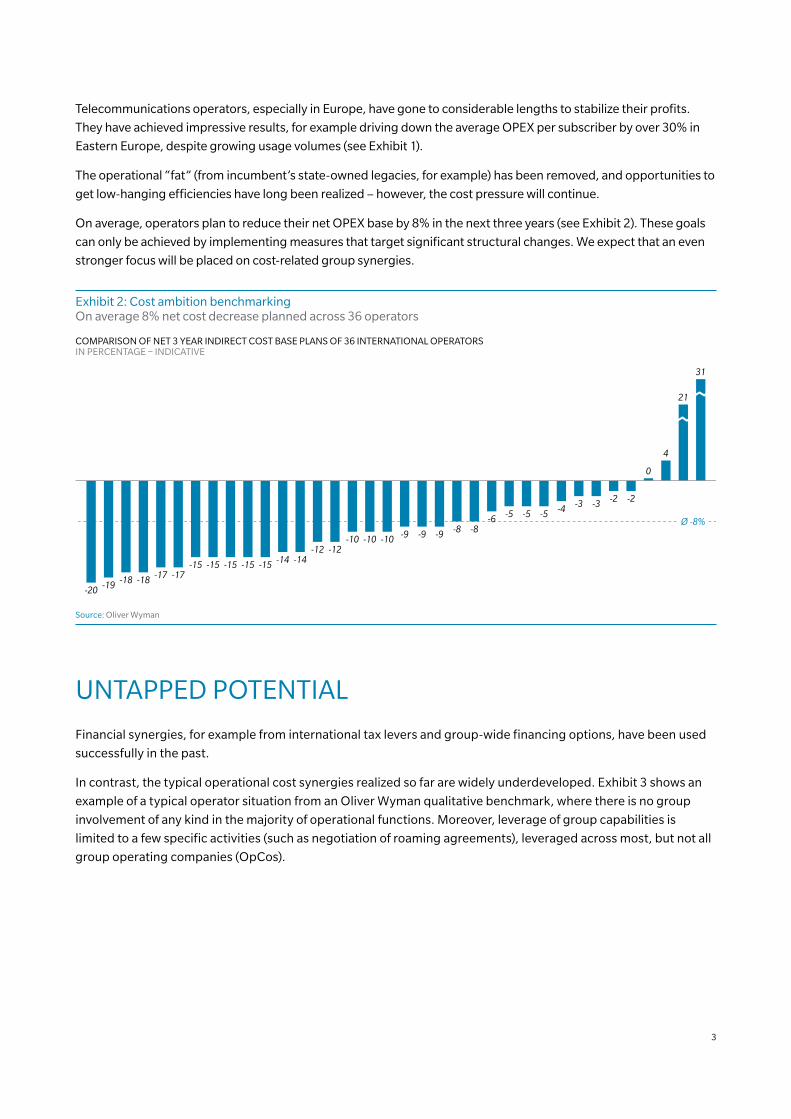
On average, operators plan to reduce their net OPEX base by 8% in the next three years (see Exhibit 2). These goals
can only be achieved by implementing measures that target significant structural changes. We expect that an even
stronger focus will be placed on cost-related group synergies.
Exhibit 2: Cost ambition benchmarkingOn average 8% net cost decrease planned across 36 operators
COMPARISON OF NET 3 YEAR INDIRECT COST BASE PLANS OF 36 INTERNATIONAL OPERATORS IN PERCENTAGE – INDICATIVE
-20 -19 -18 -18 -17 -17-15 -15 -15 -15 -15 -14 -14
-12 -12-10 -10 -10 -9 -9 -9 -8
-6 -5 -5 -5
0
4
21
31
-2-2-3-3-4
-8Ø -8%
Source: Oliver Wyman
UNTAPPED POTENTIAL
Financial synergies, for example from international tax levers and group-wide financing options, have been used
successfully in the past.
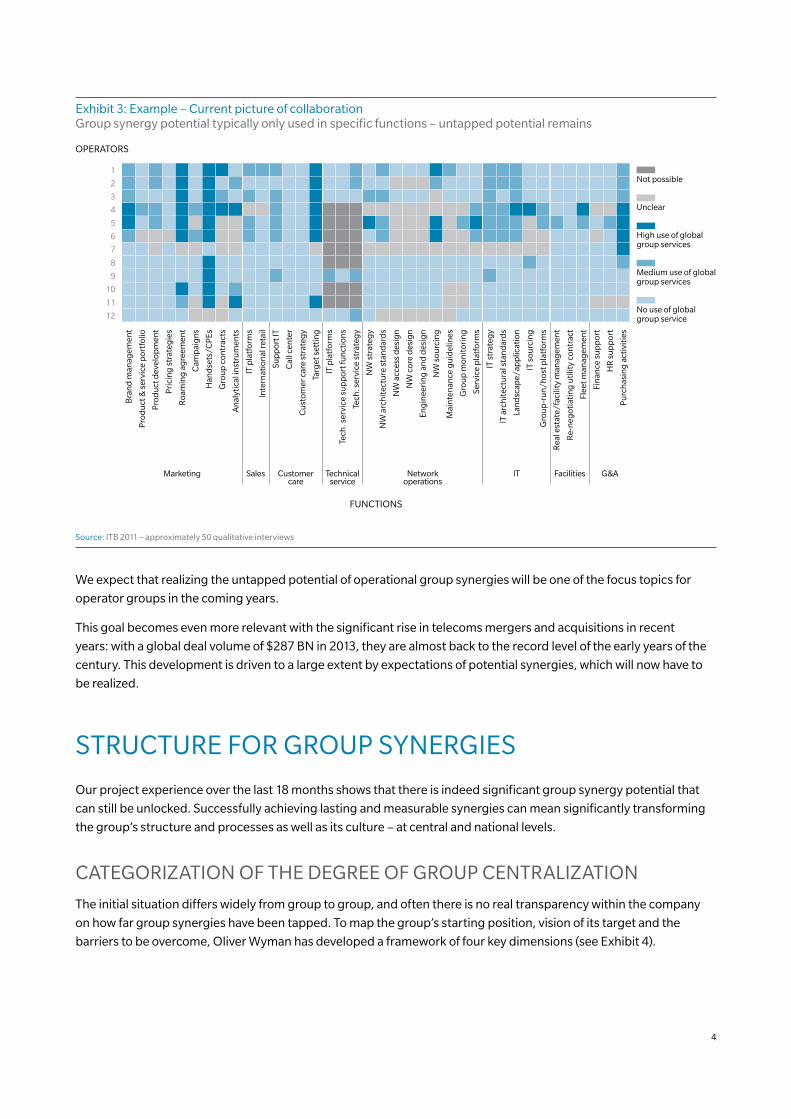
In contrast, the typical operational cost synergies realized so far are widely underdeveloped. Exhibit 3 shows an
example of a typical operator situation from an Oliver Wyman qualitative benchmark, where there is no group
involvement of any kind in the majority of operational functions. Moreover, leverage of group capabilities is
limited to a few specific activities (such as negotiation of roaming agreements), leveraged across most, but not all
group operating companies (OpCos).
4
Exhibit 3: Example – Current picture of collaborationGroup synergy potential typically only used in specific functions – untapped potential remains
OPERATORS
1
2
3
4
5
6
7
8
9
10
11
12
FUNCTIONS
SalesMarketing Customercare
Technicalservice
Networkoperations
IT Facilities G&A
Bra
nd
man
agem
ent
Pro
du
ct &
ser
vice
por
tfol
io
Pro
du
ct d
evel
opm
ent
Pri
cin
g s
trat
egie
s
Roa
min
g a
gre
emen
t
Cam
pai
gn
s
Han
dse
ts/C
PEs
Gro
up
con
trac
ts
An
alyt
ical
inst
rum
ents
IT p
latf
orm
s
Inte
rnat
ion
al re
tail
Sup
por
t IT
Cal
l cen
ter
Cu
stom
er c
are
stra
teg
y
Targ
et s
etti
ng
IT p
latf
orm
s
Tech
. ser
vice
su
pp
ort f
un
ctio
ns
Tech
. ser
vice
str
ateg
y
NW
str
ateg
y
NW
arc
hit
ectu
re s
tan
dar
ds
NW
acc
ess
des
ign
NW
cor
e d
esig
n
Eng
inee
rin
g a
nd
des
ign
NW
sou
rcin
g
Mai
nte
nan
ce g
uid
elin
es
Gro
up
mon
itor
ing
Serv
ice
pla
tfor
ms
IT s
trat
egy
IT a
rch
itec
tura
l sta
nd
ard
s
Lan
dsc
ape/
app
licat
ion
IT s
ourc
ing
Gro
up
-ru
n/h
ost p
latf
orm
s
Rea
l est
ate/
faci
lity
man
agem
ent
Re-
neg
otia
tin
g u
tilit
y co
ntr
act
Flee
t man
agem
ent
Fin
ance
su
pp
ort
HR
su
pp
ort
Pu
rch
asin
g a
ctiv
itie
s
Medium use of global group services
No use of global group service
Unclear
High use of global group services
Not possible
Source: ITB 2011 – approximately 50 qualitative interviews
We expect that realizing the untapped potential of operational group synergies will be one of the focus topics for
operator groups in the coming years.
This goal becomes even more relevant with the significant rise in telecoms mergers and acquisitions in recent
years: with a global deal volume of $287 BN in 2013, they are almost back to the record level of the early years of the
century. This development is driven to a large extent by expectations of potential synergies, which will now have to
be realized.
STRUCTURE FOR GROUP SYNERGIES
Our project experience over the last 18 months shows that there is indeed significant group synergy potential that
can still be unlocked. Successfully achieving lasting and measurable synergies can mean significantly transforming
the group’s structure and processes as well as its culture – at central and national levels.
CATEGORIZATION OF THE DEGREE OF GROUP CENTRALIZATION
The initial situation differs widely from group to group, and often there is no real transparency within the company
on how far group synergies have been tapped. To map the group’s starting position, vision of its target and the
barriers to be overcome, Oliver Wyman has developed a framework of four key dimensions (see Exhibit 4).
5
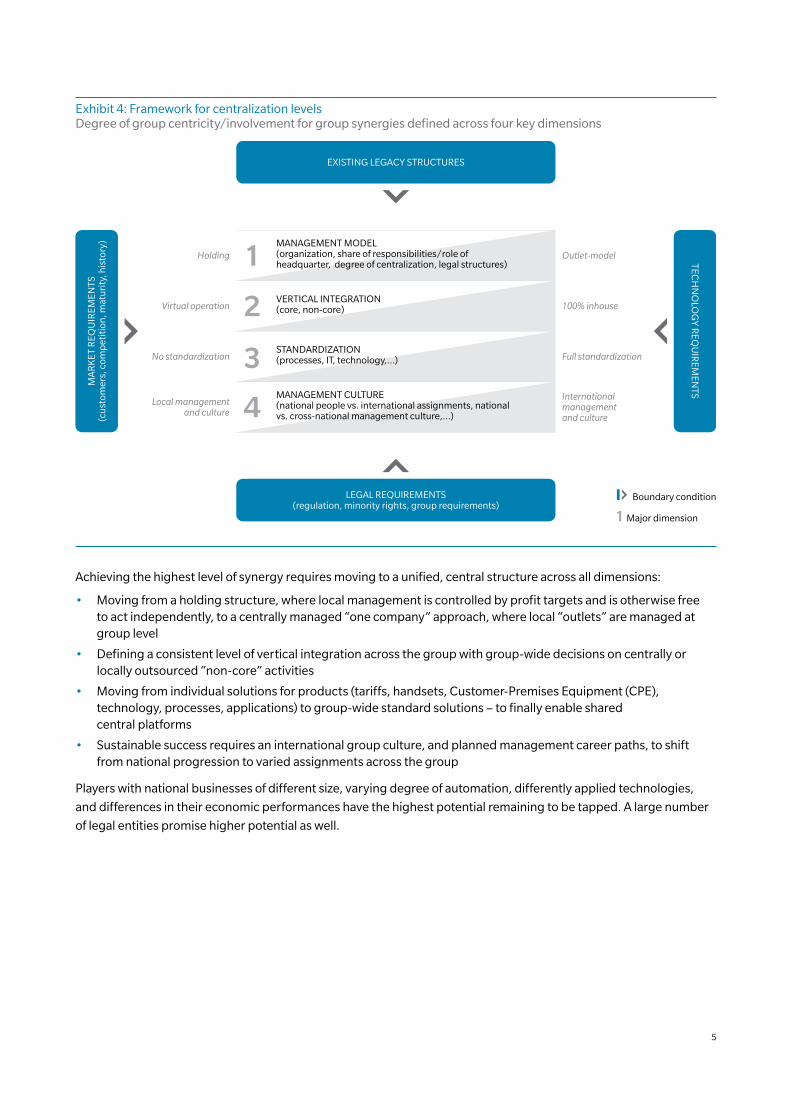
Exhibit 4: Framework for centralization levelsDegree of group centricity/involvement for group synergies defined across four key dimensions
Holding
Virtual operation
No standardization
Outlet-model
100% inhouse
Full standardization
Internationalmanagementand culture
MANAGEMENT MODEL(organization, share of responsibilities/role of headquarter, degree of centralization, legal structures)1VERTICAL INTEGRATION(core, non-core)2STANDARDIZATION(processes, IT, technology,...)3MANAGEMENT CULTURE(national people vs. international assignments, national vs. cross-national management culture,...)4
TECH
NO
LOG
Y R
EQU
IREM
ENTS
LEGAL REQUIREMENTS(regulation, minority rights, group requirements)
Local managementand culture
MA
RK
ET R
EQU
IREM
ENTS
(cu
stom
ers,
com
pet
itio
n, m
atu
rity
, his
tory
)
EXISTING LEGACY STRUCTURES
Major dimension
Boundary condition
Achieving the highest level of synergy requires moving to a unified, central structure across all dimensions:
• Moving from a holding structure, where local management is controlled by profit targets and is otherwise free to act independently, to a centrally managed “one company” approach, where local “outlets” are managed at group level
• Defining a consistent level of vertical integration across the group with group-wide decisions on centrally or locally outsourced “non-core” activities
• Moving from individual solutions for products (tariffs, handsets, Customer-Premises Equipment (CPE), technology, processes, applications) to group-wide standard solutions – to finally enable shared central platforms
• Sustainable success requires an international group culture, and planned management career paths, to shift from national progression to varied assignments across the group
Players with national businesses of different size, varying degree of automation, differently applied technologies,
and differences in their economic performances have the highest potential remaining to be tapped. A large number
of legal entities promise higher potential as well.
6
BARRIERS TO OVERCOME
In realizing these synergies, significant barriers have to be taken into account (see Exhibit 4), for example:
• Legal regulatory constraints: Potential local minority shareholder interests as well as national legal and regulatory requirements (especially for incumbent operators) impose minimum requirements for local management, services and accountability.
• Legacy structures: Groups often contain many acquired operators that previously developed independently. Overcoming the existing management structures as well as infrastructure and processes is one of the key challenges for realizing the full group synergy potential, and requires a long-term approach and focus.
• Technology: Technological developments in the past have made remote management of networks and common service platforms achievable across countries – but planning, building and maintaining the access network requires local knowledge as well as a local service organization, including local contractors.
• Most importantly, the operator’s market environment: Not all functions can be centralized and managed remotely. While it is possible to deliver internal back-end functions remotely, customer-facing activities typically require some local connection (language barriers, for example, as well as local accents may limit the offshoring potential for call centers, and on-the-ground market knowledge is required to react quickly in terms of pricing, promotions, etc.).
TARGET BLUEPRINT
The long-term vision of an efficient operator group fully realizing its efficiency potential will, therefore, be a
combination of a central “hub” organization that provides infrastructure and back-end services for multiple lean
local “spokes”, which focus on customer-facing and local market functions (see Exhibit 5).
National organizations are kept “lean” by defining the functions that are considered “core”, and therefore need
to be provided in-house, and by outsourcing all other local activities (such as contact centers and technical
field services).
Achieving this “target blueprint” requires a long-term commitment to a stable goal and a structured program that
achieves short- and mid-term efficiency measures in well-defined intermediate steps which are digestible for day-
to-day management.
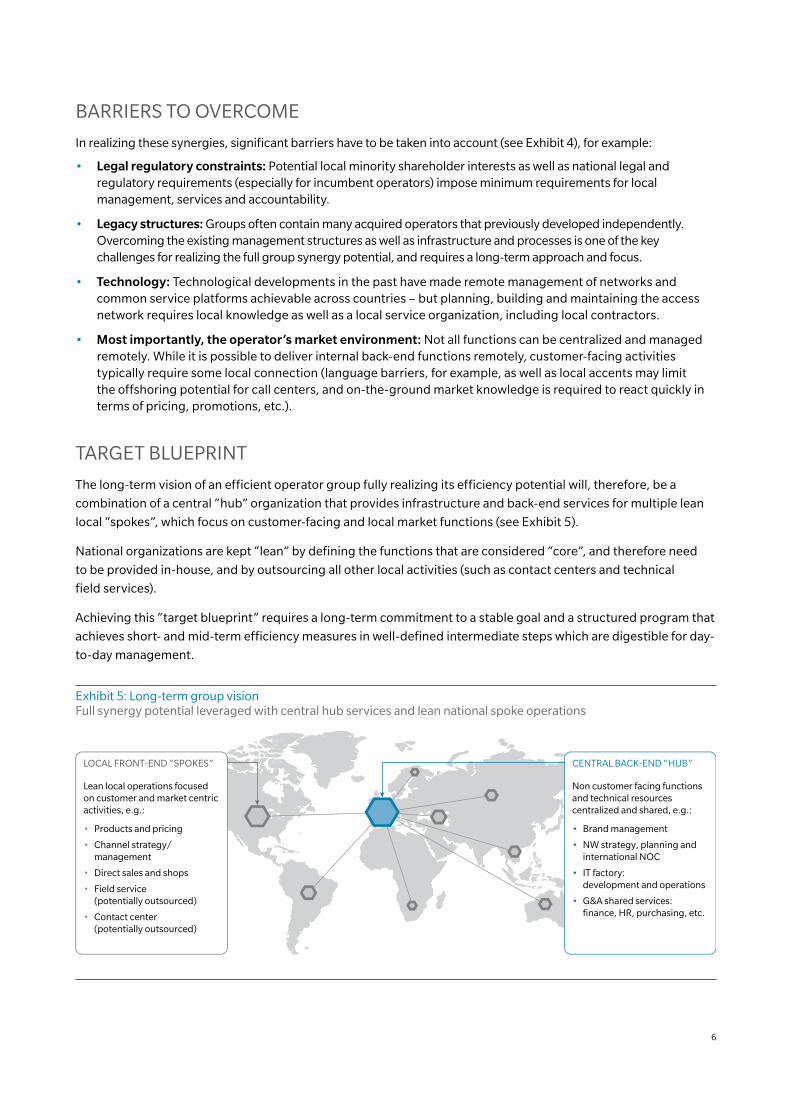
Exhibit 5: Long-term group visionFull synergy potential leveraged with central hub services and lean national spoke operations
LOCAL FRONT-END “SPOKES”
Lean local operations focused on customer and market centric activities, e.g.:
• Products and pricing
• Channel strategy/management
• Direct sales and shops
• Field service (potentially outsourced)
• Contact center (potentially outsourced)
CENTRAL BACK-END “HUB”
Non customer facing functions and technical resources centralized and shared, e.g.:
• Brand management
• NW strategy, planning and international NOC
• IT factory: development and operations
• G&A shared services: finance, HR, purchasing, etc.
7
GROUP SYNERGY MEASURES
MEASURE TYPES AND STRUCTURE
The identification of group synergy measures needs to go beyond traditional shared service centers. Oliver Wyman
differentiates two major types of operational group synergies to be evaluated for all functions along the telecoms
value chain (see Exhibit 6).
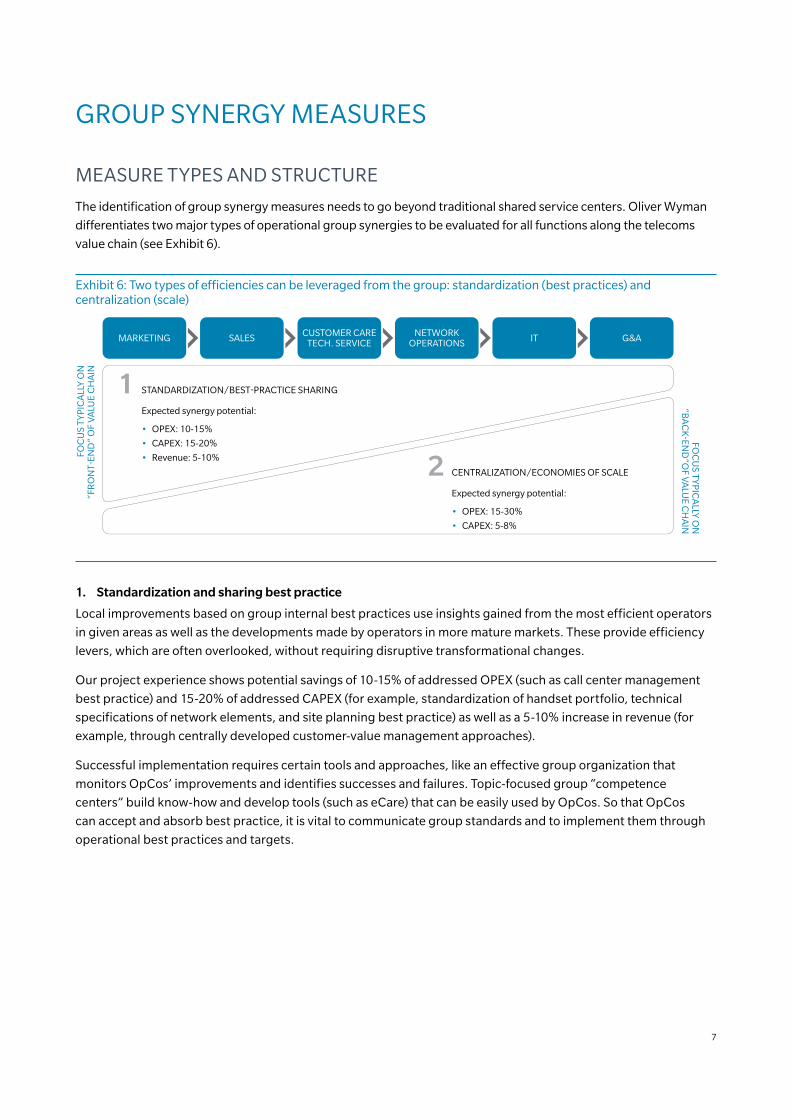
Exhibit 6: Two types of efficiencies can be leveraged from the group: standardization (best practices) and centralization (scale)
FOC
US
TYP
ICA
LLY
ON
“FR
ON
T-EN
D”
OF
VA
LUE
CH
AIN
FOC
US TY
PIC
ALLY
ON
“BA
CK
-END
”OF V
ALU
E CH
AIN
STANDARDIZATION/BEST-PRACTICE SHARING
Expected synergy potential:
• OPEX: 10-15%
• CAPEX: 15-20%
• Revenue: 5-10%
CENTRALIZATION/ECONOMIES OF SCALE
Expected synergy potential:
• OPEX: 15-30%
• CAPEX: 5-8%
MARKETING SALES CUSTOMER CARETECH. SERVICE
NETWORKOPERATIONS IT G&A
1
2
1. Standardization and sharing best practice
Local improvements based on group internal best practices use insights gained from the most efficient operators
in given areas as well as the developments made by operators in more mature markets. These provide efficiency
levers, which are often overlooked, without requiring disruptive transformational changes.
Our project experience shows potential savings of 10-15% of addressed OPEX (such as call center management
best practice) and 15-20% of addressed CAPEX (for example, standardization of handset portfolio, technical
specifications of network elements, and site planning best practice) as well as a 5-10% increase in revenue (for
example, through centrally developed customer-value management approaches).
Successful implementation requires certain tools and approaches, like an effective group organization that
monitors OpCos’ improvements and identifies successes and failures. Topic-focused group “competence
centers” build know-how and develop tools (such as eCare) that can be easily used by OpCos. So that OpCos
can accept and absorb best practice, it is vital to communicate group standards and to implement them through
operational best practices and targets.
8
2. Centralization and economies of scale
The centralization and bundling of functions across borders – typically focusing on non-customer-facing “back-
end” functions – increases efficiency levels through greater scale and scope.
The effects of this are:
• Leveraging salary arbitrage within the group footprint (for example, with the use of cross-border contact centers)
• Elimination of redundancies in infrastructure, systems and overheads (for example, by having only one central Network Operations Center (NOC) or larger more efficient data-centers)
• The possibility of higher degrees of professionalization and specialization
• Better workload management with increased volumes (for example, through batch payroll processing)
Our project experience shows savings of 15-30% in addressed OPEX (for example, with a central NOC, shared
service centers for General and Administrative (G&A) functions) as well as 5-8% in addressed CAPEX (for
example, through a unified core network).
MEASURE EXAMPLES
Typical examples of successful group synergy measures in both dimensions and across all functions of the
telecoms functional chain are shown in Exhibit 7. These are just some of the long list of potential measures, each of
which justifies an individual discussion. We have selected two examples that are generally applicable.
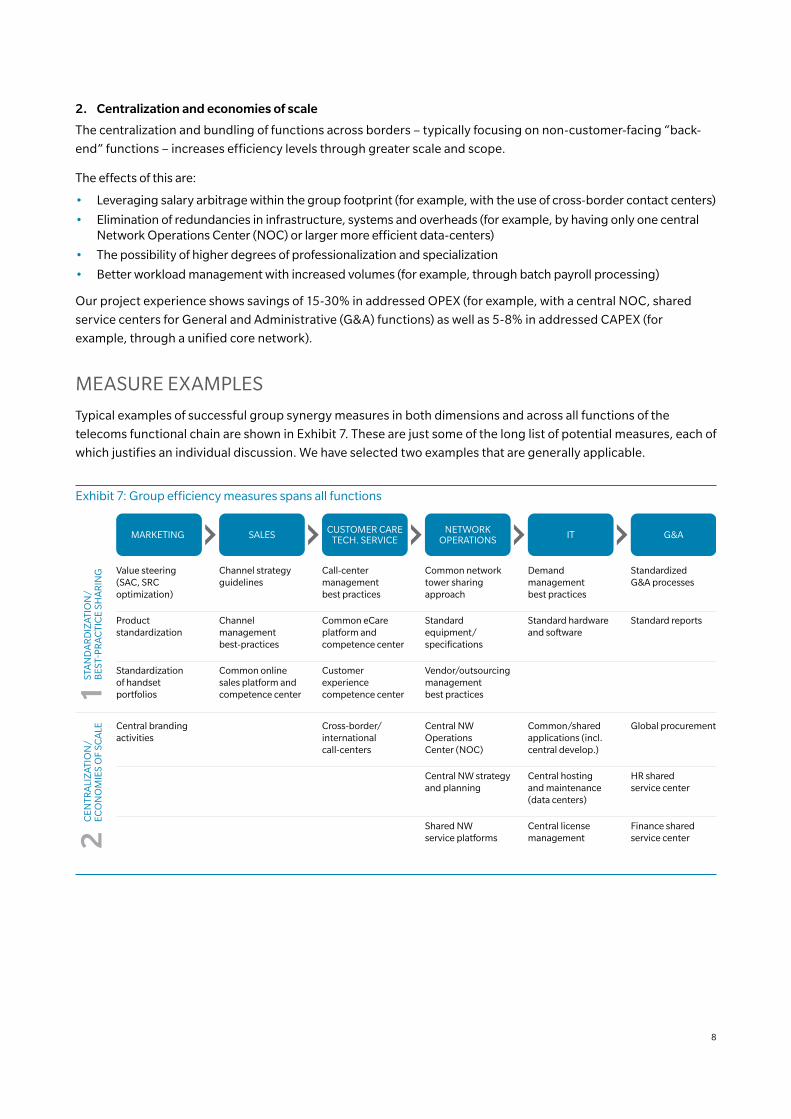
Exhibit 7: Group efficiency measures spans all functions
MARKETING SALES CUSTOMER CARETECH. SERVICE
NETWORKOPERATIONS IT G&A
Central brandingactivities
Cross-border/ international call-centers
Central NWOperations Center (NOC)
Common/shared applications (incl. central develop.)
Global procurement
Central NW strategy and planning
Central hostingand maintenance(data centers)
HR sharedservice center
Shared NWservice platforms
Central licensemanagement
Finance shared service center
Standardization of handset portfolios
Common online sales platform and competence center
Customer experience competence center
Vendor/outsourcing management best practices
Value steering (SAC, SRC optimization)
Channel strategy guidelines
Call-center management best practices
Common network tower sharing approach
Demandmanagementbest practices
StandardizedG&A processes
Product standardization
Channel management best-practices
Common eCare platform and competence center
Standard equipment/ specifications
Standard hardware and software
Standard reports
STA
ND
AR
DIZ
ATIO
N/
BES
T-P
RA
CTI
CE
SHA
RIN
G1
CEN
TRA
LIZ
ATIO
N/
ECO
NO
MIE
S O
F SC
ALE
2
9
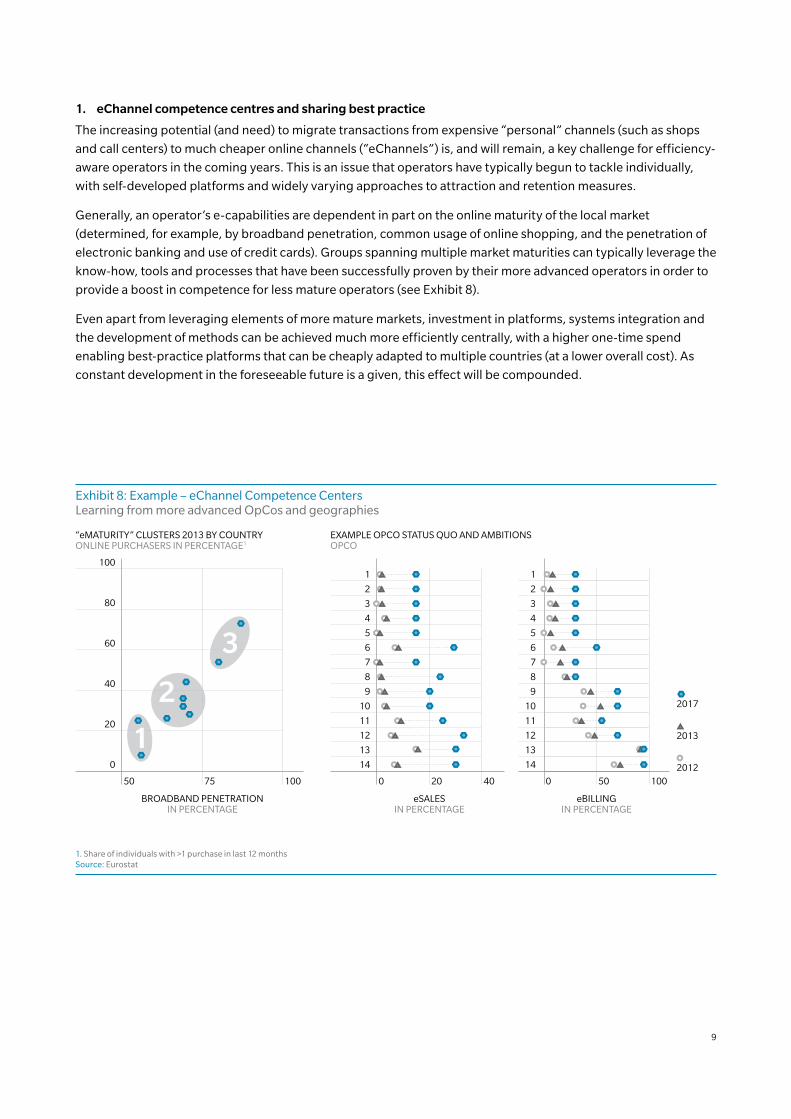
1. eChannel competence centres and sharing best practice
The increasing potential (and need) to migrate transactions from expensive “personal” channels (such as shops
and call centers) to much cheaper online channels (“eChannels”) is, and will remain, a key challenge for efficiency-
aware operators in the coming years. This is an issue that operators have typically begun to tackle individually,
with self-developed platforms and widely varying approaches to attraction and retention measures.
Generally, an operator’s e-capabilities are dependent in part on the online maturity of the local market
(determined, for example, by broadband penetration, common usage of online shopping, and the penetration of
electronic banking and use of credit cards). Groups spanning multiple market maturities can typically leverage the
know-how, tools and processes that have been successfully proven by their more advanced operators in order to
provide a boost in competence for less mature operators (see Exhibit 8).
Even apart from leveraging elements of more mature markets, investment in platforms, systems integration and
the development of methods can be achieved much more efficiently centrally, with a higher one-time spend
enabling best-practice platforms that can be cheaply adapted to multiple countries (at a lower overall cost). As
constant development in the foreseeable future is a given, this effect will be compounded.
Exhibit 8: Example – eChannel Competence CentersLearning from more advanced OpCos and geographies
400 1005020 0
40
20
80
60
BROADBAND PENETRATIONIN PERCENTAGE
0
100
1007550
“eMATURITY” CLUSTERS 2013 BY COUNTRYONLINE PURCHASERS IN PERCENTAGE1
14
13
12
11
10
9
8
7
6
5
4
3
2
1
14
13
12
11
10
9
8
7
6
5
4
3
2
1
EXAMPLE OPCO STATUS QUO AND AMBITIONSOPCO
eSALESIN PERCENTAGE
eBILLINGIN PERCENTAGE
2012
2013
2017
1. Share of individuals with >1 purchase in last 12 months Source: Eurostat
10
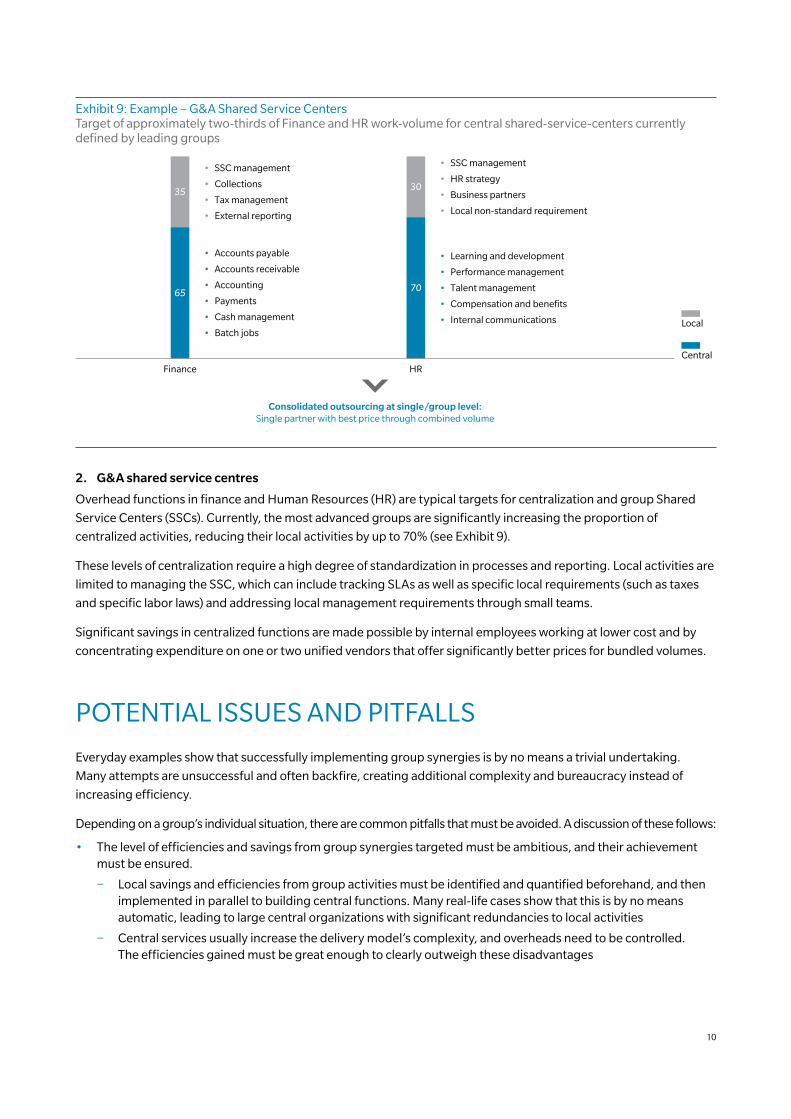
Exhibit 9: Example – G&A Shared Service CentersTarget of approximately two-thirds of Finance and HR work-volume for central shared-service-centers currently defined by leading groups
Finance HR
30
70
• Learning and development
• Performance management
• Talent management
• Compensation and benefits
• Internal communications
• Accounts payable
• Accounts receivable
• Accounting
• Payments
• Cash management
• Batch jobs
• SSC management
• HR strategy
• Business partners
• Local non-standard requirement
• SSC management
• Collections
• Tax management
• External reporting
Local
Central
35
65
Consolidated outsourcing at single/group level:Single partner with best price through combined volume
2. G&A shared service centres
Overhead functions in finance and Human Resources (HR) are typical targets for centralization and group Shared
Service Centers (SSCs). Currently, the most advanced groups are significantly increasing the proportion of
centralized activities, reducing their local activities by up to 70% (see Exhibit 9).
These levels of centralization require a high degree of standardization in processes and reporting. Local activities are
limited to managing the SSC, which can include tracking SLAs as well as specific local requirements (such as taxes
and specific labor laws) and addressing local management requirements through small teams.
Significant savings in centralized functions are made possible by internal employees working at lower cost and by
concentrating expenditure on one or two unified vendors that offer significantly better prices for bundled volumes.
POTENTIAL ISSUES AND PITFALLS
Everyday examples show that successfully implementing group synergies is by no means a trivial undertaking.
Many attempts are unsuccessful and often backfire, creating additional complexity and bureaucracy instead of
increasing efficiency.
Depending on a group’s individual situation, there are common pitfalls that must be avoided. A discussion of these follows:
• The level of efficiencies and savings from group synergies targeted must be ambitious, and their achievement must be ensured.
− Local savings and efficiencies from group activities must be identified and quantified beforehand, and then implemented in parallel to building central functions. Many real-life cases show that this is by no means automatic, leading to large central organizations with significant redundancies to local activities
− Central services usually increase the delivery model’s complexity, and overheads need to be controlled. The efficiencies gained must be great enough to clearly outweigh these disadvantages
11
• Centralization does not mean larger headquarters (HQ): a group’s shared functions should be located in the best region, based on cost and quality considerations rather than proximity to corporate HQ. In addition, new service functions should be staffed by managers who have first-hand experience of local needs as well as an understanding of group-wide requirements.
• A common culture must be enforced to avoid “us and them” dynamics: useful tools to achieve this can include management rotations and distribution of shared services across multiple OpCos.
• The organizational model has to evolve with increased centralization.
− Clear and uniquely defined responsibilities for delivery and KPIs must be ensured
− OpCos are no longer responsible for full P&L, more sophisticated KPI target models required (e.g. cost responsibility with individual central functions, revenue responsibility with local front-end teams)
• Radical changes have the potential to significantly disrupt local operations, risking quality, customer satisfaction and finally revenues. A phased migration is required, for example by starting with a selection of pilot OpCos for each function and gradually migrating additional OpCos as problems are solved.
• The costs and time needed for transformation must be realistically quantified and planned. Centralization is not a quick win – it requires a multi-year plan. HR transformation costs (including severance costs, training of new employees, and so on) must be taken into account, in addition to technical investment requirements.
IMPLICATIONS AND OUTLOOK
Groups need to review their potential for creating synergy – most will find large levers to strategically increase
their efficiency and reduce their cost base. However, the sustainable realization of this potential is no quick win. In
contrast to the small, step-by-step improvements used in traditional cost-cutting exercises, groups can destroy
value on a large scale if the subject is approached without a clear vision of the long-term target. The transformations
will take many years to be fully realized. The most advanced groups already have a head start. Those that follow must
act soon to remain competitive in the years ahead.
AUTHORS
Copyright © 2015 Oliver Wyman. All rights reserved.
FELIX IBLHER
+49 89 939 49 551
JAMES KESSEL
+49 211 8987 695
RAFA ASENSIO
+34 912 126 343
MATTHIAS LORENZ
+49 40 376 92 583
CONTACT
Oliver Wyman is a global leader in management consulting. With offices in 50+ cities across 26 countries, Oliver Wyman
combines deep industry knowledge with specialized expertise in strategy, operations, risk management, and organization
transformation. The firm’s 3,700 professionals help clients optimize their business, improve their operations and risk
profile, and accelerate their organizational performance to seize the most attractive opportunities. Oliver Wyman is
a wholly owned subsidiary of Marsh & McLennan Companies [NYSE: MMC].
For more information, visit www.oliverwyman.com.
ABOUT OLIVER WYMAN