ground-water resources of riverton irrigation project … · ground-water resources of riverton...
TRANSCRIPT
Ground-Water Resources of Riverton Irrigation Project Area, Wyoming
By D. A. MORRIS, O. M. HACKETT, K. E. VANLIER and E. A. MOULDER
With a section on
CHEMICAL QUALITY OF GROUND WATER
By W. H. DURUM
GEOLOGICAL SURVEY WATER-SUPPLY PAPER 1375
Prepared as part of a program of the
Department of the Interior for development
of the Missouri River basin
UNITED STATES GOVERNMENT PRINTING OFFICE, WASHINGTON : 1959
UNITED STATES DEPARTMENT OF THE INTERIOR
FRED A. SEATON, Secretary
GEOLOGICAL SURVEY
Thomas B. Nolan, Director
The U. S. Geological Survey Library has cataloged this publication as follows:
Morris, Donald Arthur,' 1918-Ground-water resources of Riverton irrigation project
area, Wyoming, by D. A. Morris [and others] With a section on Chemical quality of ground water, by W. H. Durum. Washington, U. S. Govt. Print. Off., 1958.
vi, 206 p. maps (3 fold., 1 col. in pocket) diagrs., tables, 24 cm. (U. S.. Geological Survey. Water-supply paper 1375)
Prepared as part of a program of the Dept. of the Interior for development of the Missouri River Basin.
Bibliography: p. 97-99.1. Water-supply Wyoming Riverton area. 2. Water, Under
ground Wyoming Riverton area. 3. Water Composition. I. Durum, Walton Henry, 1917- II. Title. III. Title: Riverton irri gation project area, Wyoming. (Series)TC801.U2 no. 1375 551.49097876 G S 59-172 Copy 2. GB1025.W8M6
For sale by the Superintendent of Documents, U. S. Government Printing Office Washington 25, D. C.
CONTENTS
PageAbstract ....................................................... 1Introduction .................................................... 3
Location and extent of area................................... 3Purpose and scope of investigation............................. 5Previous investigations ...................................... 5Methods of mapping......................................... 6Acknowledgments ........................................... 6Well-numbering system ...................................... 6
Geography ..................................................... 8Climate .................................................... 8Agriculture and industry..................................... 12History of irrigation......................................... 12
Physiography ................................................... 13Geologic history ............................................ 14Geomorphology ............................................. 15Drainage system ............................................ 18Streamflow ................................................. 19
Wind River ............................................. 19Fivemile Creek .......................................... 19Muddy Creek ........................................... 21Cottonwood Creek ....................................... 22
Geologic formations and their water-bearing properties.............. 23Cretaceous system ........................................... 23
Upper Cretaceous series.................................. 23Cody shale and Mesaverde formation, undifferentiated... 23
Tertiary system ............................................. 23Eocene series ........................................... 23
Wind River formation................................ 23Quaternary system .......................................... 27
Pleistocene and Recent series, undiff erentiated.............. 27Terrace deposits .................................... 27Colluvial-alluvial deposits, undiff erentiated............. 35Alluvial deposits .................................... 38Eolian deposits ...................................... 40Playa deposits ...................................... 41
Ground water ................................................... 41Depth to water table......................................... 41Depth to piezometric surface.................................. 42Water-level fluctuations ...................................... 43Recharge ................................................... 47
Precipitation ............................................ 47Irrigation .............................................. 47
Movement .................................................. 49Unconfined aquifers ..................................... 49Confined aquifers ........................................ 50
Discharge .................................................. 51Evapotranspiration ..................................... 51Streams and drains...................................... 51Lakes .................................................. 52
in
IV CONTENTS
Ground water Continued Discharge Continued
Wells and springs....................................... 53Aquifer test of Wind River formation .at Riverton............... 53
Test procedure .......................................... 53Analysis of test data..................................... 56
Adjustments ........................................ 56Transmissibility and storage coefficients................ 63Hydraulic boundaries ................................ 66
Estimate of well-field performance......................... 68Relation to project area.................................. 69
Chemical quality of the ground water, by W. H. Durum.......... 70Quality of ground water.................................. 72
Riverton-Le Clair irrigation district................... 72Midvale irrigation district............................ 80Other tracts ........................................ 82Seasonal fluctuations ................................ 83
Quality of water in relation to drainage..................... 85Mineral substances in the rocks and soils................... 86Quality of water in relation to use.......................... 90
Domestic use ........................................ 90Irrigation use ....................................... 91
Summary and conclusions........................................ 92Selected bibliography ............................................ 97Water-level measurements ....................................... 99Logs of wells.................................................... 131Inventory of wells and springs.................................... 175Index .......................................................... 205
ILLUSTRATIONS
PagePLATE 1. Geologic map showing location of wells in the Riverton
irrigation project, Fremont County, Wyo.............In pocket2. Map showing depth to water in the Midvale and North
Pavillion areas, August 1950........................ In pocket3. Map showing configuration of the water table in the Midvale
area, in March and August 1950..................... In pocket4. View northward showing the bedrock slope between Indian
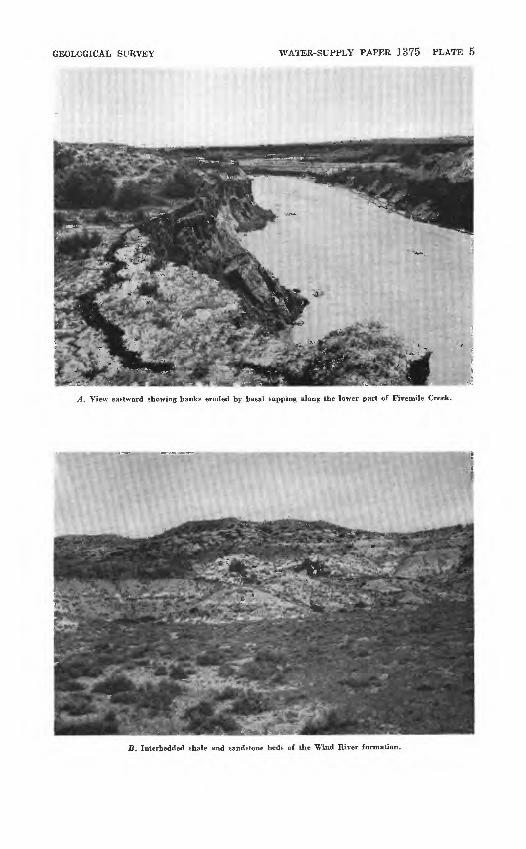
Ridge and Muddy Creek............................... 265. A, View eastward showing banks eroded by basal sapping
along the lower part of Fivemile Creek. B, Interbedded shale and sandstone beds of the Wind River formation.. 26
6. A, Terrace deposits underlying terrace T3 near Riverton. B, View approximately northward showing the western part of the Missouri Valley. .......................... 26
FIGURE 1. Map of Wyoming showing areas in which ground-water studies have been made under the program for the devel opment of the Missouri River basin and the Wyoming State cooperative program ........................... 3
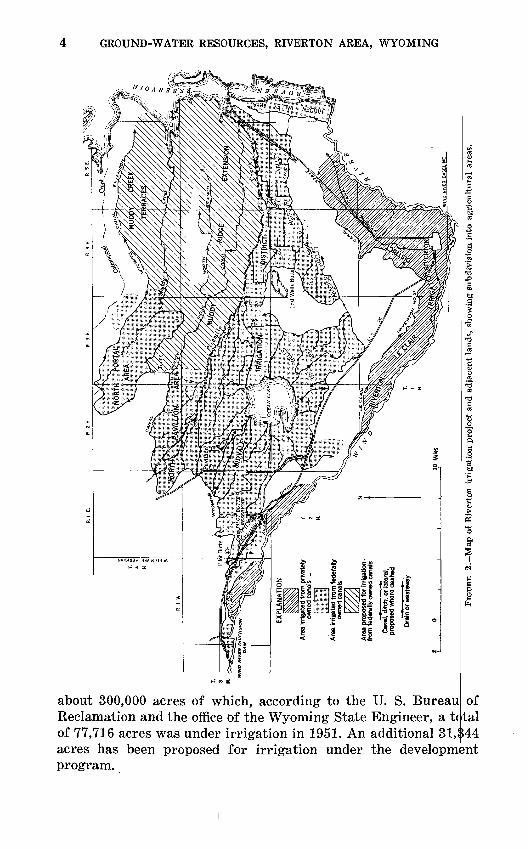
2. Map of the Riverton irrigation project and adjacent lands,showing subdivision into agricultural areas, 1951....... 4

CONTENTS v
PageFIGURE 8. Sketch illustrating well-numbering system used in this
report ............................................. 74. Annual precipitation at three stations in the Riverton irri
gation project area.................................. 95. Cumulative departure from average precipitation at three
stations in the Riverton irrigation project area......... 106. Average monthly precipitation at three stations in the Riv
erton irrigation project area......................... 117. Hydrographs showing fluctuations of the water level in
wells A2-3-35cal and A2-5-6adl and precipitation at Riv erton, 1949-50 ...................................... 44
8. Hydrograph showing water-level fluctuations in wellA3-2-20cdl, 1949-51 ................................. 45
9. Hydrographs showing fluctuations of the water level inwells Al-4-29bd2 and Al-4-33dd, 1951................. 46
10. Map showing location of municipal wells used in pumping test and circles whose radii are equal to the computed distance to the image well............................ 54
11. Hydrographs showing the recovery of the water level inwells 5 to 11 prior to beginning of test................. 55
12. Semilogarithmic plot of drawdown data and recovery ad justment, observation well 11......................... 56
13. Logarithmic plot of drawdown data, observation well 11... 5714. Logarithmic plot of recovery data, observation well 5.... 6215. Logarithmic plot of drawdown data, observation well 5.... 6316. Logarithmic plot of drawdown data, observation well 6.... 6417. Logarithmic plot of drawdown data, observation well 7.... 6418. Logarithmic plot of drawdown data, observation well 9.... 6519. Logarithmic plot of drawdown data, observation well 10... 6520. Semilogarithmic plot of drawdown data, observation well 9,
showing departure curve caused by a boundary......... 6621. Graph showing drawdown (interference) in well field at
distance r from a well pumped for t days.............. 6922. Graph showing decline of piezometric surface at distance
r from approximate center of well field after pumping from storage for t days.............................. 70
23. Map of Riverton irrigation project and adjacent land show ing locations at which samples were collected for chemi cal analysis ........................................ 71
24. Principal mineral constituents of ground water........... 7825. Relation of depth of well to mineral content, total hardness,
and percent sodium of water.......................... 7926. Relation of anions to dissolved solids in ground water...... 8127. Seasonal fluctuations of dissolved solids and sulfate in water
from selected wells.................................. 8428. Diagram for use in classifying water for irrigation....... 92
VI
TABLES
PageTABLE 1. Annual precipitation at Wind River diversion dam and at
Pavillion and Riverton................................ 82. Mean discharge of Wind River -at Riverton................ 193. Mean discharge of Fivemile Creek at station three-fourths
of a mile upstream from mouth of creek................. 204. Mean discharge of Muddy Creek at station 5 miles upstream
from mouth of creek.................................. 215. Mean discharge of Cottonwood Creek at station near Bonne-
ville ................................................ 226. Summary of terraces................................... 277. Measurements of the water level in wells during aquifer
test at Riverton, March 1951.......................... 588. Maximum and minimum concentrations of mineral constitu
ents in ground water in several irrigated areas.......... 739. Mineral constituents, in part per million, and related physical
measurements of ground and surface water............. 7410. Comparison of chemical composition of ground and surface
water ............................................... 8011. Results of chemjpal analysis of^two, samples of,water from
well A3-2-6ac ..'"......... T/f......................... 8212. Comparison of seasonal fluctuations of chemical constituents
in water from selected wells............................ 8413. Percentage composition of soluble salts on the ground surface 8614. Water-soluble and acid-soluble constituents of soils and rock
materials ........................................... 8815. Soil data collected during drainage investigations of the
Midvale irrigation district............................. 8916. Water-level measurements .............................. 10017. Logs of wells.......................................... 13118. Records of wells and springs............................ 176
GROUND-WATER RESOURCES OF THE RIVERTON IRRIGATION PROJECT AREA, WYOMING
By D. A. MORRIS, 0. M. HACKETT, K. E. VANLIER, and E. A. MOULDER
ABSTRACT
The Riverton irrigation project area is in the northwestern part of the Wind River basin in west-central Wyoming. Because the annual precipitation is only about 9 inches, agriculture, which is the principal occupation in the area, is dependent upon irrigation. Irrigation by surface-water diversion was begun in 1906; water is now supplied to 77,716 acres and irrigation has been proposed for an additional 31,344 acres.
This study of the geology and ground-water resources of the Riverton irri gation project, of adjacent irrigated land, and of nearby land proposed for irrigation was begun during the summer of 1948 and was completed in 1951. The purpose of the investigation was to evaluate the ground-water resources of the area and to study the factors that should be considered in the solution of drainage and erosional problems within the area.
The Riverton irrigation project area is characterized by flat to gently slop ing stream terraces, which are flanked by a combination of badlands, pediment slopes, and broad valleys. These features were formed by long-continued ero sion in an arid climate of the essentially horizontal, poorly consolidated beds of the Wind River formation. The principal streams of the area flow south eastward. Wind River and Fivemile Creek are perennial streams and the others are intermittent. Ground-water discharge and irrigation return flow have created a major problem in erosion control along Fivemile Creek. Similar conditions might develop along Muddy and lower Cottonwood Creeks when land in their drainage basins is irrigated.
The bedrock exposed in the area ranges in age from Late Cretaceous to early Tertiary (middle Eocene). The Wind River formation of early and middle Eocene age forms the uppermost bedrock formation in the greater part of the area. Unconsolidated deposits of Quaternary age, which consist of terrace gravel, colluvium, eolian sand and silt, and alluvium, mantle the Wind River formation in much of the area.
In the irrigated parts of the project, water for domestic use is obtained chiefly from the sandstone beds of the Wind River formation although some is obtained from the alluvium underlying the bottom land and from the un- consolidated deposits underlying the lower terraces along the Wind River. Although adequate quantities of water for domestic use are available from the Wind River formation, these quantities are not considered to be large enough to warrant pumping of ground water for irrigation. Only a few wells are in the nonirrigated part of the area. When this new land is irrigated, a body of ground water will gradually form in the terrace deposits and the alluvial and colluvial-alluvial deposits. Eventually, the terrace deposits may yield adequate quantities of water for domestic and stock use, but only locally are the alluvial and colluvial-alluvial deposits likely to become suitable aquifers.
In the Riverton irrigation project area, ground water occurs under water-
2 GROUND-WATER RESOURCES, RIVERTON AREA, WYOMING
table conditions near the surface and under artesian conditions in certain strata at both shallow and greater depths. Irrigation is the principal source of recharge to the shallow aquifers; the water level in wells that tap these aquifers fluctuates with irrigation. The depth to water in the shallow wells ranges from less than 1 foot to about 30 feet below the land surface, depend ing on the season of the year and on the length of time the land has been irrigated. The water level in wells that tap the deep confined aquifers, which receive recharge indirectly from surface sources, fluctuates only slightly be cause the recharge and discharge are more constant. In most places the depth to water in wells penetrating the deep confined aquifers is much greater than that in shallow wells, but in certain low areas water from the deep aquifers flows at the surface from wells. Ground water moves from the area of re charge in the direction of the hydraulic gradient and is discharged either by evapotranspiration; by inflow into streams, drains, or lakes; by pumping or flow of wells; or by flow of springs.
Waterlogging and the associated development of saline soils are common in parts of the Riverton irrigation project and adjacent irrigated land. The waterlogging is in part the result of the infiltration of irrigation water in excess of the capacity of the aquifers to store and transmit this added re charge. The solution of the drainage problems involves the consideration of a number of factors, some of which are inadequately known in some parts of the area and require further investigation before fully effective drainage measures can be designed.
The results of an aquifer test to determine the hydrologic characteristics of the Wind River formation at Riverton indicate a transmissibility of 10,000 gallons per day per foot (10,000 gpd per ft) and a storage coefficient of 2 x 1Q-4. The results of the test provide a part of the necessary foundation for the solution of present and future water-supply problems at Riverton and throughout the project area.
Water from shallow aquifers in irrigated tracts in the Riverton irrigation project area generally contains large amounts of dissolved solids that were leached from the soil and rocks by infiltrating irrigation water. However, wells tapping beds that receive considerable recharge from influent canal and drain seepage yield water of relatively low mineralization. Dilute water is obtained also from some shallow wells in the alluvial bottom lands and on low stream terraces that border the Wind River. Water from deep aquifers generally is more dilute than that from shallow aquifers. However, ground water from the deeper aquifers, unmixed with irrigation water, geneally has a percent sodium greater than 80.
Analyses of salt crusts on the ground surface in low areas that are affected by effluent seepage and a high water table show predominance of sodium sulfate salinity, and from determinations of the water-soluble and acid- soluble substances in several samples of soil and shale it is apparent that harmful concentrations of salts are being deposited in poorly drained areas. Although most of the soil in the Midvale irrigation district is of the normal arid type, analyses of soil samples show that saline, nonsaline alkaline, and saline alkaline types also are present.
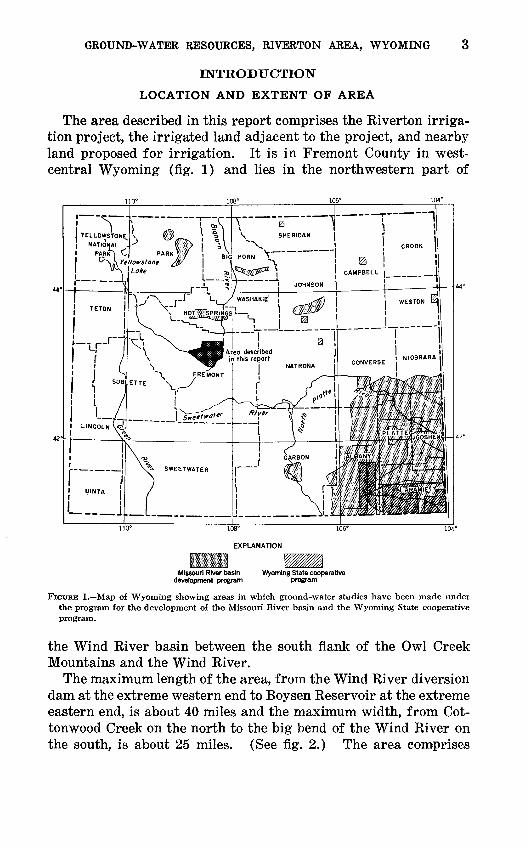
GROUND-WATER RESOURCES, RIVERTON AREA, WYOMING 3
INTRODUCTION
LOCATION AND EXTENT OF AREA
The area described in this report comprises the Kiverton irriga tion project, the irrigated land adjacent to the project, and nearby land proposed for irrigation. It is in Fremont County in west- central Wyoming (fig. 1) and lies in the northwestern part of
L J._L_.____108°
EXPLANATION
Missouri River basin Wyoming State cooperative development program program
FIGURE 1. Map of Wyoming showing areas in which ground-water studies have been made under the program for the development of the Missouri River basin and the Wyoming State cooperative program.
the Wind Kiver basin between the south flank of the Owl Creek Mountains and the Wind Kiver.
The maximum length of the area, from the Wind River diversion dam at the extreme western end to Boysen Reservoir at the extreme eastern end, is about 40 miles and the maximum width, from Cot- tonwood Creek on the north to the big bend of the Wind River on the south, is about 25 miles. (See fig. 2.) The area comprises
Area
pro
pose
d fo
r Irr
igat
ion
from
fede
rally
ow
ned
cana
ls
O
§ so
to @ o
d 1 jn to s O to
FIG
UR
E 2. M
ap o
f R
iver
ton
irri
gati
on p
roje
ct a
nd a
djac
ent
land
s, s
how
ing
subd
ivis
ion
into
ag
ricu
ltu
ral
area
s.
INTRODUCTION 5
PURPOSE AND SCOPE OF INVESTIGATION
The purposes of this investigation were to determine (1) the location of available water supplies for farms and towns within the area, (2) the chemical quality of the ground water, (3) the effects of irrigation on ground- and surface-water supplies, (4) the water bearing properties of the aquifers, (5) where drainage problems exist or may occur, and (6) the geologic and hydrologic factors that must be considered in the design of adequate and effective drainage facilities.
The field investigation on which this report is based was made by the writers between June 1948 and November 1951. A study was made of the geologic history, physiography, structure, and stratigraphy of the area, and a geologic map having particular emphasis on ground-water conditions was prepared. The hydro- logic properties of the Wind River formation were determined by the pumping-test method. Every well in the area was examined and pertinent available data were recorded. Measurements of the water level were made periodically in selected wells throughout the area. Samples of water were collected from wells and surface sources at key locations in the area, and a chemical analysis of the water was made in the laboratory of the United States Geological Survey at Lincoln, Nebr.
The investigation was under the general supervision of A. N. Sayre, chief of the Ground Water Branch, and of G. H. Taylor, regional engineer. F. A. Swenson, district geologist, Billings, Mont., directly supervised the field investigation. The study of the quality of the water was under the general direction of S. K. Love, chief of the Quality of Water Branch, and under the direct supervision of P. C. Benedict, regional engineer.
PREVIOUS INVESTIGATIONS
Little detailed work related to ground water had been done pre viously in the report area. The geology of the Boysen area, which includes the northern part of the Riverton project, was described by Tourtelot and Thompson (1948). The results of the mapping of the remander of the Riverton area by the Fuels Branch of the Geological Survey during the 1949, 1950, and 1951 field seasons have not yet been published.
The report by Tourtelot and Thompson (1948) and other reports dealing with general regional geology, which have been very useful to the authors, are listed in a bibliography at the end of this report.
6 GROUND-WATER RESOURCES, RIVERTON AREA, WYOMING
METHODS OF MAPPING
The geology of the area was mapped on aerial photographs and the data transferred to a base map prepared by the Topographic Division of the Geological Survey from aerial photographs. The scale of the map was 1:24,000.
Altitudes of wells were estimated from Bureau of Reclamation topographic maps of the area or were determined by third-order leveling from benchmarks of either the Geological Survey or the Bureau of Reclamation. The terraces were correlated by use of an altimeter or topographic maps. During the mapping the thickness of the gravel in the terrace deposits was measured roughly by hand level wherever the top and bottom of the gravel were exposed at the terrace edge. However, in most places a lack of clean exposures and the large amount of mantling material on almost all terrace faces interfered with the determination of the exact thicknesses of the overburden, and estimates had to be made.
Precise location of the contact between colluvial-alluvial or allu vial deposits and bedrock proved to be very difficult. Consequently, the units that were mapped indicate the predominant rock type; other rocks or sediments present were not considered mappable. A description of the kind and amounts of mantling deposits is given later in this report.
ACKNOWLEDGMENTS
The writers are indebted to the many persons who contributed information and assistance in the field and to those who aided in the preparation and review of this report. Earl Sullivan, James Mariner, Edward O'Hara, Martin Norman, and Homer Harry, well drillers, furnished information pertaining to wells they had drilled in the area. The Farmers Home Administration also made available much information on wells. The Bureau of Reclamation supplied maps and furnished basic data relating to ground waterand drainage. The Soil Conservation Service and the BureauIndian Affairs likewise were of assistance. The wholehearted co operation of the residents of the area greatly assisted the field studies.
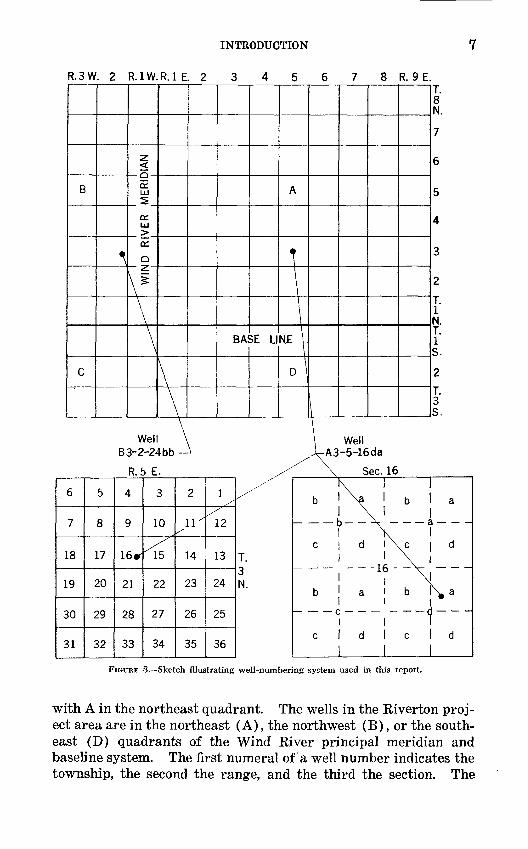
WELL-NUMBERING SYSTEMEach well in the area covered by this investigation is numbered
according to its location within the Bureau of Land Management system of land subdivision. (See fig. 3). The first letter (a capi tal) of a well number indicates the quadrant of the meridian and baseline system in which the well is located; the quadrants s.re lettered A, B, C, and D in a counterclockwise direction beginning
of
INTRODUCTION
R.3W. 2 R.I W.R.I E. 2 3 4 5 6 8 R. 9E.
Q-
ce
onLU>
Well B3-2-24bb
R.5 E.
6
7
18
19
30
31
5
8
17
20
29
32
4
9
16*
21
28
33
3
10
"15
22
27
34
2
11" x
14
23
26
35
1 /
12
13
24
25
36
- - - -16 - -V -
FIGURE 3. Sketch illustrating well-numbering system used in this report.
with A in the northeast quadrant. The wells in the Riverton proj ect area are in the northeast (A), the northwest (B), or the south east (D) quadrants of the Wind River principal meridian and baseline system. The first numeral of a well number indicates the township, the second the range, and the third the section. The
8 GROUND-WATER RESOURCES, RIVERTON AREA, WYOMING
lowercased letters following the section number indicate the loca tion of the well within the section; the first letter denotes the quarter section and the second the quarter-quarter section, or 40-acre tract. The lowercase letters also are assigned in a counter clockwise direction and begin in the northeast quarter or quarter- quarter section. If two or more wells are in a 40-acre tract, they are differentiated by consecutive numbers (beginning with 1) that are added to the well number.
GEOGRAPHY
CLIMATE
The climate of the Riverton irrigation project area is semiarid to arid and is characterized by great deviations from normal pre cipitation. United States Weather Bureau stations at the Wind River diversion dam and at Pavillion and Riverton have complete records for 28- to 31-year periods. (See table 1.) During the past 31 years at the Wind River diversion dam, at the extreme western end of the area, the annual precipitation has ranged from 5.05 to 16.28 inches and has averaged 9.83 inches. During the past 28 years at Pavillion, in the northwestern part of the area,
TABLE 1. Annual precipitation, in inches, at Wind River diversion dam and atPavillion and Riverton
[From records of the U. S. Weather Bureau]
Year
1919. -__--_-_----____-_____-______________1920__. __-.____-_ __--__-_____.___.____.___19211922.. ____________________________________1 Q9Q
1924___ ___________________________________1925___________ ___________________________1926.. _________ _____ _ _ _ ...1927.. ____________ _ _ _192819291930_______ _______________________________1931_____-_-_-___-_-_-_. _____ _____ _____1932____, ---___-_-_---_-___-_-__.-_____.__1933 _----_---_---_--____ __ ___-___-.-_-1934_____-_-_-_______.__ _____ ___ _ _____1935. _ .-___---___-___-_-___-_______.____1936_______. ______________________________1937_______ _______________________________1938_____.__ ______________________________1939_ ______ _ _ ____ ______1940____________________ _____ ___ _ _____1941_____ ___________________________ _____1942_______._ __ __________________________1943_____.._____ _ _____ ______1944____________________ _____ ___ _ _____1945_____. ________________________________1946____, _________ _____ ... _ ___19471948_______. ______ _____ _____ _1949____, _________________________________1950______ _______ ____ ...1951_____.________ ____
Wind River diversion dam
9.147.03
15.089.027.935.05
11.7210.918.25
12.7810.326.717.766.939.449.619.947.995.83
10.4913.579.395.53
14.3612.979.78
16.2810.0810.8710.988.99
Pavillion
9.288.367.52
12.127.715.20
13.677.165.578.276.686.778.00
10.047.906.818.73
13.659.305.74
15.6112.8910.4914.447.789.509.03
10.64
Riverton
11.25
18.4310.579.508.949.86
10.037.10
10.907.566.059.067.088.978.49
10.659.227.008.20
14.7411.597.79
12.1911.5210.0212.456.697.119.397.76
GEOGRAPHY
Wind River diversion dam
10
20
10
Riverton
Average 9.63
FIGURE 4. Annual precipitation at three stations in the Riverton irrigation project area.
the annual precipitation has ranged from 5.20 to 15.61 inches and has averaged 9.25 inches. During the past 29 years at Riverton, at the southern tip of the area, the annual precipitation has ranged from 6.05 to 18.43 inches and has averaged 9.62 inches. The yearly distribution of precipitation at these three stations is gen erally similar, although the dry and wet years do not always coin cide. (See fig. 4.)
10 GROUND-WATER RESOURCES, RIVERTON AREA, WYOMING
The graphs of cumulative departure from average precipitation at the Wind River diversion dam and at Pavillion and Riverton (fig. 5) illustrate the periods of generally above-average and below-average precipitation. The periods of above-average pre cipitation are shown by a rising line, and the periods of below- average precipitation by a declining line. At the Wind River diversion dam the period 5 of generally below-average precipitationwere from 1920 through 1926, from 1931 through 1939, and from
Wind River diversion dam
-10
\ieraqe j
-20
FIGURE 5. Cumulative departure from average precipitation at three stations in the Rivertonirrigation project area.
GEOGRAPHY 11
1941 through 1943; the periods of generally above-average pre cipitation were from 1926 through 1931, from 1939 through 1941, and from 1943 through 1951. At Pavillion precipitation was about average in 1924, generally below average from 1924 through 1940, and generally above average from 1940 through 1951. At Riverton the precipitation was above average in 1923, about aver age from 1923 through 1930, below average from 1930 through 1940, above average from 1940 through 1947, and below average from 1947 through 1951. At all three stations the yearly variations do not always conform with the general trend of the periods.
About 45 percent of the annual precipitation falls during April, May, and June, and 22 percent falls in September and October.
AVERA6E MONTHLY PRECIPITATION (1920-51), IN INCHES
AVERAGE MONTHLY PRECIPITATION (1919-51), IN INCHES
AVERAGE MONTHLY PRECIPITATION (1918-51), IN INCHES
Wind River diversion dam
Pavillion Riverton
FIGURE 6. Average monthly precipitation at three stations in the Riverton irrigation project area.
About 19 percent of the annual precipitation falls in May. The win ter months are driest at all stations. (See fig. 6.) The wet period in the spring usually comes too early and the wet period in the fall too late for the growing season of most crops. At times the fall precipitation is a handicap to the harvesting of crops and causes some loss. In the middle of the growing season the precipitation is scanty and the flow of streams is low. This deficiency is allevi ated somewhat by the use for irrigation of about 182,000 acre-feet of water from Bull Lake and Pilot Butte Reservoirs; the water is stored during the spring months when snowmelt and runoff are at a maximum.
The frost-free season has ranged from 75 to 163 days and aver ages about 128 days.
12 GROUND-WATER RESOURCES, RIVERTON AREA, WYOMING
AGRICULTURE AND INDUSTRY
The principal crops in the Riverton irrigation project area are beans, beets, potatoes, oats, and alfalfa hay; alfalfa and clover (for seed), wheat, and barley also are raised. In 1951 the Bureau of Reclamation reported 52,026 acres under cultivation on the River- ton irrigation project. The total value of crops was $2,233,209, which is an average return of $42.92 per acre.
Oats, the major crop, were grown on 9,096 acres, and alfalfa hay and alfalfa for seed were grown on 7,778 and 5,375 acres, respec tively. The total return from the alfalfa-seed crop was $302,400; the returns from oats and alfalfa hay ranked second and third and were $255,759 and $240,614, respectively. The highest average return per acre, $568.75, was for seed from 32 acres of tall wheat grass; the second highest return was $374.02 per acre from pota toes ; and the third was $123.81 per acre for sugar beets.
No mining is done in the area, although coal of poor quality has been mined near Pilot Butte in the western part of the area.
The oil industry is of considerable importance in the Riverton irrigation project area. Two oil fields, Steamboat Butte and Pilot Butte, are in T. 3 N., R. 1 W., at the western end of the area. Both produce oil from the Tensleep sandstone. A recently drilled well at the Pilot Butte field has also encountered oil at a shallow depth in the Muddy sandstone member of the Thermopolis shale. Nu merous other oil fields are adjacent to the area; the Riverton Dome oil field is the closest and is about 7 miles southeast of Riverton. Four wells have been drilled in this field since its discovery in 1948. Production here is also primarily from the Tensleep sandstone.
HISTORY OF IRRIGATION
The land in the Riverton irrigation project was ceded by the Indians of the Shoshone Reservation to the United States Govern ment on March 3, 1905. After a preliminary survey by the State of Wyoming, the area was opened for settlement in 1906. At that time construction was started on the first irrigation canal. This canal, which was built by the Wyoming Central Irrigation Co. and which is known as the Wyoming No. 2 canal, was completed in April 1907. (See fig. 2.) Water from the canal irrigates low lands that are mainly north and east of Riverton. In 1914, the settlers formed the Riverton Ditch Co., which constructed the Le Clair (Riverton No. 2) canal. The intake of this canal is about 15 miles northwest of Riverton, and the canal supplies water to low lands to the west along the river and also to land above the Wyo-
GEOGRAPHY 13
ming No. 2 canal. Two small private canals, the Hurtado and Aragon ditches, irrigate the lowlands west of the Le Clair canal.
The Bureau of Reclamation assumed responsibility for the present Riverton irrigation project in 1918 and began active con struction in 1920. The Wind River diversion dam, in the north west corner of the area, was completed in 1923. Pilot Butte Reservoir, which has a capacity of 30,000 acre-feet, and Pilot Butte power plant, at the intake of Pilot Butte Reservoir, were completed in 1926. Bull Lake Reservoir, completed in 1938, is about 5 miles southwest of the Wind River diversion dam and has a usable ca pacity of 152,000 acre-feet. The main Wyoming canal was com pleted from the Wind River diversion dam to Pavillion in 1925; since that time, the Pilot canal and numerous laterals have been constructed, and in 1950 the northward extension of the main Wyoming canal brought irrigation to the North Pavillion area. (See fig. 2.) A further extension of the main Wyoming canal has now been completed, which supplies water to additional acreage north of Fivemile Creek; a tunnel, which was completed in 1949, through Indian Ridge a prominent high divide lying between Fivemile Creek and Muddy Creek carries water to the North Portal area and Muddy Creek terraces. The North Portal area (fig. 2) was irrigated for the first time in 1951. Irrigation water was applied in 1951 to 77,716 acres in the Riverton area, of which 53,897 acres were either a part of or associated with the Bureau of Reclamation Riverton project and 23,819 acres were privately irri gated from the Le Clair (Riverton No. 2) canal, the Wyoming No. 2 canal, and the two small canals in the western part of the area. Plans for the irrigation of an additional 31,344 acres of land south and east of the North Portal area (Muddy Ridge exten sion) are now being considered.
PHYSIOGRAPHYThe Riverton irrigation project area is in the northwestern part
of the Wind River basin. This basin is a large sediment-filled, northwest-trending structural trough, which is bounded on the southwest by the anticlinal Wind River Mountains, on the north by the anticlinal Owl Creek Mountains, and on the south and east by the deeply eroded Sweetwater uplift and related structures. The most striking topographic features of the area are the promi nent stream terraces, pediment slopes, and broad valleys that have been formed in the easily eroded Tertiary deposits.
The terraces are a series of gently sloping surfaces along each stream and they range from a few feet to several hundred feet above the present level of the stream. They parallel and are prin-
14 GROUND-WATER RESOURCES, RIVERTON AREA, WYOMING
cipally on the north side of the parent streams. The terraces form steps to the north from the alluvial bottoms of the streams; along Muddy Creek they are interrupted by broad troughs in which closed, wind-scoured depressions have been formed. The terraces are underlain by thick deposits of well-rounded gravel. The up permost terrace in most places forms the interstream divide and is flanked to the north by a combination of pediment slopes, bad lands, and lower-terrace remnants. In places the more resistant sandstone beds that were formerly overlain by terrace deposits have retarded erosion and formed rock-capped buttes.
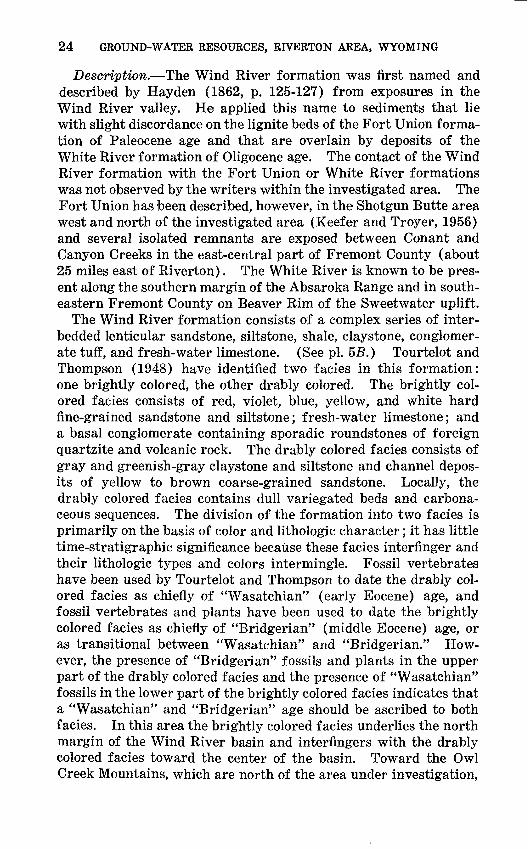
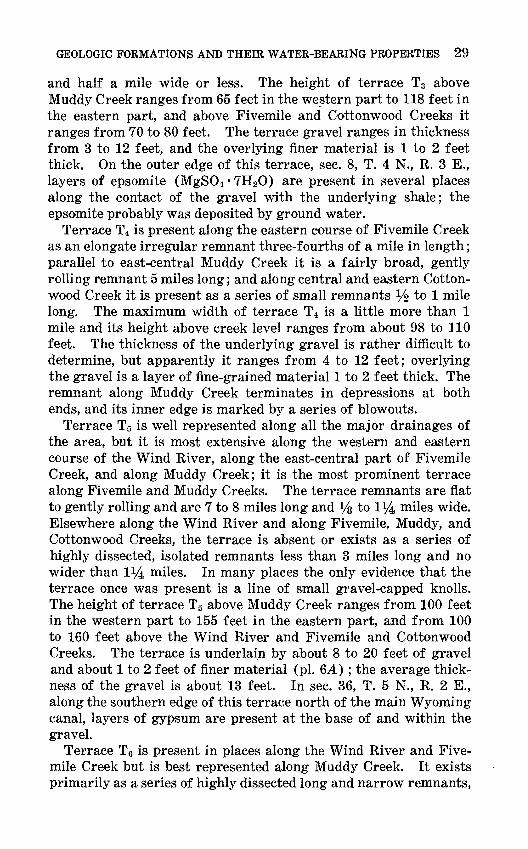
Highly dissected bedrock slopes flank terraces throughout the area. They form the floors of the smaller valleys between terraces but are best developed on the south sides of the broad valleys formed by the main streams of the area. (See pi. 4.) Colluvial- alluvial deposits derived from the weathering of the bedrock ex posed in the higher terraces and buttes mantle much of the bedrock slope. Alluvium occurs as valley fill along the drain&geways through the area. Knobs and hills of bedrock project above the colluvial-alluvial mantle in many places.
GEOLOGIC HISTORY
The details of the physiographic history of the area are imper fectly known; however, it is generally agreed that the following events occurred in the Wind River basin region in the late Mesozoic and the Cenozoic eras.
The ancestral Wind River basin and adjacent mountain struc tures were formed essentially during the Laramide revolution in Late Cretaceous and early Tertiary time. Erosion of the moun tains and highlands resulted in the deposition of much rock debris in the basin. Much of it was deposited in sheets or as channel fill. By middle or late Tertiary time the basin was completely filled with sediments, which covered the Owl Creek Mountains and which either covered or graded into peneplaned surfaces, or pediments, on the adjacent higher Wind River Mountains. In late Tertiary time, owing either to uplift or to climatic change, active aggrada tion in the Wind River basin ceased and active degradation began. Erosion has been the dominant geologic process in the region since late Tertiary time; the poorly consolidated sediments in the basin are still being removed. The removal of Tertiary sediments again exposed the more erosion-resistant mountain ranges that had been buried. The present course of the Wind River was superimposed on the area from its position on the Tertiary sediments. Minor interruptions in the long cycle of erosion are reflected by the pres ent topography of the basin.
PHYSIOGRAPHY 15
GEOMORPHOLOGY
The topography of the area has been formed principally by ero sion. The main factors that determine the rate of erosion are the climate and the lithologic character and attitude of the bedrock. The arid climate of the area is not conducive to chemical weather ing. However, because vegetation is sparse, even the small quan tity of water either in streams, as sheet flood and rill wash, or in direct precipitation is a very effective erosive agent. The attitude and lithologic character of the strata of the Wind River formation favor erosion because the formation is essentially hori zontal and consists of poorly consolidated sandstone, siltstone, and shale. Several thousand feet of sediments have been removed by repeated cycles of erosion. At the start of such a cycle streams flowing from the flanks of the mountains become entrenched; when such streams approach a graded condition or reach a local tempo rary base level, they meander from side to side and both widen and level their valley floors. As the valleys are widened and leveled, the streams deposit gravel. It is the gravel deposited in this part of the cycle that now underlies the surface of each of the terraces. Repetition of the cycle of downcutting and subsequent valley widening resulted in the development of the terraces.
The position of the terraces in relation to the present streams of the area indicates that the ancestral streams constructed the ter races. Each terrace represents a period of relative stability when the stream enlarged its flood plain. The scarps between terraces indicate periods of instability and accelerated erosion during which the stream entrenched itself before again expanding its flood plain. The broad extent of the terraces and their more gentle slope, the large size of the gravel pebbles in the terrace deposits, and the uniform thickness of the deposits indicate that the terrace-forming streams were perennial and were relatively large in comparison to the present streams. Each terrace marks a major change in the regimen of the stream. The possible basic factors that, singly or in combination, may have been responsible for the changes are: regional uplift or tilting, climatic change, changes in the size of the area being drained by the stream, and changes in the factors controlling the local base level.
The climatic changes that would be necessary to produce terrace development would be of the magnitude of those that are associated with the alternation of glacial and interglacial stages or substages.
A change in the size of the drainage area, such as would result from the capture of one stream by another, would increase the flow and erosive power of the capturing stream.
16 GROUND-WATER RESOURCES, RIVERTON AREA, WYOMING
The Wind River is assumed to have been the local base level for all its tributaries during the period of terrace development. Any downstream or upstream drainage changes in the Wind River altered the flow of the river, affected its cutting ability, and caused a change in the base level of the tributary streams. Likewise, any downvalley obstructions, such as the more resistant formations cropping out in the Wind River Canyon, created at that point a temporary base level that affected the upstream part of the river and the tributary streams. Therefore, the tributary streams of the Wind River formed terraces that correspond to those formed by the Wind River. (See pi. 1.)
In general, during the period of terrace formation, Fivemile, Muddy, and Cottonwood Creeks moved progressively to the south. A natural tendency for a stream flowing parallel to the front of a mountain range is to shift its course farther from the main source of water, the mountains. The principal tributaries rise on the mountain front and by building fans of alluvial material they force the major stream away from the mountains. Another factor that may contribute to the migration of the main stream is the "jetting action" of the tributary streams upon entering the main stream at right angles. The inflow of water from the tributaries forces the current of the major stream against the opposite bank and the stream migrates away from the mountain front, which is the source of the larger tributaries. The shorter tributaries on the other side of the main stream seldom flow; hence, they are unable to compete with the larger tributaries from the mountain front. Through the combined influence of these factors Fivemile, Muddy, and Cottonwood Creeks have migrated away from the Owl Creek Mountains.
The precise ages of the terrace surfaces have not been deter mined, but the volcanic material which was derived from the Absaroka Mountains and which is present in the gravel of the uppermost terraces indicates that these and all lower surfaces are younger than the mountains, which were formed in Eocene or early Oligocene time (Tourtelot and Thompson, 1948). Inasmuch as the uppermost terrace (terrace Ti3, or Lost Wells Butte) is considered to be the Black Rock surface of Blackwelder (1915, p. 312-316), and because that surface was correlated by him as pre- Kansan (pre-Buffalo in Wyoming), terrace Ti3 probably is of Aftonian age. This then suggests a post-Aftonian age for all lower or more recent terraces within the area.
Concurrent with the action of major streams, direct precipitation by contributing to ephemeral side streams and by causing rill wash and sheet flood has produced extensive badlands and, by
PHYSIOGRAPHY 17
contributing to escarpment retreat, has been a factor in the forma tion of pediments at the base of the escarpments. Contemporane ous with each stage of terrace development, erosion modified the escarpments of the interstream divides and formed for each terrace which represents a temporary base level a complementary slope on bedrock extending southward from the streams to the divides.
After terrace T2 had been formed, the streams of the area were rejuvenated; the principal streams cut a trench in the bedrock 50 to 75 feet below the terrace, and the intermittent tributaries be came incised in the pediment slopes. A period of alluviation, during which the principal alluvial terrace (terrace TI) along the main streams is believed to have been formed, followed the period of downcutting. Then, owing to the continued changes in climatic conditions, the streams cut their present channels and alluvial fans spread over much of the pediments and, in some places, along the streams.
Three pronounced troughs cross the divide between Muddy and Cottonwood Creeks. (See pi. 1; shown as Tw in sees. 6 and 7, T. 4 N., R. 3 E.; sees. 22 and 27, T. 4 N., R. 4 E.; and in sees. 11, 13, and 14, T. 4 N., R. 4 E.) These are wind-modified channels of former tributaries of Muddy Creek that flowed southward off the flanks of the Owl Creek Mountains. Headward erosion by Cotton- wood Creek has progressively pirated these Muddy Creek tribu taries and left the old channels through the terraces as a series of wind gaps. The geologic map (pi. 1) reveals this progressive pi racy. The easternmost trough probably was a through drainage course at least until terrace T3 was formed, the central trough until terrace T2 was formed, and the westernmost trough until after terrace T2 was formed. The Cottonwood drain has exposed the old channel gravel in the lower part of the easternmost trough. Although gravel is lacking in the upper part of this trough, it may have been removed by stormflows that have been concentrated in this natural drainageway during torrential downpours. The other two troughs are considered to have comparable histories. The po sition of the Cottonwood tributaries in relation to the position of the postulated abandoned valleys also substantiates this conclusion. The study of adjacent areas further supports the above explana tion of the development of the transverse valleys. For example, along the east flank of the Maverick Springs and Little Dome structures, the headwaters of Muddy Creek appear to have cap tured the headwaters of the Fivemile Creek tributary that flows southward in Hurley Draw.
Associated with the piracy of Muddy Creek tributaries by Cot-
18 GROUND-WATER RESOURCES, RIVERTON AREA, WYOMING
tonwood Creek, and offering still further evidence of this piracy, is the progressive increase in gradient of Muddy Creek during the period of terrace formation and the consequent increase in height above the creek of the downstream part of any terrace. Such an increase in gradient would have been necessitated by the loss of water in Muddy Creek due to piracy.
Locally, wind action has been an effective agent of erosion. The wind has scoured out closed depressions in the soft sediments that are exposed in abandoned drainageways and also has modified these by local deposition. Silt and sand from these areas as well as from slopes and level surfaces have been removed by the wind and deposited to form hummocks and dunes in sheltered places or where vegetation is present. The removal of sand and silt from deposits that also contain gravel has left a residual concentration of pebbles, which is known as "desert pavement." The abrasive action of sand-bearing wind on resistant gravel has produced many faceted pebbles (ventifacts) and the present form of the many rounded pedestals, pinnacles, and bowllike openings in easily eroded sandstone.
Precipitation has produced a complex pattern of solution sculp turing on pebbles of impure limestone which mantle the higher terraces of the area.
DRAINAGE SYSTEM
The principal streams of the area flow southeastward parallel to the trend of the structural trough of the Wind River basin. The Wind River heads in the Absaroka Mountains at the extreme north western corner of the basin and is fed by streams flowing off the Wind River and Owl Creek Mountains. It flows southeastward to its confluence with the Popo Agie, where it turns sharply north eastward and thence flows north through the Wind River Canyon, which cuts across the axis of the Owl Creek Mountains, beyond which point it is known as the Bighorn River. The principal trib utaries within the Riverton project are Fivemile Creek, Muddy Creek, and Cottonwood Creek also named Dry Muddy Creek on some maps. Fivemile Creek heads on the Circle Ridge anticline, flows through the central part of the area, and enters the Wind River at a point about 20 miles downstream from the confluence of the Popo Agie and Wind Rivers. Muddy Creek, which drains a larger area than either Cottonwood or Fivemile Creeks, heads in the Owl Creek Mountains and flows through the northern part of the area; it enters the Wind River about 7 miles downstream from the mouth of Fivemile Creek. Cottonwood Creek flows along the
PHYSIOGRAPHY 19
north boundary of the area, is fed by streams that flow southward from the flanks of the Owl Creek Mountains, and empties into the Wind River about 6 miles downstream from the mouth of Muddy Creek.
STREAMFLOW
WIND RIVER
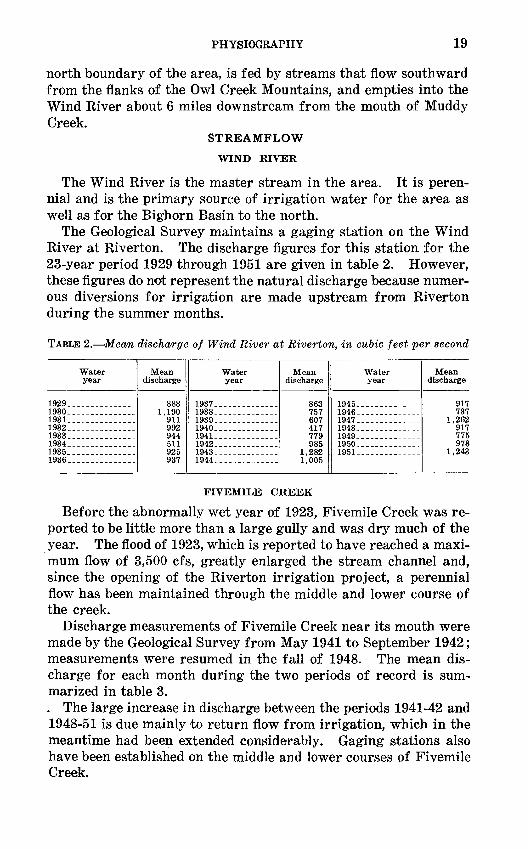
The Wind River is the master stream in the area. It is peren nial and is the primary source of irrigation water for the area as well as for the Bighorn Basin to the north.
The Geological Survey maintains a gaging station on the Wind River at Riverton. The discharge figures for this station for the 23-year period 1929 through 1951 are given in table 2. However, these figures do not represent the natural discharge because numer ous diversions for irrigation are made upstream from Riverton during the summer months.
TABLE 2. Mean discharge of Wind River at Riverton, in cubic feet per second
Water year
1929-_--__.________1930____ _........ .1931 ______________1932 -___--_----.._1933-__-___________1934 ..............1935_1936..... __________
Mean discharge
8881,190
911992944511925937
Water year
1937____________._1938_. ____________1939______________1940. _____________1941_. _._.___.____1942.___________._1943_______. ______1944. _____________
Mean discharge
863757607417779985
1,2821,005
Water year
1945. __._-..__----1946_._-___-_---_-1947___. _--_.-----1948. ______.__----1949_----___-_--_-1950. ________ __ ..1951_.__--____--_-
Mean discharge
917737
1,262917775978
1,243
FIVEMILE CREEK
Before the abnormally wet year of 1923, Fivemile Creek was re ported to be little more than a large gully and was dry much of the year. The flood of 1923, which is reported to have reached a maxi mum flow of 3,500 cfs, greatly enlarged the stream channel and, since the opening of the Riverton irrigation project, a perennial flow has been maintained through the middle and lower course of the creek.
Discharge measurements of Fivemile Creek near its mouth were made by the Geological Survey from May 1941 to September 1942; measurements were resumed in the fall of 1948. The mean dis charge for each month during the two periods of record is sum marized in table 3.. The large increase in discharge between the periods 1941-42 and 1948-51 is due mainly to return flow from irrigation, which in the meantime had been extended considerably. Gaging stations also have been established on the middle and lower courses of Fivemile Creek.
20 GROUND-WATER RESOURCES, RIVERTON AREA, WYOMING
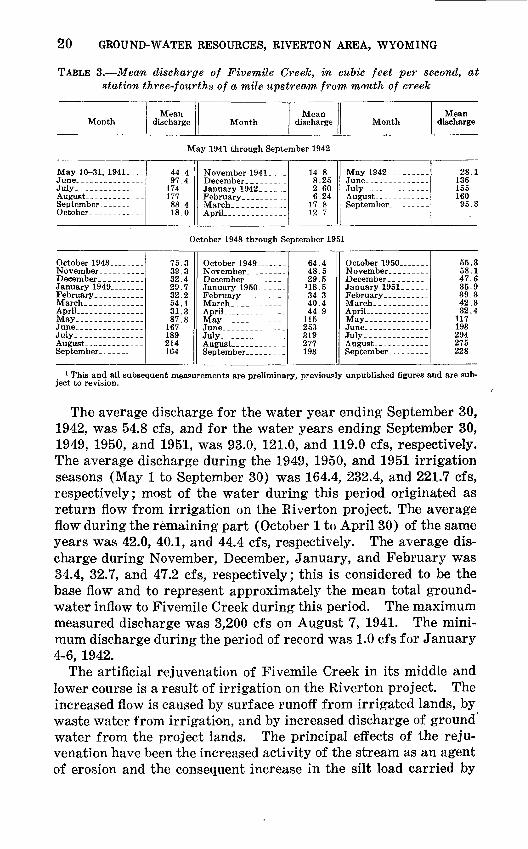
TABLE 3. Mean discharge of Fivemile Creek, in cubic feet per second, at station three-fourths of a mile upstream from mouth of creek
MonthMean
discharge MonthMean
discharge MonthMean
discharge
May 1941 through September 1942
May 10-31, 1941 ....
July, __________
44.497.4
17417788.418.0
14.88.252.606.24
17.812.7
May 1942-._------
July_--.__-----_-_
28.113615516095.3
October 1948 through September 1951
October 1948..____ _
July. .___--..__,___August
75.339.332.429.732.254.131.387.8
167189214164
October 1949. ...
July.__. ...__.-...
64.448.529.5
118.534.340.444.9
115253319277198
July----.---------
55.358.147.635.939.342.332.4
117193294275228
1 This and all subsequent measurements are preliminary, previously unpublished figures and are sub ject to revision.
The average discharge for the water year ending September 30, 1942, was 54.8 cfs, and for the water years ending September 30, 1949, 1950, and 1951, was 93.0, 121.0, and 119.0 cfs, respectively. The average discharge during the 1949, 1950, and 1951 irrigation seasons (May 1 to September 30) was 164.4, 232.4, and 221.7 cfs, respectively; most of the water during this period originated as return flow from irrigation on the Riverton project. The average flow during the remaining part (October 1 to April 30) of the same years was 42.0, 40.1, and 44.4 cfs, respectively. The average dis charge during November, December, January, and February was 34.4, 32.7, and 47.2 cfs, respectively; this is considered to be the base flow and to represent approximately the mean total ground- water inflow to Fivemile Creek during this period. The maximum measured discharge was 3,200 cfs on August 7, 1941. The mini mum discharge during the period of record was 1.0 cfs for January 4-6, 1942.
The artificial rejuvenation of Fivemile Creek in its middle and lower course is a result of irrigation on the Riverton project. The increased flow is caused by surface runoff from irrigated lands, by waste water from irrigation, and by increased discharge of ground water from the project lands. The principal effects of the reju venation have been the increased activity of the stream as an agent of erosion and the consequent increase in the silt load carried by
PHYSIOGRAPHY 21
the creek to the Wind River. (See pi. 5A.) The erosion is de stroying farmland adjacent to the creek, and the heavy load of sediment delivered to the Wind River has created a siltation prob lem at Boysen Reservoir.
The problem of minimizing erosion by Fivemile Creek can best be solved after a careful analysis has been made of the cause and effect relation of the contributing factors, among which is ground water. Although its relative importance has not yet been thor oughly evaluated, observations indicate that ground water, by saturating the materials in the stream banks, accelerates basal sapping and lowers the resistance of creek banks to flood erosion.
MUDDY CREEK
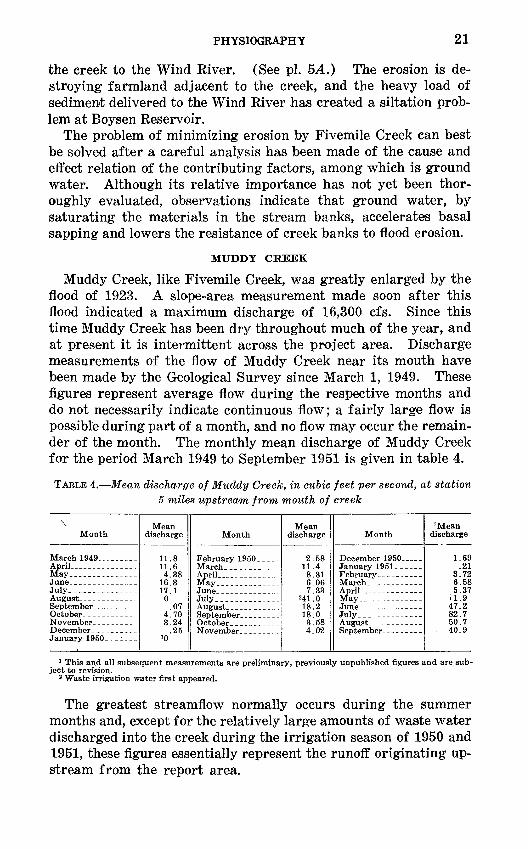
Muddy Creek, like Fivemile Creek, was greatly enlarged by the flood of 1923. A slope-area measurement made soon after this flood indicated a maximum discharge of 16,300 cfs. Since this time Muddy Creek has been dry throughout much of the year, and at present it is intermittent across the project area. Discharge measurements of the flow of Muddy Creek near its mouth have been made by the Geological Survey since March 1, 1949. These figures represent average flow during the respective months and do not necessarily indicate continuous flow; a fairly large flow is possible during part of a month, and no flow may occur the remain der of the month. The monthly mean discharge of Muddy Creek for the period March 1949 to September 1951 is given in table 4.
TABLE 4. Mean discharge of Muddy Creek, in cubic feet per second, at station 5 miles upstream from mouth of creek
\Month
March 1949 _ --.-.April. . _ --.- .. .
June.July____ ...........
Mean discharge
11.811.64.38
16.317.1
0.07
4.703.24
.25'0
Month
July,. ............
Mean discharge
2.5811.48.316.067.33
241.018.218.0
4.02
Month
December 1950. . -
July.. . ...........
'Mean discharge
1.69.21
3.726.585.37
il.947.282.750.7
, 40.9
1 This and all subsequent measurements are preliminary, previously unpublished figures and are sub ject to revision.
2 Waste irrigation water first appeared.
The greatest streamflow normally occurs during the summer months and, except for the relatively large amounts of waste water discharged into the creek during the irrigation season of 1950 and 1951, these figures essentially represent the runoff originating up stream from the report area.
22 GROUND-WATER RESOURCES, RIVERTON AREA, WYOMING
Muddy Creek is now in a state of adjustment to its new normal flow, load, and gradient. The banks appear to be stabilized by a protective vegetative cover, and there is little evidence that normal flow accomplishes much lateral erosion or much downcutting. This condition of adjustment is temporarily interrupted during flood flows, which erode more actively and which carry greater amounts of sediment. The sediment load transported at these times either is deposited lower in the course of the creek, where the lesser gradient favors aggradation, or is emptied into the Wind River; the sediment constitutes a large portion of the total load carried by the creek. Of importance, then, is the increase in flow that will result when additional land is irrigated in the drainage basin of Muddy Creek. The addition of waste irrigation water and ground-water discharge to the present normal flow will reju venate the creek, and with continued irrigation it will become per ennial and will develop erosion problems similar to those along Fivemile Creek. Obviously, erosion-control measures will be most effective the earlier they are undertaken.
COTTONWOOD CREEK
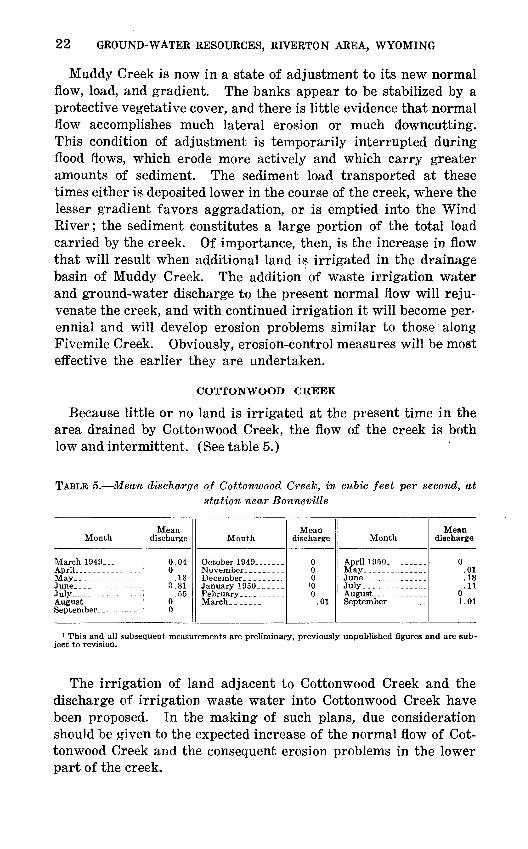
Because little or no land is irrigated at the present time in the area drained by Cottonwood Creek, the flow of the creek is both low and intermittent. (See table 5.)
TABLE 5. Mean discharge of Cottonwood Creek, in cubic feet per second, atstation near Bonneville
Month
March 1949. _--__-__
Mav
July_--------------
Mean discharge
0.040
.183.81
.5500
Month
October 1949 . _ __
Mean discharge
000
'00
.01
Month
April 1950.-_ -----_May
July
Mean discharge
0.01.18.11
01.01
1 This and all subsequent measurements are preliminary, previously unpublished figures and are sub ject to revision.
The irrigation of land adjacent to Cottonwood Creek and the discharge of irrigation waste water into Cottonwood Creek have been proposed. In the making of such plans, due consideration should be given to the expected increase of the normal flow of Cot tonwood Creek and the consequent erosion problems in the lower part of the creek.
GROUND-WATER RESOURCES, RIVERTON AREA, WYOMING 23
GEOLOGIC FORMATIONS AND THEIR WATER-BEARING PROPERTIES
Rocks ranging in age from Late Cretaceous to Recent are exposed in the Riverton project area and adjacent lands included in this investigation. The oldest rocks are exposed only at the western end of the area in the vicinity of the Pilot Butte and Steamboat Butte oil fields. The Cody shale is exposed on the crest of both the Pilot Butte and Steamboat Butte anticlines and the overlying Mesaverde and Meeteetse formations form hogbacks on the flanks of these oil structures. Younger rocks underlie the remainder of the area; they consist of the Wind River formation of Tertiary age and of alluvial, colluvial, and eolian deposits of Quaternary age.
CRETACEOUS SYSTEM
UPPER CRETACEOUS SERIESCODY SHALE AND MESAVERDE FORMATION, UNDIFFERENTIATED
Areal extent. In the area of investigation, rocks of the Cody shale and Mesaverde formation, undifferentiated, are exposed prin cipally in a narrow band about three-fourths of a mile wide along the northeast flank of the Pilot Butte anticline. They are exposed also along the edge of the escarpment between terrace T5 and the alluvial plain of the Wind River where it crosses the Pilot Butte anticline.
Description. The Cody shale and Mesaverde formation consist of soft gray to black shale and fine-grained light-colored massive to thin-bedded sandstone containing numerous coal beds (Love, 1948, p. Ill). The thin beds of rusty sandstone, coaly gray shale, and coal exposed along the Pilot Butte anticline probably are only the upper part of the sequence. The dip of the beds away from the crest of the structure is about 15° to 40° (Matter, 1948) and the more resistant beds form hogbacks. In places the beds are complexly faulted.
Occurrence of ground water. No wells are known to penetrate the Mesaverde formation in the investigated area; consequently, the quality and quantity of water in this formation are unknown.
Two wells penetrate rocks of the sequence, presumably lenticular sandstone in the upper part of the Cody shale. These yield mod erate quantities of water, but the quality is poor.
TERTIARY SYSTEMEOCENE SERIES
WIND RIVER FORMATION
Areal extent. The Wind River formation underlies all the in vestigated area except the western part where older rocks are exposed.
24 GROUND-WATER RESOURCES, RIVERTON AREA, WYOMING
Description. The Wind River formation was first named and described by Hayden (1862, p. 125-127) from exposures in the Wind River valley. He applied this name to sediments that lie with slight discordance on the lignite beds of the Fort Union forma tion of Paleocene age and that are overlain by deposits of the White River formation of Oligocene age. The contact of the Wind River formation with the Fort Union or White River formations was not observed by the writers within the investigated area. The Fort Union has been described, however, in the Shotgun Butte area west and north of the investigated area (Keefer and Troyer, 1956) and several isolated remnants are exposed between Conant and Canyon Creeks in the east-central part of Fremont County (about25 miles east of Riverton). The White River is known to be pres ent along the southern margin of the Absaroka Range and in south eastern Fremont County on Beaver Rim of the Sweetwater uplift.
The Wind River formation consists of a complex series of inter- bedded lenticular sandstone, siltstone, shale, claystone, conglomer ate tuff, and fresh-water limestone. (See pi. 5£.) Tourtelot and Thompson (1948) have identified two facies in this formation: one brightly colored, the other drably colored. The brightly col ored facies consists of red, violet, blue, yellow, and white hard fine-grained sandstone and siltstone; fresh-water limestone; and a basal conglomerate containing sporadic roundstones of foreign quartzite and volcanic rock. The drably colored facies consists of gray and greenish-gray claystone and siltstone and channel depos its of yellow to brown coarse-grained sandstone. Locally, the drably colored facies contains dull variegated beds and carbona ceous sequences. The division of the formation into two facies is primarily on the basis of color and lithologic character; it has little time-stratigraphic significance because these facies interfinger and their lithologic types and colors intermingle. Fossil vertebrates have been used by Tourtelot and Thompson to date the drably col ored facies as chiefly of "Wasatchian" (early Eocene) age, and fossil vertebrates and plants have been used to date the brightly colored facies as chiefly of "Bridgerian" (middle Eocene) age, or as transitional between "Wasatchian" and "Bridgerian." How ever, the presence of "Bridgerian" fossils and plants in the upper part of the drably colored facies and the presence of "Wasatchian" fossils in the lower part of the brightly colored facies indicates that a "Wasatchian" and "Bridgerian" age should be ascribed to both facies. In this area the brightly colored facies underlies the north margin of the Wind River basin and interfingers with the drably colored facies toward the center of the basin. Toward the Owl Creek Mountains, which are north of the area under investigation,
GEOLOGIC FORMATIONS AND THEIR WATER-BEARING PROPERTIES 25
both f acies are overlain by green and brown andesite tuff and fresh water limestone which grade laterally along the mountain front into nontuffaceous red siltstone and conglomerate.
Tourtelot and Thompson (1948) mapped the drably colored fa des of the Wind River formation in the northern part of the report area; this f acies probstbly underlies the entire area described in this report. Except locally, the beds are essentially horizontal or dip gently toward the center of the basin; on the west flank of the Pilot Butte structure the dip of the Wind River formation is about 7° W., and in sec. 5, T. 4 N., R. 6 E., the apparent dip is as much as 20° toward the Owl Creek Mountains.
The outcrops consist of sandstone, siltstone, shale, claystone, and sediments gradational between these. Shale and thin-bedded to massive siltstone and sandstone are the commonest rock types. The sandstone beds are predominantly yellow and brown, but some are gray and grayish green. They generally are fine- to medium- grained, micaceous, poorly sorted, and loosely cemented. They were deposited generally as lenticular sheets or channel deposits and are commonly crossbedded. The shale, siltstone, and claystone are generally gray, greenish gray, or grayish green; some dull-red to purple shale is exposed in the lower part of the outcrops. Shale and claystone generally are fairly soft; siltstone is typically blocky and poorly cemented. Most of the sediments are poorly consoli dated, but firmly cemented lenses of rather coarse grained sand stone or conglomerate or concretions of sandstone are present in some places, particularly in the channel deposits. The cemented lenses are irregular, elongate masses, some of which are more than 3 feet thick; they resist erosion and form ledges or ridges. The concretions are very hard, somewhat irregular but commonly smoothly rounded, and generally more than 2 feet in diameter. They litter the landscape in places where softer surrounding ma terials.have been removed by erosion. Limestone nodules also are common in the sediments. Beds of carbonaceous shale, some of which contain plant remains and which are associated with beds of bentonitic clay and some tuff, occur in places throughout the area but are exposed mainly along east-central and eastern Muddy Creek and in sec. 17, T. 4 N., R. 6 E., along buttes that border the Wind River. Petrified wood is commonly associated with this carbonaceous sequence. Numerous joints and other fractures, many of which are filled with calcareous or ferruginous material, traverse the rocks. Two large faults in the area were mapped by Tourtelot and Thompson (1948). (See pi. 1.) Small faults are common.
The thickness of the drably colored f acies in the area described
26 GROUND-WATER RESOURCES, RIVERTON AREA, WYOMING
in this report is not definitely known. A thickness of 1,500 to 2,500 feet of the Wind River formation reportedly was penetrated by several old oil tests within the area, but the information pos sibly is unreliable. The formation is known to be less than 100 feet thick in the Steamboat Butte oil field and more than 2,000 feet thick in several old oil tests northeast of Shoshone, which is con sidered to be in the deepest part of the Wind River basin. The maximum exposed thickness of the formation in the Boysen area to the north is reported to be 913 feet (Tourtelot and Thompson, 1948). Southeast of Riverton, at the Riverton dome, oil wells are reported to have penetrated about 1,500 feet of the Wind River formation. Therefore, the thickness of the formation within the report area probably is 1,000 to 2,000 feet.
Occurrence of ground water. Most wells in the area obtain water from the lenticular beds of sandstone in the Wind River for mation. The water in the sandstone beds generally is under artesian pressure and rises in wells when the confining beds are penetrated; in some parts of the area water flows at the land sur face from wells on low ground.
Infiltrating irrigation water is the source of most of the re charge to the artesian aquifers, and the water level in shallow wells rises during the irrigation season. Because the irrigation water leaches minerals from the soil and carries them down to the zone of saturation, the quality of water in the shallow aquifers gen erally is unsatisfactory for domestic use except where the shallow aquifers are recharged by infiltration from streams or canals.
Surface water probably is the principal source of recharge to the deeper artesian aquifers also; however, owing to their distance from the outcrop, and their low transmissibility, and also to the fairly constant discharge from them, the water level in wells tap ping these aquifers fluctuates only slightly throughout the year, and the quality of the water is relatively uniform and generally satisfactory for domestic use.
Some water is under water-table conditions in the upper, badly weathered part of the Wind River formation. This occurrence is described in the discussion of surficial deposits mantling the Wind River formation.
Although wells penetrating the Wind River formation do not yield large quantities of water, this formation is the best present and potential source of water for domestic use in this area. At the present time, the largest quantity of water produced from any well drilled into the Wind River formation is a little more than 200 gpm; a larger quantity of water probably can be obtained only by drilling wells into deeper aquifers in the formation. Water from
GEOLOGICAL SURVEY WATER-SUPPLY PAPER 1375 PLATE 4
View northward showing the bedrock slope between Indian Ridge and Muddy Creek.
GEOLOGICAL SURVEY WATER-SUPPLY PAPER 1375 PLATE 5
A. View eastward showing banks eroded by basal sapping along the lower part of Fivemile Creek.
B. Interbedded shale and sandstone beds of the Wind River formation.
GEOLOGICAL SURVEY WATER-SUPPLY PAPER 1375 PLATE 6
i- la*
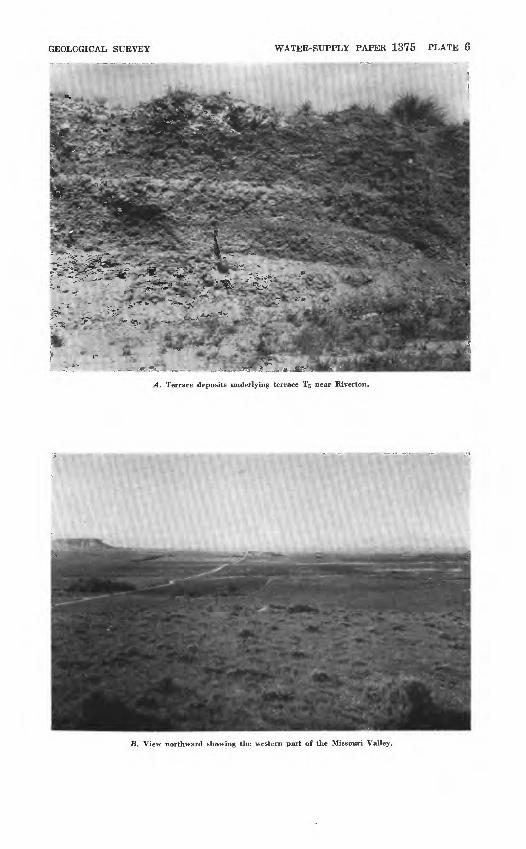
Terrace deposits underlying terrace T5 near Riverton.
B. View northward showing the western part of the Missouri Valley.

GEOLOGIC FORMATIONS AND THEIR WATER-BEARING PROPERTIES 27
such deeper sources probably would be of satisfactory quality.Influence on drainage. Waterlogging in this area generally is
attributed to direct recharge of the surficial deposits by seepage from irrigation. However, it is possible that under certain con ditions shallow artesian water may be contributing to waterlog ging. Under favorable topographic and hydrologic conditions, leakage through confining beds to the overlying unconfined aquifer may occur, and waterlogging may be accelerated by the addition of this water. The possibility of such a contribution to waterlogging should be fully investigated.
QUATERNARY SYSTEM
PLEISTOCENE AND RECENT SERIES, UNDIFnERENTIATED
TERRACE DEPOSITS
In the area described in this report, the 13 distinct terraces along the principal lines of drainage, as well as several interstream terrace remnants, are underlain by deposits of roughly angular to subrounded gravel, presumably of Quaternary age and derived from sources to the west and north. (See table 6.) The gravel derived from the Owl Creek Mountains to the north contains angu lar pieces of dolomite, limestone, and igneous rocks, whereas the gravel derived from the mountains near the head of the Wind River consists mainly of rounded fragments of pre-Cambrian ig neous and metamorphic rocks and Tertiary volcanic materials.
TABLE 6. Summary of terraces
Terrace
Ti
TJ
T,
T4
T,
T.
TJ
Ts
T »
T 10TuTuTu
Height above drainage
(feet)
15-22
28-65
65-118
98-110
100-160
140-180
220-240
300-380
420-480
500-550580-620
680800-825
Location of principal remnants
Near Riverton and in T. 2 N.,R. 6E
Near Riverton, in Tps. 2 and 3N., R. 6 E., and along Muddyand central CottonwoodCreeks.
Along eastern Muddy and west ern Cottonwood Creeks.
Along eastern and east-centralFivemile, Muddy, and Cottonwood Creeks.
Along Wind River, east-centralFivemile Creek, and MuddyCreek.
Along western and southeastern Wind River and central Muddy Creek.
Along east-central FivemileCreek.
Along western Wind River andwestern and east-central Five-mile Creek.
Tps. 1 and 2 N., R. 4 E., and T.2 N., R. 5 E.
Tps. 1 and 2 N., Rs. 2 and 4 E...Tps. 1 and 2 N., Rs. 3 and 4 E...T. 1 N., R. 3 E. ------------T. 2 N., Rs. 3 and 4 E.... ...
Thickness of gravel
(feet)
7-20
2-20
3-12
4-12
8-20
8-25
4-5
7-22
6-18
7-184-18? 184-10
Remarks
In Riverton area, terrace ismantled by 1 to 25 feet ofalluvial-fan deposits. In Tps.2 and 3 N., R. 6 E., terrace ismantled by 4 to 70 feet ofalluvial-fan deposits.
Epsomite occurs in places in basal part of terrace gravel.
Gypsum occurs in terrace deposits.
Highest irrigated terrace.
28 GROUND-WATER RESOURCES, RIVERTON AREA, WYOMING
The principal terraces have been correlated only tentatively; their relationship and relative position are shown on plate 1.
Areal extent and description of terraces. Terrace T! is present only along the big bends of the Wind River at Riverton and in T. 2 N., R. 6 E. It is a relatively flat surface about 7 miles long and y± to 1^4 miles wide in the Riverton area and about 2Vfc miles long and less than half a mile wide in T. 2 N., R. 6 E. Terrace T\ ranges in height above the Wind River from 15 feet at its upstream end to 22 feet at its downstream end and is underlain by 7 to 20 feet of gravel capped by 1 to 2 feet of finer material. The average thickness of gravel is about 12 feet in the Riverton area, but it is more nearly 20 feet in T. 2 N., R. 6 E. This terrace is believed to correlate with the highest of three low alluvial surfaces, which are mapped as alluvium along Fivemile, Muddy, and Cottonwood Creeks. (See pi. 1.)
Terrace T2 is one of the most extensive terraces in the area. It is present in places along the entire course of the Wind River, along Fivemile Creek in its western and eastern parts, and along Muddy and Cottonwood Creeks in their central and eastern parts. Ter race T2 generally is highly dissected and consists of a series of iso lated remnants that are less than 1 mile long and one-fourth of a mile wide. However, along the big bends of the Wind River at Riverton and in T. 2 N., R. 6 E., and along Muddy and Central Cottonwood Creeks this terrace is 3 to 14 miles long and about % to 2 miles wide. Its height ranges from 40 to 65 feet along the Wind River, Muddy, and Cottonwood Creeks but from 28 to 33 feet above Fivemile Creek where available evidence indicates greater alluvia- tion of the creek channel after terrace T2 was formed. The terrace gravel, which ranges in thickness from 2 to 20 feet, generally is about 12 feet thick in the Riverton area and about 20 feet thick in T. 2 N., R. 6 E. The terrace surface is mantled locally by alluvial- fan deposits, which range in thickness from 1 to 25 feet in the Riverton area and from 4 to 70 feet in Tps. 2 and 3 N., R. 6 E. In T. 3 N., R. 6 E., all surficial evidence of the terrace is obscured by the alluvial-fan deposits.
The most extensive remants of terrace T3 are along the eastern course of Muddy Creek and along the western course of Cotton- wood Creek where they consist of-a flat to gently rolling surface. Along Muddy Creek they are about 8 miles long, and along Cotton- wood Creek they are about 2 miles long. These remnants are 1/2 to 2 miles wide. Terrace T3 is less extensive along central Five- mile Creek, western and central Muddy Creek, and central and eastern Cottonwood Creek. In these places it consists of a series of highly dissected remnants that generally are 1/2 to 3 miles long
GEOLOGIC FORMATIONS AND THEIR WATER-BEARING PROPERTIES 29
and half a mile wide or less. The height of terrace T3 above Muddy Creek ranges from 65 feet in the western part to 118 feet in the eastern part, and above Fivemile and Cottonwood Creeks it ranges from 70 to 80 feet. The terrace gravel ranges in thickness from 3 to 12 feet, and the overlying finer material is 1 to 2 feet thick. On the outer edge of this terrace, sec. 8, T. 4 N., R. 3 E., layers of epsomite (MgS04 7H20) are present in several places along the contact of the gravel with the underlying shale; the epsomite probably was deposited by ground water.
Terrace T4 is present along the eastern course of Fivemile Creek as an elongate irregular remnant three-fourths of a mile in length; parallel to east-central Muddy Creek it is a fairly broad, gently rolling remnant 5 miles long; and along central and eastern Cotton- wood Creek it is present as a series of small remnants */2 to 1 mile long. The maximum width of terrace T4 is a little more than 1 mile and its height above creek level ranges from about 98 to 110 feet. The thickness of the underlying gravel is rather difficult to determine, but apparently it ranges from 4 to 12 feet; overlying the gravel is a layer of fine-grained material 1 to 2 feet thick. The remnant along Muddy Creek terminates in depressions at both ends, and its inner edge is marked by a series of blowouts.
Terrace T5 is well represented along all the major drainages of the area, but it is most extensive along the western and eastern course of the Wind River, along the east-central part of Fivemile Creek, and along Muddy Creek; it is the most prominent terrace along Fivemile and Muddy Creeks. The terrace remnants are flat to gently rolling and are 7 to 8 miles long and 1/3 to 1*4 miles wide. Elsewhere along the Wind River and along Fivemile, Muddy, and Cottonwood Creeks, the terrace is absent or exists as a series of highly dissected, isolated remnants less than 3 miles long and no wider than 1*4 miles. In many places the only evidence that the terrace once was present is a line of small gravel-capped knolls. The height of terrace T5 above Muddy Creek ranges from 100 feet in the western part to 155 feet in the eastern part, and from 100 to 160 feet above the Wind River and Fivemile and Cottonwood Creeks. The terrace is underlain by about 8 to 20 feet of gravel and about 1 to 2 feet of finer material (pi. 6A) ; the average thick ness of the gravel is about 13 feet. In sec. 36, T. 5 N., R. 2 E., along the southern edge of this terrace north of the main Wyoming canal, layers of gypsum are present at the base of and within the gravel.
Terrace T6 is present in places along the Wind River and Five- mile Creek but is best represented along Muddy Creek. It exists primarily as a series of highly dissected long and narrow remnants,
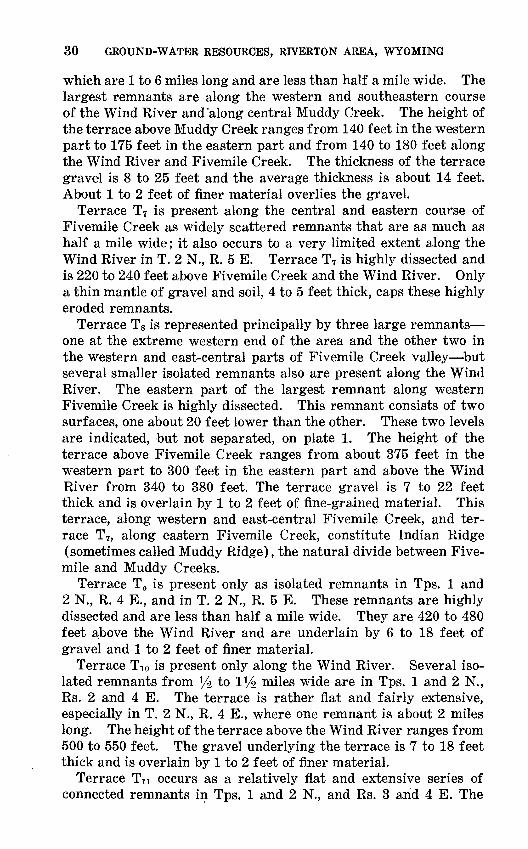
30 GROUND-WATER RESOURCES, RIVERTON AREA, WYOMING
which are 1 to 6 miles long and are less than half a mile wide. The largest remnants are along the western and southeastern course of the Wind River and "along central Muddy Creek. The height of the terrace above Muddy Creek ranges from 140 feet in the western part to 175 feet in the eastern part and from 140 to 180 feet along the Wind River and Fivemile Creek. The thickness of the terrace gravel is 8 to 25 feet and the average thickness is about 14 feet. About 1 to 2 feet of finer material overlies the gravel.
Terrace T7 is present along the central and eastern course of Fivemile Creek as widely scattered remnants that are as much as half a mile wide; it also occurs to a very limited extent along the Wind River in T. 2 N., R. 5 E. Terrace T7 is highly dissected and is 220 to 240 feet above Fivemile Creek and the Wind River. Only a thin mantle of gravel and soil, 4 to 5 feet thick, caps these highly eroded remnants.
Terrace T8 is represented principally by three large remnants one at the extreme western end of the area and the other two in the western and east-central parts of Fivemile Creek valley but several smaller isolated remnants also are present along the Wind River. The eastern part of the largest remnant along western Fivemile Creek is highly dissected. This remnant consists of two surfaces, one about 20 feet lower than the other. These two levels are indicated, but not separated, on plate 1. The height of the terrace above Fivemile Creek ranges from about 375 feet in the western part to 300 feet in the eastern part and above the Wind River from 340 to 380 feet. The terrace gravel is 7 to 22 feet thick and is overlain by 1 to 2 feet of fine-grained material. This terrace, along western and east-central Fivemile Creek, and ter race T7, along eastern Fivemile Creek, constitute Indian Ridge (sometimes called Muddy Ridge), the natural divide between Five- mile and Muddy Creeks.
Terrace T9 is present only as isolated remnants in Tps. 1 and 2 N., R. 4 E., and in T. 2 N., R. 5 E. These remnants are highly dissected and are less than half a mile wide. They are 420 to 480 feet above the Wind River and are underlain by 6 to 18 feet of gravel and 1 to 2 feet of finer material.
Terrace TIO is present only along the Wind River. Several iso lated remnants from 1/2 to l l/2 miles wide are in Tps. 1 and 2 N., Rs. 2 and 4 E. The terrace is rather flat and fairly extensive, especially in T. 2 N., R. 4 E., where one remnant is about 2 miles long. The height of the terrace above the Wind River ranges from 500 to 550 feet. The gravel underlying the terrace is 7 to 18 feet thick and is overlain by 1 to 2 feet of finer material.
Terrace Tn occurs as a relatively flat and extensive series of connected remnants in Tps. 1 and 2 N., and Rs. 3 arid 4 E. The
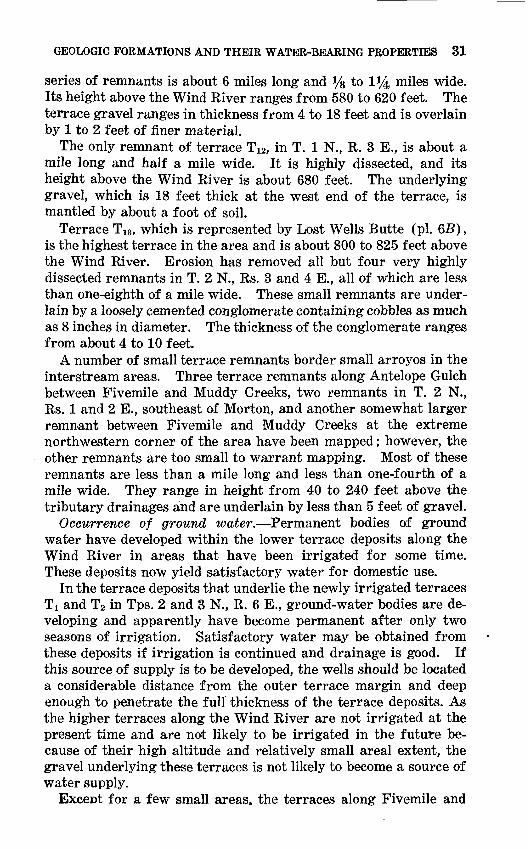
GEOLOGIC FORMATIONS AND THEIR WATER-BEARING PROPERTIES 31
series of remnants is about 6 miles long and i/g to 1^4 miles wide. Its height above the Wind River ranges from 580 to 620 feet. The terrace gravel ranges in thickness from 4 to 18 feet and is overlain by 1 to 2 feet of finer material.
The only remnant of terrace Tj2, in T. 1 N., R. 3 E., is about a mile long and half a mile wide. It is highly dissected, and its height above the Wind River is about 680 feet. The underlying gravel, which is 18 feet thick at the west end of the terrace, is mantled by about a foot of soil.
Terrace Ti3, which is represented by Lost Wells Butte (pi. 65), is the highest terrace in the area and is about 800 to 825 feet above the Wind River. Erosion has removed all but four very highly dissected remnants in T. 2 N., Rs. 3 and 4 E., all of which are less than one-eighth of a mile wide. These small remnants are under lain by a loosely cemented conglomerate containing cobbles as much as 8 inches in diameter. The thickness of the conglomerate ranges from about 4 to 10 feet.
A number of small terrace remnants border small arroyos in the interstream areas. Three terrace remnants along Antelope Gulch between Fivemile and Muddy Creeks, two remnants in T. 2 N., Rs. 1 and 2 E., southeast of Morton, and another somewhat larger remnant between Fivemile and Muddy Creeks at the extreme northwestern corner of the area have been mapped; however, the other remnants are too small to warrant mapping. Most of these remnants are less than a mile long and less than one-fourth of a mile wide. They range in height from 40 to 240 feet above the tributary drainages and are underlain by less than 5 feet of gravel.
Occurrence of ground water. Permanent bodies of ground water have developed within the lower terrace deposits along the Wind River in areas that have been irrigated for some time. These deposits now yield satisfactory water for domestic use.
In the terrace deposits that underlie the newly irrigated terraces T! and T2 in Tps. 2 and 3 N., R. 6 E., ground-water bodies are de veloping and apparently have become permanent after only two seasons of irrigation. Satisfactory water may be obtained from these deposits if irrigation is continued and drainage is good. If this source of supply is to be developed, the wells should be located a considerable distance from the outer terrace margin and deep enough to penetrate the full thickness of the terrace deposits. As the higher terraces along the Wind River are not irrigated at the present time and are not likely to be irrigated in the future be cause of their high altitude and relatively small areal extent, the gravel underlying these terraces is not likely to become a source of water supply.
ExceDt for a few small areas, the terraces along Fivemile and
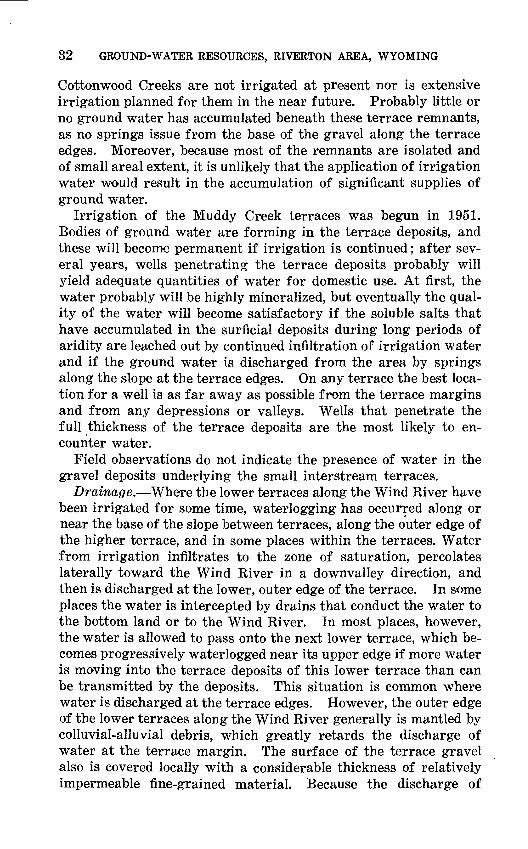
32 GROUND-WATER RESOURCES, RIVERTON AREA, WYOMING
Cottonwood Creeks are not irrigated at present nor is extensive irrigation planned for them in the near future. Probably little or no ground water has accumulated beneath these terrace remnants, as no springs issue from the base of the gravel along the terrace edges. Moreover, because most of the remnants are isolated and of small areal extent, it is unlikely that the application of irrigation water would result in the accumulation of significant supplies of ground water.
Irrigation of the Muddy Creek terraces was begun in 1951. Bodies of ground water are forming in the terrace deposits, and these will become permanent if irrigation is continued; after sev eral years, wells penetrating the terrace deposits probably will yield adequate quantities of water for domestic use. At first, the water probably will be highly mineralized, but eventually the qual ity of the water will become satisfactory if the soluble salts that have accumulated in the surficial deposits during long periods of aridity are leached out by continued infiltration of irrigation water and if the ground water is discharged from the area by springs along the slope at the terrace edges. On any terrace the best loca tion for a well is as far away as possible from the terrace margins and from any depressions or valleys. Wells that penetrate the full thickness of the terrace deposits are the most likely to en counter water.
Field observations do not indicate the presence of water in the gravel deposits underlying the small interstream terraces.
Drainage. Where the lower terraces along the Wind River have been irrigated for some time, waterlogging has occurred along or near the base of the slope between terraces, along the outer edge of the higher terrace, and in some places within the terraces. Water from irrigation infiltrates to the zone of saturation, percolates laterally toward the Wind River in a downvalley direction, and then is discharged at the lower, outer edge of the terrace. In some places the water is intercepted by drains that conduct the water to the bottom land or to the Wind River. In most places, however, the water is allowed to pass onto the next lower terrace, which be comes progressively waterlogged near its upper edge if more water is moving into the terrace deposits of this lower terrace than can be transmitted by the deposits. This situation is common where water is discharged at the terrace edges. However, the outer edge of the lower terraces along the Wind River generally is mantled by colluvial-alluvial debris, which greatly retards the discharge of water at the terrace margin. The surface of the terrace gravel also is covered locally with a considerable thickness of relatively impermeable fine-grained material. Because the discharge of
GEOLOGIC FORMATIONS AND THEIR WATER-BEARING PROPERTIES 33
ground water from the terrace gravel is retarded, the water table rises and the capillary fringe above the water table extends to the land surface.
Where waterlogging occurs, evaporation of the ground water re sults in the deposition of salts in the soil, which in time may destroy the soil structure and decrease its permeability. Continued re charge in excess of the capacity of the terrace deposits to discharge the ground water creates a condition of almost permanent water logging. This has already occurred in parts of terrace T2 in the Riverton area, which has been irrigated for some time. The same condition also probably will develop after continued irrigation of the newly irrigated parts of terrace T 2 in Tps. 2 and 3 N., R 6 E. (Hidden Valley). In both areas the alluvial-colluvial mantle of terrace T2 is thick; at its northern extremity in T. 3 N., R. 6 E., the terrace is wholly obscured by the mantling deposits.
The most effective method of alleviating the poor drainage of terrace T2 would be the construction of interception drains at the outer edge of the terrace; the exposure in the drains of as much of the total thickness of gravel as possible would effect the maximum discharge of water from the gravel. Another effective method would be the construction within the terrace deposits of intercep tion drains perpendicular to the direction of ground-water flow and penetrating the full thickness of the gravel section. If de tailed study indicated that the water in the gravel was under hy drostatic pressure, similarly located shallow drains would serve the same purpose if within them a series of relief wells penetrating the full thickness of gravel were installed. The necessary spacing of the wells would have to be determined by means of aquifer tests in each area to be drained.
The lowering of pressure or, where water-table conditions exist, dewatering of the gravel by gravity drainage would effect drainage of the overlying soil. Although the soil is fine grained and would yield water very slowly, the large size of the contributing area and the increased hydraulic gradient would result in a lowering of the water table to a depth that would relieve the waterlogged condition of the soil. Chemical treatment of the soil to improve the struc ture and to increase the permeability then would be effective.
Except in areas where the soil has been dispersed by sodium salts and consequently should not be irrigated, the high permeabil ity of the surface materials mantling the Muddy Creek terraces necessitates the application of large amounts of irrigation water. Although the ynderlying terrace gravel seems to afford good sub surface drainage now after only a short period of irrigation, under certain conditions a high water table may develop in some parts of
34 GROUND-WATER RESOURCES, RIVERTON AREA, WYOMING
the terraces, especially along and near the base of the slopes be tween terraces where bedrock is at or near the surface and also where sodium-dispersed soils may create a local perched water table. Unless intercepting drains prevent the ground water of a higher terrace from entering the next lower terrace, progressive waterlogging of the lower terrace near its upper edge may occur. This will be especially true if the water moving into the lower ter race cannot be carried away through these deposits as rapidly as it is discharged from the higher terrace. The problem of soil disper sion warrants thorough consideration, too, because it may be im possible or impractical to improve this condition.
Waterlogging may occur also in the colluvial-alluvial materials, which are less permeable than the terrace deposits and which com pletely mantle the slope between terraces in many places. If the flow of ground water from a higher to a lower terrace is retarded by colluvial-alluvial materials, the water table will rise to the surface near the contact of the colluvial-alluvial material.
As irrigation continues, the three channels crossing the divide between Muddy and Cottonwood Creeks will serve as natural ground-water and surface-water drains and may contain flowing water during part, if not all, of the year. Until these drains ad just to the new conditions of flow, erosion is likely to be a problem and measures to prevent gullying may be needed.
In the areas to be irrigated, if observation wells penetrating the entire thickness of the terrace deposits were installed at carefully selected sites, measurements of the water level in these wells would indicate at an early date any tendency toward high-water-table conditions. These observation wells should be installed along cross-valley profiles and along the outer and inner margins of each terrace; on wide terraces, observation wells should be installed also in the central areas. At least one line of wells should transect the eastern, central, and western parts of the terrace system; the line should cross where the terrace is widest.
Most of the excess irrigation water that is applied to terraces T3 to T6 probably could be intercepted by two drains. One, Cotton- wood drain, already has been constructed through the series of blowout depressions; the other should be constructed along the outer margin of terrace T3 and, throughout its length, should cut through the terrace deposits into the underlying bedrock. The feasibility of this second drain would depend on the location and character of the bedrock surface, which could be determined by test drilling. The large depression in the southeast part of T. 4 N., R. 5 E., which now is an outlet for Cottonwood drain, could also serve as an outlet for the proposed drain.
GEOLOGIC FORMATIONS AND THEIR WATER-BEARING PROPERTIES 35
The terraces along Fivemile and Cottonwood Creeks are similar to those along Muddy Creek. However, because the individual terraces likely to be irrigated are isolated and exposed, drainage problems are not imminent in these two areas.
Owing to their very limited areal extent, neither the small inter- stream terraces nor the other small terrace remnants are likely to be irrigated and, hence, are unlikely to present drainage problems.
COLLUVIAL-ALLUVIAL DEPOSITS, UNDIFFERENTIATED
Mixed colluvial-alluvial deposits mantle the Wind River forma tion throughout most of the area. As it is impossible to delineate these deposits without very detailed study, they do not appear on plate 1. The areal extent and character of these deposits, however, are described in the following paragraphs.
Areal extent. Deposits of colluvium and alluvium mantle many of the scarps between .terraces and most of the broad bedrock slopes, or pediments, that flank the terraces and buttes throughout the area.
Description. Both colluvium and alluvium consist of material derived from the weathering of rocks. Colluvial material, typi cally formed in an arid climate, moves principally by gravity from its place of origin to its place of deposition and, in the Riverton area, it mantles the terrace scarps or slopes at the base of terraces or buttes in the form of diversified rock debris. Typically un- sorted, the colluvium contains particles that range in size from silt to boulders. The alluvial part consists of sand, silt, and clay, which mantle terrace scarps and the bedrock slopes at the base of terraces and buttes, and which have been transported principally by running water but for only short distances. The alluvium occurs also as fans that spread out over the slopes and coalesce in places to form flat surfaces contiguous with alluvial deposits underlying the bottom land. These alluvial deposits are fairly well sorted and grade from coarse to fine particles with greater distance from the parent source.
In most places where they are present the colluvial-alluvial de posits generally are 5 to 10 feet thick. However, locally greater sedimentation has occurred either because the material was depos ited in a small basin or the adjacent contributing area was large or because of the alluviation of buried channels of older drainages that passed through the locality. In the central part of Paradise Valley, T. 2 N., R. 4 E., and the northeastern part of the North Pavillion area, T. 4 N., R. 2 E., for instance, thicknesses of more than 20 feet of colluvial-alluvial deposits have been reported. Fan deposits up to 70 feet in thickness have already been described in
36 GROUND-WATER RESOURCES, RIVERTON AREA, WYOMING
the discussion of terrace T2 (see p. 28).Formation of the colluvial-alluvial deposits involved relatively
little action by running water; consequently, the deposits in many places are not stable when saturated. As a result, when irrigation water is first applied to the relatively thick, fine-grained deposits, compaction and settlement occur in proportion to the total thick ness of the deposits. Since irrigation water was first applied in the North Pavillion area settlement in sec. 36, T. 4 N., R. 2 E., has reached a total of more than 5 feet. This settlement is the greatest that has occurred in the Riverton area and probably is due to the relatively great thicknesses of colluvial-alluvial deposits in the buried drainage channels underlying that locality.
Occurrence of ground water. The colluvial-alluvial deposits are relatively impermeable and lack uniformity in thickness and lateral extent. However, appreciable quantities of water accumulate in those parts of the area that have been irrigated for several years. The yield of wells tapping these deposits is inadequate for domestic use, and unless the colluvial-alluvial deposits are recharged directly by canal seepage, the water is not satisfactory for domestic use nor is it likely to improve significantly.
Drainage. The low average permeability of the colluvial- alluvial deposits and of the underlying bedrock make it certain that drainage problems will arise. The problems will be spotty because of the variation in the thickness and lateral extent of the deposits and of their heterogeneity. In some areas little or no colluvial- alluvial material overlies the bedrock, whereas in other areas a considerable thickness is present. The change in thickness gen erally is progressive, but in some places it is abrupt as, for exam ple, in the vicinity of older drainage courses that have been alluviated.
Inasmuch as these colluvial-alluvial deposits include material transported both by soil creep and by running water, they are characterized by a wide variation in the sorting and size of par ticles. The lack of homogeneity causes differences in the permea bility of the deposits. Although the permeability of transported materials generally decreases with increasing distance from their source, impermeable materials are present in many places without respect to distance from the source. In places the permeability of the deposits has been reduced as a result of their high salt content, particularly the high sodium content. Differences in the permea bility are important because they necessitate differences in the depth and spacing of ditches if drainage is to be effective.
Another variable to be considered is the underlying bedrock formed by the Wind River formation. Because the bedrock sur-
GEOLOGIC FORMATIONS AND THEIE WATER-BEARING PROPERTIES 37
face ranges from gently sloping to undulating and irregular, the overlying surficial deposits are irregular in thickness. In addi tion, the permeability of the bedrock is low, but somewhat variable. Water moves into the Wind River formation through fractures and the more permeable zones, but the movement is slow. These fac tors greatly influence the drainage of the overlying deposits. As pointed out previously, in some places the surficial deposits may be recharged by leakage from underlying confined aquifers in the Wind River formation.
Because of the above characteristics of the colluvial-alluvial ma terial and the underlying bedrock, waterlogging has occurred or will occur where (1) the colluvial-alluvial deposits thin or wedge out and thus force water to the surface; (2) a local irregularity or an abrupt change in slope of the underlying bedrock surface re duces the cross-sectional area through which the water can move; (3) the permeability of the surficial deposits and the underlying bedrock is so low that discharge from the deposits is less than re charge to them; and (4) artesian water from the underlying Wind River formation rises and enters the surficial deposits.
As the above conditions, either singly or in combination, exist in much of the area covered by the colluvial-alluvial deposits, drain age problems have developed or are likely to develop in such areas as the newly irrigated North Portal area in Tps. 3 and 4 N., Rs. 2 and 3 E. In order to foretell any tendency toward waterlogging, observation wells penetrating the full thickness of the colluvial- alluvial material mantling bedrock should be installed along two or three cross-valley lines. In the areas already waterlogged there is some question whether drainage is economically feasible. Rigid control of water use should be exercised in all areas mantled by colluvial-alluvial deposits, and measures should be taken to reduce seepage of water from canals. A detailed study of the hydrology and geology of each affected area should be made before corrective measures are attempted.
Detailed geologic and hydrologic studies, with special emphasis on the origin and nature of the surficial deposits and underlying bedrock formations, should be made in all areas of colluvial-alluvial deposits that are considered for future irrigation. The factors re lated to drainage perhaps are more important than any others in determining whether a given tract is suitable for irrigation; thus, these investigations logically should precede any others proposed to evaluate the land for agriculture. Certainly, any plan for the future agricultural utilization of areas of bedrock mantled by colluvial-alluvial deposits should be undertaken only after due con sideration of the nature of these materials and their drainability.
38 GROUND-WATER RESOURCES, RIVERTON AREA, WYOMING
ALLUVIAL DEPOSITS
Alluvial deposits occur as valley fill along the principal streams and their tributaries.
Areal extent. The alluvial deposits are most extensive along the Wind River where they are commonly a mile or more wide. Along Fivemile, Muddy, and Cottonwood Creeks they generally range in width from less than a quarter of a mile to about three- quarters of a mile, but in places they are as much as a mile wide. The width of the bottom land along each drainage course is rela tively uniform, with certain exceptions: the alluvial deposits along the Wind River are narrower than average near the west flank of the Pilot Butte anticline, and the alluvial deposits along Fivemile and Muddy Creeks are somewhat irregular in width and more extensive in the east-central and eastern reaches than along the upper reaches of the creeks.
Alluvial deposits are present along the numerous small tribu taries to the principal streams, but their areal extent is too small to warrant mapping. Consequently, only the more extensive allu vial deposits are shown on plate 1.
Description. The alluvium consists mostly of sand, silt, and clay, but in some places it contains considerable coarse sand and gravel.
The thickness of alluvium along the principal streams ranges from a featheredge to about 67 feet. The Bureau of Reclamation has reported a maximum thickness of 67 feet along Fivemile Creek and a maximum thickness of 35 feet along Muddy Creek. The logs of numerous test holes and water wells indicate that along Five- mile Creek the average thickness of the alluvium is about 40 feet and along Muddy Creek about 30 feet. The thickness of the allu vium along the Wind River and Cottonwood Creek is not known, but it probably is about the same as that along the other principal drainage courses in the area.
The alluvial deposits, especially those along the Wind River, Muddy Creek, and upper Fivemile Creek, contain a large propor tion of gravel. The deposits along Muddy Creek are reported by the Bureau of Reclamation to be remarkably uniform; about 10 feet of gravel was cored below stream level. It is estimated that the alluvial deposits along upper Fivemile Creek contain about 10 feet of gravel.
The alluvial deposits along small tributary drainages of the area were not studied in detail. Although of local origin and less thick, they probably are similar to the deposits of the principal streams.
Occurrence of ground water. The lower part of the alluvial de-
GEOLOGIC FORMATIONS AND THEIR WATER-BEARING PROPERTIES 39
posits bordering the Wind River contains a permanent body of ground water, which probably is due to recharge both from irriga tion and the Wind River. Although this aquifer has not been utilized extensively for water supply, dug wells in some places yield water that is suitable for domestic, stock, or irrigation use. The old Shoshone town well, on the east side of the Wind River in sec. 16, T. 3 N., R. 6 E., and soon to be flooded by water in Boysen Reservoir, provided a hard water used for municipal supply. Three interconnected dug wells in the same area have also provided an adequate quantity of water suitable for irrigation. The quality of water in the alluvium along the Wind River seems to depend on the source of recharge. In areas where alluvium and adjacent de posits are not irrigated and where the Wind River is the principal source of recharge, the quality of water is satisfactory for domestic use. Conversely, in areas where the recharge is principally from irrigation and where ground water is being discharged into the Wind River, the water generally is highly mineralized and suitable only for stock use. In such areas the pumping of ground water from wells located near the Wind River probably would induce re charge directly from the river and thus improve the quality of the water.
The alluvial deposits along Fivemile, Muddy, and Cottonwood Creeks contained some ground water before these lands were irri gated, but owing to subsequent irrigation along portions of the creeks, considerable water locally has been added to storage and the water table has risen. The creeks in these areas have become or are becoming effluent; that is, they are receiving water from the zone of saturation. A good example of this is Fivemile Creek, along which the water table has risen owing to the extensive irriga tion of adjacent alluvial and other deposits. As the water in Five- mile Creek, probably also in Muddy and Cottonwood Creeks, is highly mineralized, the water in the alluvial deposits along these creeks is likely to be unsatisfactory for domestic use.
Drainage. The alluvial bottom land is waterlogged in many places along the Wind River, especially in the eastern part of the report area. The waterlogging is caused (1) by infiltration of irrigation water applied to the alluvial and adjacent colluvial- alluvial deposits, (2) by uncontrolled return flow from irrigation higher terraces, or (3) by ground water discharged from higher terrace deposits. In many places the alluvial deposits are rela tively impermeable and the hydraulic gradient is low. The relative impermeability is due in part to the presence of very fine grained materials in the upper part of the alluvium, and in part to dispersal of the soil by sodium in the infiltrating water. The hy-
40 GROUND-WATER RESOURCES, RIVERTON AREA, WYOMING
draulic gradient of the water table to the Wind River is low because of the width of the deposits and the shallowness of the Wind River channel. The water table rises, but the rise is insufficient to in crease the hydraulic gradient to the point that the discharge equals recharge. Thus, excess irrigation water either accumulates in topographic depressions or, by contributing to ground-water stor age, causes the water table to rise close to the land surface. As a result, long-continued evaporation of the water has left a heavy accumulation of salts in the soil, and the alluvium has become pro gressively more impermeable and the waterlogging more extensive. In areas where the principal source of recharge to the alluvium is from higher lying terraces, the problem of waterlogging could be solved in part by constructing drains along the terrace edges. The drains should be incised to bedrock throughout their length. Interception of surface-water runoff from the terraces also would help and, in addition, would improve the drainage of-the terraces themselves. In some areas where waterlogging is caused solely by seepage of irrigation water applied to the alluvium and adjacent colluvial-alluvial deposits, the waterlogging could be remedied or alleviated by more careful application of irrigation water.
Irrigation along Muddy and Cottonwood Creeks has not been practiced long enough to cause much waterlogging of the alluvial deposits. However, in small areas along the middle and lower reaches of Fivemile Creek, some waterlogging has occurred, mainly as a result of irrigation of the alluvium and adjacent colluvial- alluvial deposits. Although some improvement has resulted from the construction of open drains through some of the waterlogged areas, these areas probably will be difficult to maintain in a condi tion suitable for extensive agriculture. If waterlogging in these areas is to be prevented or remedied, the amount of irrigation water applied to the land must be rigidly controlled.
EOLIAN DEPOSITS
Areal extent. Eolian deposits are present throughout the area, especially along the streams and in areas adjacent to badlands and steep escarpments; they are more common along Muddy and Cot tonwood Creeks. The areal extent of eolian deposits can be accu rately mapped only by very detailed work; for this reason, only the larger accumulations of eolian sand are shown on plate 1.
Description. Eolian deposits consist mostly of sand and silt. These are deposited wherever the sand-laden wind encounters land forms or vegetation that decrease its velocity and carrying ability. The deposits accumulate and sometimes form hummocks and dunes. If the wind is steady and blows mostly from one direction, bar-
GEOLOGIC FORMATIONS AND THEIR WATER-BEARING PROPERTIES 41
chans, or crescentic sand dunes, are formed. A well-developed active barchan in sec. 18, T. 4 N., R. 6 E., indicates a wind direction from the southeast. Dunes are the most obvious eolian deposits; however, a large part of the area is mantled by a thin deposit of eolian material.
Occurrence of ground water. The eolian materials are not im portant as ground-water reservoirs. They are mostly of fair to high permeability, however, and so may be effective in some places in absorbing rainwater and transmitting it to underlying deposits.
PLAYA DEPOSITS
Areal extent. Playa deposits are present in the lower parts of the larger closed depressions between Muddy and Cottonwood Creeks.
Description. During periods of heavy precipitation, silt- and clay-laden inflow spreads over the floor of a depression and forms a playa lake. Evaporation between periods of inflow leaves a thin layer of fine-grained material, some of which is later removed or redistributed by wind action. In some of the depressions in this part of the area the playa deposits are about 2 to 3 feet thick. Their relative impermeability causes ponding and retention of water in the depressions.
Occurrence of ground water. Playa deposits generally contain water only during and shortly after the wet seasons. Cottonwood drain, which now interconnects the series of depressions along an old channel through Muddy Creek terraces in T. 4 N., Rs. 4 and 5 E., will prevent the accumulation of water in some of these depres sions. The playa deposits will then receive little water except by effluent seepage after irrigation is begun on adjacent terraces.
GROUND WATER
DEPTH TO WATER TABLE
The depth to water in a well is a measure of the depth either to the water table in an unconfined aquifer or to the piezometric, or pressure, surface of water in a confined aquifer.
Precipitation that is not evaporated, absorbed by the soil and later transpired by vegetation, or carried away as surface runoff infiltrates to the zone of saturation. In some places, a perched ground-water body may be formed above the main water table; the sediments between the perched water body and the main water table are not saturated. The water table rises when recharge to ground-water storage exceeds discharge and declines when dis charge exceeds recharge. In the Riverton area the water table
42 GROUND-WATER RESOURCES, RIVERTON AREA, WYOMING
rises in response to recharge from irrigation water and declines during the nonirrigation season. Consequently, unless made at approximately the same time of year, measurements of the depth to water in any well are not indicative of changes in the long-term recharge-discharge ratio.
A map (pi. 2) showing the depth to the water table during Au gust 1950 was prepared for the Midvale and North Pavillion areas of the Riverton project. This map shows that the depth to water in unconfined aquifers ranges from less than 1 foot to more than 30 feet below the land surface. Because the configuration of the water table is similar to, but more regular than, the general surface topography, pronounced variations in the depth to water are caused primarily by irregularities of the land surface. Local perched water bodies and local differences in permeability and per colation rate also affect the shape of the water table. The map shows the effect of irrigation on depth to water. In the newly irrigated areas, such as the Lost Wells area and the North Pavillion area (see fig. 2), after 1 to 2 years of irrigation, the depth to water is still generally greater than 10 feet. However, direct recharge from irrigation canals and laterals already has caused the depth to water near canals to decrease to less than 10 feet. Continued irri gation will cause a further rise of the water table, and in a pro gressively larger area the depth to water will be less than 10 feet. Various stages in the sequence of events are shown by the depth to water in the remaining areas on the map (pi. 2) where irrigation has been practiced for some time. In a great percentage of these areas the depth to water is less than 10 feet. In some materials the capillary fringe above the water table extends to or nearly to the land surface and drainage problems exist.
If waterlogging is to be prevented in other parts of the area, rigid control of water use and the elimination of great losses of water by influent seepage from canals and laterals will be essen tial. If corrective measures to limit recharge from irrigation water are applied, it is suggested that periodic maps of the depth to water be made. These would aid in the evaluation of the effec tiveness of the corrective measures. The rise of the water table in newly irrigated areas should be observed carefully as irrigation is continued.
DEPTH TO PIEZOMETRIC SURFACE
Under artesian conditions water moves into the interconnected sandstone lenses within the Wind River formation either directly from the zone of saturation or through permeable zones and frac tures in the relatively impermeable confining beds. Because the
GROUND WATER 43
water is confined, its upward pressure against the confining bed is equivalent to the head resulting from the difference between the altitude of that point and the altitude of the water table in the re charge area minus the loss of head due to friction of movement. So long as the rate of recharge and discharge are constant, there is little relief for this pressure except where wells penetrate the aquifer or where leakage occurs. The water level in a well that penetrates the aquifer stands at a height abov_e the top of the con fining beds equivalent to the pressure head at that point. The imaginary surface to which water from an artesian aquifer would rise under the full pressure head is called the piezometric surface. In heterogeneous aquifers, such as the Wind River formation, however, the height to which water from a given standstone bed will rise in wells corresponds to the pressure head of the water confined in that sandstone at the point penetrated by the well.
At depth the Wind River formation in the report area comprises at least two distinct zones, both of which contain interconnected water-bearing sandstone lenses. The exact relation of these zones to each other is not known, but apparently they can be identified by the depth to water in wells; that is, the water in the upper sand stones of the Wind River formation rises to one piezometric sur face and the water in the deeper sandstones rises to another. These relationships cannot be resolved definitely without much more information about deep wells than is now available.
WATER-LEVEL FLUCTUATIONS
The stage of the water table or piezometric surface is a measure of the amount of water in underground storage; a rise of the water level indicates a gain of water in storage and a decline indicates a loss from storage. In wells tapping unconfined aquifers in this area, the water levels fluctuate mainly in response to recharge from irrigation and to discharge by evapotranspiration and natural drainage; the magnitude of these fluctuations is, of course, greatest in wells nearest sources of recharge or points of natural discharge. In wells tapping confined aquifers, the water level fluctuates in response to the increases or decreases in hydraulic head that result from the withdrawal of water from wells and to differences in the rates of recharge and discharge, and, to a minor degree, in re sponse to changes in barometric pressure. If recharge and dis charge are constant and the rate of withdrawal is small, the water level fluctuates very little throughout the year; this is the usual condition in the deeper confined aquifers of this area. If recharge and discharge vary substantially even though the withdrawals are
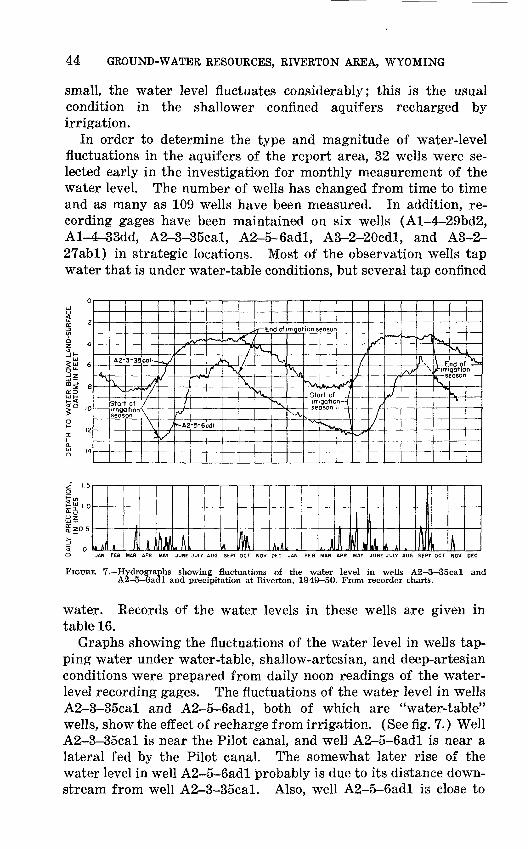
44 GROUND-WATER RESOURCES, RIVERTON AREA, WYOMING
small, the water level fluctuates considerably; this is the usual condition in the shallower confined aquifers recharged by irrigation.
In order to determine the type and magnitude of water-level fluctuations in the aquifers of the report area, 32 wells were se lected early in the investigation for monthly measurement of the water level. The number of wells has changed from time to time and as many as 109 wells have been measured. In addition, re cording gages have been maintained on six wells (Al-4-29bd2, Al-4-33dd, A2-3-35cal, A2-5~6adl, A3-2-£Ocdl, and A3-2- 27abl) in strategic locations. Most of the observation wells tap water that is under water-table conditions, but several tap confined
rigol
5 ^x End of J= rigotion season
Stort ofigation
season^ Start of
irrigation
Vy^A2-5-6
S,
M A/ A 1 A, AMLft » fl In u 1 . j . lA A
1
» nJAN FEB MAR APR MAY JUNE JULY AU6 SEPT OCT NOV DEC JUNE JULY AUG SEPT OCT NOV DEC
FIGURE 7. Hydrographs showing fluctuations of the water level in wells A2-3 35cal and A3 5 6adl and precipitation at Riverton, 1949 50. From recorder charts.
water. Records of the water levels in these wells are given in table 16.
Graphs showing the fluctuations of the water level in wells tap ping water under water-table, shallow-artesian, and deep-artesian conditions were prepared from daily noon readings of the water- level recording gages. The fluctuations of the water level in wells A2-3-35cal and A2-5-6adl, both of which are "water-table" wells, show the effect of recharge from irrigation. (See fig. 7.) Well A2-3-35cal is near the Pilot canal, and well A2-5-6adl is near a lateral fed by the Pilot canal. The somewhat later rise of the water level in well A2-5-6adl probably is due to its distance down stream from well A2-3-35cal. Also, well A2-5-6adl is close to
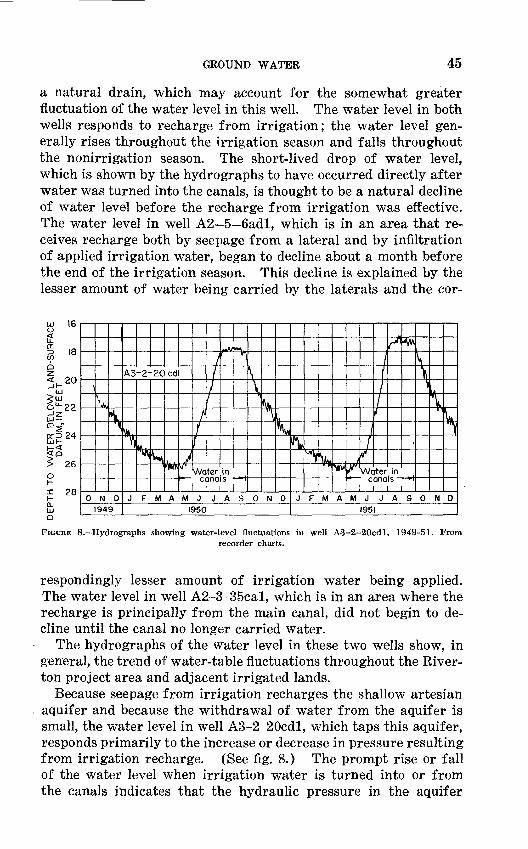
GROUND WATER 45
a natural drain, which may account for the somewhat greater fluctuation of the water level in this well. The water level in both wells responds to recharge from irrigation; the water level gen erally rises throughout the irrigation season and falls throughout the nonirrigation season. The short-lived drop of water level, which is shown by the hydrographs to have occurred directly after water was turned into the canals, is thought to be a natural decline of water level before the recharge from irrigation was effective. The water level in well A2 5 6adl, which is in an area that re ceives recharge both by seepage from a lateral and by infiltration of applied irrigation water, began to decline about a month before the end of the irrigation season. This decline is explained by the lesser amount of water being carried by the laterals and the cor-
ui 16
18
_ 20
g-22 ui
S26
28
1
VA,
\"i
0 N D1949
A3-2-20cdl
to
\ NU-wvS fakrWr yv/ 1
t
*r"
Water in canals -
*M\
\'
toP\
J FMAMJ JASOND1950
\
^W
f/
1We
c
lrterana
^
ins-
Vw
fvi» \\'i
V*
JFMAMJ JASOND1951ui
Q
FIGURE 8. Hydrographs showing water-level fluctuations in well A3-2-20cdl, 1949-51. Fromrecorder charts.
respondingly lesser amount of irrigation water being applied. The water level in well A2-3-35cal, which is in an area where the recharge is principally from the main canal, did not begin to de cline until the canal no longer carried water.
The hydrographs of the water level in these two wells show, in general, the trend of water-table fluctuations throughout the River- ton project area and adjacent irrigated lands.
Because seepage from irrigation recharges the shallow artesian aquifer and because the withdrawal of water from the aquifer is small, the water level in well A3-2-20cdl, which taps this aquifer, responds primarily to the increase or decrease in pressure resulting from irrigation recharge. (See fig. 8.) The prompt rise or fall of the water level when irrigation water is turned into or from the canals indicates that the hydraulic pressure in the aquifer
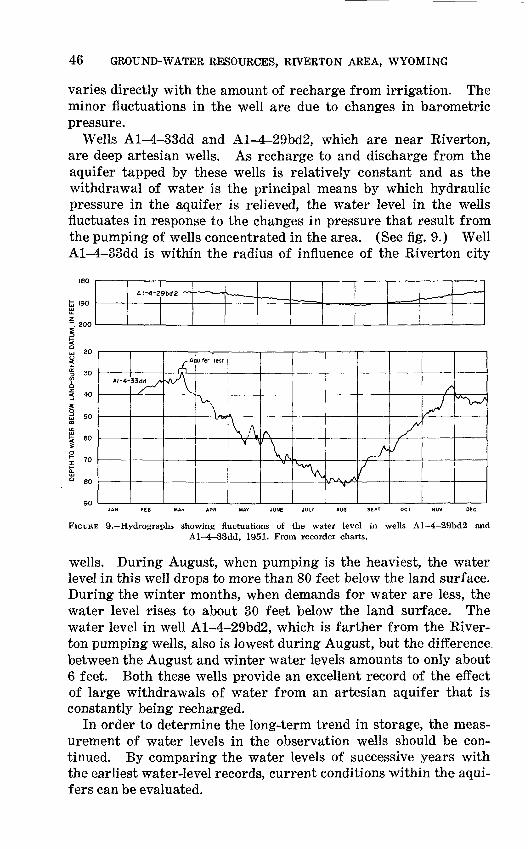
46 GROUND-WATER RESOURCES, RIVERTON AREA, WYOMING
varies directly with the amount of recharge from irrigation. The minor fluctuations in the well are due to changes in barometric pressure.
Wells Al-4-33dd and Al-4-29bd2, which are near Riverton, are deep artesian wells. As recharge to and discharge from the aquifer tapped by these wells is relatively constant and as the withdrawal of water is the principal means by which hydraulic pressure in the aquifer is relieved, the water level in the wells fluctuates in response to the changes in pressure that result from the pumping of wells concentrated in the area. (See fig. 9.) Well Al-4-33dd is within the radius of influence of the Riverton city
\/Vtf
I 77^ /
FIGURE 9. Hydrographs showing fluctuations of the water level in wells Al 4 29bd2 and Al-4-33dd, 1951. From recorder charts.
wells. During August, when pumping is the heaviest, the water level in this well drops to more than 80 feet below the land surface. During the winter months, when demands for water are less, the water level rises to about 30 feet below the land surface. The water level in well Al-4-29bd2, which is farther from the River- ton pumping wells, also is lowest during August, but the difference, between the August and winter water levels amounts to only about 6 feet. Both these wells provide an excellent record of the effect of large withdrawals of water from an artesian aquifer that is constantly being recharged.
In order to determine the long-term trend in storage, the meas urement of water levels in the observation wells should be con tinued. By comparing the water levels of successive years with the earliest water-level records, current conditions within the aqui fers can be evaluated.
GROUND WATER 47
RECHARGE
In the Riverton area recharge to the ground-water reservoir is from precipitation, irrigation, and surface-water infiltration.
PRECIPITATION
In comparison with the other sources of recharge, precipitation is not an important direct source of ground-water recharge in this area. The precipitation generally is rapidly absorbed by the soil or is evaporated directly from the surface. Only a small fraction, if any, of the water in the soil zone filters through the zone of aera tion to the zone of saturation. This is indicated by the presence of caliche in the soil zone and by the absence of a shallow zone of saturation in dryland areas before they are irrigated. The caliche, which is a foot or more thick in some places, is an accumulation of mineral matter resulting from evaporation of soil moisture de rived from precipitation; if water moved downward from the soil zone in large quantities, the caliche would not have formed. If precipitation were an important source of ground-water recharge, at least a thin zone of saturation would exist in most areas prior to irrigation.
A comparison of the hydrographs of the water level in two shallow wells in irrigated tracts with the daily record of precipita tion during the same period (fig. 7) indicates that precipitation usually causes no change in the water level. Fluctuations of the water level in wells at times of heavy precipitation during the non- irrigation season are minor; actually, it is not known whether the fluctuations are attributable to precipitation or to other causes. During the irrigation season, any water-level fluctuations caused by precipitation are obscured by the much greater fluctuations due to recharge from irrigation.
IRRIGATION
Recharge to the ground-water reservoirs in the Riverton area occurs mainly by influent seepage from irrigation canals, laterals, and reservoirs and by infiltration of water applied to cultivated land. Irrigation in the Riverton area is a large-scale and effective water-spreading operation comparable with that in areas where water spreading is practiced as a method of artificial recharge. The area is traversed by an elaborate system of canals and laterals, many of which are situated in relatively permeable surficial depos its. Also, water is stored the entire year in Pilot Butte Reservoir and Ocean Lake. Considerable water seeps from the reservoirs and from the ditches in transit to the farms of the area; personnel
48 GROUND-WATER RESOURCES, RIVERTON AREA, WYOMING
of the Bureau of Reclamation report that only about 50 percent of the water diverted for the Riverton project actually reaches culti vated land. The loss of water in this area is of major importance. Not only is less water available for irrigation, but the large amount of water infiltrating the surficial deposits causes waterlogging in many places. Many canals and laterals, especially where incised into very permeable material, have been or are being lined to pre vent further loss of water. Because the amount of irrigation water applied often is in excess of crop needs and because the soil is highly permeable in some places, such as on the terraces north of Muddy Creek, much of the irrigation water sinks into the soil and is transmitted downward to the zone of saturation. Preliminary figures of the Surface Water Branch of the Geological Survey indi cate that 100,000 to 150,000 acre-feet of irrigation water is lost annually in the Riverton irrigation project by infiltration to the ground-water reservoir, evaporation, and transpiration. No at tempt has been made to determine the amount of water contributed to the ground-water reservoir in this area because the amounts discharged by evaporation and transpiration are difficult to establish.
The seasonal influence of irrigation on the amount of water in storage is shown by a study of the hydrographs of the water level in two "water-table" wells situated in cultivated areas and near irrigation canals or laterals. (See fig. 7.) The water level in both wells began to rise steadily about a week after water was turned into the canals and laterals and fell gradually after the flow in the canals ceased. Although the rise of the water level in wells during the irrigation season indicates to some extent the amount of water that is added to ground-water storage as a result of re charge from irrigation, it does not in itself show the total increase because discharge from the ground-water reservoir is progressing at the same time as recharge; the rise of the water level indicates only that the recharge exceeded the discharge.
The importance of irrigation as a source of recharge is empha sized by the rapidity with which a zone of saturation develops and by the rapid rise of the water level in newly irrigated areas. In parts of the North Pavillion area, in Tps. 3 and 4 N., Rs. 1-3 E., recharge from irrigation caused waterlogging in only 1 year.
Water is contributed to the ground-water reservoir by streams crossing areas where the water table is below the level of the stream; such streams are said to be influent. Data pertaining to the loss of streamflow from Muddy Creek have been compiled by the Surface Water Branch of the Geological Survey. During Sep tember 1949 the measured loss of water within the Riverton irri-
GROUND WATER 49
gation project was about 113 cfs. During the same month a flash flood increased the normal flow of Muddy Creek by 100 cfs where the creek entered the project area, but no increase in flow was noted at the lower end of the project. These data demonstrate that streamflow in influent stretches contributes considerable water to ground-water storage. The extent of the contribution by streams other than Muddy Creek, however, is unknown.
MOVEMENT
Ground water in a permeable material moves from one place to another if there is a hydraulic gradient (difference in head) be tween the two places. Ground water generally is in motion; truly stagnant ground water, or at least stagnant fresh water, is rare if it exists at all. Unconfined ground water moves in permeable rock that is underlain by relatively impermeable rock; confined water moves in permeable rock that is both underlain and overlain by relatively impermeable rock. In either situation, ground water moves from a place of recharge to a place of discharge at lower altitude. Although the rate of ground-water movement is affected by the texture and structure of the rocks, the direction of move ment always coincides with the path of least resistance to flow. Ground water generally moves so slowly that the internal friction of its particles is relatively low and its flow is "laminar" or "viscous."
According to Darcy's law the rate of movement of ground water is directly proportional to the hydraulic gradient and the permea bility, and the quantity of water discharged in a unit of time depends on the rate of movement and the cross-sectional area through which the water is moving.
The configuration of both the water table and the piezometric (pressure) surface can be shown on maps by contour lines. As water moves in the direction of the greatest slope of the water table or piezometric surface, the direction of movement is perpen dicular to the contour lines. The maximum difference in hydro static pressure is at right angles to the contour lines, and the slope or hydraulic gradient is measured along the line of maximum difference.
UNCONFINED AQUIFERS
In much of the Riverton area the colluvial-alluvial, alluvial, and terrace deposits together constitute the principal shallow aquifer and the water in them generally in unconfined. Because the re charge is considerable during the irrigation season, tho water table rises and discharge increases somewhat. The slow decline of the
50 GROUND-WATER RESOURCES, RIVERTON AREA, WYOMING
water levels after the irrigation season (fig. 7) indicates that ground-water movement is slow. Nevertheless, because the sur- ficial deposits are recharged directly by irrigation water, the quan tity of water passing through them is comparatively large.
The direction of movement of ground water in the surficial de posits is generally the same as the slope of the land surface. For example, in inter-butte areas, ground water moves downgradient through the colluvial-alluvial deposits either toward some ephem eral wash or toward the center of a closed basin. In terrace areas ground water moves in a downvalley direction through the terrace deposits toward the principal surface drainage. In valley allu vium, water moves in a downvalley direction as underflow parallel to streamflow. Although the topography of the land surface gen erally is a key to ground-water movement in the surficial deposits of the area, the irregularities of the underlying bedrock surface locally modify and complicate the direction of movement.
To illustrate these characteristics of shallow ground-water movement in unconfined aquifers in the Riverton area, a general ized map of the Midvale area of the Riverton irrigation project was prepared from data in the files of the Bureau of Reclamation. (See pi. 3.) This map shows the position of the water-table con tours immediately before the 1950 irrigation season (about March 15) and during the latter part of the irrigation season (August 15), and thus approximately represents the low and high water levels during the year. The relative rates of movement are indi cated by the spacing between the water-table contours for March and August. If the contours are closely spaced or if the March contour crosses the August contour line (thus showing higher water levels), the movement of ground water evidently is slow. Conversely, if the contours are more widely separated, the move ment of ground water evidently is more rapid. The entire Mid- vale is mantled primarily by colluvial-alluvial deposits that receive direct recharge from irrigation.
CONFINED AQUIFERS
In the Riverton area, ground water in the Wind River formation generally is confined under artesian pressure. The water level in a well that penetrates one of the systems of essentially horizontal lenticular water-bearing sandstones in the Wind River formation coincides with the piezometric surface of that system. At least two major water-bearing zones and two piezometric surfaces are known to be present in the Riverton area, but insufficient data are available for the precise depiction of these surfaces. The response of the water level in observation wells to the pumping of ground
GROUND WATER 51
water during an aquifer test in the Riverton well field indicates that the sandstone lenses within a certain depth range are inter connected hydraulically and that the formation within this depth range reacts as a hydraulic unit. Although the mode of intercon nection of the sandstone lenses is unknown, it is assumed to be largely by fractures in the impermeable materials separating them.
DISCHARGE
In the Riverton area, ground water is discharged by evapotran- spiration; into streams, drains, and lakes; and through wells and springs. Some ground water is discharged from the area as underflow in the alluvium of some of the creeks.
EVAPOTRANSPIRATION
The loss of soil moisture and ground water by evaporation is greatest during the summer when the temperature is highest and where the water table or capillary fringe extends to the land sur face. Inasmuch as the periods of high temperature coincide with the periods of high water table resulting from the application of large amounts of irrigation water, much water is evaporated and an accumulation of salts is left on or near the land surface.
The loss of soil moisture and ground water by transpiration of plants is also greatest during the growing season owing to higher temperatures and large applications of irrigation water. Quanti tatively, however, the transpiration of soil moisture is much more important than the transpiration of ground water, despite the fact that phreatophytes derive most of their water supply from the zone of saturation or capillary fringe.
Although the total discharge of ground water by evaporation and transpiration is quantitatively important, it probably is small compared with other types of ground-water discharge. It is of economic importance, however, because much of the ground water discharged in this manner is wasted or produces plants that have little or no value.
STREAMS AND DRAINS
Most of the ground water discharged from unconfined aquifers and some of the water discharged from confined aquifers leaves the Riverton area in streams and open drains and eventually flows into the Wind River.
Wherever a stream is incised below the water table in surficial deposits, ground water discharges into the stream. For example, the average base flow of Fivemile Creek, which is about 38 cfs in
52 GROUND-WATER RESOURCES, RIVERTON AREA, WYOMING
the winter season, represents essentially the total inflow of ground water into the creek and its tributaries. During the irrigation sea son, when the increased recharge causes a higher water table and a correspondingly steeper hydraulic gradient to the creek, the dis charge into the creek is greater. Some shallow confined water in the Wind River formation also is released to streamflow, especially where lower Fivemile Creek is incised into the formation.
Similarly, where the water table is higher than the floor of an open drain, ground water is discharged into the drain. However, the efficiency of a drain as an agent of ground-water discharge depends on the course of the drain with respect to the direction of ground-water flow, the elevation of the water table with respect to the floor of the drain, and the permeability of the material trans mitting the water. If a drain is perpendicular to the direction of ground-water movement, it will intercept the maximum amount of ground-water flow; and the greater the depth of a drain below the water table, the larger the amount of ground water discharged into it. However, even though a drain is perpendicular to the di rection of ground-water movement and is incised well below the water table, it will not be effective if the water-bearing materials are relatively impermeable.
In many parts of the Riverton irrigation project the permeability of the waterlogged material is low because of a high content of sodium salts or because of fine-grained texture, and, although the hydraulic gradient is steep, the drains are ineffective except for short distances on either side. The low permeability of the water logged material is the principal obstacle to drainage of many waterlogged areas within the Riverton project.
LAKES
The total inflow of ground water into topographic depressions has contributed to the formation of lakes in some parts of this area. Discharge occurs directly when the elevation of the water table is greater than the elevation of the lake surface and indirectly when ground water discharges to open drains flowing into the lake. The lakes are formed only where the surficial deposits transmit water into the depressions and tributary open drains faster than it can be evaporated. As the bottom of such a depression generally is bedrock of low permeability, the ground-water discharge, along with some return flow from irrigation, accumulates in the depres sion and remains throughout the year. Effluent ground water is known to be the primary source of recharge to the lakes because, after irrigation return flow has ceased, a relatively constant water level in the lakes is maintained even though water is discharged
GROUND WATER 53
from the natural or artificial outlets of the lakes. Ocean Lake, which has existed only since the beginning of irrigation in this area, is a notable result of total ground- and surface-water inflow.
WELLS AND SPRINGS
Most wells in the report area penetrate zones of confined water in the Wind River formation. Although some along the Wind River are flowing wells, elsewhere in the area a pump generally is needed to lift the water to the surface. A few wells tap the ter race deposits or alluvium, but their total yield is small compared to that of wells tapping the Wind River formation. Springs issue from the terrace and alluvial deposits along the Wind River and other drainages, especially where these deposits are irrigated or are adjacent to irrigated land.
The locations of wells and springs in the Riverton area are shown on plate 1, and data pertaining to them are given in table 18.
AQUIFER TEST OF WIND RIVER FORMATION AT RIVERTON
The rapid increase in the population of Riverton during the period 1930-50 greatly increased the demand far water. When additional wells were installed, however, it soon became apparent that the supply of ground water in the vicinity of Riverton was limited. Accordingly, an aquifer test was run to obtain informa tion on the water-bearing properties of the Wind River formation. The well numbers used in describing the aquifer test correspond, as follows, to the coordinate numbers used elsewhere in the report:
35bbl34ad27dd27dc27cdl
Well 7.............Al-4-34bal8............. 34bb29............. 34bbl
10............. 34ca11............. 33dd
Construction records and logs of all wells used in the test are given in tables 17 and 18; with the exception of well 11, all are owned by the city of Riverton.
TEST PROCEDURE
A time of year was selected when a minimum number of wells could supply the daily municipal demand. Well 8 (fig. 10) was selected as the well to be pumped during the test because it was centrally located and its rate of pumping could be controlled so as
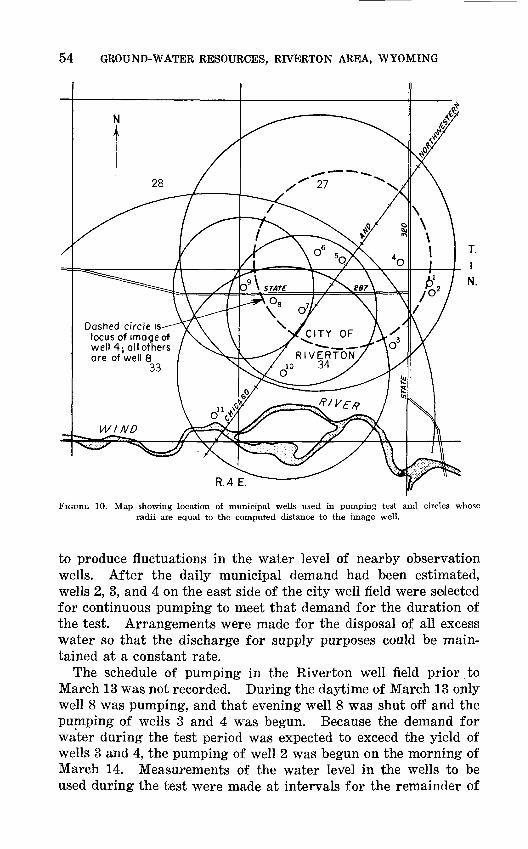
54 GROUND-WATER RESOURCES, RIVERTON AREA, WYOMING
Dashed circle is locus of image of well 4; all others are of well 8
33
R.4 E.
FIGURE 10. Map showing location of municipal wells used in pumping test and circles whose radii are equal to the computed distance to the image well.
to produce fluctuations in the water level of nearby observation wells. After the daily municipal demand had been estimated, wells 2, 3, and 4 on the east side of the city well field were selected for continuous pumping to meet that demand for the duration of the test. Arrangements were made for the disposal of all excess water so that the discharge for supply purposes could be main tained at a constant rate.
The schedule of pumping in the Riverton well field prior to March 13 was not recorded. During the daytime of March 13 only well 8 was pumping, and that evening well 8 was shut off and the pumping of wells 3 and 4 was begun. Because the demand for water during the test period was expected to exceed the yield of wells 3 and 4, the pumping of well 2 was begun on the morning of March 14. Measurements of the water level in the wells to be used during the test were made at intervals for the remainder of
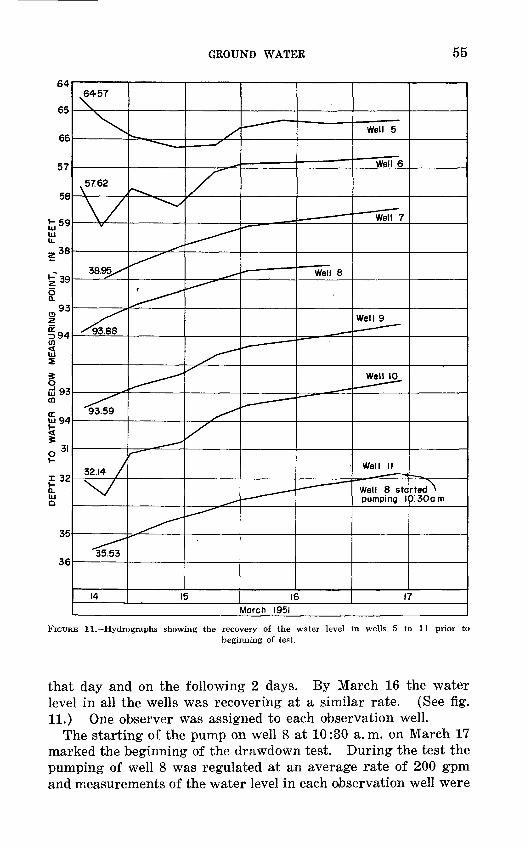
GROUND WATER 55
FIGURE 11. Hydrographs showing the recovery of the water level in wells 5 to 11 prior tobeginning of test.
that day and on the following 2 days. By March 16 the water level in all the wells was recovering at a similar rate. (See fig. 11.) One observer was assigned to each observation well.
The starting of the pump on well 8 at 10:80 a. m. on March 17 marked the beginning of the drawdown test. During the test the pumping of well 8 was regulated at an average rate of 200 gpm and measurements of the water level in each observation well were
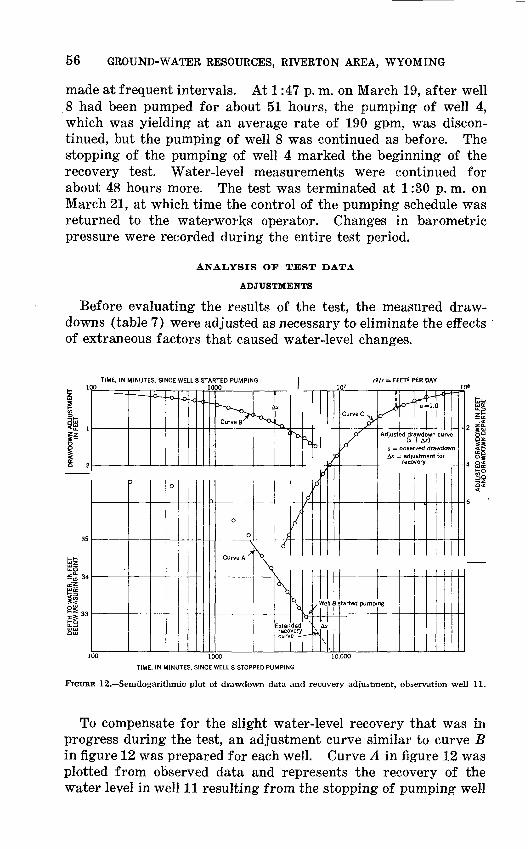
56 GROUND-WATER RESOURCES, RIVERTON AREA, WYOMING
made at frequent intervals. At 1:47 p. m. on March 19, after well 8 had been pumped for about 51 hours, the pumping of well 4, which was yielding at an average rate of 190 gpm, was discon tinued, but the pumping of well 8 was continued as before. The stopping of the pumping of well 4 marked the beginning of the recovery test. Water-level measurements were continued for about 48 hours more. The test was terminated at 1:30 p. m. on March 21, at which time the control of the pumping schedule was returned to the waterworks operator. Changes in barometric pressure were recorded during the entire test period.
ANALYSIS OF TEST DATA
ADJUSTMENTS
Before evaluating the results of the test, the measured draw downs (table 7) were adjusted as necessary to eliminate the effects of extraneous factors that caused water-level changes.
TIME, IN MINUTES, SINCE WELL 8 STARTED PUMPING 100__ ____ ___ 1000
r'/t = FEET» PER DAY
TIME. IN MINUTES, SINCE WELL 8 STOPPED PUMPING
FIGURE 12. Semilogarithmic plot of drawdown data and recovery adjustment, observation well 11.
To compensate for the slight water-level recovery that was in progress during the test, an adjustment curve similar to curve B in figure 12 was prepared for each well. Curve A in figure 12 was plotted from observed data and represents the recovery of the water level in well 11 resulting from the stopping of pumping well
GROUND WATER 57
8 The adjustment increment As (the distance between the water level at the time well 8 was started and the extension of curve A) was replotted as curve B in terms of the time since the pumping of well 8 started. The adjustment increment As was added to the observed drawdowns, and the adjusted drawdown (s + As), plotted as curve C in figure 12, was plotted beside the observed drawdown (s), as shown in figure 13. A comparison of the ob served data with the adjusted data showed that only the measure ments of the water level in well 11 were appreciably affected; hence, only the data from well 11 were adjusted for the final computations.
O _ Observed dra
Adjusted drawdov
~0 = pumping rate = 2C
_/"2/f = 4.2 X 10'sqftp
~W(u) = 0.22 s = 0.5 ft
_ ' = 5 = 1 C
1.87/-2//
/-,=» /- \ = 690
wdown
m (3 + is)
Ogpm
er day
,000 gpd per foot
io-<
Oft
X
(
X
' K
C 1O
XX
Trace of type . curve
«O
s
< -
Os
- WelKstopp
4.1"'
H
ed pum
= 0.5
\\x\
Jing
V\
c
" ti
\
(
late
^
\
>
h 10 nt -
V
\
r*/f = SQUARE FEET PER DAY
FIGURE 13. Logarithmic plot of drawdown data, observation well 11.
58 GROUND-WATER RESOURCES, RIVERTON AREA, WYOMING
TABLE 7. Measurements of the water level in wells, in feet below measuring point, during aquifer test at Riverton, March 1951
t: Time since well 8 started pumping, in minutes; t equals 3,077 when t' equals 0. Pumping of well 8started at 10:30 a.m., March 17.
I': Time since well 4 stopped pumping, in minutes. Pumping of well 4 stopped at 1:47 p.m., March 19.
TimeWater level Time
Water level Time
Water level
Well 4[Altitude of measuring point, 4,955.23 feet. Distance from well 8 is 2,995 feet.]
March 14 6:00 p.m.___ _.__ ..
0357. . .,
13.. ..............16..------.-.--...21................26.-.----,.-----..32................38.. --... ----..46................61................61................7079. ............ ...82...............89. ...............
168.05
172.11
120110.62110.10106.26106.12103.42101.96100.4699.1197.7296.6294.9793.6492.4392.0691.22
March 19 Con. t'
HO.... _____ -..121 __ -----------136160----.. -------165 --------186- . 205 ---- -----.ooc263 283- 328 - -368 388 - --- -418..--....---...448 488 533..--.. ------578
623
89.9788.9387.8786.5085.3684.2182.7681.48
78.1477.2075.1173.9872.8271.7570.1569.5768.2267.04
65.97
March 20 Con. t'668 . 728. _____ 745 __ .. .. . .....808.------ ____ -868923-.. ---------983
1,063 1,168 1,278----------- __ -1,283 1,408 1,528 ------------1,648 1,833
2,091 ------------2,363 - 2,603 . 2,823... -----------
64.9164.6763.3362.2261.2360.35,59.4758.4357.2255.9855.9854.7653.6752.8451.64
50.2548.9648.0647.23
Well 5[Altitude of measuring point, 4,970.40 feet. Distance from well 8 is 2,995 feet; distance from well 4 is
1,490 feet]
March 14
March 16
7:20 p.m.
t0. ___ .3
12- __ . .. - 24 ___ .. . __ 30 . __ _ - 39_ - _48. ___ . ... 63-- --- -68-. ..--....- 82.- ------------
102122--- ---------142 162 -172 192 ------ _ -212--. -----------232_. -------------252 - - 272 ._ __ -----292 . 312 . _ -_332..- ..- 352 __ _.---.
64.5765.20
65.8966.2666.1965.62
65.3465.43
65.32
65.3065.3265.3465.3465.3465.3465.3465.3565.3765.3765.3765.3865.3965.4065.4265.4465.4465.4665.4865.5065.5365.5565.5765.59
March 17 Con. t
387. __ .... ...417----. -- -- 448 478- - _-- _ --509 ------------549 -----------HQQ650 --- --700 . 760. ----------
March 18820 -880 940
1,000-.. -----------1,060 __ --------- ...1,120 ------------1,180 __ 1,240 __ ------- __ -1,300 __ ..--- 1,360 1,408 __ .... __1,515 _ -----------1,645 --------1,800 __ ------ _ -2, 025--. ---------2,145. ------------
2,280 __ -----------2,400 _ - --- --2,580 ____ -- _2,805 ____ .. . _ ...3,071 _____ . _ ...t'
0-.-- -----------
65.6965.7365.8065.8665.8965.9766.0866.1666.2366.35
66.3966.4666.5666.6866.7466.7666.8166.8666.8767.0567.0867.1567.3067.4767.7667.90
68.0568.1368.2568.3968.56
68.57
March 19 Con. t'9------- -------
12--..--- __ -----23---.- ___ -----26. ------------2932 36 38 41. ------44-- ____ ------47-- -----------50-..--- __ -----63 5659. .......... ---.62-_ ------ _ ..66 - . 70 77.- ------ .. ...SO .- . __ --84 ----------88---------.92--. ____ - __ -96 _ ------- _ -.
100- . -- .106 110--------115---------120- ------------130... -------140--.. ----- ....150. __ ----- ____160 __ ------ ....170.- ___ .- ......180 193 _____ _- ___ -
68.5668.5668.5668.5668.5568.5568.5468.5368.5168.5068.4868.4668.4168.4168.3968.3668.3268.2868.2068.1768.1468.0968.0367.9867.9467.8867.8367.7667.6967.5667.4367.3067.1767.0466.9166.75
GROUND WATER 59
TABLE 7. Measurements of the water level in wells, in feet below 'measuring point, during aquifer test at River ton, March 1951 Continued
TimeWater level Time
Water level Time
Water level
Well 5 Continued
March 19 Con. i' 208248 ____ 278 -____--__-_308_ _ ---__. _ __343 __ -____ __403 -____ _478 _____ ........568__.__ ..........658 __ ...... __ ...
66.5566.0265.6165.3464.9164.3463.7562.8662.16
March 20 t' 718 ___ ..._....._818 ... .878 __ _ __ ---..-_933993-______ ........
1,073 1,173 ___ ..........1,288 __ ______ _____1,418... ____________
61.7461.1160.7660.4560.1259.7959.3158.8558.37
March 20 Con. f
1,538 _____ ----_-.1,653.. ..____ ___ .1,838
2,095 2,369 2,613 ___ .._.-.--._2,828_.--_____- __ -.
57.9557.6057.11
56.5155.9055.4955.10
Well 6[Altitude of measuring point, 4,983.77 feet. Distance from well 8, 2,345 feet; distance from well 4, 2,590
feet]
March 14
12:53 a.m._ ... _-___10:48 a.m. _
March 1710:17 a.m.__. __ -____
t0 __ _4
10_ ------------1826.---. --------33 _ _ ...42-----.- -------60 70 __ _----__-_---81 - - 90 -
100 110 120_---_- ___ _ .130 __ ___140.-_ ------- __ -150. - __ __ __ -160- __ _____--_---.170- __ _. __ -------ISO. 190 __ -_ __ ---_-_200 91 ft230 ____ ----- __ --oco
291
QQO
57.6258.15
56.7657.3556.10
55.8955.8155.72
55.56
55.5755.5855.5855.5855.5855.5855.5855.5855.5955.6055.6055.6155.6355.6455.6655.6855.7055.7255.7555.7755.8055.8355.8555.9055.9656.0856.2156.40
March 17 Con.
444____... .-._._._503 __________540. 590 640_. ______ __ ____690.- __ ---.-- -_750. ...___________810__-_-__________
March IS870 . . .930 990
1,050.--- -------1,110 --. ____ . _1,170-.-- ---------1,290 1,413 1,510 l,640-__ __________1,795 2,030__ __________
2,150 _____ .- _--2 2822,408.. __ ----------2,5852,800 - _ _3,074
0 ___ _ __ ______6 . _ _ __
12.. ------18 26 30.- __ ___ __ ____38. ___ _-._____-48 ____ ____--._-5868 __ .____-._-_-78 __ ___-_.-_----
56.6456.8656.9757.1557.3057.4557.6457.80
58.0058.1958.3158.4758.6558.8059.1059.3859.5659.8160.0860.60
60.8261.0261.1961.4461.7362.00
62.0062.0062.0162.0162.0362.0462.0562.0462.0562.0762.09
March 19 Con. t'8898... .. -
108 ...... ___--118 ... --------128.--. ._ __ _ 148168 __ 188..-- --__ _ --218_----------- --238 273. ----------298 ---------338_-.________- ...368_. __ . --.--398428 _ ---.__ -. __473 518 563
March 20608. .. --------653_ __ -. .--- -698.- ---------758 823. __ ......- 883 ----- __--_-_938. _ __ .___ __ -_998 ___ - - .
1,078 1,183 1,298 _--.-- _1,423 -1,543--.-- ------ -1,658 1,843.- ----------
March 212,099 - -.2,377 _____ _____ ...2,618___ __ ____ .2,838 ___ _______ ...
62.0862.1062.1262.1262.1262.1562.1962.2062.2262.2362.2562.2662.2862.3062.3262.3562.3762.3762.39
62.4062.3862.3762.3762.3562.3462.3462.3362.3662.3962.3662.3362.2862.2662.27
62.2462.2262.2162.16
Well 7 [Altitude of measuring point, 4,968.10 feet. Distance from well 8,860 feet; distance from well 4, 3,570 feet]
March 1444.4838.95
38.4737.8037.43
March 16 12:22 a.m. _ ...
March 17
37.1536.9936.79
36.49
March 17 Con. t
0...- --.- _ ..-24_ ___ _____----.6 __ _ __ __ ,8
36.5036.5036.4936.4936.49
60 GROUND-WATER RESOURCES, RIVERTON AREA, WYOMING
TABLE 7. Measurements of the water level in wells, in feet below measuring point, during aquifer test at Riverton, March 1951 Continued
TimeWater level Time
Water level Time
Water level
Well 7 Continued
March 17 Con. t
10 12 __ ---.------.-_14.--- _____ -----16 -------18 20 _ ----- _ - _ -22..---- _____ .--24 ______ --- __26--- ---28 __ . __ -- ___ -30-__- ___ -------33------- __ - ....36-- -------39 __ . __ .- __ .42- __ -- _____ -46 ________ -----50- _______ -----55 ________ - __60 65 ___ - __ ------70 _____ . __ -----75 80 _____ ---------85 .90 ____ -- ___ ...
100110 -------120 - --------130 140.-- , __ -------150 160 170 180190.- -----------200,- - -.-210, .. ----.--....240.- ----------260
36.5036.5236.5536.5836.6036.6336.6736.7336.7736.8136.8536.9337.0037.0737.1337.1837.3137.4237.5237.6137.7337.8437.9538.0538.1538.3338.5138.6938.8238.9839.1239.2739.4039.5439.6539.7839.9040.2440.45
March 17 Con. t
280--------- ___ -300.-------. -----320------.- - __ -340 .. -----------360-- - __ -----390 -420----.-- __ -----450. ------- __ - 480-.---..-----.510.--- __ -------540580----.. ---------620 670 -------------733 ' _ _ 790-
850 . Qin970 __ --. __ ....
1,034 . 1,090. __ - - 1,150- -------------1,210.-.- -----1,270 __ ------ ___ -1,330. __ ...... __ -1,390 1,452_ __1,638 . 1,765- --1,891. --------------2,050 2,170
2,300 ,__---_2,415...... ------2, 590. ...... ..--- 2,695-.. __ --------3,065 ......_.-_----
40.6540.8641.0741.2441.4341.7141.9542.2142.4242.6542.8143.1043.3743.6844.0544.37
44.6744.9445.1745.4445.6845.9446.1946.3746.6346.8547.0147.5247.9348.3248.8149.10
49.3449.5349.7850.2050.59
March 19 Con. t' 0--- _ ----- ....4
19 _____ .. .. __ .36 . - __ -.-52.. 68 91 ___ .. .. __ .
125. __ --. _____ -146. ---------- __ _163180211 227 . __ .--267. __ - __ -------297. . __ _328--. ------------358_ 388. __ ----------418-.-.. ------458508 553 593
653 __ .... ____ -713 833 __ --._- 953
1,093. __ . __ ------1,198-- -1,338. --------------1,563 _ _ - _1,858.
2,115 --._ --------2,403 ..--..--__-__-2,853
50.6250.6550.6050.7350.7450.8050.8550.8750.8650.8850.9350.9650.9551.0151.0251.0751.1051.1451.1951.3151.3951.45
51.5351.6251.7551.8952.1052.2352.3452.4152.71
52.9853.2653.38
Well 8[Altitude of measuring point, 5,023.47 feet. Distance from well 4, 2,995 feet]
March 1493.88 93.42
March 1592.98 92.43 92.02
March 1691.69 91.55 91.41
Well 9[Altitude of measuring point, 5,030.15 feet. Distance from well 8, 1,180 feet; distance from well 4,
5,045 feet]
March 14
March 15 12:40 a.m........ ....
March 16
March 17
t 0 __ . __ ------
93.59 93.37
92.88 92.20 91.76
91.42 91.22 91.02
90.68
90.67
March 1 7 Con. t
6--. .... -------16-........---- -22 28---.. ----------33-. __ -----------36 39 _____ --- .- 42 --46 .. __50 55_ 60-.. -------70.- -------- __ -
90.65 90.68 90.67 90.70 90.70 90.74 90.79 90.75 90.89 90.88 90.96 91.00 91.08
March 1 7 Con. t
80-.---.-..... _ _90 ___ ----- ___ -
100. __ _ _ _110 __ ... __ .120 __ ._ ... .. __ ..140_ __ 160 __ .185. . .........200.------- __ ..225 ____ ---------247 ___ ----_ 274 ___ ...... __ .-296.. ...... ......
91.24 91.37 91.50 91.66 91.75 92.02 92.20 92.41 92.68 92.83 93.13 93.29 93.48
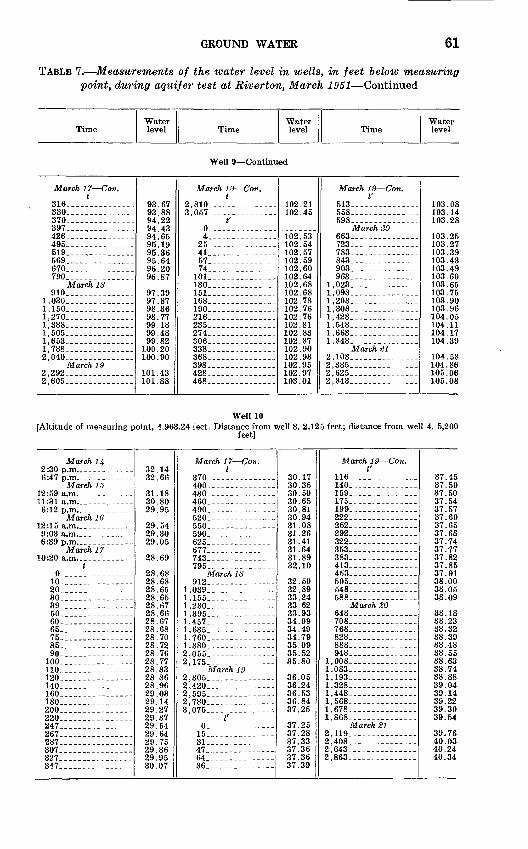
GROUND WATER 61
TABLE 7. Measurements of the water level in wells, in feet below measuring point, during aquifer test at Riverton, March 1951 Continued
TimeWater level Time
Water level Time
Water level
Well 9 Continued
March 1 7 Con. t
316...............330 ____ .........370 __ .---.397 __ . __ ....426. ____ ........495..--.----......519 ____ .........569 .. .670 __ ---.790.----.. ........
910....... __ .....1,030 __ ...... __ ...1,150... ............1,270. ._------.._-..1,388..----. ____ .-1,505.... __ --. ....1,6531,788---..----- __ -2,040
2,292 __ .... ........2,605. __ -----..--..
93.6793.8894.2294.4394.6595.1995.3695.64% OA
96.87
97.3997.8798.3698.7799.1899.4899.82
100.20100.90
101.43101.88
March 19 Con. t
2,810 3,057 __ -.....----.t'
0. ..............4
25 ---------415774 ___ --...-.---
101. .. __ . __ ....ISO 151---------.-.--.168----.-. __ .-__-190.--- __ -------216.-------. __ ...235.-.----.- ..-274-.- 306 - -338--- ------368... - .. . 398428.-----..-. ..468. ____ --------
102.21102.45
102 . 53102 . 54102 . 57102 . 59102.60102.64102.68102.68102 . 73102.76102 . 76102.81102.83102.87102.90102.93102.95102.97103.01
March 19 Con. t' 513 558 - 598.-- __ ---------
663.--.. _ -------723 783 ____ _.. .-843. 903. --------------963
1,023 ____ - ___ .--1,098 1,208..-- ---- __ -1,308- .- ___ . ._..1,428 --_1, 548--.. ----------1,663- - -1,848---.--- -.-.-.
March 312,103 -- ---__2,385 __ ....----- -2,625 __ ----------2,843 .
103.08103.14103.28
103.25103.27103.39103.43103.49103.60103 . 65103 . 75103.90103.96104.05104.11104.17104.39
104.58104.86105.06105.08
Well 10[Altitude of measuring point, 4,963.24 feet. Distance from well 8, 2,125 feet; distance from well 4, 5,200
feet]
March 14 2:30 p.m.. .. _-.._..
11:31 a.m.
12 :15 a.m... .. - -
t0
10- _ ._----.--.20 __ .. . _..30 ___ ----------3950-.... -----------60- ___ . ._-65.. ------------75. . . --------85.. ... .. ---------90- -------------
100-. . ----------- 110. --------------120..... ---------140-..- __ -------160-.. _____180 200- - - -220 _________ ----247 _____ ---------267 __ .---.. --.287.. --------------307-.-- __ .- ... .327 ________ . __ -347.. __ .. . -----
32.1432.66
31.18
29.95
29.5429.3029.05
28.69
28.6828.6828.6528.6528.6728.6628.6728.6828.7028.7228.7628.77 28.8328.8628.9629.0329.1429.2729.3729.5429.6429.7529.8629.9530.07
March 17 Con. t
370 ------------400 430460 490 - _- - -520.--- __ ------550------ __ -----590 ____ --------625- __ -----------677 _ -.- --- --743 -.--.---_---.-795
912-- -. --------1,039.-. __ .--.-_--1,155 - ---------1,280.. -------------1,395------ __ ------l,457---_- __ 1,635 ---- __ ------1,760.. -------1, 880. -------------2, 055. --------------2,175-------------
2, 305. --------------2,420. __ ...--- ---2,595.-- __ ------2,780.-- -. __ -----3,075 -
0.----- - __ ---1531 - -47 __ . ----64 86. __ -----------
30.1730.3530.5030.6530.8130.9431.0831.2631.4131.6431.8932.10
32.5032.8933.2433.6233.9334.0934.4934.7935.0935.5235.80
36.0536.2436.5336.8437.25
37.2537.2837.3337.3637.3637.39
March 19 Con. t'116- ----------140- -----------159 175-. ---------199----- __ ---_-_-222262-.- --------292----. ___ -----322.-- __ ---------353 ___ -----.._383.-- ___ -------413-- 453. ------------505--. __ --------548--.--- -------588 ------------
March 20648 - 708 __ --_.-----_-.768 - - 828.. __ .. -- 888----. ------948.- __ . . -..-
1,008 __ - __ -_-_-_ 1,083------------ .1,193------ __ -_--__1,328. ----------1,448.---.-------.1,568 ___ -------1,678.-.- ____1,868..- - __ ------
March SI2,119.... ...........2,408---.- __ -------2, 643. .. . . ._..2,863 --------
37.4537.5037.5037.5437.5737.6037.6537.6837.7437.7737.8237.8537.9138.0038.0538.09
38.1838.2338.3238.3938.4838.5538.63 38.7438.8839.0439.1439.2239.3039.54
39.7640.0340.2440.34
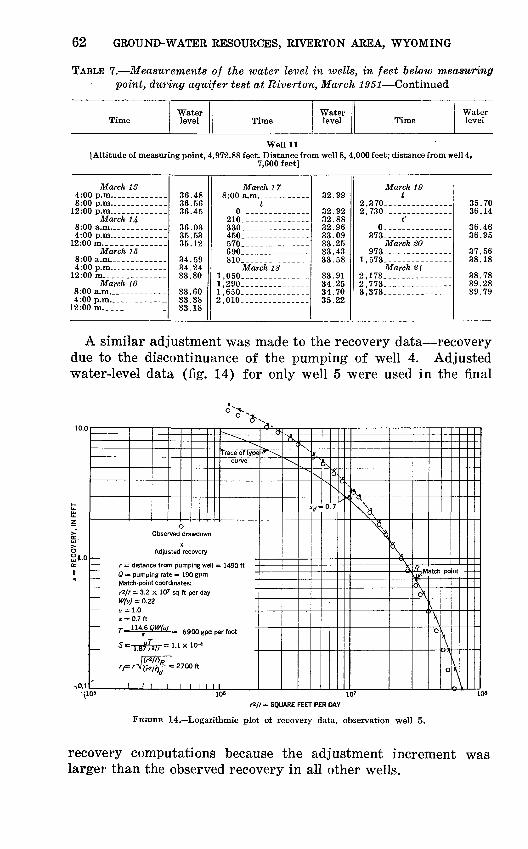
62 GROUND-WATER RESOURCES, RIVERTON AREA, WYOMING
TABLE 7. Measurements of the water level in wells, in feet below measuring point, during aquifer test at Riverton, March 1951 Continued
TimeWater level Time
Water level Time
Water level
Well 11[Altitude of measuring point, 4,972.88 feet. Distance from well 8, 4,000 feet; distance from well 4,
7,600 feet]
March 13 4:00 p.m.8:00 p.m.
12:00 p.m... ... __ ...
8:00 a.m.__. ... ..
12:00 m. _________March 16
8:00 a.m.. . _ ._ .4:00 p.m.
12:00 m. .. _ ... ....March 16
8:00 a.m... ...4:00 p.m.. .... ...
12:00 m.
36.4836.5636.45
36.03
35.12
34.5934.2433.80
33.6033.3833.18
March 1 7
0210330. __ ._---. __ .
570.-- ____ -. __ -690 ______ ---_-_810-- __ -.. __ ._
1,050. __ .--.-------l,290--------.-_ __ _1,650 __ --.-__- __ -2, 010. --------------
32.99
32.9232.8832.9633.0933.2533.4333.58
33.9134.2534.7035.22
March 19
2 3702,730 __ ------------
0373
March 20973
1,573-------------.-March 21
2 1732 7733,373
35.7036.14
36.4636.95
37.5638.18
38.7839.2839.79
A similar adjustment was made to the recovery data recovery due to the discontinuance of the pumping of well 4. Adjusted water-level data (fig. 14) for only well 5 were used in the final
v 2K
s= RECOVERY, IN FEET
P P P t; r ° c
~ 0 =
O
Observed drawdown
x Adjusted recovery
distance from pump ng wel pump ng rate = 190 gpm
Match-point coordinates: r2// = 3.2 x 10⁷ sq ft per dayW(u
.-
r=
T
1.0 0.7ft 114.60^
1.87>2// =
Rr2/t)o r^rnf%
^^^^^->.
Trace of typecurve
-= 6900 gpd per foot
1.1 X 10-4
= 2700 ft
d*
^^
si K
\
k.
x
.
^,
\
d =
^
S
0
8.
X \s
7\
\*
%.
^^\ K it
0^"'
&\cX,
atch
'\
0
po
\
0
nt
\b
05 106 1Q7 1
r*/t = SQUARE FEET PER DAY
FIGURE 14. Logarithmic plot of recovery data, observation well 5.
recovery computations because the adjustment increment was larger than the observed recovery in all other wells.
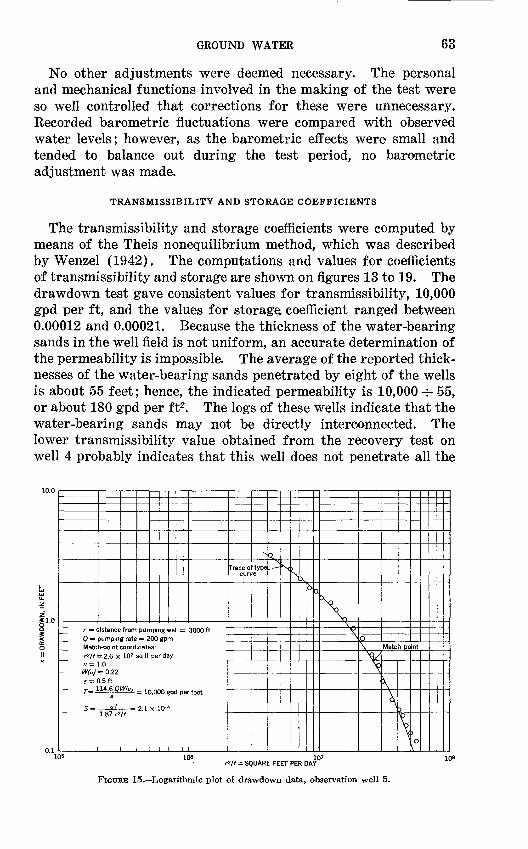
GROUND WATER 63
No other adjustments were deemed necessary. The personal and mechanical functions involved in the making of the test were so well controlled that corrections for these were unnecessary. Recorded barometric fluctuations were compared with observed water levels; however, as the barometric effects were small and tended to balance out during the test period, no barometric adjustment was made.
TRANSMISSIBILITY AND STORAGE COEFFICIENTS
The transmissibility and storage coefficients were computed by means of the Theis nonequilibrium method, which was described by Wenzel (1942). The computations and values for coefficients of transmissibility and storage are shown on figures 13 to 19. The drawdown test gave consistent values for transmissibility, 10,000 gpd per ft, and the values for storage coefficient ranged between 0.00012 and 0.00021. Because the thickness of the water-bearing sands in the well field is not uniform, an accurate determination of the permeability is impossible. The average of the reported thick nesses of the water-bearing sands penetrated by eight of the wells is about 55 feet; hence, the indicated permeability is 10,000-^- 55, or about 180 gpd per ft2. The logs of these wells indicate that the water-bearing sands may not be directly interconnected. The lower transmissibility value obtained from the recovery test on well 4 probably indicates that this well does not penetrate all the
r = distance from0 =Mater2/>u =
- W(u)
s =
- r=J
S =
pumping rate ti-point coord = 2.6 X 10' 1.0 = 0.22 ).5ft 14.6 QW(u)
s
1.87 rVt =
pun 2
nate sqft
= 1
2.1
nping well = OOgpm s: per day
),000 gpd pe
X 10-*
3000 ft
i foot
N
Trace of type curve
Q^-- N
N,X
£> c
\ v\ o\ Mate
^/NO
\
\
h pc
\
int
) 0\
106 10' r2// = SQUARE FEET PER DAY
FIGUHE 15. Logarithmic plot of drawdown data, observation well 5.
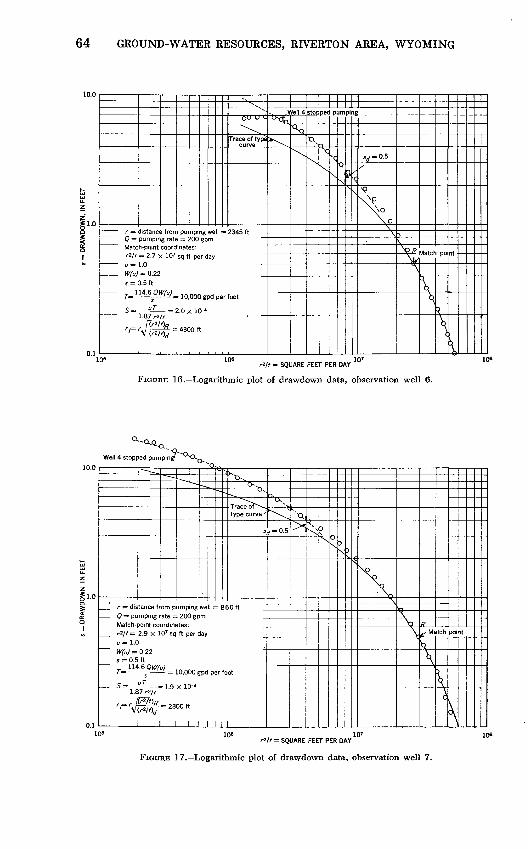
64 GROUND-WATER RESOURCES, RIVERTON AREA, WYOMING
Mate
W(u)s =
r=-
s =
distance frorr pumping rat h-point coord = 2.7 X 10?
1.0 = 0.22 15 ft L4.6 QW(uj
s "
-;^=
pu
inat sqfl
= 10
2.0 >
43C
Tipmgwell = OOgpm
ss: per day
,x "^ v* >
ou o o\^
Trace of type
000 gpd per foot
< 10-"
Oft
,V<>dr)
^^
fell 4
u-o
\
^
x
pec
<
^
1
j
P
X
\
jm
S
1" "
pin
* <
v=°-5
\o\\ 1
\>R
\
Jlatct
\
po
l
H 1
r*lf = SQUARE FEET PER DAY
FIGURE 16. Logarithmic plot of drawdown data, observation well 6.
-O.Q<
Well 4 stopped pumping^"0^,^
s = DRAWDOWN, IN FEET
o i- « b r = djs
0= puMatch-
u ~ IX^~ W(u) =
s = 0.5
~ ~.
tance from p mpmg rate = 3omt coordin 2.9 x 10' sq
0.22 ft .6 QW(u)
S- " T 191.87 rt/t
r/=rJ^$B. = 23
1 1
L.
ump 2CK tes ftp
0,0
X 1
00 f
~- ^
ng well = 3gpm
er day
DO gpd p
3-4
I |
---
= 8
erf
lx^
type curve '
s
50ft
DOt
^
rf-0-5
' Q.
> 0
^N ^ 3
\P
X- ^^
\V
\fffMi
\ \
tch
i
poi
\
nt
"--
106 JO'r*/t = SQUARE FEET PER DAY
FIGURE 17. Logarithmic plot of drawdown data, observation well 7.
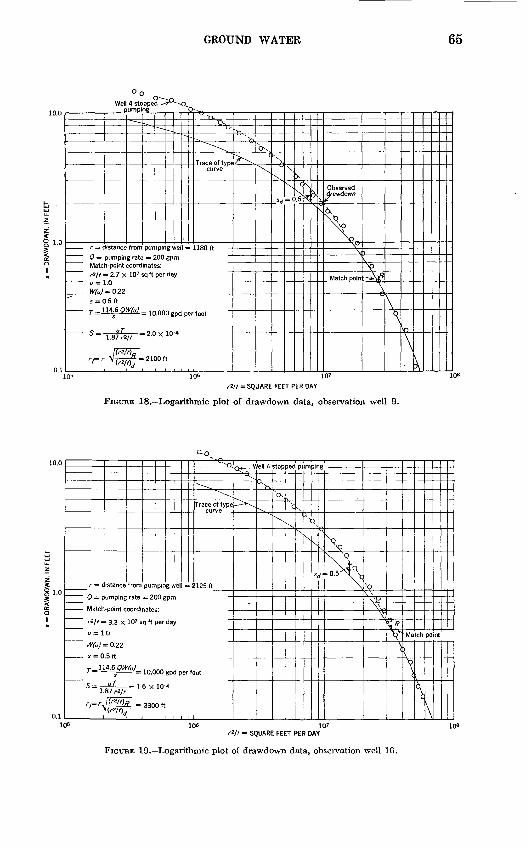
GROUND WATER 65
Well 4 stopp
1-
u_Z
Z
§ 1-0
IQ
II
0.1
r = <
0 = Mate
W(u) " s = (
/ =-
rr r... ,.
^ __
distance from pur
pumping rate = ! h-point coordinat = 2.7x 10'sqft 1.0 = 0.22
).5ft U&QW(u) = K
1.87 rz/f '
(r2/f)R ~ 21
L 1 _l_
" - -^.--
npmg well =
.00 gpm is: per day
,000 gpd pe
X 10-"
DO ft
Yv
^~^^~^
curve
rfoot
^v -
/"^-^
"ovC
\
srl
\
= (
XC
.5 ^
Observed drawdown
v *=
\
Match poin
^
^^Mu
\
\^
\k
rVf = SQUARE FEET PER DAY
FIGURE 18. Logarithmic plot of drawdown data, observation well 9.
O.Q
r=( istance from purr pir g well =
0 = pumping rate = 200 gpm
Match
0 = 1
W(u)
* = r)
r=J-
-point coordi
= 3.3 X 10? s
0
= 0.22
5ft
4.6 QW(u)_
uT ,1.87 i*lt "
nates:
q ft per day
10,C
6 x
330
100
10
Oft
gpd per
^-^^"~\
Trace of type,
2125ft
oot
-^
ell 4 stopped pumpin
' ' ^
^
a,
\x^
t
\
1
s^
«
\
\\\VP
N\
\,/?
V Ma
\
^
ch po
\\
nt
106 10'r*/t = SQUARE FEET PER DAY
FIGURE 19. Logarithmic plot of drawdown data, observation well 10.
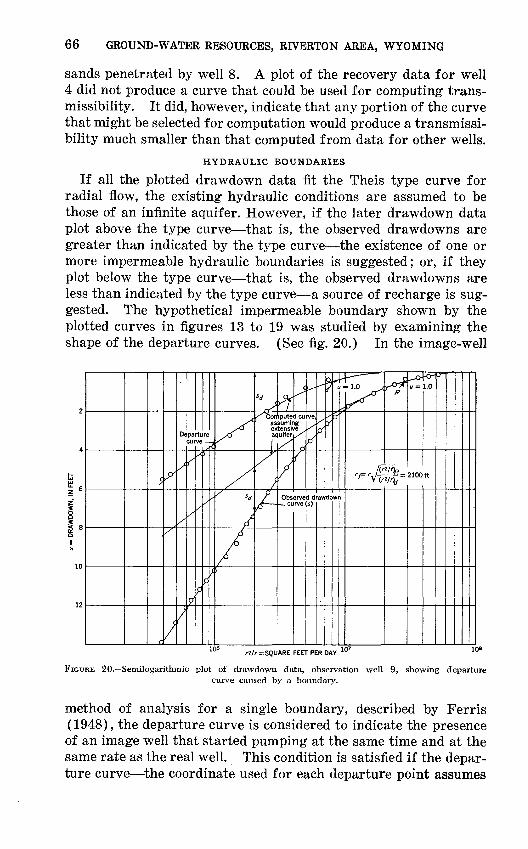
66 GROUND-WATER RESOURCES, RIVERTON AREA, WYOMING
sands penetrated by well 8. A plot of the recovery data for well 4 did not produce a curve that could be used for computing trans- missibility. It did, however, indicate that any portion of the curve that might be selected for computation would produce a transmissi- bility much smaller than that computed from data for other wells.
HYDRAULIC BOUNDARIES
If all the plotted drawdown data fit the Theis type curve for radial flow, the existing hydraulic conditions are assumed to be those of an infinite aquifer. However, if the later drawdown data plot above the type curve that is, the observed drawdowns are greater than indicated by the type curve the existence of one or more impermeable hydraulic boundaries is suggested; or, if they plot below the type curve that is, the observed drawdowns are less than indicated by the type curve a source of recharge is sug gested. The hypothetical impermeable boundary shown by the plotted curves in figures 13 to 19 was studied by examining the shape of the departure curves. (See fig. 20.) In the image-well
r2/f = SQUARE FEET PER DAY
FIGURE 20. Semilogarithmic plot of drawdown data, observation well 9, showing departurecurve caused by a boundary.
method of analysis for a single boundary, described by Ferris (1948), the departure curve is considered to indicate the presence of an image well that started pumping at the same time and at the same rate as the real well. This condition is satisfied if the depar ture curve the coordinate used for each departure point assumes
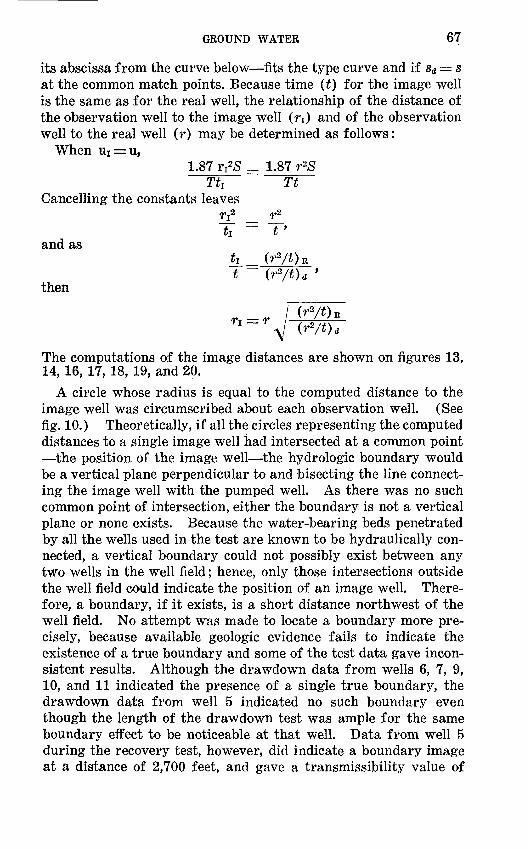
GROUND WATER 67
its abscissa from the curve below fits the type curve and if sd = s at the common match points. Because time (t) for the image well is the same as for the real well, the relationship of the distance of the observation well to the image well (rO and of the observation well to the real well (r) may be determined as follows :
When Ui = u,1.87 r!2£ _. 1.87 r2S
T^ Tt Cancelling the constants leaves
!j! _ if. ti ~ t '
and as
t ~ (r2/t). then
ty>
The computations of the image distances are shown on figures 13, 14, 16, 17, 18, 19, and 20.
A circle whose radius is equal to the computed distance to the image well was circumscribed about each observation well. (See fig. 10.) Theoretically, if all the circles representing the computed distances to a single image well had intersected at a common point the position of the image well the hydrologic boundary would be a vertical plane perpendicular to and bisecting the line connect ing the image well with the pumped well. As there was no such common point of intersection, either the boundary is not a vertical plane or none exists. Because the water-bearing beds penetrated by all the wells used in the test are known to be hydraulically con nected, a vertical boundary could not possibly exist between any two wells in the well field; hence, only those intersections outside the well field could indicate the position of an image well. There fore, a boundary, if it exists, is a short distance northwest of the well field. No attempt was made to locate a boundary more pre cisely, because available geologic evidence fails to indicate the existence of a true boundary and some of the test data gave incon sistent results. Although the drawdown data from wells 6, 7, 9, 10, and 11 indicated the presence of a single true boundary, the drawdown data from well 5 indicated no such boundary even though the length of the drawdown test was ample for the same boundary effect to be noticeable at that well. Data from well 5 during the recovery test, however, did indicate a boundary image at a distance of 2,700 feet, and gave a transmissibility value of
68 GROUND-WATER RESOURCES, RIVERTON AREA, WYOMING
6,900 gpd per ft, which is somewhat less than that obtained from wells 6, 7, 9,10, and 11. The data from well 4 during the recovery test were erratic and, because they did not conform with those from the other wells, could not be analyzed by similar methods. The data from well 4 indicated a transmissibility of less than 3,000 gpd per ft. The water-level data collected at well 6 during the test period showed much less effect from the recovery of well 4 than would be expected in view of the effects at well 5. The water levels in the other observation wells west of well 5 showed no response during the 48-hour recovery period, despite the fact that other evidence indicated the water-bearing beds penetrated by all wells are hydraulically connected. All available evidence being consid ered, the following conclusions have been reached: No single true plane boundary exists; the boundary effect indicated by the test data was caused by the lenticular nature of the water-bearing de posits ; and the hydraulic connection of water-bearing beds in the Riverton well field is imperfect across a north-south line passing between wells 5 and 6.
ESTIMATE OF WELL-FIELD PERFORMANCE
The test results provide a basis for understanding present well problems and for predicting the future performance of the well field. Inspection of the test data indicates a large lowering of the water level in wells close to the pumped well. Obviously, the pumping of two closely spaced wells at the same time results in a considerable loss of efficiency. An example of the interference that may be expected if wells are spaced at various intervals as suming idealized boundary conditions, is shown in figure 21. If the pumping lift of a well cannot be increased, the yield of the well will decrease. To obtain maximum efficiency from the Riverton well field, it would be necessary to decentralize pumping as much as possible and to space new wells as far apart as practical.
In making a prediction of well-field performance, it is neces sary to consider the effects of the previously described boundary condition. Although the existence of a true boundary was not established by the results of the aquifer test, the approximate location of the boundary described above was used in the prediction of the general performance of the Riverton well field. To compute the effects of pumping at great distances from the well field, the total discharge from the field is assumed to be from a centrally lo cated point within the well field. The drawdown effects with respect to the distance from the approximate center of the well field, if no source of recharge is intercepted, are shown in figure 22. Because of the uncertainties of the test results, figures 21 and 22
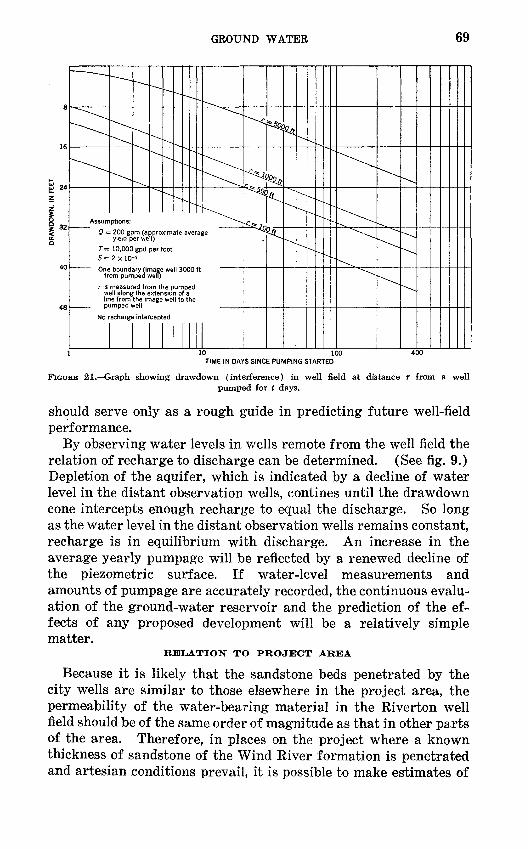
GROUND WATER 69
r is measured from the pumped well along the extension of a line from the image well to the pumped we
10 100 TIME IN DAYS SINCE PUMPING STARTED
FIGURE 21. Graph showing drawdown (interference) in well field at distance r from a wellpumped for t days.
should serve only as a rough guide in predicting future well-field performance.
By observing water levels in wells remote from the well field the relation of recharge to discharge can be determined. (See fig. 9.) Depletion of the aquifer, which is indicated by a decline of water level in the distant observation wells, contines until the drawdown cone intercepts enough recharge to equal the discharge. So long as the water level in the distant observation wells remains constant, recharge is in equilibrium with discharge. An increase in the average yearly pumpage will be reflected by a renewed decline of the piezometric surface. If water-level measurements and amounts of pumpage are accurately recorded, the continuous evalu ation of the ground-water reservoir and the prediction of the ef fects of any proposed development will be a relatively simple matter.
RELATION TO PROJECT AREA
Because it is likely that the sandstone beds penetrated by the city wells are similar to those elsewhere in the project area, the permeability of the water-bearing material in the Riverton well field should be of the same order of magnitude as that in other parts of the area. Therefore, in places on the project where a known thickness of sandstone of the Wind River formation is penetrated and artesian conditions prevail, it is possible to make estimates of
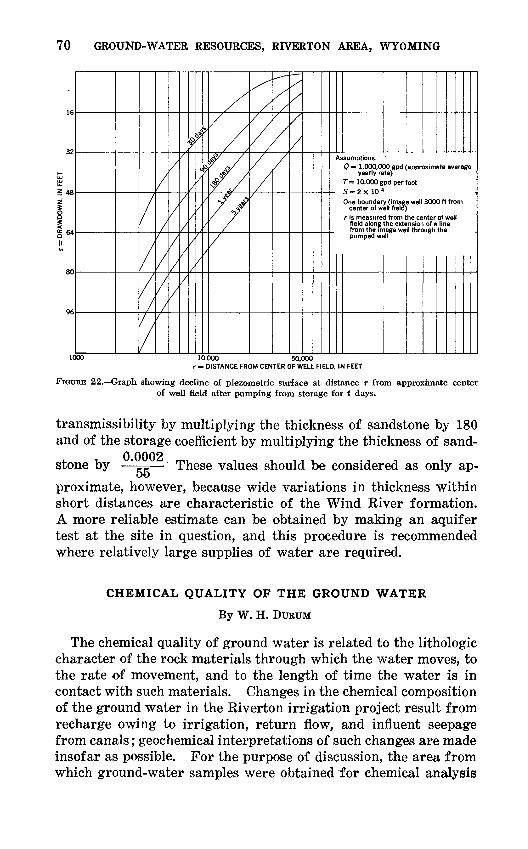
70 GROUND-WATER RESOURCES, RIVERTON AREA, WYOMING
16
32
fc u_ 5 48z"
I «*
80
96
/
/
[/
/
/
/
//I
7
/
/
/
/
7
?
/
X
tf
/'
/
/
/
X
X/
!^/
/
X
^
^ /
'X
^-
/
/7
/
/Assumptions: '
0 = 1,000,000 gpd (approximate average yearly rate)
T= 10,000 gpd per foot S = 2xlO~*
One boundary (image well 3000 ft from center of well field)
r is measured from the center of well field along the extension of a line from the image well through the pumped well
1000 10,000 50,000r m, DISTANCE FROM CENTER OF WELL FIELD, IN FEET
FIGURE 22. Graph showing decline of piezometric surface at distance r from approximate center of well field after pumping from storage for t days.
transmissibility by multiplying the thickness of sandstone by 180 and of the storage coefficient by multiplying the thickness of sand
stone by ' ' These values should be considered as only ap- ooproximate, however, because wide variations in thickness within short distances are characteristic of the Wind River formation. A more reliable estimate can be obtained by making an aquifer test at the site in question, and this procedure is recommended where relatively large supplies of water are required.
CHEMICAL QUALITY OF THE GROUND WATER
By W. H. DURUM
The chemical quality of ground water is related to the lithologic character of the rock materials through which the water moves, to the rate of movement, and to the length of time the water is in contact with such materials. Changes in the chemical composition of the ground water in the Riverton irrigation project result from recharge owing to irrigation, return flow, and influent seepage from canals; geochemical interpretations of such changes are made insofar as possible. For the purpose of discussion, the area from which ground-water samples were obtained for chemical analysis
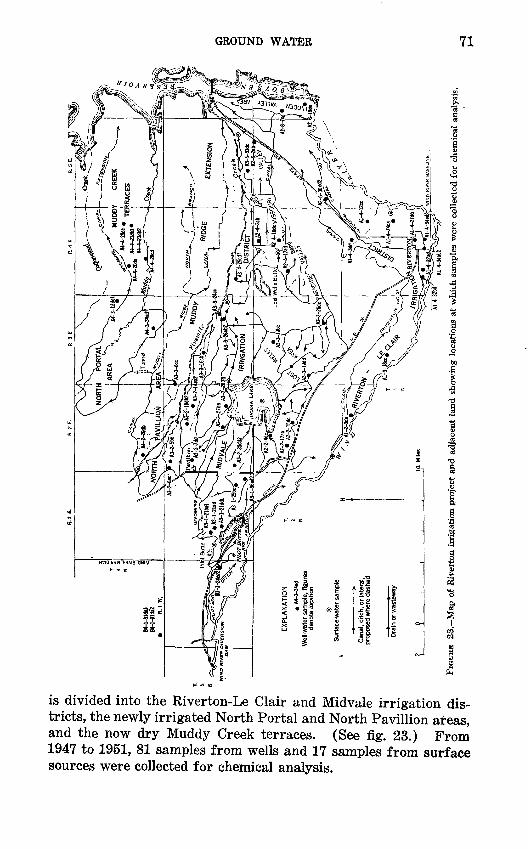
CQ
M
£>
§ ££
8 ^
3
§ o
d
FIG
UR
E 2
3.
Map
of
Riv
erto
n ir
riga
tion
pro
ject
and a
dja
cen
t la
nd s
how
ing
loca
tion
s at
whi
ch s
ampl
es w
ere
coll
ecte
d fo
r ch
emic
al a
naly
sis.
72 GROUND-WATER RESOURCES, RIVERTON AREA, WYOMING
QUALITY OF GROUND WATER
Dissolved solids in ground water result from the solvent action of percolating water on minerals in the soil and rocks. The water dissolves soluble salts and organic compounds in the soil and, assisted by the chemical action of other dissolved constituents, particularly carbon dioxide, decomposes rocks and minerals. Ce menting materials, such as carbonates and silicates, are particu larly susceptible to chemical decompostion. Changes in the chemical composition of the dissolved constituents of the ground water indicate to some extent the types of water-soluble minerals in the strata through which the water percolates. The range in concentration of several constituents in the samples of water from wells in irrigated tracts is given in table 8.
Sulf ate is the predominant anion in most samples of deep ground water in the Riverton project area. The exact nature of the chem ical alteration from a bicarbonate type of recharge water to a sodium sulfate type of ground water is not known. The results of analyses of some samples indicate that the explanation is simply that of accretion of soluble sulfates, followed by cation exchange. Undoubtedly, the accretion is an important factor in this area, as sulfate-bearing minerals are commonly present in the surficial de posits. Epsomite (MgSO4 -7H2O), probably deposited by ground water, is present in terrace deposits north of Muddy Creek, and water from one of the flowing wells near Muddy Creek has a rela tively high content of calcium and magnesium sulfate. However, the chemical characteristics of water from some sources, especially water that has a deficiency in bicarbonate ion, indicate a rather complex series of chemical reactions in the formation of the water type.
In areas where the depth to confined water is greater, the phe nomenon of cation exchange generally occurs as the water infil trates the soil and bedrock. When the water is in contact with sodium-bearing materials, the calcium and magnesium ions are replaced by sodium and the water is made correspondingly softer. The degree of the chemical replacement is indicated by analyses of samples from deep wells (Al-4-27dd, 34ad, and 34bb2) that sup ply the city of Riverton. The percent sodium exceeds 90, and the hardness is as low as 5 ppm. (See table 9.)
RIVERTON-LE CLAIR IRRIGATION DISTRICT
Chemical analyses were made of 17 samples from 11 wells that tap the alluvium in the bottom lands, the deposits that underlie the
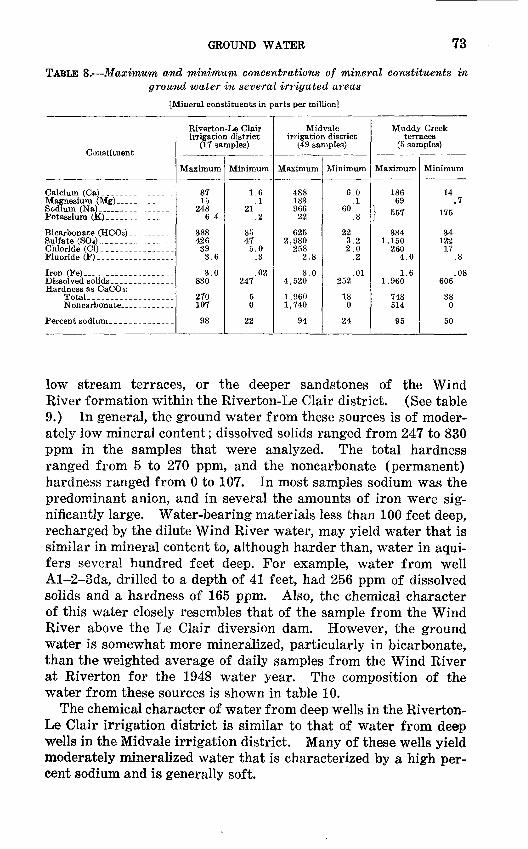
GROUND WATER 73
TABLE 8. Maximum and minimum concentrations of mineral constituents in ground water in several irrigated areas
[Mineral constituents in parts per million]
Constituent
Bicarbonate (HCOs) ........ .Sulfate (SO4)_-_------_------Chloride (Cl)-___- -------Fluoride (F) .. ._ _ .. .__..
Hardness as CaCOs:
Riverton-Le Clair irrigation district
(17 samples)
Maximum
87 15
248 6.4
388 426
39 3.6
3.0 830
270 107
98
Minimum
1.6 .1
21.2
85 47 5.0
.3
.02 247
5 0
22
Midvale irrigation district
(49 samples)
Maximum
488 183 96622
625 2,980
258 2.8
8.0 4,520
1,960 1,740
94
Minimum
6.0 .1
60.8
22 3.2 2.0
.2
.01 252
18 0
24
Muddy Creek terraces
(5 samples)
Maximum
186 69
} 557
334 1,150
260 4.0
1.6 1,960
748 514
95
Minimum
14 .7
175
34 122 17
.8
.08 606
38 0
50
low stream terraces, or the deeper sandstones of the Wind River formation within the Riverton-Le Clair district. (See table 9.) In general, the ground water from these sources is of moder ately low mineral content; dissolved solids ranged from 247 to 830 ppm in the samples that were analyzed. The total hardness ranged from 5 to 270 ppm, and the noncarbonate (permanent) hardness ranged from 0 to 107. In most samples sodium was the predominant anion, and in several the amounts of iron were sig nificantly large. Water-bearing materials less than 100 feet deep, recharged by the dilute Wind River water, may yield water that is similar in mineral content to, although harder than, water in aqui fers several hundred feet deep. For example, water from well Al-2-3da, drilled to a depth of 41 feet, had 256 ppm of dissolved solids and a hardness of 165 ppm. Also, the chemical character of this water closely resembles that of the sample from the Wind River above the Le Clair diversion dam. However, the ground water is somewhat more mineralized, particularly in bicarbonate, than the weighted average of daily samples from the Wind River at Riverton for the 1948 water year. The composition of the water from these sources is shown in table 10.
The chemical character of water from deep wells in the Riverton- Le Clair irrigation district is similar to that of water from deep wells in the Midvale irrigation district. Many of these wells yield moderately mineralized water that is characterized by a high per cent sodium and is generally soft.
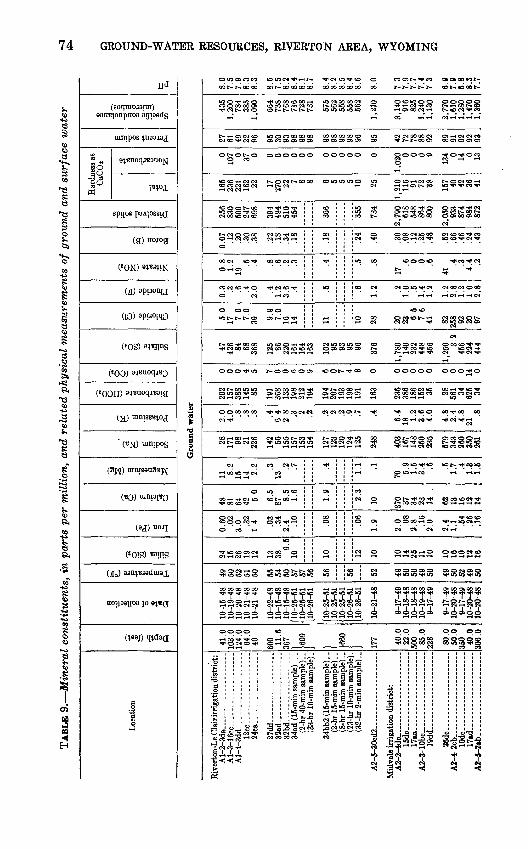
TABL
E 9.
Min
eral
con
stit
uent
s, i
n pa
rts
per
mil
lion
, an
d re
late
d ph
ysic
al m
easu
rem
ents
of
grou
nd a
nd s
urfa
ce w
ater
Loca
tion
1 £ 0
a 1 o fi
£ 3 0 P.
g H
O 02
V C
O
h- 1
1 _3
O
a s » s
"c? a 1 02
g a "o
H w 1 «
^^ o 0 a a
6
02 3i 1
0 0) 6
£ 'g
0 "S iSo
."2
"3 i5
Har
dnes
s as
CaC
O,
I
_g g a o
1 g t-i
g 11
8
2
02
w
Gro
und
wat
er
Riv
erto
n-L
e C
lair
irri
gatio
n di
stri
ct:
Al-
2-3
da.
.._ .
....
........
A1-
3-16
CC
-. .... ...........
Al-
4-3d
d_ _
.-...... .. .
12cc
-- ...
....
....
..24
ca...
..... .......
-
27
dd
..--
_ _
__
-...
__
_32
ad...
....-
-.
....
32bd
-_ ...
....
......
34ad
(15
-min
sam
ple)
-..
34bb
2 (1
5-m
in s
ampl
e). .
(32-
hr 2
-min
sam
ple)
..
A2-
5-30
cd2-
___.
...
....
....
....
Mid
yale
irri
gatio
n di
stri
ct:
A2-
2-4d
c ..
....
.. ............
15
dc .
.. ...... .. ...
...
17aa
. ...
....
....
..A
2-3
-10
bc
... .
....
....
....
..19
dd-_
. ...
....
....
....
..
26dc-
. ....... ..........
A2-
4-2c
b... ._
...-.
_.-
.-....
lOd
c...
... .
......
....
...
17«d
.... .
....
....
....
...
A2-
5-2»
b-- ............. ......
41.0
103.
012
4.0
64.0
40 600 11
.636
7
[609
] Ifif
ift
J 177 40
.022
.050
0 85.0
228 80
.050
.035
0 40.0
306.
0
10-1
5-48
10-1
9-48
10-2
0-48
10-2
1-48
10-2
1-48
10-2
2-48
10-1
5-48
10-1
5-48
(10-
25-5
1 U
O-2
5-51
[10-
26-5
1
10-2
5-51
10
-25-
5110
-25-
5110
-26-
5110
-26-
51
10-2
1-48
9-17
-49
10-1
8-48
10-1
8-48
10-1
9-48
9-17
-49
9-17
-49
10-2
0-48
9-17
-49
10-2
0-48
10-2
0-48
49 50 52 51 50 55 54 50 57 57 56 56 5fi
52 49 fiO 50 49 50 49 50 82 49 50
24 15 26 19 12 13 389.
510 10 12
10 10 14 25 11 10 10 16 10 12 16
0.60 .0
23.
0 .32
1.4 .03
.34
2.4 .1
0
.08
.06
1.9
2.0 .0
82.
8 .16
2.0
2.4
1.1 .5
4.2
6.1
6
48 81 64 42 5.0
6.5
87 8.5
1.6
1.9
2.3
10 370 37 34 23 14
.
62 13 16 12 14
11 8.2
15 14 2.2 .3
13.2 .7 .4 1.1 .1
70 5.9
1.5
3.4 .6 .5 1.7 .4 1.3
1.5
28 171 98 21 226
142 56 155
157
153
154
127
123
120
124
125
248
403
167
148
250
235
579
343
260
350
261
2.0
4.0 .8 .8 .8 .4 6.4
2.8 .3
.2 .2 .2
.2 .2 .9 .7
.4 6.4
18 1.2
3.6
4.0
4.8
2.4
4.8
21.8
202
157
388
145 85 191
368
133
198
212
194
194
207
193
198
191
163
236
386
186
152 35 28 561 34 625 34
0 0 0 4 5 7 0 0 6 0 9 6 0 7 4 8 0 0 0 0 0 0 0 0 0 14 0
47 426 84 68 368
125 86 220
161
164
163
102 95 93 95 96
376
1,78
014
023
244
845
6
1,25
0 3.2
456
224
444
5.0
17 7.0
7.0
39 9.9
7.0
16 14 11 10
28 20 23 6.5
7.6
41 82 258 92 20 97
0 3 .3 .6 .4
2 0 .4 1.2
3.6 .4 .5 .6
1.2 .2 1 0 5
1 4
1.2
1 ?,
2 8
1.2
1 0
2.8
0.8
1.2
19.5 .4 .8 .6 .2 .3 .4 .5 .8
17.6 .0 .0 .6
41.4 .3 4.4 .2
0.07 .1
2.2
0.3
0.3
8
.22
.18
.34
.18
.18
.24
.40
.30
.08
.12
.25
.48
.52
.66
.46
.24
.43
256
830
500
247
698
394
494
510
454
366
355
734
2,79
061
854
886
480
0
2,05
093
387
498
487
2
165
236
221
162 22 17 270 22 7 8 8 6 5 5 5 10
25
1,21
011
6 91 72 38 157 40 42 36 41
010
7 0 37 0 0 0 0 0 0 0 0 0 0 0 0 0
1,02
0 0 0 0 9
134 0 14 0 13
W 61 49 W,
96 95 30 93 98
98 98 98
98 98 98 96
95 4? n 78 88 92 89 91 92 92 93
435
1,20
078
438
51,
090
664
738
768
716
728
731
575
562
558
558
562
1,21
0
3,14
091
682
51,
240
1,13
0
2,77
01,
610
1,28
01,
470
1,36
0
8 0
7 5
7 9
8 3
8 3
8 fi
7 5
8 2
8.4
8 1
8 7
8.4
8 f,
8 5
8 4
8.6
8 0
7 3
7 9
7 7
7 4
7 3
fi 0
7 9
6 8
8 X
7.7
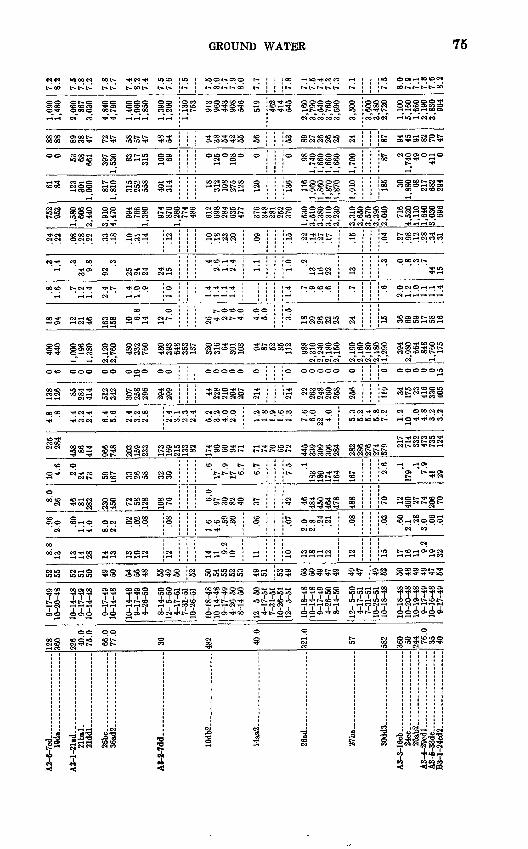
A2-6-7cd
- ._. .... ._
19da - ...
....
....
....
A3-l
-21a
d. ........... ..
......
21bal.
21dd
l._
. .... ..
.......
25bc----_ __ . ____ ..
.36ad2 -
A3-2
-7dd
.. ..-.-... ._.. .
10db
2...
... ..
....
.......
14aa
2 ...........
.....
26ad
. ....... .........
27ba . ....
30dd3_-..._ .............
A3-3-16cb.. . ....... .
....
.. .
24cc
. .-._. - ...
....
..26ab2_. ..
....
.......
.,.
A3-4-29cdl ... - ..
.A3
-6-33dc-. . ...
B3-l-24cd2 ..._ ....
.. _ .
28 360
226 40.0
75
.0
66.0
77.0
36 482 40.0
321.
0
57 582
360 50 244 76.0
35 40
9-17-49
10-20-48
10-14-48
9-17-49
10-14-48
9-17
-49
10-14-48
10-1
4-48
9-
17-4
9 4-26-50
8-14-50
12- 5-50
4-17
-51
7-31-51
10-26-51
10-1
8-48
10-1
4-48
9-
17-4
9 4-26-50
8-14
-50
12- 5-50
4-17-51
7-31-51
10-2
6-51
12-
5-51
10-18-48
[10-
14-4
8 9-
17-4
9 4-26-50
8-14
-50
12- 5-50
4-17
-51
7-31-51
10-25-51
10-1
8-48
10-1
8-48
10-20-48
10-19-48
9-17
-49
10-1
6-48
9-17
-49
52 55 52 51
50 49 50 54
55
48 55 49
50 52 50 54
55
52
53 49 51 53 49
53 50 49 47
49 49 47 49 5B 50 48 49 49 47 54
8.8
13 13 14
28 14 13 13
10 12 12 14 11 9.2
10 11 10
13 18
11
12 12 15 17 16 11 9.2
19 32
.96
2.0 .60
1.1
4.0
8.0
2.2 .02
.02
.08
.08
1.6
4.6 .59
.30
.06
.07
2.0
2.8 .24
.21
.08
no
.60
2.1 .28
3rt .06
.01
8.0
26 46 81
282
230
450 72 58
128
108 76 6.
097
30
82
40 37 42
46 484
450
464
478
488 70 12 460 27 74 206 70
10 4.6
2.0
24
73 59 167 33 26
58 32 30
.617
7.9
17 6.7
6.7
7.5 .1
183
180
174
164
167 2
0 .1 .17
941 29
235
284
458 86
414
966
7d.f
i
203
159
233
169
215
i qq 82 174 90
60 94
71 71 74 70 65 72
445
339
309
306
284
282
286
276
274
579 21
771
4332
473
735
124
4.8 .8
4.4
3.2
2.4
6.4
5.6
2.4
3.2
2.8
2.4
3.1
2.3
2.4
5.2
3.2
4.0
2.0
1.2
1.8
1 9
1.6
1.3
7.6
6.0
22 4.0
5.3
5.2
5.4
5.8
7.2
1.2
10 4.0
4.8
3.2
3.2
138
12fi 85 284
414
512
342
307
258
296
294
299 44 228
210
204
207
214
214 22 263
248
260
258
256
119 34 175 23 416
330
405
0 fi 0 0 0 0 0 0 10 0 0 0 0 0 0 0 0 0 0 0 0 0 0 0 0 0 0 0 0 0 0 15
4fm
440
1,000
196
1,38
0
2,120
2,760
480
332
760
480
393
648
353
137
320
316 64
301
103 94 87 52 35 112
988
2,310
2,240
2,18
0 2,150
2,190
2,160
2,180
2,180
1 9Q
ft
OQA
2QQf\
664
QAQ
1,76
017
5
18 94 12 21 46 163
158 10 6.
814 12 7.
0
26 4.7
2.0
7.6
4.0
4.0
5.0
3.5
18 29 26 22 25 24 "IB"
"
36 69 59 17 58 16
.8 1.6 .7 1.2
1.4
2.4 .7 1.4
1.0 .9 1.0
1.4
1.4
1.1
1.4
1.4 .7 .9 .6 .6 .7
~""(T
2.0
1.2
1.0
1.1
1.1
1.4
.3 1.4 .3
34 9.8
92.3
25 24 24 24 15
.42.
61.
12.
4
1.1
1.0 .2
13 16 22 13 .-
-
.0 .8 .3 .744 15
.24
.22
.08
.28
.22
.33
.18
.10
.31
.14
.12
.10
.18
.23
.20
.09
.15
.22
.14
.27
.17
.15
~~~M .27
.98
.12
.28
.34
.31
7521
953
1,58
060
62,440
3,910
4,47
0
994
766
1,380
974
876
1,280
774
486
612
698
284
635
477
376
348
281
252
370
1,53
03,510
3,380
3,310
3,23
0
3,31
03,650
3,570
3,390
2,040
716
4,520
1,110
1,64
03,
030
696
61 84 123
301
1,000
817
1,810
315
252
558
401
314 18 312
108
275
128
120
136
116
1,96
01,860
1,870
1,870
1,91
0
"I§5~
301,880 68 217
682
294
0 0 53 68 661
397
1,530 63 17 315
160 69 0
125 0
108 0 0 0 98
1,74
01,66
01,66
01,660
1,70
0
"If 2
1.74
0 49 0411 0
88 88 89 38 47 72 47 58 57 47 48 54 94 38 54 42 55 56 53 89 27 26 26 25 24 If 94 45 91 82 70 47
1,09
01,480
2,060
867
3,030
4,84
04,790
1,40
01,
060
1,85
0
1,390
1,20
0
1,13
0753
913
960
443
908
546
519
462
414
545
2,160
3,790
3,540
3,760
3,590
3,500
3,600
3,480
2,720
1,10
05,160
1,66
02,190
3,83
0964
7.2
8.2
7.5
7.8
7.2
7.8
7.7
7.4
8.2
7.4
7.5
7.6
7.5
7.5
8.0
7.7
7.9
8.0
7.7
"fi
7.1
7.5
7.4
7.3
7.3
7.1
TS 8.0
7.9
7.1
7.8
7.6
8.2
ex
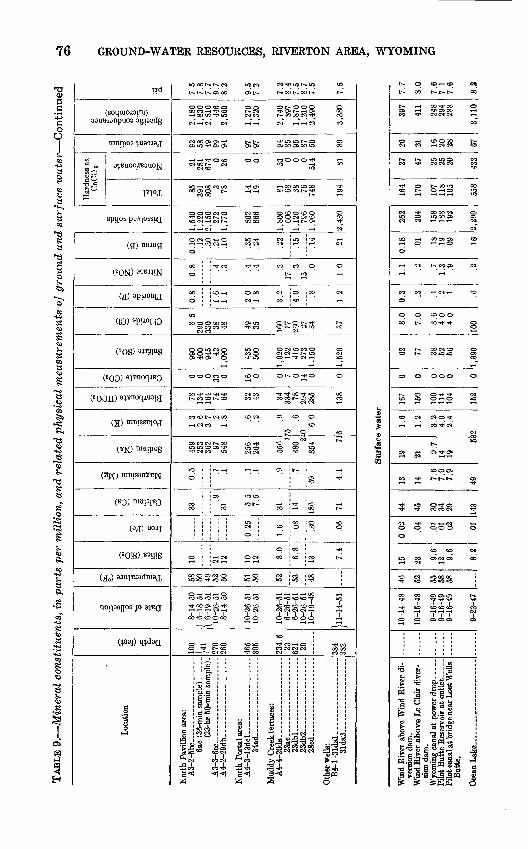
y.y.^ ^ ^If3i-i-
?a g ? % g-s?
i?i P* fij a * a q-S t-< =d
«M J |
rii s a *g: & « I v &
? ?I t li- rf».
«^ CO CO CO OO OO
00 cocoeo CO to os os
to * w » H- '*. o to to o>
ooo o o
O OOS O O
to coco
g §
OO CD rf*. I-1
Other wells:
B4-l-31dal -_.. .........
31da2... ................
CO CO 0000 tO h£>
' V -
I ! t T 2 §
i *
^
§ s-1 0
0
iCTc
CO ot00 0
0 C
en ^-g s
" *
to oc
o c
tO !-
co cr0 C
J- OC
s soo o<0 C
O5 tC
w "rf*g s
"en C"
g a x f>c t>S » >St& r^ rr r^ T*I TSJ rr fs»
|g| |f ||| '^n I "I " If !'1 |e' K
B'W.
W,i
tOtOtOCO OOS OS-^*hOOH-CO^ enen oo H- o
Cn
, - s
???? ?? 2SJS£Ot Ot Cn Ot Cn Ot Ot Ot Ot Cn Cn
Si Cn Cn Cn Ot Ot 4^- Ot C?t i tO OH- OtOOOGO
001 O
1 H- I O 1
!O Oi i to i i OOi i Cn i i i
H- i CO CO CO rf^ r H- -<ICn H- CO
i Cn en co
! o-q i CD i * H- i * i-* Cn
CO en tO tO en CO tO rf^CO Cn (^ Cn rfs-cOOiCnCn O os rf*> Oi OO -^ to CO eD
H- COIOH-
O5 CO tO Oi OO tO -<l OS CO
tO CO I H- CO -q CO CO ^ CO O5 <! O5 CO ^J kf^OOrf^^- COtO rf^hf^^^OO
^ O -4 O OOS O CO O O O
9EE8 IS !«EHtoSl CIS CO rf^ rf^COCOCO-<io*^o enco oooooooo
rf^ i CO t ' to t ' t ' o
O i to 00 O H- OS 00
CO CO rfi- rfi- CO ^. OO
! oh- I tO tOCO H- tO W H- h--Cn to rf*«en O t ' o to o
-<l t ' cja oo oooo -<l to t » N> Cn OSO§0 OiS OtOOOO
00 CO -<ICOOSOO t 't ' -<I OcOOO OS OO OO H- CO rf^ OOCOOOI 'Cn
en to Siooto
-vicncnrf^- ^"^ rf*cocoooto
H-H- ts5 H-l-' bO tOI-ibO
loOOOO-q OitO Cn>t.oOOOH- t ' -<I CO rf*- bi-<I Osrfi-t 'COOO
-qCnrf*.lO tOCn to^q-qoocn
Location
Depth (feet)
Date of collection
Temperature (°F)
Silica (SiOs)
Iron (Fe)
Calcium (Ca)
Magnesium (Mg)
Sodium (Na)
Bicarbonate (HCOs)
Carbonate (CO 3)
Sulfate (SOO
Chloride (Cl)
Fluoride (F)
Nitrate (NOs)
Dissolved solids
Total IsP g-
Noncarbonate " Bm
Percent sodium
Specific conductance (micromhos)
PH
i
ooc+
fla>
DNIKOAM 'V3HVHaiVM-QNtnOHO 92,
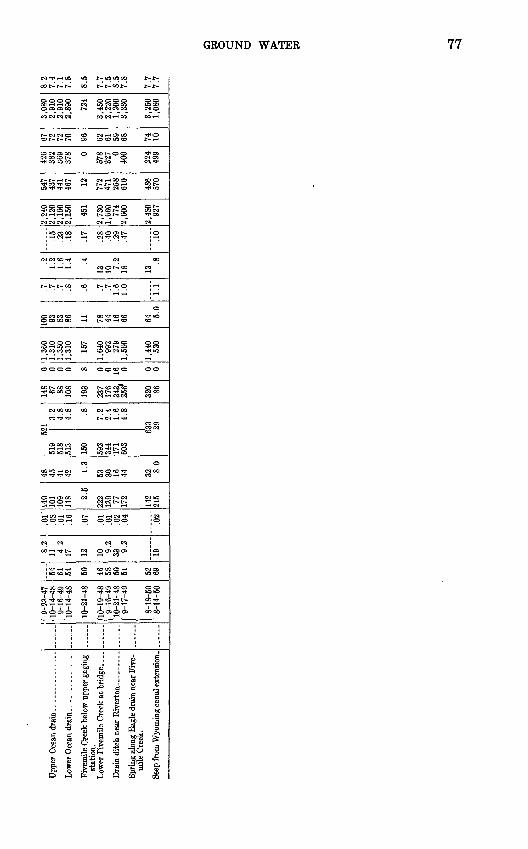
Upp
er O
cean
dra
in. .
-.--
--_-.
_-.
-
Low
er O
cean
dra
in........ ..
Five
mile
Cre
ek b
elow
upp
er g
agin
gst
atio
n.
Low
er F
ivem
ile C
reek
at b
ridg
e
Dra
in d
itch
near
Biv
erto
n ..
. _ .
Spri
ng a
long
Eag
le d
rain
nea
r Fiv
e-m
ile C
reek
.
Seep
from
Wyo
min
g ca
nal e
xten
sion
.
'. 9-
23-4
710
-14-
489-
16-4
9 10
-14-
48
10-2
1-48
(10-
19-4
8\
9-16
-49
10-2
1-48
9-17
-49
8-18
-50
8-14
-50
54 61
54 50 46 58
50 51 52 69
8.2
11 4.2
17 12 10 9.2
33 9.2
19
.or
.08
.01
.16
.07
.01
.01
.02
.04
.02
140
101
109
118 2.
5
222
139 77 172
142
215
48 45 41 42 1.3
53 30
16 44 32 8.0
551
951
8 51
3
150
592
344
171
603
6!13.
24.
8 4.
8 .8
7.2
2.4
1.6
4.8
33 29
148 67 88
108
193
237
176
343.
256*
320 86
0 0 0 0 8 0 0 16 0 0 0
1,36
01,
310
1,35
0 1,
310
157
1,64
099
2 27
91,
560
1,44
053
0
100 93 83
86 11 78 44
16 66 fi4 Ort 5.
0
.7 .7 .7
.8 .6 .7 .7
1.6
1.0
1.1
.2 1.2
1.6
1.4 .4
13 10 7.2
18 13.8
.15
.23
.18
.17
.28
.40
.29
.47
.10
2,24
02,
120
2,16
0 2,
150
451
2,73
01,
660
774
2,60
0
2,48
092
7
547
437
441
467 12 772
471
258
610
486
570
426
382
369
378 0
578
327 0
400
224
499
67 72 72
70 96 62 61
59 68 74 10
3,08
02,
910
2,91
0 2,
890
724
3,45
02,
220
1,20
03,
330
3,25
01,
080
8.2
7.4
7.1
7.8
8.5
7.7
7.5
8.5
7.8
7.7
7.7
s o
d

78 GROUND-WATER RESOURCES, RIVERTON AREA, WYOMING
90
60
70
60
50
40
30
20
10
~A3-3-24cc
-A2-2-l7ao
o 0UJ
30
RIVERTON -LE CLAIR IRRIGATION DISTRICT
20
10
A4-4-20da
A3-2-5bc
NORTH PAVILLION AND NORTH PORTAL AREAS AND MUDDY CREEK TERRACES
A3-2-26ad EXPLANATION
aSodium and
potassium
Magnesium
EZ3Calcium
Chloride and nitrate
Sulfate
Carbonate and bicarbonate
MIDVALE IRRIGATION DISTRICT
FIGURE 24. Principal mineral constituents of ground water.
The Burch well (Al-4-27dd), one of several deep wells that supplies the city of Riverton, yields satisfactory water for domestic use. The analysis of this water shows 394 ppm of dissolved solids and a hardness of 17 ppm.
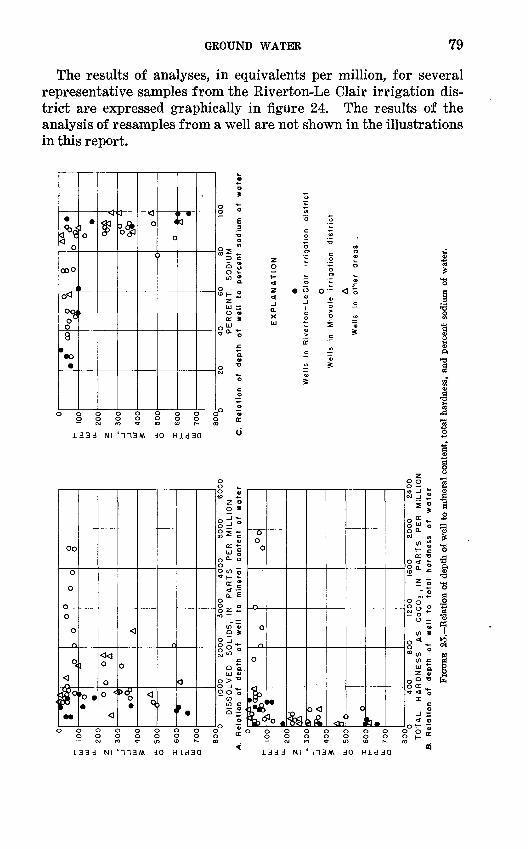
W
100
UI "
20
0
z j
30
0
^
40
0
S
500
*
60
0
g
70
0
son
f 0 o
A
$
.oft
^>A
i)A
A
°
o
OA
o
A
o3
0 A
D
§
6000
DIS
SO
LV
ED
S
OL
IDS
, IN
P
AR
TS
P
ER
M
ILL
ION
A
. R
ela
tion
of
de
pth
o
f w
ell
to
min
era
l co
nte
nt
of
wate
r
w
100
UJ
^
20
0z j
30
0
£J
40
0
S
50
0
^
600
g
70
0
80
0
.8
®°°
^
^8
*~
\a
****
0
rf>A
0
^ 0°
A<&
> oi
a JM S
'
20
4
0
60
80
10
0P
ER
CE
NT
S
OD
IUM
C
. R
ela
tion
of
depth
of
well
to
perc
ent
sodiu
m
of
wa
ter
EX
PL
AN
AT
ION
We
lls
in
Riv
ert
on-L
e C
lair
irrigation
dis
tric
t
Wells
in
M
idvale
irrig
atio
n
dis
tric
t
Wells
in
o
the
r a
rea
s..
2400
TO
TA
L
HA
RD
NE
SS
A
S
CoC
03
,IN
P
AR
TS
P
ER
M
ILLIO
N
B.
Re
lati
on
o
f d
epth
o
f w
ell
to
tota
l h
ard
nes
s o
f w
ate
r
FIG
UR
E 2
5.
Rel
atio
n o
f de
pth
of w
ell
to m
iner
al c
onte
nt,
tota
l ha
rdne
ss,
and
perc
ent
sodi
um o
f w
ater
.
u
I0°
UI "
20
0
Z j
30
0
_J
^
40
0
£
50
0
jt
60
0
S
70
0
BD
D
0^ I
B-o
Jb
A
^-
9» °
TT »
O0
0D
0°°
!-:
03
e-t-
*
8
2.
CD
00
05^
5' 2
CD
_
w
Q5
H»
o t3
'-fe
p g*
B
! i
. .
CD
O §
gs if
f i
f
tOO
i|^
a- y
o O r§
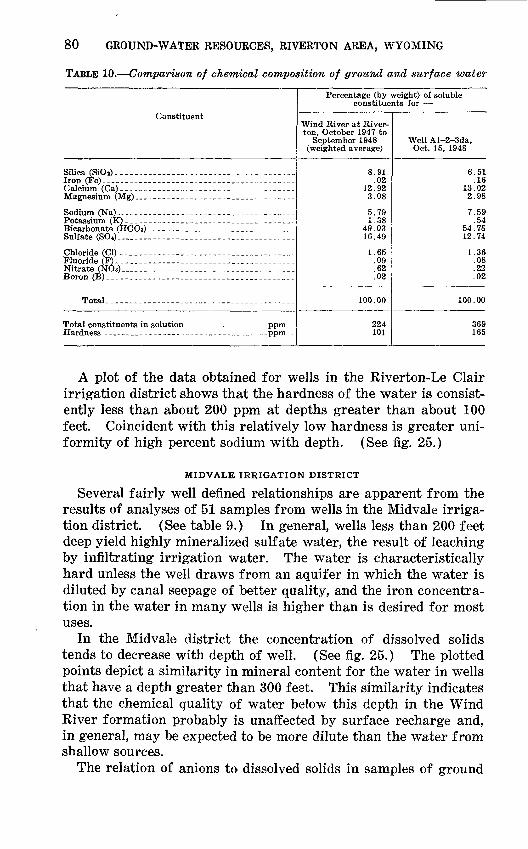
80 GROUND-WATER RESOURCES, RIVERTON AREA, WYOMING
TABLE 10. Comparison of chemical composition of ground and surface water
Constituent
Silica (SiOj) . __ . ___ . __ ....... ____ .........Iron (Fe)-_- - _ _ _.- ... _ _ .... .. .
Sulfate (SO 4)
Chloride (Cl) . __ . .. _ - ____ . _ ...........
Nitrate (NOa). _ . _ ------ __ ........ _ ---------Boron (B) -- ------
Total.. __ - . _ - ----- _-.. -- -
Percentage (by weight) of soluble constituents for
Wind River at River- ton, October 1947 to
September 1948 (weighted average)
8.91 .02
12.92 3.08
5.79 1.38
49.03 16.49
1.65 .09 .62 .02
100.00
224 101
Well Al-2-3da, Oct. 15, 1948
6.51 .16
13.02 2.98
7.59 .54
54.78 12.74
1.36 .08 .22 .02
100.00
369 165
A plot of the data obtained for wells in the Riverton-Le Glair irrigation district shows that the hardness of the water is consist ently less than about 200 ppm at depths greater than about 100 feet. Coincident with this relatively low hardness is greater uni formity of high percent sodium with depth. (See fig. 25.)
MIDVALE IRRIGATION DISTRICT
Several fairly well defined relationships are apparent from the results of analyses of 51 samples from wells in the Mid vale irriga tion district. (See table 9.) In general, wells less than 200 feet deep yield highly mineralized sulf ate water, the result of leaching by infiltrating irrigation water. The water is characteristically hard unless the well draws from an aquifer in which the water is diluted by canal seepage of better quality, and the iron concentra tion in the water in many wells is higher than is desired for most uses.
In the Midvale district the concentration of dissolved solids tends to decrease with depth of well. (See fig. 25.) The plotted points depict a similarity in mineral content for the water in wells that have a depth greater than 300 feet. This similarity indicates that the chemical quality of water below this depth in the Wind River formation probably is unaffected by surface recharge and, in general, may be expected to be more dilute than the water from shallow sources.
The relation of anions to dissolved solids in samples of ground
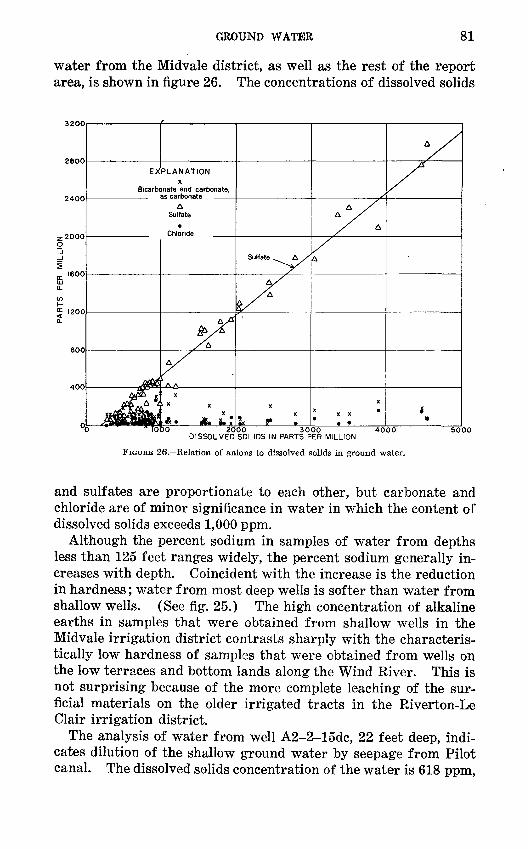
GROUND WATER 81
water from the Midvale district, as well as the rest of the report area, is shown in figure 26. The concentrations of dissolved solids
EXPLANATIONX
Bicarbonate and carbonate, as carbonate
Sulfate
Chloride
J$&
J$jJ£.
5?\
X
i x xX
«tl v , « iU x
Sulfate ^^ A ./
t/f
X
X
2x r
x^A
X
* X X
aXs
6
1000 2000 3000 4000 DISSOLVED SOLIDS IN PARTS PER MILLION
FIGURE 26. Relation of anions to dissolved solids in ground water.
and sulfates are proportionate to each other, but carbonate and chloride are of minor significance in water in which the content of dissolved solids exceeds 1,000 ppm.
Although the percent sodium in samples of water from depths less than 125 feet ranges widely, the percent sodium generally in creases with depth. Coincident with the increase is the reduction in hardness; water from most deep wells is softer than water from shallow wells. (See fig. 25.) The high concentration of alkaline earths in samples that were obtained from shallow wells in the Midvale irrigation district contrasts sharply with the characteris tically low hardness of samples that were obtained from wells on the low terraces and bottom lands along the Wind River. This is not surprising because of the more complete leaching of the sur- ficial materials on the older irrigated tracts in the Riverton-Le Clair irrigation district.
The analysis of water from well A2-2-15dc, 22 feet deep, indi cates dilution of the shallow ground water by seepage from Pilot canal. The dissolved solids concentration of the water is 618 ppm,
82 GROUND-WATER RESOURCES, RIVERTON AREA, WYOMING
the hardness is 116 ppm, and the chemical quality is satisfactory for general domestic use.
Well A3-2-26ad, 321 feet deep, is near the north edge of Ocean Lake. The water from this well contains 1,530 ppm dissolved solids, of which 988 ppm is sulf ate, and is more highly mineralized than water from most other wells that are deeper than 300 feet. Although the well reportedly is cased to a depth of 296 feet, there is a possibility that the casing is leaking and that more highly mineralized water from shallow horizons is entering the well.
OTHER TRACTS
In areas other than the Midvale and the Riverton-Le Glair irri gation districts, only a few wells were available for sampling. Five samples were obtained from the North Pavillion area, two samples from the North Portal area, and five samples from the Muddy Creek terraces. (See fig. 23 and table 9.) Most of these samples were obtained after the main Wyoming canal had been ex tended and therefore represent comparatively new supplies.
In the North Pavillion area a field permeability test was made by pumping temporary well A3-2-6ac, 41 feet deep. As shown in the following abridged analysis (table 11), the total mineralization particularly the hardness (calcium and magnesium) and sulfate increased significantly from the sample collected 36 minutes after pumping began to the sample collected 23 hours and 50 min utes after pumping began; sodium increased to a somewhat lesser extent than hardness and sulfate. The data indicate possible in duced infiltration of water from an aquifier that contains water having greater concentration of calcium sulfate. The data indicate possible induced infiltration of water from an aquifer that contains water having greater concentration of calcium sulfate.
TABLE 11. Results of chemical analysis of two samples of water from wellA3-2-6ac
ConstituentTime from start of pumping
36 min
253 391 400
1,220 58
23 hr 50 min
362 808 945
2,150 49
The water from well A3-3-6cc, 270 feet deep, had a moderately low mineral content (272 ppm) but was reported unsatisfactory for drinking because of the strong hydrogen sulfide odor and the precipitation of sulfur on standing. Although no gas analyses
GROUND WATER 83
were made, the problem of hydrogen sulfide in water supplies, par ticularly in deep wells, was observed for new supplies in other tracts. Some preliminary investigations by the writer have indi cated that a commercial unit of exchange resins is a possible means for the removal of hydrogen sulfide from water of otherwise good quality; however, aeration of the water probably will be a satis factory method if the supply can be protected from freezing. The water from well A3-3-6cc had almost no hardness, presumably as a result of base-exchange reactions.
In the North Portal area, samples from wells A4-3-13dcl, 465 feet deep, and A4-3-34ad, 305 feet deep, were similar in total min eralization and in chemical composition. The hardness in the water was very low; and although the water was somewhat higher in sulf ate and fluoride than is desirable, it was of acceptable quality for domestic use. It is of interest to note that the concentration and composition of the water from well A4-3-34ad were similar to those of the water from several wells of comparable depth in the Midvale irrigation district.
The analyses of five samples from shallow and deep wells in the Muddy Creek terraces are indexes of the quantities and composi tion of mineral substances that can be expected in supplies from this area. Deep wells, such as A4-4-20da and A4-4-23dbl, yield water having the softness and the high percent sodium that char acterize water from deep wells in other parts of the project area. (See table 9.) The rapidity of the alteration from a calcium bi carbonate irrigation water to a sodium sulfate ground water sev eral times more concentrated is indicated in the results of analyses of samples from observation wells A4-4-23ac and A4-4-23db2. The analyses of water from these wells, which are on the experi mental farm, further indicate that a water supply obtained at shallow depth from terrace deposits in a newly irrigated area is likely to be appreciably mineralized during the early life of the well. However, the general degree of mineralization is somewhat less than that of water at shallow depths in the bedrock.
SEASONAL FLUCTUATIONS
It was recognized early in the study that irrigation water prob ably influenced significantly the quality of ground water in per meable materials adjacent to the canals. So that these seasonal changes could be observed, the water in three shallow wells (A3- 2-7dd, A3-2-14aa2, and A3-2-27ba) was sampled periodically; well A3-2-27ba was selected because the immediate area was waterlogged. The analytical results for selected constituents are given in table 12.
84 GROUND-WATER RESOURCES, RIVERTON AREA, WYOMING
TABLE 12. Comparison of seasonal fluctuations of chemical constituents in water from selected wells
Well no.
A3-2-7dd __________ _
A3-2-14aa2 _ _. ____
A3-2 27ba_____ ________
Date
10-14-48 9-17-49 4-26-50 8-14-50
12- 5-50 4-17-51 7-31-51
10-26-51
10-14-48 9-17-49 4-26-50 8-14-50
12- 5-50 4-17-51 7-31-51
10-26-51 12- 5-51
10-14-48 9-17-49 4-26-50 8-14-50
12- 5-50 4-17-517-31-51
10-25-51
Ca+Mg Na+K HCOj SO 4Dissolved
solids
Parts per million
105 84
186 140 106
114 38 9947 44
50
667 630 638 642 655
205 162 236 173 171 218 135 84
9364 96 71 72 76 72 67 73
345 331 310 284 287 291 281 280
307 258 296 294 299
228 210 204 207 214
214
263248 260 258 256
480 332 760 480 393 648 353 137
316 64
301 103
94 87 52 35
112
2,310 2,240 2,180 2,150 2,190 2,160 2,180 2,180
994 766
1,380 974 876
1,280 774 486
698 284 635 477 376 348 281 252 370
3,510 3,380 3,310 3,230 3,310 3,650 3,570 3,390
Relation to irrigation
season
After At peak. Before. At peak. After. Before. At peak. After.
After. At peak. Before. At peak. After. Before. At peak. After. After.
After. At peak. Before. At peak. Aft<er. Before. At peak. After.
Dissolve! solids (sum)
Dissolved solids (residue)
.Well A3-Z-Z7bc
1949 1950 1951 1952
FIGURE 27. Seasonal fluctuations of dissolved solids and sulfate in water from selected wells.
GROUND WATER 85
The more significant changes occurred in the water in wells A3-2-7dd and A3-2-14aa2 as a direct result of dilution by irriga tion water from the main Wyoming canal or its laterals. The changes in dissolved solids and sulfate are shown graphically in figure 27. Largely through reduction in the content of calcium and magnesium sulfate, the dissolved solids in water from well A3-2-14aa2, 40 feet deep, decreased from 698 ppm in the post- irrigation season of 1948 to 284 ppm in the peak-irrigation season of 1949, then increased to 635 ppm prior to the 1950 irrigation season. The seasonal fluctuations are less pronounced for the samples collected in 1950 and 1951 and show a slight downward trend in concentration. By comparison, much greater fluctuations occur in the mineral content of samples collected in 1950 and 1951 from well A3-2-7dd, 36 feet deep. The residents of the area detect the increase in hardness of their supplies during the winter season.
Changes in the dissolved solids and sulfate in samples from well A3-2-27ba are not as pronounced. Evidently no dilution effect is apparent during the irrigation season because the ground-water level is already high in this immediate area. (See fig. 27.) It is obvious from these results that a long period of flushing action by surface water will be required to improve permanently the quality of the shallow ground water in waterlogged areas even if water levels are lowered. Periodic sampling and water-level measure ments of key wells should be continued as a part of the hydrologic studies in the area.
QUALITY OF WATER IN RELATION TO DRAINAGE
A total of 17 samples was collected from 13 surf ace-water sources in connection with this study. (See fig. 23 and table 9.)
The total concentration of dissolved solids in the Wind River at the Wind River diversion dam was only 262 ppm and is an index of the high quality of the irrigation supply. Occasional checks of the water have indicated that the total mineralization of the canal water remains essentially unchanged in its course through the area.
The chemical character of the water in Fivemile Creek and drains, however, changes significantly in a downstream direction. (See table 9.) A sample of water from upper Fivemile Creek (SW^ sec. 24, T. 4 N., R. 1 E.), which was collected at a time when the main Wyoming canal water was closed off, had a rela tively low mineral content of 451 ppm of dissolved solids. Return flows from irrigation enter Fivemile Creek downstream from this point and effect an increase in the dissolved-solids content to 2,730 ppm near the confluence with the Wind River. This sixfold in crease in dissolved solids is evidence of the large amount of soluble
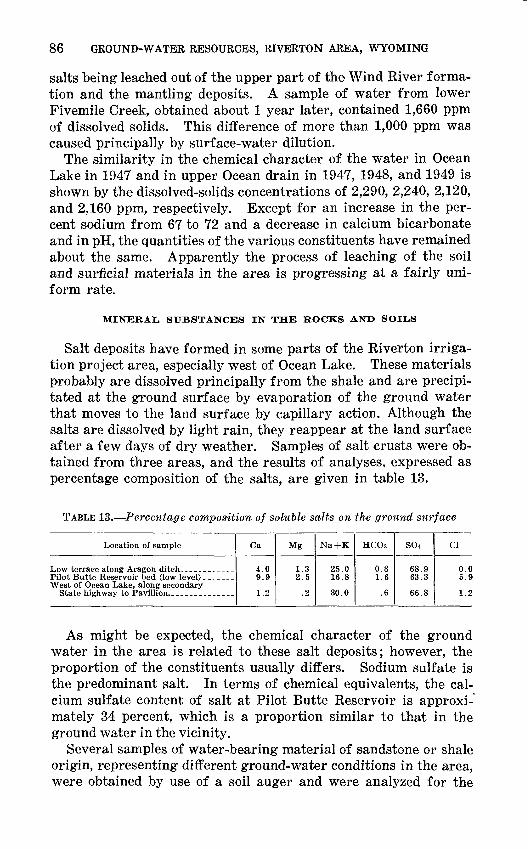
86 GROUND-WATER RESOURCES, RIVERTON AREA, WYOMING
salts being leached out of the upper part of the Wind River forma tion and the mantling deposits. A sample of water from lower Fivemile Creek, obtained about 1 year later, contained 1,660 ppm of dissolved solids. This difference of more than 1,000 ppm was caused principally by surface-water dilution.
The similarity in the chemical character of the water in Ocean Lake in 1947 and in upper Ocean drain in 1947, 1948, and 1949 is shown by the dissolved-solids concentrations of 2,290, 2,240, 2,120, and 2,160 ppm, respectively. Except for an increase in the per cent sodium from 67 to 72 and a decrease in calcium bicarbonate and in pH, the quantities of the various constituents have remained about the same. Apparently the process of leaching of the soil and surficial materials in the area is progressing at a fairly uni form rate.
MINERAL SUBSTANCES IN THE ROCKS AND SOILS
Salt deposits have formed in some parts of the Riverton irriga tion project area, especially west of Ocean Lake. These materials probably are dissolved principally from the shale and are precipi tated at the ground surface by evaporation of the ground water that moves to the land surface by capillary action. Although the salts are dissolved by light rain, they reappear at the land surface after a few days of dry weather. Samples of salt crusts were ob tained from three areas, and the results of analyses, expressed as percentage composition of the salts, are given in table 13.
TABLE 13. Percentage composition of soluble salts on the ground surface
Location of sample
West of Ocean Lake, along secondary
Ca
4.09 9
1.2
Mg
1.32.5
.2
Na+K
25.016.8
30.0
HCOs
0.81.6
.6
SO4
68.963.3
66.8
Cl
0.05.9
1.2
As might be expected, the chemical character of the ground water in the area is related to these salt deposits; however, the proportion of the constituents usually differs. Sodium sulfate is the predominant salt. In terms of chemical equivalents, the cal cium sulfate content of salt at Pilot Butte Reservoir is approxi mately 34 percent, which is a proportion similar to that in the ground water in the vicinity.
Several samples of water-bearing material of sandstone or shale origin, representing different ground-water conditions in the area, were obtained by use of a soil auger and were analyzed for the
GROUND WATER 87
water-soluble constituents. (See table 14.) The two samples from sandstone-derived soils in nonirrigated tracts in the NE*4 SWi/i sec. 16, T. 3 N., R. 2 E., were slightly less mineralized than samples from other sources in the area. The water-soluble substances, composed principally of calcium carbonate, totaled less than 0.10 percent of the dry weight of the soil. On the other hand, the total soluble salt content of a sample of shale-derived soil in an untilled area was 0.14 percent. It also was composed principally of calcium carbonate.
Samples of well-drained soil from irrigated tracts in the NEl/4 SEi/4 sec. 7, T. 3 N., R. 2 E., contained higher concentrations of soluble salts than samples of untilled soil, but the carbonates of calcium plus magnesium also were prominent in these samples. In both samples from waterlogged areas in Paradise Valley (SEi/4 SE14 sec. 18, T. 2 N., R. 4 E.) and near Pavillion (SE^SWi/4 sec. 2, T. 3 N., R 2 E.), the total salt content exceeded 0.5 percent, and the percentages of sodium plus potassium and of sulfate were more prominent.
Kearney and Scofield (1936) and other investigators have estab lished arbitrary limits for separating saline and nonsaline soils. They consider that plants are affected when the salt content of the soil exceeds 0.1 percent. It is apparent from the results given in table 14 that harmful concentrations of salts are being deposited in soils in poorly drained areas.
Chemical analyses of acid-soluble constituents in both unweath- ered and weathered shales were made in order to determine further those mineral substances possibly affecting the character of water that percolates from the ground surface. (See table 14.) The shales are composed principally of iron and aluminum silicate and contain appreciable quantities of calcium, magnesium, sodium, and potassium. Considerable effervescence resulted from the addition of the hydrochloric acid; apparently an appreciable quantity of carbonates is present. The sulfate content of both samples is low. These results do not provide the evidence necessary to demonstrate the source of sulfate in the water; moreover, because only a few samples were collected, the results given in table 14 may not neces sarily be representative of surface or subsurface conditions.
Typical chemical analyses of soil profiles in the Midvale irriga tion district have been extracted from the large volume of data made available by the United States Bureau of Reclamation at Riverton to illustrate the various soil conditions in one segment of the project. The terms used in describing soil conditions and soil classes in table 15 are defined by the United States Regional Salin ity Laboratory (1947). Although most of the soils examined were
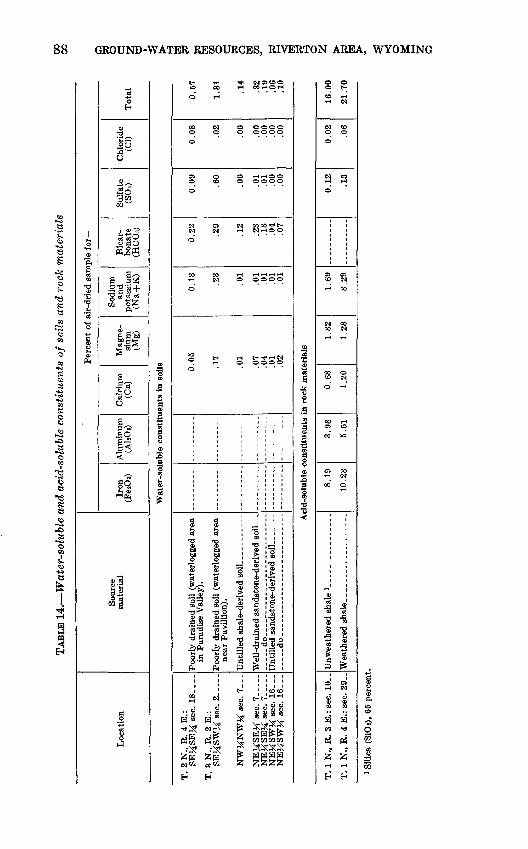
TAB
LE 1
4.
and
acid
-sol
uble
const
ituen
ts o
f so
ils
and
rock
ma
teri
als
Loc
atio
nS
ourc
e m
ater
ial
Per
cent
of
air-
drie
d sa
mpl
e fo
r
Iron
(Fe2
O3)
Alu
min
um
(AhO
,)C
alci
um
(Ca)
Mag
ne
sium
(M
g)
Sod
ium
an
d po
tass
ium
(Na+
K)
Bic
ar
bona
te
(HC
Ch)
Sul
fate
(S
04)
Chl
orid
e (C
l)§
Tota
l £ S
W
ater
-sol
uble
con
stit
uent
s in
soi
ls
[j> uJ
T.
2 N
., R
. 4
E.:
S
EM
SE
Mse
c. 1
8 ....
T.
3 N
., R
. 2
E.:
S
EM
SW
M s
ec.
2 .....
NW
MN
W}£
sec
. 7 ...
NE
^S
EJi
sec
. 7 .
....
NE
MS
E^ s
ec.
7 .....
NE
^S
WM
sec.
16 ..
. N
EM
SW
M s
ec.
16 ...
Poo
rly
drai
ned
soil
(wat
erlo
gged
are
a in
Par
adis
e V
alle
y).
Poo
rly
drai
ned
soil
(w
ater
logg
ed a
rea
nea
r P
avil
lion
).
_ ..d
o. - - - --.
.
.____do_ _
__.... -_
-__ -
0.05
.17
.01
.07
.04
.01
.02
0.1
3
.23
.01
.01
.01
.01
.01
0.22
.29
.12
.23
.13
.04
.07
0,0
9
.60
.00
.01
.01
.00
.00
00
N
O
OOOO o o o oooo
o
ER
RESOURCES, RIVE
t-
T-I «*
NOS«OO
10
CO
*H
COrHOlH
O
1H
tdA
cid-
solu
ble
cons
titu
ents
in
rock
mat
eria
ls
^
T.
1 N
., R
. 3
E.:
sec
. 1
0..
T.
1 N
., R
. 4
E.:
sec
. 29
..
Unw
eath
ered
sha
le i
8.1
9
10.2
3
3.9
8
5.51
0.6
8
1.20
1.3
2
1.28
1.6
9
3.29
0.1
2
.13
0.0
2
.06
7"
16.0
0
^
21.7
0
Sd y
1 Sil
ica
(SiO
s),
65 p
erce
nt.
3 g
£ 0
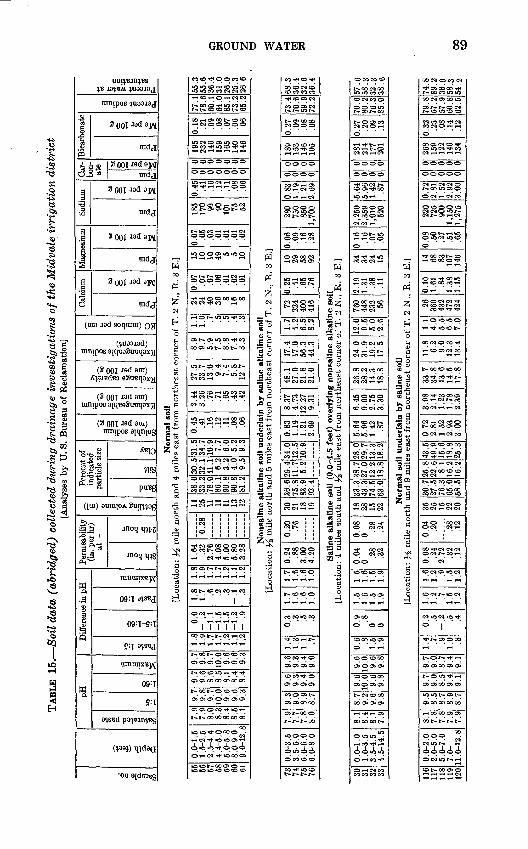
TABL
E 1
5.
Soil
dat
a (a
brid
ged)
col
lect
ed d
urin
g dr
aina
ge i
nves
tiga
tion
s of
the
Mid
vale
irr
igat
ion
dist
rict
[Ana
lyse
s by
U.
S. B
urea
u of
Rec
lam
atio
n]
6 a a, I
H-« * 0
pH
. c§ 1 rlf?
0 $ S
Diff
eren
ce in
pH
1C £ PH
O - "h
s 3 (2
0 $ 1
Perm
eabi
lity
at
^ J &
Lri
^ §
a "I a "o
bo .Jj
1
Perc
ent o
f
part
icle
siz
e
o AS3
^ o
"bo
MX ll 11
a * £
03
CL>
s a
H
I"3 4° w
T
H
g a
w
e 1 JS 11 -§a
Ed
,-.
Lri
1 -M o w
Cal
cium
a o, Hi
bQ S t-l a §
Mag
nesi
um
a £
bD g A §
Sodi
um
a o. Hi
bo 8 a §
Car
-
ate
a OH CM
Tin 8 a g
Bic
arbo
nate
a 1
Hi
bo 0 o a s
fl 3 T3 O S3 PH
I! 1-2
(51"
Nor
mal
soi
l[L
ocat
ion:
J^
mil
e n
ort
h a
nd 4
mil
es e
ast
from
nort
hea
st c
orne
r of
T.
2 N
., R
. 3
E.]
55
56
57 58
59
60
61
0.0-
1.5
1.5-
2.5
2.5-
4.4
4.4-
5.0
5.0-5.8
8.0-9.0
9.0-
12.8
7.9
7 9
8.0
8.3
8.4
8.5
8 1
9.7
9 8
9.7
10.0
9.
6 9.
6 9
3
9.7
9 fi
8.6
8.5
8.1
8.4
8 4
9.7
9 8
9.7
10.0
9.6
9.6
9 3
1.8
1 9
1.7
1.7
1.2
1.1
1 9,
0.0
- .2
-1.1
-1
.5
-1.5
-1.2
- .9
1.8
1 7 .6
.2
.3
-.1 3
1.8
1 9
1.7
1.7
1.2
1.1
1 9,
1.64
.3
22.
76
4.08
5.00
5.80
3.28
~6?2
8~11
25
11
11
11
13
38.0
33.2
78
.0
86.1
90.8
90
.8
81
9,
30.5
32.1
11.1
6.2
3.2
4.0
9 5
31.5
34.7
10.9
7.7
6.0
5.2
9 3
0.45
.41
.16
.12
.11
.08
.06
2.44
3.26
.76
.71
.65
.43
.42
27.5
33
.7
13.0
9.
4 7.4
5.8
12.7
8.9
9.7
5.9
7.5
8.8
7.4
3.3
1.1
1.0 .7
.5
.5
.4
.3
24
24
40
36 8 16 8
0.07
.07
.07
.06
.01
.02
.01
15
10
10
49 5 5 10
0.07
.05
.03
.01
.01
.01
.02
185
170 99
90
101 75
52
0.45
.4
1 .16
.12
.11
.08
.06
0 0 0 0 0 0 0
0 0 0 0 0 0 0
195
232
146
159
165
140
146
0.18
.21
.09
.08
.07
.06
.06
77.1
78.6
60.1
64.0
85
.1
73.2
65
.2
55.3
55
.6
36.4
31.0
26.0
25
.3
26 6
1N
onsa
line
alka
line
soil
unde
rlai
n by
sal
ine
alka
line
soil
[Loc
atio
n: J
-£ m
ile
no
rth
an
d 5
mil
es e
ast
from
nort
hea
st c
orne
r of
T.
2 N
., R
. 3
E.]
73 74
75
76
0.0-3.5
3.5-5.0
5.0-6.0
6.0-8.0
7 9
7.7
7.8
8.0
9 3
9.0
8.9
8.7
9 fi
9.3
9.4
9.0
9 fi
9.3
9.4
9.0
1 4
1.3
1.1 .7
0.3 .3
.5
.3
1 7
1.6
1.6
1.0
1 7
1.6
1.6
1.0
0.24 .88
3.00
4.20
0.20
.76
30 21
18
19
36.6
75.8
83.9
92
.4
29.4
11
.7
5.2
34.0
12
.5
10.9
0.83
1.
19
1.21
2.69
8.37
4.
73
12.2
7 9.
31
48.1
27.9
21.8
21
.0
17.4
17.0
56
.3
44.3
1.7
4.2
6.5
8.2
72
224
400
416
0.25
.41
.65
.76
10 29
58
92
0.06
.09
.16"
.28
280
750
850
1,70
0
0.83
1.
19
1.21
2.69
0 0 0 0
0 0 0 0
189
153
146
105
0.27
.09
.08
.08
73.4
70
.6
59.9
72
.2
68.3
36
.4
32.6
36
.4
Salin
e al
kalin
e so
il (0
.0-4
.5 f
eet)
ove
rlyi
ng n
onsa
line
alka
line
soil
[Loc
atio
n: 4
mil
es s
outh
and
% m
ile
east
fro
m n
ort
hea
st c
orne
r of
T.
2 N
., R
. 3
E.]
30
31
32
33
0.0-1.0
1.0-
3.5
3.5-4.5
4.5-
14.5
8 1
8.4
8.1
7.9
8 7
9.2
9.6
9.8
9 fi
10.0
9.
6 9.8
9 fi
10.0
9.
6 9.8
0 fi .8
1.5
1.9
0.9 .8
0 0
1 fi
1.6
1.5
1.9
1 fi
1.6
1.5
1.9
0.04
0.28
.32
0.08
0.28
.24
18
28
15
22
33.3
43
.3
74.5
63
.0
38.7
27
.0
12.2
18.8
28.0
29.7
13.3
18.2
5.64
5.96
1.42 .87
6.45
9.00
2.75
3.
30
26.8
28.2
14.3
18.8
24.0
31.9
19.2
17.5
12.0
9.
5 5.
0 2.6
760
448
232 56
2.19
1.31
.38
.11
34
34
24
15
0.16
.16
.07
.05
2,25
0 2,359
1,010
520
5.64
5.
96
1.42
.87
0 0 0 0
0 0 0 0
281
214
177
201
0.27
.20
.09
.13
70.6
80
.2
76.3
85
.0
57.6
58
.3
32.3
38
.6
[Loc
atio
n:N
orm
al s
oil
unde
rlai
n by
sal
ine
soil
mil
e nort
h a
nd
9 m
iles
eas
t fr
om n
ort
hea
st c
orne
r of
T.
2 N
., R
. 3
E.]
116
117
118
119
120
0.0-
2.0
2.0-
5.0
5.0-
7.0
7.0-
11.0
-12.
8
8.1
7 8
7 8
7.9
7 9
9.5
8 5
8 7
8.9
8 7
9.7
9 0
8 5
9.4
9 1
9.7
9 0
8 7
9.4
9 1
1.4 7 9
.1.0 8
0.2 .5
2 .5 .4
1.6
1 9: 7
1.5
1 9,
1.6
1 9, 9
1.5
1 9,
0.08 .24
2.72 .32
.12
0.04
.20
.28
.12
35 25
15 22
20
30.7
27.5
76
365
.0
58.5
25.8
22
.6
8 1
16.2
lf
i.2
43.5
49
.9
15 f
i18
.8
25.3
0.72
2.81
1.52
2.93
3.00
3.98
2.
14
1.23
1.78
2.
39
33.7
34.8
13.6
14.5
17.8
11.8
6.2
9.0
12.3
13.4
1.1
4.0
5 5
6.5
7.0
26
360
432
472
424
0.10
1.
61 .84
1.38
1.15
14
68
83
107
146
0.08
.50
.27
.51
.65
220
725
900
1,150
1,27
5
0.72
2.81
1.52
2.92
3.
00
0 0 0 0 0
0 0 0 0 0
268
159
122
146
134
0.32
.2
3 .08
.14
.12
79.8
57.2
57.9
60
.8
62.fi
74.8
89.2
38.9
58
.3
54 9
00
90 GROUND-WATER RESOURCES, RIVERTON AREA, WYOMING
of the normal arid type, four classes of soils normal, nonsaline alkaline, saline alkaline, and saline types are represented in the data collected. All analyses in table 15 were by U. S. Bureau of Reclamation.
In places the soil type differs appreciably within a profile. For example, a normal soil at the surface is immediately underlain in some places by nonsaline alkaline soil; conversely, nonsaline alka line soil at the surface may be underlain by normal soil. Although either sodium or calcium may be the predominant cation in normal soils, percent sodium that exceeds 60 is common in the four soil types. Differences in the bicarbonate and total cations indicate predominance of strong acid radicals, presumably sulfate.
QUALITY OF WATER IN RELATION TO USEDOMESTIC USE
The United States Public Health Service (1946) recommends the following maximum concentrations of chemical constituents in water to be used for drinking purposes on common carriers:
Maximum Maximumconcentration concentration
Constituent (ppm) ConstituentIron and manganese together.. 0. 8Magnesium ................. 125Sulfate ..................... 250
Fluoride .................... *!.5Chloride .................... 250Dissolved solids ............. 2500
1 Mandatory upper limit.2 Where water of this quality is not available, 1,000 ppm is permitted.
These standards, together with other sanitary, chemical, and bio logical requirements, are applicable primarily to interstate com merce but can be used also in evaluating the suitability of a water for private and public supplies. Many supplies in the area are of higher mineral content than desirable; sulfate and iron are the principal constituents that exceed the standards.
Many domestic wells in the Midvale irrigation district and in the newly opened tracts, particularly those drawing water from shallow sources, yield water in which the hardness exceeds 200 ppm. Such supplies, in addition to their scale-forming character istics, are of economic significance to the consumer because of added soap costs. Fluoride, which reduces tooth decay if present in quantities of about 1.0 ppm but which may promote dental mot tling if present in quantities of more than about 1.5 ppm (Dean, 1936), is higher than desirable in some of the supplies from both shallow and deep sources throughout the area. In the Muddy Creek terrace area the leaching effect of irrigation water probably will maintain, temporarily at least, a somewhat high concentration of fluoride in shallow sources of water. Many ground-water sup-
GROUND WATER 91
plies in the report area are high in iron. Although several parts per million of iron may be in solution as iron bicarbonate in the ground water, oxidation of the iron to ferric hydroxide and subse quent precipitation occur when the water is exposed to air.
Water containing minerals in excess of the recommended stand ards often is used for drinking as well as other purposes. Many consumers in the Riverton area have become accustomed to the saline properties of the water and now find less mineralized water somewhat less palatable. However, the water from several of the wells that were sampled, particularly the water having excessive concentrations of dissolved solids, is used only for the watering of stock and fowl.
IRRIGATION USE
A small but definite amount of boron in either the soil or the irri gation water is essential for satisfactory crop growth, but for certain crops a toxic effect results from too great an amount of boron in the irrigation water. Water containing more than 2.0 ppm of boron should not be used for the irrigation of crops sensi tive to this element. None of the samples of water that were analyzed had troublesome quantities of boron; the maximum was 0.98 ppm.
Wilcox (1948, p. 27) and others have given criteria for classify ing irrigation water and have indicated that if the specific con ductance is less than 1,000 micromhos, salt probably will not accumulate in the soil, but if the specific conductance is more than 3,000 micromhos, salt is likely to accumulate. Percent sodium also is an index of the suitability of a water for irrigation because a high proportion of sodium in the water generally adversely affects the physical properties of the soil. For most soils the percent sodium of the irrigation water should be less than 60; although for soils having a good structure and permeability, a percent sodium as high as 75 may not cause adverse effects.
Water in the Riverton irrigation project may be rated for sup plementary irrigation use on the basis of a diagram devised by Wilcox (1948, p. 26). (See fig. 28.) This diagram is based on the percent sodium and the specific conductance of the water. (See table 9.) The section of the diagram into which a plotted point falls signifies the quality classification of the water.
The analyses of only three samples, all from wells in tracts that have been irrigated for a number of years, rate excellent or good; most of the supplies rate no better than doubtful. The data con sidered together with analytical results obtained for soils indicate
92 GROUND-WATER RESOURCES, RIVERTON AREA, WYOMING
100
90
80
70
60
50
40
30
20
10
EXCELLENTTO i
GOOD
PERMISSIBLE
TO
DOUBTFUL
GOODTO |
PERMISSIBLE
DOUBTFUL
TO
UNSUITABLE
UNSUITABLE
0 500 1000 1500 2000 2500 3000 3500 4000 SPECIFIC CONDUCTANCE IN MICROMHOS PER CENTIMETER AT 25 DEGREES CENTIGRADE
FIGURE 28. Diagram for use in classifying water for irrigation. After Wilcox.
a generally unsatisfactory supply of ground water for irrigation. Reuse of return irrigation water also should be avoided.
Wilcox points out that the soil, crop, climate, drainage, and management of the soil influence the tolerable quantities of salts in irrigation water; thus, no simple classification is applicable to all conditions.
SUMMARY AND CONCLUSIONS
In the Riverton irrigation project area, ground-water supplies are derived principally from the sandstone beds of the Wind River
SUMMARY AND CONCLUSIONS 93
formation. This source provides the best present and future sup ply of ground water in the area. Although generally not available in quantities large enough for irrigation, the water yielded by the formation is adequate in quantity and of suitable quality for mu nicipal, domestic, and stock use. Additional sources of satisfactory water from this formation possibly can be obtained at greater depths than now penetrated.
Except where the terrace deposits and the valley alluvium have been recharged for a number of years by seepage from canals and irrigation water or by streamflow, with consequent leaching of salts, most surficial deposits in the report area yield water neither sufficient in quantity nor suitable in quality for domestic or stock use. The continuation and expansion of irrigation will result in the development of ground-water bodies in the terrace deposits along the tributary streams. The quality of the water throughout these aquifers will improve in time if drainage is sufficient to allow the flushing of deleterious salts from them. Wells drilled where the aquifer is recharged by dilute surface water are likely to ob tain water of suitable quality. In most places the colluvial-alluvial and alluvial deposits are not potential aquifers because they have low permeability and the water in them is likely to be of poor quality.
Available evidence indicates that, before irrigation, ground water in the surficial materials either was nonexistent or generally was far below the surface and that infiltration from canals and applied irrigation water either has formed a permanent ground- water body or has enlarged one already present. Where the per meability of the surficial materials was great enough to allow the water to move through and be discharged from them, the added re charge caused no great rise of the water table, but where the natural underdrainage was poor, the recharge exceeded the dis charge and the water table rose progressively closer to the surface. As shallow ground water generally is highly mineralized, evapora tion of the water at or near the surface leaves a concentration of salts that further hinders the drainage of the materials and the use of the land for agriculture. Because most of the surficial materials mantling the report area are poorly drained and because the underlying bedrock is relatively impermeable, serious water logging and the accompanying salinization of the soil have oc curred or will occur in many places both in the Riverton irrigation project and in adjacent privately irrigated land. Properly de signed and strategically located drains would lower the water table in some of the waterlogged areas and, unless the soil has been permanently damaged by the salts, the land again can be cultivated.
94 GROUND-WATER RESOURCES, RIVERTON AREA, WYOMING
However, adequate drainage systems or other measures of im provement can be designed only after the hydrology and geology of the problem areas have been studied in detail. The present general study indicates not only wherein the origin, geologic na ture, and physiographic expression of both the surficial materials and the underlying bedrock contribute to these problems but also the factors that should be considered in resolving them.
The area covered by this investigation is subdivisible into sev eral distinct geomorphic units, in each of which the drainage prob lems are somewhat different.
The lower Wind River terraces, which have been irrigated for several years, are waterlogged in many places along or near the base of slopes between terraces and in some places within the ter races. Waterlogging at the upper margin of a terrace generally is caused by discharge from a higher terrace of ground water or irrigation return flow in quantities too large to be transmitted by the lower terrace. A drain that exposes the full thickness of gravel along the outer terrace edge would intercept the discharge of ground water from that terrace onto the next lower terrace. Terrace T2, which is waterlogged in the vicinity of Riverton, is likely to become waterlogged in the Hidden Valley area also, be cause that area is underlain by rather thick and relatively imper meable deposits. As discharge at the terrace edge is retarded and the movement of water within the upper part of the terrace deposits is slow, interception drains penetrating the full thickness of gravel would help alleviate this situation. However, a detailed study should be made to determine the permeability and thickness of the terrace gravel and overlying alluvium and to detect the possible presence of water under hydrostatic pressure in either the terrace deposits or the underlying- Wind River formation. If the ground water is confined, the construction of relief wells might be a means of alleviating waterlogging.
The Muddy Creek terraces, which are irrigated to some extent at the present time, possibly will become waterlogged by perched ground water if the sodium-dispersed soil of some of the terraces retards the downward movement of irrigation water into the underlying terrace gravel. After irrigation has been continued for several years, a high water table may cause waterlogging along and near the base of slopes between terraces unless intercepting drains prevent the movement of ground water out of higher terrace deposits into lower terrace deposits. Waterlogging may occur also in the colluvial-alluvial materials, which in places completely mantle the slope between terraces. If these materials retard the flow of ground water from higher to lower terrace deposits, pro-
SUMMARY AND CONCLUSIONS 95
gressive waterlogging will occur near the contact of the colluvial- alluvial material with the higher terrace. Interception drains ex posing the full thickness of terrace gravel along the terrace edge would increase the discharge of water from the terrace deposits. At least one line of observation wells along a cross-valley profile should transect each of the eastern, central, and western parts of the terrace system. Measurements of the water level in the wells in irrigated areas will indicate at an early date if the trend is toward high water-table conditions. The possibility of the develop ment of perched bodies of ground water also should be taken into consideration.
The three cross-terrace channels, the eastern one of which con tains a series of blowouts now interconnected by Cottonwood drain, will serve as natural ground- and surface-water drains. Measures to prevent gullying may be necessary while the drains adjust to the new conditions of flow.
Problems of erosion along Muddy Creek, similar to those along Fivemile Creek, can be prevented if the discharge of ground water and irrigation return flow from the Muddy Creek terrace system is diverted into drains instead of directly into the creek. If a drain that exposes the entire thickness of gravel along the outer margin of terrace T3 were constructed parallel to Muddy Creek, it and Cottonwood drain would intercept all the excess surface-water dis charge and most of the ground-water discharge resulting from the irrigation of the terraces. Properly designed drop structures would be an essential feature of the new drain. Both drains could discharge into the large closed depression at the lower end of Cottonwood drain and the release of the water from the depression into Muddy Creek could be controlled.
Drainage problems in the terrace systems along Fivemile and Cottonwood Creeks are unlikely because the individual terraces, although similar in many respects to those along Muddy Creek, are small in area and are isolated.
In a large part of the investigated area the Wind River forma tion is either at the surface or is mantled by only colluvial-alluvial deposits. Wherever the colluvial-alluvial deposits are thin or dis continuous, wherever local irregularities or abrupt changes in the slope of the underlying bedrock surface impede or reduce the lateral movement of water, and wherever the permeability of these deposits and the underlying bedrock is so low that discharge from the deposits is less than recharge to them, drainage problems either have developed already or are likely to develop. After colluvial-alluvial deposits have become waterlogged, it is question able whether they can be drained effectively. Where waterlogging
96 GROUND-WATER RESOURCES, RIVERTON AREA, WYOMING
has not yet occurred, rigid control of water use and reduction of canal losses may forestall waterlogging. In newly irrigated areas, such as the North Portal area, three cross-valley lines of observa tion wells that penetrate the full thickness of the colluvial-alluvial material should be constructed, and periodic measurements of the water level in the wells should be made in order to foretell any trend toward high water-table conditions. Also, lands proposed for irrigation in the Muddy Ridge extension of the Riverton project should be evaluated according to their drainability. The design and construction of drainage facilities in any area should be pre ceded by detailed geologic and hydrologic studies.
Waterlogging of the alluvial bottom lands along the Wind River, especially in the eastern part of the area, has been caused primarily by the discharge of ground and surface water from the adjacent terrace. The construction of interception drains at the terrace edge probably would alleviate the condition in areas already water logged and prevent the extension of the affected areas. Along the middle and lower parts of Fivemile Creek the irrigation of the valley alluvium or adjacent colluvial-alluvial deposits has caused waterlogging of the alluvium. Because the alluvial deposits are relatively impermeable, these areas possibly could never be well drained. Reduction of the amount of irrigation water applied to the land and reduction of water loss in canals and laterals are probably the most effective means of controlling waterlogging in these areas.
The hydrologic properties of the Wind River formation in the Riverton area were determined by making an aquifer test in the Riverton municipal well field. The transmissibility and storage coefficients of the Wind River formation were computed to be about 10,000 gpd per ft and 2 x 10⁻⁴, respectively. The results of the test, which include a consideration of the effects of boundaries, aid the understanding of present problems in the Riverton well field and make it possible to predict approximately the future perform ance of the well field, including the expected drawdown interfer ence between wells under different pumping schedules and the distribution of the wells. Records of pumpage and of water-level fluctuations in wells also will be necessary for the most efficient operation of the well field.
Because the geologic and hydrologic conditions in the Wind River formation in the Riverton area are fairly typical of condi tions in the Wind River formation throughout the project area, a reasonable estimate of the yield of the formation can be computed for any part of the area for which the thickness of water-bearing sandstone is known.
SELECTED BIBLIOGRAPHY 97
In some parts of the Riverton irrigation project extensive water logging and the resultant deposition of salt on and in the surficial materials are altering the chemical composition and increasing the salinity of the shallow ground waer. The analyses of water from return flow to Ocean drain and Fivemile Creek indicate large amounts of soluble salts in the surficial deposits. The soluble-salt content in the soil in waterlogged areas probably exceeds 0.5 per cent in places, and continued saturation of the soil by water con taining a high percent sodium is likely to destroy the soil structure. Chemical analyses of soils made by the United States Bureau of Reclamation show that normal arid, saline, saline alkaline, and nonsaline alkaline soils are present in the Midvale irrigation district.
The concentration of dissolved solids in the ground water tends to be variable at shallow depth, but uniformly lower at greater depth. The available analyses indicate that the water from most of the wells that are 300 feet or more deep contains less than 1,000 ppm of dissolved solids. The sulfate content, however, probably exceeds the desired limits unless concentrations of dissolved solids are less than 500 ppm.
In all parts of the area the concentration of dissolved solids in the ground water increases in proportion to the increase in sulfate; the carbonate and chloride concentrations increase very little.
Because of variations in the freshening action of irrigation water from place to place, wells less than 100 feet deep yield water that has a wide range in percent sodium. At depths greater than 100 feet, the percent sodium generally is greater than 80; this fact indicates geochemical alteration and resultant reduction in hard ness. The high percent sodium generally will be a limiting factor in the use of ground water and drain water for irrigation.
Sulfate and iron exceed the accepted drinking-water standards in more than half of the ground-water samples collected in the area.
No analyses of the ground water in the area prior to irrigation are available for study. However, the degree of mineralization of the ground water to a depth of 300 feet in the newly irrigated tracts is sufficient evidence of the salinity problems that exist in the area.
SELECTED BIBLIOGRAPHYBarton, H. E., 1948, Steamboat Butte oil field: Wyo. Geol. Assoc. Guidebook,
Wind River Basin, p. 173-177. Blackstone, D. L., 1948, The structural pattern of the Wind River Basin, Wyo.:
Wyo. Geol. Assoc. Guidebook, Wind River Basin, p. 69-78. Blackwelder, Eliot, 1915, Post-Cretaceous history of the mountains of central-
98 GROUND-WATER RESOURCES, RIVERTON AREA, WYOMING
western Wyoming: Jour. Geology, v. 23, p. 97-117, 193-217, and 307-340. Condit, D. D., 1924, Phosphate deposits in the Wind River Mountains, near
Lander, Wyo.: U. S. Geol. Survey Bull. 764, 39 p. Barton, N. H., 1906, Geology of the Owl Creek Mountains, Wyo.: U. S. 59th
Cong., 1st sess., S. Doc. 219, 48 p. Dean, H. T., 1936, Chronic endemic dental fluorosis: Am. Med. Assoc. Jour.,
v. 107, p. 1269-1272. Downs, G. R., 1948, Regional relationships of Wind River Basin sediments:
Wyo. Geol. Assoc. Guidebook, Wind River Basin, p. 140-147. Espach, R. H., and Nichols, H. D., 1941, Petroleum and natural-gas fields in
Wyoming: U. S. Bur. Mines Bull. 418,185 p. Ferris, J. G., 1948, Ground-water hydraulics as a geophysical aid: Mich. Dept.
Conserv. Geol. Survey Div. Tech. Rept. 1,12 p. Hayden, F. V., 1862, Geology and natural history of the upper Missouri: Am.
Philos. Soc. Trans., new ser., v. 12, p. 1-218. Kearney, T. H., and Scofield, C. S., 1936, The choice of crops for saline lands:
U. S. Dept. Agriculture Circ. 404, 24 p. Keefer, E. K., Love, J. D., Larsen, R. M., and Alien, M. W., 1949, Map of
Wyoming showing test wells for oil and gas, anticlinal axes, oil and gasfields, pipelines, unit areas, and land district boundaries: U. S. Geol.Survey Oil and Gas Inv. Prelim. Map 107.
Keefer, W. R., and Troyer, M. L., 1956, Stratigraphy of the Upper Cretaceousand lower Tertiary rocks of the Shotgun Butte area, Fremont County,Wyo.: U. S. Geol. Survey Oil and Gas Inv. Chart OC-56.
King, Ralph, 1947, Phosphate deposits near Lander, Wyo.: Wyo. Geol. SurveyBull. 39, 84 p.
Love, J. D., 1939, Geology along the southern margin of the Absaroka Range,Wyo.: Geol. Soc. America Special Paper 20,134 p.
Love, J. D., 1948, Mesozoic stratigraphy of the Wind River Basin, centralWyoming: Wyo. Geol. Assoc. Guidebook, Wind River Basin, p. 96-111.
Matter, J. E., 1948, Surface geologic map, Steamboat Butte and Pilot ButteFields, Fremont County, Wyo.: Wyo. Geol. Assoc. Guidebook, Wind RiverBasin, p. 174, fig. 1.
Nace, R. L., 1936, Summary of the late Cretaceous and early Tertiary stratig raphy of Wyoming: Wyo. Geol. Survey Bull. 26, 271 p.
Scott, H. W., 1947, Solution sculpturing in limestone pebbles: Geol. Soc.America Bull., v. 58, no. 2, p. 141-152.
Thomas, H. D., 1948, Summary of Paleozoic stratigraphy of the Wind RiverBasin, Wyo.: Wyo. Geol. Assoc. Guidebook, Wind River Basin, p. 79-95.
Thompson, R. M., Troyer, M. L., White, V. L., and Pipiringos, G. N., 1950,Geology of the Lander area, central Wyoming: U. S. Geol. Survey Oil andGas Inv. Prelim. Map OM112.
Tourtelot, H. A., 1948, Tertiary rocks in the northeastern part of the WindRiver Basin, Wyo.: Wyo. Geol. Assoc. Guidebook, Wind River Basin, p.112-124.
Tourtelot, H. A., and Thompson, R. M., 1948, Geology of the Boysen area,central Wyoming: U. S. Geol. Survey Oil and Gas Inv. Prelim. Map 91.
U. S. Public Health Service, 1946, Drinking water standards: U. S. PublicHealth Service Repts,, v. 61, no. 11, p. 371-384.
U. S. Regional Salinity Laboratory, 1947, Diagnosis and improvement ofsaline and alkali soils: U. S. Dept. Agriculture, Bur. Plant Industry, Soils,and Agr. Eng.
WATER-LEVEL MEASUREMENTS 99
Van Houten, F. B., 1950, Geology of the western part of the Beaver Dividearea, Fremont County, Wyo.: U. S. Geol. Survey Oil and Gas Inv. Prelim.Map OM113.
Wenzel, L. K., 1942, Methods for determining permeability of water-bearingmaterials with special reference to discharging-well methods: U. S. Geol.Survey Water-Supply Paper 887,192 p.
Wilcox, L. V., 1948, The quality of water for irrigation use: U. S. Dept.Agriculture Tech. Bull. 962, 40 p.
Woodruff, E. G., and Winchester, D. E., 1912, Coal fields of the Wind Riverregion, Fremont and Natrona Counties, Wyo.:' U. S. Geol. Survey Bull.471, p. 516-564.
WATER-LEVEL MEASUREMENTS
By measuring at intervals the depth to water in wells, a record of the changes in the amount of ground water in storage can be obtained. Such a record aids in determining the relative effect of the various factors of recharge and discharge to the ground-water reservoir. Measurements were made by the wetted-tape method in 4 wells in 1947, in 83 additional wells in 1948, and in several more wells beginning in 1949 and in 1950. Unless measurements had to be discontinued for some reason, they were made at monthly intervals until late in 1950 or early in 1951. A few wells were measured until the end of 1951. All measurements made by the tape method are given on pages 100 to 124 of table 16.
To obtain a continuous record of water-level fluctuations a water-stage recording gage was installed on 6 of the wells. Daily noon readings were taken from the recorder charts and are given on pages 125 to 130 of table 16.
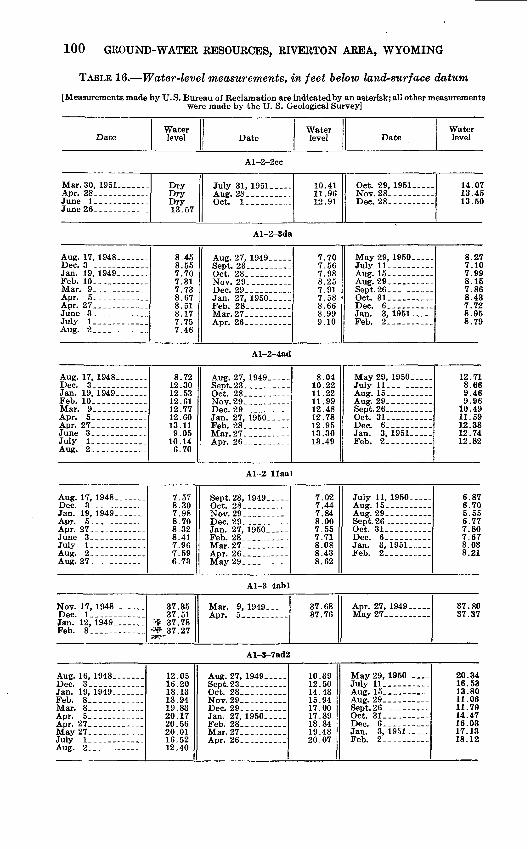
100 GROUND-WATER RESOURCES, RIVERTON AREA, WYOMING
TABLE 16. Water-level measurements, in feet below land-surface datum
[Measurements made by U. S. Bureau of Reclamation are indicated by an asterisk; all other measurements were made by the U. S. Geological Survey]
Date
Mar. 30, 1951. __ ...Apr. 28__ - ...June 1 ..-- -__June 26. __..._ ..
Aug. 17, 1948 Dec. 3 -. ------ ..Jan. 19, 1949 ... _Feb. 10__ __ . __ _Mar. 9...... ...
Apr. 27 ----------June 3_ -. -_--..July l._ _____ _
Aug. 17, 1948 __ --.-Dec. 3- --- ___ .Jan. 19, 1949 _ __ _.Feb. 10- -Mar. 9.. .. ... .
Apr. 27.---. ...-._.
July 1. _. ..._
Aug. 17, 1948.. ..._
Jan. 19, 1949
Apr. 27 __ ---------
July 1. _.. ...-
Aug. 27-.-. -------
Nov. 17, 1948. .-.
Jan. 12, 1949 _ . _Feb. 8.- -
Aug. 16, 1948 ____
Jan. 19, 1949 _ - _Feb. 8 __ .-.-.--.-Mar. 8 ____ - _
Apr. Z1. ...........May 27.-..- _ ..._July 1 - ____ - ...
Water level
13.57
8.458.557.707.317.738.678.518.177.757.46
8.7212.3012.5312.6112.7712.6013.119.05
10.146.70
7.578.307.988.708.328.417.967.596.73
37.3537.51
>'# 37.78-*? 37.27
12.0516.2018.1318.9419.8320.1720.5620.0116.52
Date
Al-2-2cc
July 31, 1951. .Aug. 28-_ ____ -Oct. I.- _- -
Al-2-3da
Aug. 27, 1949 __ .
Oct. 28.- ____ .
Jan. 27, 1950 _ Feb. 28-. ------Mar.27-. .. _ Apr. 26.
Al-2-4ad
Aug. 27, 1949
Nov. 29-... ------Dec. 29 , .-----_
Feb. 28...- --.-Mar.27- __ ..
Al-2-llaa
Oct. 28-._. Nov. 29 __..
Jan. 27, 1950 __Feb. 28 ---------Mar.27.. ___ ..
May 29.. -----
Al-3-4abl
Mar. 9, 1949 ___
Al-3-7ad2
Aug 27 1949
Nov.29___--- ....
Jan. 27, 1950 ___Feb. 28 __ ...Mar.27 Anr. 26- __ ... .
Water level
10.4111.9612.91
7.707.567.988.257.917.588.668.999.10
8.0410.2211.2211.9912.4812.7812.9513.3013.49
L
7.027.447.848.007.557.718.088.438.62
37.6837.76
10.3912.5014.4815.9417.0017.8918.8419.4820.07
Date
Oct. 29, 1951 Nov.28 __ ------Dec. 28 -----.-.
May 29, 1950 __ -July 11 __ - _ .Aug. 15..
Sept. 26-.. ___ .Oct. 31 .._ ...-
Jan. 3, 1951 Feb. 2- _
May 29, 1950 _ -July 11- _ -. _ -
Aug. 29-_ Sept. 26 ____ .Oct. 31 ___ - ....Dec. 6--. __ ...Jan. 3, 1951 .....Feb. 2 ___
July 11, 1950- --Aug. 15-. _ . _ .
Sept.26 _ - _ .Oct. 31 --------Dec. 6 - . ___ .Jan. 3, 1951---.-Feb. 2-. .
Apr. 27, 1949 ___May 27 __ ...
May 29, 1950 ....July 11 ____ Aug. 15. Aug. 29
Oct. 31 ... Dec. 6- --- ...Jan. 3, 1951 ___Feb. 2
Water level
14.0713.4513.50
8.277.107.998.157.868.437.728.958.79
12.718.669.469.96
10.4911.5912.3812.7412.82
6.876.705.556.777.807.678.038.21
37.8037.37
20.3416.5313.8011.0611.7914.4716.0317.1318.12

WATER-LEVEL MEASUREMENTS 101
TABLE 16. Water-level measurements, in feet below land surface datum Continued
Date
Mar. 30, 1951. __-.._Apr. 28 ....------.June !-__. .____-
Mar. 30, 1951--..-..Apr. 28 __________June 1__ _.. .__.__June 26__. ._- _.
Aug. 11, 1948.--.- -_Dec. 3. _..- .-.__Jan. 19, 1949- . __ .Feb. 8__ ____ ....Mar. 8-._--_ ______
Apr. 27___- _ ..-..May 27--. . .. ...July 1 __ _________
Apr. 28, 1951 _ ..-.June !____ .. _.._June26___ _ .. ..
Water level
9(1 19
20.8491 no18.10
14.2914.5913.361O 7Q
21.4219.8820.9321.3021.6621.8922.5922.8799 QA
21 45
17.1117.1917.11
Date
Al-3-7ad3
July 31, 1951---..
Oct. 1- __ ------
Al-3-7dd
July 31, 1951.---_
Oct. l____-_____
Al-3-16cc
Aug 27 1949
Oct. 28 __ . _ -Nov.29-__. - ---
Jan. 27, 1950. _ .Feb. 28_ _ _.._-AT gr. O7
Al-3-17da
July 31, 1951-.--.
Oct. !-- ---.-_
Water level
U Q1
9 9711.81
8.588.34
10.02
20.1818.2518.4119.2019.7420.1020.5721.0821.80
16.4214.6313.83
Date
Oct. 29, 1951.----Nov.28----------
Oct. 29, 1951_.___Nov. 28.-. _ _--_
May 29, 1950_---_July 11_ __ . _ _Aug. 15- __ -----
Oct. 31. ___
Jan. 3, 1951- ____Feb. 2__ -_._---
Oct. 29, 1951. _ -Nov.28--.- ___ _
Water level
12.8415.2416.64
11.3012.3813.16
22.3021.7818.8517.7817.0518.0718.9019.5120.38
13.9414.6515.13
Al-3-27ad
Aug. 10, 1948 ____ _
Jan. 19, 1949 _______Feb. 8___ ______Mar. 8 __ .-.___-
Apr. 27-._- __ _-..May27__ ___ _____July 1- ___________
8.858.879.269 EC
9.749 93
10.389.79
10.80
Aug. 2, 1949. _._-
Nov 29
Jan. 27, 1950 _ _.Feb. 28--.. ------Mar 97
8.108.677.158.057.928.208.569.029.60
May 29, 1950-...,July ll__-----__-Aug. 15-_ _ - _ ,Aiirr OQ
Sept. 26 __ -----._Oct. 31-_. .......Dec 6Jan. 3, 1951 _____Feb. 2.. _ . ____
10.159.081.273.367.227.738.118.659.15
Al-3-27bb
Mar. 30, 1951...--..
June 26 _ __ __ _
6.056.245.905.10
July 31, 1951---.-
Oct. 1----------
4.343.654.75
Oct. 29, 1951. .-_Nov.28- _____ _Dec. 28.---------
4.945.686.14
Al-3-35aa
Aug. 10, 1948-.---..
Apr. 5, 1949--..--.Apr. 27 __ -----.--.May 27 __ .........July 1 __ .........
Aug. 27 _____ .-...
9.739.028.928.83
12.3310.1810.34'6.38
Sept. 27, 1949_ -..-Oct. 10__ .-- ....Nov.29. __ ------
Mar.27 _____ ..
11.4213.2014.7713.6810.8510.4010.81
May 29, 1950.. _July 11 __ .--..-Aug. 15- ____ --Aug. 29._ _ -----
Oct. 31.. _ ..---Jan. 3, 1951 __ -
10.6010.8012.2011.9712.5411.9011.62
1 Well pumped just prior to measurement.
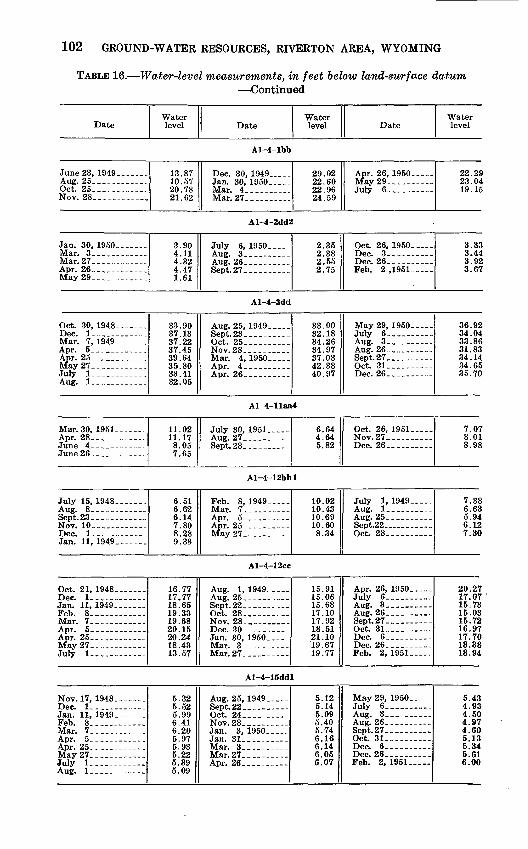
102 GROUND-WATER RESOURCES, RIVERTON AREA, WYOMING
TABLE 16. Water-level measurements, in feet below land-surface datum Continued
DateWater level Date
Water level Date
Water level
Al-4-lbb
June 23, 1949 ....Aug. 25_ ___Oct. 25- ......._.Nov. 28. ...... __
13.87 10.57 20.78 21.62
Dec. 30, 1949..-..Jan. 30, 1950_. _.Mar. 4..... ....Mar. 27 _. __ ...
29.02 22.60 22.96 24.59
Apr. 26, 1950---
July 6 __ ------
22.29 23.04 19.15
Al-4-2dd2
Jan. 30, 1950 .... _Mar. 3. ... __ ...Mar. 27____Apr. 26 _...._ .May29 . ___ .....
3.90 4.11 4.32 4.47 1.61
July 6, 1950 _-..-
Sept.27.. .--.-..
2.35 2.38 2.552.75
Oct. 26, 1950- _...
Dec. 26.. _....._.Feb. 2 ,1951 ___
3.33 3.44 3.92 3.67
Al-4-3dd
Oct. 30, 1948 __ _Dec. 1 _ .... _Mar. 7, 1949 . ..Apr. 5 .__ __ ...Apr. 25 . __ ..____May 27 . _ ------July 1 . ____ ...
33.90 37.13 37.22 37.45 39.64 35.80 33.41 32.05
Aug. 25, 1949 __
Oct. 25 - -------Nov.28. .---._
Apr. 4 __ ...Apr. 26_ -- -.--
33.00 32.18 34.26 34.97 37.03 42.38 40.97
May 29, 1950 ___July 6. _._._. Aug. 3 _._... Aug. 26-. -------Sept.27 __ ----- -Oct. 31 __ -------Dec. 26.--.---
36.92 34.04 33.86 31.83 34.14 34.65 35.70
Al-4-llaa4
Mar. 30, 1951 . _ _Apr. 28.. ____ . .
11.02 11.17 8.05 7.65
July 30, 1951 __Aug. 27 __ ------Sept.28_-_ -----
6.64 4.64 5.82
Oct. 26, 1951- Nov.27 __ -----Dec. 26 _______
7.07 8.01 8.98
Al-4-12bbl
July 15, 1948 ___ .
Nov. 10 _______ ..Dec 1Jan. 11, 1949_. __
6.51 6.62 6.14 7.80 8.28 9.33
Feb. 8, 1949 _.--Mnr 7
May 27-. ____ -
10.02 10.43 10.69 10.60 8.34
July 1, 1949---Aug. 1 __ -----
Sept.22 -. ...Oct. 28... ------
7.38 6.63 5.94 6.12 7.30
Al-4-12cc
Oct. 21, 1948 ____ .
Jan 11 1949Feb. 8 _______ .Mar. 7 __ . ._...
Apr. 25--.-. -------
July 1 __ --------
16.77 17.77 18.65 19.33 19.68 20.15 20.24 18.43 13.57
Aug. 1, 1949. --.-
Oct. 28 __ -.--._-Nov. 28 _____ .
Jan. 30, 1950. _
Mar.27_---- - _
15.91 15.06 15.68 17.10 17.92 18.51 21.10 19.67 19.77
Apr. 26, 1950 ___July 6 __ .-..._-
Sept.27.- ____ --Oct. 31-... - .Dec. 6_ _ _ -.
Feb. 2, 1951 ___
20.27 17.07 15.73 15.03 15.72 16.97 17.70 18.38 18.94
Al-4-15ddl
Nov. 17, 1948_- __Dec 1Jan. 11, 1949 ------Feb. 8-. _- . Mar. 7_---_- ...
Apr 25
July 1. .-.. --__
5.32 5.52 5.99 6.41 6.20 5.97 5.93 5.22 5.39
Aug. 25, 1949 .....
Oct. 24 ____ ...-Nov.28 ___ . .. Jan. 3, 1950. _ _
Mar. 3_ . .Mar.27___-------Apr. 26_ - -.--
5.12 5.14 5.09 5.40 5.74 6.16 6.14 6.05 6.07
May 29, 1950 .... . July 6 .......Aug. 3 ..-__.Aug. 26 .. . ...Sept.27- ____ ._Oct. 31- --------Dec. 6___ .-. -.Dec. 26..,.-- ....Feb. 2, 1951.
5.43 4.93 4.50 4.97 4.60 5.13 5.34 5.61 6.00
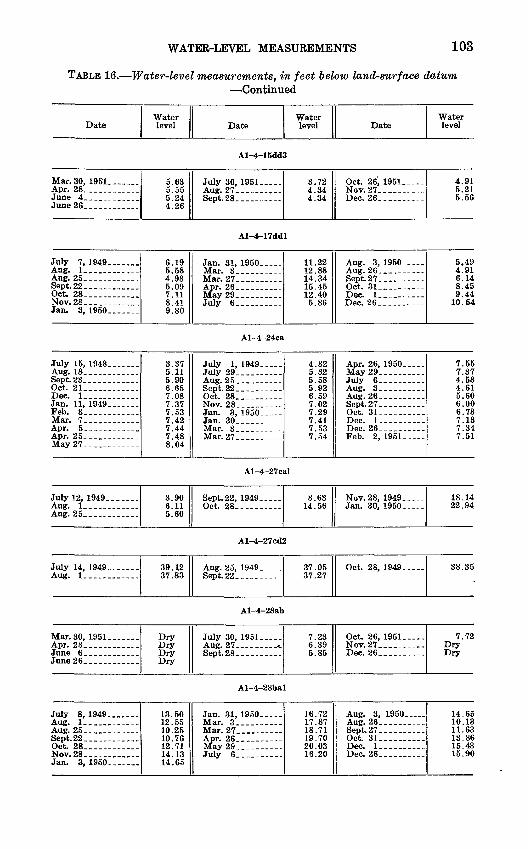
WATER-LEVEL MEASUREMENTS 103
TABLE 16. Water-level measurements, in feet below land-surface datum Continued
DateWater level Date
Water level Date
Water level
Al-4-15dd3
Mar. 30, 1951 ____Apr. 28_ ______June 4____ _ ...June 26. . _ _ - _ _ .
5.63 5.55 5.24 4.26
July 30, 1951 _ -.Amr 91
3.72 4.34 4.34
Oct. 26, 1951---.-Nov.27 __ ------Dec. 26-- _ ----
4.91 5.21 5.56
Al-4-17ddl
July 7, 1949 _.____.
Aug. 25__ ____ _Sept.22____. __Oct. 28 _ __________Nov.28__ ______ .Jan. 3, 1950. . __ .
6.19 5.58 4.98 5.09 7.11 8.41 9.80
Jan. 31, 1950 _____Mar. 3..... -.Ajfor 97
May 29 ___ . _ .July 6 _____ .-
11.22 12.88 14.34 15.45 12.40 5.86
Aug. 3, 1950 _____
Oct. 31 _ _ ._.--
5.49 4.91 6.14 8.45 9.44
10.54
Al-4-24ca
July 15, 1948 . Aug. 18 ____ ----._Sept.23_.._- . -- .Oct. 21 ____ -. _ _Dee. 1__ .... .. .Jan. 11, 1949_______Feb. 8. _ ........Mar. 7 __ ._
Apr. 25__ .May 27
3.37 5.11 5.90 6.65 7.08 7.37 7.53 7.42 7.44 7.48 8.04
July 1, 1949 __ .Till 17 9QAi.tr 9^
Oct. 28 ____ . .Nov. 28.. ___ -_
Mar. 3_. ...-.--
4.82 5.32 5.58 5.92 6.59 7.02 7.29 7.41 7.53 7.54
Apr. 26, 1950. _ -
July 6 __ ------
Aug. 26. _ --_...Sept. 27 __ -------
Feb. 2,1951. -
7.55 7.37 4.58 4.61 5.60 6.00 6.73 7.13 7.34 7.51
Al-4-27cal
July 12, 1949 ___ .. 8.90 6.11 5.60
8.63 14.56
Nov. 28, 1949. -Jan. 30, 1950 .-
18.14 22.94
Al-4-27cd2
July 14, 1949 ____ 39.12 37.83
Aug. 25, 1949.. ... 37.05 37.27
Oet. 28, 1949 .... 38.35
Al-4-28ab
Mar. 30, 1951 _ . ...Apr. 28 __ ... _ ..June 6 _._ __._--June26_. _ _. __
Dry Dry Dry Dry
July 30, 1951 __ .
Sept. 28 __ ------
7.23 6.39 5.85
Oct. 26, 1951.- Nov.27 __ ---...Dee. 26 ____ ...
7.72 Dry Dry
Al-4-28bal
July 8, 1949 _______
Sept. 22 ____ . .____Oct. 28 __ ___.-___.Nov. 28 ____________
13.50 12.55 10.25 10.76 12.71 14.13
Jan. 31, 1950 _ .. Mar. 3 ____ _ .
July 6 ______ -
16.72 17.87 18.71 19.70 20.03 16.20
Aug. 3, 1950 _____ Aug. 26 _____. _Sept. 27 ______ .Oct. 31 __________Dee. 1 __________Dee. 26__.. _
14.65 10.13 11.63 13.8615.43 15.90
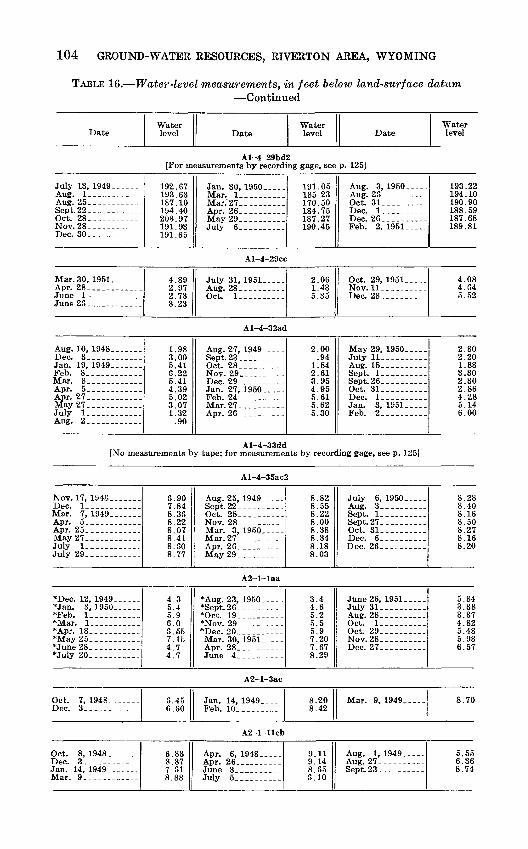
104 GROUND-WATER RESOURCES, RIVERTON AREA, WYOMING
TABLE 16. Water-level measurements, in feet below land-surface datum Continued
DateWater level Date
Water level Date
Water level
Al-4-29bd2[For measurements by recording gage, see p. 125]
July 13, 1949______Aug. l._ _ ____ _Aug. 25--Sept.22 _ ...Oct. 28 . .-... .Nov. 28 -..._Dec. 30 _ _____
192.67193.631ST. 10194.40203.97191.93
Jan. 30, 1950 . .Mar. 1 .......Mar.'27 ---------
July 6- _.......
191.05185.23170.50184 . 75187.27190.45
Aug. 3, 1950.----Aug. 26-- ___.._.Oct. 31---------.Dec. 1-------- -Dec. 26Feb. 2, 1951 ...
193.22194.10190 . 90188.59187.68189.81
Al-4-29cc
Mar. 30, 1951. ......Apr. 28 ... . .. ._
June 26-. . __ ....
4.892.972.733.23
July 31, 1951.----
Oct. l._ .__---_
2.061.435.35
Oct. 29, 1951 -. ...Nov.ll. ._.-.---.Dec. 28
4.084.645.52
Al-4-32ad
Aug. 10, 1948.......Dec. 3 . . -. _Jan. 19, 1949 ._ .Feb. 8-_ __ .......Mar. 8__ ... ......
Apr. 27 __ .__.....-May 27 ------July 1- _....-....Aug. 2 .. ._
1.983.005.416.225.414.395.023.071.32
.90
Aug. 27, 1949_----
Oct. 28 . _ _Nov. 29. __ _____
Feb. 24 . ___ ...Mar. 27 - _ -----
2.00.94
1.842.613.954.955.615.625.30
May 29, 1950. . ...July 11-. __ __--Aug. 15 ____ --.-Sept. 1 __ ......Sept.26.. _ ...Oct. 31.__. ------
Jan. 3, 1951 -...Feb. 2. --__---
2.802.201.883.302.302.864.285.146.00
Al-4-33dd[No measurements by tape; for measurements by recording gage, see p. 125]
Nov. 17, 1948_-__.__
Mar. 7, 1949 ..____
Apr. 25 ..--_May 27.- ........July !.-_. _._._.._July 29 __ -_._____
*Dec. 12, 1949______*Jan. 3, 1950__-___*Feb. 1_- _ ______*Mar. l._ .. . ___*Apr. 18...........*May25_ .........*June28_ _ ___. .*July 20 - -. __ _
Oct. 7, 1948_______Dec. 3 .. _____ __
Oct. 8, 1948 -. _ .
Jan. 14, 1949_._- ...Mar. 9-._ .. _ ..
6.907.848.368.228.078.418.608.77
4.35.45.96.06.557.154.74.7
6.456.60
6.838.377.618.88
Al-4-35ac
Aug. 25, 1949_____
Nov. 28. -. __ .._Mar. 3, 1950-...-
May 29. _________
A2-l-laa
*Sept.26 -------*Oct. 19 . -.
*Dec. 20. .........Mar. 30, 1951.----
A2-l-3ac
Jan. 14, 1949.-.. _Feb. 10. . ........
A2-l-llcb
Apr. 6, 1948 __ _Apr. 26. __ .---__June 3July 5 __ _--. _
2
8.828.558.228.008.388.348.188.03
3.44.65.25.55.97.207.678.29
8.208.42
9.119.148.656.10
July 6, 1950 ---_Aug. 3.- __Sept. 1Sept. 27.. -------Oct. 31 ---------
Dec. 26-_ _ ---__
June 26, 1951 ...July 31 . ... __Aug. 28 . _ .Oct. 1 _ . . .Oct. 29...... _ .Nov.28 _ _ _ .Dec. 27. .........
Mar. 9, 1949_-.-.
Aug. 1, 1949 .....Aug. 27Sept.23_-._. .---
8.288.408.168.508.278.168.20
5.843.383.374.825.485.986.57
8.70
5.556.368.74
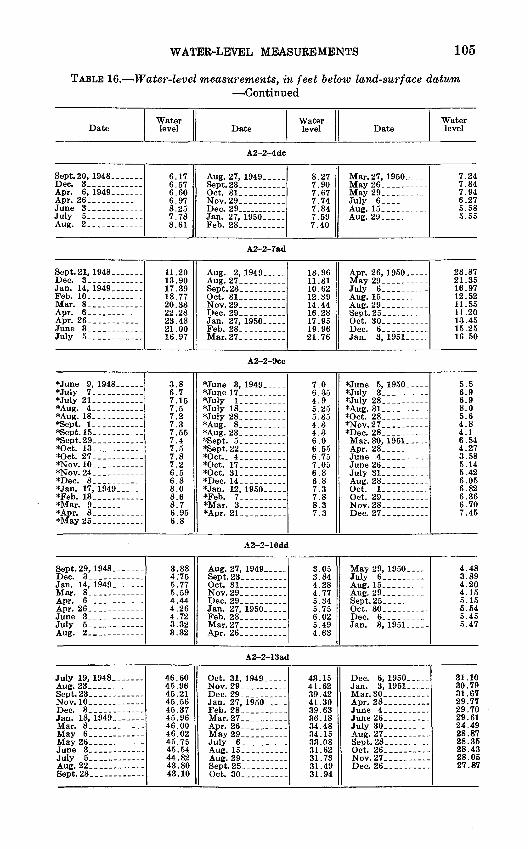
WATER-LEVEL MEASUREMENTS 105
TABLE 16. Water-level measurements, in feet below land-surface datum Continued
DateWater level Date
Water level Date
Water level
A2-2-4de
Sept.20, 1948 ____Dec. 3 ___ . ......Apr. 6, 1949 --.-.Apr. 26.. __ ......June 3 ... -. _ .July 5-_ .........Aug. 2 .. ..... _
6.176.576.606.978.257.788.61
Oct. 31 . ____ _Nov. 29 ... ...Dee. 29...........
Feb. 28._ _.
8.277.907.677.747.847.597.40
Mar. 27, 1950 -----
May 29. .. .....July 6 . _ -_-.-Aug. 15 _ -_- .Aug. 29.. _.. ---
7.247.847.946.275.585.55
A2-2-7ad
Sept. 21, 1948 ___ ..Dee. 3. . __ ..Jan. 14, 1949 .......Feb. 10 . _ . ___ .Mar. 8 __ .-.-..._Apr. 6.. ______ _._Apr. 26 _ _ -_-__._
July 5-____- ______
11.2013.9017.3918.7720.3322.2823.4821.0016.97
Aug. 2, 1949 _ _.Aug. 27..
Oct. 31 . ____ _Nov. 29 . ____ .Dee. 29 __.......Jan. 27, 1950 . -Feb. 28, ..._.-_Mar.27. ._.....
13.9611.3110.6212.3914.4416.2817.9519.96
Apr. 26, 1950..---May 29 .. . .July 6 __ ...Aug. 15.. _ __--.
Oct. 30_. --------
Jan. 3, 1951 -...
23.8721.3516.9712.5211.5511.2013.4515.2516.50
A2-2-9cc
*June 9, 1948. -._*July 7. ____ ---_*July 21 __ ....---*Aug. 4 .. _ ....*Aug. 18 ---------*Sept. 1- ... ___ *Sept.l5. _ ----.-_
*Oet. 13 __ --------*Oet. 27 __ --.- ...*Nov. 10 __ - ___ -*Nov.24_ __ . ___ -*Dee. 8 . .-..*Jan. 17, 1949 ___ -*Feb. 13 __ ..___.-.*Mar. 9 ____ _..-.*Apr. 8 __ _.-.-.--*May25 ____ ....
3.86.77.157.57.27.37.557.47.57.87.26.56.88.08.68.76.956.8
*Junel7 __ ..-.-*July 1 __ .......*July 18 .........*July 28. _ __ ____*Aug. 8_. ..-._._*Aug. 23_. ........*Sept. 5. ____ -.-*Sept.22 ... ._ _*Oet._ 4_. ....._..*Oet. 17*Oet. 31-- __ -.-*Dee. 14 ._...__*Jan. 12, 1950 - __*Feb. 7 __ _______*Mar. 3*Apr. 21.. ___....
7.06.354.95.255.354.34.36.06.556.757.056.86.87.37.88.37.3
*June 5, 1950-- .*July 3 . -------*July 28 __ ...-_-_*Aug. 31 __. .-*Oet. 28. __ -_-_*Nov.27._.. - __ -*Dee. 28 __ _. _Mar. 30, 1951 __ -
July 31 ----- ...
Oct. l._ .._.-.._Oct. 29.. __ .---Nov.28_. __ .---Dee. 27-. ___ .. .
5.56.96.98.05.64.84.16.544.273.585.145.426.056.826.366.707.45
A2-2-10dd
Sept. 29, 1948. ......Dee. 3 ..Jan. 14, 1949-. ...Mar. 8. __ ..._____Apr. 6 __ . __ ...Apr. 26.-. ---------
July 5 __ ---------Aug. 2 ___ - ___ -
3.884:755.775.594.444.264.723.323.32
Oct. 31 __ .--_-..Nov.29._. - __ _Dec. 29Jan. 27, 1950- ....Feb. 28 _. _. .-Mar.27 ___ ...
3.053.844.284.775.345.756.025.494.63
May 29, 1950. ....
Dee. 6_. ... ... .Jan. 3, 1951. . ..
4.483.894.204.155.155.545.455.47
A2-2-13ad
July 19, 1948 _ . Aug. 23 __ . ___ -
Nov. 10 _______ -
Jan. 18, 1949. ...Mar. 8 ____ __
May 26 __ .... .
July 5 ____Aug. 22 ___ . _ ...Sept.23._ ____ - -
46.6045.9645.2145.5645.3745.9646.0046.0245.7545.5444.8243.8043.10
Oct. 31, 1949-- .Nov. 29 _ .._-.
Jan. 27, 1950 ....Feb. 28. ... __ -Mar.27 __ . __ .
May 29 _____ ..July 6. __ .-.-Aug. 15 ____ ...-
Sept.25 ____ .
43.1541.6239.4241.3039.6336.1834.4834.1533.0831.6231.7331.4931.94
Dee. 6, 1950 _ .Jan. 3, 1951 ... ..
July 30 ___Aug. 27. __ ...-.
Nov.27 __ -
31.1030.7931.6729.7729.7029.6124.4928.8728.3528.4328.0527.87
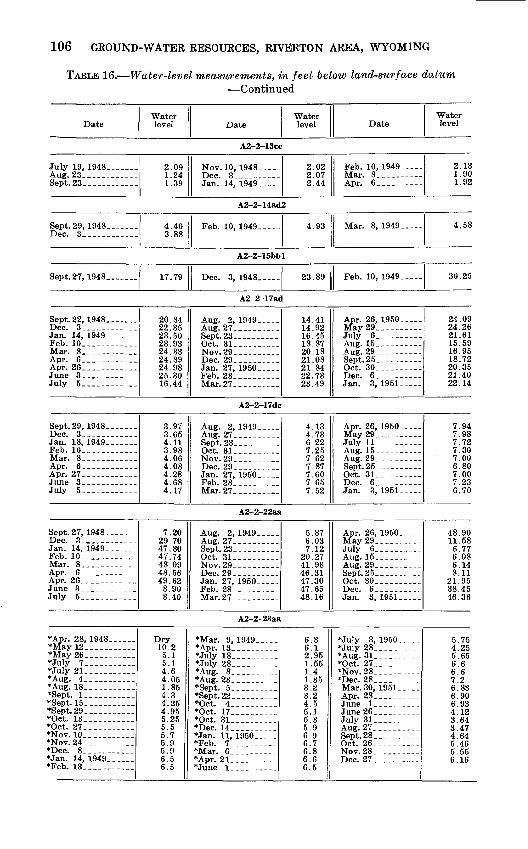
106 GROUND-WATER RESOURCES, RIVERTON AREA, WYOMING
TABLE 16. Water-level measurements, in feet below land-surface datum Continued
DateWater level Date
Water level Date
Water level
A2-2-13cc
July 19, 1948. _ _____Aug. 23. __ -__-___Sept.23.. _ _- __
2.091.241.39
Nov. 10, 1948__ _ 2.022.072.44
Feb. 10, 1949 .Mar. 8__ ___ _ Apr. 6_ . --
2.131.901.92
A2-2-14ad2
Sept. 29, 1948. ______Dee. 3 _____ ____
4.403.88
Feb. 10, 1949 _ ._ 4.93 Mar. 8, 1949 _ _- 4.58
A2-2-15bbl
Sept. 27, 1948 _______ 17; 79 Dee. 3, 1948 _____ 23.89 Feb. 10, 1949. __ 30.25
A2-2-17ad
Sept. 22, 1948 ____ _Dee. 3____ Jan. 14, 1949Feb. 10_. ___ _____Mar. 8_--._ ____
Apr. 26____. __ ...
July 5 _____ _-.__
20.8422.3523.5023.9324.3324.8924.9825.3016.44
Aug. 27.. _ -
Nov.29. ..___.__7~l£_/» OQ
Feb. 28.. ____ -.Mar.27. _ ..._
14.4114.9216.4518.8720.1821.0821.8422.7323.49
Apr. 26, 1950. ...May29_. ____ _July 6__ _______
Aug. 29. ____ --
Dee. 6. _ ___.Jan. 3,1951-. -
24.0924.2621.6115.5916.9518.7220.3521.4022.14
A2-2-17dc
Sept. 29, 1948 ____ _Dee. 3 _ _ -Jan. 18, 1949. _ __Feb. 10...---.- _ _Mar. 8. ___________
Apr. 27__.-_ ...
July 5 _____ -___
3.973.654.113.984.064.084.284.684.17
Aug. 27._ -------Sept.23- __-.-.-.Oct. 31. _ _ ---.Nov. 29_ __--. _T.or> 9Q
Jan. 27, 1950 _ _Feb. 28____-__ ...Mar.27 ... ____
4.134.736.227.257.627.877.607.657.52
Apr. 26, 1950 . _May 29-. _ -----July 11 . __ -----
Aug. 29 _ .___
Oct. 31. _..---_.
Jan. 3, 1951 ___.
7.947.987.727.307.006.807.007.236.70
A2-2-22aa
Sept. 27, 1948 ____ _Dec. 3 ____ - __ _Jan. 14, 1949--- .Feb. 10. __ ------Mar. 8 __ _____ .Apr. 6Apr. 26 _ ___ __._June 3 .July 5 ____________
7 9f>
29.7047.3047.7448.0948.5649.628.908.40
Auff 2 1949Aug. 27. --------Sept.23 --------
Jan 97 1Q£fi
Feb. 28_._. ---_-_Mar.27.- .- ___
5.876.037.12
20.2741.9846.31
47.6548.16
A r.1- 9fi IQ^ft
May 29 _ ___July 6_______
Aug. 29... -----Sept.25 _----_.-
Dec. 6 __- ...
48.9011.586.776.086.148.11
21.9538.4546.36
A2-2-23aa
*Apr. 28, 1948- - __*May 12 ___ . .*May26- _______*July 7.. _________*July 21.. ________*Aug. 4__ _*Aug. 18 _ ___ ...*Sept. 1.*Sept. 15. _ --_-___*Sept.29 ___ . _____*Oet. 13. ... _____*Oet. 27.. _._ _ ..*Nov. 10__. . ....*Nov. 24. ------ __*Dec. 8 -. ___*Jan. 14, 1949 _ _*Feb. 13.. _ -_.-,-.
10.25.15.14.64.051.854.34.254.955.255.55.75.95.96.56.5
*Mar 9 1949*Apr. 13 _._ _*July 18 __ ._- _*July 28____-__-_-*Aug. 8.. _____-_.*Aug. 23.. __ .___
*Oet. 4-. ____ .*Oet. 17 ------*Oct. 31- _ --.-*Dee. 14-- -------*Jan. 11, 1950 . .*Feb. 7*Mar. 6_. _ -----*Apr. 21..
6 06.12.951.551.41.353.23.24.5t\ 15.35.96 96.76.86.66.5
*July 3, 1950 __*July 28.. ..__--_*Aug. 31. __.--_--*Oet. 27 _ -._._*Nov.28._ -------*Dee. 28--..--....Mar. 30, 1951 _.__
June 26- _ .....July 31. _._. -Aug. 27 __..._ _Sept. 28-_. ._.....Oct. 26_____._...Nov.28._ __ .-._Dec. 27 - _ -----
>» t*\A. y^5.656.66.67.26.836.906.934.123.643.474.645.465.556.16
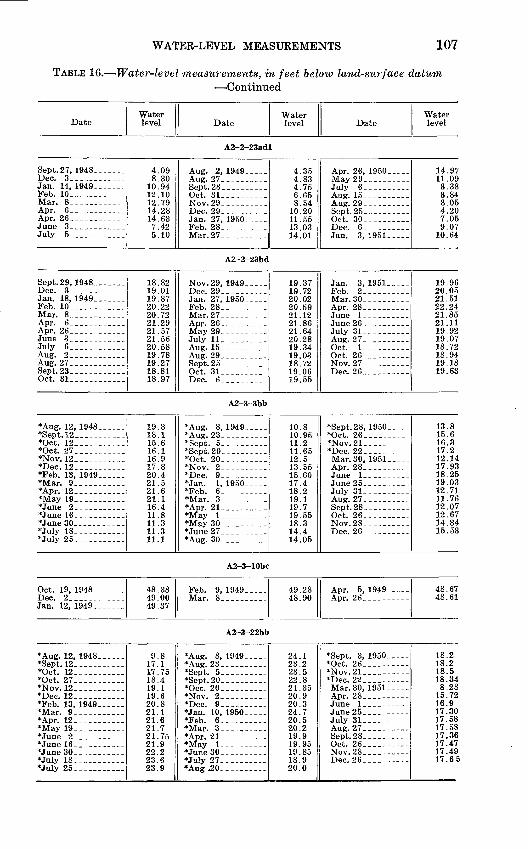
WATER-LEVEL MEASUREMENTS 107
TABLE 16. Water-level measurements, in feet below land-surface datum Continued
DateWater level Date
Water level Date
Water level
A2-2-23adl
Sept.27, 1948... ....Dec. 3 __Jan. 14, 1949 _ _Feb. 10 ._ _. __..Mar. 8 . .Apr. 6 .._ .....Apr. 26_ . ...June 3 ......July 5 __ .....
4.098.30
10.9412.1012.7914.2814.637.425.10
Aug. 27_ ______ _
Oct. 31 __ _____Nov.29_ .......
Feb. 28. _.__..._Mar.27 _. ___
4.354.834.756.658.54
10.20
13.0314.01
ATM- 9fi 1QKO
May 29July 6__ ..------
Jan. 3, 1951 ____
14.9711.093.383.843.054.207.059.07
10.64
A2-2-23bd
Sept. 29, 1948 _.. ...Dee. 3Jan. 18, 1949- Peb. 10 ----__Mar. 8-.-..-.-....Apr. 6 _......Apr. 26 -------
July 6 ___ . -Aug. 2 ._ . . .Aug. 27Sept.23. ------Oct. 31 _ __ .
18.8219.0119.8720.2220.7221.2921.5721.5620.5819.7819.2718.8118.97
Nov. 29, 1949 _ ..Dec. 29 . _ .....
Feb. 28_ _______Mar.27_. ..._.__
July 11. _........Aug. 15.. -. _ __
Oct. 31 _ ._.._
19.3719.7220.02
21.1221.8621.64
19.3419.0318.7219.0619.55
Jan. 3, 1951.-- Feb. 2_ --------
July 31__ _ ---.Ancr 97
Nov.27 _ __ .-_-Dec. 26 _._-..
19.9620.0521.5122.2421.8521.1119.9219.0718.7218.9419.1819.63
A2-3-3bb
*Aug. 12, 1948 __ ...*Sept.l2 _----._._*Oct. 12_ __---_-.*Oet. 27. -_- --_.*Nov. 12 __ ____*Dee. 12 . ....--*Feb. 13, 1949 ... -*Mar. 9-. __.-. *Apr. 12 _---. .--
*June 16 -----._*June 30 -*July 18.. ._-----..*July 25. . .........
19.318.115.616.116.917.820.421.521.621.116.411.811.311.311.1
*Aug 8 1949*Ancr 9^
*Sept. 5.. -
*Oct. 20 _ _____*Nov. 2_. _______
*Jan. 1,1950. *Feb. 6_________.*Mar. 3___ _____*Apr. 21..... ._..-*May 1. .........
*Aug. 30_. ________
10.8
11.211.6512.513.5515.6017.418.219.119.719.5518.3
14.05
*Sept.28, 1950 ___
*Dee. 22. Mar. 30, 1951 .
July 31_ ... -Aug. 27. .. ... ..
Nov.28 . .
13.815.616.317.212.1417.9318.2519.0312.7111.7612.0712.6714.3415.53
A2-3-10bc
Oct. 19, 1948 _ __-_
Jan. 12, 1949_______
48.3849.0049.37
Feb. 9, 1949 _...Mar. 8 _ _____
49.2848.90
Apr. 5, 1949 . . 48.6748.61
A2-3-22bb
*Aug. 12, 1948 ... ._*Sept. 12. _ _._ _*Oet. 12 _ ..... ..*Oct. 27 ..- __*Nov.l2 ._....*Dec. 12_. __ _____*Feb. 13, 1949 ._ ..
*Apr. 12 ._.-____*May 19. ..........
*June 30 _ . .*July 18_ ____ ... .*July 25. ........
9.817.117.7518.419.119.620.821.121.621.721.7521.922.223.623.9
*Aug. 8,1949_ _-*Aug. 23 __ -__-.*Sept. 5 __ -__.___
*Oet. 20 _______*Nov. Z.. ........*Dee. 9 .. . .*Jan. 10, 1950. ..*Feb. 6-. _----..*Mar. 3. .........*Apr. 21 ... ....*May 1 . _ -----
*July 27.. ___ .*Aug.20 _.....
24.123.. 223.522.821.3520.920.324.720.520.219.919.9519.8518.920.0
*Sept. 3, 1950 _.-_*Oct. 26_- -------*Nov.21. -------*Dec. 22 .... --Mar. 30, 1951- _ Apr. 28 . - --.
July 31 -------Aug. 27 _ ._Sept. 28 -. .--.Oct. 26 . __..Nov.28 ------Dec. 26_ _. _- --
18.218.218.518.348.28
15.7216.917.3017.5817.5817.3617.4717.4917.65
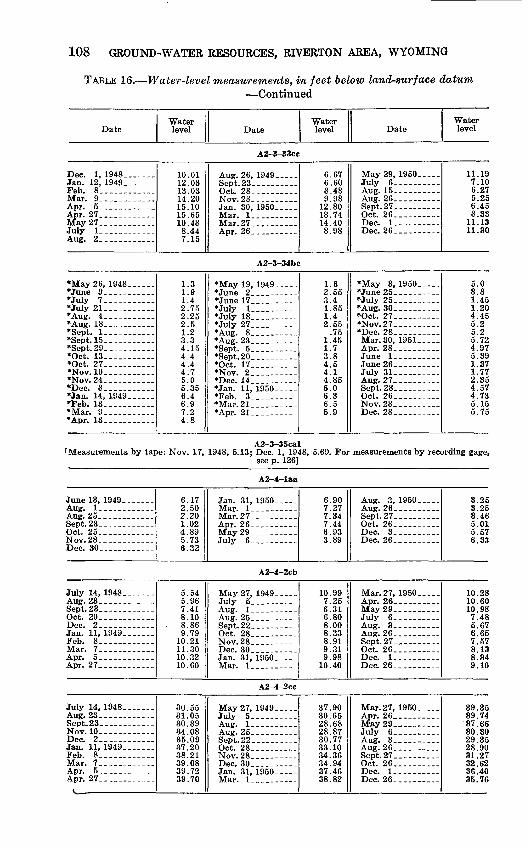
108 GROUND-WATER RESOURCES, RIVERTON AREA, WYOMING
TABLE 16. Water-level measurements, in feet below land-surface datum Continued
DateWater level Date
Water level Date
Water level
A2-3-33cc
Dec. 1, 1948...--..Jan. 12, 1949 . --Feb. 8_. ..........Mar. 9 . .
Apr. 27. ._.-----.--May 27 ____ _ ..July 1. .._--- _ .
10.0112.0313.0314.2015.1015.6510.488.447.15
Aug. 26, 1949 .... .
Oct. 28.. ........Nov. 28 __ . .Jan. 30, 1950 __ .Mar. 1 __ __ .Mar.27 __ . _ -
6.676.608.489.98
12.8013.7414.408.98
May 29, 1950 -...July 6 ____ ...Aug. 15 ____ .Aug. 26 ___ ...Sept.27. ___ --.Oct. 26.._ .- -.Dec. 1. __ -.- --Dec. 26 -..-- -.
11.197.106.275.256.458.33
11.1811.30
A2-3-34bc
*May26, 1948 .-...*June 9. .. ... .*July 7..- _ .....*July 21 __ .... ...
*Aug. 18 __ ..._._*Sept. I...... _ ..*Sept. 15... _.__-.--*Sept. 29-. -_..._---*Oct. 13 - ____ .*Oct. 27.. . ........*Nov. 10 ____ ..*Nov.24. . ... ....*Dec. 8 ___ . ..*Jan. 14, 1949 _ ..*Feb. 13._. __ .*Mar. 9 . .. .--.*Apr. 13 . . _..-
1 <i1.91.42.752.252.51.23.34.154.44.44.75.05.356.46.97.24.8
*May 19, 1949-----
*Junel7 __ ....*July 1 __ ._...-*July 18 .... ....*July 27____. ...*Aug. 8 .. .--*Aug. 23 __ ------
*Oct 17*Nov. 2_. _ -.*Dec 14*Jan. 11, 1950 --..*Feb. 3 . .......*Mar.21__ ........*Ani- 91
1.62.553.41.851.42.55
.751.451.73.84.54.14.856.06.36.55.9
*May 3, 1950 .....*June25.__- ----*July 25. ___ . _*Aug. 30 __ ------*Oct. 27. ___ _*Nov.27. ._. ....*Dec. 28. __ . .Mar. 30, 1951.-..Apr. 28.. _ .-- -
July 31 _____ -
Sept. 28 __ ...Oct. 26...... - -Nov.28_. .-. ...Dec. 28 ___ --.-
5.03.81.451.204.455.25.25.724.975.391.371.772.354.574.735.155.75
A2-3-35cal "Measurements by tape: Nov. 17, 1948, 5.13; Dec. 1, 1948, 5.69. For measurements by recording gage,
see p. 126]
A2-4-laa
June 13, 1949. --__.-
Aug. 25 - - ..- ...Sept. 23 -----
Nov.28----. -------
6.172.502.201.024.895.736.32
Jan. 31, 1950 . ..Mar 1Mar.27 . __ ...Apr. 26 _... ..May 29July 6 __ -------
6.907.277.347.446.933.89
Aug. 3, 1950 __ .
Oct. 26 ._.. ...Dec. 3- - .....
3.253.253.465.015.576.33
A2-4-2cb
July 14, 1948-------Aug. 23 -. ---. __Sept.23 __ ... . ..Oct. 20 __.. ... .
Jan. 11, 1949-. ...Feb. 8---..----...Mar. 7 __ ---------
Apr. 27. . -------
5.545.967.418.10
. 8.869.79
10.2111.3010.3210.60
July 5 ... ___ _
Aug. 25.. __ .. -
Nov.28. -.. -..-
Jan. 31, 1950 ___Mar. !____ __ .
1 rt QQ
7.256.316.808.008.338.919.319.98
10.40
Mar.27, 1950 .....
May 29.. _..._._.July 6 __ .......
Sept.27 __ ___Oct. 26 ____ . -Dec. 1 _____ .
10.2810.6010.987.485.676.657.578.138.349.10
A2-4-2cc
July 14, 1948-------Aug. 23 ___ _______Sept.23 __ . ......Nov. 10-...-.-..-..Dec. 2... -.- _Jan. 11, 1949 ------Feb. 8 ____ ......Mar. 7.. _ ......
Apr. 27-... _ .....«
30.5531.0530.8934.0835.0937.2038.2139.083Q 79
39.70
May 27, 1949 .....
Sept.22 __ _ .
Nov.28.- _ .
Jan. 31, 1950 ___TVTnr 1
37.9030.6528.6828.8730.7733.1034.3634.9437.4638.82
Mar.27, 1950 __ .
May 29 _______July 6 ___ -...-
Aug. 26 __ .......
Oct. 26 __ .....
39.3539.7437.6630.3029.3528.9031.2732.6236.4035.76
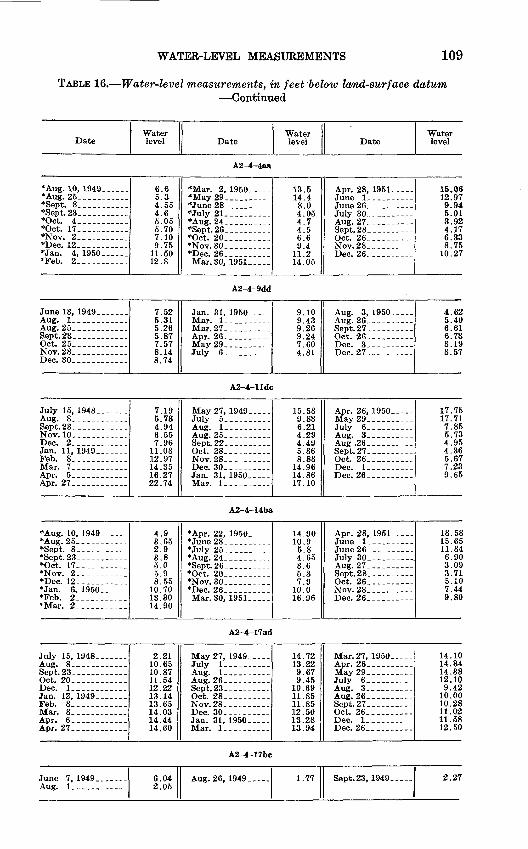
WATER-LEVEL MEASUREMENTS 109
TABLE 16. Water-level measurements, in feet 'below land-surface datum Continued
DateWater level Date
Water level Date
Water level
A2-4-4aa
*Aug. 10, 1949 -*Aug. 25 __ ........*Sept. 8 __ ........*Sept.23___ ... ..*Oct. 4..-- ____ _*0ct. 17.. .........*Nov. 2 __ _ ...*Dec. 12-. _____ .*Jan. 4, 1950. - ._*Feb. 2 __ ....----
6.65.34.554.65.055.707.109.75
11.5012.8
*May29 ____ ...*June28 . __ ...*July 21 __ ..---.-*Aug. 24.. ____ _
*Oct. 20.. ____ .*Nov.30 _____ .*Dec. 26..........
13.514 48.04.054.74.56.69.4
11.214.05
Apr. 28, 1951 -
July 30 - _ ----Aug. 27. ___ .---Sept.28- --------Oct. 26 _____ .-Nov.28 __ ------Dec. 26 -----
15.0612.979.945.013.924.176.338.75
10.27
A2-4-9dd
June 13, 1949.--- .._
Aug. 25. __-_-- _- -Sept.23..-- ... ..Oct. 25 __ ---..Nov. 28_._.. ____ -Dec. 30. ... - -.-
7.525.315.265.877.578.148.74
Jan. 31, 1950 - Mar. 1_._. .-. .Mar.27 ---------Apr. 26 __ ....--.
July 6 __ .......
9.109.439.269.247.604.81
Aug. 3,1950 -
Dec. 27... -------
4.625.406.616.738.198.57
A2-4-lldc
July 15, 1948. ------Aug. 8. _. -.---.Sept.23,- . -_-_--Nov. 10_-------- -Dec. 2.-_. .... _-Jan. 11, 1949 ______Feb. 8__ -_---Mar. 7 __ ........
Apr. 27_- . -... ..
7.195.734.946.557.96
11.0812.9714.3516.2722.74
May 27, 1949. July 5.--. ------
A no- 9 PI
Nov.28_ --------
Jan. 31, 1950 __ -Mar. 1- __ ..
15.589.836.214.294.495.868.88
14.9614.8617.10
Apr. 26, 1950 ._..
July 6 __ -------
Aug .26.- __ -.--Sept.27. ----- -Oct. 26..
Dec. 26. _ -----
17.7517.717.855.734.954.365.677.239.65
A2-4-14ba
*Aug. 10, 1949 - -.-*Aug. 25 __ ------*Sept. 8 ----------*Sept.23 _____ -.-*Oct. 17- .._......*Nov. 2.. . _---*Dec. 12.- __ -----*Jan. 6, 1950 *Peb. 2 . -_ -_.
4.93.652.93.85.05.98.55
10.7013.3014.90
*Apr. 22, 1950 -
*TlTll7 9Pi
*Aug. 24- _. ---.
*Oct. 20 ..-.--.--*Nov. 30 _ - --_*Dec. 26Mar. 30, 1951. . .
14.9010.95.84.653.65.37.9
10.016.96
Apr. 28, 1951- _ -
July 30 ___ -.-,Aug. 27 ... Sept.28_--_. -_-Oct. 26. _-- Nov.28 __ . _ -__Dec. 26 __ -------
18.5815.6511.846.903.093.715.107.449.80
A2-4-17ad
July 15, 1948 .
Sept.23 ___ -_Oct. 20_ ___ -_-.-
Jan. 12, 1949 _ ..Feb. 8__ . ... .....Mar. 8 __ _... Apr. 6 -_ _ .-.-Apr. 27 ___ - ...
2.2110.6510.8711.5412.2213.1413.6514.0314.4414.60
May 27, 1949. July 1 -. .- . Aug. 1_. -------Aug. 26 __ --_. -
Oct. 28 ____ _--Nov.28__ ____ -
Jan. 31, 1950 __ -Mar. 1--.. __ --
14.7213.229.679.45
10.6911.8511.8512.5013.2813.94
Mar.27, 1950---Apr. 26. _ .
July 6_. ------
Aug. 26... -----
Oct. 26 - ------
Dec. 26.. . _ ...
14.1014.3414.3312.109.42
10.0010.2811.0211.5812.50
A2-4-17bc
June 7, 1949 ____ 6.042.05
Aug. 26, 1949 1.77 Sept.23, 1949 -
1
2.27
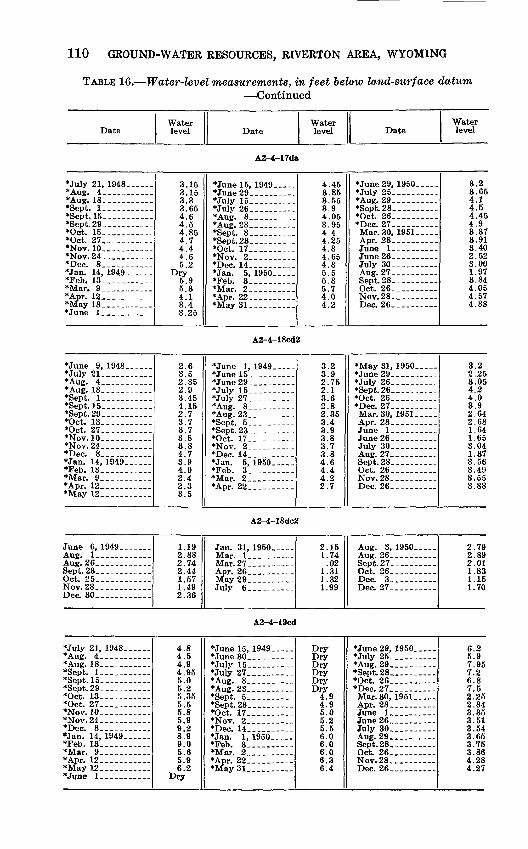
110 GROUND-WATER RESOURCES, RIVERTON AREA, WYOMING
TABLE 16. Water-level measurements, in feet below land-surface datum- Continued
DateWater level Date
Water level Date
Water level
A2-4-17da
*July 21, 1948 ______*Aug. 4_ _____ -*Aug. 18 __ --------*Sept. 1 ___________*Sept. 15_ -. ______*Sept.29_ __________*Oct. 15- _ _______*Oct. 27_. ____ -*Nov. 10-. -__- *Nov.24 ___________*Dec. 8.____ ------*Jan. 14, 1949--- *Feb. 13 . . ___ .*Mar. 9_. _ . _____*Apr. 12 __ --------*May 18 - -*June !___-._ -_
3.153.153.33.654.64 C
4.854.74.44.65.2
5.95.34.13.43.25
*Junel5, 1949 __ _.
*July 15 __________*July 26 ____ ...*Aug. 8 __ __-_-.*Aug. 23 __ -------*Sept. 8 ___- *Sept.23__ - _*Oct 17*Nov. Z.. ....... -*Dec 14*Taw t\ 1Q^n
*Feb. 3- __ - _ .*Mnr 9
*Apr. 22. __ ------*May 31
4.453.853.553.94.053.954.44.254.84.654.85.55.85.74.04 9
*June29, 1950 __ .*July 25 ______ .*Aug. 29 ___ -*Sept. 28.. . *Oct. 26. __ . .
Mar. 30, 1951. Apr. 28 ___ . _ -
June 26__- _ -July 30 --- Aug. 27 __ ... -Sept. 28-,. -------Oct. 26 ----- _ -Nov.28 ______ .
3.23.654.14.54.454.93.373.913.402.523.001.973.844.054.574.88
A2-4-18cd2
*June 9, 1948 ______*July 21____. _*Aug. 4 ___________*Aug. 18- ____ --.*Sept. 1_____ ______*Sept. 15_- . - - -*Sept.29_.- __ -._*Oct. 13---. _ - *Oct. 27---- _ ---.*Nov. 10 .-- _ -.-.*Nov.24___. _______*Dec. 8__ - - ___*Jan. 14, 1949 *Feb. 13.__- - .*Mar. 9.-- _ ...*Apr. 12 __ __ -__.*May 12 ._. ____
2.63.52.852.93.454.152.73.73.73.83.84.73.94.02.42.33.5
*June 1, 1949 ___
*July 15 __ ------*July 27- --------*Aug. 8 .--_-_--
*Qtir,f K
*Sept.23_ -_----._*Oct 17*Nov. 2- - --_- *Dec 14
*Feb. 3___ ------*Mar 2*Am» 99
3.23.92.752.13.62.82.353.43.93.83.73.84.64.4A 9
2.7
*May31, 1950 _ -
"July 26--- *Sept.26 __ -. _ -*Oct. 26-- - _____*Dec. 27_ _ ------Mar. 30, 1951---
July 30- __ ______Aug. 27__ ____ -Sept. 28 ______ .Oct. 26__ _ _ ._Nov.28 __ _, _
3.22.253.054.24.03.92.642.681.641.653.041.373.563.493.553.88
A2-4-18dc2
Aug. 1 __ --------Aug. 26 __ ....--...Sept.23___--- -_ __Oct. 25 ___.__--.._Nov.28---. _-_.-.-_Dec. 30__ -__.-_-.
1 1Q2.882.742.441.571.492.36
Jan. 31, 1950 ___Mar. 1. ______TW-iT> 97
May 29.- ___ ...July 6 --. __ .
2 1 p-
1.74.02
1.311.321.99
Aug. 3, 1950 __ _Aug. 26_____ ____-
Oct. 26__ ________Dec. 3 ..........Dec. 27 __ _______
2.792.892.011.831.151.70
A2-4-19cd
*July 21, 1948 ______*Aug. 4.- _________*Aug. 18-... -_-___-*Sept. 1___________*Sept.l5- __________*Sept.29- _ . -._*Oct. 13- -----*Oct. 27_-.__ ______*Nov. 10. _ ______*Nov.24__ ____ *Dec. 8. ___ _ Jan. 14, 1949 ___ _*Peb. 13.. _ _ __ -*Mar. 9-. ___ __._*Apr. 12- -----*May 12-__ ____
4.84.54.94.955.05.25.355.55.85.99.28.99.05.65.96.2
Dry
*June30_._- _ _*July 15 ____ *July 27 __ ------*Aug. 8____ -*Aug. Z&.. ........*Sept. 5__ *Sept.23 ______ -*Oct. 17 _____ _-*Nov. 2__ ____ __*Dec 14*Jan. 1, 1950 ___*Feb. 3 ______ .*TVTnp 9*Apr. 22 _ *May31 _______
Dry
Dry
4.94.95.05.25.56.06.06.06.36.4
*June29, 1950 ___*July 25 .__.. *Aug. 29_____ _...*Sept.28 __ . ___*Oct. 26 ___ _ .*Dec. 27___. __.__-Mar. 30, 1951 _____Apr. 28 __ _______
July 30 _______
Oct. 26 _______Nov.28 __ .___-
6.25.97.957 96.87.52 9^2.843.353.513.543.653.753.864.284.27
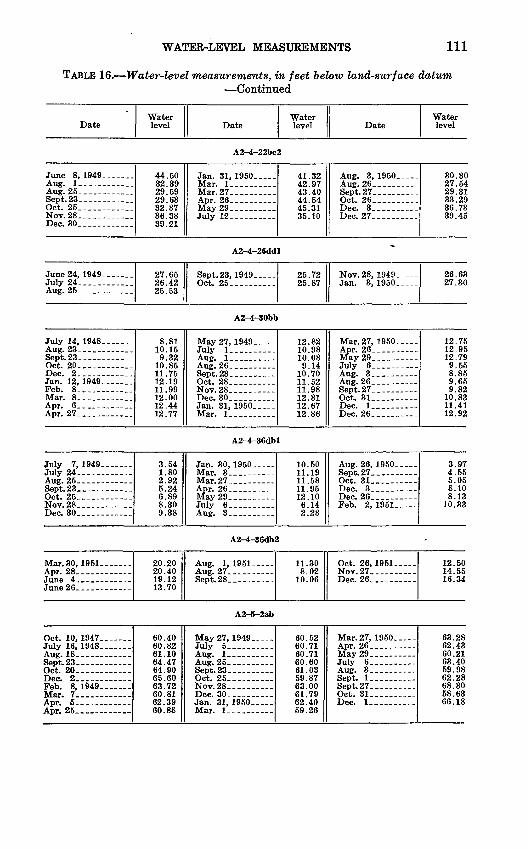
WATER-LEVEL MEASUREMENTS 111
TABLE 16. Water-level measurements, in feet below land-surface datum Continued
DateWater level Date
Water level Date
Water level
A2-4-22bc2
June 8, 1949 ___Aug. 1... .........Aug. 25 __ - ...Sept. 23 __..........Oct. 25. ....._.._.Nov.28 __ ... __.Dec. 30. .........
44.50 32.39 29.59 29.63 32.87 36.38 39.21
Jan. 31,1950 .. Mar. 1 ______ .Mar.27 ___ .....
May29_ _._...._July 12--_. ------
41.32 42.97 43.40 44.54 45.31 35.10
Aug. 3, 1950 _ .
Sept. 27 ._______
30.30 27.54 29.31 33.29 36.73 39.45
A2-4-26ddl
June 24, 1949 ......July 24 ___ .......Aug. 25 _ _ _
27.65 26.42 25.53
Sept. 23, 1949 _....Oct. 25 .__.......
25.72 25.87
Nov.28, 1949 ___ 26.63 27.30
A2-4-30bb
July 14, 1948 .......
Sept. 23. . . -_.Oct. 20 ________Dec. 2_. .. _..Jan. 12, 1949 _..._..Feb. 8-...---..-.Mar. 8 __ .........
Apr. 27 _ . .-...
8.81 10.15 9.32
10.85 11.75 12.19 11.99 12.00 12.44 12.77
May 27, 1949 __ July 1 .___. Aug. 1 __ .._._.
Nov.28 _..._ Dec. 30 __________Jan. 31, 1950 _ -Mar. 1 ___._ _-.
12.82 10.98 10.08 9.14
10.70 11.52 11.98 12.31 12.67 12.86
Mar.27, 1950 __...Apr. 26 __.____.May 29 __ __ July 6 __.......
Sept. 27 _____ .-Oct. 31 ____ _ _
12.75 12.95 12.79 9.55 8.85 9.65 9.82
10.83 11.41 12.92
A2-4-36dbl
July 7, 1949. .....July 24 __ .._......Aug. 25. __ _ .. ...Sept. 23 ____ .. ...Oct. 25 ____._ -Nov.28 __ .........
3.54 1.80 2.92 5.24 6.89 8.30 9.38
Jan. 30,1950 -Mar. 3 __ -------Mar.27 __ ______
July 6 ______ .
10.50 11.19 11.58 11.95 12.10 6.14 2.28
Aug. 26, 1950 _ Sept.27_ __ _ -Oct. 31 _.__ _ Dec. 3 _____ ..
Feb. 2, 1951 --
3.97 4.55 5.05 8.10 8.13
10.33
A2-4-36db2
Mar. 30, 1951 _ _... 20.20 20.40 19.12 13.70
Aug. 1, 1951 _
Sept. 28 __ ______
11.30 8.02
10.06
Oct. 26, 1951 __ -Nov.27 __ ______
12.50 14.55 16.34
A2-5-2ab
Oct. 10, 1947 _. ...July 16, 1948 ___ ..Aug. 18 ....... _..
Oct. 20 ___ . ..
Feb. 8,1949 .......Mar. 7 _____Aor. 5.. ----.._.
60.40 60.82 61.10 64.47 64.90 65.60 63.72 60.81 62.39
May 27, 1949 ___ July 5 __ -----Aug. 1 ___ _.
Oct. 25 ______ .Nov.28 ____ _..
Jan. 31. 1950 __
60.52 60.71 60.71 60.60 61.03 59.87 63.00 61.79 62.40
Mar.27, 1950 ___ Apr. 26 ____ ____May 29 _____._ July 6 __________Aug. 3_ _____ ._Sept. 1 _____ ___Sept. 27 ____ .Oct. 31 ____ ___.Dec. 1. ------
63.28 62.43 60.21 63.40 59.98 62.28 68.30 58.63 66.18
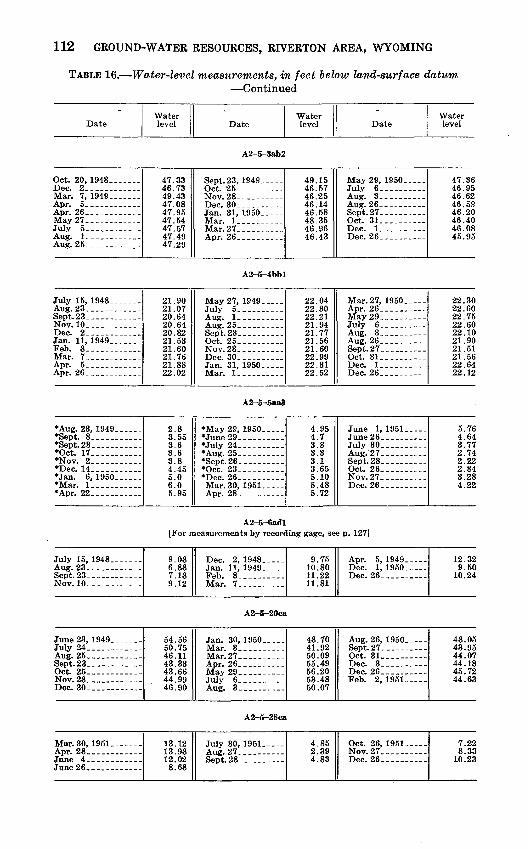
112 GROUND-WATER RESOURCES, RIVERTON AREA, WYOMING
TABLE 16. Water-level measurements, in feet below land-surface datum Continued
DateWater level Date
Water level Date
Water level
A2-5-3ab2
Oct. 20, 1948._-_ ...Dec. 2 ... ....Mar. 7, 1949._- ....
May27_. __ -. ......July 5 ... . __ .
Aug. 25_. ___ _--
47.3346.7349.4347.0847.9547.5447.5747.4947.29
Sept. 23, 1949.---.Oct. 25. .... __Nov. 28- _ -----
Jan. 31, 1950----.A/Tur 1
Mar.27 ___ -----
49.1546.5746.2546.1446.5848.3546.9646.43
May 29, 1950 ....July 6 __ -------
Oct. 31 ____ . ...
47.3646.9546.6246.5946.2046.4046.0845.95
A2-5-4bbl
July 15, 1948 _ .._.
Sept. 23- __ -------Nov. 10. ------Dec. 2--. .- - .-Jan. 11,1949 _______Feb. 8--..- ...Mar. 7 _______ ..
Apr. 26 __.
21.9091 (\1
20.6420.6420.8221.5321.6021.7621.8822.02
May 27, 1949. __July 5- __ ....
Oct. 25 _..--.--.Nov.28- -------
Jan. 31, 1950. Mar. 1. _..- ---
22.04
22.2121.9421.7721.5621.6022.9922.3122.52
Mar.27, 1950 ---
July 6-... ------
Aug. 26 __.. ._--
Oct. 31_ _ -----
Dec. 26 __-- . -
22.3022.6022.7522.6022.1021.9021.5121.5622.6422.12
A2-5-5aa3
*Aug. 23, 1949 _ .-*Sept. 8-. .......*Sept.23- _ . ......*Oct. 17...-...-..*Nov. 2 ____ --.-*Dec. 14.. _ .. ...*Jan. 6,1950. ---*Mar. 1 ____ .-*Apr. 22 __ ........
2.83.553.63.63.84.455.06.05.95
*May29, 1950. ....*June29 __ .. ...*July 24-...---.*Aug. 25_.__ .*Sept. 26-. ........*Oct. 23_...--- _*1~\0« OC
Mar. 30, 1951.. ...
4.954.73.83.33.13.655.105.485.72
June 1, 1951.. _June 26 .--. July 30 ___. .Aug. 27 ____ ...
Nov.27. ___ .---Dec. 26 ____ -.--
5.764.643.772.742.222.843.284.22
A2-5-6adl[For measurements by recording gage, see p. 127]
July 15, 1948 ___ ..
Sept.23 __ -. _ .Nov. 10. __ . ___ -
9.086.887.189.12
Dec. 2,1948. Jan. 11, 1949 Feb. 8-. -.---..Mar. 7---.
9.7510.8011.2211.81
Apr. 5, 1949 - Dec. 1,1950.. Dec. 26 .... ._
12.329.50
10.24
A2-5-20ca
June 23, 1949 __ ...July 24 __ . ___ -.-
Sept.23 ___Oct. 25 ___.._._....Nov.28 ________Dec. 30.... _ _ ..
54.5650.7546.1143.3343.6644.9946.90
Jan. 30, 1950.. -Mar. 3 __ ------Mo- O7
May 29 ___ . .July 6 __ ......Aug. 3. __ .... _.
48.7041.9250.0955.4956.2053.4850.07
Aug. 26, 1950. -.-
Oct. 31 ___.__.
Feb. 2, 1951 .....
48.0543.9544.0744.1845.7244.63
A2-5-28ca
Mar. 30, 1951. .. _ .Apr. 28 ________
June 26..... ._._...
13.1213.9812.028.68
July 30, 1951 _ .Aug. 27 ..........
4.852.394.83
Oct. 26, 1951. ...Nov.27 ___.....
7.228.33
10.23
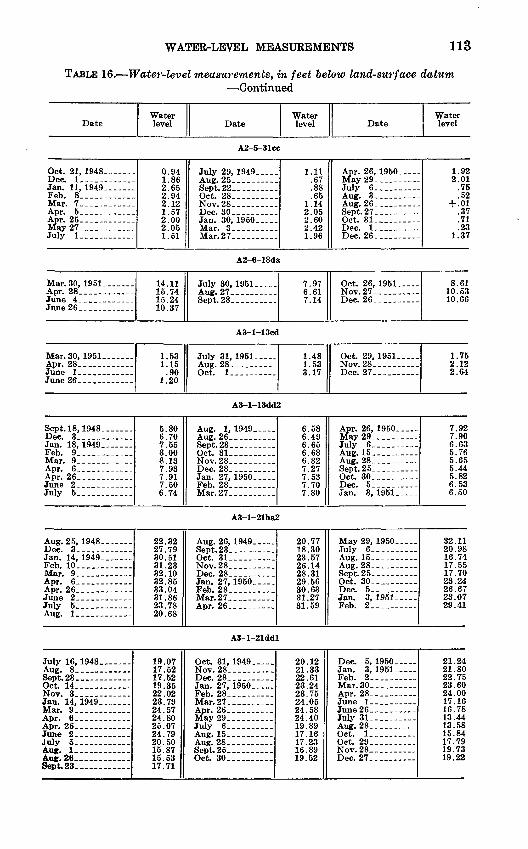
WATER-LEVEL MEASUREMENTS 113
TABLE 16. Water-level measurements, in feet below land-surface datum Continued
Date
Oct. 21, 1948----Dec. 1__ .-- __Jan. 11, 1949--. __Feb. 8 __ ,.-....-.Mar. 7. .. ____
Apr. 25 ____ .-.--May 27 ____ - ....July 1 __ .._.....
Mar. 30, 1951 ____Apr. 28 __ ... _ ...
June 26._ .. ____ .
Mar. 30, 1951 ____Apr. 28._ _ ..
Water level
0.941.862.652.942.121.572.002.051.51
14.1115.7415.2410.37
1.531.15
.901.20
Date
A2-5-31cc
July 29, 1949 __ .
Oct. 28-. ___ ...Nov.28. ______
Jan. 30, 1950 .....Mar. 3 _______Mar 97
A2-6-18da
July 30,1951- .Aug. 27__ _.... .
Aa-l-13cd
July 31, 1951- .Aug. 28 __ -------Oct. 1 __.. .
Water level
1.11.67.88.65
1.142.052.602.421.96
7 Q76.617.14
1.481.533.17
Date
Apr. 26, 1950 __ .May 29 ______July 6 __ -------Aug. 3- ____ --.Aug. 26. _ . .....Sept. 27 _____ -.Oct. 31-. _.-----Dec. 1-. ____Dec. 26-. -------
Oct. 26, 1951 . Nov.27 .........Dec. 26 __- ___ -
Oct. 29, 1951 Nov.28 . ___ .-Dec. 27 __.._....
Water level
1.922.01
.75
.52+ .01
.37
.71
.231.37
8.6110.5310.66
1.752.122.64
A3-l-13dd2
Sept. 18, 1948 _......Dec. 3 __ ._ ..Jan. 18, 1949 ____Feb. 9 __ --------Mar. 9_- ______ .
Apr. 26 ----- __ .-
July 5-_-_ --------
5.806.707.553.008.137.937.917.506.74
Aug. 1, 1949 _....
Oct. 31 ____ --.Nov.28-. _.. ..Dec. 28....---...Jan. 27, 1950. _ .Feb. 28. __ - __ .Mar.27._ _____
6.586.496.656.686.827.277.537.707.80
Apr. 26, 1950 .....May 29.. ........July 6. __ ......Aug. 15 __ .._....
Sept.25 _. . ....Oct. 30 _____ Dec. 5 _ _ ..Jan. 3,1951.---
7.927.906.635.765.655.445.826.536.50
A3-l-21ba2
Aug. 25, 1948 ......Dec. 3. ...........Jan. 14, 1949. __ Feb. 10 __ .... ....Mar. 9 _______ .
July 5 ____ -----Aug. 1 __ .......
22.3227.7930.5131.2332.1032.8533.0431.8623.7820.68
Aug. 26, 1949 Sept.23 ._ . ..Oct. 31 .__.. .Nov.28 __ ------
Jan. 27, 1950. ....Feb. 28 _______Mar.27 .._......_
20.7718.3023.5726.1428.3129.5630.6331.2731.59
May 29, 1950 ___July 6 _._.......Aug. 15 __ -------
Oct. 30 __. ......
Jan. 3, 1951 ....Feb. 2. ____ -
32.1120.9816.7417.5517.7023.2426.6723.0729.41
A3-l-21ddl
July 16, 1948 _ ... .
Oct. 14 ____ _Nov. 3 ____ -----Jan. 14, 1949 ___ .Mar. 9 .._.__
July 5 __ . _ - Aug. 1 __ ..
Sept. 23 ___._....
19.0717.5217.5219.3522.0223.7924.5724.8025.0724.7920.5015.8715.5317.71
Oct. 31, 1949 Nov.28 _______Dec. 28 __........Jan. 27, 1950 .....Feb. 28 ___ ---.Mar.27.. .......Apr. 26-. -
July 6__. .......Aug. 15 ___ Aug. 28_.
Oct. 30 ______
20.1221.3322.6123.2423.7524.0524.5824.4019.8917.1617.2316.8919.52
Dec. 5, 1950 _. Jan. 3, 1951 ___Feb. 2 __ .- __ .Mar.30 ..........Apr. 28_. ___ ...
June26._ __ ....July 31.. --------
Oct. 1 _____ Oct. 29 ..........Nov.28 __ .......Dec. 27 ____
21.2421.8022.7523.6024.0017.1616.7813.4413.5815.8417.7919.7319.22

114 GROUND-WATER RESOURCES, RIVERTON AREA, WYOMING
TABLE 16. Water-level measurements, in feet below land-surface datum Continued
Date
Aug. 27, 1948-------
Jan. 18, 1949 _.__Feb. 10 . .........Mar. 9_ . .... .
July 5_-----_ .
Aug. 26, 1948. __ ..
Jan. 14, 1949 ......Feb. 10 __.........Mar. 9 _ .. . _.
July 5. .._.-.....
Mar.30, 1951.... .Apr. 28 __ _ . _
June 26 . .... .. .
Aug. 25, 1948 _____
Jan. 14,1949.--- __Feb. 10--_. ...... .-
Aug. 26, 1948 _ - _
Jan. 14, 1949 _ . ...
July 5-. ...... ...
Jan. 18, 1949 .. . .Feb. 10 __ .--.-.-.Mar. 8 __ ._......
July 5 ___ ... __
Water level
14.1918.1420.5621.4221.7422.4122.9122.9518.8214.83
3.538.35
10.1311.6812.6913.4113.739.975.16
11.60
10.20
10.9825.4627.9528.89
10.6213.1214.3814.9014.6214.4813.798.518.55
15.7816.1717.0717.1717.2817.4017.2916.6315.8915.83
Date
A3-l-25bc
Aug. 26, 1949 _-.-
Oct. 31.-.. ------Nov.28_. ..-----.Dec. 28___. -._-..Jan. 27, 1950 __ ..Feb. 28 _ ___ --Mar.27 .......Apr. 26_ -------
A3-l-26bc
Aug. 1, 1949.----
Oct. 31 --------Nov.28-... ....
Feb. 28_ --------Mar.27.. -------
A3-l-26bd
July 31, 1951-- -
Oct. 1- --------
A3-l-28cc
Mar. 9, 1949 _ ..
July 5. -.- __ -
A3-l-34aa
Aug. 26, 1949.. ...
Oct. 31 .... _ .Nov.28 -... ...
Jan. 27, 1950- - __Feb. 28 _.......Mar.27 ____ ....Apr. 26. ____ ..
A3-l-36ad
Aug. 26, 1949 _ .-
Oct. 31. ____ .-Nov.28 ____ Dec. 28_ __ . .....Jan. 27, 1950 ....Feb. 28 - .. ___Mar.27 _____Apr. 26 __ - _ ..
Water level
12.4812.2514.7216.1317.7918.6519.5620.3021.35
L
4.104. 9Q
5.984.755.808.94
10.3911.3712.23
2
3.442.704.63
2
29.7130.0230.5210.04
9.519.90
12.4513.3214.0614.5014.8014.8014.91
2
15.7015.4815.9715.9016.5616.6816.8016.5716.74
Date
May 29, 1950 __ -July 6_ -_- __ .
Aug. 28-. Sept. 25 . . -
Jan. 3, 1951 -...Feb. 2. --------
May 29, 1950. - _July 6... -------
Aug. 28_ _ - _ -.
Jan. 3, 1951 . _
Oct. 29, 1951 __ -Nov.28- ____ ..Dec. 27. ____ .-
Aug. 1, 1949 .....
Sept.23 _ __ _ .Oct. 31. __ .
May 29, 1950- ...July 6-__ Aug. 15- ____ .-
Oct. 30. __ . _ Dec. 5_. .......Jan. 3, 1951 _ .Feb. 2 __ -------
May 29, 1950 .....July 6 __Aug. 15.. ____ .
T\e/» K
Feb. 2 __ . ....
Water level
21.4914.1710.9011.0912.3715.4817.9318.3020.26
12.823.154.013.213.575.277.267.92
5.507.048.63
11.5113.9920.8524.24
14.4910.759.139 4.7
10.8812.5813.7414.3314.46
16.5815.0214.9915.2514.6115.0416.0015.4016.23
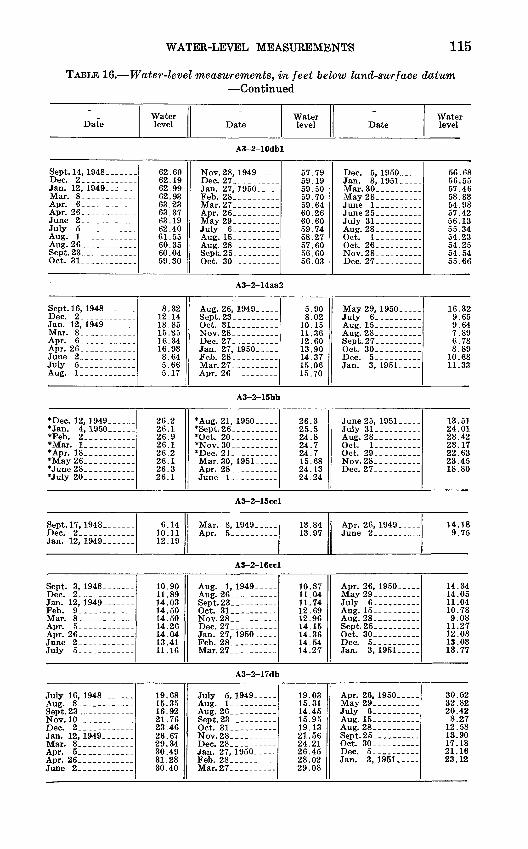
WATER-LEVEL MEASUREMENTS 115
TABLE 16. Water-level measurements, in feet below land-surface datum Continued
Date
Sept. 14, 1948- ......Dec. 2 ...Jan. 12, 1949 .. _Mar. 8__ .........Apr. 6 . ... ___Apr. 26. ........June 2 _July 5 _._.......
Aug. 26 _ _ . ..Sept.23 ...... ...Oct. 31 _
Sept. 16, 1948 __ ____Dec. 2. _ _______Jan. 12, 1949 _ _ ___Mar. 8 . _ _______Apr. 6 _. ... ....Apr. 26 _ ._ _ __June 2 ______July 5-..._. _____
*Dec. 12, 1949__-.._*Jan. 4, 1950 . ..*Feb. 2 _ . ---._*Mar. 1__. ........*Apr. 18_. _ --_.-.*May26 ..........*June28 __ _.__*July 20. .........
Sept. 17, 1948 ______Dec. 2... -. _____Jan. 12, 1949. .. ..
Sept. 3, 1948 ......
Jan. 12, 1949- __ ..Feb. 9 __ _--._.__Mar. 8.. ..._-..__
July 5 ____ ---.
July 16, 1948_ .....Aug. 8--..-._- _._Sept.23. _ ... _ ...Nov. 10__. -_..----_
Jan. 12, 1949. __ ..
Apr. 26
Water level
62.6062.1962.9962.9363.2363.3763.1962.4061.5560.3560.0459.30
8.3212.1413.8515.3516.3416.938.645.665.17
26.226.126.926.126.226.126.326.1
6.1410.1112.19
10.9011.8914.0314.5014.5014.2614.0413.4111.16
19.6815.3516.9221.7623.4626.6729.3430.4931.2830.40
Date
A3-2-10db
Nov. 28, 1949 .. _Dec. 27--_.- Jan. 27, 1950 ....Feb. 28_ -_-____
July 6_- __-.---Aug. 16. -_-___._
Sept. 25. _- -
A3-2-14aa
Aug. 26, 1949---__
Oct. 31.. ______Nov.28_. __ ____Dec. 27---- .Jan. 27, 1950- ____Feb. 28.. _ -------
A3-2-15bb
*Aug. 21, 1950 -._*Sept.26_._-__ ___*Oct. 20_ . ____*Nov. 30__ . ___ _*Dec. 21. -------Mar. 30, 1951_.-__
A3-2-15cc]
Mar. 8, 1949 ... .
A3-2-16ccl
A no* 1 1 Q4.Q
Oct. 31. ____ ..Nov.28 __ _--.--Dec. 27 - -__ __Jan. 27, 1950 __ -Feb. 28 . __ -._-Mar.27 __ _ ...
A3-2-17db
July 5, 1949.- ..Aug. 1 __ -----Aug. 26 . .Sept.23 -._ _Oct. 31. _ ___ -Nov.28_ - -----
Jan. 27, I960 Feb. 28 __ _-----.Mar.27 __ . . ...
Water level
1
57.7959.1959.5059.7059.6460.2660.60
58.2757.6056.6056.03
2
5.908.02
10.1511.3612.6013.9014.3715.0615.70
26.325.524.824.724.715.6824.1324.24
13.8413.97
10.8711.0411.7412.6912.9614.1514.3614 5414.27
19.0315.3114.4515.9519.1321.5624.2126.4528.0229.08
Date
Mar.30 ... .. ...
July 31.. _ . _ _
Oct. 1 .-. -Oct. 26 _...___..Nov.28 .. ---.
May 29, I960... _July 6 . _______Aug. 15. .-- -.__
Oct. 30 . ... ._.Dec. 5_ _. -. .
July 31_-_. Aug. 28 __ _Oct. 1 .. .. -_
Nov.28. ._._-_-__Dec. 27 __ ---_
Apr. 26, 1949.----
Apr. 26, I960.- May 29. _ . ...July 6. ____ ._Aug. 15 . .-.---_Aug. 28 __ .
Oct. 30..-- . ..Dec. 5Jan. 3, 1951 ..
Apr. 26, 1950 ....May29___. _ July 6 __ . _ .-Aug. 15 ____ ._
Oct. 30 _ . ....Dec. 5 ._. _ ..Jan. 3, 1951. _
Water level
56.6856.5557.4658.8354.9857.4256.1355.3454.2354.2554.5455.66
16.329.659.647.896.788.89
10.6811.33
13.5124.0123.4223.1722.6323.4518.80
14.189.75
14.3414.0511.0410.789.08
11.2712.0813.0313.77
30.5232.8220.428.27
12.5813.9017.1821.1623.12
116 GROUND-WATER RESOURCES, RIVERTON AREA, WYOMING
TABLE 16. Water-level measurements, in feet below land-surface datum, Continued
DateWater level Date
Water level Date
Water level
A3-2-18ba
*Mar. 1, 1950. ___*Apr. 19 ------ _ .*May 25 ...- .*June28--------.--*July 20 __ . ____*Aug. 21 .--.----..*Sept.22__---_ ___
1.81.51.2
.6
.8
.6
.0
*Oet 12 1950*Nov.29_ -------
Mar. 30, 1951-----
0.61.11.153.251.401.09
.59
July 31, 1951---.-Aug. 28--..--- _Oct. 1---- _ ---Oct. 29 -------Nov.28 -._--.---Dec. Z7. .........
1.131.07
.32
.39
.851.55
A3-2-20cdl
[For measurements by recording gage, see p.128-129]
July 16, 1948-.---..
Sept. 23_. ....._....
Dec. 3_.. -. -. -Jan. 12, 1949-------
19.6716.8616.73
21.9124.17
Feb. 19, 1949 -- _Mar. 8-. ..-..---
Apr. 26----------
25.0725.4626.009R 99
25.41
July 5,1949---..
Oct. 24---. ------
21.0017.6916.4917.2520.24
A3-2-20cd2
*Nov. 2, 1949_----_*Dec. 12_-______--_*Jan. 4, 1950 __ ._*Feb. 2 .----...*Mar. 1.. ........*Apr. 18_-_--------*May 26. _ -------*June 28 _...-- . "
11.513.014.716.517.018.1516.011.25
*July 20, 1950-----*An*r *>1
*Sept.26----------*Oct. 19 _ - __*vrrk»» on
*Dec. 20----------Mar.30, 1951.----
8.88.18.2
11.113.414.115.1518.26
June 1, 1951 .
July 31-. ____ .Aug. 28.. ...----.Oct. 1 __ .---...Oct. 29.. ...... ..Nov.28.-. .---...Dec. 26 ... . .
16.6811.685.346.637.92
10.7012.3912.70
A3-2-22cb
July 16, 1948_ ------Aug. 8. -----------Sept.23_._- - ._Nov.lO.- _ --__._.
Mar. 8, 1949-------Apr. 6. .. --- .-
15.3914.9916.0916.9817.2718.5518.5418.6517.75
July 5,1949-----
Oct. 31__.__- ....Nov.28--_-------Dec. 28----------Jan. 27, 1950-----
16.2114.6115.4415.7516.7716.9317.4817.83
Feb. 28, 1950 ...Mar.27. .........Apr. 26--..--- ...May 29- ... _ .July 6-. ... ....
Aug. 23_ _ _ -.-
18.0217.9718.2618.1516.6015.6015.2915.02
A3-2-23ba
Sept. 17, 1948_ __ ..
Jan. 12, 1949 __ ...Feb. 9. ..........Mar. 8-_ _ .. _ .-
July 5. -----------
4.554.524.935.00
4.244.665.204.30
Aug. 1,1949---..Aug. 26 __ .-.----
Oct. 24 - ... ....Nov.28. _ . _ -..Dec. 27----------Jan. 27, 1950- ....Feb. 28_ ..-.----Mar.27. -. _ ...
4.334.553.934.10
4.985.074.744.53
Apr. 26, 1950-----May29 .__.......July 6 ___ - __
Aug. 28-. __ ...
Oct. 30-...-- Dec. 5....-- _ -Jan. 3,1951-.-.-
4.845.215.153.503.754.004.393.844 7Q
A3-2-23bc
July 15,1948 ......
Nov.lO.--. ..- ...Dec. 2 . - -.Jan. 12, 1949 ...-Feb. 9-------- __Mar. 8.-. ........ -
16.4412.2112.4216.3118.3421.6823.3921.2025.3926.15
July 5-- _ - ....
Oct. 24_- _ . --.-Nov.28 - .-- __T-»O_ 97
Jan. 27, 1950 ___Feb. 28 ______
26.5814.1810.448.919.95
11.8714.3117.3220.0521.89
Mar.27, 1950-.--Apr. 26------.-.-May29 - _______Aug. 15. ___ --_.Aug. 29-... .--_-
Oct. 30-.....----Dec 5Jan. 3,1951. __
O*> KG
25.009R fi9
23.2921.9720.9122.4825.1627.06
WATER-LEVEL MEASUREMENTS 117
TABLE 16. Water-level measurements, in feet below land-surface datum Continued .
DateWater level Date
Water level Date
Water level
A3-2-25aa
July 14, 1948 ______Aug. 8_ _______ _Sept.23._ __ . _Nov. 10Dee. 2. ._._ __Jan. 2, 1949- --____Feb. 9 - _.Mar. 8__ __ _ _Apr. 6 _______Apr. 26 _--_ __
7.217.417.948.468.298.909.158.748.758.41
June 1,1949. -July 5 ______ _Aug. !_--_---.--
Sept. 23---.-- .Oet. 31_______ __Nov. 28 __ ___ .
Jan. 27, 1950-----Feb. 28-_____._--
7.597.127.476.947.377.657.367.848.208.15
Mar. 27, 1950. __._
July 6___ -----Aug. 15------ ...Aug. 29.. -------Sept. 27--.---- .
Dee. 5. - ------Jan. 3, 1951_ _--.
7.797.597.116.266.598.257.487.538.247.50
A3-2-27abl
[For measurements by recording gage, see p.130]
July 16, 1948 _ _.
Sept.23----_-.-.___Nov. 10 -Dee. 2 ... . .Jan. 12, 1949.Feb. 9-. ......._--Mar. 8-------. _Apr. 6_ ..___._. Apr. 26. ..--._ ..
14.6614.3213.9615.5214.9415.3715.9716.5315.1514.67
July 5.__. ------Aug. I.. .-. __Aug. 26___.-- _ .
Oct. 24 ..- _..Nov.28___. ______Dee. 28_. ._......Jan. 27, 1951_----
15.2313.3814.7214.7014.4614.4614.6915.1015.18
Feb. 28, 1951.-.--Mar.27. ._ ___ -
May 29----------July 6 --------Aug. 15-. --------
15.1515.0815.6115.7113.8513.0713.6913.5814.00
A3-2-27ab2
*Nov. 2, 1949 ._... *Dee. 12 - --------*Jan. 4,1950------*Feb. 2--- - -----*Mar. I----.......*Apr. 18.. -.--... ..*May 26_-_ -.-.....*June 28 . . . . . . . .
3.2 4.15.26.36.76.67.255.1
*July 20, 1950- .._ - *Aug. 23-. --------
*Oet. 20__-- -*Nov. 30. --------*Dee. 21--..--- Mar. 30, 1951-. .Apr. 28. -__...-
3 0 .02.82.12.64.14.66.436.88
June 1, 1951-----
July 31-__-------
Oet. 1. ... ------
Nov.28----------Dee. 26---. ------
6.80 5.702.461.901.061.863.034.35
A3-2-28dd
Sept. 1, 1948-------Dee. 2-._ -- _ --Jan. 12, 1949.-- . .Mar. 8_ ____ . ....Apr. 8__ . -__. ...Apr. 26-- .--- ---.
12.7316.5817.2817.8118.4818.02
July 5 ----- ....Aug. I-... ------Aug. 26 --------
Oct. 31 -_.-_-.--
16.4814.8113.5911.9114.1214.29
Nov.28, 1949-.- Dee. 28. .. .. ..Jan. 27, 1950 Feb. 28. ____ -.Mar.27.-.- ...
15.2516.9317.9418.5018.75
A3-2-29cd
Sept. 2, 1948.----
Jan. 12, 1949.. __ .Feb. 9. ..-------..Mar. 8--.------ _
Apr. 26 __ _------.
July 5 ____ .. ...
3.025.347.318.928.935.659.779.886.62
Aug. 1,1949- --Aug. 26 ...... ...
Oct. 31-- -------Nov.28----- __ -
Jan. 27, 1950_ ....Feb. 28- ........Mar.27-. ........
3.323.413.644.135.026.478.018.799.60
Apr. 26, 1950-.---May29 .._.. _ -July 6.. --------Aug. 15-- ____ -Aug. 28Sept. 25----------Oet. 30. __ ------Dee. 5__. ....Jan. 3, 1951 __ -
8.7410.605.093.703.072.534.035.376.51
118 GROUND-WATER RESOURCES, RIVERTON AREA, WYOMING
TABLE 16. Water-level measurements, in feet below land-surface datum Continued
DateWater level Date
Water level Date
Water level
A3-2-30bb2
*Nov. 2, 1949-. _*Dec. 12__ _ --- _*Jan. 2, 1950. . .*Feb. 2-------___-*Apr. 18 _ ____ . .*May25 ____ ...*June28 ..........*July 20-. ---____.
9.610.211.212.614.6515.714.011.45
Aug. 21, 1950 _-- *Sept.26__ -------*Oct 19*Nov.29 ___ __---*Dec. 20---._ _ .-Mar. 30, 1951.- -
9.358,159.1
10.911.713.8314.7615.45
June 26, 1951__ .July 31-.--------Aug. 28 __.- Oct. !--__------Oct. 29__ .-_--.-Nov.28-_ ._ _ __Dec. 27__. .-__--_
15.0511.889.568.989.35
10.2811.14
A3-2-31cc
July 19, 1948-._- ___Aug. 23- __ -_____.
Nov.lO.- .__ -_-_-Dec. 3----------Jan. 18, 1949- -_--__Feb. 10_. ---------Mar. 8.... .--_--
Apr. 26. ...--..-._-
5.075.104.874.75
5.155.074.805.20
June 2 1949July 5---. ------Aug. 1_. .. - ---Aug. 26-_. .__---.
Oct. 31 --------Nov.28- __ ------Dec. 28 ---------
Feb. 28 ..--..---
4.954.823.783.854.773.964.214.554.714.79
Mar. 27, 1950_-_ Apr. 26 __ __ __
July 6 __ ------Aug. 15 -_- ___ .
Oct. 30 ..---- .-Dec. 5_-__ ------Jan. 3, 1951 -- _
4.754.995.034.204.814.924.955.055.155.22
A3-2-32dd
*Dec. 12, 1949 .. .. Jan. 3, 1950_ -___*Feb. !.-_-. ------*Mar. 1 __ -. _ -.*Apr. 19. __ ------- May 25- ---------*June 28 July 28- ..- __ -.
Sept. 1, 1948--. _ .
Jan. 12, 1949--.Feb. 9 . ____ ._Mar. 8 _ _ ------
Apr. 26-_ _ - ..- June 2July 5.-.. --....-
May 9, 1949-......A Her 9Aug. 26. -._.----Sept.23_ _ .. -- _Oct. 28 _Nov.28-___ -----
July 16, 1948.......
Nov. 10 __ _ .-.-Dec. 2 - - -.-_ ..Jan. 12, 1949 _ ___.Feb. 9---- _ - ....
4.44.85.55.65.655.15.64.8
8.078.308.859.119.078.899.258.988.48
17.1114.4713.5614.0514.8515.32
7.396.526.91
10.4211.2012.9513.9014.2714.7615.00
*Sept.26 __ ------*Oct 20
*Dec. 21---. ._ _ -Mar. 30, 1951. .-._
A3-2-33c
Aug. 1,1949. .Aug. 26.... . __Sept. 23-- Oct. 31- ____ --Nov.28_- ._.... Dec. 28--.. ..-
Feb. 28 . _.......Mar.27__ .... ...
A3-3-15cc
Dec. 30, 1949 . .
Mar. !--__ Mar.27. _____
July 6 ....-
A3-3-18dd]
Oct. 31 _. _ -_Nov.28 ______ -Dec. 27 _ _ -
Feb. 28____ ...
4.13.23.74.35.15.455.624.41
c
8.368.137.958.078.138.508.808.878.77
15.9016.2516.8416.6417.3815.34
L
11.476.376.145.306.579.32
10.6611.7712.7413.36
June 26, 1951 ....July 31. __ . __ _
Oct. !__-- _ ...Oct. 29-. --------Nov.28 _____ ._Dec. 27 _._-----_
Apr. 26, 1950 _ ..
Aug. 16-_.. ...Aug. 28. --.... Sept.25-_ ------Oct. 30 __.-_
Jan. 3, 1951 ___
Aug. 3, 1950 .....Aug. 26.. ___ -__Sept. 27 _____ .-Oct. 26. _ -. -Dec. 3 .. -Dec. 26-... ..
Mar.27, 1950- __..Apr. 26 ______ __May 29. .July 6 __ --..-_.Aug. 15... .......Aug. 29 ...
Oct. 30 _____ _.
Jan. 3, 1951 _ ..
4.954.323.684.094.164.514.97
9.618.657.877.506.857.288.498.068.09
14.2713.7014.4214.7219.6915.91
13.6914.0911.888.047.266.687.49
10.1311.3911.90
WATER-LEVEL MEASUREMENTS 119
TABLE 16. Water-level measurements, in feet below land-surface datum Continued
DateWater level Date
Water level Date
Water level
A3-3-21ad2
Dec. 2, 1948 ... _Feb. 9, 1949 _ ....Mar. 8--.. __ . _
Apr. 26 ....... ...June 1July 5_._. ........Aug. 3 -. _ .....Aug. 26__ . _ .. ...Sept. 23. _ .... _ .Oct. 28 ... ...Nov. 28----. ___ ._
147.21147.25147.13147.22147.45147.28147.22147.87147.26147.33147.24147.15
Dec 27 1949Jan. 30,1950 . .Mar. l._ .. __Mar.30__ ... _ .
May 29 . ... _ .
Oct. 26__ - _ _
147.24147.04147.21146.84147.05147.19146.80147.06147.47146.89146.29
Dec. 26, 1950 ..Feb. 2,1951 --Mar.30._. ------Apr. 28__ ._-.-June 26, . ...July 31. --------Aug. 27_. -------Sept. 28.. --------Oct. 26 __ .-_.---Nov.28_ .-__---Dec. 26-_ ------
146.06147.13146.88147.10147.13147.23146.98147.11147.27147.32147.56
A3-3-23bb2
May 10, 1949 ____Aug. 2Aug. 26 -.
21.9619.5019.20
Sept. 23, 1949. Oct. 25 _ __- .-.
19.2520.11
Nov. 28, 1949 - 20.7321.00
A3-3-24cc
Oct. 20, 1948 -- _ .Dec. 1 _ _Jan. 12, 1949Feb. S __ ......Mar. 8__ _______
Apr. 26. _ _ __June 1 ._---July 5- _. _ -__
10.4511.5712.7513.2212.7812.2313.2311.3910.25
Auff 2 1949
Oct. 25 __ _ __ --Nov.28. ____ _
Mar. 27
9.629.63
10.0910.8611.4812.3910.2713.5013.31
Apr. 26, 1950 ... .May29__ -------July 6__ ------
Aug. 26,__. ------Sept. 27.. _ . _ -
Dec. 5 _ -Dec. 26_ -- --
13.6113.6912.1711.4811.5011.4513.0412.5113.50
A3-3-25bb
*Oct. 4, 1949*Oct. 17-._ __*Nov. 2-. . _ -__.*Dec. 12 _ -- ---*Jan. 4, 1950__-- .*Feb. 2-. . _ _-.
*Apr. 21 __- May 24 .. ..
8.39.29.4
10.110.811.912.012.112.05
*June28, 1950. .. .*Tnlir 91
Oct. 20-. . _ --.*Nov.30-_ ___ .-
Apr. 28. . ------
11.311.0511.310.711.712.3
13.1213.42
July 31. ____ --A no1 97
Oct. 26____ _- Nov.28_-__ __ --
12.5111.9711.6311.0110.2311.8213.6412.98
A3-3-26abl
May 16, 1949--. __._Aug. 2... __ .Aug. 26 _Sept.23_. ___ --_.-Oct. 25 _______.._Nov.28 __ ------Dec. 30 . _ _.. _
8.799.028.858.858.888.978.91
Mar. 1 __ .--_ -
TV/To TT OQ
July 6 . ___ -
9.009.099.249.209.239.28
Sept. 27.. --------
9.249.309.269.309.359.40
A3-3-26bb
Nov. 30, 1948 _......Dec. 2 _ - ..
23.9623.96
Jan. 12, 1949- __ 24.20 Feb. 9, 1949.- 24.25
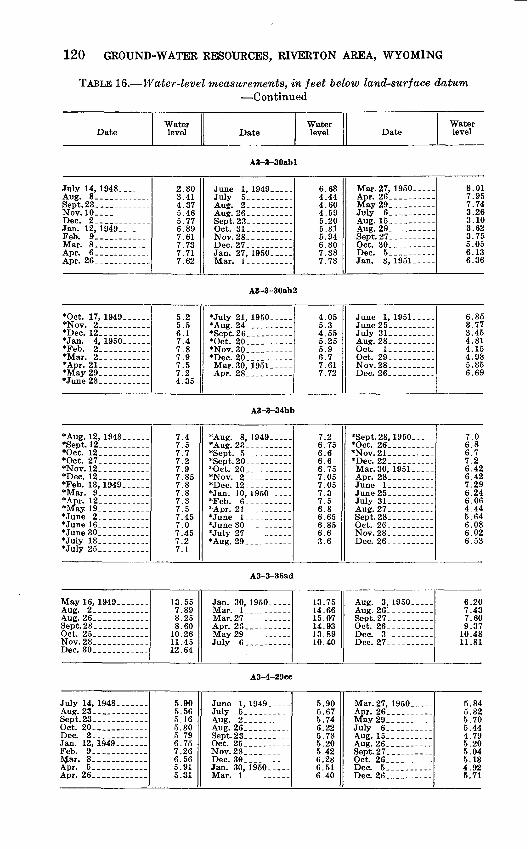
120 GROUND-WATER RESOURCES, RIVERTON AREA, WYOMING
TABLE 16. Water-level measurements, in feet below land-surface datum Continued
DateWater level Date
Water level Date
Water level
A3-3-30abl
July 14, 1948 _ ....
Sept. 23. _______Nov.10 ___ _______
Jan. 12, 1949..-- -Feb. 9 _______ _Mar. 8 ___ .......
Apr. 26 _ ------
2.303.414.375.465.776.897.617 7^t
7.717.62
June 1,1949 _ ..July 5 __ -------
Aug. 26 ___ -----
Oct. 31 ... . _ .Nov.28-. --Dec. 27----------Jan. 27, 1950. --M rtf 1
6.634.444.604.59<; 905.315.946.807.387.73
Mar. 27, 1950. ....
May 29. ------July 6-. ___ ..-Aug. 15-- __ ----
Sept. 27_ --. .--Oct. 30-_ -------
Jan. 3, 1951 -
8.017.957.743.263.103.623.755.056.136.36
A3-3-30ab2
*Oct. 17, 1949- - *Nov. 2___. ------*Dec. 12. _ -.-.--*Jan. 4,1950- - *Feb. 2-*Mar. 2-_..------.*Apr. 21 ___-_-..-_*May29 __ ........*June28- __ .......
5.25.56.17.47.87.97.57.24.35
*July 21, 1950 *Aug. 24_... ------*Sept.26_.. ...
*Nov. 30.. -------*Dec. 20. --------Mar.30, 1951 _ ..
4.055.34.555.255.96.77.617.72
June 1, 1951-
July 31 __ . _ ...
Oct. 1_. ____ -Oct. 29 ._ __ .-Nov.28 ___ - _ .Dec. 26 . . .-
6.353.773.454.814.154.985.856.69
A3-3-34bb
*Aug. 12, 1948-.----*Sept. 12-___ -_-____*Oct. 12_..........*Oct. 27...........*Nov. 12.. _ ....._*Dec. 12...... ....*Feb. 13,1949------*Mar. 9 ... .....*Apr. 12-_. ........*May 19.. __ _..__*June 2.. ------*June 16 . .-..-._.*June30. ........*July 18... ......*July 25 ....-_____
7.47.57.77.27.97.857.87.87.37.57.457.07.457.27.1
*Aug. 23. ..-----.*Sept. 5-_ _ -----*Sept.20--_. ------*Oct. 20_._ *Nov. 2 _ .--- -*Dec. 12--...- --*Jan. 10, 1950-- -*Feb. 6------ _ -
*July 27....... .
7.26.756.66.66.757.057.057.37.56.86.656.856.63.6
Sept. 28,1950 *Oct. 26 ___ ...*Nov.21_ .--.-.-
Mar.30, 1951. -
July 31 ------Aug. 27 -
Nov.28... .Dec. 26-__. -----
7.06.86.77.26.426.427.296.246.064.445.646.086.026.53
A3-3-36ad
May 16, 1949 ___ ..Aug. 2.. ____ .-Aug. 26.... ___ ..Sept.23.. _ . _ ...Oct. 25 . _ __ ...Nov.28 __ -...._---Dec. 30 ._.- . _ __
13.557.898.258.60
10.2611.4512.64
Jan. 30, 1950- --Mar. 1__ __---___Mar.27 --------Apr. 26 __ __--.-May 29. ..._----_July 6.. ___ ..
13.7514.6615.0714.9313.8910.40
Aug. 8,1950-
Sept. 27. ---------
Dec. 27. .... ..
6.207.437.609.37
10.4811.81
A3-4-29cc
July 14, 1948 ___ ..Aug. 23. __ ___ Sept.23_ ____ ..Oct. 20. _____ ...Dec. 2 . ____ ....Jan. 12, 1949 ____Feb. 9 _______ -.Mar. 8 _______ .-
Apr. 26 __ . .......
5.905.565.165.305.796.757.266.565.915.31
July 5
Aug. 26 -.-- _ --Sept. 23---- - ---Oct. 25-. -------Nov.28. ___ _ -Dec. 38. .---.-Jan. 30, 1950 .....Mar. 1 ------
5.905.675.746.225.785.205.426.236.516.40
Mar.27, 1950. ... .
May 29....-- ...July 6.. ___ .. .Aug. 15...... Aug. 26...--. .-_Sept. 27... . _ .Oct. 26. ---------
Dec. 26.. _ - _ .
5.845.325.705.444.795.205.045.134.925.71
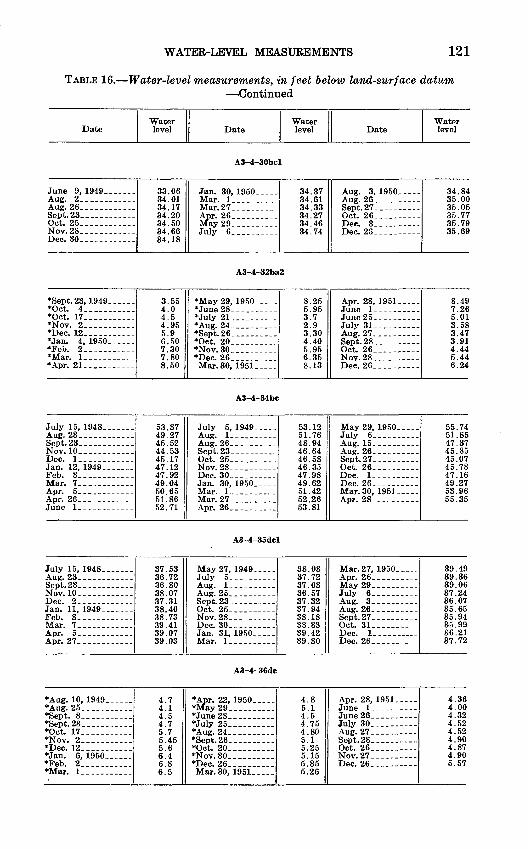
WATER-LEVEL MEASUREMENTS 121
TABLE 16. Water-level measurements, in feet below land-surface datum Continued
DateWater level Date
Water level Date
Water level
A3-4-30bcl
June 9, 1949. .. ..
Aug. 26... __ . .Sept.23 _ _Oct. 25.. . ..Nov.28 __ ........Dee. 30-._ . ._
33.0634.0134.1734.2034.5034.6634.18
Jan. 30, 1950 _ .Mar 1Mar.27 . _ ....
May29__ ___ ...July 6... _______
34.3734.6134.3334.2734.4634.74
Aug. 3,1950. .Aug. 26_- _ --__
Dee. 26 _ _ .
34.8435.0035.0535.7735.7935.69
A3-4-32ba2
*Sept.23, 1949-.--..*Oet. 4- _ _.*Oet. 17 __ .......*Nov. Z.. .........*Dec. 12. .........*Jan. 4,1950 *Feb. 2 __ ........*Mar. 1 ____ ....*Apr. 21.. ____ ...
3.554.04.54.955.96.507.307.808.50
*May29, 1950. .._.*June28 _ . . ..*July 21. ___ ....
*Oet. 20 ____ . ...*Nov.30 __ ------*Dee. 26.- _____Mar. 30, 1951 ___
8.255.953.72.93.304.405.956.358.13
Apr. 28, 1951-
July 31 - ....- Aug. 27.. ____ ..
Oct. 26 __ . __ .Nov.28. ____ .-
8.497.265.013.583.473.914.445.446.24
A3-4-34bc
July 15, 1948- Aug. 23- __ -.-._-_.Sept. 23_- __ ______Nov.lO.. __ ______Dee. 1 _.__._Jan. 12,1949 .Feb. 8_ ____ _.Mar. 7___._ ..____.
Apr. 26.. __ -.__._
53.8749.2745.5244.5345.1747.1247.9249.0450.6551.8652.71
July 5,1949
Get. 25.. _Nov.28.. .... Dec. 30.- .. ...
Mar. 1 -----Mar.27 ___ . _
53.1251.7648.9446.6446.5846.3547.9849.6251.4252.2653.81
May 29, 1950- July 6_ _ - -Aug. 15.. . __ --
Sept. 27 __ .._---Oct. 26 __ ------Dee. 1 -..-----
Mar.30, 1951 _
55.7451.8547.3745.8545.0745.7847.1649.2753.9655.35
A3-4-35dcl
July 15, 1948.... __.Aug. 23 ____ ..__Sept. 23. -- __ ___Nov.lO-. _
Jan. 11, 1949_ ______Feb. 8. ___Mar. 7 ___ ______
Apr. 27.. _ -_-_._.
37.5336.7236.8038.0737.3138.4038.7339.4139.0739.03
May 27, 1949- July 5....-- __ .
Sept. 23 __ . __ .
Nov.28. _ _Dee. 30--.--- . .
Mar. 1 -----
38.0837.7237.0836.5737.3237.9438.1838.8339.4239.80
Mar.27, 1950 Apr. 26. --. __ _May 29 ... ___ -July 6- __ --.-
Sept. 27__ --------Oct. 31.- ____ _Dee. 1- ____ Dee. 26 _ ...
39.4939.3639.0637.2436.0735.6535.9435.9936.2137.72
A3-4-36dc
*Aug. 10, 1949_ - _.*Aug. 25_._... .. .. .*Sept. 8.. ____ ...*Sept.23_ __ .....*Oet. 17.... __ ._.*Nov. 2 __ .. .. .. ..*Dee. 12 . .... _*Jan. 6, 1950 __ _*Feb. 2 _______ .*Mar. 1. _____ _
4.74.14.54.75.75.455.66.46.86.5
*Apr. 22, 1950 .. ._*May29 ______
*July 25 __ . ......*Aug. 24 ______ *Sept.26._ ...*Oet. 20 ____ ...*Nov.30 _____ .*Dee. 26.. ________Mar.30, 1951 _____
4.85.14.54.754.805.15.255.155.355.26
Apr. 28, 1951 ___
June 26__ __ _ .July 30 __ -------
Oct. 26_.._. __ .Nov. 27 _______
4.364.004.324.524.524.904.874.905.57

122 GROUND-WATER RESOURCES, RIVERTON AREA, WYOMING
TABLE 16. Water-level measurements, in feet below land-surface datum -Continued
DateWater level Date
Water level Date
Water level
A3-5-16da
Oct. 1,1947- July 19, 1948- Aug. 18............Sept. 23_ _---._ __ Oct. 19____-.______Dec. 1_____. ... ...Jan. 12, 1949- ------Mar. 7_- _.-_____.
Apr. 25_____ __May 27_. __----July 1_- ---------July 29_. ____-_-_
28.1128.3028.3028.2028.1928.34
28.2228.3428.3328.3228.4328.4028.43
Sept. 22, 1949-
Nov.30.--. ------Dec. 31-- ------
Feb. 24 _ ------Mar.30_. ____ _-
Mo 17 01
July 1. _...---_.
Sept 27
28.4628.4428.3528.4028.3828.4728.4028.4428.5728.5028.5128.6828.50
Oct. 26, 1950 __ -.Dec. 1--- - -__-Dec. 26- _ -----Feb. 2, 1951--- Mar.30 . _ ---__Apr. 28- -------
July 30 - ---._--Aug. 27-- - - Sept.28 . - .--Oct. 26_ -- - -.Nov.27---------Dec. 26-_ --- _ -
28.5628.4728.5828.8628.6528.6428.6928.7628.5928.6728.7628.6628.79
A3-5-33ccl
July 15, 1948.- .
Sept. 23 __ --..-...Nov.10. Dec. 2.... ......Jan. 11, 1949 ___ .Feb. 8Mar. 7 ___.._ ...
Apr. 26 . __ . _ .-
5.383.913.193.714 00
5.454.815.986.206.49
May 27, 1949 ... .July 5_. ---.-.
Oct. 25--. - --Nov.28.. --------
IVTor 1
5.885.955.064.764.654.665.175.976.747.23
Mar. 27, 1950 . Apr. 26 . _ _--_-May 29 __ -----July 6.- _ -----Aug. 3 __ ------Aug. 26-. -------Sept.27-------- -Oct. 31 - --
Dec. 26 __ ------
7.177.447.116.155.074.724.434.885.156.16
A3-5-36cd
*Oct. 23, 1950 Dec. 27_ -_------.
*Mar.30, 1951 --
7.111.79.249.44
July 30 . __-----
9.526.265.096.59
Sept. 28, 1951 _____Oct. 26_._.- -_ _Nov.27 __ - _ __
6.797.267.698.23
A3-6-5adl
June 17, 1949 ......July 29_- ---------Aug. 26___ ... --__Sept. 22---.--------Oct. 26 _ ._--.- __Nov.30 . .........
Jan. 30, 1950 -... -Mar. 4- ____ ....
7.5810.6910.709.468.758.368.047.698.47
May 31--_.- . July 6__ ..Aug. 3-- -. --
Dec. 3___..-----
7.45'7.327.388.038.388.318.637.496.97
Mar. 30, 1951 _ ..Apr. 28. .. .....June 25 ...July 30---------.Aug. 27-. -------Sept.28 ---------
Nov.27 --. ___ .Dec. 26---. . ..
6.656.886.627.387.837.957.557.256.97
A4-2-lldd
July 30, 1951.------Aug. 27 - _ -_-_
13.2611.33
Sept.28, 1951 -.-- 11.4518.82
Nov.27, 1951 __ .Dec. 27 ---------
23.0925.31
A4-2-29dd
*Feb. 7,1950.. *Mar. 6. ----------*Apr. 24 -------*May 29--.. -------
*July 5 __ --------*July 17 --------
17.517.517.718.2516.49.18.05
*Aug. 17, 1950-.---*Sept.l9_ -------*Oct 17*Nov. 17- -. ------*Dec. 19-__. ------Mar. 30, 1951 . .
7.16.98.59.6
11.912.94
Apr. 28, 1951 -.
July 30 __ -_-.--.Aug. 28.........Oct. 1 ...------
15.1210.758.027.026.966.94
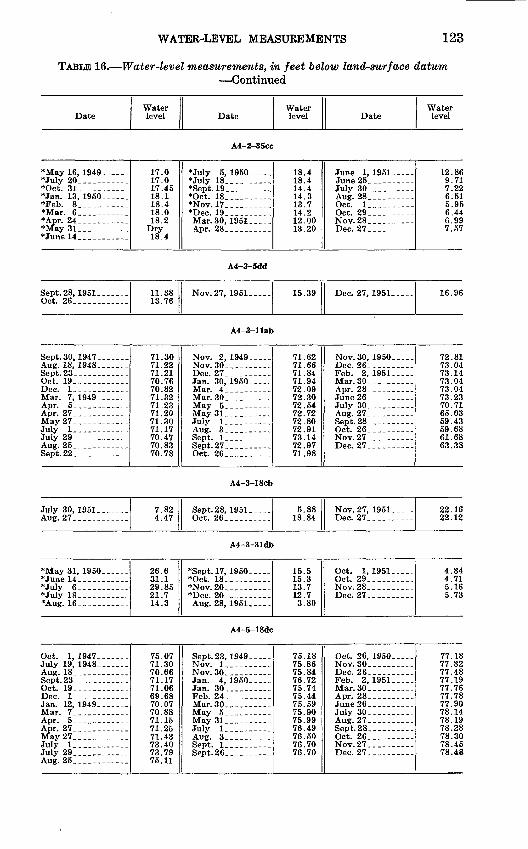
WATER-LEVEL MEASUREMENTS 123
TABLE 16. Water-level measurements, in feet below land-surface datum Continued
DateWater level Date
Water level Date
Water level
A4-2-35cc
*May 16, 1949.. _ .*July 20 ____ .._.*Oet. 31 ...... _ .*Jan. 13, 1950-..--.*Feb. 8_ ._-_ .-.*Mar. 6. ...... ..*Apr. 24-. _ ------*May 31. ..........*Junel4_._- _ _..-
17.017.017.4518.118.418.018.2
18.4
July 5, 1950 _ __*July 18....--- _*Sept. 19. .........*0ct. 18 __ -------*Nov. 17---------.*Dec. 19. __. ------Mar. 30, 1951-----Apr. 28-. __ ---.
18.418.414.414.313.714.212.0013.20
June 1,1951.----
July 30_ __ _ __ -Aug. 28. ---------Oct. !.__.. __ -Oct. 29_. ._-----Nov.28 __ .-__ ...Dec. 27. -------
12.869.717.226.515.956.446.997.57
A4-3-5dd
Sept.28, 1951-------Oct. 26_. __........
Sept. 30, 1947_ .....Aug. 18, 1948.---.-.Sept. 23 . -. - ..Oct. 19.. ____ _-..Dec. 1 .-.-..Mar. 7, 1949 _ ....
Apr. 27. _.--------_May 27. ...........July 1. ...........July 29 ..._-_---..Aug. 25 _ .......Sept. 22. -...-__----
July 30, 1951. __ ..Aug. 27....-.-.--..
*May 31, 1950... ...
*July 6--.------..*July 18 __ . _ ---.*Aug. 16-. ... _ .-
Oct. 1,1947 ___ -.July 19, 1948... ....Aug. 18_._...-.--_.Sept. 23.. ..........Oct. 19.. __ ----..Dee. 1 -_. _---...
Mar. 7. _ ........
Apr. 27 _...-----..May 27. _ ........July 1. _ --------July 29............
11.3813.76
71.3071.2271.2170.7670.8271.3271.2371.2071.3071.1770.4770.8370.78
7.824.47
26.631.129.8521.714.3
75.0771.3070.6671.1771.0669.6870.0770.8871.1571.2571.4373.4073.79
Nov. 27, 1951 __ .
A4-3-llab
Nov. 2, 1949-.--.Nov.30...- _ --.Dee. 27. _..._...Jan. 30, 1950----.
Mar.30-___ ......May 5-. ___ ...May 31.-. -.._...July 1__ . . _ .
Sept. 1_ ........Sept. 27. ____ -.Oct. 26-_ _ -----
A4-3-18cb
Sept.28, 1951.. ...
A4-3-31db
*Sept. 17, 1950 ---.*Oet. 18
*Dee. 20.----- -Aug. 28, 1951 ___
A4-5-18dc
Sept. 23, 1949 __ .Nov. 1__ -------Nov.30-_._ __ -.Jan. 4,1950----.Jan. SO....... -.Feb. 24.. - -----Mar.30. ___ ....
May 31. __ .....July 1. ____ .--
Sept. 1. _ - .....SeDt.26__-_-- . .
15.39
71.6271.6671.8471.9472.0972.3072.5472.7272.8072.9173.1472.9771.98
5.8818.84
15.515.313.712.73.80
75.1875.8675.8476.7275.7475.4475.5975.9075.9976.4976.5076.7076.70
Dee. 27, 1951. ... .
Nov. 30, 1950 ._--
Feb. 2, 1951---..Mar.30__ _ -----Apr. 28 . ._-.-.-
July 30._ ____ --Aug. 27 . ____ .Sept.28 ... _ .-Oct. 26. _ _ .-Nov.27_. ........Dec. 27__. .---._-
Nov. 27, 1951. .Dee. 27. ---------
Oct. 1,1951-----Oet. 29__-_ -.. _Nov.28. ... -.-._-Dee. 27 ... _ ..
Oct. 26, 1950 -.--Nov.30.. __ .--.Dee. 26_ .-..--.Feb. 2,1951-.---Mar.30_- __ ....Apr. 28.. __ .---
July 30. .. -------Aug. 27.. ..------Sept.28. _ ------Oct. 26 ______ -Nov.27 __ ------Dee. 27.... -
16.96
72.8173.0473.1473.0473.0473.2370.7165.0359.4359.6861.6863.38
22.1622.12
4.344.715.165.73
77.1377.3277.4877.1977.7677.7877.9078.1478.1978.2878.3078.4578.48
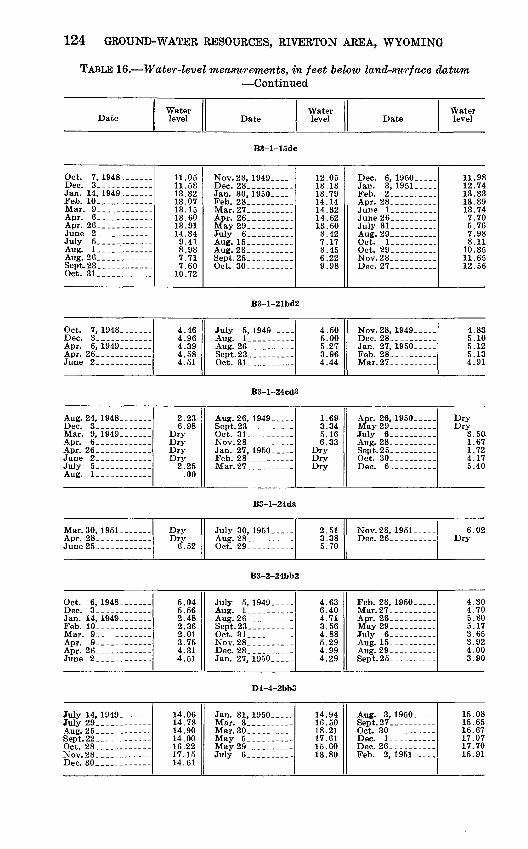
124 GROUND-WATER RESOURCES, RIVERTON AREA, WYOMING
TABLE 16. Water-level measurements, in feet below land-surface datum Continued
Date
Oct. 7, 1948.... _Dec. 3. ...-.Jan. 14, 1949 ____Feb. 10. __ __------Mar. 9_.__ ___ ...Apr. 6.. _. _ . ..Apr. 26_-___ _ ..
July 5 ___ ... ....Aug. 1. _. _ _ _.Aug. 26-_____ . . .Sept.23._ . __ ._Oct. 31_... ___ ..
Oct. 7,1948. .Dec. 3__ _ .Apr. 6, 1949. .. _Apr. 26____ _____
Aug. 24, 1948 __ ---.Dec. 3 __ . - _Mar. 9, 1949. . __
June 2 .. - - -July 5.. __ ------
Mar. 30, 1951 ____ -
June 25 ... . ..
Water level
11.0511.5813.3213.0713.1513.6013.9114.349.418.987.717.60
10.72
4.464.964.394.584.51
2.236.98
Dry
2.25.00
DryDry
6.52
Date
B3-l-15dc
Nov. 28, 1949 __ .Dec. 28 ___ . ....Jan. 30, 1950 __Feb. 28 ... ......Mar.27 __ . ......Apr. 26 __ . ......May 29 ......July 6 _______Aug. 15 ..... __
Sept. 25. .........Oct. 30 ._-----
B3-l-21bd
July 5, 1949 . ...
Oct. 31 _ ........
B3-l-24cd
Oct. 31. --. __ -Nov.28-_ .._._...Jan. 27, I960- --Feb. 28-. . -------Mar. 27-
B3-l-24da
Oct. 29 - .- __ -
Water level
12.0513.1313.7914.1414.3214.6213.608.427.178.456.229.98
Z
4.505.005.273.964.44
J
1.693.345.166.33
DryDry
2.513.385.70
Date
Dec. 6, 1950 __Jan. 3, 1951 .....Feb. 2 ___ . _ .Apr. 28 ..........
July 31 __ -.....-
Oct. 1- _____ -Oct. 29. ._......-Nov.28____. .....Dec. 27 ........
Nov. 28, 1949 .....Dec. 28 _____ ..Jan. 27, 1950 ....Feb. 28_. ..---...Mar.27.. ........
Apr. 26, 1950 .....May29_. _ .....July 6__--------Aug. 28.... .-.Sept.25_- __ --.-
Nov. 28, 1951 _ _.
Water level
11.9812.7413.3313.8913.747.705.767.988.11
10.3511.6512.56
4.835.105.125.134.91
Dry3.50.1.671.724.175.40
6.02Dry
B3-2-24bb2
Oct. 6, 1948 _._._
Jan. 14, 1949. ------Feb. 10-----------Mar. 9_- __ -----
Apr. 26-. ___ ..--
5.045.562.482.362.013.754.314.51
July 5, 1949 __ ..
Sept. 23. ___--___-Oct. 31.... ......Nov. 28 . .......Dec. 28.. . ......
4.636.404.713.564.885.294.994.29
Feb. 28, 1950-..--Mar.27 .______.._Apr. 26.- _ .._.May 29 __ -------July 6_--. ------Aug. 15... .......
4.304.705.805.173.653.924.003.90
Dl-4-2bb3
July 14, 1949. ___ -July 29.. ____ .--
Nov.28._-.._ __ --Dec. 30. ------ --.-
14.0614.7814.9014.0016.2217.1514.61
Jan. 31, 1950.-- Mar. 3. ---------Mar.30-. __ ....
May 29-...- _ ._
14.9416.5018.2117.6115.6013.80
Aug. 3, 1950 .. Sept. 27.. --------Oct. 30.- ___ --
Dec. 26 - - .--_-Feb. 2, 1951 .....
15.0815.6516.6717.0717.7015.91
WATER-LEVEL MEASUREMENTS 125
TABLE 16. Water-level measurements, in feet below land-surface datum Continued
Day1951
Mar. Apr. May June July Aug. Sept. Oct. Nov. Dec.
Al-4-29bd2[Daily noon water level]
12345678910111213141516171819202122232425262728293031
185.05184.91185.10185.09185.01184 . 87184.84185.01184.93184.84184.91
185.00185.01184.94184.87184.92184.99184.99185.04184.94185.16185.14
185.07185.14185.20
185.42185.50
185.45185.39185.51185.45185.32185.35
185.64185.88186.03186.06186.09186.20186.14186.16186.31186.32186.27186.19186.33186.45186.61186.67186.65
187.10187.06187.09187.13187.20187.20187.22187.29
187.34
187.37187.50187.52187.53187.49187.56187.58187.72187.82187.82187 . 78187 . 76187.84187.96187.91187.95187.99188.07188.09
188.18188.24188.31188.31188.44188.45188.60189.69188.80188.83
188.83188.85188.99188.94189.05189.13189.13189.21189.22189.29189.38189.49189.51189.54189.58189.63189.70189.68189.61189.57189 . 63189.73189.79189.76
190.06
190.07190.11190.12190.09190.20190.29190.28190.30190.38190.45190.48190.53190.571 Qrt 7rt190.73190.68190.73190.79190.82190.96190.97190.93190.99190.98191.11191.04190.99191.08191.17191.25191.31
191.29
191.41191.41
191.38191.30
191.05
190.84
190.50190.55190.67190.40190.27190.22
190 . 08189 . 96189.96190.00190.08190.09190.01190.01190.07189.98189.82189.72189.74189.73189 . 54189.63189.58189.71189.52189.33189.35
189.22189.20189.19189.25189.17189.05188.85188.86188.79
188.82188.60188.55188.42188.54188.52188.39188.22188.19188.16187.90187.70187.74
187.75187.88187.73187.57187.44187.24
186.97186.81186.79186.65
186 . 54186.36186.46186.33186.11186.20186.40186.41186.38186.28186.11185.98185.85185.99185.90185.76185.72185.50185.34185.46185.50185.39185.50185.39185.44185.50185.39185.18185.04184.95185.05
Day1951
Feb. Mar. Apr. May June July Aug. Sept. Oct. Nov. Dec.
Al-4-33dd[Daily noon water level]
123456 7 8 9
10 11 12 13141516171819202122232425262728293031
39.50 39.00 38.84 38.32 37.70 37.04 36.42 36.2336.5635.6436.2535.9436.1036.9035.9536.3036.1234.93 34.8734.2632.9533.9233.86
34.2033.0032.9934.5633.5632.66 34.16 34.92 35.01 34.62 34.16 32.82 32.9532.4931.1830.1829.5931.2433.1034.6935.95
36.85
42.4043.80 43.71 43.79 43.14 43.09 42.64 43.03
46.1048.7551.46
49.8549.25
50.7850.0250.5250.5150.1349.68
49.7849.0849.5451.3253.4055.49 55.91 56.86 57.50 56.34 57.02 58.72 59.6461.1262.5861.7060.1059.60
54.4354.64 56.4058.1560.2658.8259.8961.15
64.38
62.8661.0159.38K7 70
56.8357.06 57.40 58.74 60.93 60.75 61.81 63.76 65.0466.1767.3168.0867.5468.3269.77
71.30n Krr
69.94 67.4667.3468.3069.0269.8670.0470.82
69.6069.7270.8071.6071.7972.58 73.38 72.02 72.30 73.70 73.60 72.47 72.5473.1071.6272.7174.2075.5076.5077.1777.6275.6074.70 75.4476.2577.2777.8078.2077.3078.3078.87
79.7280.6381.0080.5578.9978.50 78.81 79.29 79.77 80.02 79.72 79.50 78.8479.5880.2280.5181.2382.0179.8780.4280.9080.3580.43 79.8079.9078.7577.9078.7678.6479.4378.69
77.4776.0774.5073 9Q
73.0073.59 72.82 71.37 69.65 69.25 69.38 68.94
68.4368.7067.5966.7165.83 64.5664.6165.0065.8865.6365.8266.18
65.8966.05
65.6764.3563.54 62.07 60.79 59.92 59.10 59.07 58.97 58.7958.3257.5456.7856.6856.9256.7056.1255.8754.8154.08 53.3352.8854.2353.9453.0952.2151.4551.40
50.3649.9549.5048.5649.2547.77 47.27 47.80 47.10 47.90 46.28 46.17 46.2646.4545.4946.7745.8643.7441.61
39.2538.1537.34 37.2736.6436.5436.7136.0938.5839.08
39.3941.21
41.3540.8241.49 41.85 41.83 41.86 41.49 42.50 42.39 43.0843.9644.6244.1743.7642.9943.7443.3943.2543.7544.48 43.7443.3042.5342.1641.9042.6042.6542.33
126 GROUND-WATER RESOURCES, RIVERTON AREA, WYOMING
TABLE 16. Water-level measurements, in feet below land-surface datum Continued
Day
1949
Jan. Feb. Mar. Apr. May June July Aug. Sept. Oct. Nov. Dec.
A2-3-35cal[Daily noon water level]
12 3 4 5 6 7 8 9
10 11 12 13 14 15 16 17 18 19 20 21 22 23 24 25 26 27 28 29 30 31
Day
6.97 6.85 6.72 6.65 7.10 7.00 7.00 6.99 7.00 7.00 7.02 7.14 7.38 7.44 7.41
17.33 7.48 7.48 7.41 7.42
7.44 7.41 7.43 7.39 7.48 7.43 7.65
!7.81 17.9317.7617.82 18.04 18.00 17.95 8.07 8.14 8.13 8.12 8.23 8.31 8.38 8.31 8.38 8.38 8.42 8.47 8.42
8.36 8.40 8.40 8.39 8.37 8.48 8.37 8.28 8.35
8 8 8 8 8 8 8 8 8 8 8 8 8 8 8. 8
30 30 36 32 10 20 19 02 11 17 20 15 19 31 26 30
8.24 8.14 8.19 8.29 8.25 8.19 8.16 8.02 8.16 8.26 8.16 7.93 7.84 7.94 8.00 7.86 7.84 7.73 7.61 7.52 7.50 7.51 7.51 7.37 7.27 7.34 7.41 7.30 7.05 7.02
7.08 7.13
27.12 7.17 7.35 7.47 7.24 7.06 6.99 6.88 6.83 6.70 6.55 6.45 6.26 6.07 5.90 5.99 5.92 5.78 5.73 5.65 5.57 5.54 5.45 5.34 5.21 5.07 4.97 4.95 4.91
4.84 4.87 4.93 4.91 4.81 4.78 4.68 4.60 4.64 4.61 4.51 4.45 4.41 4.42 4.35 4.22 4.19 4.30 4.22 4.17 4.15 4.06 4.01 3.93 3.87 3.86 3.90 3.89 3.82 3.86
3.90 3.87 3.79 3.75 3.74 3.77 3.82 3.88 3.92 3.87 3.82 3.79 3.76 3.74 3.74 3.62 3.62 3.67 3.65 3.61 3.67 3.67 3.64 3.64 3.62 3.60 3.59 3.65 3.69 3.69 3.70
3.70 3.66 3.64 3.60 3.60 3.60 3.57 3.55 3.56 3.54 3.59 3.60 3.61 3.60 3.60 3.62 3.62 3.61 3.62 3.66 3.65 3.63 3.59 3.64 3.66 3.68 3.71 3.71 3.69 3.73 3.72
3.69 3.64 3.64 3.64 3.61 3.61 3.62 3.62 3.57 3.51 3.49 3.56 3.63 3.63 3.60 3.54 3.58 3.69 3.75 3.71 3.75 3.78 3.77 3.69 3.62 3.69 3.72 3.70 3.59 3.54
33.51 3.54 3.56 3.58 3.49 3.52 3.55 3.70 3.76 3.66 3.78 3.85 3.95 4.02 3.98 3.92 3.90 3.87 4.06 4.06 4.10 4.18 4.26 4.24 4.20 4.15 4.14 4.17 4.14 4.30 4.30
4.25 4.34 4.34 4.36 4.41 4.39 4.30 4.15 4.14 4.16 4.37 4.60 4.62 4.60 4.56 4.69 4.72 4.70 4.61 4.70 4.78 4.74 4.67 4.70 4.80 4.73 4.71 4.73 4.95 4.94
1950
Jan. Feb. Mar. Apr. May June July Aug. Sept. Oct. Nov. Dec.
5.02 4.97 5.01 5.12 5.01 4.98 5.07 5.08 4.97 4.83 5.02 5.24 5.39 5.53 5.46 5.23
5.66 5.75 5.76 5.58 5.79 5.83 5.89
6.12 6.00 6.12
1951
Jan.
A2-3-35cal Continued
123456789
10111213141516171819202122232425262728293031
6.085.966.046.076.256.396.516.306.136.436.416.466.436.386.586.766.726.796.937.027.026.966.796.636.777.157.216.937.107.177.22
7.307.457.507.517.427.437.427.607.587.547.427.637.807.827.877.817.807.937.927.787.787.787.717.767.918.047.898.01
______
8.168.047.947.988.007.717.978.037.937.937.968.038.098.007.958.068.007.908.008.008.108.067.967.957.797.687.777.988.238.258.11
8.037.877.878.138.228.017.907.777.707.858.008.007.857.727.777.817.717.807.897.797.627.497.417.587.617.497.51
27.377.607.65
7.497.267.237.267.247.217.187.036.956.886.726.436.195.975.775.685.575.335.345.295.185.044.914.904.974.894.714.524.564.504.51
4.374.344.414.294.174.043.943.974.054.053.923.833.823.773.773.783.693.673.673.633.573.473.433.423.493.573.553.553.523.46
3.413.373.373.353.343.333.293.253.263.273.283.343.343.273.233.223.273.273.283.303.343.323.313.303.293.253.213.193.173.173.23
3.313.313.283.27
3.373.363.363.363.353.353.333.333.353.393.383.403.393.363.333.293.323.363.423.433.413.393.403.41
3.473.523.533.513.493.503.523.573.523.523.463.363.343.283.243.233.223.233.253.253.27
'3. 253.163.153.143.133.183.253.263.30
3.373.493.583.53
~3~7<r
3.823.823.823.733.833.823.884.013.963.933.993.994.084.064.014.014.144.194.194.18
4.324.394.484.43
4.404.474.694.644.554.324.374.414.604.794.73
______
4.884.874.955.005.005.024.975.044.954.83
4.714.874.974.935.305.245.005.165.425.455.355.305.305.365.455.595.625.635.585.625.705.685.715.755.615.745.715.715.805.775.57
5.765.855.735.936.116.35
16.426.206.096.216.096.196.39
______
6.216.236.256.39
~~6~77
6.886.85
______------
1 Reading may be in error.2 Opening of irrigation season water released into canals.3 Close of irrigation season no further release of water into canals.
WATER-LEVEL MEASUREMENTS 127
TABLE 16. Water-level measurements, in feet below land-surface datum Continued
Day
1949
Jan. Feb. Mar. Apr. May June July Aug. Sept. Oct. Nov. Dec.
A2-5-6adl[Daily noon water level]
1
5678g
101119
131415
17181920219990
249£
262728293031
DayJan. Feb. Mar.
12.5912. 6»12.6312.6212.6712.7312.7012.6412.5312.39
Apr.
U2 . 7212.7212.7712.7912.9312.8812.7712.7612.7512.7212.7112.6012.5812.5112.4412.3612.3512.4512.3512.2412.2712.1412.0611.9011.6611.6411.4511.3111.1911.1410.96
May
10.8210.7210.5910.4210.3610.3810.3310.4110.4710.4610.4110.5410.4510.4710.3410.2210.1910.089.679.509.159.008.818.588.548.478.147.857.607.51
1950
June
7.17
7.047.037.02
7.017.027.02
7.127.006.967.066.946.966.977.037.047.077.187.087.077.10
July
7.127.087.146.916.456.386.286.296.126.156.226.086.00
5.825.885.945.915.765.375.395.395.405.515.545.655.665.69
Aug.
5.555.525.605.555.565.585.615.705.675.725.716.116.036.046.126.066.356.456.406.396.496.496.446.416.446.636.616.616.556.64
Sept.
26.766.836.976.986.947.117.177.407.217.337.477 ^1
7.677.667.597 fi9
7.647.797.887.837.968.018.077.998.048.058.138.148.218.358.29
Oct.
8.388.448.438.518.548.498.458.368.468.508.838.838.768.778.828.938.908.868.829.018.978.978.909.039.009.013.999.169.309.14
Nov.
9.269.209 00
9.369.189.359.399.379.269.329.57
9.659.569,479.629.719.669.769.859 799.859.699.929.949.97
10.03
Dec.
A2-5-6adl Continued
123456189
10111213141516171819202122232425262728293031
10.5010.3510.6010.5310.5210.3410.5210.6510.7910.6510.62
10.9610.9310.9410.93
11.0811.1111.1311.1011.1411.1911.1511.1011.1911.1811.2211.2611.3311.3411.2211.42
11.4611.2911.4011.4411.4111.2611.5611.4611.4911.4911.5811.6111.5411.5511.6111.6711.6011.7411.7011.8011.7611.6711.8011.7411.6411.7711.7211.9512.0211.8811.93
11.8411.8612.0212.1012.0011.8911.9411.9311.9612.1812.18
12.0812.0812.1812.18
12.3712.3212.2112.23
12.1712.33
0)
12.2912.3512.3912.4012.4712.4612.4712.5012.5612.5612 4912.4212.3812.3412.3812.2812.2012.2012.2112.1312.0712.0312.1112.1612.0311.9311.9311.9411.9511.92
11.7611.9011.7511.6711.5811.4711.4311.4511.4111.2611.1111.0610.9810.8310.7710.5710.3210.2210.0510.009.809.679.60
9.579.499.429.36
9.259.239.109.008.978.878.798.798.788.738.748.828.628.478.378.308.107.687.237.217.167.147.127.047.006.946.956.997.037.047.17
7.077.026.716.666.556.626.606.53
6.786.766.776.626.676.526.486.576.606.576.446.476.336.386.306.256.24
6.266.105.80
5.045.215.41
5.69
6.266.336.26
(2)
6.716.786.88
6.947.117.257.047.047.247.457.357.377.517.617.617.667.637.687.787.827.937.967.917.958.088.058.178.138.228.188.348.388.378.46
8.558.758.648.608.588.748.728.929.05
8.869 199.06
1 Opening of irrigation season water released into canals.2 Close of irrigation season no further release of water into canals.
128 GROUND-WATER RESOURCES, RIVERTON AREA, WYOMING
-
I
Q COCOCOCOCOCOIMCOCOCOCOCOCOCOCOCOCOCOCOCOCOCOCOCOCOeqCOCOCOCOC
Oi r-l CO 1O t-1-4 P 00 CO Oi T-4 * *1O r-l 1O P * 1O 1O Oi IM O3 Oi 1 _. * 00 00 SO CO «O SO 00 03 10 CO CO r-l t-P * 10-^l t-t-t-001-00 tD
r-l r-l r-l r-l r-l r-l 1-4 r-l i-4 r-l IM IM IM r-l IM IM IM IM IM IM IM IM IM IM IM IM IM IM IM IM IM IM CO IM IM CO CO CO CO CO CO CO CO CO CO CO CO CO CO CO CO CO
5DrHCOPOiPSO?OlOt-PPrHPPCOIMlOt-lOlOOOt-OiOOOOt-r-lr-lr-IIM"8 O
oooooooot ' '
eoeoe
COO>r-IO51OOOPOOOOIMlOO3O3COCOt-«DPOiOOt-OiPr-lrHlO«DPPr-l
NiMNiMiMiMiMNNNeocxieoeoeoeoeoeoeoeocxicxicxieoeoeoeocxieoeo
eo d j -^ oo^pcoNOJost^t^Ncoeopoieoeodioscor-ipooooMPrHppcoos
'3
P.
OOO5PO5OiOOO5rHOiO5t-(MIMIMCOIMM^I<(MO5(MrHrH(M'>tlOIMl
pt( CO (M CO CO (M CO CO <N CO <N (M CO CO (M (M CO CO <N CO <N (M (M <N (M CO CO (M (M -j »
lO^lOtOOOrHOt-iopOOOlSSNCXICOCOlOtblO^SpMOOScoSJDt-
IMIMNIMIMIMIMNIMIMIMCXICOCOIMIMIMCXICXICOCO0303NCO0303COCO0303NNiMiMNNNiMiMNNNiMNeoeoeoiNcxieoeocxieocxieoeoeoeocxieoeo
COOOt- 10 10 «D r-l P -* t- 10 «D Oi -* «D 03 COoooiOi oioo«Dppoit-oiOioooop_-*eoP P P r-l r-l T-i CO CO r-l rH r-l r-i r-i r-l CO CO COeoeoeo eo eo eo eo eo eo eo eo eo eo eo eo eo eo
S ___ _____________________________________!- ' § d oi g. 9OOPt-«D 03lOOO_t-
O eoeoeoeo
>> a p
rH CO O3 1O «D t> 00 Oi P r-i CO O3 * 1O «D t-00 Oi P T-4 CO O3 C 1O «D t-00 Oi P T-4
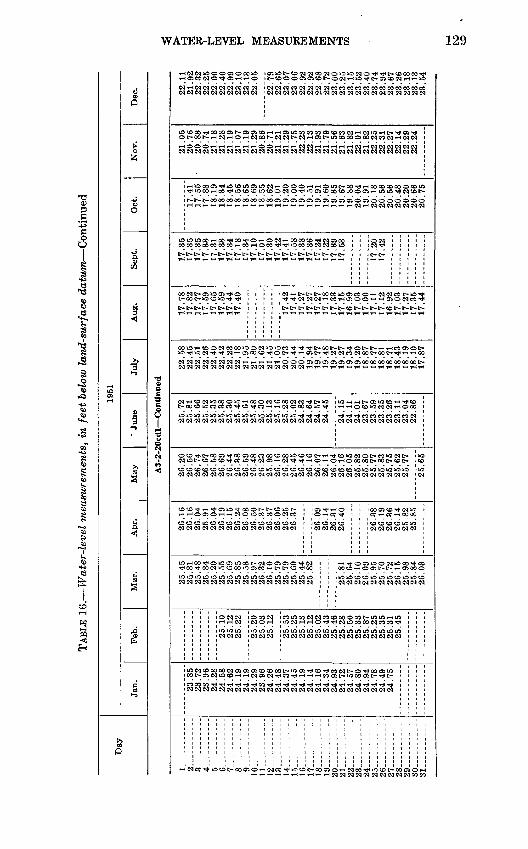
TABL
E 1
6.
Wat
er-l
evel
mea
sure
men
ts,
in f
eet
belo
w l
and-
surf
ace
datu
m C
onti
nued
. D
ay19
51
Jan
.F
eb.
Mar
.A
pr.
May
Jun
eJu
lyA
ug.
Sep
t.O
ct.
Nov
.D
ec.
A3-
2-20
cdl
Con
tin
ued
1 2 8 ---
----
-4 5.
---
---
6 ---
----
-7 8 ------
9 10
--
----
--11 12 13. ---
---
14 ---
---
15 --
----
--16 ------
17
. -
-18... -
----
---
19 OA 21__
____
__-_
_*>*
>O
Q 24
. ---
----
25 ------
26 --
----
-27 O
Q
on
30
Q1
23
.85
23.7
22
3.9
62
4.2
824.5
824.6
22
4.1
92
4.1
92
4.2
92
3.9
62
4.2
624.4
82
4.3
72
4.4
524.1
92
4.1
424.1
62
4.3
424
93
24
.72
24
.57
24
.80
OA
Q
A
24.7
824
.49
24.7
5
25.1
025
.12
25.2
2
25.2
025
.03
25.1
2
25.5
325
.25
25.1
325
.12
25.0
225
.43
25.2
825
.50
25.8
725
.25
25.3
525
.31
25.4
5
25.4
525
.31
25.4
825
.34
25.2
025
.55
25.6
925
.85
25.5
325
.97
26.3
226
.10
25.7
925
.79
25.6
025
.44
25.8
2
25.8
125
.64
26.1
026
.09
25.9
525
.70
25.7
226.1
525
.98
25.8
426
.03
26.1
626
.16
26.0
425
.91
26.0
426
.19
26.1
526
.24
26.0
326
.50
26.3
726
.37
26.0
626
.25
26.3
7
26.0
926
.14
26.3
126
.40
26.3
826
.19
26.3
626
.14
25.8
225
.85
26.2
026
.56
26.7
426
.67
26.5
826
.69
26.4
426
.38
26.5
926
.48
26.2
325
.98
26.1
626
.28
26.4
526
.46
26.1
626
.07
26.1
12
6.0
426
.16
26
.05
25.8
225
.80
25.7
725
.83
25.7
525
.62
25.7
7
25.6
5
25.7
225
.81
25
.66
25.5
225
.35
25.3
825
.30
25.4
525
.61
25.4
825
.30
25.1
325
.16
25.2
825
.02
24.8
324
.64
24.5
724
.45
24.1
524
.11
24.0
123
.67
23.5
923
.35
23.2
623
.11
23.0
422
.86
22.5
822
.45
22.5
122
.26
22.4
022
.42
22.2
322
.18
21.9
521
.80
21.6
221
.45
21.0
520
.73
20.4
420
.14
19.9
419
.77
19.4
819
.27
19.2
719
.34
19.2
018
.87
18.7
718
.81
18.7
118
.43
18.1
918
.10
17.8
7
17.7
817
.82
17.7
717
.59
17.6
517
.59
17.4
417
.40
17.4
217
.41
17.2
717
.27
17.2
717
.18
17.3
317
.15
16.9
917
.03
17.0
017
.11
17.1
216
.92
17.0
317
.27
17.3
517
.44
17.3
517
.35
17.3
517
.33
17.3
117
.33
17.3
417
.18
17.3
417
.10
17.0
117
.30
17.4
217
.41
17.5
817
.38
17.3
617
.24
17.2
217
.39
17.5
3
17.2
017
.42
17.4
117
.55
17.8
818
.19
18.3
418
.45
18.5
618
.65
18.6
918
.55
18.6
219
.01
19.2
019
.00
19.4
019
.51
19.9
119
.60
19.3
519
.67
19.8
820
.04
19.9
120
.18
20.5
620
.56
20.4
820
.20
20.6
62
0.7
5
21.0
520
.76
20.8
320
.74
21.1
821
.28
21.1
921
.07
21.1
921
.29
20.8
620
.71
21.2
121
.29
21.7
522
.23
22.1
321
.93
21.7
921
.56
21.6
321
.82
22.0
121
.82
22.2
522
.31
22.2
722
. 14
22.2
922
.24
99
1 1
21.9
22
2.3
22
2.2
52
2.0
02
2.4
022.9
923.1
023.1
32
2.0
5
OO
7
Q
22.6
523.0
723.0
6O
O
QO
oo
no
22
68o
o
70
23.0
023.2
523.1
5
23.4
023.7
423
.94
23.6
723
.26
OQ
i
e
23.1
323.5
4
I e 03 H
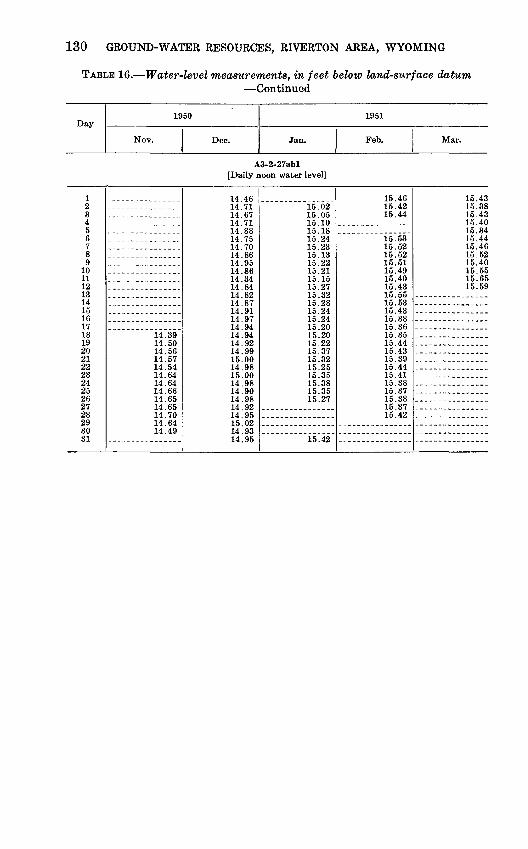
130 GROUND-WATER RESOURCES, RIVERTON AREA, WYOMING
TABLE 16. Water-level measurements, in feet below land-surface datum Continued
Day1950
Nov. Dec.
1951
Jan. Feb. Mar.
A3-2-27abl[Daily noon water level]
123456789
10111213141516171819202122232425262728293031
14.3914.5014.5614.5714.5414.6414 6414.6614.6514.6514.7014.6414.49
14.46
14.6714.7114.88
14.8614.9514.8614 3414.8414.8214.8714.9114 9714 9414 9414.9214.9915.0014.9815.0014.9814.9014.9814.9214.9515.0214.9314.95
15.0215.0515.1015.1815.2415.2315.1315.2215.2115.1515.2715.3215.2815.2415.2415.2015.2015.2215.3715.321 1\ *?%
15.3515.3815.3515.27
15.42
15.4615.4215.44
15.5315.5215.5215.5115.4915.4015.4315.5515.5315.4315.3815.3615.3515.4415.4315.3915.4415.4115.3815.3715.3815.3715.42
15.4315.3815.4315.4015.3415.4415.4615.5215.4015.5515.6515.59
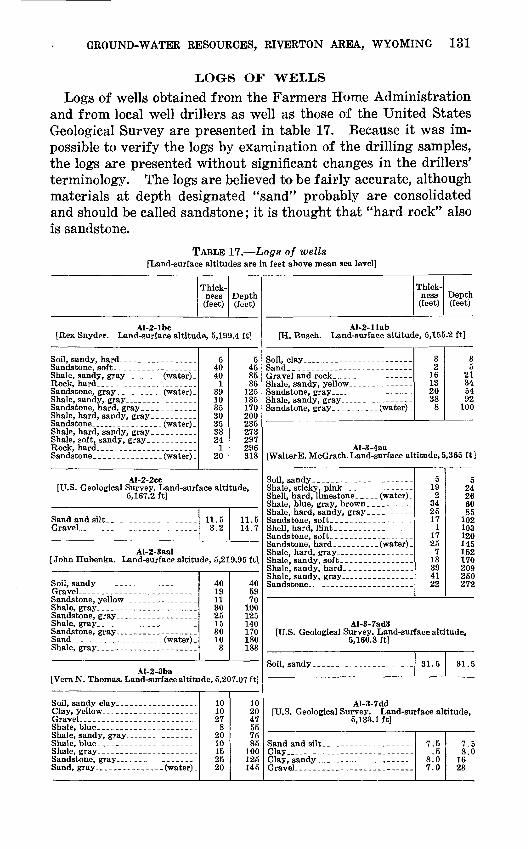
GROUND-WATER RESOURCES, RIVERTON AREA, WYOMING 131
LOGS OF WELLS
Logs of wells obtained from the Farmers Home Administration and from local well drillers as well as those of the United States Geological Survey are presented in table 17. Because it was im possible to verify the logs by examination of the drilling samples, the logs are presented without significant changes in the drillers' terminology. The logs are believed to be fairly accurate, although materials at depth designated "sand" probably are consolidated and should be called sandstone; it is thought that "hard rock" also is sandstone.
TABLE 17. Logs of wells[Land-surface altitudes are in feet above mean sea level]
Thick ness (feet)
Depth(feet)
Al-2-lbc[Rex Snyder. Land-surface altitude, 5,199.4 ft]
Shale, hard, sandy, gray _ _ . .Sandstone . _ _ _._ (water).
5 40 40
1 39 10 35 30 35 38 24
1 20
5 45 85 86
125 135 170 200 235 273 297 296 318
Al-2-2cc[U.S. Geological Survey. Land-surface altitude,
5,167.2 ft]
11.5 3.2
11.5 14.7
Al-2-3aal[John Hubenka. Land-surface altitude, 5,219.95 ft]
Gravel ........ ..._ .........Sandstone, yellow .. -.._. ...
Shale, gray.. . . .... .. -.-_--.
40 19 11 30 25 15 30 10
3
40 59 70
100 125 140 170 180 183
Al-2-3ba[Vern N. Thomas. Land-surface altitude, 5,207.07 ft]
Gravel _ ......... . ......Shale, blue . . . . ..... .. . . _ .
10 10 27
8 20 10 15 25 20
10 20 47 55 75 85
100 125 145
Thick ness
(feet)Depth (feet)
Al-2-llab[H. Busch. Land-surface altitude, 5,155.2 ft]
3 2
16 13 20 38
8
3 5
21 34 54 92
100
Al-3-4aa[WalterE. McGrath. Land-surface altitude, 5,365 ft]
Shale, blue, gray, brown.
Sandstone, soft . . _ . _ . _ . . .
Shale, sandy, hard . . . -------
5 19 2
34 25 17
1 17 25
7 18 39 41 22
5 24 26 60 85
102 103 120 145 152 170 209 250 272
Al-3-7ad3[U.S. Geological Survey. Land-surface altitude,
5,160.8 ft]
31.5 31.5
Al-3-7dd[U.S. Geological Survey. Land-surface altitude,
5,133.1 ft]
Clay..-.-.--. ------------------7.5
.5 8.0 7.0
7.5 8.0
16 23

132 GROUND-WATER RESOURCES, RIVERTON AREA, WYOMING
TABLE 17. Logs of wells Continued
Thick ness (feet)
Depth(feet)
Al-3-13dd2[O. G. Griffey. Land-surface altitude, 5,456.07 ft]
Gravel _ _ - - _______ _. -Shale, green _____ Shale, gray ____ _______ Shale, red- _ (water)
Sandstone _ _ _ - (dry) Shale, blue _ .----_.__
4 14
5 34
123 100 22
2
4 18 23 57
180 280 302 304
Al-3-16dbl[Marvin Williams. Land-surface altitude, 5,173.8 ft]
Sandstone.. -----Shale, blue ___ ______Shale, brown. - _ _ _ ___Sandstone, hard, gray and white- __
20 80 40 45
20 100 140185
Al-3-16dd3[Dean Spencer. Land-surface altitude, 5,162.7 ft]
Shale, sandy, gray - __ _
Shale, sandy, gray _ ...Sandstone, gray _ _ _____
Sandstone, gray _ -___- _ _ _ _
Shale, sandy, blue- _ _ _ _ _Shale, sticky, gray___ .._ .-.
12 21
2 40
5 3
29 24 24 26 34 50 15 15 12 15 18 15 17 33
12 33 35 75 80 83
112 136 160 186 220 270 285 300 312 327 345 360 377 410
AI-3-17ad[Alex Heil. Land-surface altitude, 5,130.4 ft]
Shale, sticky, blue_ _ _Shale, sticky, gray Sandstone, red and black _ ___.Shale, blue . _ _.Shale, sandy, gray __ ... _ _ _Sandstone, coarse _ _ _. (water)Shale, sandy, gray_
40 16 14 30 20 27 46 32 10 11 34
5
40 56 70
100 120 147 193 225 235 246 280 285
AI-3-17da[U.S. Geological Survey. Land-surface altitude,
5,116.8 ft]
Sand and silt ._.- .__ _ _Clay-____ _________________Sand and silt. ___. ___Gravel .___ ___Sandstone __ _--____-__.________
14 2
16.5 1.3
14 16 32.5 33.8
Thiek-ness
(feet)Depth (feet)
Al-3-21da[Mrs. Gould Quiver. Land-surface altitude,
5,096.65 ft]
Muek(?), yellow___._ _________ Gravel. __ _ _____ Shale, yellow___ _ __ _ _Shale, blue.. _ _ _ __ _._ Sand, gray. ... _ _ (water) .
18 12 20 10 30 10
18 30 50 60 90
100
Al-3-22bb[Dean Spencer. Land-surface altitude, 5,153.77 ft]
[?]-_-_---- -...... .
Shale, blue and green ________ _
115 75 4
76 24 66 10 10 25
5 16
6 43
115 190 194 270 294 360 370 380 405 410 426 432 475
AI-3-22CC[Lewis Weber. Land-surface altitude, 5,088.21 ft]
16 10 11 25 10 11
16 26 37 6272 83
Al-3-25db[W. A. Jarvis]
Shale, brown, and coal__------_-
10 40 30 10
10 50 80 90
Al-3-26ca[Claude Fike. Land-surface altitude, 5,083.19 ft]
Shale, sandy, gray _.----__ _
Rock, hard, gray, and sandy shale. _ Sand __ __ _-- ... (water)
Shale, red, brown-_--------_----_
45 15 40 35
5 60 12
8 19 41 30 35 20 10 25 27
3
45 60
100 135 140 200 212 220 239 280 310 345 365 375 400 427 430
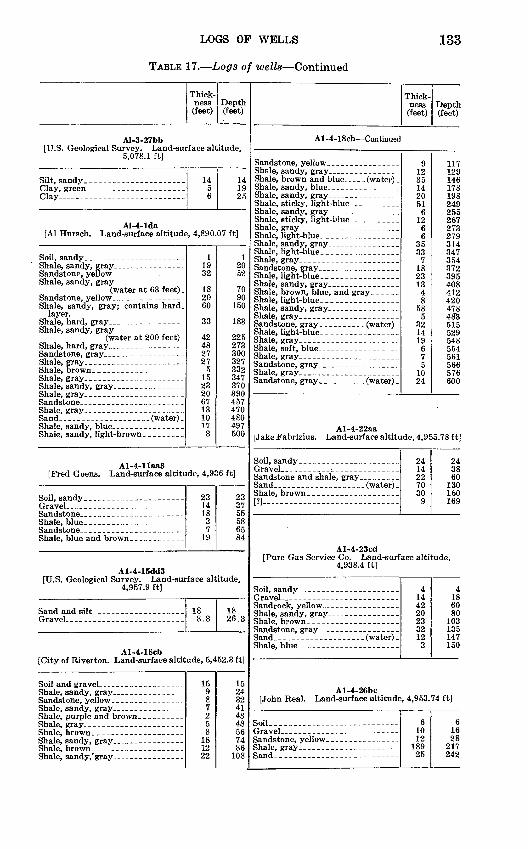
LOGS OP WELLS
TABLE 17. Logs of wells Continued
133
Thick ness (feet)
Depth (feet)
Al-3-27bb[U.S. Geological Survey. Land-surface altitude,
5,078.1 ft]
Clay... ...... ...... ---------
14 5 6
14 1925
Al-4-lda[Al Hursch. Land-surface altitude, 4,890.07 ft]
Soil, sandy __________ _ __Shale, sandy, gray __ __ _ _____Sandstone, yellow. ......_ _ . __Shale, sandy, gray
(water at 63 feet) _ Sandstone, yellow. _ _ _ _Shale, sandy, gray; contains hard,
layer. Shale, hard, gray __ .. . -___Shale, sandy, gray
(water at 200 feet) _ Shale, hard, gray.. _ . ______Sandstone, gray . _ __--_--_Shale, gray_____ __ _. ._._Shale, brown ._ _- __ __Shale, gray. ._. .__-----_ .--.-
1 19 32
18 20 60
33
42 48 27 27
5 15 23 20 67 13 10 17
3
120 52
70 90
150
183
225 273 300 327 332 347 370 390 457 470 480 497 500
Al-4-llaa3[Fred Goens. Land-surface altitude, 4,936 ft]
Soil, sandy. ._. -___ .-Gravel... _. -___ ___-._ __ _.
23 14 18
3 7
19
23 37 55 58 65 84
Al-4-15dd3[U.S. Geological Survey. Land-surface altitude,
4,957.9 ft]
Sand and silt . _._-- _____ _GraveL--... _.___ _ - - -
18 8.3
18 26.3
Al-4-18cb[City of Riverton. Land-surface altitude, 5,452.3 ft]
15 9 8 7 2 5 8
18 12 22
15 24 32 41 43 48 56 74 86
108
Thick ness (feet)
Depth (feet)
Al-4-18cb Continued
Sandstone, yellow. ..__ _ _ _ _ _
Shale, brown and blue__ . (water)Shale, sandy, blue _.Shale, sandy, gray _________Shale, sticky, light-blue . . . .
Shale, light-blue . ... .. ....
Shale, light-blue ._ _.
Shale, brown, blue, and gray. _____
Shale, sandy, gray ... ____ _____
Shale, light-blue ... ...._.
912 35 14 20 51
6 12
6 6
35 33
7 18 23 13
4 8
58 5
32 14 19
6 7 5
10 24
117 129 146 178 198 249 255 267 273 279 314 347 354 372 395 408 412 420 478 483 515 529 548 554 561 566 576 600
Al-4-22aa[Jake Fabrizius. Land-surface altitude, 4,955.78 ft]
Soil, sandy
[?]
24 14 22 70 30
9
24 38 60
130 160 169
Al-4-23cd[Pure Gas Service Co. Land-surface altitude,
4,938.4 ft]
4 14 42 20 23 32 12
3
4 18 60 80
103 135 147 150
Al-4-26bc[John Real. Land-surface altitude, 4,953.74 ft]
Soil __ -_ _- 6 10 12
189 25
6 16 28
217242
134 GROUND-WATER RESOURCES, RIVERTON AREA, WYOMING
TABLE 17. Logs of wells Continued
Thick ness (feet)
Depth(feet)
Al-4-27aa3[Robert Spencer. Land-surface altitude, 4,952 ft]
Sand . .. ___ ._ ..(water).
Sand ________ - -__ _ _ -_Shale, brown and blue ______ - -
10 8
22 10 38
2 75
6 24 25 25 10 40
5
10 18 40 50 88 90
165 171 195 220 245 255 295 300
Al-4-27aa4[Earl Sullivan. Land-surface altitude, 4,951.40 ft]
Soil.. -____-----__--__--_____._
Sandstone, yellow. _ _ (water)Shale, sandy, gray _ _ __ __Sandstone, gray _ _ _. _Shale, sandy, gray. . ____ _____Sandstone, gray ______ _____Shale, sandy, gray. ________Shale, bluish-brown, mixed with coalShale, gray. ...__ __ ________Shale, brown, containing some oil__ Shale, gray.-- __ _ _.-__.__Shale, dark-brown___ __ __ ___Shale, sandy, gray, _ ________
3 12 22
4 12 12 15 15 13 10
2 8 7 2 3
35 25 85
315 37 41 53 65 80 95
108 118 120 128 135 137 140 175 200 285
Al-4-27ab[Carlos Apodaca. Land-surface altitude, 4,961.4 ft]
Soil, sandy ___ _ _____
Sandstone, yellow. _._ ____ _ _ _
Sandstone, gray __.. _ _ _ _ _Shale, hard, gray _ __ _ _Shale, blue and brown _ _ _ _ _
3 9
10 38 10 28 62 10 15 34
3 12 22 60 70 98
160 170 185 219
Al-4-27adl[Earl Sullivan. Land-surface altitude, 4,954.94 ft]
Soil________. ____________
Sand. -_-----._-________________
7 13 25 95 10 10
7 20 45
140 150 160
Thick ness (feet)
Depth (feet)
Al-4-27bb2[E. E. Davis. Land-surface altitude, 5,022.29 ft]
Soil__ __-__----_-_-_._--___-___- Gravel __ _.___ .__ (water)Sandstone, yellow. . ._ __ . . ...Shale, hard, gray _ _. _--._Sandstone, gray and red _ _ _Shale, blue and gray _ _.....Sand. -.._ _ ._ _ ___ (water).Shale, gray..-.. _. _ _ _ _ .
[?] _ _ _ _ -. _ __
2 13 15 95
9 11 20 16
5 4
2 15 30
125 134 145 165 181 186 190
Al-4-27bc[Elmer Peterson. Land-surface altitude, 5,015.18 ft]
26 54 40 28 32
26 80
120 148 180
Al-4-27ca4[Eldin Robertson. Land-surface altitude, 5,009.9 ft]
14 21 23 15
2 30 10 35 12
4
14 35 58 73 75
105 115 150 162 166
Al-4-27cb2[Lon Wagoner. Land-surface altitude, 5,015.71 ft]
18 14 18 10 12
5 38 20 15 35
18 3250 60 72 77
115 135 150 185
Al-4-27cdl[City of Riverton. Land-surface altitude,
4,983.37 ft]
Sandstone, hard. . .__--__-----_.
Shell, hard_ _____---___-__ ----
Shale, soft, green __-_--_-----__
1050
5 8
12 45
1 5 3 5 1
10 60 65 73 85
130 131 136 139 144 145
LOGS OP WELLS
TABLE 17. Logs of wells Continued
135
Thick ness
(feet)Depth (feet)
Al-4-27cdl Continued
Shale, hard, gray _ . _.__- _ __
Shell, hard . _ . _ .............
Shell, hard.. -__--------__-______
Shell, hard. --_---------_---_____
Shell, hard.. -------_---__--_____
7 18
9 1
10 30 20
1 2
12 10 19 23 13 30
5 13 12 3 2 5
28 10 34 21 4 9 5 5
29 19 36 25
7 23
152 170 179 180 190 220 240 241 243 255 265 284 307 320 350 355 368 380 383 385 390 418 428 462 483 487 496 501 506 535 554 590 615 622 645
Al-4-27dc[City of Riverton. Land-surface altitude,
4,969.90 ft]
Shale, sandy, gray _ ._ Sandstone, gray - ------- Shale, gray ......
Sand.. - . ------ .(water) Shale, dark-gray _ - - _ - - _ Shale, brown and blue - _ Shale, gray... ... .. ...
Shale, sandy, gray .......Sand ... . _- . _-_(water)Shale, hard, blue _ . . . _ . .
Shale, hard, gray... ------- Shale, brown.. _ .. . .. ..Sandstone, gray. _ . . . _ . . . _ .Sand_ -- --_-_--. .... (water) - Shale, hard, gray___ .. . . Shale, brown and blue .
Sand and hard shells . . . . . (water)
20 55 23 67 27 18 25 15 4
14 4
21 10 34 18 48 12 10
5 20
8 22
5 3 5 5
12 22
3 36
4 3 7
20 75 98
165 192 210 235 250 254 268 272 293 303 337 355 403 415 425 430 450 458 480 485 488 493 498 510 532 535 571 575 578 585
Thick ness
(feet)Depth (feet)
Al-4-27dd[City of Riverton. Land-surface altitude,
4,954.93 ft]
Soil. --------------------------
Shale, blue . .. ..-._-.--
3 1334 32 25 29 25 14
6 11 24 56
9 31
8 33
9 3
10 8
11 6 2 8
10 5
30 5
55 15 12 31
7 18
2
3 1650 82
107 136 161 175 181 192 216 272 281 312 320 353 362 365 375 383 394 400 402 410 420 425 455 460 515 530 542 573 580 598 600
Al-4-28aa4 [Eugene Gassel. Land-surface altitude, 5,053 ft]
Sand and graveL. .... _.--_-.-- Sandstone, yellow- -- ... ._ _.. Sandstone, gray_ _ _- _ --_ - _Shale, gray, ---------- . . _Sandstone, gray, -.__ . ----- Sandstone, yellow . . _ _-___ Sandstone, gray _.___ .__.. Rock, hard. . . . . . . _ . . . . .Sandstone, gray _ _ _ _ . - _ _. Shale, blue--- - .. -..
Rock, hard . .. ._ . .. _.Shale, hard, gray _ _ .-_ .. Shale, blue ....._. . . _ . . _ . - - -Shale, sandy-.--- _.. .__- -__
Shale, gray-.- - . _._ _. . _ _ Sandstone, red and blue. Sand, coarse . . . . (water)
12 23 15 4 7 3
16 7 4
11 10
3 24
7 32
1 6
15 17
12 35 50 54 61 64 80 87 91
102 112 115 139 146 178 179 185 200 217
Al-4-28ab[U.S. Geological Survey. Land-surface altitude,
5,058.2 ft]
2 7.2
2 9.2
136 GROUND-WATER RESOURCES, RIVERTON AREA, WYOMING
TABLE 17. Logs of wells Continued
Thick-
(feet)Depth (feet)
Al-4-28ad[C.WittAnderson. Land-surf ace altitude, 5,025.39ft]
2 11 12
6 1
13 15 12 18 50 20 15 23
2
2 13 25 31 32 45 60 72 90
140 160 175 198 200
Al-4-29bd2[City of Riverton. Land-surface altitude,
5,182.80 ft]
SoiL -_--------------_-----.
Shale. ___ . ___ - __ - __ -------
Shale, sandy --------- - -...
Shale, sandy . . . _ ___,--Shale,..- __ ... _ -------------Shale, ___ - _______ .........Shale, sandy. ... . -._ --Shale... ______ --------- _ .--Shale, sandy. - ------- --_Shale ---------.-------------_Shale and shells. _ - _Shale-. .........................Sand shell... - - -..._ .Sand-. . . . .--. --- ---Shale-. -----------------.-.-----Sand shell, hard. -- -_-..Sand -------Shale....... ___ . .............Sand . - - _-. .- -. - --.
10 20 20 30 20 20 10 30 30 10 10 10 60 60 30 10 10 10 30
2 17 36 4 1
13 3
69 3
10 30 50 80
100 120 130 160 190 200 210 220 280 340 370 380 390 400 430 432 449 485 489 490 503 506 575 578
Al-4-29cc [U.S. Geological Survey. Land-surface altitude,
5,039.4 ft]
Clay8 2 2.7
8 10 12.7
Thick ness
(feet)Depth (feet)
Al-4-30ca[Charles Ridgeway. Land-surface altitude,
5,095.40 ft]
Coal. -. ------ - ----- ------
Sandstone.- - - _--- ...Sand. .... .- -.-- ( water) _
4 12 25 42 3 64 20 19 21
9 27 29 43 18 56
9 11 15 11
6 1
10 14 13 30 23
3
4 1641 83 86
150 170 189 210 219 246 275 318 336 392 401 412 427 438 444 445 455 469 482 512 535 538
Al-4-31bc[I. D. Woodward. Land-surface altitude,
5,035.47 ft]
Sandstone, soft, gray (poor water) -
30 10 10
9 14 32 25 40 20 45 33 10 37
7 36 2
30 40 50 59 73
105 130 170 190 235 268 278 315 322 358 360
Al-4-32dc[George Rein. Land-surface altitude, 4,990.68 ft]
Soil-.. ___ - _ --------_-_..--
Shale, sandy, gray ... - -_....
3 15 12 22 23
100 47
2 13
1 62 10 20
3 18 30 52 75
175 222 224 237 238 300 310 330
LOGS OP WELLS
TABLE 17. Logs of wells Continued
137
Thick ness (feet)
Depth (feet)
Al-4-33ba3[William Mund. Land-surface altitude,
5,067.87 ft]
Soil, sandy..- -- -Gravel --- --- -- --Shale, yellowish-gray
Coal shale . _ - -Shale, sandy, blue-- .Sandstone, gray.. ._ -_ ---
Shale, gray, ._ --. -_ -_-
4 20
6 9 3
11 8
69 20 12
3 15 20 25 20 33
2
4 24 30 39 42 53 61
130 150 162 165 180 200 225 245 278 280
Al-4-34ad [City of Riverton. Land-surface altitude,
4,934.24 ft]
Soil. __ _ -----------------.-
Shale, hard, sandy, gray - - _ _
Sand.---- - -- --- (water)
Shale sandy gray
Sand .-_ ___ __-(water)-
Shale, brown and blue _ - - - - -
8 12 18 88 31
4 19
6 16 25 13 35 15 20 25 11 17
6 11 12 16 28
4 31 29 36 19 14 11 10 15
4
8 20 38
126 157 161 180 186 202 227 240 275 290 310 335 346 363 369 380 392 408 436 440 471 500 536 555 569 580 590 605 609
Al-4-34bal[City of Riverton. Land-surface altitude,
4,969.00 ft]
Wash ravellShale,' sandy _ "(trace of water) -
23 17 60 10 25 50 55 30
5
23 40
100 110 135 185 240 270 275
Thick ness (feet)
Depth (feet)
Al-4-34bal Continued
Shale, red -. .-.-. - -__ _ __
Hardshell __ .. _ -----------Shells..- ___ _--------_____ ___Sand.- _ -- .--__ _ (water)
Shale, brick-red _-.. .-._ __ . _Shale, variegated- ------- -----
60 33 62
7 6 7
25 12 20
3 25
335 368 430 437 443 450 475 487 507 510 535
Al-4-34bbl[City of Riverton. Land-surface altitude,
5,030.15 ft]
Sandstone, red, black, and white .
[?] _ -----
4 14
9 9
24 110
10 43 17 15 15 13
3 14
5 10
6 14 15 35 25 31 4
21 19 35
8 3
79 52
4 18 27 36 60
170 180 223 240 255 270 283 286 300 305 315 321 335 350 385 410 441 445 466 485 520 528 531 610 662
Al-4-34bb2[City of Riverton. Land-surface altitude,
5,022.87 ft]
Rock, hard. . _ . _ - - -. -- ---
Shell, hard ------ _____ ------
12 8
30 20 72
1 16 19 22 2
63 1 6
13 22
8
12 20 50 70
142 143 159 178 200 202 265 266 272 285 307 315
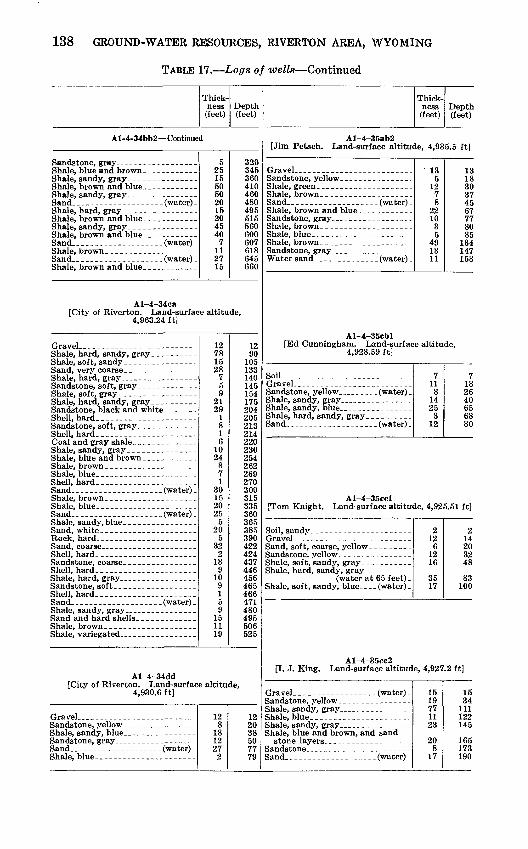
138 GROUND-WATER RESOURCES, RIVERTON AREA, WYOMING
TABLE 17. Logs of wells Continued
Thick ness (feet)
Depth(feet)
Al-4-34bb2 Continued
Shale, brown and blue. . _ -----
5 25 15 50 50 20 15 20 45 40
7 11 27 15
320 345 360 410 460 480 495 515 560 600 607 618 645 660
Thick ness (feet)
Depth(feet)
Al-4-35ab2[Jim Petsch. Land-surface altitude, 4,935.5 ft]
Shale, brown -.__ ... _-
' 135
12 7 8
22 10
3 5
49 13 11
1318 30 37 45 67 77 80 85
134 147 158
Al-4-34ca[City of Riverton. Land-surface altitude,
4,963.24 ft]
Shell, hard. ____ --------- _ ---
Shell, hard-... ------------------
Shell, hard.- ______ -----------
Sand- _ -- _ - -- - (water) -
Shell, hard ... ______ - _ -----
Shell, hard.-- -----------------
Shell, hard. ________ - ___ .--Sand _ -- - - _ - (water)
12 78 15 28
7 5 9
21 29
1 8 1 6
10 24
8 7 1
30 15 20 25
5 20
5 32
2 13
9 10
9 1 5 9
15 11 19
12 90
105 133 140 145 154 175 204 205 213 214 220 230 254 262 269 270 300 315 335 360 365 385 390 422 424 437 446 456 465 466 471 480 495 506 525
Al-4-34dd[City of Riverton. Land-surface altitude,
4,930.6 ft]
12 8
18 12 27
2
12 2038 50 77 79
Al-4-35cbl[Ed Cunningham. Land-surface altitude,
4,928.59 ft]
Soil. ___--_---_-_-_______---____GravelSandstone, yellow . ...... (water)
Shale, sandy, blue . _ . . . . . . .Shale, hard, sandy, gray - _ - - -Sand.- - --------- - .-.(water)-
7 11
8 14 25
3 12
7 18 26 40 65 68 80
Al-4-35ccl[Tom Knight. Land-surface altitude, 4,925.51 ft]
Shale, hard, sandy, gray (water at 65 feet) -
2 12
6 12 16
35 17
2 14 20 32 48
83 100
Al-4-35cc2[I. J. King. Land-surface altitude, 4,927.2 ft]
Sandstone, yellow. ...
Shale, blue and brown, and sand
15 19 77 11 23
20 8
17
15 34
111 122 145
165 173 190
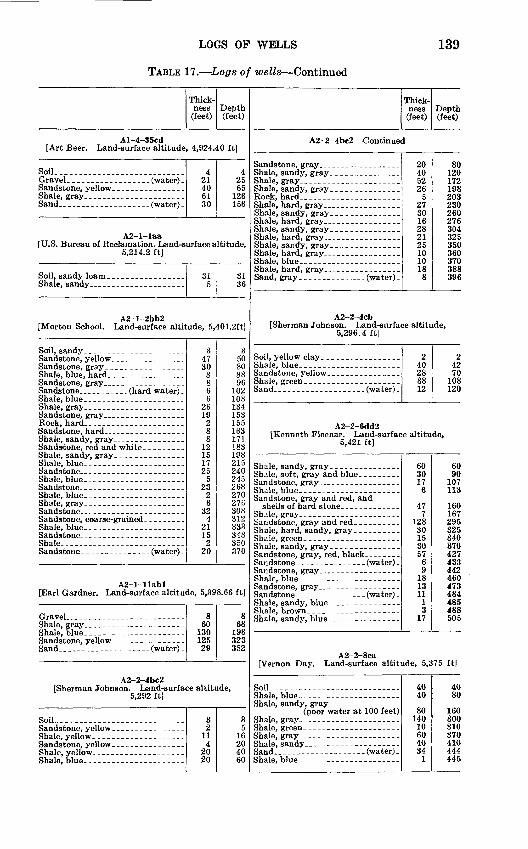
LOGS OF WELLS
TABLE 17. Logs of wells Continued
139
Thick ness
(feet)Depth (feet)
Al-4-35cd[Art Beer. Land-surface altitude, 4,924.40 ft]
Soil.. .--._. ........._... .......
Shale, gray . _ _______Sand .... _. . __ _ .(water)
4 21 40 61 30
4 25 65
126 156
A2-l-laa[U.S. Bureau of Reclamation. Land-surface altitude,
5,214.2 ft]
Soil, sandy loam . . . _ . _._Shale, sandy_ . . . _ . .
315
31 36
A2-l-2bb2[Morton School. Land-surface altitude, 5,401.2ft]
Shale, blue . ... ._--__ ___
Sandstone, red and white . . . . .
Shale, blue -___-___ . . __-Sandstone . ... .... ___-.Shale, blue _______ .. __ .... ..Sandstone _.. _ ._ . ..-.-. .
Shale, gray __ _ . . . . . __ _____Sandstone.. _ .. .__ _____Sandstone, coarse-grained . . _ _Shale, blue ..._.._._.. . . . . .Sandstone ...... _ . .. _.ShaleSandstone . __ _ _ (water) _
3 47 30
8 8 6 6
26 19
2 8 8
12 15 17 25
5 23
2 6
32 4
21 15 2
20
3 5080 88 96
102 108 134 153 155 163 171 183 198 215 240 245 268 270 276 308 312 333 348 350 370
A2-l-llabl[Earl Gardner. Land-surface altitude, 5,398.66 ft]
Gravel.. .__-_ .-___--Shale, gray. ._ . ._ -.-__-.
8 60
130 125 29
8 68
198 323352
A2-2-4bc2[Sherman Johnson. Land-surface altitude,
5,292 ft]
Soil __ _ ______ ______ ----_-_ 32
11 4
20 20
35
16 20 40 60
Thick ness
(feet)Depth (feet)
A2-2-4bc2 Continued
Shale, sandy, gray __ .. _____
20 40 52 26
5 27 30 16 28 21 25 10 10 18
8
80 120 172 198 203 230 260 276 304 325 350 360 370 388 396
A2-2-4cb[Sherman Johnson. Land-surface altitude,
5,296.4ft]
Soil, yellow clay. . _ __ __-_ .Shale, blue ...........Sandstone, yellow _ _ _ _ _ _ _Shale, green ... ____ _ ____
2 40 28 38 12
2 42 70
108 120
A2-2-6dd2[Kenneth Fleenar. Land-surface altitude,
5,421 ft]
Sandstone, gray and red, and
60 3017 6
47 7
128 30 15 30 57
6 9
18 13 11
1 3
17
60 90
107 113
160 167 295 325 340 370 427 433 442 460 473 484 485 488 505
A2-2-8ca [Vernon Day. Land-surface altitude, 5,375 ft]
Soil. -_.--- ------------- ---
Shale sandy, gray (poor water at 100 feet)
Sand.. _.-_ __- .-_ _ -(water).
40 40
80 140
10 60 40 34
1
40 80
160 300 310 370 410 444 445
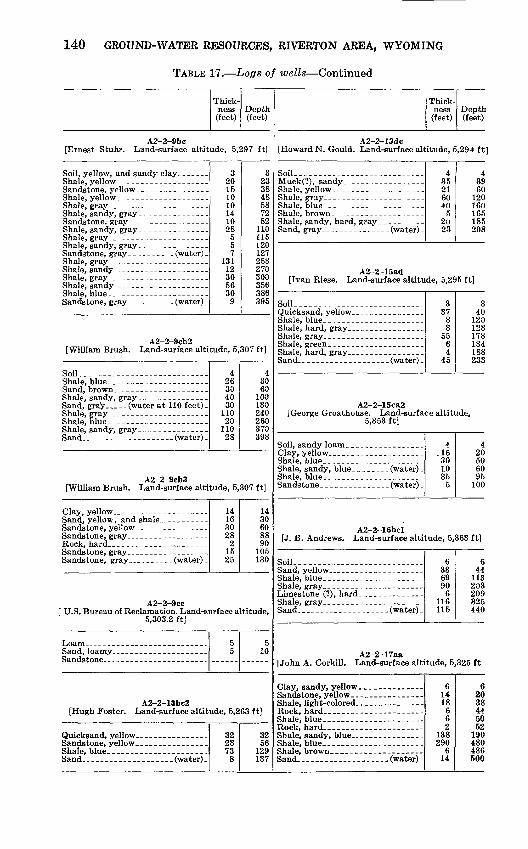
140 GROUND-WATER RESOURCES, RIVERTON AREA, WYOMING
TABLE 17. Logs of wells Continued
Thick ness (feet)
Depth (feet)
A2-2-9bc[Ernest Sbuhr. Land-surface altitude, 5,297 ft]
Shale, gray_ . ._ ___ __-_ - - --Shale, sandy, gray _
Shale, sandy. _ __.-... _ - -Shale, blue-.-. _--- - - -_ ---- Sandstone, gray _ _ - . . . (water)
3 20 15 10 10 14 10 28
5 5 7
131 12 30 56 30
9
3 23 38 48 58 72 82
110 115 120 127 258 270 300 356 386 395
A2-2-9cb2[William Brush. Land-surface altitude, 5,307 ft]
SoiL__ _-_-_-------------------.
Shale, sandy, gray - _ _ _
4 26 30 40 30
110 20
110 28
4 30 60
100 130 240 260 370 398
A2-2-9cb3[William Brush. Land-surface altitude, 5,307 ft]
Rock, hard-... .. ._. --_ -Sandstone, gray.- -_- _ - Sandstone, gray.---.---- (water) -
14 16 30 28
2 15 25
14 30 60 88 90
105 130
A2-2-9ccU.S. Bureau of Reclamation. Land-surf ace altitude,
5,303.2 ft]
A2-2-13bc2
5 5
5 10
[Hugh Foster. Land-surface altitude, 5,263 ft]
32 2373
8
32 56
129 137
Thick ness
(feet)Depth (feet)
A2-2-13dc[Howard N. Gould. Land-surface altitude, 5,294 ft]
Soil.- ------------ ___ --------- 4 35 21 60 40
5 20 23
4 39 60
120 160 165 185 208
A2-2-15ad[Ivan Riese. Land-surface altitude, 5,295 ft]
Soil-- -------------------------- 337
8 3
55 6 4
45
3 40
120 123 178 184 188 233
A2-2-15ca2[George Groathouse. Land-surface altitude,
5,353 ft]
Soil, sandy loam _._._ _-_-____Clay, yellow.. ___- ,--_. -------
4 -16 30 10 35
5
4 20 50 60 95
100
A2-2-16bcl[J. B. Andrews. Land-surface altitude, 5,363 ft]
Soil___-- ______ ------ __ --- 6 38 69 90
6 116 115
644
113 203 209 325 440
A2-2-17aa[John A. Corkill. Land-surface altitude, 5,325 ft
Shale, blue...-. ____-____-.._ --
6 14 18
6 6 2
138 290
6 14
6 20 38 44 50 52
190 480 486 500
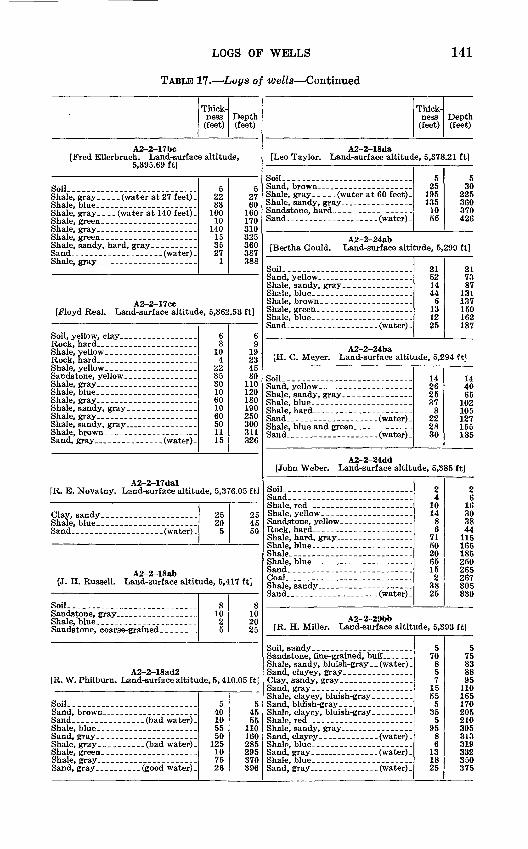
LOGS OF WELLS 141
TABLE 17. Logs of wells Continued
Thick- ness
(feet)Depth (feet)
A2-2-17bc[Fred Ellerbrueh. Land-surface altitude,
5,395.69 ft]
Soil. __ __ __
Shale, gray_ _ _ _ (water at 140 feet) .
Sand. __ ___. ______ ___(water)
5 22 33
100 10
140 15 35 27
1
5 27 60
160 170 310 325 360 387 388
A2-2-17cc[Floyd Real. Land-surface altitude, 5,362.53 ft]
Soil, yellow, clay--.--- _ -._ ___-
Rock, hard____.. ____ _ __-_Shale, yellow __ _-.. ------------Sandstone, yellow ... _ - _..Shale, gray _ . ... ... ____ .. _Shale, blue ______ _ _ ____Shale, gray __ . _________Shale, sandy, gray_ ________ ___.Shale, gray. __ _ __ _____ __ _ _Shale, sandy, gray____ ___ __ __Shale, brown _ _-._ ____ __ _ _
6 3
10 4
22 35 30 10 60 10 60 50 11 15
6 9
19 23 45 80
110 120 180 190 250 300 311 326
A2-2-17dal[R. E. Novatny. Land-surface altitude, 5,376.05 ftJ
25 20
5
2545 50
A2-2-18ab[J. H. Russell. Land-surface altitude, 5,417 ft]
Soil. __ _--. _______ _. __ -.
Sandstone, coarse-grained ____ __
8 10 25
8 10 20 25
A2-2-18ad2[R. W. Philburn. Land-surface altitude, 5, 410.05 ft]
Soil.--- _- - - -- 5 40 10 55 50
125 10 75 26
5 45 55
110 160 285 295 370 396
Thick ness
(feet)Depth (feet)
A2-2-18da[Leo Taylor. Land-surface altitude, 5,378.21 ft]
Soil_-__ ___ Sand, brown. .._ -_-_-_.__ _-__Shale, gray _ _ _ (water at 60 feet)Shale, sandy, gray ._ _.--. ._-_.
Sand-....- __ . ------ .(water).
5 25
195 135
10 56
5 30
225 360 370 426
A2-2-24ab[Bertha Gould. Land-surface altitude, 5,299 ft]
Soil- __ __ .__- __. __- ___Sand, yellow ... .-_ ___-. _._ .
Shale blue_---_--------------- -Sand-----_--------_. _ .(water).
21 52 14 44
6 13 12 25
21 73 87
131 137 150 162 187
A2-2-24ba[H. C. Meyer. Land-surface altitude, 5,294 ft]
Soil_-_-_ - --_ 14 26 25 37
3 22 28 30
14 40 65
102 105 127 155 185
A2-2-24dd[John Weber. Land-surface altitude, 5,385 ft]
Soil __ .--- ______ _-._ ___ -Sand_--_. -. __ .-Shale, red---_--_--_- __.-. ___. Shale, yellow. _ - _ __---__--____Sandstone, yellow _ -__- --__ .
Shale---...---. -------------
2 4
10 14
8 6
71 50 20 65 15 2
38 25
2 6
16 30 38 44
115 165 185 250 265 267 305 330
A2-2-29bb[R. H. Miller. Land-surface altitude, 5,393 ft]
Sandstone, fine-grained, bufF_,__-_- Shale, sandy, bluish-gray __ (water) -
Sand, gray, . _ _ _ --------
5 70
8 5 7
15 55 5
35 5
95 8 6
13 18 25
5 75 83 88 95
110 165 170 205 210 305 313 319 332 350 375
142 GROUND-WATER RESOURCES, RIVERTON AREA, WYOMING
TABLE 17. Logs of wells Continued
Thick ness
(feet)Depth(feet)
A2-3-3aa2[W. C. Womack. Land-surface altitude, 5,285 it
Soil, yellow clay. _ . . . . .Shale and clay, yellow- __-.. ...Shale, brown __ _ .. . _ _. ..Sandstone, blue-gray T _ . .
6 25 12 18
63143 61
A2-3-3bbU.S. Bureau of Reclamation. Land-surface altitude
5,285 ft]
[?]..__....-...-...-.-._.--_..-_
a ---_-_ .. .. - _
Sandstone, gray _ ._ . _ _ _ _ _
3.5 .5
3.5 4.5
8 9
3.54
7.5 12 20 29
A2-3-5da[Robert Heumeyer. Land-surface altitude, 5,270 ft;
Topsoil _ ----- -- -_--. -------Shale, yellow - ----- - _ . - - -Shale, gray. _ . . _ . ___________ - _ _
Shale, blue _ _ _ _ _ _ _ _ _ _ _ _Shale, gray, ----- - . _ _ _ _ _ _ _ . _ _Sand, gray _ . _ _ _ _ _ _ _ (water)
320 58
5 64 46
4
3 2381 86
150 196 200
A2-3-8bc[Stanley Huffman. Land-surface altitude, 5,290 ft]
Sandstone, yellow - _ _ _ _ _ _ _ _ _Shale, gray. ----- _ _ _ _ _ _ . Sandstone - - _ ------- -(water) -Shale, sandy, gray.. ___ _ __ __ .Sandstone, red and graySand..-,-. . .- ._ .(water)Shale, gray- _ _ _ ----- _ _ _ _. _ _ _ _
21 5
52 15
5 25 20 20
5
2 3 8
60 75 80
105 125 145 150
A2-3-9da[L. G. Edge. Land-surface altitude, 5,338 ft]
Soil... --_--_--_------__--_.___-Shale, blue _ _ _ _ .. _ _ _ _ _ _______
Shale, blue_-_ - _. _.Shale, sandy. _ . ._ ..-. __ _-..Shale, blue .... _ ... ______
Shale, sandy. _ ... ..__.__. ____Shale, gray_.._ . ._ ._ ______
20 20 20 50 10 40 15 49 26
20 40 60
110 120 160 175 224 250
A2-3-10bc[Jack Cole. Land-surface altitude, 5,331 ft]
Topsoil, sandy clay..--- _.. . __ _
Shale, blue.. _ _________________
34
10 27 10
6 5
18 2
37
17 44 54 60 65 83 85
Thick ness (feet)
Depth (feet)
A2-3-19ba[H. J. Peterson. Land-surface altitude, 5,325 ft]
Shale, blue ...- _ _ _ .. -._-_-.Shale, green. _ __ _ _ ________Shale, brown ... .... ._..-Lime shell (?)_. _ _ ------------Sand- -_ -_ __--_- (hard water) -Lime shell (?). _ - _.--._ ___Sand- -_--_ _--- (good water) _
7 3 8
14 40 21 98 21 28
6 7 2
31 2
31
7 10 18 32 72 93
191 212 240 246 253 255 286 288 319
A2-3-19dd[John Weber. Land-surface altitude, 5,359 ft]
Shale gray.,- . __.__ _-._-._ _Shale blue__ - ___ . -_-_-_ ._
9 20 20 15 46 30 25 15 22 26
9 29 49 64
110 140 165 180 202 228
A2-3-20cd[Dale M. Ibach. Land-surface altitude, 5,340 ft]
1 5
87 17 68 42
1 6
93 110 178 220
A2-3-21cd[A. J. Gardner. Land-surface altitude, 5,310 ft]
4 13 46 12
5 25
4 17 63 75 80
105
A2-3-21ddWalter H. White. Land-surface altitude, 5,307 ft]
3 5 8
16 24 11 10
38
16 32 56 67 77
LOGS OP WELLS
TABLE 17. Logs of wells Continued
143
Thick ness
(feet)Depth (feet)
A2-3-22bb[U.S. Bureau of Reclamation. Land-surface altitude,
5,320 ft]
[?]_-. ___
Shale, red--.---------...--- _ .-Shale, blue------------ _ -------
1 4 7 7 8 3
1 5
12 19 27 30
A2-3-26dc[Leonard Withington. Land-surface altitude,
5,369 ft]
3 19 13 20 25
3 22 3555 80
A2-3-28da2[Harold Holmes. Land-surface altitude, 5,365 ft]
Sandstone, yellow -----Shale, sandy, gray __ ------Sandstone, gray-.-. _.. -------
Shale, hard, gray -------- -- ----Sand ---------- ._ - (water)Sandstone, soft, gray _ _ _ _ -
Sandstone, fine-grained, grayShale, gray, sandy - _ - - - - -
Shale, blue and gray. -- _ . _ _ . _Shale, stickey, gray -------
Sandstone, gray and blackSandstone, red and white
Shale, green . _ _ _ ---_-_.__
Sandstone, gray__ - - _.__ _ _.Shale, sticky, gray- __ . . .. . . .Sand... - ,_ __ - __ -.(water) _
6 29 20 15 20
5 15 30
6 9 3 4 1
12 13
7 5 8 7
25 5 5
30 10 10
7 5 2 6
10 4 7
14 38 12 30
6 35 55 70 90 95
110 140 146 155 158 162 163 175 188 195 200 208 215 240 245 250 280 290 300 307 312 314 320 330 334 341 355 393 405 435
A2-3-29bb[Andrew Ibach. Land-surface altitude, 5,361 ft]
Sand- . _ ------------ _ ------
3 9
80 23 59 83
312 92
115 174 257
Thick ness (feet)
Depth (feet)
A2-3-29bc[George Hinkle. Land-surface altitude, 5,369 ft]
[?]Shale, sandy, gray _ . . _ _...
Coal.. _.. .. ... ...- .-__ .
Shale, sandy, hard, gray _ _ _Shale, sandy, soft, gray - .. - ...Limestone (?), white _ ---_.-.-._
Sandstone, hard, gray _ ... _.
Shale, hard, gray.. _ .... .....__Shale, soft, gray__. ____.._. . . Shale, gray. .. . .__-_ ...Shale, brown . .. . ________Sand... . ____________ (water).Shale, blue .. .. .. . _._... __
190 45 30 10 4
11 10 10 2
23 5
35 10 43 22
6 9 4
190 235 265 275 279 290 300 310 312 335 340 375 385 428 450 456 465 469
A2-3-29cb2[J. J. Portlock. Land-surface altitude, 5,363 ft]
Soil. -__---.-_._.___......____- 6 14 20 20
5
6 20 40 60 65
A2-3-32ad[A. M. Peterson. Land-surface altitude, 5,349 ft]
4 7 2
10 22
7 24
4 11 13 2345 52 76
A2-3-33bbl[Henry Johnson. Land-surface altitude, 5,345 ft]
Topsoil _ ------- ----- _- _...Sandstone ..- ._. _.--_ - .-
Shale, brown . ______
Rock, hard.. __ _ _ __ _. _ ___
10 4
36 22 16 4
13 136 29
3 12 2
28 5
50 2
128
10 14 50 72 88 92
105 241 270 273 285 287 315 320 370 372 500
144 GROUND-WATER RESOURCES, RIVERTON AREA, WYOMING
TABLE 17. Logs of wells Continued
Thick ness (feet)
Depth (feet)
A2-3-33da[Joe Detimore. Land-surface altitude, 5,349 ft]
[?L..._ _. _ _- 132 69 33
132 201 234
A2-3-34bc[U.S. Bureau of Reclamation. Land-surface altitude
5,348 ft]
Soil, loamy sand. . _ -- .---Sand, loamy _.--. ------ __ . -
Shale, red and blue. .. . - . . .
1 2
.55.5 1
1 3 3.5 9
10
A2-3-34ec2 [Henry Bath. Land-surface altitude, 5,359 ft]
Topsoil-..-- --- ------------Soil, sandy ._... --.._ ._ .Shale, gray __ ------.__.--Sand, white.... -... .(water).
Shale, blue- ... - ----- -----Shale, gray. .- ---------- _. _ _
Sandstone, gray - . -- __--_Rock, brown ___ . --..._ Shale, gray -------- -_._Coal _____ . __ .- -- -.-Shale, blue . . - - -------Shale, gray.... ... . . - -Shale, blue -... - - - - ---
317 28
4 98 30 40 15
7 8
20 15 10 35
3 27 20 22
3 20 48 52
150 180 220 235 242 250 270 285 295 330 333 360 380 402
A2-3-34cc3[Henry Bath. Land-surface altitude, 5,358 ft]
TopsoiL---------- ...Sand, brown __ -.. -__-------.Mud, sandy, red. --- -----------
Shale, blue .. . . . .CoaL _ __ . _____ - ___ .--Sand - . .-- .- _ ( water) .Rock, brown __ -_..-_Shale, blue ...... _ .... _.. -Rock, gray __-. . .--.Shale, blue ... .. _... ... ...Sandstone _ - - - - ._Sand .---= . .-- -.-(water).
2 6
20 32 40
5 23 10 27
6 24 15 12
2
2 8
28 60
100 105 128 138 165 171 195 210 222 224
A2-3-34cd[Paul and Andy Peterson. Land-surface altitude
5,359 ft]
Topsoil-- .- . . --._ __-Shale .... . .-.. -Mud, redShale, blue . ....
Shale, blue......................
4 6
18 60 17 25 65 23
4 10 28 88
105 130 195 218
Thick ness (feet)
Depth(feet)
A2-4-lcb[Gerhard Medow. Land-surface altitude, 5,019 ft]
Sandstone, hard, gray and yellow. _ .
Sandstone, hard, gray ........
20 25 15
3 2
10 10 15 12 2 4 2
10 12 23
20 45 60 63 65 75 85
100 112 114 118
120 130 142 165
A2-4-ldc[V. B. Plummer. Land-surface altitude, 5,023 ft]
6 10 24
4 24 16
6 16 40 44 68 84
A2-4-2ad[H. M. Currah. Land-surface altitude, 5,011 ft]
Shale, blue _ _ . _ _ . .
5 31
1 13
8 29
8 7 3
18 3
16 34 19
5 15
5 40 20 25 15 15 15 15 15 22 11
7
5 36 37 50 58 87 95
102 105 123 126 142 176 195 200 215 220 260 280 305 320 335 350 365 380 402 413 420
A2-4-2dc[Floyd W. Uglow. Land-surface altitude, 5,075 ft]
4 35 34
3 59 23
4 39 73 76
135 158
LOGS OF WELLS
TABLE 17. Logs of wells Continued
145
Thick ness
(feet)Depth (feet)
* A2-4-3bb [Ray Hursh. Land-surface altitude, 5,135 ft]
Shale, sandy, gray (hard shells)
Shale, gray_ . _ _ .._...
Shale, brown and blue _ _ _ . _Sandstone. _ _ __. ____ __Sand _. _ .. ... _ (water)
317 32 18 20 60 33 42 50 25 27
5 15 23 20 67 13 10 17 43
5 15
3 20 52 70 90
150 183 225 275 300 327 332 347 370 390 457 470 480 497 540 545 560
A2-4-3cc[Larry Barrett. Land-surface altitude, 5,179 ft]
Shale, green .... . . . . ..-.-_-
Shale, brown, blue, and green. .
7 13
5 6 6
54 7
97 21 14 17
3 10 27 21
6 96 4
16 30 40 10 20
7 20 25 31 37 91 98
195 216 230 247 250 260 287 308 314 410 414 430 460 500 510 530
A2-4-4aa [U.S. Bureau of Reclamation. Land-surface altitude,
5,113.5 ft]
8 6 64
8 14 20 24
Thick ness
(feet)Depth (feet)
A2-4-4dd[I. W. Douglas. Land-surface altitude, 5,185 ft]
Coal _-_. --.---_..----..--
Shale, hard, gray .-._--. _ _ . _ _Sand ... - .. _____ -_ _ ...
9 31 23
3 5
18 61 16 74
8 12 34
9 40 63 66 71 89
150 166 240 248 260 294
A2-4-9aal[Milo Runyan. Land-surface altitude, 5,183 ft]
Topsoil __.. ___ _. ___
Shale, yellow .__ .. . . . .
Sand_ __---___-_ _________ (dry)
. 3 3
24 22
4 10
186 26 52
6 4
38 100
3 6
30 52 56 66
252 278 330 336 340 378 478
A2-4-9aa2[Milo Runyan. Land-surface altitude, 5,183 ft]
4 20
6 15
5 6 6
18 72 40 12 48 18 28
4 24 30 45 50 56 62 80
152 192 204 252 270 298
A2-4-9aa3[T. W. Walthers. Land-surface altitude, 5,190 ft]
QVialo HflrV
Shale, blue ... . . . _ .____
Shale, sandy, hard, gray.
4 26 15 20
5 20 55 15 85 12
5 37
4 30 45 65 70 90
145 160 245 257 262 299
146 GROUND-WATER RESOURCES, RIVERTON AREA, WYOMING
TABLE 17. Logs of wells -Continued
Thick ness (feet)
Depth(feet)
A2-4-9cc [J. R. Longfellow. Land-surface altitude, 5,279 ft]
Shale, sandy, brown_ __ ______ _
Sandstone, coarse-grained, gray (water) .
Shale, sandy, hard, gray _ _ _ _ _ _
Sandstone, gray _ __ _ ________Shale, sandy, hard, gray _ _ _ __
Sandstone, coarse-grained, gray_-_-
10 25
2 8 5 1
25 44 26
6 5 3
20 40
35 43
2 18 22 14 26 35 32 18
10 35 37 45 50 51 76
120 146 152 157 160 180 220
255 298 300 318 340 354 380 415 447 465
A2-4-10bb[Fred Devish. Land-surface altitude, 5,179 ft]
Coal _____ _ _____ ___
Shale, sandy, gray_ __ __ __
34
20 17 3
46 3
24 15 37 23 52
5 5
21 4
16 2
3 7
27 44 47 93 96
120 135 172 197 242 255 257 278 282 298 300
A2-4-10bd[Roy Haggerty. Land-surface altitude, 5,185 ft]
Soil. __ _-__--.---______________Sandstone, yellow _____ _
Shale, blue . _____ _ _______
Sand. _----. _ ___ __._(water)
8 32 10
9 11 12 94 54 56 40
8 40 50 59 70 82
176 230 286 326
Thick ness (feet)
Depth(feet)
A2-4-10dc[Leonard Templin. Land-surface altitude, 5,171 ft]
5 30 20
5 15 16
5 7 7 8
12 65 40 23 17 12 43 20
5 35 55 60 75 91 96
103 110 118 130 195 235 258 275 287 330 350
A2-4-llda[Arthur McCoy. Land-surface altitude, 5,073 ft]
Shale, gray... __ -__---_ _Shale, sandy, gray _ _ _ _ _ Sand___- .__ .- _,_ _ (dry).Sandstone. _ _ _ __. _____Sand ---_ ---__--_-_-(water)-Shale, sandy, gray _ ___- _ __ _
8 12
7 52 42
8 6
25 25
5 15 13
8 20 27 79
121 129 135 160 185 190 205 218
A2-4-12bc[Oliver Lund. Land-surface altitude, 5,060 ft]
Sandstone, yellow (water at 25 feet) _
Shale, sandy, hard, gray . ._---._Shale, sandy, soft, gray _._ -.-_-._Shale, gray_ ._ ___-_--------_Shale, sandy, gray _____ -____
5
51 44 16 10 12 28
6 18
5
56 100 116 126 138 166 172 190
A2-4-12cb[E. T. Steenbock. Land-surface altitude, 5,073 ft]
7 21 28 65 14 25 28
7 28 56
121 135 160 188
LOGS OF WELLS 147
TABLE 17. Logs of wells Continued
Thick ness
(feet)Depth (feet)
A2-4-13bbl[John P. Sanders. Land-surface altitude, 5,121 ft]
Sandstone, gray (water at 75 feet) .
Sandstone, red, gray, and black____ Shale, gray__ . ______ _ _Sandstone, red, gray, and blaek____
Shale, gray, brown, and blue _ _ _
[?], red
654
60 24
3 8
16 11
8 25 15 25 25 10 35 10 20 15 25 15 20 30
5 35
6 60
120 144 147 155 171 182 190 215 230 255 280 290 325 335 355 370 395 410 430 460 465 500
A2-4-13bb2[J. P. Sanders. Land-surface altitude, 5,101 ft]
Shale, sandy, hard, gray
Sandstone, hard, gray _ _ ___ Sandstone, gray __ __ __ ____ .
Sandstone, gray _ _ ___ _ _ _
50 15 20 45
5 5
25 17
8 22 14
4
50 65 85
130 135 140 165 182 190 212 226 230
A2-4-14ba[U.S. Bureau of Reclamation. Land-surface altitude
5,118.5 ft]
2 15 16
2 17 33
A2-4-14bb[Oswald Anderson. Land-surface altitude, 5,175 ft]
Soil, sandy __ _____ _ _ __ _Sands tone, yellow _____Shale, eoal.__ __ __ _ __ _ __Shale, sandy, gray _Sandstone, yellow _ _ _
Sandstone, soft, yellow _Roek, hard. _____ _ ____ ___ _Sandstone, yellow...-- ---_. _____
5 36
5 9 5 1 5 1
28
5 41 46 55 60 61 66 67 95
Thick ness
(feet)Depth (feet)
A2-4-14bb Continued
134 17
1 5 2
64 1
27 28 23 22
3 10
2
96 130 147 148 153 155 219 220 247 275 298 320 323 333 335
A2-4-15ab[Charles Wheeler. Land-surface altitude, 5,176 ft]
Loam, sandy _ __._ __--_-____Sandstone, yellow
(water at 35 feet) . Shale and coal _ _________Shale, soft, blue__- _. __ ______
Sand___ ___ __ _ ___ (water)
6
40 5 5 7
12 15 43
4 13 25
6
46 51 56 63 75 90
133 137 150 175
A2-4-15ac[Floyd Verley. Land-surface altitude, 5,195 ft]
Soil, sandy _ ____ __ _ _______ Clay, yellow ______ --__._Shale and coal. .__ _ ___._ Clay, yellow. _- ___. __. . _.__
Sandstone, coarse-grained, gray____
7 13 10 10 70 15 35 30 53 17 45 25
7 20 30 40
110 125 160 190 243 260 305 330
A2-4-15bb[Victor C. Hughes. Land-surface altitude, 5,230 ft]
2 33 55 25 10 30 25
120 25 15
5 30 20
2 35 90
115 125 155 180 300 325 340 345 375 395
148 GROUND-WATER RESOURCES, RIVERTON AREA, WYOMING
TABLE 17. Logs of wells Continued
Thick ness
(feet)Depth (feet)
A2-4-16ab[John L. Sinner. Land-surface altitude, 5,233 ft]
TopsoiL-. __ . - __ ....
Shale, hard, gray.. __._.. ._ . ___Shale, blue. ___________ . .. .._Sandstone _ _ _ _----.-. (water) -
9 7
30 40 44
4 23
1 17 45 55 29 76
6 17
9 16 46 86
130 134 157 158 175 220 275 304 380 386 403
A2-4-16bb[W. C. York. Land-surface altitude. 5,279 ft]
[?] - -_----___-_ --
Shale, blue _ . . _ _ _ _ ..._ ....Coal ___ -.. -----_-. _____ .
Sandstone, gray _ _____ .... _.Shale, black, ____ __ __ _ _ _
Sandstone, brown _ _ __ __
Shale, gray__-----_-_____ .... .Sandstone, brown _____ __ __
Sandstone, coarse-grained, hard.___
50 22 28 30 25
8 4
13 5
18 5
28 4
20 3 9
38 10 45
7 28 48
9 8 8
50 72
100 130 155 163 167 180 185 203 208 236 240 260 263 272 310 320 365
372 400 448 457 465 473
A2-4-17aa[E. C. Brines. Land-surface altitude, 5,296 ft]
Shale, sandy, gray. ___ _ __ .Sandstone, gray ___ _ ________Shale, light-brown. ____ ___
Shale, sandy, blue. _. .. _ _ __
Sand, coarse. __ ... _ ___ (water)
8 12 4
14 7 3 9
20 17
6 40 18
6 11 7
10 16 52
3 18
3
8 20 24 38 45 48 54 63 83
100 140 158 164 175 182 192 208 260 263 281 284
Thick ness
(feet)Depth (feet)
A2-4-17ba[Oscar Evans. Land-surface altitude, 5,353 ft]
3 9
28 70 15 70 25 15 15 19
3
3 12 40
110 125 195 220 235 250 269 272
A2-4-17da[U.S. Bureau of Reclamation. Land-surface altitude,
5,262 ft]
Sand, fine------------- ___ .__Sand, loamy. _ .-__ ___ _ ___
6 4.5 1
6 10.5 11.5
A2-4-17ddl[H. E. Clapp. Land-surface altitude, 5,243 ft]
4 27 24 12 18 28
5 8 9
35 25 20 10
4 31 55 65 87
113 118 126 135 170 195 215 225
A2-4-18cd2 [U.S. Bureau of Reclamation. Land-surface altitude,
5,301 ft]
4 5 1
4 9
10
A2-4-18dcl[C. C. Williams. Land-surface altitude, 5,301 ft]
Soil and gravel ___.. .---_. _ _Shale.... __ - __ ---. _ - ___ -Sand _._ . -_. _ -__ __ ___
28 56 14
28 84 98
A2-4-19cd[U.S. Bureau of Reclamation. Land-surface altitude,
5,291.5 ft]
3 3 3
3 6 9
LOGS OP WELLS 149
TABLE 17. Logs of wells Continued
Thick-ness (feet)
Depth(feet)
A2-4-19dd[G. Eiseman. Land-surface altitude, 5,294 ft]
Shale, sandy, gray __ __ ______Shale, blue.. -- ._. _ _ - -
Sandstone, gray _ - ----- _____ Shale, sandy, gray. - ------ Coal -. ... -._-- ._ __- -----Shale, sandy, gray ____-- . . Sandstone, gray. _ _ _ __---. -- -- Sandstone, white- _ - - - - - (water) Shale, sandy _ _- ___. -___- --
Sand-. ----- - . --- -- (water) -
35 21 12 17 40 15 10 25 20
5 20 40 40 11 21 23
35 56 68 85
125 140 150 175 195 200 220 260 300 311 332 355
A2-4-21ac[K. R. Loghry. Land-surface altitude, 5,215 ft]
Sandstone, yellow _ _ _ _ _ _ _6
716
77
A2-4-21ad[James Knight. Land-surface altitude, 5,229 ft]
Loam, sandy__ .- _- _._. --- -
Shale, gray.- ---. _ --- (water) - Sandstone, yellow ---- -__.--. . .Rock, hard, gray... --- - .__---_Shale, sandy, gray _ _ _ - _ _ _ _ _ Coal __ -- _ -.- -_-- ---. - - Shale, gray. --- _ _ _ _ - -----Sandstone, gray _- .-.- - - __ - Shale, green ----- .. -.-. - _- Shale, gray.---.-- -- -- - _..-- Sandstone, coarse-grained, gray.__- Sand -- __-- - -(water)-Shale, hard, gray ... _ _. ___
A2-4-21ca2[J. D. Verley]
Soil, sandy_ . .-.. . ._ - _-
Sandstone, gray, hard- _. .-_-----
Sandstone, coarse-grained, gray_-_-
2 26
3 25
2 22
6 4
10 10
8 36 21 78
10 20
5 35 20 18 10
5 5
59 3
25 25 12 48 25 15 20
2 18 10 22 11 67 28
1
2 28 31 56 58 80 86 90
100 110 118 154 175 253
10 30 39 70 90
108 118 123 128 187 190 215 240 252 300 325 340 360 362 380 390 412 423 490 518 519
Thick ness (feet)
Depth (feet)
A2-4-21ca2 Continued
Shale, brown _ _ _ __ .... _Shale, sandy, gray -.-.._ _ _
16 5
10
535 540 550
A2-4-21ca3[J. D. Verley. Land-surface altitude, 5,249 ft]
Shale, friable, gray -.... ... Sandstone, soft __ __ .___-
Sandstone, gray __ -_._-_. _____ Shale, green_ _ . _ ____ - Rock, hard ... ... _. _._Sandstone, hard, yellow. __________Shale, sandy, gray _ ____- _.- Sandstone, yellow.. - -_- ___ --
3 2 5 5
12 3
15 15 10 20
3 5
10 15 27 30 45 60 70 90
A2-4-30ca2 [J. S. Draper. Land-surface altitude, 5,354 ft]
Shale, gray.- _ _.--__-. ___. ..
Shale, gray... ___ ._.__ ____ Shale, green __ _ _ _ _ _ _ _ - _ _Shale, gray. _ _ _ .__. . ... Shale, gray. .. -.. --__- -_ .. _
Shale, soft, blue __ ___ ._._ Sandstone, red... -----_.__-_-- _ Shale, sandy, gray ___.. --_..
Shale, blue ____ - --- ----- Coal. . ------ -_ --------- -.- Shale, green ___-.- __-. -__--
12 18
6 24 20 22
6 6
76 20 16 15 13 54 17 16
5 8
41 35
1230 36 60 80
102 108 114 190 210 226 241 254 308 325 341 346 354 395 430
A2-4-36db2[U.S. Geological Survey. Land-surface altitude,
4,959.8 ft]
Soil and clay. - - - -- ----- 25 25
A2-5-2ab[Joe R. Foster. Land-surface altitude, 4,875 ft]
Shale-------..------.-----. ---
10 15 20 23
2 13
8 44 10 15 18 22 16 29 10 20 25
6
10 25 45 68 70 83 91
133 145 160 178 200 216 245 255 275 300 306
150 GROUND-WATER RESOURCES, RIVERTON AREA, WYOMING
TABLE 17. Logs of wells Continued
Thick ness
(feet)Depth(feet)
A2-5-3abl[Ernest Pintgetzer. Land-surface altitude, 4,871 ft]
Shale, sandy, gray (bad water at 75 feet) _
Shale, brown. _ _______________ __
7 21
2
100 10
3 27 10
5 13
7 28 30
130 140 143 170 180 185 198
A2-5-3ab2[Ernest Pintgetzer. Land-surface altitude, 4,873 ft]
Shale, sandy, gray, with hard shells
1 4 7
53 15 40 45 31 38 35
1 5
12 65 80
120 165 196 234 269
A2-5-3bb[C. H. Hayen. Land-surface altitude, 4,879 ft]
Rock, hard.- -_ __ ___ ___
Sand, fine (water under artesian head) .
Shale, sandy, gray. _. ._._.. .__.Sandstone, gray.. ___._..._ .... .
Shale, red, blue, yellow, and brown- Shale, blue. _ -_ -- -_ --_
7 8
24 3
23 7
13
15 14 18 38
5 20 15 8
30
7 15 39 42 65 72 85
100 114 132 170 175 195 210 218 248
A2-5-4aa[E. S. Peltzer. Land-surface altitude, 4,888 ft]
Soil.. __--__- _-- ___. 12 15 33 48 27 33 22 30 40
2
12 27 60
108 135 168 190 220 260 262
Thick ness
(feet)Depth(feet)
A2-5-4bb2[C. B. Brown. Land-surface altitude, 4,916 ft]
Sand, gray. ..__. _.. . . _ . (water)
10 10 10
5 45 10
5 30 20 10 50 10
10 20 30 35 80 90 95
125 145 155 205 215
A2-5-5aa2[R. C. Neal. Land-surface altitude, 4,929 ft]
Soil, sandy . _ __ _ -_ -__._Sandstone, hard, gray
(water at 27 feet) .
Shale, hard, sandy, gray. ___ __ Shale, brown _ ----------------
13
27 40 10 18 8 7
19 38
5 10 36 19 2 3 5
15 2
13
40 80 90
108 116 123 142 180 185 195 231 250 252 255 260 275 277
A2-5-5aa3[U.S. Bureau of Reclamation. Land-surface altitude
4,916 ft]
Shale.- ----------------------
10 2 2 2
14 4
10 12 14 16 30 34
A2-5-5dd[Harry Waugh. Land-surface altitude, 4,989 ft]
Soil_-_. ------------------------ 320 20 39 10
3 23 4382 92
A2-5-6bd[Leo Cunningham. Land-surface altitude, 5,001 ft]
7 28 50
5 20 15 15
7 85 85 90
110 125 140
LOGS OP WELLS 151
TABLE 17. Logs of wells Continued
Thick ness
(feet)Depth(feet)
A2-5-7bb[C. M. Corr. Land-surface altitude, 5,012 ft]
SoilQuicksand ___ __ ... ..__ ...
Shale, blue..... .. . . ._ - _Shale, sandy _-- _. -(water)
4 12 24 58
7
4 16 40 98
105
A2-5-7bd[John Kobayashi. Land-surface altitude, 5,024 ft]
Soil, sandy..-.--.. .-. _--. -.-Sandstone, gray. - __--- _-Crevice- -- -- -- _ . (water).Sandstone, light-gray. .. .- _-Shale, green and gray. _ .._- . _ .Sandstone, hard, gray ...Sandstone, red and whiteShale, soft, gray _ _ _ _ _ _ . _Shale, hard, gray - - _._ ..._.Sandstone, red and white _ ._Sand, coarse. . . __ - - (water) .Shale, blue . . _-_. -------Sandstone, gray. ... .. .__.--Shale, blue __.. .. -------Shale, gray.-.. _ ... _. . ..
619
1 24 25
1 26 19
3 31 10
8 8 2 5
625 26 50 75 76
102 121 124 155 165 173 181 183 188
A2-5-8bb[Roy J. Eells. Land-surface altitude, 5,007 ft]
Shale, sandy. _ ._. _..-_ ...Shale, sandy, gray. _ ______ .. _
Sandstone, yellow. _ _ _Shale, sandy, gray _ _ _
27
11 16 59 15
2 9
20 36 95
110
A2-5-10ac[Y. W. Causey. Land-surface altitude, 4,999 ft]
Shale, blue..-.----..-- - ------
Sandstone, red and gray ____..__.Shale, blue _ __ _ _ _ . __
Shale, blue __ - _ __ _ ... ...
Shale, blue... __ _ _ . _ ...
327
5 7
15 13
3 6 5 1 2
23 22 13
5 8
10 2 7 5
11 2
19 3 8 3
22 4
330 35 42 57 70 73 79 84 85 87
110 132 145 150 158 168 170 177 182 193 195 214 217 225 228 250 254
Thick-ness
(feet)Depth (feet)
A2-5-10ac Continued
Shale, sandy, blue _ _ - ...Shale, blue and brown _ . _ _..._ Shale, blue ___ ..._.. ._._ _.Sandstone, gray. - . . __..__ . .
2 12 68
7 3
11 3
256 268 336 343 346 357 360
A2-5-10bb[Irl Pintgetzer. Land-surface altitude, 4.SS9 ft]
7 17 22 50 13
6 10 51 29 35 20 18
2 12
2
7 24 46 96
109 115 125 176 205 240 260 278 280 292 294
A2-5-llbbl[Lincoln Todd. Land-surface altitude, 4,964 ft]
Soil. ----- __ ------- _ --- _ -
Shale, s«ndy, gray . _ _
Shale, sticky, brown -- - _ _ _ _ _Shale, sticky, gray. -.-_ _-.- - Shale, brown ___. . .__ _Shale, sticky, blue.. .. - -- Shale, sticky, brown _____ ._ .__-Shale, sticky, blue _ ... ____ ..Shale, brown _. ... .. ..__ - _Sandstone, brown _ . _..- _ _ .Sandstone, gray. - - - - _ . .Sandstone- - - .. _- ( water) -Shale, sandy, blue _ -. ..-. -
8 42 43 52
7 24
4 10
5 16
5 14 25
3 3
14 5
20 23
8 14
2
8 50 93
145 152 176 180 190 195 211 216 230 255 258 261 275 280 300 323 331 345 347
A2-5-12bb[Geo. English. Land-surface altitude, 4,983 ft]
[?] ...
Sand, brown, and sandy shale. ._.-
Shale, brown and gray, bentonite.-
10 20 10 10 40 10 30 10 10 40 10 80 20
10 30 40 50 90
100 130 140 150 190 200 280 300
152 GROUND-WATER RESOURCES, RIVERTON AREA, WYOMING
TABLE 17. Logs of wells 'Continued
Thick ness (feet)
Depth (feet)
A2-5-20dcl[Paul Madlock. Land-surface altitude, 4,986.17 ft]
Sandstone, yellow (water at 30 feet) .
6 9
15
10 25 10
6 15 30
4065 75
A2-5-27ca[N. R. Shelly. Land-surface altitude, 4,829.97 ft]
Shale, brown - - -.-- --- -
25 12 26
117
25 37 63
180
A2-5-28ca [U.S. Geological Survey. Land-surface altitude,
4,861.1 ft]
Soil, sandy _ _ . -- . - ------ _ 17.7 17.7
Thick ness (feet)
Depth (feet)
A2-5-30cd2 [Lowell Lund. Land-surface altitude, 4,962.55 ft]
Soil, sandy .. ------- ---------Gravel ._ ----- ------ ___Sandstone, yellow. ___-_--_____ -
Shale, brown and blue .. --.. -Shale, sandy, light-brown - ...Sand.-__---_ . ------- -(water)
4 15 22 34 12 53 25 12
4 19 4175 87
140 165 177
A2-6-6da[L. O. Allread. Land-surface altitude, 4,829 ft]
Gravel. . -------- -----Sandstone, yellow -----
35 28 21 30 16 2
11 15 16 14
2
35 63 84
114 130 132 143 158 174 138 190
A2-5-28cb2[Harry Littlefield. Land-surface altitude,
4,882.78 ft]A2-6-6dd
[A. R. Morse. Land-surface altitude, 4,839 ft]
Soil __ ----------------------- 8 54 78 30
8 62
140 170
A2-5-29dd[Harry Littlefield. Land-surface altitude,
4,871.50 ft]
Soil __ ---------- -.---.-._- 5 5
38
5 10 48
A2-5-30ad[Leo Kehm. Land-surface altitude, 5,005.64 ft]
Soil, sandy _ - _ _Sandstone, yellow ... -____Shale, gray. - . . _ ._ _...Sandstone, yellow.. . -. _ _._Shale, gray. .' -_________._.. .Sandstone, gray .___Shale, gray -_..._Sandstone, gray . _ _Sand _._._ .---. . _ (water).Sandstone, gray _ _ .._ ___.Sand ---. . _ ._ _ (water) .
4 16 7
21 30 12 15 17
8 19 21
4 20 27 48 78 90
105 122 130 149 170
Sandstone, yellow. ._..- --.-.-..
Shale, brown. ._.---_ - --------
Sandstone, hard_____----___.._._
Shale, gray..---...-..-. .... ...Sand -_. ..--.....(sulfur water)
10 20 13 12 30 21 32
6 20 26 14 33
8 10
1 18
8 8 4
26 4
56 22
3 47 10 4 4
10 31
1 11 25
7 12
3
10 30 43 55 85
106 138 144 164 190 204 237 245 255 256 274 282 290 294 320 324 380 402 405 452 462 466 470 480 511 512 523 548 555 567 570
LOGS OP WELLS 153
TABUS 17. Logs of wells Continued
Thick ness (feet)
Depth (feet)
A2-6-7cd[Sam Schrinar. Land-surface altitude, 4,864 ft]
Sand. _- - --. .. ___ __ -.-
32 35 28 13 17
3
32 67 95
108 125 182
A2-6-7db[Howard Edwards. Land-surface altitude, 4,809 ft]
12 18
5 1012
7 6
12 30 3545 57 64 70
A2-6-18ad [M. Marlowe. Land-surface altitude, 4,808 ft]
Sandstone, yellow _. ------------
Shale and coal. -._ (sulfur water) _
Shale, brown and blue. -----------
20 14 9
11 4 1
66 25 26 17 17 25 25 20 13 27 35
6 24 20
20 34 43 54 58 59
125 150 176 193 210 235 260 280 293 320 355 361 385 405
A2-6-18ba[B. G. Gillette. Land-surface altitude, 4,854 ft]
Sand.. .(water).Shale, gray
4 21 25 10 22 21
2
4 25 50 60 82
103 305
A2-6-18ca [Mel Devish. Land-surface altitude, 4,843 ft]
Soil.. ... _ . ___ . _ ......... 15 45 15 28
15 60 75
103
Thick ness
(feet)Depth(feet)
A2-6-18cd[E. H. Marlatt. Land-surface altitude, 4,835 ft]
Soil. __ --..-...-- --..----
Shale.. ----.-.-.-----.--.-.--
7 83
3 18
7 90 93
111
A2-6-18da[U.S. Geological Survey. Land-surface altitude,
4,814.6 ft]
Soil, sandy... .---------..- --- 5.5 16.3
5.5 21.8
A2-6-19ba[Ira D. Ablard. Land-surface altitude, 4,828 ft]
Shale, sandy, gray __ ... --------
Sand and coal shale, (sulfur water) .
40 23 24
2 16
1 6
12 2
14
40 63 87 89
105 106 112 124 126 140
A2-6-19bd[T. H. Coleman. Land-surface altitude, 4,834 ft]
Sand____--.---. .(sulfur water).
15 30 15 30 10 35 80
5 15 22 20
15 45 60 90
100 135 215 220 235 257 277
A2-6-19cb [E. M. Dixson. Land-surface altitude, 4,833 ft]
Soil, sandy-------- -_ ----------Gravel . --------- ----- - .--
Shale, sandy, light-brown -.-. _
6 32 18 14 18 49 15 36 37 39
1 17
6 38 56 70 88
137 152 188 225 264 265 282
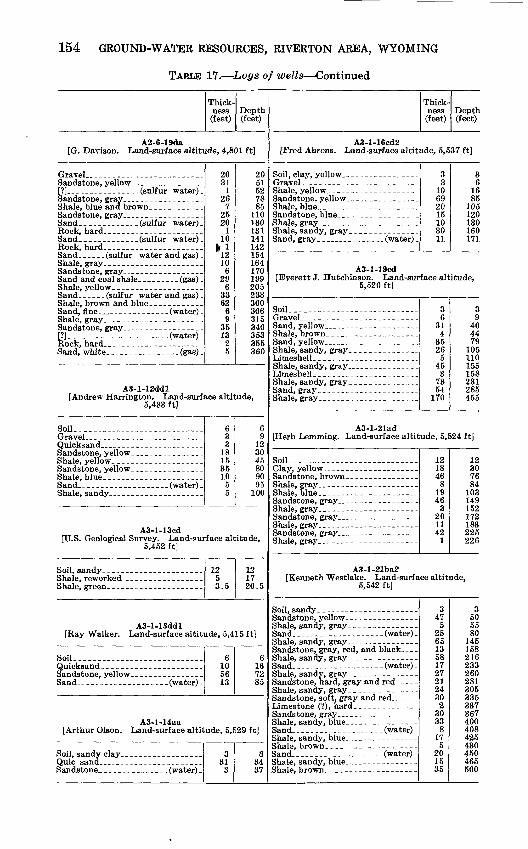
154 GROUND-WATER RESOURCES, RIVERTON AREA, WYOMING
TABLE 17. Logs of wells Continued
Thick ness
(feet)Depth (feet)
A2-6-19da[G. Davison. Land-surface altitude, 4,801 ft]
Rock, hard. _ - ... _... _ ._ ..
[?]-_-.-- __ _--__-----_-(water)-
20 31
1 26
7 25 20
1 10
fcl 12 10
6 29
6 33 62
6 9
35 13
2 5
20 51 52 78 85
110 130 131 141 142 154 164 170 199 205 238 300 306 315 340 353 355 360
A3-l-12ddl[Andrew Harrington. Land-surface altitude,
5,483 ft]
Soil.-...--. ____ . _ ------ ___
Quicksand _ __ -_ . _..-_-.
6 3 3
18 15 35 10
5 5
6 9
12 30 45 80 90 95
100
A3-l-13cd[U.S. Geological Survey. Land-surface altitude,
5,452 ft]
12 5 3.5
12 17 20.5
A3-l-13ddl[Ray Walker. Land-surface altitude, 5,415 ft]
SoiL.. __---------_-_----.--._._ 6 10 56 13
6 1672 85
A3-l-14aa[Arthur Olson. Land-surface altitude, 5,529 ft]
3 31
3
334 37
Thick ness
(feet)Depth (feet)
A3-l-16cd2[Fred Ahrens. Land-surface altitude, 5,537 ft]
Shale, blue. -... - ...
3 3
10 69 20 15 10 30 11
3 6
1685
105 120 130 160 171
A3-l-19cd[Everett J. Hutchinson. Land-surface altitude,
5,520 ft]
Soil__-_ _ __ ... ____ .. ____ -Gravel . . _ . ----- .... .-Sand, yellow. .. -- - .-. .- -.-Shale, brown _.._..-_ _ _Sand, yellow. ..._--.- . . ... -_Shale, sandy, gray _ _ -_ . . _ . _
3 6
31 4
35 26
5 45
3 73 54
170
3 9
40 44 79
105 110 155 158 231 285 455
A3-l-21ad[Herb Lemming. Land-surface altitude, 5,524 ft]
Soil.... ___ . _ ------ ____ --.
Sandstone, gray . _ . _ -----Shale, gray. _ _ _ . ....
12 18 46
8 19 46
3 20 11 42
1
12 30 76 84
103 149 152 172 183 225 226
A3-l-21ba2[Kenneth Westlake. Land-surface altitude,
5,542 ft]
Sand.. _. _ -. _- --.-(water).Shale, sandy, gray. _ _ . . _ _ _ . -Sandstone, gray, red, and black-. .-
Sandstone, hard, gray and redShale, sandy, gray .. . . --_-Sandstone, soft, gray and red _ .
Shale, sandy, blue.-.. ._ ._ .. _
347
5 25 65 13 58 17 27 21 24 30 2
30 33
8 17
5 20 15 35
350 55 80
145 158 216 233 260 281 305 335 337 367 400 408 425 430 450 465 500
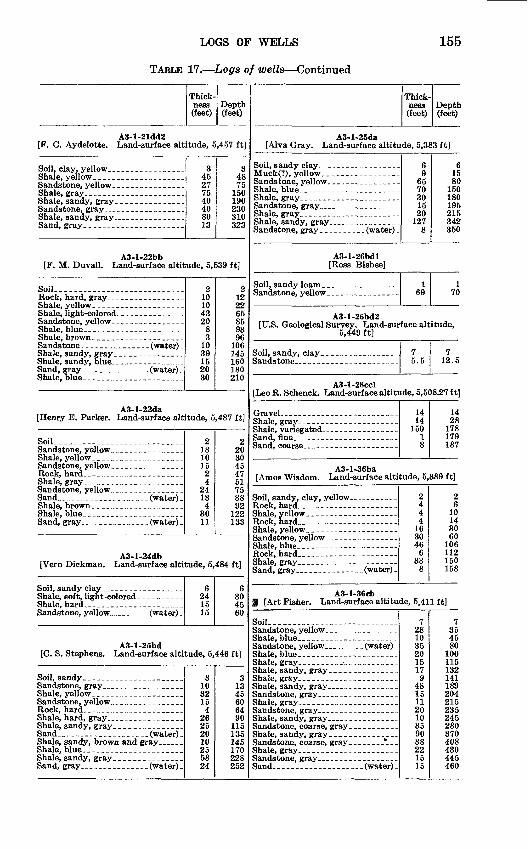
LOGS OP WELLS 155
TABLE 17. Logs of wells Continued
Thick ness (feet)
Depth (feet)
A3-l-21dd2[F. C. Aydelotte. Land-surface altitude, 5,457 ft]
Shale, yellowSandstone, yellow ___ . . - _ . . . . . Shale, gray. _- . . . _.Shale, sandy, gray. - --------Sandstone, gray _ _ _ .. - __ Shale, sandy, gray __ _ - -- - .--
345 27 75 40 40 80 13
3 48 75
150 190 230 310 323
A3-l-22bb[F. M. Duvall. Land-surface altitude, 5,539 ft]
Soil
Sand, gray - -.-_-.- . (water) _Shale, blue
2 10 10 43 20
8 3
10 39 15 20 30
2 12 22 65 85 93 96
106 145 160 180 210
A3-l-22da[Henry E. Parker. Land-surface altitude, 5,487 ft]
Soil-__---_---__ _____________Sandstone, yellow . --------
Shale, gray... . ._ _ ___ ..
218 10 15 2 4
24 13
4 30 11
2 20 30
.45 47 51 75 88 92
122 133
A3-l-24db[Vern Dickman. Land-surface altitude, 5,484 ft]
Shale, hard,. ______Sandstone, yellow . . . . (water) .
6 24 1515
6 3045 60
A3-l-25bd[C. S. Stephens. Land-surface altitude, 5,446 ft]
3 10 32 15
4 26 25 20 10 25 58 24
3 13 45 60 64 90
115 135 145 170 228 252
Thick ness (feet)
Depth (feet)
A3-l-25da[Alva Gray. Land-surface altitude, 5,383 ft]
Soil, sandy clay. _______ -Muck(?), yellow...... - .. ...
Shale, blue - -- - -. - ______ -
Sandstone, gray _ _ _ ._ _ _ _ _ ...
Shale, sandy, gray __ ----- ___ -Sandstone, gray - - - - _ - (water) -
A3-l-26bdl[Boss Bisbee]
Soil, sandy loam - .. ------Sandstone, yellow _ _ _. _ _ _ _ _ _
6 9
65 70 30 15 20
127 8
1 69
6 15 80
150 180 195 215 342 350
1 70
A3-l-26bd2[U.S. Geological Survey. Land-surface altitude,
5,449 ft]
7 5.5
7 12.5
A3-l-28ccl[Leo R. Schenck. Land-surface altitude, 5,508.27 It]
Sand, fine. ---------- ._.
14 14
150 1 8
14 28
178 179 187
A3-l-36ba[Amos Wisdom. Land-surface altitude, 5,389 ft]
Shale, yellow. _ _ ____.-__Sandstone, yellow. _ _ _ _ . . _ _ -- -
Shale, graySand, gray.. ... ..-- .(water)-
24 4 4
16 30 46
6 38
8
2 6
10 14 30 60
106 112 150 158
A3-l-36cb1 [Art Fisher. Land-surface altitude, 5,411 ft]
Soil ___ .---_---.--_..--------.
Shale, gray..---- _.- ___ .. .--
7 28 10 35 20 15 17
9 48 15 11 20 10 35 90 38 22 15 15
7 35 45 80
100 115 132 141 189 204 215 235 245 280 370 408 430 445 460
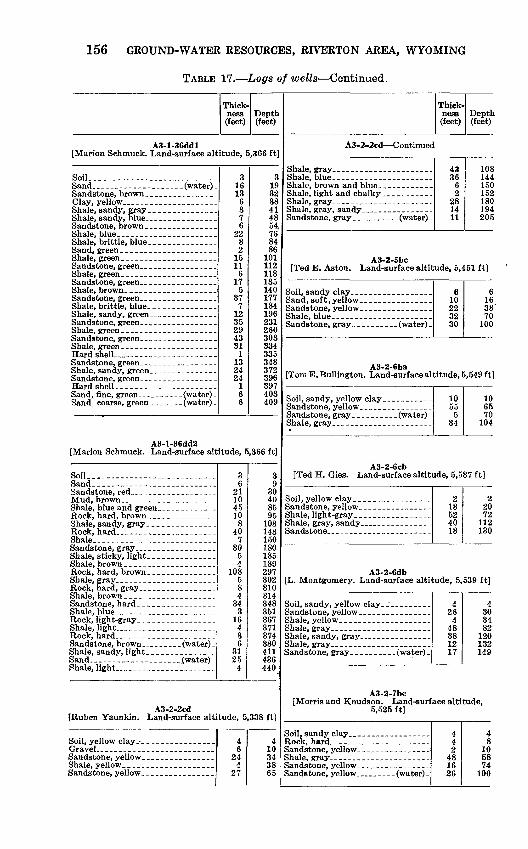
156 GROUND-WATER RESOURCES, RIVERTON AREA, WYOMING
TABLE 17. Logs of wells Continued.
Thick ness (feet)
Depth (feet)
A3-l-36ddl[Marion Schmuck. Land-surface altitude, 5,366 ft]
Soil-...-. - ---_ --
Sandstone, brown.. _____.___-..-.
Shale, green---- -- - - .Sandstone, green. -._ _-_ -_.-_Shale, brown____-_ - _---- Sandstone, green... ....._-__----Shale, brittle, blue. . ....... __ .Shale, sandy, green _ ------------
Hard shell -----------------
Hard shell __ ___ ,._- ____ ...Sand, fine, green ..__-_. (water)Sand coarse, green. ___ _ (water) _
3 16 13
6 3 7 6
22 8 2
15 11
6 17
5 37
7 12 35 29 43 31
1 13 24 24
1 6 6
3 19 32 38 41 48 54, 76 84 86
101 112 118 135 140 177 184 196 231 260 303 334 335 348 372 396 397 403 409
A3-l-36dd2[Marion Schmuck. Land-surface altitude, 5,366 ft]
Soil __ --.---. --.--.------Sand __ __ -- __ _ _ -. __ .
Shale.. ---- -
Rock, hard, gray _______ ____
Sand-------.-. .-- -.---(water)Phale,light .... -.-
3 6
2110 45 10
8 40
7 30
5 4
108 5 8 4
34 3
16 4 3 6
31 25
4
39
30 40 85 95
103 143 150 180 185 189 297 302 310 314 348 351 367 371 374 380 411 436 440
A3-2-2cd[Ruben Yaunkin. Land-surface altitude, 5,338 ft]
Sandstone, yellow _____ ____
4 6
24 4
27
4 10 34 38 65
Thick ness (feet)
Depth (feet)
A3-2-2cd Continued
Shale, blue.------ -------------Shale, brown and blue. -----------Shale, light and chalky. ____--
43 36
62
28 14 11
108 144 150 152 180 194 205
A3-2-5bc[Ted E. Aston. Land-surface altitude, 5,451 ft]
6 10 22 32 30
6 16 38"
70 100
A3-2-6ba[Tom E. Bullington. Land-surface altitude, 5,549 ft]
1055
5 34
10 65 70
104
A3-2-6cb[Ted H. Gies. Land-surface altitude, 5,537 ft]
Soil, yellow clay ___ . .. ...._-- 2 18 52 40 18
2 20 72
112 130
A3-2-6db[L. Montgomery. Land-surface altitude, 5,539 ft]
4 26
4 48 38 12 17
4 30 34 82
120 132 149
A3-2-7bc[Morris and Knudson. Land-surface altitude,
5,525 ft]
4 4 2
48 16 26
4 8
10 58 74
100
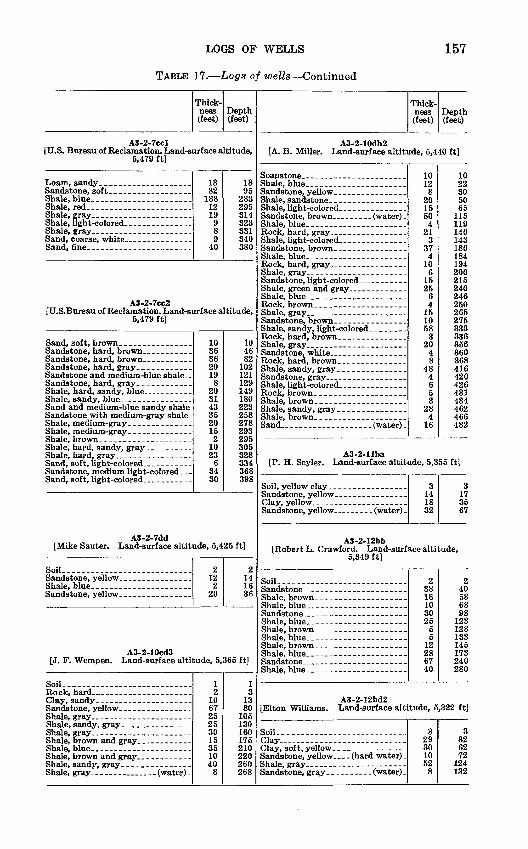
LOGS OP WELLS
TABLE 17. Logs of wells Continued
157
Thick ness (feet)
Depth (feet)
A3-2-7ccl[U.S. Bureau of Reclamation. Land-surface altitude,
5,479 ft]
Loam, sandy.. _ --------.-----._
Shale, blue.. . _ .Shale, red - - . ---.-_---. . _
Shale, light-colored ---------- ....Shale, gray _ _ _ ... .....Sand, coarse, white _ .._-_._ _Sand, fine ... _____._-_______..
13 82
188 12 19
9 8 9
40
13 95
283 295 314 323 331 340 380
A3-2-7cc2[U.S.Bureau of Reclamation. Land-surface altitude,
5,479 ft]
Sand, soft, brown. _---.-.-. . _Sandstone, hard, brown _ ... --..Sandstone, hard, brown - __ --.-.Sandstone, hard, gray.... _Sandstone and medium-blue shale.. Sandstone, hard, gray....Shale, hard, sandy, blue __ . -.-.Shale, sandy, blue _ . . - . ...Sand and medium-blue sandy shale Sandstone with medium-gray shale. Shale, medium-gray. _ . .----._-Shale, medium-gray..
Sandstone, medium light-colored. . .
10 36 36 20 19
8 20 31 43 35 20 15 2
10 23
6 34 30
10 46 82
102 121 129 149 180 223 258 278 293 295 305 328 334 368 398
A3-2-7dd[Mike Sauter. Land-surface altitude, 5,425 ft]
Soil...- - - - .Sandstone, yellow . ............Shale, blue.. _ . ... ..... ...Sandstone, yellow. -._.__ _ _
2 12 2
20
2 14 16 36
A3-2-10cd3[J. F. Wempen. Land-surface altitude, 5,365 ft]
Soil __ -----. .-..- _ ......
Shale, gray.. ... ___ ____
1 2
10 67 25 25 30 15 35 10 40
8
1 3
13 80
105 130 160 175 210 220 260 268
Thick ness (feet)
Depth(feet)
A3-2-10db2[A. B. Miller. Land-surface altitude, 5,440 ft]
Shale, blue . __ . _ .....
10 12
8 20 15 50 4
21 3
37 4
10 6
15 25
6 4
15 10 58
3 20
4 8
48 4 6 5 3
28 4
16
10 22 30 50 65
115 119 140 143 180 184 194 200 215 240 246 250 265 275 333 336 356 360 368 416 420 426 431 434 462 466 482
A3-2-llba[P. H. Seyler. Land-surface altitude, 5,355 ft]
Soil, yellow clay_ .... . -----Sandstone, yellow . . . . ------- .
3 14 18 32
317 35 67
A3-2-12bb[Robert L. Crawford. Land-surface altitude,
5,349 ft]
SoiL. __----------------------.-
Shale, brown ... - _
2 38 18 10 30 25
5 5
12 28 67 40
2 40 58 68 98
123 128 133 145 173 240 280
A3-2-12bd2[Elton Williams. Land-surface altitude, 5,322 ft]
Soil __ ______ . _________Clay.... ----------------------
Sandstone, yellow..--(hard water) .
3 29 30 10 52
8
3 32 62 72
124 132
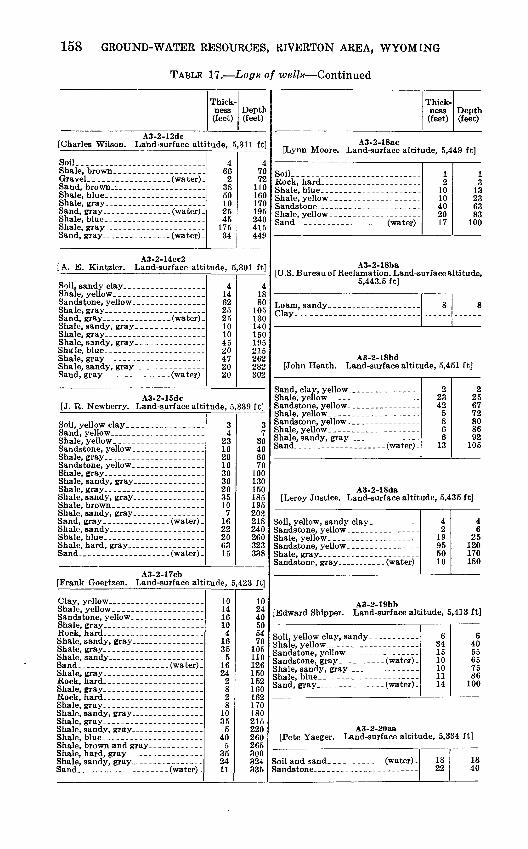
158 GROUND-WATER RESOURCES, RIVERTON AREA, WYOMING
TABLE 17. Logs of wells Continued
Thick ness (feet)
Depth (feet)
A3-2-12dc[Charles Wilson. La'nd-surface altitude, 5,311 ft]
Soil. ___ _ ---_.-Shale, brown _ _ .. ...- .. ..Gravel _. . .. .. ___ . (water) _Sand, brown. i _____ __ ____ _ _Shale, blue..-.- -_____--_-____---Shale, gray. .---__-. .. .-.Sand, gray. . . _ _ . (water)Shale, blue _. ------ - - --...
4 66
2 38 50 10 25 45
175 34
4 70 72
110 160 170 195 240 415 449
A3-2-14cc2[A. E. Kint^ler. Land-surface altitude, 5,301 ft]
Sandstone, yellow _ _______ _.-.
Sand, gray.. _ ... _ ___ (water).
4 14 62 25 25 10 10 45 20 47 20 20
4 18 80
105 130 140 150 195 215 262 282 302
A3-2-15dc[J. R. Newberry. Land-surface altitude, 5,339 ft]
Shale, yellowSandstone, yellow. . .. --.-. ..
Shale, brown _ _ _
34
23 10 20 10 30 30 20 35 10
7 16 22 20 63 15
37
30 40 60 70
100 130 150 185 195 202 218 240 260 323 338
A3-2-17cb[Frank Goertzen. Land-surface altitude, 5,423 ft]
Rock, hard..--. __-- -- -- ....Shale, sandy, gray.. .-.
Shale, sandy... ..Sand.. --------- --..(water)Shale, gray. ... ._ ... ... _Rock, hard_____ -___ _ _ _ ...
Shale, brown and gray.. _ - .--..
10 14 16 10 4
16 35
5 16 24
2 8 2 8
10 35
5 40
5 35 24 11
10 24 40 50 54 70
105 110 126 150 152 160 162 170 180 215 220 260 265 300 324 335
Thick ness (feet)
Depth (feet)
A3-2-18ac[Lynn Moore. Land-surface altitude, 5,449 ft]
Soil _ -___-_--............... 12
10 10 40 20 17
1 3
13 23 63 83
100
A3-2-18ba[U.S. Bureau of Reclamation. Land-surf ace altitude,
5,443.5 ft]
Loam, sandy _ __.-....__..____-._Clay----.---- .. ----------
8 8
A3-2-18bd[John Heath. Land-surface altitude, 5,451 ft]
Sandstone, yellow _______ __ _ _
Sandstone, yellow ._._. . . -_.Shale, yellow _ _.____-.-_ .Shale, sandy, gray. . _ _
2 23 42
5 8 6 6
13
225 67 72 80 86 92
105
A3-2-18da[Leroy Justice. Land-surface altitude, 5,435 ft]
Sandstone, gray. _ __ -(water)
4 2
19 95 50 10
4 6
25 120 170 180
A3-2-19bb[Edward Shipper. Land-surface altitude, 5,413 ft]
Shale, yellow -____- __ __ _-___Sandstone, yellow __. ___ __ _-_
Shale, sandy, gray. _ . _ _ -___ -
Sand, gray. .___ ___-_ (water) _
6 34 15 10 10 11 14
6 40 55 65 75 86
100
A3-2-20aa[Pete Yaeger. Land-surface altitude, 5,334 ft]
18 22
18 40
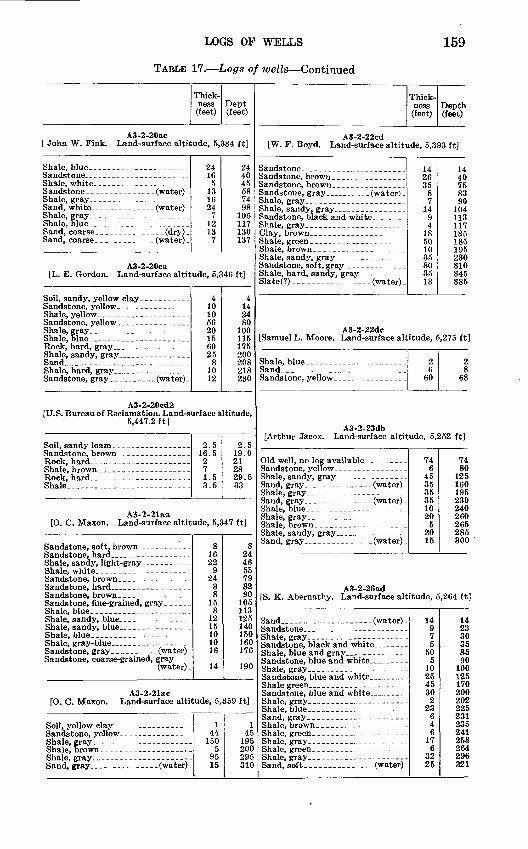
LOGS OP WELLS
TABLE 17. Logs of wells Continued
159
Thick ness (feet)
Dept (feet)
A3-2-20ac [ John W. Fink. Land-surface altitude, 5,334 ft]
Shale, blue _ - . --_.Sandstone ___--__ .. __ _ . __Shale, white- - ----- --- _-_-Sandstone - -_._ .-- (water)Shale, gray. . --- - _ _ _ _ _ _Sand, white - - - - - . (water) -
Shale, blue ______ _ _ ______Sand, coarse. _ _ _ _ _ ___ (dry) _Sand, coarse - ----- -(water)
24 16
5 13 16 24
7 12 13 7
24 40 45 58 74 98
105 117 130 137
A3-2-20ca[L. E. Gordon. Land-surface altitude, 5,346 ft]
Rock, hard, gray... __ _
4 10 10 56 20 15 60 25
8 10 12
4 14 24 80
100 115 175 200 208 218 230
A3-2-20cd2[U.S. Bureau of Reclamation. Land-surface altitude,
5,447.2ft]
Shale....--.--... ---------------
2.5 16.5 2 7 1.5 3.5
2.5 19.0 21 28 29.5 33
A3-2-21aa[O. C. Maxon. Land-surface altitude, 5,347 ft]
Sandstone, fine-grained, gray_ _ -
Shale, sandy, blue... - __. __. .Shale, blue. ._ . - - - - - -
Sandstone, gray _ _ _ - (water) -Sandstone, coarse-grained, gray
(water) -
8 16 22
9 24
3 8
15 8
12 15 10 10 16
14
8 24 46 55 79 82 90
105 113 125 140 150 160 176
190
A3-2-21ac[O. C. Maxon. Land-surface altitude, 5,359 ft]
1 44
150 5
95 15
1 45
195 200 295 310
Thick ness (feet)
Depth(feet)
A3-2-22cd[W. F. Boyd. Land-surface altitude, 5,393 ft]
Shale, brown _ _ _ _ _ . _ _ _
Slate(?)_ --.. _ _ __ . .(water) _
14 26 35
8 7
14 9 4
18 50 10 35 80 35 13
14 40 75 83 90
104 113 117 135 185 195 230 310 345 385
A3-2-22dc[Samuel L. Moore. Land-surface altitude, 5,275 ft]
Shale, blueSand _-.-. ___ ------ - --
2 6
60
2 8
68
A3-2-23db[Arthur Jacox. Land-surface altitude, 5,252 ft]
Old well, no log available
Shale, gray_ .________-._ -Sand, gray_ - _ - _ - (water) -
74 6
45 35 35 35 10 20
5 20 15
74 80
125 160 195 230 240 260 265 285 300
A3-2-26ad[S. K. Abernathy. Land-surface altitude, 5,264 ft]
Sandstone, blue and white... __._
Shale, blue _ ___ ___
14 9 7 5
50 5
10 25 45 30 2
23 6 4 6
17 6
32 25
14 23 30 35 85 90
100 125 170 200 202 225 231 235 241 258 264 296 321
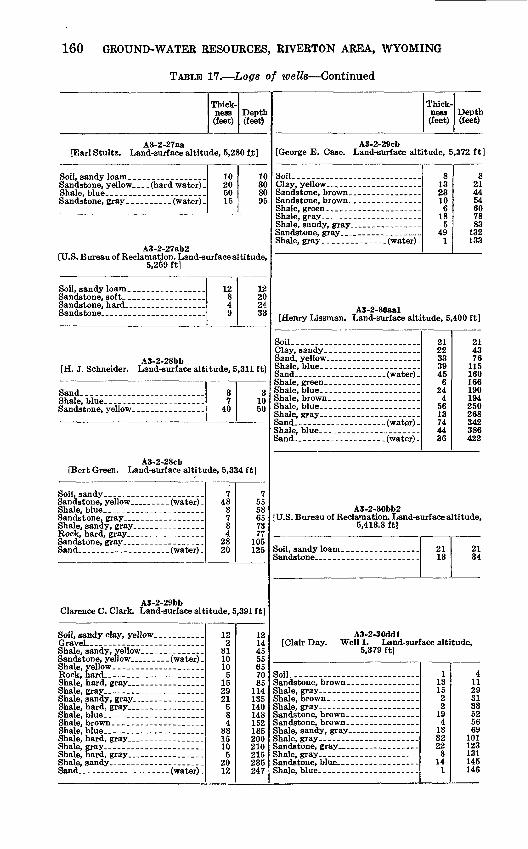
160 GROUND-WATER RESOURCES, RIVERTON AREA, WYOMING
TABLE 17. Logs of wells Continued
Thick ness(feet)
Depth (feet)
A3-2-27aa[Earl Stultz. Land-surface altitude, 5,280 fjt]
Sandstone, yellow.. -.(hard water) - Shale, blue
10 20 50 15
10 30 80 95
A3-2-27ab2 [U.S. Bureau of Reclamation. Land-surf ace altitude,
5,259 ft]
12 8 4 9
12 20 24 33
A3-2-28bb[H. J. Schneider. Land-surface altitude, 5,311 ft]
3 7
40
3 10 50
A3-2-28cb[Bert Green. Land-surface altitude, 5,334 ft]
Rock, hard, gray _ ____-
(wafer)
7 48
3 7 8 4
28 20
7 55 58 65 73 77
105 125
A3-2-29bbClarence C. Clark. Land-surface altitude, 5,391 ft]
Sandstone, yellow. .. . . (water) -
12 2
31 10 10
5 15 29 21
5 8 4
33 15 10
5 20 12
12 14 45 55 65 70 85
114 135 140 148 152 185 200 210 215 235 247
[George E. Case.
Soil. __ - .....
Sandstone, brown.
Shale, green- ____-Shale, gray... ... Shale, sandy, gray
[Henry Lissman.
Soil ___ ----..-.
Shale, blue _ _ .Shale, brown __ ._Shale, blue ....
Sand ________ .
Sand _______ .
Thick ness (feet)
Depth (feet)
A3-2-29cb Land-surface altitude, 5,372 ft]
8 13 23 10
6 18
5 49
1
8 21 44 54 60 78 83
132 133
A3-2-30aalLand-surface altitude, 5,400 ft]
21 22 33 39 45
6 24
4 56 13 74 44 36
21 43 76
115 160 166 190 194 250 268 342 386 422
A3-2-30bb2[U.S. Bureau of Reclamation. Land-surface altitude,
5,413.8 ft]
Sandstone _ -----21 13
21 34
A3-2-30ddl [Glair Day. Well 1. Land-surface altitude,
5,379 ft]
Soil __ --------- 1 13 15
2 2
19 4
13 32 22
8 14
1
4 11 29 31 33 52 56 69
101 123 131 145 146
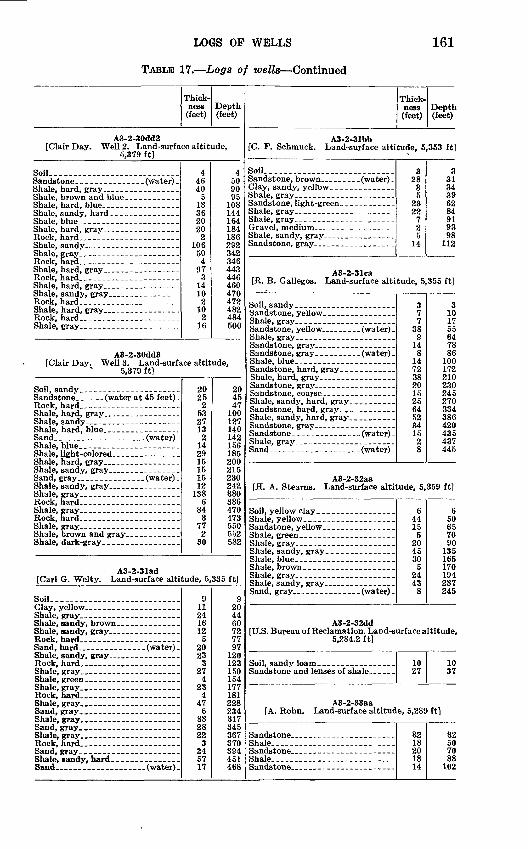
LOGS OP WELLS
TABLE 17. Logs of wells Continued
161
Thick ness (feet)
Depth (feet)
A3-2-30dd2[Clair Day. "Well 2. Land-surface altitude,
5,379 ft]
Soil...... .____--__--.-__-----__
Shale, gray____ _______
Rock, hard__-_-__ _ . -_ -_-
Rock, hard._ -_____. _ _ -Shale, gray.. --__.--- __.__----.
4 46 40
5 13 36 20 20
2 106
50 4
97 3
14 10 2
10 2
16
4 50 90 95
108 144 164 184 186 292 342 346 443 446 460 470 472 482 484 500
A3-2-30dd3[Clair Day. Well 3. Land-surface altitude,
5,379 ft]
Sandstone. _ _ _ . (water at 45 feet) - Rock, hard_____ .__ __ _______ Shale, hard, gray _ ___ _____ _ _ Shale, sandy _ ______ ._----_-.
Sand. ________ ______ ___ (water) Shale, blue _____ __ __ -____ Shale, light-colored. _._-----_-_.
Shale, gray. _ .__ _ _._ ___ __
20 25
2 53 27 13
2 14 29 15 15 15 12
138 6
84 3
77 2
30
20 45 47
100 127 140 142 156 185 200 215 230 242 380 386 470 473 550 552 582
A3-2-31ad[Carl G. Welty. Land-surface altitude, 5,335 ft]
Soil __ _.._ _ _-_
Sand, hard ___ _ _ _ _ (water) _
Shale, green _._. --_--___ _
Shale, gray. . ____ ___ .
9 11 24 16 12
5 20 23
3 27
4 23
4 47
6 83 28 22
3 24 57 17
9 20 44 60 72 77 97
120 123 150 154 177 181 228 234 317 345 367 370 394 451 468
Thick ness(feet)
Depth (feet)
A3-2-31bb[C. F. Schmuck. Land-surface altitude, 5,353 ft]
Soil. ________ ___ _ ___ __ _ _Sandstone, brown_ _ _ _ (water) -Clay, sandy, yellt>w_ __________Shale, gray. . _________Sandstone, light-green. ___ _______Shale, gray. __ __ __ _________ .Shale, gray. _________ _ _ _Gravel, medium . _________Shale, sandy, gray __ _ ____ ____Sandstone, gray ____ _______
328
3 5
23 22
7 2 5
14
3 3134 3962 84 91 93 98
112
A3-2-31ca[R. B. Gallegos. Land-surface altitude, 5,355 ft]
Soil, sandy ___.. . .. _._. ...Sandstone, yellow. _-.. _._._ ..
Sandstone, gray. _ ._---_._-_.--
Shale, sandy, hard, gray ___...__._ Sandstone, hard, gray. __ ________ Shale, sandy, hard, gray. ____-_-_- Sandstone, gray. ___ .._..._--_.Sandstone _ .__ _---._ .(water). Shale, gray. ... ...... ......Sand.... - ... --. __ (water).
37 7
38 9
14 8
14 72 38 20 15 25 64 52 34 15
2 8
310 17 55 64 78 86
100 172 210 230 245 270 334 386 420 435 437 445
A3-2-32aa[H. A. Stearns. Land-surface altitude, 5,359 ft]
Shale, sandy, gray _ _______ ...
6 44 15
5 20 45 30
5 24 43
8
6 50 65 70 90
135 165 170 194 237 245
A3-2-32dd[U.S. Bureau of Reclamation. Land-surface altitude,
5,284.2 ft]
1027
10 37
A3-2-33aa[A. Rohn. Land-surface altitude, 5,289 ft]
Shale..-. _ -_----. _
Shale. . _ -_----.--_-______..
3218 20 18 14
32 50 70 88
102
162 GROUND-WATER RESOURCES, RIVERTON AREA, WYOMING
TABLE 17. Logs of wells Continued
Thick ness (feet)
Depth(feet)
A3-3-6ba[Lawrence Williams. Land-surface altitude,
5,340 ft]
248 16 24 38 27 17 20 24 12 7
17 5
23 50 27
3
2 50 66 90
128 155 172 192 216 228 235 252 257 280 320 347 350
A3-3-6cc[Kenneth Heald. Land-surface altitude, 5,346 ft]
Soil 2 8
120 50 60 30
2 10
130 180 240 270
A3-3-6dc[Lloyd G. Foster. Land-surface altitude, 5,308 ft]
Soil
Shale, blue
Shale, blue... .... _ ___ _ ...Shale, green. __ _____ __
Sand_ ______ __ _ __ ______
4 48
4 14 13 19
6 8
20 19 29
5 7
10
4 52 56 70 83
102 108 116 136 153 182 187 194 204
A3-3-7bb[Blake P, Helberg. Land-surface altitude, 5,336 ft]
Shale, yellow. _ _ _ _ _ _
Sandstone, hard, gray.
15 3 5 5
22 28
2 18 13
15 18 23 28 50 78 80 98
111
Thick ness (feet)
Depth (feet)
A3-3-7bb Continued
Shale, brown, blue, gray _ _
Sandstone, gray, and gray shale- __
Sandstone, gray, and gray shale. _ _
Sandstone and gray broken shale. _
Shale, brown, green and gray. _____
Sandstone, hard_____ __ ___Sandstone, gray. _ _ _ -.--_-._ Shale
4 5 2 6 4
16 2
14 6
10 20 12
8 27 15 12
1 5
13 1
10 6
115 1201.^2m132148 1150 1(54 170 130 200 212 220 247 262 274 275 230 293 294 304 310
A3-3-7ca[Raymond Bond. Land-surface altitude, 5,293 ft]
Clay, sandy (topsoil) _______ _ _Sandstone, yellow. __--Gravel
Shale, blue _ _ _
Shale, blue ___ _______ ... _ _
20 18 4 2
46 4 6
55 4
29 12 20
5 5 5
10 30 4
31
20 38 42 44 90 94
100 155 159 188 200 220 225 230 235 245 275 279 310
A3-3-13ad[U.S. Bureau of Reclamation. Land-surface altitude,
5,309 ft]
Shale...... __ ----- _. _
Shale, hard, gray, with stringers of soft red shale
Sand, shaly
5 5 5 5
5 10
5 5
15 5
10 10
5 14
7
5 10 15 20
25 35 40 45 60 65 75 85 90
104 111
SUMMARY AND CONCLUSIONS
TABLE 17. Logs of wells Continued
163
Thick ness (feet)
Depth (feet)
A3- 3- 1 Sad Continued
Shale. _ _ __ .. _ .. ....
Shale..... ......................
Shale . ... . ... _. ._ .
Shale.. _--_____-_ _.__..._-_-__
Shale, soft . . .. _____ ..
Shale, hard, with stringers of soft shale _ _ _--_--_.._
Shale, soft, with stringers of hard
Sandstone, medium-grained, hard_.
Sandstone, fine-grained, soft, to
Sandstone, coarse- to medium- and fine-grained, soft _ _._
Sandstone, fine, moderately soft ....
3 6 5
25 15 15 10 10 20
5 15
5 5
5 5
15 10 15 11 9
5 5
5 15 20 15 25
8 2 7
114 120 125 150 165 180 190 200 220 225 240 245 250
255 260
275 285 300 311 320
325 330
335 350 370 385 410 418 420 427
A3-3-16cb[Richard Pattison. Land-surface altitude, 5,236 ft]
Soil, sandy. _. ... .(some water)Shale, sandy, gray _ _ _ _ (bad water) . Shale, gray _ __ ... _ _ _..Sandstone, red and gray . . . . _ _ -Shale, sandy, gray _____ ... . _Sandstone, red and gray_ _ ...Shale, blue and brown._._ ..Shale, sandy, gray. _____.._ ... _Sandstone, red and gray. . . _ .Sand __. ... ._--- (good water)
45 75 20 90 23 22 20 20 25 20
45 120 140 230 253 275 295 315 340 360
A3-3-17aa[Richard Pattison. Land-surface altitude, 5,248 ft
Soil __ -------.---__--_.--_--.
Sandstone, black and white (bad water) _
Shale, blue, gray, green and brown.
15 41 34
114 3
16 17
5 20 15 55
5 5 9
31 27 23
15 56 90
204 207 223 240 245 265 280 335 340 345 354 385 412 435
Thick ness (feet)
Depth (feet)
A3-3-17adRichard Pattison. Land-surface altitude, 5,254 ft]
Sand, black, red and white (water) _
347 20 15 35
103 14 33 20 10 10 10 30
20
3 50 70 85
120 223 237 270 290 300 310 320 350
370
A3-3-18adSmith Pattison. Land-surface altitude, 5,281ft]
Shale, blue. ---------------------Shale, sandy, gray -.-. - __. - Sandstone, soft, brown and gray. - .
Sand ----- - -. (bad water) -
2 48 50 17 2
48 35 43 15 20
5 10 13
6 5 6
15 40 10 30 30 2 8
15 45
7 48
2 50
100 117 119 167 202 245 260 280 285 295 308 314 319 325 340 380 390 420 450 452 460 475 520 527 575
A3-3-18dd2[C. Miranda. Land-surface altitude, 5,283 ft]
Sand, gray - - - - - - - - - (water)
1 29
5 5
20 15 10
1 30 35 40 60 75 85
164 GKOUND-WATEK RESOURCES, RIVERTON AREA, WYOMING
TABLE 17. Logs of wells Continued
Thick ness (feet)
Depth (feet)
A3-3-21ad2[Harvey W. Roland. Land-surface altitude.
5,273 ft]
Shale, gray. __-.--------- -.__ _Sandstone, gray. _ _-_-----._____
Shale, gray. ------- _------______
Shale, brown...--- ---_----_-_._
Shale, mixed colors -------------
Sand-.-- -. _- -__. ..-(water)
35 35 18
3 19 8 7 2
18 24
9 25
4 20
9 6
29 7 4 3 5
10 18
3 9 5
15 22
4 2 3
11 8
25
35 70 88 91
110 118 125 127 145 169 178 203 207 227 236 242 271 278 282 285 290 300 318 321 330 335 350 372 376 378 381 392 400 425
Thick- ness (feet)
Depth (feet)
A3-3-22cc Continued
80 3
57 15
120 123 180 195
A3-3-22cd[Henry Jaeger. Land-surface altitude, 5,263 ft]
2 7355 45
8
2 75
130 175 183
A3-3-22dc[Otis Williams. Land-surface altitude, 5,236 ft]
Sandstone, fine- to coarse-grained,
Sand, fine, blue to gray. (water)-
3
29. 10
5 81 21
3
3242 47
128 149
A3-3-22ab[Bryan Annon. Land-surface altitude, 5,198 ft] A3-3-23bbl
[William Eafcon. Land-surface altitude, 5,183 ft]
[?]._ _ Sandstone, gray --. _---.---_____
82 8
27 3
28 3
63 4
46 5
35 14 13 28
2 32 46
6 15
82 90
117 120 148 151 214 218 264 269 304 318 331 359 361 393 439 445 460
A3-3-22cc[Midvale Store (Stubbs and Lund). Land-surface
altitude, 5,268 ft]
Soil __ ---------- _ _________ 9 16 15
9 25 40
Gravel and sand-- - - --.(water)Shale, gray--.-.------- _--___-_-
Shale, sandy, gray. -----------Shale, gray..-- ____Sandstone, gray _-__------_-_-Shale, blue. ------- ---__-----_.Sand and gray shale. -----------Shale, blue ---------------------Shale, sandy, hard, gray. ------ ..Shale, sandy, hard, gray.. ________Shale, sandy, gray __________Shale, soft, gray. .Shale, sandy, gray. ..- - _..Sandstone, gray. .-- --..Shale, sandy, gray. . .-.----.Sandstone, gray. ------- __.
Sandstone, gray.. -. - --- .__.-
40 35
3 30 70
5 19 4
10 6
13 14 11
9 31 12 16 12
8 30
2 26
6 6
27 17 6
14 18
40 75 78
108 178 183 202 206 216 222 235 249 260 269 300 312 328 340 348 378 380 406 412 418 445 462 468 482 500
LOGS OF WELLS 165
TABLE 17. Logs of wells Continued
Thick ness (feet)
Depth (feet)
A3-3-23cc[Otis Williams. Land-surface altitude, 5,187 ft]
3 92
16 2
28 15 26 23
3 1214 30 326075
101124
A3-3-23dc[Emil Leonhardt. Land-surface altitude, 5,159 ft]
Quicksand __ __________________Sandstone, yellow, . . _ . Shale, hard, gray _ __ . . . .__Shale, blue _ -_ _ _ _____ ______ Shale, sandy, gray ___ _ _ _.
Shale, soft, green _ _ _.. _ ___
Shale, blue . _. _ ____________
20 10 15 20 65 26 20 29 25 10 11
20 30 45 65
130 156 176 205 230 240 251
A3-3-24cc[R. W. White. Land-surface altitude, 5,150 ft]
Soil __ --_--.__________________Shale ____ _ _ _ _________Sandstone.... _______ _________
29 8
13
2937 50
A3-3-25ba[Arno P. Huenefeldt. Land-surface altitude,
5,142 ft]
75 37 83 15
5
75 112 195 210 215
A3-3-25bb[U.S. Bureau of Reclamation. Land-surface altitude,
5,149.3 ft]
Soil, sandy loam _______ _ ... 30 3
30 33
A3-3-26abl[Carl Leonhardt. Land-surface altitude, 5,154 ft]
Soil.......... ____________ _
Sandstone, brown
18 21 18
9 5
14 37 23
18 39 57 66 71 85
122 145
Thick ness (feet)
Depth(feet)
A3-3-26ab2[Carl Leonhardt. Land-surface altitude, 5,154 ft]|
Shale, brown _ _ _. _
Shale, blue and brown _
Shale, blue _ _ _ . ______Sand ____ _______ (water)-
6 34 20 10 78
8 19
9 20 24 16
6 40 60 70
148 156 175 184 204 228 244
A3-3-27ab2[Herbert T. Burton. Land-surface altitude, 5,201 ft
Rock . __._ ________ Shale..----.-------- __ -- ___ _Rock, sandy ________Shale .-_ _ __ --_ - _ -Shale, sandy, and sandstone _ _ _ Shale-. _ _ -__-___ ____ --------Sand.__-_- - ----- (water) -
4 6
10 15 35 30 80 12
4 10 20 35 70
100 180 192
A3-3-27bb[Jerry Lathrop. Land-surface altitude, 5,259 ft]
Shale, gray ___ ____ ____
4 4
17 50
5 60 35 15
4 8
25 75 80
140 175 190
A3-3-27bc2[Robert Taylor. Land-surface altitude, 5,249 ft]
Soil, sandy __.._ -----Shale, gray. _ _ _ _ _ _______Shale, sandy, gray. _ _ __. .-. .-
Shale, sandy, hard, gray _ - _
Shale, sandy, gray ___- _._
Shale, gray .._-_ _ _____
2 3
45 5
20 10
8 32 10 20 10
5 22
1
2 5
50 55 75 85 93
125 135 155 165 170 192 193
A3-3-29ac[I. D. White. Land-surface altitude, 5,281 ft]
8 12 27 11 11 13 13 27
8 20 47 58 69 82 95
122
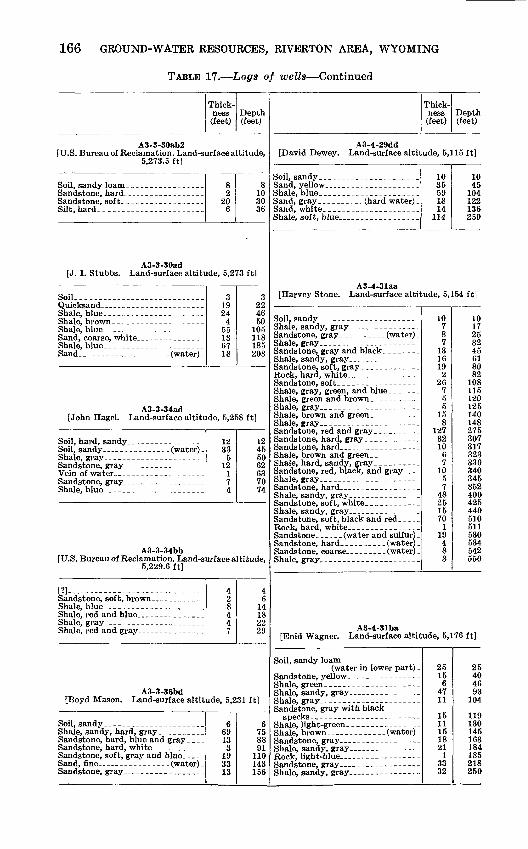
166 GROUND-WATER RESOURCES, RIVERTON AREA, WYOMING
TABLE 17. Logs of wells Continued
Thick ness (feet)
Depth (feet)
A3-3-30ab2[U.S. Bureau of Reclamation. Land-surface altitude,
5,273.5 ft]
8 2
20 6
8 10 30 36
Thick ness
(feet)Depth (feet)
A3-4-29dd[David Dewey. Land-surface altitude, 5,115 ft]
Shale, soft, blue.. --_ . ..-_- ..
10 35 59 18 14
114
10 45
104 122 136 250
A3-3-30ad[J. I. Stubbs. Land-surface altitude, 5,273 ft]
Soil.. --------_-----____----
Shale, brown. _____ . __ _.--.Shale, blue __ .. _ -.--......_
3 19 24
4 55 13 67 18
3 22 46 50
105 118 185 203
A3-3-34ad[John Hagel. Land-surface altitude, 5,258 ft]
12 33
5 12
1 7 4
12 45 50 62 63 70 74
A3-3-34bb[U.S. Bureau of Reclamation. Land-surface altitude,
5,229.6 ft]
[?]. _- ---. _.- ------ 4 2 8 4 4 7
4 6
14 18 22 29
A3-3-36bd[Boyd Mason. Land-surface altitude, 5,231 ft]
Sandstone, hard, blue and gray_-__
Sandstone, soft, gray and blue_-_-_
6 69 13
3 19 33 13
6 75 88 91
110 143 156
[Harvey Stone. Land-surface altitude, 5,154 ft]
Soil, sandy ___. _ ______ _ _ _
Sandstone, gray _ -- - (water) -Shale, gray.. ___ __ _._ - _.Sandstone, gray and black- . ._
Shale, gray. . - _.__-._ --...Sandstone, red and gray- ... _. Sandstone, hard, gray, _ ...
Shale, brown and green _ _ _ _Shale, hard, sandy, gray __ ...Sandstone, red, black, and gray. ... Shale, gray. _. _ _ _ -__-__Sandstone, hard-.. . ___- ---
Sandstone, soft, black and red_--__
10 7 8 7
13 16 19
2 26
7 5 5
15 8
127 32 10
6 7
10 5 7
48 25 15 70
1 19
4 8 8
10 17 25 32 45 61 80 82
108 115 120 125 140 148 275 307 317 323 330 340 345 352 400 425 440 510 511 530 534 542 550
A3-4-31ba[Enid Wagner. Land-surface altitude, 5,176 ft]
Soil, sandy loam (water in lower part) -
Sandstone, gray with black
25 15
6 47 11
15 11 15 18 21
1 33 32
25 40 46 93
104
119 130 145 163 184 185 218 250
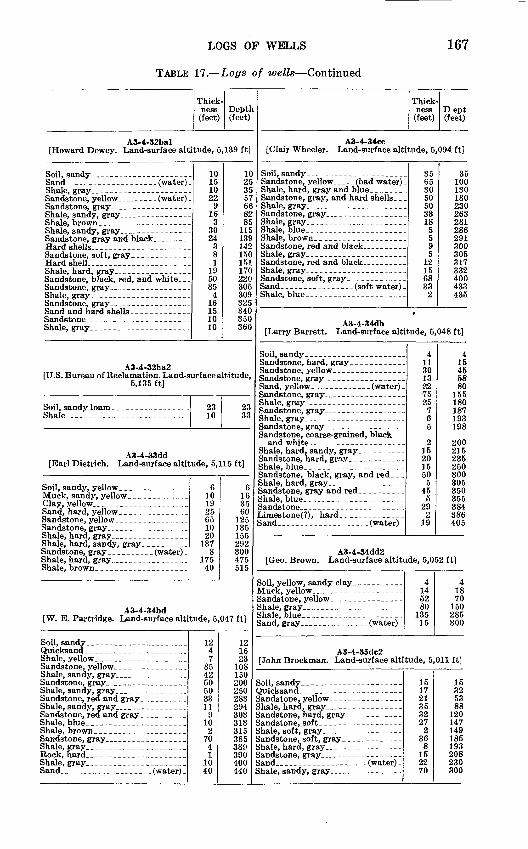
LOGS OF WELLS
TABLE 17. Logs of wells Continued
167
Thick ness (feet)
Depth(feet)
A3-4-32bal[Howard Dewey. Land-surface altitude, 5,139 ft]
Hardshell __-__--_---_ _ ..-_.
Sandstone, black, red, and white.. _
Sandstone, gray _ _ . _. --.. _
10 15 10 22
9 16
3 30 24
3 8 1
19 50 85
4 16 15 10 10
10 25 35 57 66 82 85
115 139 142 150 151 170 220 305 309 325 340 350 360
A3-4-32ba2[U.S. Bureau of Reclamation. Land-surface altitude,
5,135 ft]
Soil, sandy loamShale
23 10
23 33
A3-4-33dd[Earl Dietrich. Land-surface altitude, 5,115 ft]
Soil, sandy, yellow ------- --- ..Muck, sandy, yellowClay, yellow. _ .._. _ .._ . _-__Sand, hard, yellow _ - _ _ - - -Sandstone, yellow - _----__ _--,Sandstone, gray___ _. ______ ._
6 10 19 25 65 10 20
137 8
175 40
6 16 35 60
125 135 155 292 300 475 515
A3-4-34bd[W. E. Partridge. Land-surface altitude, 5,047 ft]
Quicksand
Shale, blue . - ---- ----- ------
12 4 7
85 42 50 50 33 11
9 10
2 70
4 1
10 40
12 16 23
108 150 200 250 283 294 303 313 315 385 389 390 400 440
Thick ness (feet)
Dept(feet)
A3-4-34cc[Glair Wheeler. Land-surface altitude, 5,094 ft]
Soil, sandySandstone, yellow - - - _ (bad water) .
Sandstone, gray, and hard shells. _.
Sandstone, red and black _ .. -Shale, gray
Shale, gray, ....... - .. . .. _
35 65 30 50 50 33 18
5 5 9 5
12 15 68 33 2
35 100 130 180 230 263 281 286 291 300 305 317 332 400 433 435
A3-4-34db[Larry Barrett. Land-surface altitude, 5,048 ft]
Soil, sandy
Sandstone, coarse-grained, black
Sand_._ --._ ---. --_ -(water)
4 11 30 13 22 75 25
7 6 5
2 15 20 15 50
5 45
5 29 2
19
4 15 45 58 80
155 180 187 193 198
200 215 235 250 300 305 350 355 384 386 405
A3-4-34dd2[Geo. Brown. Land-surface altitude, 5,052 ft]
4 14 52 80
135 15
4 18 70
150 285 300
A3-4-35dc2[John Brockman. Land-surface altitude, 5,011 ft]
15 17 21 35 32 27
2 36 8
15 22 70
15 32 53 88
120 147 149 185 193 208 230 300
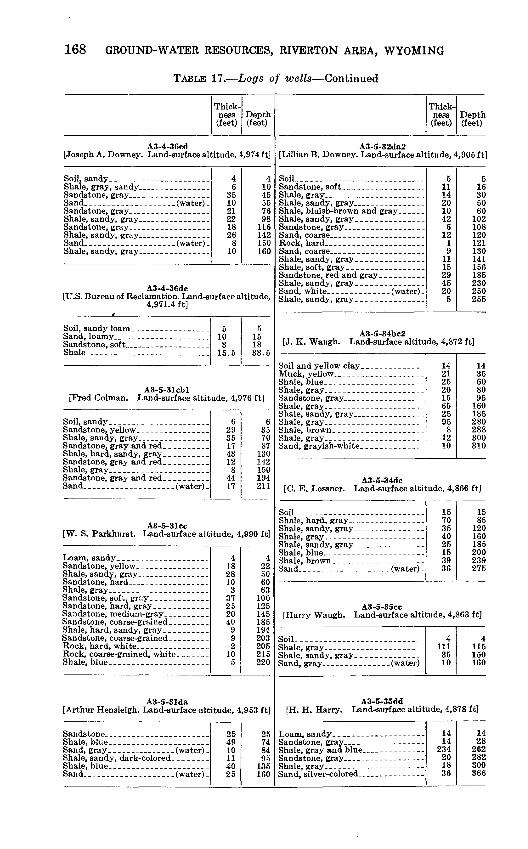
168 GROUND-WATER RESOURCES, RIVERTON AREA, WYOMING
TABLE 17. Logs of wells Continued
Thick ness (feet)
Depth (feet)
A3-4-36cd[Joseph A. Downey. Land-surface altitude, 4,974 ft]
4 6
35 10 21 22 18 26
8 10
4 10 45 55 76 98
116 142 150 160
A3-4-36dc[U.S. Bureau of Reclamation. Land-surface altitude,
4,971.4 ft]
Shale... _ ---..---_ _ .......
5 10
315.5
5 15 18 33.5
A3-5-31cbl[Fred Colman. Land-surface altitude, 4,976 ft]
Shale, hard, sandy, gray. _ _ . ...
Sandstone, gray and red . . . .
6 29 35 17 43 12
8 44 17
6 35 70 87
130 142 150 194 211
A3-5-31cc[W. S. Parkhurst. Land-surface altitude, 4,990 ft]
Loam, sandy _ ______Sandstone, yellow - ------ _ .
Sandstone, medium-gray _ . .Sandstone, coarse-grained- .Shale, hard, sandy, gray _ Sandstone, coarse-grained
Rock, coarse-grained, white. ____Shale, blue.. - ------
4 18 28 10
3 37 25 20 40
9 9 2
10 5
4 22 50 60 63
100 125 145 185 194 203 205 215 220
A3-5-31da[Arthur Hensleigh. Land-surface altitude, 4,953 ft]
25 49 10 11 40 25
25 74 84 95
135 160
Thick ness (feet)
Depth (feet)
A3-5-32da2[Lillian B. Downey. Land-surface altitude, 4,905 ft]
Soil __ ------------.-_----_-_-_
Shale, sandy, gray . ---------
5 11 14 20 10 42
6 12
1 9
11 15 29 45 20
5
5 16 30 50 60
102 108 120 121 130 141 156 185 230 250 255
A3-5-34bc2[J. K. Waugh. Land-surface altitude, 4,872 ft]
Shale blue--.-.-.------- _ -----
Shale gray... .. _ __.-
14 21 25 20 15 65 25 95
8 12 10
14 35 60 80 95
160 185 280 288 300 310
A3-5-34dc[C. E. Lossner. Land-surface altitude, 4,866 ft]
Soil. --_--------------------.-- 15 70 35 40 25 15 39 36
15 85
120 160 185 200 239 275
A3-5-35cc[Harry Waugh. Land-surface altitude, 4,863 ft]
Soil.__. -.-------------. -- 4 111 35 10
4 115 150 160
A3-5-35dd[H. H. Harry. Land-surface altitude, 4,878 ft]
14 14
234 20 18 36
14 28
262 282 300 366
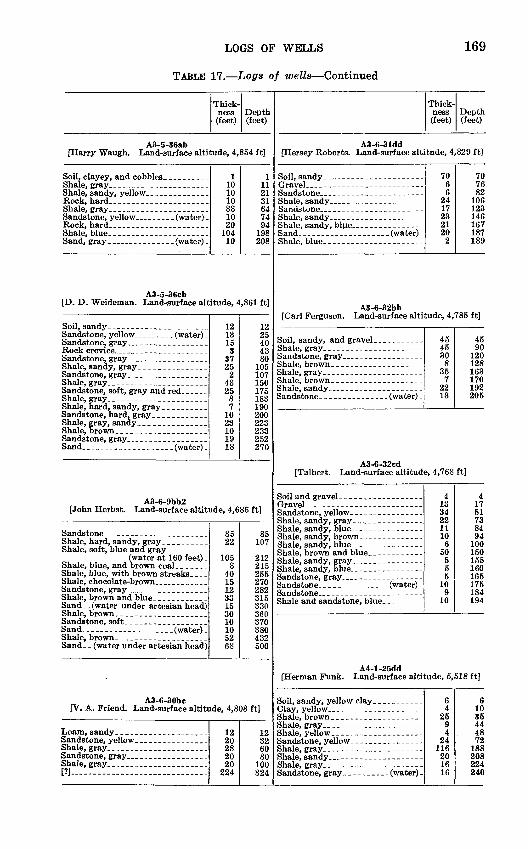
LOGS OP WELLS
TABLE 17. Logs of wells Continued
169
Thick ness (feet)
Depth (feet)
A3-5-36ab[Harry Waugh. Land-surface altitude, 4,854 ft]
Soil cla e and cobbles 1 10 10 10 33 10 20
104 10
111 21 31 64 74 94
198 208
Thick ness (feet)
Depth (feet)
A3-6-31dd[Hersey Roberts. Land-surface altitude, 4,829 ft]
70 6 6
24 17 23 21 20
2
70 76 82
106 123 146 167 187 189
A3-5-36cb[D. D. Weideman. Land-surface altitude, 4,861 ft]
A3-6-32bb
12 13 15
3 37 25
2 43 25
8 7
10 23 10 19 18
1225 40 43 80
105 107 150 175 183 190 200 223 233 252 270
A3-6-9bb2[John Herbst. Land-surface altitude, 4,686 ft]
Sandstone. _ .___ _ _ _Shale, hard, sandy, gray _Shale, soft, blue and gray
(water at 160 feet). Shale, blue, and brown coalShale, blue, with brown streaks _... Shale, chocolate-brown ___ ___ .Sandstone, gray ___ . ._. _____Shale, brown and blue-Sand,, (water under artesian head)
Sand__ (water under artesian head)
85 22
105 3
40 15 12 33 15 30 10 10 52 68
85 107
212 215 255 270 282 315 330 360 370 380 432 500
A3-6-30bc[V. A. Friend. Land-surface altitude, 4,803 ft]
Sandstone, yellow. _---.___ _ ___Shale, gray _ _ _ _ _________ _ _Sandstone, gray _ _____ _______
[?] ._________-__ ._._.
12 2028 20 20
224
12 32 60 80
100 324
L«Jarl .Perguson. Jjana-suriace aratuae, <_,<eo itj
Soil, sandy, and gravel. _.. _ -Shale, gray. . ._. . ___Sandstone, gray _ _ . ... _ ___Shale, brown _ ___ .-..-Shale, gray. . . ._ __ _ -------Shale, brown __ _ ._ -__. _
Sandstone ._ - __ __.. (water)
45 45 30
8 35
7 22 13
45 90
120 128 163 170 192 205
A3-6-32cd[Talbert. Land-surface altitude, 4,768 ft]
4 13 34 22 11 10
6 50
5 5 5
10 9
10
4 17 51 73 84 94
100 150 155 160 165 175 184 194
A4-l-25dd[Herman Funk. Land-surface altitude, 5,518 ft]
Shale, brown _.-.____ ._.
6 4
25 9 4
24 116 20 16 16
6 10 35 4448 72
188 208 224 240
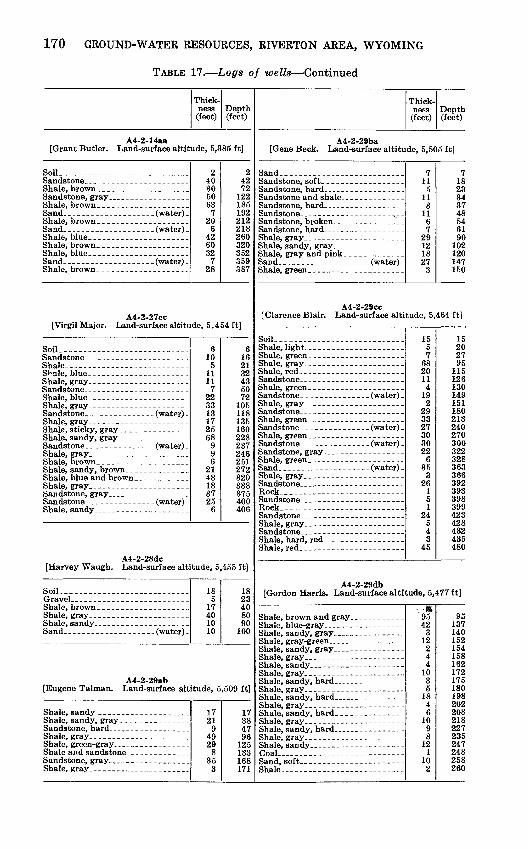
170 GROUND-WATER RESOURCES, RIVERTON AREA, WYOMING
TABLE 17. Logs of wells Continued
Thick ness (feet)
Depth (feet)
A4-2-14aa[Grant Butler. Land-surface altitude, 5,385 ft]
Soil.. -----_-----------._---_-_-
Shale, brown. _____________ _ _
2 40 30 50 63
7 20
6 42 60 32
7 28
2 42 72
122 185 192 212 218 260 320 352 359 387
A4-2-27cc[Virgil Major. Land-surface altitude, 5,454 ft]
Soil. __ -___-_-__-__-__-__._____
Shale------------------------ --
6 10
5 11 11 7
22 33 13 17 25 68
9 9 6
21 48 18 37 25
6
6 16 21 32 43 50 72
105 118 135 160 228 237 246 251 272 320 338 375 400 406
A4-2-28dc[Harvey Waugh. Land-surface altitude, 5,455 ft]
Soil, __ ---------_.---_-------.Gravel. - _ __--_ _ ___ _ ___ _Shale, brown - ______ _ _ _ _ Shale, gray- _ _ -----______.
18 5
17 40 10 10
18 23 40 80 90
100
A4-2-29ab[Eugene Talman. Land-surface altitude, 5,509 ft]
Shale, sandy, gray. ___ _ _______17 21
9 49 29
8 35
3
17 38 47 96
125 133 168 171
Thick ness (feet)
Depth (feet)
A4-2-29ba [Gene Beck. Land-surface altitude, 5,505 ft]
7 11
5 11
3 11
6 7
29 12 18 27
3
7 18 23 34 37 48 54 61 90
102 120 147 150
A4-2-29cc [Clarence Blair. Land-surface altitude, 5,464 ft]
So_l____-_.-------------------__Shale, light-. -------------------Shale, green _- _ _ _____ _ ____Shale, gray. . _ __ ------- -- -- -Shale, red ----- ---------- -.. -Sandstone. __-- . . .. .___,._Shale, green.-- _---_ . -... .. .Sandstone __ _ _. (water) .Shale, gray. __.-----__ _ _ _Sandstone.- - - _ _ __Shale, green _ _ . -.--. - - -----Sandstone.. . _ _____ (water) -Shale, green _ _ __ __ .--_--_---.Sandstone .-_-_-. _. .(water)Sandstone, gray _ _ --_-_--___-Shale, green _ __ _ _ _ __._-__-.Sand__ --.__- _-_ -_ - (water) -
Sandstone __._-_ ----- _ - __ -Rock...--.--- - --- _- . - _--Sandstone.. ---------- -- - -----Rock ------ ------ -- --..Sandptone -- ------- - - ---Shale, gray_ . . . - - ----- - -__-
15 5 7
68 20 11
4 19
2 29 33 27 30 30 22
6 35
3 26
1 5 1
24 5 4 3
45
15 20 27 95
115 126 130 149 151 180 213 240 270 300 322 328 363 366 392 393 398 399 423 428 432 435 480
A4-2-29db[Gordon Harris. Land-surf ace altitude, 5,477ft]
Shale gray
Shale, sandy, hard. . --- -
Qliala
- -K 95 42
3 12 2 4 4
10 3 5
18 4 6
10 9 8
12 1
10 2
95 137 140 152 154 158 162 172 175 180 198 202 208 218 227 235 247 248 258 260
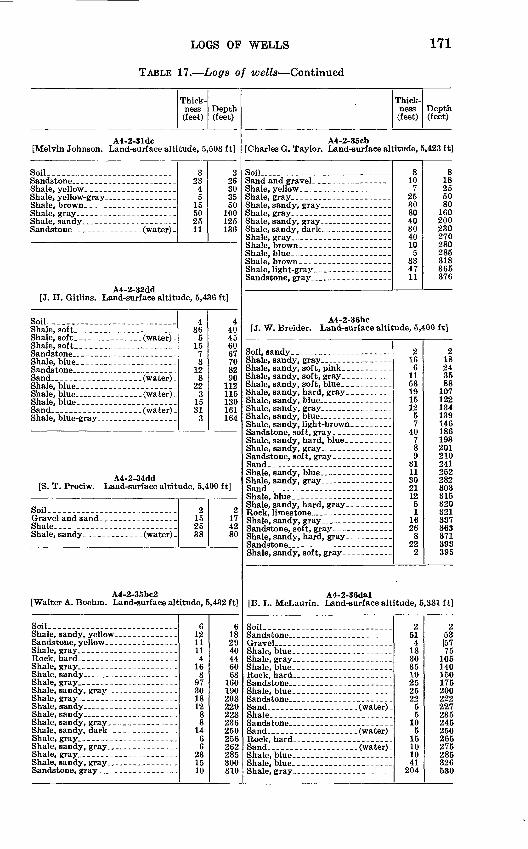
LOGS OF WELLS
TABLE 17. Logs of wells Continued
171
Thick ness (feet)
Depth(feet)
A4-2-31dc[Melvin Johnson. Land-surface altitude, 5,503 ft]
Soil 3 23 4 5
15 50 25 11
3 26 30 35 50
100 125 136
A4-2-32dd[J. H. Gitlins. Land-surface altitude, 5,436 ft]
Soil--.... - 4 36
5 15
7 3
12 8
22 3
15 31
3
4 40 45 60 67 70 82 90
112 115 130 161 164
A4-2-34dd[S. T. Proeiw. Land-surface altitude, 5,400 ft]
Soil--.- -- ----...Gravel and sand __- - _ _ ____._.Shale Shale, sandy. _ _ __.- (water)
215 25 38
2 17 42 80
A4-2-35bc2[Walter A. Boehm. Land-surface altitude, 5,432 ft]
Soil-.-. --- Shale, sandy, yellow .. ._--_- -
Shale, gray _ ... _ __ _ __ _.__
Shale, sandy, gray. __- __ __ ...
Shale, sandy __ ... ._ .__ .._Shale, sandy, gray. ._ .- -_ .
Sandstone, gray. _ ._ .. - _.._
6 12 11 11
4 16 3
97 30 18 12
8 8
14 6 6
23 15 10
6 18 29 40 44 60 63
160 190 208 220 228 236 250 256 262 285 300 310
Thick ness (feet)
Depth(feet)
A4-2-35cb[Charles G. Taylor. Land-surface altitude, 5,423 ft]
Soil-.... ------------------------
Shale, gray.- .. __-. ----- _ -Shale, brown ---------- .
8 10
7 25 30 80 40 30 40 10
5 33 47 11
8 18 25 50 80
160 200 230 270 280 285 318 365 376
A4-2-36be[J. W. Breider. Land-surface altitude, 5,400 ft]
Soil, sandy . . - . ----- - -------Shale, sandy, gray. -___.--__- . .Shale, sandy, soft, pink ----------Shale, sandy, soft, gray - ------Shale, sandy, soft, blue _ _ _ .Shale, sandy, hard, gray. ______Shale, sandy, blue __-. -- -- -- -Shale, sandy, gray. _ .. - -. ._-Shale, sandy, blue - -__-_--_-- .Shale, sandy, light-brown _ _ _
2 16
6 11 53 19 15 12
5 7
40 7 8 9
31 11 30 21 12
5 1
16 26
8 22
2
2 18 24 35 88
107 122 134 139 146 186 193 201 210 241 252 282 303 315 320 321 337 363 371 393 395
A4-2-36dal[B. L. MeLaurin. Land-surface altitude, 5,381 ft]
Soil.- ------- --.- _ - ___ ----
Shale---------.--.----------..
2 51 4
18 30 35 10 25 25 22
5 5
10 5
15 10 10 41
204
2 53 |57 75
105 140 150 175 200 222 227 235 245 250 265 275 285 326 530
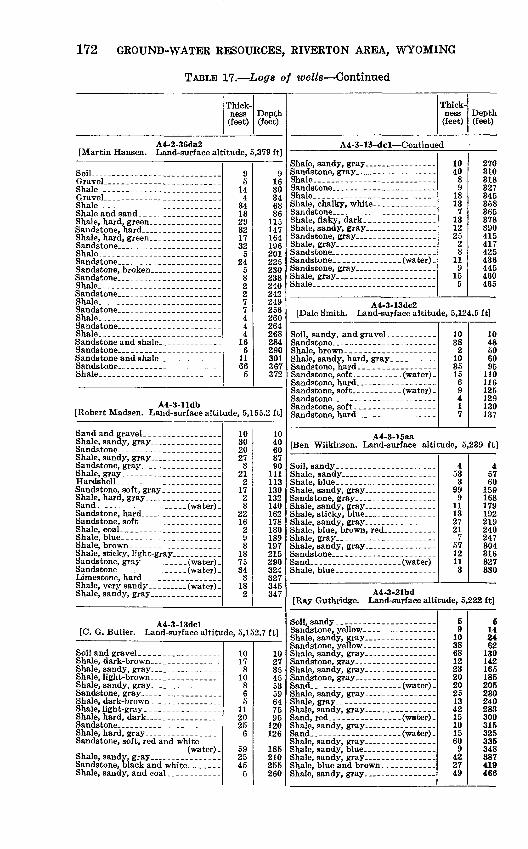
172 GROUND-WATER RESOURCES, RIVERTON AREA, WYOMING
TABLE 17. Logs of wells Continued
Thick ness (feet)
Depth (feet)
A4-2-36da2[Martin Hansen. Land-surface altitude, 5,379 ft]
Soil --------.-.............
Shale _ ------- ________ . _
Shale _ . ______ .. _ _ __ -_.
Shale---.. _ --. _ .. _ ... _ .Sandstone _-_-__- ..Shale--.-..--------...-.--....-.
Shale..-- ____ -..,
Shale.. ---------_.--------_----_
Shale ___ .. .......
9 5
14 4
34 18 29 32 17 32
5 24
5 8 2 2 7 7 4 4 4
16 6
11 66
5
9 16 30 34 68 86
115 147 164 196 201 225 230 238 240 242 249 256 260 264 268 284 290 301 367 372
A4-3-lldb[Robert Madsen. Land-surface altitude, 5,155.2 ft]
Sandstone . ----___ _ _.
Shale, gray. _ _ - _ .
Shale, hard, gray ... .
Sandstone, soft
Shale, brownShale, sticky, light-gray
Limestone, hardShale, very sandy .. .. (water) Shale, sandy, gray .
10 30 20 27
3 21
2 17
2 8
22 16
2 9 8
18 75 34
3 18 2
10 40 60 87 90
111 113 130 132 140 162 178 180 189 197 215 290 324 327 345 347
A4-3-13dcl[C. G. Butler. Land-surface altitude, 5,152.7 ft]
Soil and gravel _ ....
Shale, light-brownShale, sandy, gray. . .
Shale, ligh t-gray ....
Sandstone _ .....Shale, hard, gray . .Sandstone, soft, red and white
(water) -
10 17
8 10
8 6 5
11 20 25
6
59 25 45
5
10 27 35 45 53 59 64 75 95
120 126
185 210 255 260
Thick ness (feet)
Depth (feet)
A4-3-13-dcl Continued
Sandstone, gray __ _ ---.-----...Shale.. _ .- .. .... __ . .Sandstone .----_----_.-. .-.Shale _ ------ ____ . __ __ .Shale, chalky, white ._-.-.Sandstone.... ._ . .Shale, flaky, dark _.. . . ------Shale, sandy, gray ...... .Sandstone, gray. .. .. __-..Shale, gray.. ---.-.... __.Sandstone...------ - __.._.Sandstone- ..._ ---._-._ (water) .
Shale, gray. .... .. ._._Shale . _ . __ -.- --. . .._-..
10 40
8 9
18 13 7
13 12 25
2 8
11 9
15 5
270 310 318 327 345 358 365 378 390 415 417 425 436 445 460 465
A4-3-13dc2[Dale Smith. Land-surface altitude, 5,124.5 ft]
Sandstone, hard . _...- -.Sandstone, soft. - - . _ . . (water) -
Sandstone, hard ... _ ...
10 38
2 10 35 15
6 9 4 1 7
10 48 50 60 95
110 116 125 129 130 137
A4-3-15aa[Ben Wilkinson. Land-surface altitude, 5,239 ft]
4 53 3
999
11 13 27 21
7 57 12 11 3
457 60
159 168 179 192 219 240 247 304 316 327 330
A4-3-21bd[Ray Guthridge. Land-surface altitude, 5,222 ft]
Shale, sandy, gray __ -------- .
5 9
10 38 68 12 23 20 20 25 13 42 15 10 15 60
9 42 27 49
5 14 24 62
130 142 165 185 205 230 240 283 300 315 325 335 348 387 419 466
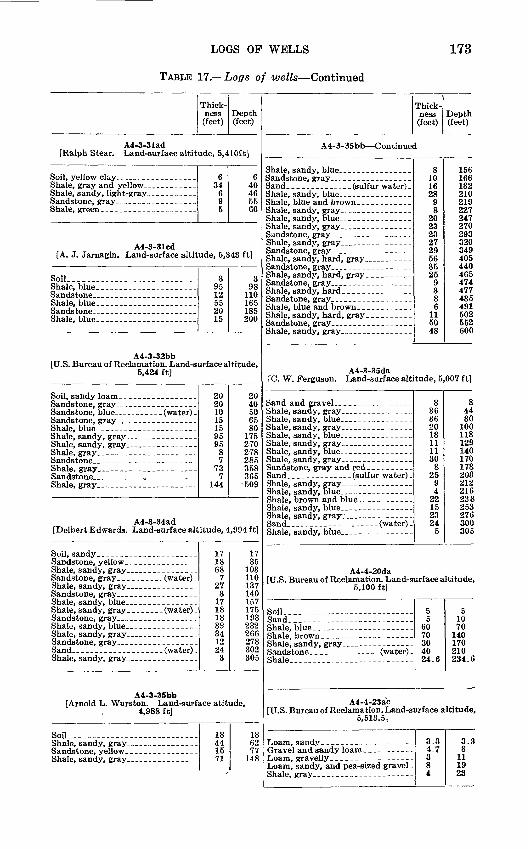
LOGS OP WELLS
TABLE 17. Logs of wells Continued
173
Thick ness (feet)
Depth (feet)
A4-3-31ad[Ralph Stear. Land-surface altitude, 5,410ft]
Soil, yellow clay __ _. __ ___. .Shale, gray and yellow _. _- - .Shale, sandy, light-gray. - . _ - - .Sandstone, gray _ __ - __ _Shale, green .__ ... _ .__ ....
6 34
6 95
6 40 46 55 60
A4-3-31cd[A. J. Jarnagin. Land-surface altitude, 5,343 ft]
Soil.-..--.-. -------------Shale, blue. ._. ... _ . .. ..
Shale, blue.. ... _-_._ ._...- Sandstone. --------- . ..- Shale, blue. _-- .-_- _.
3 95 12 55 20 15
3 98
110 165 185 200
A4-3-32bb[U.S. Bureau of Reclamation. Land-surface altitude,
5,424 ft]
20 20 10 15 15 95 95
8 7
73 7
144
20 40 50 65 80
175 270 278 285 358 365 509
A4-3-34ad[Delbert Edwards. Land-surface altitude, 4,994 ft]
Shale, sandy, gray ... . . . .
Sandstone, gray. _._ .._. .. .Shale, sandy, blue _ Shale, sandy, gray ... (water)Sandstone, gray _ _- _ _...Shale, sandy, blue ..- .____._.Shale, sandy, gray . -------Sandstone, gray. . . . . .Sand.. _. .. . ... (water) -Shale, sandy, gray _ _ . . . .
17 18 68
7 27
3 17 18 18 39 34 12 24
3
17 35
103 110 137 140 157 175 193 232 266 278 302 305
A4-3-35bb[Arnold L. Wurston. Land-surface atitude,
4,988 ft]
Soil ..-- . .. 18 44 15 71
18 62 77
148
Thick ness (feet)
Depth(feet)
A4-3-35bb Continued
Shale, sandy, blue .-..--
Shale, sandy, hard, gray . . Sandstone, gray ._ . .--. . Shale, sandy, hard. . _ _ . _ _Sandstone, gray . -.__ -.._ ... Shale, blue and brown . . _ - . - Shale, sandy, hard, gray ____ .._..
8 10 16 28
9 8
20 23 23 27 29 56 35 25
9 3 8 6
11 50 48
156 166 182 210 219 227 247 270 293 320 349 405 440 465 474 477 485 491 502 552 600
A4-3-35da[C. W. Ferguson. Land-surface altitude, 5,007 ft]
Sand and gravel. __ . ._ _...-Shale, sandy, gray _ . ._ . ..-.Shale, sandy, blue - . ... - -Shale, sandy, gray ... ....---
Shale, sandy, blue . -- ---Shale, sandy, gray . . -------Sandstone, gray and red _ _ ... .Sand - .... (sulfur water)Shale, sandy, gray . ------Shale, sandy, blue. _ . - . . _ _ ---Shale, brown and blue_ - .- _ - -
Sand. - -. - ... ... (water).
8 36 36 20 18 11 11 30
8 25
9 4
22 15 23 24
5
8 44 80
100 118 129 140 170 178 203 212 216 238 253 276 300 305
A4-4-20da [U.S. Bureau of Reclamation. Land-surface altitude,
5,100 ft]
Soil.. ___-. - -- --
Shale ___ . _ ------- _ --_-.--
5 5
60 70 30 40 24.6
5 10 70
140 170 210 234.6
A4-4-23ac [U.S. Bureau of Reclamation. Land-surface altitude,
5,513.5]
Gravel and sandy loam _ . -----
Loam, sandy, and pea-sized gravel -
3.3 4.7 3 8 4
3.3 8
11 19 23
174 GROUND-WATER RESOURCES, RIVERTON AREA, WYOMING
TABLE 17. Logs of wells Continued
Thick ness (feet)
Depth(feet)
A4-4-23dbl [U.S. Bureau of Reclamation. Land-surface altitude,
5,009 ft]
Soil. __ ------------------------
Shale, brown _ _ ...._. __ ...
Shale, gray.. _ _ _ _________
10 35 35 75 30 35 60 15 10 65 41
9 8
152 10 10 21
10 45 80
155 185 220 280 295 305 370 411 420 428 580 590 600 621
A4-4-23db2 [U.S. Bureau of Reclamation. Land-surface altitude
5,512.5 ft]
Shale.-----.----.-. .............
4 4 7
15
4 8
15 20
Thick ness (feet)
Depth(feet)
B3-l-19ba2[Robert N. Harris. Land-surface altitude,
5,550.5 ft]
Soil- -..-....----..---------.
Shale-..- -----------------------
5 33
7 61 24 37 17 10
5 38 45
106 130 167 184 194
B3-l-21bdl[W. E. Smith. Land-surface altitude, 5,503.46 ft]
Soil ___- - - . 464
4 10 14
Dl-4-2ba[Kiva Sproule. Land-surface altitude, 4,918.82 ft]
Soil __- - --. --
Shale, gray, . - . . . . . . - -----
1 12 27 22 26 27 25
3
1 1340 62 88
115 140 143
GROUND-WATER RESOURCES, RIVERTON AREA, WYOMING 175
INVENTORY OF WELLS AND SPRINGS
The location of all known water wells in the area covered by this report is shown on plate 1. Pertinent available information on all wells shown on the map is given in table 18. Most drilled wells in the area penetrate sandstone beds of the Wind River formation. As it was impossible to obtain a measurement of the depth of every well or of the depth to water in all of the wells, the information given for some of the wells in the table is based on the memory of the owner or driller of the well.
TABL
E 18 R
ecor
ds o
f wel
ls a
nd s
prin
gsW
ell
nu
mb
er:
See
expla
nat
ion o
f w
ell-
num
ber
ing s
yste
m i
n te
xt.
Typ
e of
w
ell:
D
D,
dug
and
d
rill
ed;
Dn,
dri
ven
; D
r,
dri
lled
; D
u,
du
g;
J, j
ette
d;
Sp,
spri
ng.
Dep
th
of
wel
l:
Mea
sure
d de
pths
ar
e gi
ven
in
feet
an
d te
nth
s be
low
la
nd
surf
ace;
rep
ort
ed d
epth
s ar
e gi
ven
in f
eet.
Typ
e o
f ca
sing
: C
, co
ncre
te
(bri
ck,
tile
, or
pip
e);
G,
galv
aniz
ed
iron;
M,
mas
on
ry;
N,
none
; O
d, o
il dru
m;
P,
iron o
r st
eel
pip
e; P
I, p
last
ic p
ipe;
R
, ro
ck l
ined
; T
, cl
ay t
ile
; W,
woo
d.M
etho
d of
li
ft:
C,
ho
rizo
nta
l ce
ntr
ifugal
; C
y,
cyli
nder
; F
, nat
ura
l fl
ow
(gal
lons
per
m
inute
gi
ven
in par
enth
esis
);
J,
jet;
N
, n
on
e; P
, p
itch
er
pum
p ;
S, s
ubm
ersi
ble
turb
ine;
T,
turb
ine.
Typ
e of
pow
er:
E,
elec
tric
; G
, g
aso
lin
e; H
, h
and
oper
ated
; W
, w
ind.
Use
of
wat
er:
BO
, ob
serv
atio
n of
wat
er l
evel
by
U.
S.
Bur
eau
of R
ecla
ma
ti
on
; D
, dom
esti
c; I
, ir
rigat
ion;
In,
indust
rial
; N
, n
ot
use
d;
O,
obse
rva
ti
on o
f w
ater
lev
el b
y U
. S.
Geo
l. S
urv
ey;
PS
, publi
c su
pply
; R
R,
rail
road
; S,
sto
ck.
Mea
suri
ng
-po
int
des
crip
tion:
Be,
bo
ttom
of
co
ver;
B
pl,
base
of
pla
tform
; E
p,
edge
of
pla
nk u
nder
pu
mp
; H
e,
hole
in
ca
sing;
Hpc
, ho
le i
n
pum
p co
lum
n;
L,
land
su
rfac
e;
Op,
outl
et pip
e;
Pb
, bo
ttom
of
pu
mp
base
; T
c, t
op o
f co
ver
; T
ea,
top
of c
asin
g;
Tg,
top o
f ga
lvan
ized
iro
n;
Tm
c, t
op
of m
ilk
can
over
cas
ing;
Tod
, to
p
of o
il d
rum
ca
sing;
Tpl
, to
p of
pla
t
form
; T
t, t
op o
f cl
ay t
ile;
Tw
, to
p of
woo
d ca
sing.
Alt
itude:
A
ltit
ud
es
dete
rmin
ed
by
inst
rum
enta
l le
veli
ng
are
give
n in
fe
et,
tenth
s,
and
hundre
dth
s;
alti
tudes
in
terp
ola
ted
fr
om
to
po
gra
ph
ic
map
s hav
ing
a co
nto
ur
inte
rval
of
2
feet
ar
e gi
ven
in
feet
. A
ltit
ud
e of
la
nd
surf
ace
at w
ell
is g
iven
for
wel
ls h
avin
g n
o oth
er m
easu
rin
g p
oin
t.D
epth
to w
ater
: M
easu
red
dept
hs to
w
ater
le
vel
are
give
n in
fe
et,
tenth
s,
and
hundre
dth
s;
rep
ort
ed
dept
hs
are
give
n in
fe
et.
Cas
ing
dia
met
er
is
show
n in
par
enth
esis
fo
r re
spec
tive
m
easu
rem
ents
m
ade
in
inn
er
and
oute
r ca
sing o
f sa
me
wel
l.R
emar
ks:
A
, ab
andoned
; A
ri,
auto
mat
ic
wat
er-l
evel
re
cord
er
inst
alle
d;
B,
buri
ed;
BC
, ch
emic
al
anal
ysi
s of
w
ater
m
ade
by
U.
S.
Bure
au
of
Rec
lam
atio
n;
C,
caved
; D
h,
dry
ho
le;
Ff,
fl
owed
w
hen
firs
t d
rill
ed;
GC
, ch
emic
al
anal
ysi
s of
w
ater
m
ade
by
U.
S.
Geo
l. S
urve
y;
L,
log
of
wel
l in
tab
le
17;
Mbc
, w
ater
-lev
el m
easu
rem
ent
mad
e be
twee
n in
ner
and
oute
r ca
sings;
O
c,
ori
gin
ally
a
cist
ern;
Ot,
un
succ
essf
ul
oil
test
; P
, pl
ugge
d (d
epth
, in
fee
t, g
iven
in p
aren
thes
is)
; R
w,
reli
ef w
ell;
SC
che
mi
ca
l an
alysi
s of
w
ater
by
S
tate
of
W
yo
min
g;
Sah
, se
ven
dra
inag
e w
ells
dri
lled
in
S
EJ4
se
c.
33,
T.
3 N
.,
R.
5 E
. no
w
aban
done
d an
d
buri
ed;
Wcs
, w
ater
lev
el i
n d
ug w
ell
abov
e su
bmer
ged
12-i
nch
casi
ng.
Wel
l N
o.
Al-
2-l
bc .
. Ib
d..
led
....
. Id
a ..
2ad_
..__
2bc_
____
2c
c._.
__
3aa
l.._
. 3
aa2
....
3ba..
Ow
ner
or te
nant
Will
iam
Gill
iland
. ...........
-..
.do
. ...
....
....
....
..V
ern
N. T
hom
as _
__
__
_ .
Yea
r dr
illed
1948
1938
19
36
1948
19
51
1942
19
42
1943
Typ
e of
wel
l
Dr
Dr
Dr
Dr
Dr
Dr J Dr
Dr
Dr
Dep
th o
f w
ell b
elow
la
nd s
ur
face
(fe
et)
318 51
.0
107 84
.0
98.5
46.0
14
.7
183 50
14
5
Dia
met
er
of w
ell
(inch
es) 4 7 8 6 8 K 6 6 7
Typ
e of
ca
sing P P P
P P
P
P
P
P
Met
hod
of
lift;
type
of
pow
er
J,E
C
y,G
C
y.E
C
y, E
, H
C
y, H
Cy,
H
N
J,E
C
y, E
C
v. E
Use
of
wat
er
D D,
S D
, S
D,
SN S 0
D
S D
. S
Mea
suri
ng p
oint
Des
crip
tio
n L Pb
L Tea
T
ea
Tea
T
ea
Tea
L L
Dis
tanc
e ab
ove
or
belo
w (
) la
nd s
ur
face
(fe
et)
0.3 .0
.4 .5
4.
0 1.
0
Alti
tude
(f
eet)
5,19
9.4
5,18
9.78
5,
152.
59
5,19
5.07
5,
196.
76
5,20
4.57
5,
171.
2 5,
220.
95
5,21
9.04
5.
207.
07
Dep
th t
o w
ater
lev
el
belo
w
mea
suri
ng
poin
t (f
eet)
82 7.75
15
.18
56.3
0 30
.67
38.3
7 17
.57
37.2
8 42
20
Dat
e of
m
easu
re
men
t
8-17
-48
8-16
-48
8-17
-48
8-17
-48
6-26
-51
1-19
-49
Rem
arks
L L SC, L
SC
L
.- ..
OS CQ
O d w O H W O
3bc .
.3
da .
. 4a
a _ ..
4ad
llaal
Ilaa
2ll
ab
12dd
____
M_
Q_A
a a
4ft
h1
4ab2
....
6cd
7a
b___
__7adl
.
7ad2
... .
7ad3 .
7bb_
_...
7cc .
7da
7d
d..
...
8bb .
_ 8bc.
....
8d
b-
13dd
l...
13dd
2.._
16bb
... .
16cc .
16
cd__
_ _
16db
l...
16db
2...
16dc
... .
16dd
l...
16dd
2.._
16dd
3._.
17aa .
17ad
....
ITba
17da .
21ab .
21da .
22ba .
22bb .
22cc
-~-
Will
iam
Gill
iland
..
B.
M. G
orum
.....
.....d
o... .
....
....
....
....
.H
. Bus
ch _
_ ..
.. ..
........
G. W
. Dav
is
. ...........
....
.do .
.. ..
. ... ..
. ...
C. B
. C
oope
r. ...............
....
-do... ..
. ...
G. W
. Dav
is. _
_ . ___ ....
B. W
. Bec
kman
..
.......
Pete
r B
usch
.. .
Har
vey
Eat
on...-
. .........
0. G
. Gri
ffey
-. ..
.......
... .
.do .
....
....
....
....
.H
enry
Hei
l... --
----
..
V
ern
Ada
ms ........
.....d
o ..
....
....
....
.. -
.. do
..... d
o.. .
.. ..
. ..
. -
..do
Ale
x H
eiL
..
. ... ..
... ..
Fran
k Sl
ater
__ .........
Pete
Hei
L ____ . ____ ...
Lew
is W
eber
..._
..........
1934
""1937""
1941
1937
1941
1943
1948
.
1936
1951
1943
1951
~"I9
34~~
~
1938
1940
1939
19
46
""1945""
1933
1943
1922
1949
1950
1943
1951
1938
19
4819
4119
4919
41
Dr
Dr
Dr
Du
Du
Dr
Dr
Dr
Dr
Dr
Dr
Dr
Dr
Dr
Dr
Dr J Dr
Dr
Dr J Dr
Dr
Dr
Dr
Du
Dr
Dr
Dr
Dr
Dr
Dr
Dr
Dr
Dr
Dr
Dr
Dr
Dr J Dr
Dr
Dr
Dr
Dr
40 41.0
42
.5
18.5
9.
5
50
100 60
272
160
200
160
150
240
150 77
.0
28.8
26
0 60
197.
0
23.0
69
.0
145
140.
0 15
0 29.5
73
0 38
0 10
3.0
365
109.
0 16
1.0
63.0
16
0.0
154
410 37
.528
5.0
350 31
.2
145
100
100
475 83
8 6 36
18 8 6 6 6 6 6 6 8 6 1H 6 5 « 5 4 4 6 6 8 6,
4 6 10 7 7 6 6 5 4 %
8,4« 6 6 6 5
P P
P
G
G P
P P P
P P P P
P P P
P
P
G P P P
P
P
P W
P
P
P
P P
P
P
P
P P
P P
P P P
P
P
P
P
Cy.
HC
, E
Cy,
H V Cy,
E
J.E
Cy.
E
Cy.
EN
Cy.
EJ,
EJ,
E
J.B
Cy.
E
N
N
Cy,
B
Cy,
H
J.E N
Cy.
H
J,E
J.
E
Cy.
E
N
Cy,
G, H
J.
B
J,E
J,
E
Cy.
E
J, B
V
Cy.
E
Cy.
E
Cy,
HC
y.E
C
y.E
N
Cy.
E
Cy,
H
Cy.
E
Cy.
B
Cv.
H
D, S
D, S
,0
D
S,0
0 D.S
D
.S D D6S
D,
SD
, S
.D
,S
D,S
D,S 0 0
D, S N
D.S 0
N
D,
S D
.S
D,
S
N S
D,
S D
,S,
0
D,
S
D.S
D
,S N
N
D, S D N D,S
D
,S 0 D,
S D
, S
D,
S D
, S
D.S
L Tea
Pb 3 L L L
T
ea L Tea
T
ea
L
L Tea
Tea
L
T
ea
L L Tw
L
L
T
ea
Tea
Pb
T
ea
Tea
L L L Tea Pb
L L
LL Tea
Pb 3 L L L Tea L Tea
T
ea
L L Tea
Tea
L Tea
L L Tw
L L Tea
Tea
Pb
T
ea
Tea
L L
.. ..
..
Tea Pb
L L L
.0
.8
.9
.3
1.5
.5 2.7
-5.3
5.7 .2 .0
1.5
1.0
-5.8
.9
.4
5.3 .6
. ..
. .
5,19
9.03
5,17
5.18
5,
201.
35
5,19
3.06
5,
155.
23
5,15
3.07
5,15
5.2
5,12
4.21
5,36
55,
254
5,35
1.8
5,17
1.52
5,16
9.55
5,15
3.58
5,15
4.85
5,
163.
5 5,
162.
31
5,13
5.10
5,13
8.8
51
70
O
Q
5,15
5.04
5,
123.
185,
160.
03
5,45
5.79
5,
456.
075,
154.
995,
126.
14
5,12
9.43
5,17
4.78
5,
150.
79
5,14
5.17
5,
162.
32
5,16
4.40
5,16
2.7
5,15
0.03
5,
130.
45,
118.
115,
122.
1
5,13
3.05
5,
096.
65
5,15
3.77
5,08
8.21
32 8.45
18
.39
9.62
7.
87
8
6-8
160 38
.85
64 12.5
522
.82
60.8
066
.70
19 9
9
45.9
7 12 80 73
.22
80 22.9
2
51.5
4 48
.03
28.1
3 52
.41
80 71
""B
O""
19.8
1
21.3
7 25 80 70
8-17
-48
8-17
-48
8-17
-48
8-17
-48
11-1
7-48
8-16
-48
3-30
-51
C
1ft
_JQ
8-16
-48
3-30
-51
81
ft
/IQ
8-16
-48
7-11
-49
8-11
-48
8-11
-48
8-11
-48
8-11
-48
8-11
-48
- ...
4-2S
H51
8-11
-48
......
GC
L SC
.L
L L L GC
L L L L L L SC
,L
178 GROUND-WATER RESOURCES, RIVERTON AREA, WYOMING
5
«+H fl)O h H)J
_g g g
I1!-'a
M S vl*- ^ *
o"^
11 '
||l
r°fi * §
fill
i!En's
i!
Owner or tenant
ll
£« 8
OO IOO rtOO OST :T IT T0 |0 00 CO
L 'T TV 700 100 COOO CO
CO 1/3 1/3 CO O OS ,_, COTH FC
wcoo oooot-
2SS3Cgt-IM «
00^0
I CO OS O t- 1/3 1/3 t-
OO W3M3 CO OOOOS
1/3./3./3W 10X3 10 T*
tx.
O
0 " S" °
w ll^l
! * 5 55°*!co JH 4.J.
t^« o oo o ^t< t*« co oo
8 CD CO OO C^ «=f i-H U3
O O t>- CD T-H
OS O ^H W3 O
^^ ** ^^
CD U3 M3 CD
^ §,_q o oo
I
I
00 CO
U3 CC
MOsS
U3U3CDCO CO t>
* *«
S
OS OO OS OS OS OS OS OS
TTTTT TTT(MOOOOO«M CO OO OO
SSS5SS SSS(M CO i-H C^ C^ C^
SSSS3 SSIS1/3 OS 1/3 t» CO -^rl OO (M CO-rHOOOOt- 1OCOO O O OS OS O O OS O
ww^.^.w lo-aoa
10<MO<M^ 0000
~7 T rt
-*- «w ^-8CQQ ^02 02 02^020202 O2O2 O2 O2O2OO2 O CQCQ
P * « O " "'Z ~O^ ~ * *Z * " tZ * * * * **Zi ^\ **P P J2J -J'-J't^ P 02 "Q P P -P QQ PQP PPjzP P QQ
SS *£S :-SsS -35-5 ^<5 -5-S "S*p^g »MM MM« «MM
06" o"0
o
QQQQQ ^QQQC
III
er
1 <
&
X
1° «
a £
4
1C
1<M
Roy Hendrickson __ .. _ ... Bert Brasket. ... _ . __ .
Elmer Farrans
ui-O T: cg^^SC^ C^ C^l
mi
U.S. Geological Survey _ .... Evelyn Delfelder- __ ......
R. M. Pickett _______ ..
Devere Trimmer... ---------
V. M Millpr
1
^P O O "^ O CD CD
QQQQQ QQQQC
II 1
*c g*^53 m
pj pJH a E .Oe o H "'^«l 1 a
0^2^:= Jo*c °^S|| ^1"
^^Q^ rt «
Id^l 1111
&
*v«» »»*»» »»»
T ^^ "
CO OOW31/3 1/3
C<|Sr.C4 CO<Mr-IW3M3 I>- OO
QQOO QQQQQ OOP
(M OSOS
1
1
^
1
1
1i z
&CC
1
!=
,J-CT3S
c
c
! T3TJ ( (M(MC'
CO S S » »
!g>c<-
_ |, ^ |
5 5 5 tS = s P ,s Qfr o 5g-SZyste ^&-§J WSP= J c8 ooo t?c
Jllll III
pi.s+3
§ O
t3
1 42
t3 5-
^
llaa
L.-
Ilaa2
Ilaa3
Ilaa
4...
lladl.
..Il
ad2_
_.ll
cb._
_.
lldd .
12ac
- 1
2b
bl
12bb
2_._
12bd
..._
12ca
_ 12
cc
12dc
_.__
13ad
.._.
13ba
..__
13bc
....
13cc
_...
13db
_._.
13dc
l.__
13dc
2._.
14cd
_...
ISadl
15ad
2...
15bb
l._.
15bb
2...
15
bd
.15
ccl
15cc
2__-
ISdd
l...
15dd
2__.
15
dd
3
16
aal
16aa
2._.
16bd
...
16cd
16da
_16
dd...
.17ddl
17dd
2...
18cb .
20dd .
..... d
o.. .
..................
.. ..
.do..
.. ...
....
....
....
..
. do
.
....
_ ..
. .
.
0. W
. Nic
hols
on ........ .
...
Del
feld
er H
alL
... ..
.........
do
..
.
0. W
. Nic
hols
on.
.. ...
....
. d
O
do
BiU
Tod
d... - . ..
d
o
J. R
. P
itts
-.
..-.
-.--
-. -d
o -....
do
- -
d
o
.....do
U.S
. G
eolo
gica
l Sur
vey _
_ ..
.
....-d
o.. ..
. .... .
.. ..
.
Fred
W.
Lyt
le. .
..... _
_ ..
C. E
. Bar
nes
. ..
_ ..
.....
. d
o... .
.. .
R.
L. P
ost
er....... -..
1910
1950
1951
1910
(?)
1926
1919
1944
1946
1942
1916
(?)
1933
1932
1907
(?)
1935
(?)
1933
1908
1942
1951
19
44
1929
(?)
1946
1950
Dr
Du
Dr J Dr
Dr
Dr
Dr
Dr
Dr
Dr
Dr
Dr
Dr
Dr
Sp Dr
Dr
Dr
SP SP Sp Dr
Dr
Dr
Dr
Dr
Dr
Du
Dr
Dr
Dr
Dr J Dr
Dr
Dr
Dr
Dr
Du
Dr
Dr
Dr
30.5
15 84 22.0
57 18.3
300
(?)
55.6
67.0
39.8
102.
065 92
.564
.071
.0
13.5
160
310
132.
025
015
048
012
0 59 13 4
416 36 0
165 26
3
290
150
200
250
118.
05.
424
.576
.0
600
210
36 7-4
^ « 6 6 6 6 6 4 6 6 6 6 8 6 86,
4 6 8(?) 8 8
6,4 6 42 6 6 4 6 « 6 4 6 6
26x2
6 5 5 8 5
P N P P P P P P P P P P P P P P P P P P P P P C P P P P P
P P P P P W P P P P
Cy,
HC
y, H
J, E N
Cy,
EC
y.H
Cy,
HC
y, H N
Cy,
HJ,
E
Cy,
HC
y, H
Cy,
H D N
Cy,
EF,
J,
EN
P(8
)
J,E
J, E
J, E
J, E
Cy,
H
J, E N J, E N
Cy,
E N
J, E N
Cy,
H NC
y, H N
Cv.
E
D,
SN D,
S0 D D,S D N D,S 0 D D,S D 0 D N D,S
D,
S
D S
D,
SD
, S
D D D D,S N D.S 0 D,
S0
D,
SN D,
S
D,
SS S
S, 0 N PS
,D
.S
Bp
Pb L L Tpl Pb Pb Hpc
Tea Bpl Pb Tea
Tea
Hpc L Be L Tea
T
eaL L L
1.1 .6
3.6
1.7 .7 1.2
2.5 .2 .6 .7 .4
-1.5 2.7
-5.2
-4.0 1.1 .3 .1
3.7
-5.5 1.
6 .7 1.0
4,93
5.68
4,93
8.45
4,93
64,
938.
34,
925.
774,
930.
114,
963.
61
4,91
8.34
4,90
2.69
4,93
5.56
4,90
6.21
4,90
3.60
4,91
5.57
4,88
0.56
4,89
9.50
4,90
5.57
4,89
3.40
4,85
9.71
4,92
1.58
4,96
7.31
5,05
8.00
5,05
5.35
4,99
5.04
5,02
8.27
4,95
9.30
4,96
1.6
5,06
3.30
5,04
6.06
5,03
1.06
5,13
0.32
5,45
2.3
8.98
9.22
15 14.6
25 f>
97
35.2
3
16.7
412
.80
6.71
10
SO
5 12.8
017
.47
7 50
7.38
14.8
4
17.4
8
14.9
848
.70
45 4.75
50 80 5.42
9.33
54
.36
50 34.5
9.7
07.
19
400
160
3-30
-51
6-24
-49
6-28
-49
6-27
-49
6-24
-49
7 1
f\_
4Q8-
8-4
8
6-24
-49
10-2
1-48
6-27
-49
6-27
-49
6-27
-49
6-28
-49.
7- 6
-49
7- 7
-49
11-1
7-49
3-30
-51
7- 6
-49
7- 7
-49
7- 7
-49
7- 7
-49
GC
Ff P17
TABL
E 18 R
ecor
ds o
f w
ells
and
spri
ngs
Con
tinu
ed00 o
Wel
l N
o.
Al-
4-21
ca-_
-.21da .
21db .
21ddl
21dd
2...
99
22ad
_
22bc
22cb
--._
22cc
....
22cd
22da
l_._
22da
2...
23ab .
23cd .
23db .
23dd _
24ca.
24cb
-.-
24cd
l...
24cd
2._.
24da .
24dd
....
25ab
-_-
25ac
__
25bb _
25cb .
25dc_
25dd.
26ab
....
26ac .
26bal
Ow
ner
or t
enan
t
B. B
eck.
.. .-
- ..
..
.....d
o-.
.. ..
....
....
....
.. ..d
o -. .
J. E
kman
--
----
----
--- _
-W
m W
ood
W.J
.Web
b..- .
.. do
do.
..... d
o ..
.
..... d
o ...
J.L
. S
elby
.. ._
_.__
J. E
. GeB
lin
..
. ... ...
.
__
do ..
...................
Cec
il W
ood..
....
...........
Yea
r dr
illed
1935
19
15
1945
1919
1941
1945
(?)
1951
1910
(?)
19
39
1939
1939
19
47
1946
1948
1921
(?)
19
45
1933
19
39
Typ
e of
wel
l
Dr
Dr
Dr
Dr
Dr
Dr
Dr
Dr
Dr
Dr
Dr
Dr
Dr
Dr
Dr
Dr
Dr
Dr
Dr
Dr
Dr
Dr
Dr
Sp S Dr
Du
Dr
Du
Dr
Dep
th o
f w
ell b
elow
la
nd s
ur
face
(fe
et)
450
180
400 66
36
.2
169 40
(?)
500 25
.4
53
90-1
00
212 59
.0
150
200
(?)
125 40 180 65
28
.0
69.0
10
0 98.0
100 9.
5 64
11
.5
200+
Dia
met
er
of w
ell
(inch
es) 5 5 5 7
10,6
5 5 5 4 5
6,4 6
6,8 8 4 4
6,2 8 4 4 6
12.8 6 6
24 6
Typ
e of
ca
sing P P P P P P P P P P P P P P P P P P P P P P P P G
P G
P
Met
hod
of
lift;
type
of
pow
er
Cy,
E
Cy,
E
Cy,
E
Cy,
H
Cy,
E
J,E
C
y,E
C
y, E
, G
Cy,
H
Cy,
H
J, E
C
y, E
J,
E w J,E
J,
E
Cy,
H
F,J
,E
J, E
C
y,H
J,
E
Cy,
H N J, E
Cy,
E F N
, H
J,
E
N
Cy,
E
Use
of
wat
er
D,S
D
D
, S
D,
S D
, S
D,
S S
D,S
D,
S D
D
, S
S D D
In
D,
S D
, S
0 D D,
S S D
D
, S
N D,
S D N
D
, S
D,
S N
D
, S
Mea
suri
ng p
oint
Des
crip
tio
n
Tea L Tpl
T
ea
L L Tea
Tea Tea
L L Tea L Pb
T
ea
Tpl
Tea L Tea
L Tea
T
ea
Dis
tanc
e ab
ove
or
belo
w (
)
land
sur
fa
ce (
feet
)
-3.0 .4
_ 2 .4 .2
.4 .4 .9
-1.0
.8
2.5
1.0
1.5 .7
Alti
tude
(fee
t)
5,08
9.17
5,08
6.04
5,08
4.83
5,
038.
63
4,95
5.78
5,02
8.94
-
4,94
9.88
4,92
1.11
4,
938.
4 4,
930.
79
4,88
1.80
4,89
5.26
4,89
5.85
4,
889.
67
4,88
4.75
4,
864.
08
4,87
3.71
4,91
5.93
4,87
9.22
4,
931.
93
4,94
3.00
4,
944.
39
Dep
th to
wat
er l
evel
be
low
m
easu
ring
poin
t (f
eet)
108.
00
100-
125
16.0
2 8.
70
9 40 9.97
5.37
15.4
8 20
20 3.
77
10 6.87
1.
89
5.54
2.54
15 7.70
5 2.
69
7.98
Dat
e of
m
easu
re
men
t
7- 8
-49
7- 8
-49
7- 8
-49
7- 8
-49
7-11
-49
7-11
-49
7-15
-48
7- 8
-49
7- 8
-49
7- 8
-49
7- 8
-49
7-12
-49
7-11
-49
7-11
-49
Rem
arks
L SC
L GC
Ff Ot
Ff
26ba
2...
26bc
26
dc
27aa
l...
27aa
2...
27aa
3...
27aa
4...
27aa
5...
27
ab
27
adl.
..
27ad
2...
27ad
3...
27bb
l...
27bb
2...
27bo
_ .
27bd
l...
27bd
2...
27ca
l...
27ca
2...
27ca
3.-
27ca
4...
27cb
l...
27cb
2...
27cd
l...
27cd
2...
27da
l 27
da2.
..
27da
3...
27db .
27
dc
27dd
_...
28aa
l...
28aa
2...
28aa
3...
28aa
4
28
ab....
28
ad....
28ba
l...
28ba
2...
28od
....
28
da.
...
28dc
l...
.....d
o
Cec
il W
ood .
....
....
....
....
Ear
l Sul
liva
n... ............
C. E
. Log
an..
C. E
. M
atte
son.
. _ ..
. __
__ do
.....................
Ber
tha
Ber
lin _
....
_ ..
...
E.T
.Abra
.. ...
....
. .......
Geo
. Nei
berg
er, J
r.. .
........
P. M
. Dra
ke.
....
... _
_ ..
.
.....d
o....
. ...
....
....
....
.C
. E. B
arne
s ...
. .
....
..
.....d
o..
..
. ... ..
...
Euge
ne G
asse
l. ..
....
....
...
C. W
itt A
nder
son.
.. _ . ....
Lesl
ie M
ajor
.. ..
....
L.E
. P
eck...... ..
....
....
..
1946
1949
1947
1946
1946
1948
1949
1913
19
4819
4919
4819
46
1945
1936
(?)
1918
1949
1947
1947
1910
1915
1947
1947
1942
""1956""
1951
1948
""1
94
7""
1945
1919
Dr
Dr
Dr
Dr
Dr
Dr
Dr
Dr
Dr
Dr
Dr
Dr
Du
Dr
Dr
Dr
Dr
Dr
Dr
Dr
Dr
Du
Dr
Dr
Dr
Dr
Dr
Dr
Dr
Dr
Dr
Dr
Du
Dr
Dr J Dr
Du Dr
Dr
Dr
Dr
242
500
135 90 300
285
260
219
160 91
197 9
190
180
150
190 75
.012
9.0
98.0
166 9.
518
564
510
8.5
124.
5
76.0
585
600 22
.0 9 76.5
21
7 9.2
200 24
.0
234
128.
0
176
206
6 8 4 5 4 5 5 412
,6 4 6 4 IS 8,6
8,6
10,6 6 4 4 4
8,6
48x4
86,
414
, 10
, 8 5
7,4 4
10,8
10,8
12.8 12 4 6 s/c
10,6 10
6 5 8 6
P P P P P P P P P P P P P P P P P P P P W P P P P P P P P P P P P C P P P P
JN J, E
J, E
J, E
Cy,
H
J, E
J, E
J, E
Cy,
H N J,E
J.E
J, E
J, E
J, E
J,E
Cy,
E
Cy,
HC
y, H
J, E
T,
EC
y.E
J,E
T, E N
Cy,
HC
y, E
Cy,
HJ,
ET
.G
T,E
J,E
J,E
Cy,
H
J,E N J,E N J.E
J, E
Cy.
EJ,
E
JN
D D,
SD N D D D D D D D D,
SD
, S
D,
S
D,
SD
, S
D,
0D D D S D PS 0 S D N D PS PS D,S D S
D.S 0 D 0 D, S
D,
S
D,
SD
, S,
In
L Tea
L L L L L L Tea L L L L L L Tea
T
pl
Tea L L L Tea
Tea
Tea L Tea
L Tea
L Tea
L L
L Tea
L L
-4.0
-3.6 1.
5
-7.3 .4
.2
-1
.0 .8 .1 2.0 .7
.0 (
12")
.8
(8
") .2
4.0 .6
-6.0
4,94
9.74
4,93
3.66
4,
953
374,
949.
88
4,95
24,
951.
40
4,96
1.4
4,95
6.44
4,97
3.21
4,95
9.11
5,02
2.37
5,02
2.29
5,01
5.18
4,98
4.62
4,
999.
764,
989.
87
5,00
0.70
4,
999.
56
5,00
9.9
5,01
0.88
5,01
5.71
4,98
3.37
4,98
5.68
4,95
7.29
4,96
9.77
4Q
CQ
Q
fl
4,95
4.93
5,02
8.09
5,05
3.08
5,
053
5,06
2.2
5,02
5.39
5,06
3.36
5,
063.
365,
045.
43
5,02
5.79
5.03
8.36
60 7.55
35 12 30 55 55 7 72
.87
15-2
030 5 45 5.
4245 9.
30
34.1
0 30
.00
50 7.89
45 35 39.2
2
4.27
(7")
71
.00(
4")
26.8
0
27 2.16
7.74
6 14
.19
84 11.2
3 45 13
.50
60 4.05
10 10
7-12
-49
7-12
-49
7-12
-49
7-12
-49
7-12
-49
7-12
-49
7-14
-49
7-12
-49
7-12
-49
7-11
-49
7- 8
-49
7- 1
-51
7-J
W9
7-14
-49
P L L SC, L
L L L L Mbe
L L L L GO
, L
L L L SC
o "3 CO 00
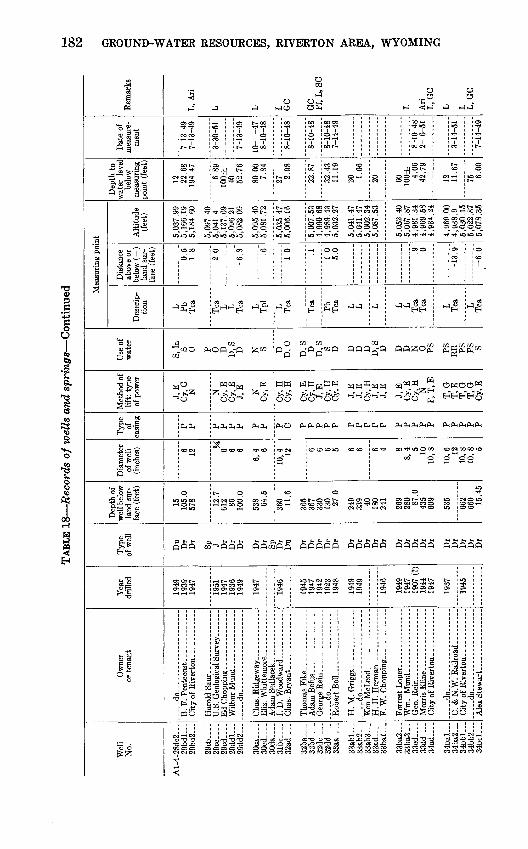
TABL
E 18 R
ecor
ds o
f wel
ls a
nd s
pri
ngs
Con
tinue
d
Wel
l N
o.
Al-
4-28
dc2-
__29bdl
29bd2
29
cb-_
.
29cd_
29ddl
29
dd2.
..
30
cd--
_3
0d
a -
32ad
...
32ba
32
bd
- -
32dd
...
33abl
33ab3
33ad
33bal
...
33ba2
33cd
---
33dd
34
ad._
-
34ba
l.__
34ba
2___
34bbl
3
4b
b2
34
bcl._
-
Ow
ner
or t
enan
t
_
do
- -
.....d
o.
...... --
---
Rob
ert B
ell
--
----
----
--
__
.-d
O---------------.-
.
d
o
---- .
C.
& N
.W.
Rai
lroa
d. ...
....
.
Ale
xSte
war
t ..
.-. ..
Yea
r dr
illed
1949
19
39
1947
1951
19
47
1936
19
49
1947
1946
1945
19
47
1942
19
23
1948
1949
19
49
1946
1949
19
47
1907
(?)
19
44
1947
1937
""
"194
5"""
Typ
e of
wel
l
Du
Dr
Dr
SP
J Dr
Dr
Dr
Dr
Dr
SP
Dr
Du
Dr
Dr
Dr
Dr
Dr
Dr
Dr
Dr
Dr
Dr
Dr
Dr
Dr
Dr
Dr
Dr
Dr
Dr
Dr
Dr
Dep
th o
f w
ell b
elow
la
nd s
ur
face
(fe
et)
15
105.
057
8 12.7
61
2 86
100.
0
538 64
.5
360 11
.6
365
367
330
130 27
.0
249
339 40
18
0 24
1
269
280 87
.0
435
609
535
""662""
660 15
.45
Dia
met
er
of w
ell
(inc
hes) 6 12
H 6 6 6
6,4
6
10,
4 12 6 6 6 5 6 6 6 4 8 8,4
5 10
10,8
10,6
12
10
, 8
10,8
5
Typ
e of
ca
sing P
P P
P
P
P P
P P C P P P P P P P P P P P P P P P P P P P P
Met
hod
of
lift:
type
of
pow
er
J, E
C
y.G
N N
Cy,
E
Cy.E
J,
E N
Cy.
B
Cy,
H
Cy,
H
Cy,
E
Cy.H
J,
E
Cy.H
C
y, E
J,E
J,
E
Cy,
H
J,E
J,
E
J, E
C
y.E
C
y, H
N
F
.T.E
T,
G
T,
E
T,G
T
,G
Cy,
E
Use
of
wat
er
S, I
n S 0 p 0
D
D,
S D N
S D
D.O
D,
S D
D
,S
S D D
D
D
D,
S D D
D N
0
PS
PS
R
R PS
P
S s
Mea
suri
ng p
oint
Des
crip
ti
on L Pb
Tea
Tea
L
L Tea L
Tpl L Tea
Tea Pb
Tea L
L L L
L
Tea
T
ea L
Tea L
Tea
Dis
tanc
e ab
ove
or
belo
w (
)
land
sur
fa
ce (
feet
)
0.5
1.8
2 0
-6.8 .6
1 0 .1 1 6
5.0 .9
.0
-13.9
-6.0
Alt
itud
e(f
eet)
5,03
7.99
5,
166.
19
5,18
4.60
5,09
7.40
5,04
1.4
5,13
7.69
5,
096.
21
5,08
2.09
5,09
5.40
5,
081.
72
5,03
5 47
5,
006.
16
5,00
7.53
4,
990
68
4,98
9.43
5,
032.
27
5,04
1.47
5,
041.
47
5,00
2.34
5,08
7.53
5,05
2.40
5,
067.
87
4,98
1.34
4,
969.
58
4,93
4.24
4,96
9.00
4,
938.
9 5,
030.
155,
022.
87
5,07
8.35
Dep
th t
o w
ater
lev
el
belo
w
mea
suri
ng
poin
t (f
eet)
12
22.6
8 19
4.47
6.89
10
0±
40
52.7
6
80 0
07.
84
27 2.98
22.8
7
32.4
3 11
.19
20 1.06
20 60
100±
4.
06
42.7
9
12
11.6
7
75 6.00
Dat
e of
m
easu
re
men
t
7-13
-49
7-13
-49
3-30
-51
7-13
-49
10-
-47
8-10
-48
8-10
-48
8-10
-48
8-10
-48
7-14
-49
8-10
-48
2- 6
-51
3-14
-51
7-14
-49
Rem
arks
L,
Ari
L L L
GC
GC Ff, L
, SC
L Ari
L
, G
C
L L L, G
C
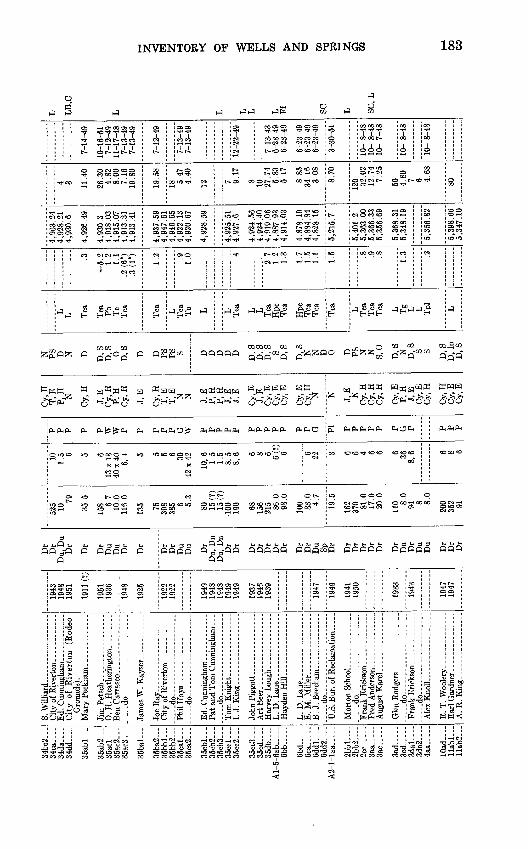
34bc
2...
34
ca
34da_
3
4d
d .
35abl
35ab
2
35acl
35bal
35ba
2...
35bbl
35bb
2___
35cal
35ca
2
35cbl
35
cb2_
--
35
cb3
35
ccl
35cc
2___
35cc
3---
35
cd--
35db_
Al-
5-6a
b__-
-6bb
6bd_
-_-
6ca_
_ _
6ddl
6
dd
2
A2
-l-l
aa
2bbl-
2bb2.
3aa
- _
Sac .
....
3ad..
3cd
3dal
-3
da2
....
lOad
llabl
Ilab2
Cit
y of
Riv
erto
n (R
odeo
G
roun
ds).
. do
Jam
es W
. K
ay
ser
..
Joe
Ray
..--
-- --
_
____
_
Phil
Hay
s. ._
._
____
_
Ed.
Cun
ning
ham
Pat
and
Tom
Cun
ning
ham
. . .
... .
.do .-
.
Tom
Kni
ght.
.. .............
I.J.
Kin
g- ........
Har
vey
Lou
gh. -. _
____
Hay
den H
ill-
......... .
E.
M. M
ille
r.. ..
. .
..... d
o
U.S
. Bur
. of R
ecla
mat
ion _ ..
... -
do
..... ..
. ..
....
. do
.
.... .
...
.A
lex
Knoll
. .
....
. ......
E.
T.
Wb
ok
ry.... ..........
A.R
.Kin
g
1943
1948
1951
1911
(?)
1951
1936
1948
1925
"1922""
"
1922
1949
19
48
1948
1949
19
49
1937
1946
1939
1947
1949
1941
1950
1933
1943
1947
19
47
Dr
DrDu
, Dn
Dr Dr Dr
Du
Du
Dr Dr Dr
Dr
Du
Du Dr
Du, Dn
Du, Dn
Dr Dr Dr
Dr
Dr
Dr
Dr Dr
Dr
Du Dr
Dr
Dr
Dr
Dr Dr
Du
Dr
Du
Du Dr
Dr
Dr
KO
K 1079
35.5
158 6.
7 10
.0
116.
0
135 75 398
385 6 5.
3
80 15(?
)15
(?)
100
190 68 156
215 86
.0
98.0
100 83
.0
4.7
19.5
162
370 81
.0
17.0
20
.0
110 8.
0 94 8 8.
0
200
QK
O 91
10 1.5 6 5 6
13x1
3 40
x40
6,4 5 5 5 6 30
10,6 1 5
1.5
8,5
8,6 6 8 6 6(
?)
6 6 22 3 6 6 4 6 6 6 36
8,6 6 8 6
P P P P P W
W
P P P P P G
W P P P P P P P P P P P P G PI
P P P P P P G P P P P
Cy,
HT
, E
P, H N
Cy,
H
J, E
C
y,H
P,
H
Cy,
H
J, E
Cy.
H
T,
ET
, E
N
N J, E
P, H
P, H
J, E
J, E
Cy,
EJ,
EC
y.E
C
y, E
C
y, E
Cy,
EC
y, H N N
J,E N
Cy,
H
Cy,
H
Cy,
H
Cy,
EP,
H
J, E
Cy,
EC
y.H
Cy.
HC
y,E
Cv.
E
N PS D N D D,
S D
, S
0 D,
S
D D PS PS S D D D D D
D,
SD
, S
D,
S S
D,
S
D,
SN
N
D 0 D PS N
N
S,
0
D,
SN
D
, S
S S
D,S
D.I
nD
. S
L L Tea
Tea
Pb
Tc
T
ea
Tea L Tea
Tc L L Tea
L L Tea
H
pc
Tea
Hpc
Tea
T
ea Tea L Tea
T
ea
Tea L Tg L L Tpl L
.3
-5.2
1.
2 1.
1.2
(6"
) .3
(4"
)
1.2 .9
1.
0 .4
2.7
1.2
1.3
1.7
1.5
1.1
1.5 .8
.9
.8 1.3 .2
4,96
3.24
4,92
8.21
4,93
0.6
4,92
6.49
4,93
0.3
4,91
8.03
4,
915.
07
4,91
3.31
4,
913.
41
4,93
7.59
4,
947.
614,
946.
654,
922.
13
4,92
0.67
4,92
8.59
4,92
5.51
4,92
7.6
4,92
4.56
4,92
4.40
4,91
9.06
4,
887.
93
4,91
4.03
4,87
8.19
4,88
4.84
4,
828.
15
5,21
5.7
5,40
1.2
5,36
3.00
5,
366.
33
5,35
6.69
5,36
8.31
5,34
8.19
5,35
6.82
5,39
8.66
5.34
7.10
4 3 11.4
0
26.3
0 4.
82
8.00
7.
16
19.8
0
19.5
8
18 5.47
4.
40
12 7 9.17
8 10 27.7
4 5.
83
5.17
8.85
34.1
6 3.
08
8.70
120 32
.02
12.7
4 7.
25
50 4.80 7 6 4.68
80
7-14
-49
10-1
6-51
7-
12-4
9 11
-17-
48
7-13
-49
7-13
-49
7-12
-49
7-13
-49
7-13
-49
12-2
2-49
7-13
-43
6-23
-49
6-23
-49
6-23
-49
6-23
-49
6-23
-49
3-30
-51
10-
8-48
10
- 8-
48
10-
7-48
10-
8-48
10-
8-48
L LB
.C
L L L L L Ff SC L SC, L
00
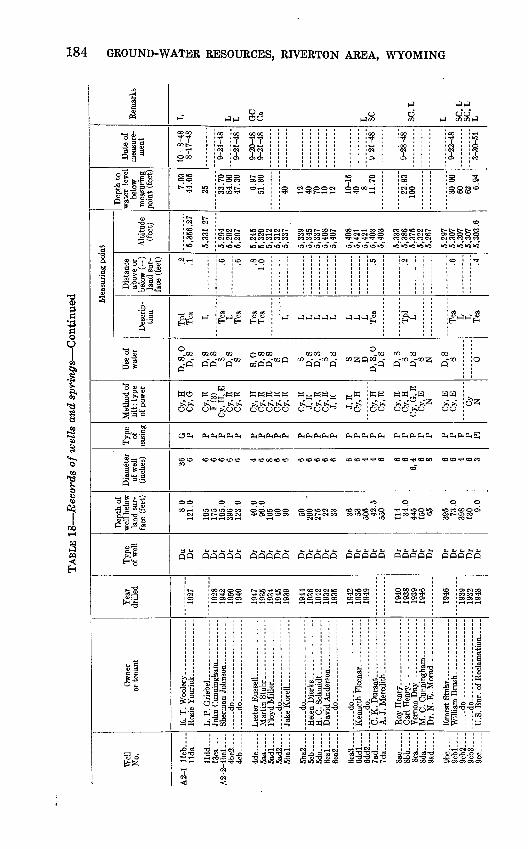
184 GROUND-WATER RESOURCES, RIVERTON AREA, WYOMING
1
1
Hi*&' ' o £3^-
is^ <~ao ^~. , ^-. a S S 1 ^ "S
S0.
I.I
"S S3
|f{
>/c5'53
t-,
111
11
H
Owner or tenant
u
OcaJ JJ OO
oo oo
ooo
^3 "^
c5 *"
10 CO CO CO
IO 10
' s J
oo too oooo
COOO -^ IO
(MC^S CNICOK
IOWW WW«
CO CO OOO
w «o
.GQ CQCQ OQ ° S
CO
w
O 0 m'm'j
ooT
o w ooo «
B' iiSISW WIOW10W
10 o
iooo,-i
=><M(MOO «
IO IO IO IO kO iO
>o
- 1GQOQ GQCO OQ
- -OQ Q CO - "COQQ " QQ Q
J
scio(MO
COIOCoo i>. eCO CO O
IO
-^o
-OQ GQ GQJZlQCQ - -OQ
Q° °
H 'MO fH-~- -HH MHHHH HraHH^i rviW !W
OO O^ £OO OOOOO O'-'OO'^
C5P4 P4P4pHpHPLI FL,
COCO CO CO CO CO CO ^
PL, PH PL, PL, PL, PL, PL, PL, PL,
CDOOCOCO COCDCDCDCO
oo o o ooOO T ( IO IO IO CO CO O O IO O O O O IO CXI CO
CXI o t*- O O5 CN ^t< C35 CO CO O5 lOOr-CXICO
QQ QQQQQ QQQQQ QQQQQ
S
ill t£t2 oH'5 PL,
S
O CXI O O l>- IO ^f IO O5 ^ CO CXI CXI IO
^"o idH HB
oo 3-30-51
logo
CO
to 10 10 10 wMO
£-1GQ GQ
-GQ iZ -GQQ Q
P£l P£IP£I
tt .^ . .
O
*H-r
>i >i >> . >>^ >> >> o o oo >>o oo
S
<O
CD CO »O (M
o o o
QQQQQ QQQQQ QQQQQ
esuocn
J ohn Cunnmgnam. ---------- Sherman Johnson ........ do----.----- -
<?! i <MS o o coXJXJf-H ^* 'f
4
1
rs e.* ^
Martin Stuhr. -------------
Plnir^ A^;ilor.
CS I 1OU
T
k5J
5 c^ >»^ c ^ -o a.^rS-cI -s^gS WWQ
IX! .Q'ljTS S S 5lO IO IO IO CO CO
- do ---------- Kenneth Fleenar---- .. -do--- -.
C. K.Durant.. -.---- -..-
liiiCO COCO t-
ooc OiCO CO Oi(MOO
i i§ t?>-» g -< ff
=3 C T3 0 t^ O!
>C
II
1J^
>£
1 §>
aoo
S 1*8 e J!*; g.Jj^ -
SQ II
J] i
... ..ao....... ------- -.- U.S. Bur. of Reckmation
II
1
I
9H
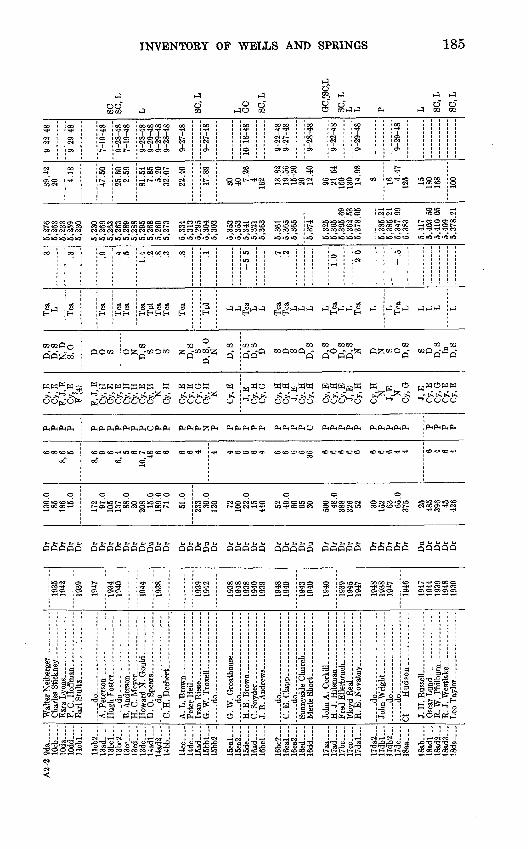
A2
-2-9
da
-lO
cb-.
- lO
da...
. 10dd_
llcb
l-.
Ilcb
2
13ad
. ..
13bel
13bc2
1
3cc
13
cd
13de
.14adl
14ad
2
14bb
..._
14ce
_
14dc
15ad
....
15bb
l...
15bb2
ISca
l...
15ca
2
15dc
16ad
....
16
bcl
16bc2
16cal
16
ca2.
_,16
cd-.
_.1
6d
d
17aa
.._.
17ad
17
be
17cc
17da
l___
17da2
17
dbl.
..17db2
17dc .
18aa
18
ab....
18adl
18ad
2-._
18ad
3...
18da .
Cha
rles
Stic
kney
_
-
Ezr
a Ly
ons _
___
.___
___-
.
do
--.do--- - -
H.
C.M
ey
er.
.. .... .
C. H
. D
ech
ert
----
...
....
Pete
r H
eiL
... .... ....-..
G W
Tro
xell
..... d
o . _ - ..
do ___ ... - - ------
do
- .-
-.C
.B.
Cla
pp. _
__
do.
- -
- .
do
- --
-.
J. H
. Ku
ssel
l.. ..... ......
R.W
. Ph
ilbur
n- ...
....
.E
. J.
Wes
tkke
--.. --
----
--
Leo
Tay
lor-
. ---
----
--
1935
19
42
1939
1947
1934
1940
1944
1938
1939
1CU
9
1938
1948
1938
1940
1939
1948
1940
1943
1940
1940
1939
1945
1947
1948
1938
1947
1946
1947
1944
1939
1948
19
39
Dr
Dr
Dr
Dr
Dr
Dr
Dr
Dr
Dr
Dr
Dr
Dr
Du Dr
Dr
Dr
Dr
Dr
Du
Dr
Dr
Dr
Dr
Dr
Dr
Dr
Dr
Dr
Dr
Du
Dr
Dr
Dr
Dr
Dr
Dr
Dr
Dr
Dr
Dr
Du Dr
Dr
Dr
Dr
130.
085
18
6 15.0
172 97
.010
513
7 88.0
20 208 15
.018
9.0
71.0
51.0
233 30
.012
0 72 100 22
.015 440 52 49
.0
60 65 30 500 48
.038
832
6 52 30 152 63 65
.037
5 25 485
396 45
426
6 8 8,
6 5
8,6 9 6
6,4 5 6
10,7 48 6 6 6 6 4 4 4 6 6 6 4 6 6 6 6 36 6 6 6 6 6 6 6 6 4 4 6 4 6 4
P P P P P P P P P P P C P P P P P N P P P P P P P P
P P C P P P P P P P P P P P P P P
Cy,
E
Cy,
EF
,J,
EC
y, E
F(4
)
F,J
, E
Cy,
H
Cy,
EC
y, E
Cy,
H
Cy,
HC
y.E
C
y, H
N
C
y, H
Cy,
E
Cy,
EC
y, G
Cy.
HN
Cy,
E
J, E
C
y, H
Cy.
G
Cy,
H
Cy,
H
J,E
Cy.
HC
y, H
Cy.
EC
y,H
C
y, E
J, E
Cy,
H
Cy,
HN J, E N
C
y,G
J, E
Cy.
EC
y, G
Cy,
EC
y, E
D,S
D
,SN
, D
8,0 D 0 S 0 N D,
SS 0 S N
D
, S
SD
, S,
0N D,
S
D,
S D
, S
D S D S D D,S
D,
S0
D,
SD
, S
N
D N S 0
D.
S
S D D,
SIn D,S
Tea
L Tea
Tea
Tea
Tea
Tea
T
pl
Tea
T
ea
Tea Tpl L L Tea
L L Tea
T
ea
L L L L Tea
L L Tea
L L Tea
L L L L L
.3 .3 .9 .4 .5
1.4 .2
.8
.3 .8 .1
-5 5 .7
.2
1.0 2.0
-.5
5,27
6 5,
263
5,23
35,
259
5,23
0
5,23
05,
269
5,26
35,
263
5,28
95,
288
5,29
5 5,
268
5,26
9 5,
273
5,33
4 5,
313
5,29
55,
304
5,30
3
5,35
35,
353
5,34
1 5,
321
5,36
3
5,36
1 5,
365
5,36
5
5,37
4
5,32
55,
365
5,39
5.69
5,36
2.53
5,37
8.05
5,38
5.21
5,38
5.21
5,34
7 99
5,
383
5,41
75,
403.
595,
410
055,
409
5,37
8.21
39.4
2 20 4.
18
47.5
0
25.6
02.
59
81.5
4 7.
85
5.20
32
.07
22.4
0
17.8
9
30 40 7.26
416
2 13.8
2 19
.56
15-2
020 12
.40
96 21.5
4 16
013
0 14.9
8
8 16 4.47
12
5 15 180
168
100
9-22
-48
9-29
-48
7-19
-48
9-28
-48
7-19
-48
9-28
-48
9-29
-48
9-29
-48
9-28
-48
9-27
-48
9-27
-48
10-1
8-48
9-22
-48
9-27
-48
9-28
-48
9-22
-48
9-29
-48
9-29
-48
SC SC
.L
L SC
.L
L GC
SC
,L
GC
.'SC
.L
SC, L
L L P L SC
.L
SC
.L00
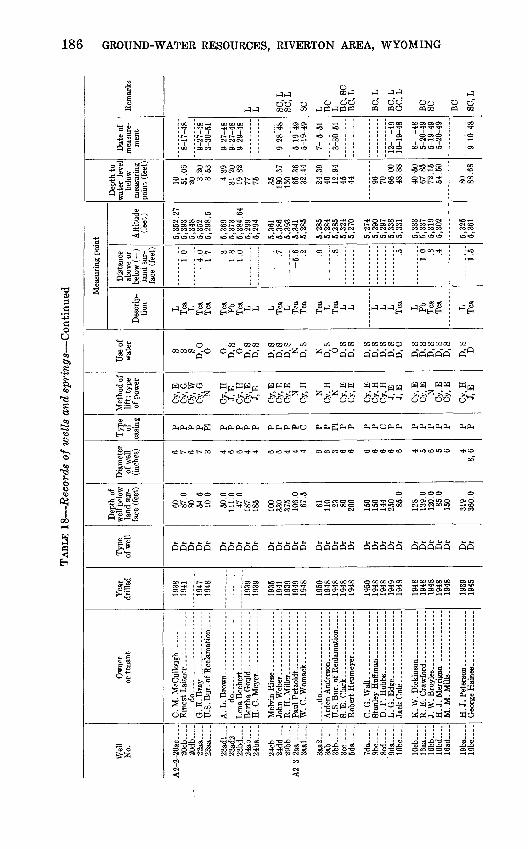
TABL
E 1
8 R
ecor
ds o
f w
ells
and
spri
ngs
Con
tinu
ed
Wel
l N
o.
A o
O
9f
lar>
20cb
.-._
20db .
22aa
..._
23aa
._--
23
ad
l 23
ad2-
.23bd .
24ab .
24cb -
24dd
_...
29bb .
3aal
_
3ab
~3
bb
..
3cc
5d
a -
7da_
_8bc.
.-_
8cd
..
9d
a -
10
bc~_
_
10cb
..._
16bb _
16bd
._._
16ad .
19ba
-.._
19bc.
Ow
ner
or te
nant
C. M
. M
cCul
loug
h ..........
Ern
est L
aitn
er. .
. ---
----
----
.....d
o....
.......... ...
....
G.
E.B
ray.
_ ,-
__..
.......
U.S
. Bur
. of R
ecla
mat
ion _
.-
..... d
o .
...
....
....
...
...
H.
C.M
eyer
.... .
....
....
...
R.H
. M
iller
. ..
- ..
....
W.
C.W
omac
k....
_ ......
.....d
o....
....
....
... ......
U.S
. Bur
. of
Rec
lam
atio
n .-
S.E
. C
lark
.. ..
....
....
....
.
C.G
.WaU
-.. --- ......
D.
F. H
obbs
... .............
L. G
. Edg
e.-
..--
-.--
--...-
.
R. E
. C
raw
ford
... _
___ ...
J. W
. Bro
yle
s...
....
. _ ...
.
M.
M. M
ills
. .-...-
Yea
r dr
iUed
1938
19
41
1947
19
48
1939
19
39
1935
19
41
1939
19
49
1948
1950
19
48
1948
19
48
1948
1950
19
48
1948
19
49
1948
1948
19
48
1948
19
48
1948
1939
19
45
Typ
e of
wel
l
Dr
Dr
Dr
Dr
Dr
Dr
Dr
Dr
Dr
Dr
Dr
Dr
Dr
Dr
Dr
Dr
Dr
Dr
Dr
Dr
Dr
Dr
Dr
Dr
Dr
Dr
Dr
Dr
Dr
Dr
Dr
Dr
Dep
th o
f w
ell b
elow
la
nd s
ur
face
(fe
et)
60
87.0
80
54
.5
10.0
50.0
11
1.0
47.0
187
185
100
330
375
106.
0 67
.5
61
110 23
80
20
0
150
150
144
250 85
.0
128
139.
0 12
0.0
85.0
15
0
319
360.
0
Dia
met
er
of w
ell
(inch
es) 6 7 6 7 3 4 6 6 4 4 6 6 4 4 4 6 6 3 6 6 6 6 6 6 6 4 5 6 5 6 4
8,6
Typ
e of
ca
sing P P P P PI P P P P P P P P P C P P PI
P P P P C p p p p p p p p p
Met
hod
of
lift;
type
of
pow
er
Cy,
E
Cy,
G
Cy,
W
Cy,
G N
Cy,
H
J, E
C
y, H
C
y,E
J,
E
Cy.
E
Cy,
E
Cy.
E
N
Cy,
H N
Cy.
H
N
Cy,
E
Cy,
E
Cy,
E
Cy,
H
Cy,
H
J,E
J,
E
Cy,
E
Cy,
E
N
Cy,
E
Cy,
E
Cy,
H
J, E
Use
of
wat
er S S S D
, 0
0 0
D,
S 0
D,
S D
, S
D,
S D
, S
D,
SN
D
,S N
D,
S 0
D,
S D
,S
D,
S D
, S
D,
S D
, S
D,
0
D,
S D
, S
D,
S D
, S
D.S
D,
S D
Mea
suri
ng p
oint
Des
crip
tio
n L Tea
L Tea
T
ea
Tea
Pb
T
ea
L L L Tea
L Tea
T
ea
Tea
L Tea
L L L L L Tea L Pb
T
ea
Tea L Tea
Dis
tanc
e ab
ove
or
belo
w (
) la
nd s
ur
face
(fe
et)
1.0
-4.0 1.7 .3
1.
8 1.
0 .7
-5.6
.2 .9 .8 .5
1.0 .8
.4
1.5
Alti
tude
(f
eet)
5,35
2.27
5,
393
5,34
8 5,
352
5,29
8.5
5,36
9 5,
373
5,38
4.64
5,
299
5,29
4
5,36
1 5,
386
5,39
3 5,
341
5,28
5
5,28
5 5,
284
5,28
5 5,
324
5,27
0
5,27
4 5,
290
5,29
7 5,
338
5,33
1
5,33
3 5,
337
5,31
9 5,
302
5,32
5 5,
361
Dep
th to
w
ater
lev
el
belo
w
mea
surin
g po
int
(fee
t)
10
51.0
6 20
3.20
8
53
4.39
31
20
19.8
277
75 35
18
0.67
16
0 65.3
6 32
.44
24.3
9 40
12
.94
45
44 96
70
66.0
0 48
.88
40-5
0 67
.85
72.1
5 54
.50
80
88.6
8
Dat
e of
m
easu
re
men
t
8-17
-48
9-27
-48
3-30
-51
9 27
-48
9-27
-48
9-29
-48
9-28
-48
5-19
-49
5-19
-49
7- 5
-51
3-30
-51
12-
-49
10-1
9-48
8-
-48
5-20
-49
5-19
-49
5-20
-49
9-10
-48
Rem
arks
L L SC,
L SC
, L
SC L BC
L B
C,
SC
BC
, L
BC
, L
BC
, L
GC
, L
BC SC BC
SC
.L
00
O5
M S O O
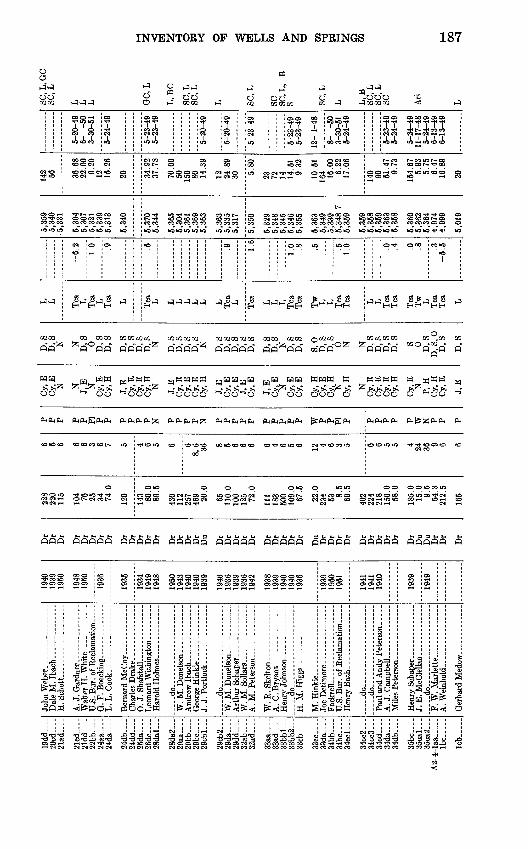
19dd
.__.
20cd
.___
21dd
._._
22
bb
_
24da .
24
db
. 24
dd-_
-25da_
26
dc-_
-28dal
28da
2.._
29aa
--_
29bb _
29
bc-
-29
cbl.
~
29cb
2...
29da -
29dd
___.
32ab .
32ad
..__
33ad
_.__
33bbl
33bb
2...
33cb .
33
cc.
38da .
34bb -
34bc .
34
ccl_
._
34cc
2._.
34cc
3-_.
34cd
_...
34da
__. _
34db
~. .
35bc
35ca
l...
35ca
2__.
A2-
4-la
a .....
Ib
c
Icb .
.
Dal
e M
. Iba
ch _
__
...
__
.
G.
F. B
oec
kin
g.
.-. .
......
0. J
. S
haf
stal
l ...
....
..
.....d
o...-
- ...........
J. J
. Po
rtlo
ck. _
__ _
--_-
--.
.....d
o.. . . ... ..
Art
hur
Sch
aper
.--.
. .__
___-
_
A.
C.B
ryan
t___
. ...
....
....
...-
.do
-. ..
.... -
H. M
. Hig
gs...
....
....
....
.
Fac
kre
lL. ...
....
....
....
U.S
. Bur
. of R
ecla
mat
ion,
. ...
....
.do
..
....
....
....
.......d
o. - ............
.....d
o........ ..........
F. W
. M
arle
tte
-_ .
A. W
einh
old.
.. ..
....
....
...
Ger
hard
Med
ow ..
. -
1940
1939
1950
1948
1950
1936
1935
1934
1949
1948
1950
1943
1940
1940
1939
1946
1936
1939
19
3619
42
1938
1939
19
4019
4019
36
1939
1950
1951
1941
1941
1940
1939
1949
Dr
Dr
Dr
Dr
Dr
Dr
Dr
Dr
Dr
Dr
Dr
Dr
Dr
Dr
Dr
Dr
Dr
Du
Dr
Dr
Dr
Dr
Dr
Dr
Dr
Dr
Dr
Dr
Du Dr
Dr
Dr
Dr
Dr
Dr
Dr
Dr
Dr
Dr
Du
Du
Dr
Dr
Dr
228
220
115
104 76 25 34 74
.0
120
143 80
.089
.5
430
112
257
469 20
.0
65 110.
010
0 12
5 72.0
111
183
500
109.
067
.5
22.0
234 53 8.
5 69
.5
402
224
218
150.
058
.0
185.
015
.0 9.5
54.3
212.
5
165
6 5 6 6 6 3 6 7 5 4 6 5 6 68,
6 36 8 5 6 6 6 6 4 6 5 6 12 4 6 3 5 6 6 5 5 4 24 36 9 6 6
P P P P P PI P P P P P P N P P P P N P P P P P P P P P P W P P PI
P P P P P P W N P P PP P P P P PI P P P P P P N P P P P N P P P P P P P P P P W P P PI P P P P P P W N P P P
Cy,
EC
y, E N N J,
E NC
y.E
Cy,
H
J, E
Cy,
EC
y,E
Cy,
H N J,E
Cy,
EC
y,E
Cy,
EC
y,H
J, E
Cy.
EC
y.E
J.E
Cy,
E
J, E
Cy,
E NC
y.E
Cy.
E
Cy.
HC
y,E
Cy,
H NC
y,H
NC
y,E
Cy,
EC
y,E
Cy,
H
Cy,
E N P, H
Cy,
HC
y.E
J,E
D,
SD
, S
N N D,
S0 D.S
D,
S
D,
SD
, S
D,S
D,
SN D,
SD
, S
D,
SD
, S
N D,
SD
, S
D,
SD
, S
D,
S
D,
SD
,S N D,
SD
, S
S, 0
D,
S V N N D,
SD
,SD
, S
D,
S
S 0 D,
SD
, S,
0D
.S
D,
S
L L Tea
L Tea
L Tea
L Tea
L L L L L L L Tea
L Tea
L L L Tea
T
ea Tw
L L Tea
T
ea L L Tea
T
ea
Tea
T
w
L Tea
T
ea L
-6.2 1.0 .9 .5 .9 1.6
1.0 .8 .5 .5
1.
0 .0 .4 .0 .8 .3
-5.5
5O
CQ
5,34
0-5
,331
5,30
4 5,
307
5,32
1 5,
339
5,31
3
5,34
0
5,37
0 5,
344
5,36
55,
304
5,36
15,
369
5,36
3
5,36
35,
335
5,31
7
5,35
0
5,32
95,
348
5,34
55,
346
5,35
5
5,36
3 5,
349
5,33
95,
348.
7 5,
359
5,35
95,
358
5,35
95,
363
5,35
8
5,36
0 5,
362
5,36
44,
974
4,99
9
5,01
9
142 56 36
.68
22.0
09.
20
12 15.2
6
20 34.9
2 37
.78
70.0
050 15
0 80 14.3
9
12 24.8
9 30 5.
80
23 72 14 14.5
1 9.
32
10.5
1 16
4 16.0
06.
22
17.0
6
140 90 51
.47
9.73
154.
67
5.93
5.
756.
47
16.8
9
20
5-20
-49
6-
-50
3-30
-51
5-24
-49
5-23
-49
5-23
-49
5-20
-49
5-20
-49
5-23
-49
5-23
-49
5-23
-49
12-
1-48
8-
-50
3-30
-51
5-24
-49
5-23
-49
5-24
-49
5-24
-49
11-1
7-48
5-
24-4
96-
13-4
9 6-
13-4
9
SO, L
, GO
SO,
L
L L L GO
, L
L, B
C
SO, L
SO,
L
L SO, L
SO SO, L
, B
S SO, L
L L,
BSO
, LSO
, L
SO
Ari
L00 -q
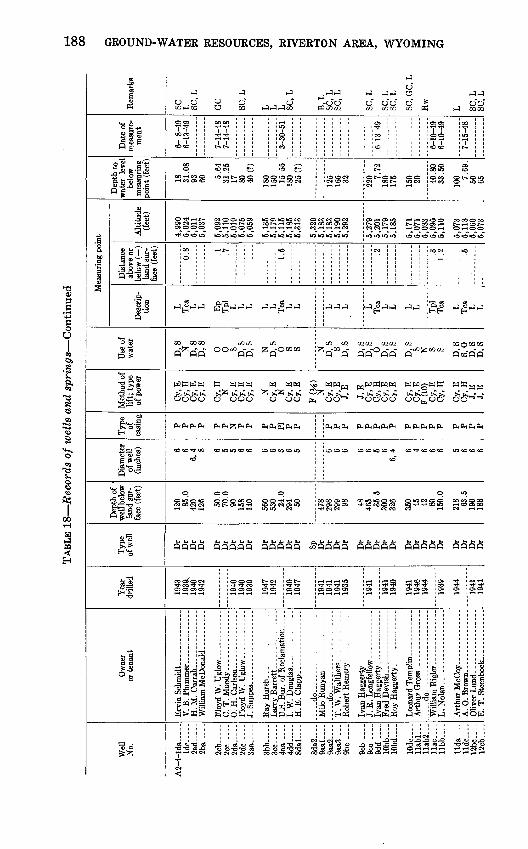
TABL
E 18 R
ecor
ds o
f w
ells
and
spri
ngs
Con
tinu
ed
Wel
l N
o.
A2
-4-l
da
..
Idc -
2ad
--
2ba .
-
2cb-
2cc_
_ .
2d
a .
.2dc ~
Qa»
3bb -
_3
cc.-
~.
4aa ..
4dd.
_8dal
9aal
9a&
2
9bc
9cb
9cc
.---
9d
d ....
10bb
._-
10bd
._..
lOdc
Ilab
2..
.ll
acll
bb .
llda
lldc....
12bc
._-
12cb
_ .-
Ow
ner
or t
enan
t
V. B
. P
lum
mer
__ ...
...
H. M
. C
urra
h.. ...
....
....
..
C. T
. M
oody
-___
--- .
....
...
0. H
. C
arls
on..-
--. -
----
----
U.S
. Bur
. of R
ecla
mat
ion _
..
_____dO
-------------
T.W
. W
alth
ers.
_-_
_._.
__-.
.
.- d
o-. .... ---
---
A. 0
. B
row
n...... ---
----
---
E.
T. S
teen
bock
-.-
-
Yea
r dr
illed
1943
19
39,
1940
19
42
"~im
"~19
40
1939
1947
19
42~~
~194
0"~
1947
1941
19
41
1941
19
35
1941
1941
19
40
1941
19
46
1944
1939
1944
""1941""
1941
Typ
e of
wel
l
Dr
Dr
Dr
Dr
Dr
Dr
Dr
Dr
Dr
Dr
Dr
Dr
Dr
Dr
SP
Dr
Dr
Dr
Dr
Dr
Dr
Dr
Dr
Dr
Dr
Dr
Dr
Dr
Dr
Dr
Dr
Dr
Dr
Dep
th o
f w
ell b
elow
la
nd s
ur
face
(fe
et)
120 85
.0
420
126 50
.0
70.0
90
15
8 14
0
560
530 24
.0
294 50 478
298
299 98 48
46
5 35.5
30
0 32
6
350 45
42
80
15
0.0
218 63
.5
190
188
Dia
met
er
of w
ell
(inch
es) 6 6
6,4 8 6 5 5 6 6 6 6 3 6 5 6 6 6 6 6 5 6
6,4 6 4 6 6 6 5 6 6 6
Typ
e of
ca
sing
P
P
P P P
P N
P
P P P
PI
P
P P P P P
P
P
P P P
P
P
P
P P P P
P
Met
hod
of
lift;
type
of
pow
er
Cy,
E
Cy,
H
Cy,
E
Cy,
E
Cy,
H
N
Cy.
E
Cy,
E
Cy,
E N V Cy,
E
Cy,
E
FJ«
Cy,
E
Cy,
E
J,E
J,E
C
y.E
C
y, H
C
y,E
C
y, E
Cy.
E
Cy,
E
F(1
0)
Cy,
E
Cy,
H
Cy,
E
Cy,
H
J.E
J.
E
Use
of
wat
er
D,S
N
D
, S
D.S 0
0 S
D, S
D
, S
N
D,
S 0 S S N
D
, S
S D
, S
D.S
D
, S
0
D,S
D
, S
D,
SS N
3 S
D.S
S
,0
D,
S D
, S
Mea
suri
ng p
oint
Des
crip
tio
n L Tea
L L Ep
Tpl
L L
L L L Tea
L L L L L L Tea
L L L L Tpl
T
ea L Tea
L L
Dis
tanc
e ab
ove
or
belo
w (
-)
land
sur
fa
ce (
feet
)
6.8 .1 .7 1.5 .2 .3
1.2 .5
Alti
tude
(f
eet)
4,99
0 5,
024
5,01
1 5,
037
5,09
2 5,
110
5,01
9 5,
075
5,05
9
5,13
5 5,
179
5,11
5 5,
185
5,31
3
5,32
9 5,
183
5,18
3 5,
190
5,29
2
5,27
9 5,
201
5,17
9 5,
185
5,17
1 5,
071
5,03
3 5,
095
5,11
0
5,07
3 5,
113
5,06
0 5,
073
Dep
th to
w
ater
lev
el
belo
w
mea
surin
g po
int
(fee
t)
18
31.0
8 93
60 5.
64
31.2
5 17
80 40
(?)
180
150 15
.55
180 25
(?)
125
165 32 220 7.
72
180
175
150 20 40
.80
33.5
0
100 7.
69.
50
65
Dat
e of
m
easu
re
men
t
6- 8
-49
6-13
-49
7-14
-48
7-14
-48
3-30
-51
6-13
-49
6-10
-49
6-10
-49
7-15
-48
Rem
arks
SC
L SC,
L
GC
SC, L
,
L L L SC,
L
B,
L SC
, L
SC,
L
SC, L
SC
.L
SC,
L
SC
.GC
.L
Ew
L SC, L
S
C.L
00
CO I Ul o w !
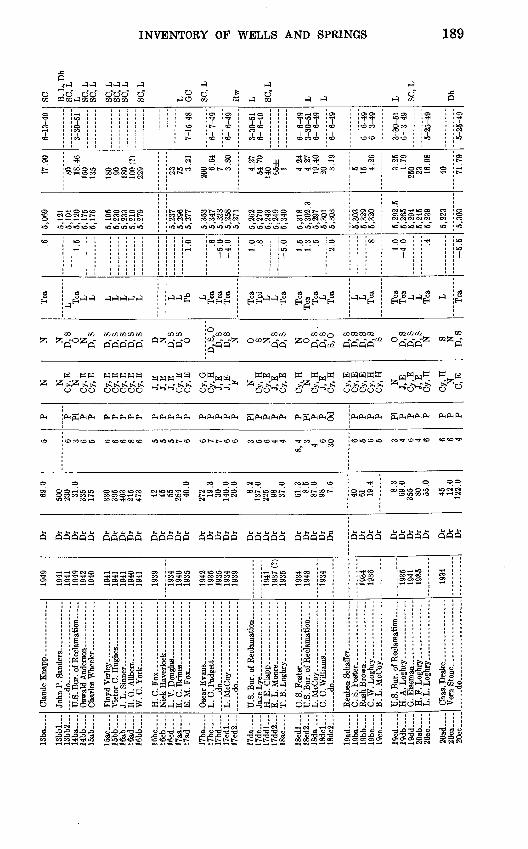
13ba -
ISbb
l...
13bb
2...
14
ba.
14bb
.__ _
15ab
_._
.
15ac
_1
5b
b
16ab
...-
16ad
..._
16bb_
16bc
....
16cb
....
16
cd
17aa .
17ad -
17ba
17bc_
17bd .
17cd
l...
17cd
2-_-
17da -
1
7d
c.
17
dd
l
17dd
2__.
18ac
18cd
l__.
18
cd2.
.. 18
da .
..
18dc
l...
18dc2
I9ad
. 19ba .
19bb
___.
19bc -
19
cc
19cd
_
19db
_...
19
dd
-2
0ab
20ac .
20ad
....
20ca
20cc .
..... d
o.... ...
....
....
....
..U
.S. B
ur. o
f Rec
lam
atio
n
Vic
tor
C. H
ughe
s -
R. 0
. A
llber
t---
-- _
....
..
W.C
.York
........ . ..
H.
C. F
ox
.. .
....
....
....
E.
C. B
rine
s. _
______ ...
E. M
. F
ox...
_____ . -
-..
Osc
ar E
van
s...
. .--
..-.
..
L.M
cCoy
--- .
........ .....
.....d
o
U.S
. Bur
. of R
ecla
mat
ion ..
H.E
.Cla
pp..
-
E.
L. M
oore
_ ..
T
. B. L
oghry
....
... .
....
...
C.S
.Foste
r...
.
....
. U
.S. B
ur. o
f Rec
lam
atio
n ..
L.
McC
oy.. _
..
C. C
.Wil
liam
s . ..
.. d
o
C.S
.Fo
ste
r..
C. W
. Lo
gh
ry ..
-
B.L
.McC
oy..
H. A
. Log
hry-
-- ..
H.
F. L
oghr
y _______ ..
. L.
L. L
oghr
y-.. ..
.....
Cha
s. D
rake
_ _
... ..
.
do
1949
1941
1941
1949
19
4219
40
1941
1941
19
4119
40
1941
1939
1934
1940
19
35
1942
19
3519
3519
34
1939
1941
19
37 (
?)
1935
1934
19
48""
1934""
1934
1936
1935
19
4119
S5
1934
Dr
Dr
Dr
Dr
Dr
Dr
Dr
Dr
Dr
Dr
Dr
Dr
Dr
Dr
Dr
Dr
Dr
Dr
Dr
Dr
Dr
Dr
Dr
Dr
Dr
Dr
Dr
Dr
Dr
Dr
Du Dr
Dr
Dr
Dr
Dr
Dr
Dr
Dr
Dr
Dr
Dr
Dr
69.0
500
230 31
.0
335
175
330
395
403
215
473 42
45 55 28
4 40.0
272 19
.330 14
0.0
20.0 8.2
137.
022
5 98
37.0
61.3 8.5
87.0
98 7.
5
40 61 19.4 8.3
69.0
35
5 80
55.0
45
12.0
122.
0
5 6 3 6 5 6 6 6 8 6 5 5 5 7 6 6 7 7 6 6 3 5 6 4 4
8,4 3 4 6 30 6 5 6 5 3 4 6 4 6 6 6 4
P P PI
P P P P
P P P P
P P P
P P P P P P PI
P P P
P P
PI
P P Od P P P P PI P P P P P P P
N
NC
y.E
NC
y, E
C
y.E
Cy.
EC
y.E
Cy,
EC
y,E
Cy.
E
J, E
J, E
J, E
Cy,
EC
y,E
Cy.
G
J!E F N
Cy,
HC
y, E
J E
Cy,
E
Cy,
H NC
y, H
J, E
Cy,
H
Cy.
EC
y.E
Cy,
E
Cy.
HC
y, H N J,E
Cy,
EJ,
EC
y.H
Cy,
H N C, E
N
N D.S 0 N
D,
S
D,
SD
, S
D,
SD
, S
D,
S
D N D,
SD
, S
0
D,S
, 0
D.S
D,
SN 0 S N D,
SD
, S
N 0 D.S
,D
, S
S, 0
D,
SD
, S
D,
S D
, S
S 0 D,
SD
, S
D,
SN S N D,
S
Tea
L Tea
L L L L L L L L L Pb
L Tea
T
eaT
ea
Tea
TT
Pl L Tea
Tea
T
ea
Tea
L Tea L L Tea
Tea
T
ea
L L Tea
L Tea
.6
1.5
1.0 .6
-5
.0-4
.0 1.0 .8
-5.0 1.5
1.3 .5
2.0 .8 1.0
-4.0 .4
-5.5
5,06
9
5,12
15,
101
5,12
0 5,
175
5,17
6
5,19
55,
230
5,23
35,
219
5,27
9
5,23
75,
296
5,27
7
5,35
35,
347
5,32
85,
258
5,27
1
5,26
2 5,
270
5,24
35,
249
5,34
0
5,31
8 5,
302.
3 5,
297
5,30
15,
303
5,30
35,
329
5,32
0
5,29
2.5
5,26
5 5,
294
5,24
55,
239
5,22
3
5,30
3
17.9
0
80 18.4
6 15
013
5
180 90 180
100
(?)
229 23 75 3.
21
200 6.
647 3.
80
4.27
54
.70
140 65
±1 4.
24
4.27
19
.40
20 3.19
5 15 4.26
3.25
4.
79
250 23 16
.98
40 71.7
9
6-13
-49
3-30
-51
7-15
-48
6- 7
-49
6- 6
-49
3-30
-51
6- 6
-49
6- 6
-49
3-30
-51
6- 6
-49
6- 6
-49
6- 6
-49
6- 3
-49
3-30
-51
6- 3
-49
5-25
-49
5-25
-49
SC
B,
L, D
hS
C.L
L
SC, L
SC, L
SC
,LSC
, LSC
, L
SC
.L
L GC
SC, L
L SC
.L
L L L SC, L
Dh
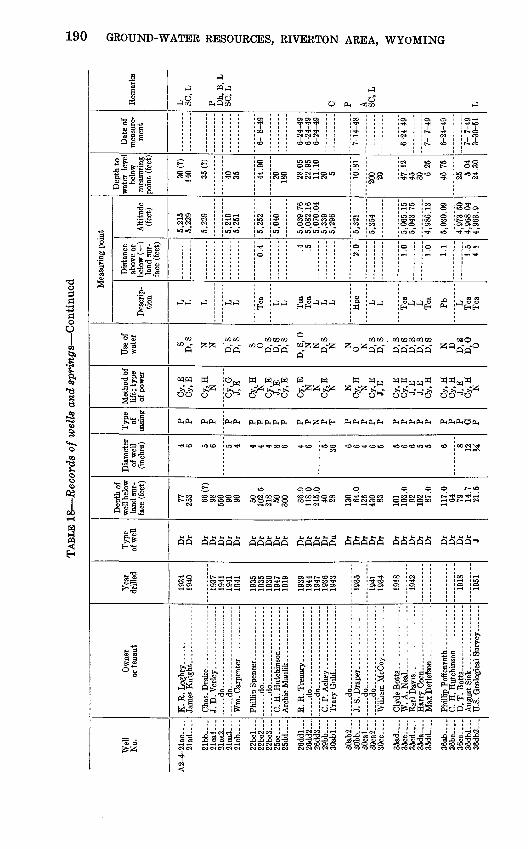
TABL
E 18 R
ecor
ds o
f wel
ls a
nd s
pri
ngs
Con
tinue
d
Wel
l N
o.
A2-
4-21
ac...
_ 21
ad...
_
21bb .
21cal
21ca
2...
21
ca3
21cb .
22bcl
22
bc2.
..22
bc3_
-25
cc. _
2
5d
d
26
dd
l
26dd
2....
26dd
3...
29bb
SO
abl..
.
30ab
2___
30bb
..._
30cal
35ad
....
35cc
....
35cd
35da
35
dd__
__
36ab
_...
36bc
-._
36cc
-.._
36db
l...
36db
2___
Ow
ner
or t
enan
t
K. R
. L
oghr
y __ ._
. - -
.....d
o....
Wm
. Car
pen
ter
do ..
do
R. R
. Tre
nary
. -
do..
.. .d
o..
. ..
..
C.P
.Achey -
..... d
o-- .....
J. S
. Dra
per
...-
- ---
----
--
.d
o
do
W. A
. N
eal..
----------
Yea
r dr
illed
1934
19
40
1937
19
41
1941
19
41
1935
19
35
1936
19
47
1919
1939
19
44
1947
19
36
1943
1935
1941
19
34
1918
""
1942""
1918
1951
Typ
e of
wel
l
Dr
Dr
Dr
Dr
Dr
Dr
Dr
Dr
Dr
Dr
Dr
Dr
Dr
Dr
Dr
Dr
Du
Dr
Dr
Dr
Dr
Dr
Dr
Dr
Dr
Dr
Dr
Dr
Dr
Dr
Dr J
Dep
th o
f w
ell b
elow
la
nd s
ur
face
(fe
et)
77
253 66
(?)
98
550 90
90 50
10
2.5
218 50
30
0 36.9
11
8.0
215.
0 40
28 13
0 64.0
12
6 43
0 83 101
103.
0 92
10
2 87.0
117.
0 64
79
14
.7
21.5
Dia
met
er
of w
ell
(inch
es) 4 6 5 6 5 4 4 4 4 8 6 4 6 5 36 6 6 4 6 5 5 6 6 5 5 6 8 12
. «
Typ
e of
ca
sing
P
P P
P P
P P
P
P
P
P P P N
P
T P
P
P
P P P
P
P
P
P P
P P
G
P
Met
hod
of
lift;
type
of
pow
er
Cy.
E
Cy,
E
Cy,
H N
Cy,
G
J, E
Cy,
H N W Cy,
E
Cy,
E N
N
Cy,
E N N
Cy,
H
N
Cy,
E
J, E
Cy,
E
Cy,
E
J,E
J,
E
Cy,
H
Cy,
H
Cy,
H
J, E
C
y, H N
Use
of
wat
er S D
,S N
N D,
S D
, S
S 0
D,
S D
,S
D,
S
D.S
.ON
N
D
,S N N
0 N
D,
S D
.S
D,
S D
,S
D,
S D
, S
D.S N
D
D,S
D
,0
0
Mea
suri
ng p
oint
Des
crip
tio
n L L L L L Tea L L Tea
T
ea
L L L
Hpc L L Tea
L L Te
a
Pb L Tea
T
ea
Dis
tanc
e ab
ove
or
belo
w (
)
land
sur
fa
ce (
feet
)
0.4 .4
.5
2.0
1.0
1.0
1.1
1.5
4.1
Alti
tude
(f
eet)
5,21
5 5,
229
5,22
9
5,24
9 5,
251
5,25
2
5,04
0
5,03
9.76
5,
082.
16
5,07
0.04
5,
339
5,29
6
5,32
1
5,35
4
5,06
5.15
5,
043.
75
4,98
6.13
5,03
0.09
4,97
3.50
4,
968.
04
4,96
3.9
Dep
th to
w
ater
lev
e be
low
m
easu
ring
poin
t (f
eet;
80 (T
) 14
0 35(?
)
40
35 44.9
0
20
180 28
.05
22.9
5 11
.10
20 5 10.8
1
200 20 47
.12
45
30 6.25
46.7
5
25 5.04
24
.30
Dat
e of
m
easu
re
men
t
6- 8
-49
6-24
-49
6-24
-49
6-24
-49
7-14
-48
6-24
-49
7- 7
-49
6-24
-49
7- 7
-49
3-30
-51
Rem
arks
L SC, L
P Dh,
B,
LSC
, L
C
P A SC,
L
L
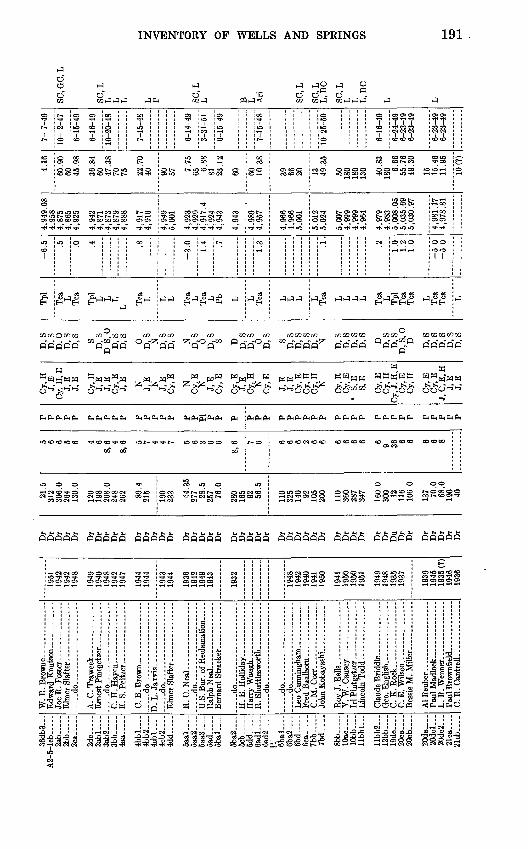
36db3
A2
-5-l
cb
. .
2ab
.....
2bb
2ca -
2dc
3abl
. 3a
b2...
.3
bb
4b
bl
. 4b
b2...
.4c
bl
4cb2
4d
d
5aa
l....
5aa2
5aa3
5ad
5b
al._
-
5ba2
.__
.5cb
5dd -
6adl
6a
d2._
_ _
K
6bal
._..
6ba2
._._
6bd -
6c
a .....
7bb
7bd_
_-.
8bb
lOac -
10bb_
llbbl
Ilbb2...
12bb .
19
dc
20ca
20
cb
20
da.
...
20dc
l...
20dc2
21ca
21cb .
W.
R. B
row
ne...
_ ..
......
Elm
er S
laft
er-
....
.do ..
....
....
. ..
..
A.
C. T
raw
eek..
....
_ ..
...
Ern
est P
intg
etze
r _ ..
.......
C. H
.Hayen. ..
..........
C. B
. Bro
wn
..--
... _
....
..
do
....
.do...... ...
Elm
er S
laft
er- -
-..-
.. .......
R. C
. Neal.
.. -
... .
.. .
d
o . . ..
...
U.S
. Bur
. of
Rec
lam
atio
n _
... ..do... - . ..
....
H. E
. Ho
llid
ay
..
.. ..
. ..
R. S
hutt
lesw
orth
........ .
. .
do --... _.
-...
do
-- ..
. ...
-
do
Leo
Cun
ning
ham
.
. .
Y. W
. Cau
sey
Irl P
intg
etze
r. -
---.
._.
C. K
. Roc
k. _
.. _
....
_ .
C.E
.Wil
son,
L. R
. Wen
ner. _
__ ..
C. R
. C
antr
ell. .......
1951
1942
1942
19
48
1949
19
40
1948
1942
19
47
1944
19
44
1943
1944
1936
1942
1949
19
43
1932
1948
1942
19
4019
4119
50
1941
1950
19
50
1951
1949
1948
1935
19
37
1939
1945
1935
(?)
19
4619
36
Dr
Dr
Dr
Dr
Dr
Dr
Dr
Dr
Dr
Dr
Dr
Dr
Dr
Dr
Dr
Dr
Dr
Dr
Dr
Dr
Dr
Dr
Dr
Dr
Dr
Dr
Dr
Dr
Dr
Dr
Dr
Dr
Dr
Dr
Dr
Dr
Dr
Du
Dr
Dr
Dr
Dr
Dr
Dr
Dr
21.5
312
306.
026
4 13
0.0
120
198
248
262 89
.4
215
190
233 44
.35
277 28
.5
957 76
.0
280
165 92 56
.5
110
325
140 92 105
200
110
360
287
347
160.
030
0 12
116
106.
0
137 70
.068
.0
190 40
5 6 6 5 6 4 6 8,
6 4 8,
6 5 7 4 7 5 6 3 6 6
8ft 7 6 6 6 6 6 6 6 6 6 6 6 36
6 6 6 6 8
P P P P P P P P P P P P P P P P P PI
P P P P P P P P P P P P P P P P P P P P P P P P P P
Cy.
HJ,
EC
y, H
, EJ,
EJ.
E
Cy.
HJ.
EJ,
EC
y.E
J, E N J,E N J,E
Cy,
E
NC
y,E
J, E
Cy,
E
Cy,
EJ
EC
y.H
NC
y.E
J,E
J, E
Cy,
EC
y, H
Cy,
H N
Cy.
EC
y.E
* S,
ES
,E
Cy,
EC
y.H
C
y, J
, H, E
Cy.
EC
y, H
Cy.
EC
y, E
J,
C, E
, HJ,
EJ,
E
D,
SD
, S
D, 0
D,
SD
, S SD
, S
D S
, 0D
, SD
, S
0 D,
SN D,
SD
, S
N D,
S 0 D,
SS D D,
SD
, S
0 D,
S
SD
, S
D,
SD
, S
D,S N D,
SD
, S
D,
SD
, S
D D,
S D
, SD
, S,
0D D,S
D,S
D
, S
D, S
D,
S
Tpl
Tea
L Tea Tpl
L L L
L Tea
L L L Tea
L Tea
L Pb
L L Tea L L L L Tea
L L L L Tea
L Tpl
T
ea
Tea L Tea
T
ea L
-6.5 .5 .0 .4 .8
-3.0 1.4 .7 1.3 .1
.
.2
1.0
1.2
1.0
-5.0
-5
.0
4,94
9.08
4,
958
4,87
5 4,
865
4,92
5
4,94
2 4,
871
4,8
734,
879
4,88
8
4,91
7 4,
916
4,94
95,
001
4,92
3 4,
929
4,91
7.4
4,92
44,
943
4,94
3
4,98
94,
957
4,96
64,
966
5,00
1
5,01
25,
024
5,00
74,
999
4,99
94,
964
4,97
9 4,
983
5,00
8.05
5,
035.
69
5,03
0.97
4,98
1.17
4,
978.
81
4.16
60.9
0 60 45
.98
36.8
4 60 47
.38
70 75 22.7
0 40 90 57 7.
75
65 6.88
81 23
.12
60 60 10.3
8
39 66 20 13 49.3
5
50 180
180
130 40
.83
180 6.
66
55.7
6 49
.30
15 15.4
6 11
.95
iom
7- 7
-49
10-
2-47
6-15
-49
6-16
-49
lo^C
MS
7-15
-48
6-14
-49
3-31
-51
6-15
-49
7-15
-48
10-2
5-50
6-16
-49
6-24
-49
6-23
-49
6-23
-49
6-23
-49
6-23
-49
SC, G
C, L
SC
,L
L L L SC, L
L B L A
ri
SC,
L
SC
,L
L,B
C
SC, L
L L L
,BC
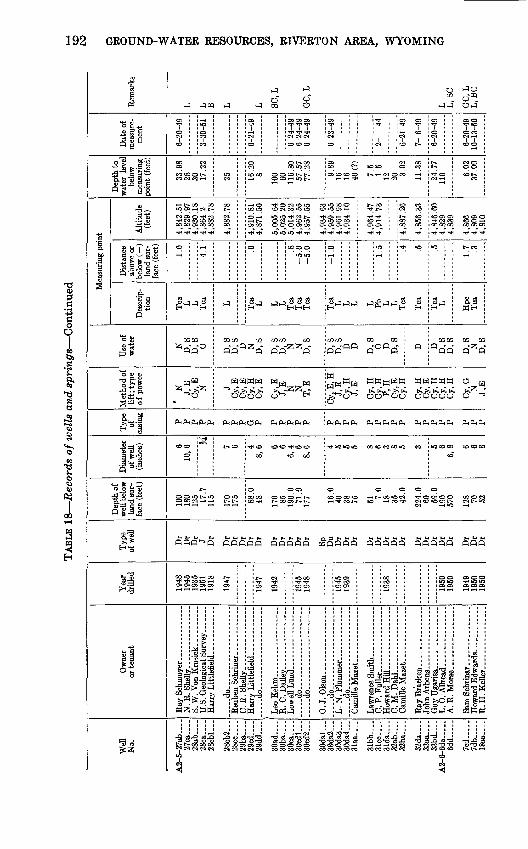
192 GROUND-WATER RESOURCES, RIVERTON AREA, WYOMING
TABLE 18 Records of wells and springs Continued
1 1
'SS^» § qsi s
fill! jbJii°l sa
Measuring point
5? S.2<!~
ss?i?S c. g>2» t> te- ^2l|ii
D,'BgCQ"-<P^
*S S3 Sola & *
O 0 f-H
O&fe
ill§3*5
09 t*)
Erf'0003 o <D
1*1jS-sS
«" ^ , S? <5 o t: 9 ^j-S gj
SliR ^-Sig
S^O. K-
L&fc-i'S
a"8TO r ]
^^
siP a 55 oil
o
^ rf^iz;
J "J Q U
J JPQ J iJ CQ O
Tti I iOi i i 2 i IOO !N O3 !N
coooot-
rft^OO 00 »OO5 ^H CM !>
liiii
O I rf
T-, 1 ^,
g , , g ^l-ll-l^
CQCQ
^ X--TO PP
H w <-^
PL, PL, CL, PL, |X
0=0 "^o"
1
>o!N
OO
00
;
,-J
t r+i TJI ^t, 4U4,
? ^^^
O Ot^-00 (N OO K5<N
COCO OOCOI>.I>.,-H O COi-H lOt-
1-1 O * O C<1 »O iO cv OOiO CO(MCO»OiO CC
O^-< lOiO^C^lt^" -^ I-H t O(Mi-icOiO =^
O OOOO»o»o
1 1
c3 g C8 c3H^ ^^HHH
CQCQ CQ CQCQ O3
PP Q ^P PP^^P
HHMH H H H
^£££S ^^H
PL,PL,PL,^^ ^ PL, PL, p^ PL,
t^co TfcO cOtOTfcOCO
OO ctJ OO
t-. o OO
§OW5t^iO O »O OO OO O »O O ^H t^
o> , * ^, i -«tiJ, i '
2 jeii
CO *^, »OiO
1-1 1-1 -SJ1 1-1
1OCOO t^-CO
Oi ^_i TJI TJI TJI iOCOCO CO i-l
O ' »O
T p
s
a> a* rti ^,I iM *°
i tl
CO CO
OO »OOO OO
* 1O
^j^hj ij£i-qij£> ^
CQCQ CQ CQ
PP PQ P OP0 p
wH-H W H WWjz
^O 1^ OO 1^
HW W
j
Q iJO CQ 0-«
J Oi-J
6-20-49
fcTfO
iCC1 oc ooe
o-
£
>o
e«
^
6-20-49 10-13-50
s§CO t-^
CO
S CO O ^1 CO OO CO
t-.CO
agjHH
CQCQ CQ CQ
°P-P 0*0
WfC W W o w >> s>> x i=- x ^ x x^ _ QQ QOQOO Q ^
PL, PL, PL, CL, PL, (X, PL, PL, PL, (X, PL, PL, PL, PL, PL,PL,^I
Tfiousio ooeocooo»o co mcooo cotooo
0 0CO O OO WS T-, t^ OC
ooo»O(N -^OOSOO OO O C.
1010 cd T-,!O rf
ppp>-=p ppppp ppppp t&pppp ppppp pppp
OOIOIO-H OO !>. 1**, -^, CO 1O t-f Tt, t OSOiOS Oi Oi O I
i
Ray Schmoyer
N. R. Shelly. S. W. Von Krosick--. ....... U.S. Geological Survey ....
Harry Littlefield.. ___ ....... .. do ... ..... .... Reuben Sehriner.--.-- ..--
n Vt Shfillv
J2 C4J2 c4J2 J2 0 c(Socaoo ooX
fot^COOOOO OO OO O- N<Ne»C»C<l cdMg]
i<u
t <M W5OO^ -^ TM-^1
=1-^ >>T3
^ a|S S^ as« §S ° ^tt JrtJ C
S -r T3 T3 IS <S^3S "c S*T3 ?. _° <3 S S *T;
^00 00
O5 O5 O~
1 * 11 1 Ijli s^i Iflsiz; £ gpn ^ 5
^ C iJOtt C
iij
^ 1<u -S= PC
§c3 ft
£ 41 C* C<
CO CO
g1 Jo-
1
£
£ C
Q POP
O O O5 O G iO U3 -^ kCkC
1.1,c,_:
^ccot coco
T c, <
1PC
<
?CC
Sam Schrinar.-. ........ Howard Edwards __ ........ R. H. KeUer _ ......... _ .
T3^ S.2.9*t~ t~ ^**
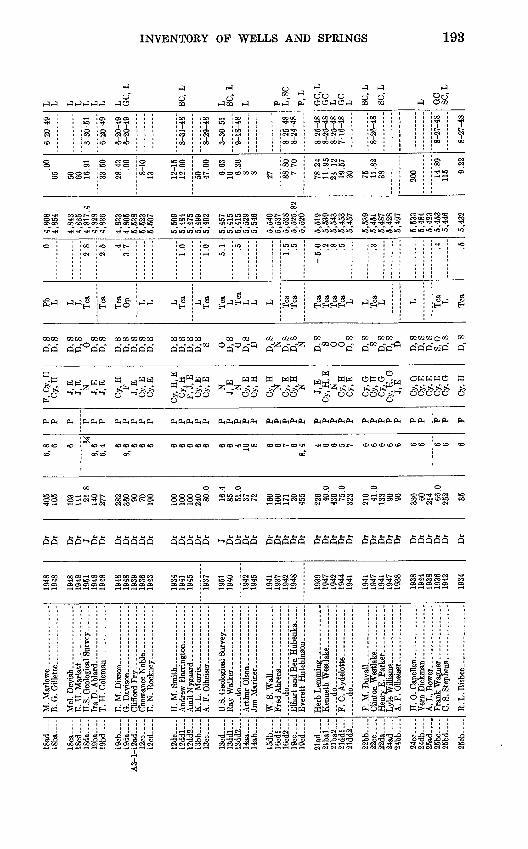
18ad
18ba
18
ca -
18cd -
18da
....
19ba
.._.
19bd
....
19cb
-._.
19da
... .
A3-
l-12
ad.._
.12cc
12cd .
12dc .
12dd
l...
12dd
2...
13bb .
13cc
.--
13
cd
. 13ddl
13dd
2...
14aa
.
14ab .
15db
..._
16cd
l._.
16cd
2...
19cc
--._
19
cd...
.
21ad .
21bal
21ba
2...
21dd
l...
21dd
2...
22bb
..._
22cc
..-_
22da .
24
ad
. 2
4b
b _
24cc
....
24
db
.25
ad_.
..25
bc...
.25bd _
25
cb
B.
G. G
ille
tte.
. ........ .....
E.
H. M
arla
tt .........
Ira
D. A
blar
d....
...
....
....
H.
M. S
mit
h....... .
........
K. L
. Mor
ris ..
..
. A
. F. O
lhei
ser ...............
Ray
Wal
ker.
. ..............
Art
hur
Ols
on...
-_-.
...-
--..
W.
S. W
all.
. ...
....
....
....
....
.do
....
....
. .........
Elh
art a
nd B
en H
uben
ka ..
Ken
neth
Wes
tlak
e....
. ......
..
do.. ...................
F. C
. Ay
del
ott
e-..
.......
..... d
o..... .
...............
F. M
. D
uval
l -. .
.........
A. F
. O
lhei
ser _
____ . .
...
H. 0
. C
apel
lan.
.... .
........
C.S
.Ste
ph
en
s...
....
....
...
R. L
. Bis
bee.
...
__
__
.
1948
1948
1948
1948
1951
1948
19
48
1948
1948
1939
1936
1943
1934
1941
1945
""1937""
1951
1940
1942
19
45
1941
19
3719
4219
48
1939
1947
1942
1944
1941
1941
1947
1941
1947
1938
1938
1944
1938
1936
1942
1934
Dr
Dr
Dr
Dr J Dr
Dr
Dr
Dr
Dr
Dr
Dr
Dr
Dr
Dr
Dr
Dr J Dr
Dr
Dr
Dr
Dr
Dr
Dr
Dr
Dr
Dr
Dr
Dr
Dr
Dr
Dr
Dr
Dr
Dr
Dr
Dr
Dr
Dr
Dr
Dr
Dr
405
105
103
111 21
.814
027
7
282
360 90 70 190
100
100
100
240 80
.0
16.4
85 51.0
37 72 160
100
171 20 455
226 40
.043
0 75.0
323
210 41
.013
3 90 90 336 60 214 66
.025
2 35
6,8 6 6 H
8,6
6,4 6
8,6 6 6 6 6 6 6 6 6 6 6 4 10 8 6 6 7 6
8,4 4 6 6 5 7 6 6 6 6 6 6 6 6 6 6
P P P P P P P P P P P P P P P P P P P P P P P P P P P P P P P P P P P P P P P P P
F, C
y, H
Cy,
H
J, E
J, E N J, E
J, E
Cy,
H FJ,
EC
y, E
Cy.
E
Cy,
H,
E
Cy,
HF,
J,
EC
y, E
Cy,
E N J, E N
Cy,
EC
y, H
Cy,
H NC
y, E
C
y, H N J,
EC
y, H
, E
NC
y, H
Cy.
E
Cy.
GC
y, H
Cy,
GC
y, H
, G
J,E
Cy,
GC
y, E
Cy.
EC
y, E
Cy,
G
Cy,
H
D,
S D
, S
D,
S D
, S
0 D,
S D
, S
D,
S D
, S
D,
S D
, S
D,
S
D,
S D
, S
D,
S D
, S
0 D,
S0
D,
SD D,
S N D,
S D
, S
N D,S S 0 0 D,
S
D,
SS
D,
S D
, S
D D,
S D
, S
D,
S S,
0
D,
S
D,
S
Pb
L L L Tea
Tea
Tea
O
p L L L Tea L Tea
Tea
L T
ea
L L L Tea
Tea
Tea
T
ea
Tea
T
ea
L L Tea
L L Tea
L Tea
.0
2.8
2.5 .4
3.
7
1.0
1.0
5.1 .5 1.5 .5
5.0
.2
.8
.5 .3 .4 .5
4,80
8 4,
854
4,84
34,
835
4,81
7.4
4,82
84,
836
4,83
3 4,
805
5,53
85,
523
5,50
7
5,50
95,
484
5,47
55,
499
5,49
2
5,45
7 5,
415
5,41
5 5,
529
5,54
6
5,54
05,
537
5,53
8 5,
525.
82
5,52
0
5,51
9 5,
539
5,54
3 5,
453
5,45
7
5,53
95,
451
5,48
75,
428
5,49
7
5,53
35,
484
5,42
35,
453
5,44
6
5,43
2
.00
65 50 60 16.9
1
33.5
0
28.4
3 .0
0
8-10
13 12-1
512
.00
50 47.0
0
6.63
10 6.
308 8 27 88
.80
7.70
78.2
4 11
.95
23.1
2 19
.57
30 75 11.8
2 38 20
0 14.8
9 11
5 9.22
6-20
-49
3-30
-51
6-20
-49
6-20
-49
6-20
-49
8-31
-48
8-29
-48
3-30
-51
9-18
-48
8-25
-48
8-24
-48
8-25
-48
8-25
-48
8-25
-48
7-16
-48
8-26
-48
8-27
-48
8-27
-48
L L L L L L L L GC
, L
SC,
L
L SC.
L
L P L,S
C
P, L
GC
,L
GC
L
G
C
L SC, L
SC, L
L GC
SC
,L
I I § W n S 2 o CO
C
O
194 GROUND-WATER RESOURCES, RIVERTON AREA, WYOMING
1
111
Ipjf
"a 'I
8 1
p
llili
1.2 Q*
°°feco-g co 03p i*
°O CO tj
111>,*o'g
E"* cj
,|j£3 CO QJ Q> Q>
i|jfii31
llo
u
,00 ! l
? i?OO t CO
*OCO O
t O COCO CO COCOt* OO T-l T-l
0000^5 SI?
10*0*0*0 *o*r
<M 0
o **^
O3 O3
OO OO OO OO OO OO OO -^t1 1 **f -ttl tf tf tf ^f
CO i *O »O -**O*O CO
OO i OO OO OO OO OO OO
O3 O CO OO T 1 T 1 lO O3
r^ . DO .O £) .Q
OJ03 P303
00 !
00
0 0pqooJCQJ
10-10-50 10-10-50
O i (MO
CD OO OC
N OO N CO OO
*O CD OS Oi lO <M OO !>. Oi O Oi C<) CO *O C<l Oi T-I CO CD CO OO T-I *fCO »O*O*O*OO OOC<1I>-I>. C<l*O»OOOi l COcOCOCOiC
OOO
O (4^(4
T-i OO
1C lO *O
T i iCO OS Os
*o *o o
*O CO I-H CO »O Os Os
Slsi«,« «,«««« ««,«,«« «,«««« kOkOkOkOkO «««,«
CO (M O O O <N
'CD oI
°3 ^ "3. " 2
H
03 co 020303
oo """ o oo 1"^ oooo 1"" o pL^'~°
**** P^P, ^P^P, ^^ «
-
O 03 .0303 03
oooo o
OCM
Is-
CQCQ
^^d
p *»
H^HH
S2-
i-s"
pHpHpHpH PL, PH PL, PH PL, gpMpMp-i
co" co"
o *o *o o o oo o o
*OT-ICOCO t T-t^-^TjH iOCOCO*OOO !>. O C<) C^l -^ O t *O CO T-I «*
^
*ooo o ooS
QQQQ O^>QQO QQQQQ OQ 3-QQ OQQQQ QQQOQ Q
li g 1 !il 11 1
5? 'fc 1 bi)
pi ^ 5^?3 i2 ^ co
% 1-*f£ Ej c il . £ £'a£5 15 -,"= ^ J .M^ c s^S -g^. S-g |^M c§ s^| g jtgcc c '(3 Swpag gp£ , c c£-£i-3c H
<oo tfp'Sdtf woo ^ I(§S H
iiii iii-M ^ia ii^ii i
S8SS %% ggg
5SSS
QQQQ
<oookOkOkO kC
E. R. Schamber _______
-- do
Amos Wisdom.------. -- Art Fisher __ _ _ ------- Marion Schmuck- ----------- _____do__-__- ............
mi i
Ruben Yaunkin.------------ M. A. Wright... ..--_----.- Ted E. Aston ...............
! !! 1
NiMkr
csi
CO
g I
ll« bD >i
°«ej
^ f-H ^- I_I
ea fl3 Q -£Cj Q ^ T:
-2f3 Pi
1O
09
.15-8-ts1
4 £«o «I
T-H
a I
Tab
....
.
lad
....
.7bc
7ccl
__-
7cc
2....
7dd..
...
8ad.
.._.
9aa.
__
9ab
..
lOcdl
10cd
2...
10cd
3
lOdbl
10db
2...
llba
.
llb
b-.
.ll
cb
.ll
dc .
12bb _
12
bd
l
12bd
2...
12cc
____
12dc .
13ad
_.-
13bal
13ba
2._.
13bc
--._
13dd
..._
14
aal
14
aa2
14ba
....
14cc
l...
14cc
2___
14db .
14dc .
15bb .
15
ccl.
..15
cc2.
..15dc
16ab
l...
16ab
2...
16bb
..._
16cc
l
Eve
rett
Whi
tehe
ad. .
-......-
Gle
n C
ox
...
....
.
.....d
o... .
.................
C.F
ike.
. ..................
.. d
o - ._.
.....d
o......... .
...........
A.B
. M
ille
r.. .
.......... ...
....
.do..
....
. ...........
P. H
.Sey
ler_
____
. _-_
____
__-
-.-.
.do
..
....
. . . ..
J.W
.Fik
e....... ...........
E.
M. C
ampbel
L............
..... d
o .
. --
....
I.E
.Fik
e.-
-.- ...
.
....
.do
..... ..
.
R.W
. W
hite
... ..
........... .
A. E
. Kin
tzle
r- _ ......... ..
......d
o... .
.................
U.S
. Bur
. of
Rec
lam
atio
n_--
.-
do
. . -
..... d
o.... ..
... ..
. .
Har
old
Six
....
....
....
..
.J.
N.
Pick
inpa
ugh.
..........
1937
1948
1946
1938
1939
1940
1936
1939
1943
1934
1941
1936
1933
1950
1939
1949
1937
1939
1937
1947
1935
1937
1942
1946
1937
1936
1943
1949
19
42
1943
1940
1945
1936
Dr
Dr
Dr
Dr
Dr
Dr
Dr
Dr
Dr
Dr
Dr
Dr
Dr
Dr
Dr
Dr
Dr
Dr
Dr
Dr
Dr
Dn
Dr
Dr
Dr
Dr
Dr
Dr
Dr
Dr
Dr
Dr
Dr
Dr
Dr
Dr
Dr
Dr
Dr
Dr
Dr
Dr
Dr
Dr
57.0
54.0
100
380
398 36 100
253 72
.030
.065 123
268
283
482 70 60 99
.092
.028
0 65.0
132 97 449 7Q
n17
5 48 42 70 62.0
40.0
180.
040 302
134.
076
.0
34.1
24
.019
033
8 30 115 42
.5
6 6 6 6 7 6 6 6 6 6 8 6 6 6 6 6 6 6 6 6 6 6 6 6 6 6 6 6 6 10 6 6 4 7 6 6 3 6 4 7 6 5
P P P P P P P P P P P P P P P P P P P P P P P P P P P P P P P P P P PI
P P P P P P
Cy,
H
Cy,
HJ,
E
T,
EJ,
E
Cy,
EC
y,H
Cy,
H N
Cy,
HC
y, E N
Cy.
EC
y,H
Cy,
H
Cy,
HS,
EC
y.H
Cy.
EC
y,E
Cy,
EC
y, N
Cy,
E
Cy,
HJ,
EC
y, E
Cy,
EC
y, H
Cy.
EN
Cy.
EC
y, H
Cy,
H N
Cy,
HC
y, E
Cy,
EP,
H
Cy,
EJ,
E N
D D,S In P
D.S
D,
SD
, S
N N N N D,S 0 D,
SS S N N D,S N D,
S
D,S N D,S
D,
SD
Q
S
D,
0
N D,
SN 0
D,
0 SD
Q
D D.S 0
Tea
Tea
L L L L L Tea
Tea
T
ea
Tea
L Tpl
T
ea
L Tea
T
ea
L Tea
L L L Tea
T
ea L Tea
T
ea
Tea L Tea
T
ea Tea
T
ea L Tea
.3
.5 .4 .2
.5 .3 .5 .9 .0
.3 1.0 .1
.1 .4
.4
.4 .2
.2 1.5 .5 1.3
5,48
4
5,45
3 5,
525
5,47
95,
479
5,42
5
5,43
05,
416
5,39
2 5,
375
5,36
5 5,
365
5,40
4 5,
405
5,35
5
5,36
05,
357
5,38
4 5,
349
5,32
3
5,32
25,
324
5,31
15,
297
5,31
9
5,31
95,
308
5,28
8 5,
332
5,32
5
5,36
65,
303
5,30
15,
331
5,29
6
5,37
7 5,
363
5,37
15,
339
5,43
1
5,42
65,
397
5,35
5
13.0
4
16.4
9
12 100 13
43
17.5
8 22
.39
37.5
2 15
2 63.1
0 21
8.00
15 20
.60
11.4
4 15
5 19.4
1
40 40 113 13
.70
12.9
2
on 15.0
0 29
.11
8.72
102 22
.11
14.9
9
17.1
8 6.
64
142 12
.20
9-14
-48
9-14
-48
9-14
-48
9-16
-48
9-16
-48
9-14
-48
12-
2-48
9-17
-48
9-16
-48
8-12
-50
9-14
-48
10-
-49
9-18
-48
9-18
-48
9-18
-48
9-16
-48
9-16
-48
9-17
-48
9-17
-48
3-30
-51
9-17
-48
9- 3
-48
L L L GC
, L
L GC
.SC
.L
L L SC
,L
SC, L
GC
SC, L
L
TJ
W <£>
01
TABL
E 18 R
ecor
ds o
f w
ells
and
sp
rin
gs
Con
tinu
ed
Wel
l N
o.
A3-
2-16
cc2
1
6d
b _
17ab
_
17cb -
17db
18ab
18ac
_._-
18ba
... .
18bd
18cb
.1
8d
a
19bb
19cd
____
19dc
-.._
20aa
....
20cb
20
cd
l
20cd
2___
20
dd...
. 21aa _
21ac--
21cb
---
21dc _
22
ac-_
_ 22ba _
22cb
--_
22cd -
23ba
-._
23bc
_...
Ow
ner
or te
nant
Clif
ford
Fik
e --...
L. E
. S
tair
s .
Lyn
n M
oore
----
----
--
U.S
. Bur
. of R
ecla
mat
ion _
_.
John
W. F
ink -
-----
_
dO
_ - -
U.S
. Bur
. of
Rec
lam
atio
n
Ned
CaE
e
---------
... .
.do
-
d
o --- -.
W. F
. B
oy
d
...
. -
Yea
r dr
illed
1947
19
29
1942
~~~I
94Y
~~
1949
19
42
1938
1942
1943
19
44
1937
19
39
1943
1937
1949
19
38
1943
19
39
1940
1941
19
35
Typ
e of
wel
l
Dr
Dr
Dr
Dr
Dr
Dr
Dr
Dr
Dr
Dr
Dr
Dr
Dr
Dr
Dr
Dr
Dr
Dr
Dr
Dr
Dr
Dr
Dr
Dr
Dr
Dr
Dr
Dr
Dr
Dr
Dr
Dr
Dep
th o
f w
ell b
elow
la
nd s
ur
face
(fe
et)
227
160
335 40
.0
100 8
105 60
18
0 10
0
460
130 40
137
230
180 48
.0
31.0
13
0 19
9.0
310 49
.0
45 0
80
.0
17.0
27.0
35
8 68
47.0
63
.0
Dia
met
er
of w
ell
(inch
es) 6 6 6 5 6 3 6 6 6 6 6 8 6 6 6 8 3 6 6 6 6 6 4 8 6 6
8,6 6
Typ
e of
ca
sing P P P P P PI
P P P P P P P P P P PI
P P P P P P P P P P P
Met
hod
of
lift;
type
of
pow
er
J,E
C
y, E
Cy,
E
Cy.
E
Cy,
H
Cy,
H
Cy,
E
N
Cy,
H
Cy,
E
Cy.
E
Cy.
E
Cy,
E
Cy,
G
Cy,
H
Cy,
E
Cy,
E
Cy,
W
N
N
J, E
C
y, H
Cy,
H
Cy,
H
Cy,
H
Cy,
E N N
Cy,
HC
y, E N
N
Use
of
wat
er
D,
S D
,S
D,
S D
, S
0 N
D,S 0
D,
S D
, S
D
D,
S
S D
, S
D,
S D
, S
S 0
0
D,
SN N
S S D
, S
N 0 D,
S 0
0
Mea
suri
ng p
oint
Des
crip
tio
n
Tea
L L Pb L Tea
T
ea L L L Tea
L L Tea
T
ea
L Tea L Tea
T
ea
Tea
Tea
T
ea
Tea
T
ea
Dis
tanc
e ab
ove
or
belo
w (
)
land
sur
fa
ce (
feet
)
-6.0 1.2
1.5
1.3 .7 1.7
1.5 .9 .8
.5 1.0 .5
1.
0 .5
.5
Alti
tude
(fee
t)
5,34
8 5,
419
5,37
2 5,
423
5,36
2 5,
434
5,44
9
5,44
5 5,
452
5,43
3 5,
435
5,41
3
5,41
9 5,
421
5,33
5 5,
334
5,34
6
5,35
2 5,
351
5,44
8.7
5,32
3 5,
348
5,35
9 5,
320
5,27
4 5,
351
5,35
7
5,30
7 5,
394
5,27
5 5,
283
5,31
1
Dep
th t
o w
ater
lev
el
belo
w
mea
suri
ng
poin
t (f
eet)
31.0
0 30 200 20
.88
25 2.90
17
.95
80
15 100 1 30 18
21.3
2 16
.65
6 11
9.20
118 17
.92
6.65
6.22
15.8
9 74
.32
5.05
16
.64
Dat
e of
m
easu
re
men
t
9- 3
-48
7-16
-48
4-28
-51
9-16
-48
7-16
-48
3-30
-51
9-17
-48
9- 3
-48
9- 1
-48
9-17
-48
7-16
-48
7-16
-48
9-17
-48
7-15
-48
Rem
arks
SC.^
L
SO, L
L SC
.L
L SC
.L
L SO, L
L A
ri L SO
, L
L SC.L
L SC
I cc ** § S g
23db
24dc
26aal
26aa
2_-
26ad .
27aa
._-
27ab
l
27ab
2
27ba -
27bb
l 27bb2
28ad -
28ba -
28bb .
28
eb
.
28dd
- .
29ab
29bb_
29
cb
29
cd-_
- Qf
lQai
30bbl
30bb
2__.
S
Ocb
l
30cb
2
30db .
30ddl
30dd
2_-
30
dd
3
Sla
d
31bb
32aa -
32
cb
32
dd
.
33
a2
.
33bb
33cc
..
C.B
. S
ynder
. .
E.
C. G
ordo
n _
__
__
_ ..
-.
..... d
o .
.. ..
.
S. K
Ab
ern
ath
y.-
.
E
arl S
tultz
. .
M.
C. C
line
. ...
. ... ..
. ...
U.S
. Bur
. of R
ecla
mat
ion .
Ber
t Gre
en. .
W. C
.Gra
ble
.
U.S
. Bur
. of R
ecla
mat
ion -
Geo
rge
H. B
ower
.
.....d
o
.. d
o -
Car
l G.W
elty
.. . ....
C. F
. Sc
hmuc
k.- -
------
T.
R. S
tear
ns _
_
U.S
. Bur
. of R
ecla
mat
ion
....
A. R
oh
n
Ted
Lud
eman
..
1926
1942
1937
1938
1941
1940
1949
1949
19
3719
4019
4819
37
1937
1940
19
4819
40
1942
1939
1938
19
4019
41
1934
1949
19
35
1932
1938
1939
1941
1941
1940
1939
19
41
1942
1935
1949
19
40
1938
Dr
Dr
Dr
Dr
Dr
Dr
Dr
Dr
Dr
Dr
Dr
Dr
Dr
Dr
Dr
Dr
Dr
Dr
Du
Dr
Dr
Dr
Du Dr
Dr
Dr
Dr
Dr
Dr
Dr
Dr
Dr
Dr
Dr
Dr
Dr
Dr
Dr
Dr
Dr
Dr
Dr
Dr
Dr
265
300 85 45
.045 80 80
.
321 95 48
.0
28 57.0
53.0
256 57 80 50 125 20
.059
.0
247
133 13
042
2 80 86 35.5
200 51
.063
.0
138
146
500
582
468
112
445 54
.024
5 89.0
27.0
102
114 33
.0
P P P P P P P P P P PI P P P P P P P G P P P P P P PI P P P P P P P P P P P P PI P P
Cy,
EC
y, E
Cy,
EC
y, H
Cy,
E
Cy,
E N J, E
Cy,
EC
y,H
NC
y, H
Cy,
H NC
y, H
Cy.
EC
y, E
Cy,
GC
y, H
J, E
Cy,
EC
y, G
P, H
Cy,
EC
y, H
Cy,
E N NC
y, H
Cy,
H
Cy,
GC
y, G N
Cy,
E
Cy,
G
Cy,
EC
y,G
Cy,
HC
y, E
Cy.
E
NC
y, E
Cy,
EC
y, H
SD
, S
S 0 D,
S
S N D,
SD 0 0 S S N D.S
D,
SD
, S
D,
SS,
0D
, S
D,
SS
D.S
OD
, S
S S 0 N S S S S N S
D,
S
D D,
S0 D.S
D,
S
0 SD
, S
8,0
L L L Tea L
L Tea L Tea
Tea
Tea
Tea L L L L Tg Tea L L Pb L Tea L Tea
Tea L L L L L Tea L Tea
Tea L L Tea
5,28
95,
252
5,24
55,
238
5,27
4
5,27
55,
275
5,26
5 5,
280
5,27
0
5,26
0.6
5,25
1 5,
261
5,26
15,
283
5,27
55,
311
5,33
45,
269
5,33
4
5,39
15,
372
5,34
6 5,
400
5,40
1
5,40
05,
415.
3 5,
379
5,37
5 5,
356
5,38
45,
379
5,37
95,
379
5,33
5
5,35
35,
355
5,35
9 5,
359
5,35
3
5,28
5.7
5,28
95,
339
5,28
2
90 112 20 7.
86
18 40 50.7
0 18 15
.46
7.93
4
75
7.95
18 20 20 50 13
.23
8.05
156 33 4.
42
225 15
.33
40 12.3
7 10
.23
51 72 175 33 150 5.
12
116 36
.16
6.95
85 67 9.37
7-14
-48
10-1
8-48
7-16
-48
3-30
-51
9- 1
-48
9- 1
-48
9- 1
-48
9- 2
-48
9- 2
-48
3-30
-51
9- 3
-48
9- 3
-48
7-19
-48
9- 1
-48
3-30
-51 ,
9- 1
-48
L P GC
, L
L Ari
L GC
, SC
L SC,
L
SC,
LSC
, L
SC.L
SC L P P L P, L
SC,
P245
,L,
GC
SC
, L
SC,
LSC
, L
L L L
i i 2
S h? 3 S Kj 0 "d 3 $ f OJ >
Z e
ro
3 S V-, o W C£>
-J
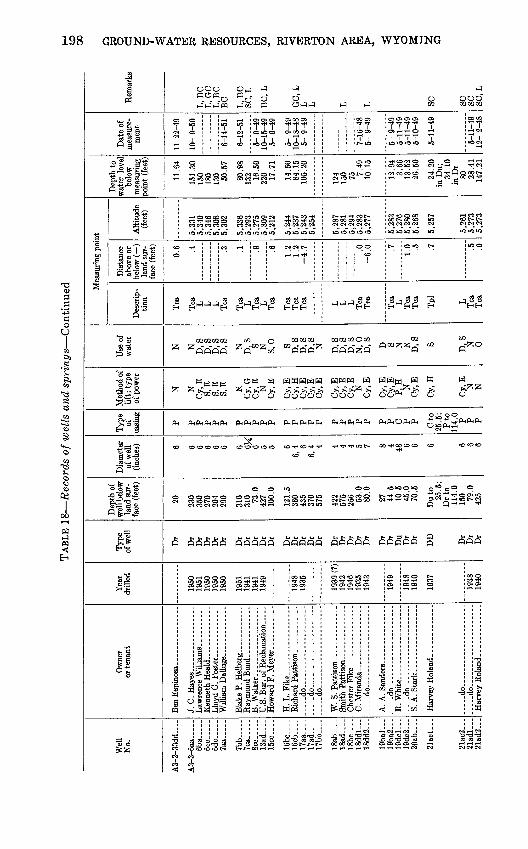
TAB
LE 1
8 R
ecor
ds o
f w
ells
and
sp
rin
gs
Con
tinu
ed
Wel
l N
o.
A3-
2-33
dd-_
.
6ba_
---
6cc.
_ .
6d
c -
7bb_
_-_-
7ca_
-_--
13ad _
15
cc-.
-_
16bc.
16cb
....
17aa -
17ad -
17bb _
18ab
-._.
1
8ad
18bc~
- 18ddl
18
dd2.
..
19
bal
19ba
2...
19dc
l_.-
19dc2
20
ab-_
-
21ac
l...
21ac
2__.
21ad
l._.
21ad
2...
Ow
ner
or te
nant
J. C
. Hay
es. ..
. .
Law
renc
e W
illia
ms .
.__.
__._
-K
enne
th H
eald
.... -
----
----
-Ll
oyd
G.
Fost
er. - ....
Will
iam
Dal
luge
..
. _ .-
..-_
U.S
. Bur
. of R
ecla
mat
ion _
..
H.L
. F
ike.
... ..............
.....d
o.... ..............
-- d
o- ... ..
..
-...
.do
-...
....
. .........
W. S
. Pat
tiso
n.-
-..-
. ...
.Sm
ith P
atti
son
_ -
_-_
.--_
_C
hest
er F
ike _
.. ..
-
.....d
o...
.. d
o. . .
do
.......
.......
-do .. ..
--..do -.
... ..........
Har
vev
Rol
and.
.. ... ....-
Yea
r dr
iUed
1950
19
51
1950
19
50
1950
1951
19
41
1941
19
49
1948
19
35
1939
(?)
19
42
1946
19
35
1943
1949
1948
19
40
1937
1938
19
40
Typ
e of
wel
l
Dr
Dr
Dr
Dr
Dr
Dr
Dr
Dr
Dr
Dr
Dr
Dr
Dr
Dr
Dr
Dr
Dr
Dr
Dr
Dr
Dr
Dr
Dr
Du
Dr
Dr
DD Dr
Dr
Dr
Dep
th o
f w
ell b
elow
la
nd s
ur
face
(fe
et)
20 230
350
270
204
290
310
310 73
.0
427
100.
0
121.
5 36
0 43
5 37
0 57
5
422
575
256 53
.0
80.0
27
44.5
10
.5
45.0
70
.5
Dut
o 25
.5;
Drt
o
114.
0 15
0 79.0
42
5
Dia
met
er
of w
ell
(inch
es) 6 6 6 6 6 6 6 6M
6 5 5 6
6,4 6
6,4 4 4 4 4 5 7 8 4 48
6 6 6 6 6 6
Typ
e of
ca
sing P P P P P P P P P P P P P P P P P P P P P P P C P P Cto
25
.5;
Pto
11
4.0
P P P
Met
hod
of
lift ;
type
of
pow
er
N N
Cy,
E
S.E
S
,E
S, E N
Cy,
G
Cy,
E
N
Cy,
E
Cy,
E
Cy.
H
Cy,
E
Cy,
E
Cy.
E
Cy,
E
Cy,
E
Cy,
E
N
Cy,
E
Cy,
E
Cy,
E
P, H
N
C
y,E
Cy,
H
Cy,
E N
N
Use
of
wat
er
N N
D,
S D
, S
D,
S D
, S
N
D,
S S N
S,
0 S D
, S
D,
S D
.S N D,
S D
, S
D,
S N
, 0
D,
S
D S N
N
D,
S
S
D,
SN
O
Mea
suri
ng p
oint
Des
crip
tio
n
Tea
Tea
L L L Tea
Tea
L Tea
L Tea
Tea
T
ea
Tea L L L Tea
T
ea Tea
L Tea
T
ea Tpl L Tea
T
ea
Dis
tanc
e ab
ove
or
belo
w ( )
la
nd s
ur
face
(fe
et)
0.6 .4 .3
.1 .9 .6 1.2
1.2
-4.7 .0
-6
.0 .7 1.0 .5 .7 .5
n
Alti
tude
(f
eet)
5,33
1 5,
340
5,34
6 5,
308
5,30
2
5,33
6 5,
293
5,27
5 5,
309
5,21
2
5,24
4 5,
237
5,24
3 5,
254
5,28
7 5,
281
5,29
4 5,
283
5,27
7
5,28
3 5,
276
5,28
0 5,
268
5,25
7
5,26
1 5,
273
S 27
3
Dep
th to
w
ater
lev
el
belo
w
mea
suri
ng
poin
t (f
eet)
11.6
4
151.
30
150
180
130 50
.57
80.9
8 13
2 16.5
0 22
0 17.7
1
14.5
0 84
.15
105.
20
124
150 75
7.49
10
.15
12.9
4 3.
66
13.5
2 26
.50
24.2
0 in
Du;
34
.10
in D
r 80
28
.41
147
21
Dat
e of
m
easu
re
men
t
11 2
2 49
10-
9-50
6-14
-51
6-12
-51
5-9-
49
10-1
5-49
5-
9-4
9
5- 9
-49
10-1
8-48
K
Q
4.Q
7-16
-48
5- 9
-49
5- 9
-49
5-11
-49
5-11
-49
5-10
-49
5-11
-49
5-11
-49
19
- 9-4
8
Rem
arks
L, B
C
L, G
C
L,B
C
BC
L, B
C
SC
.L
BC
, L
GC
, L
L L L L SC SC
SC
sn. T
,
CO
00
02 o o
H 5° so 3 M a
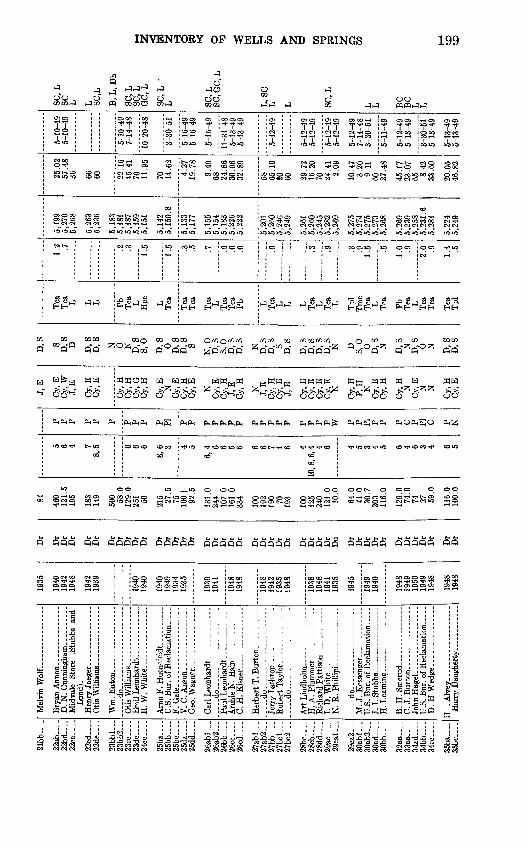
21
bb
22ab .
22bd
....
22
cc.
22cd _
22dc_
23bb
l._.
23bb
2.._
23
dc
25ba
....
25bb .
25da .
25dd .
26ab
l...
26ab
2...
26bb .
26
cd~
-
27ab
l...
27ab
2...
27bb _
27bcl
27bc
2.__
28
bc
28cb .
28dd
..._
29cal
29ca
2...
30ab
l.._
30ab
2...
30ad
....
30bb.
32aa
_...
34ad
....
34bb
....
35ba
..__
36bc
_...
Mel
vin
Wol
f... ..
....
. ......
Mid
vale
St
ore
(Stu
bbs
and
Lun
d).
Hen
ry J
aege
r.. .
......... ...
Wm
. E
aton
..
. _ ---
-- ...
do
U.S
. Bur
. of
Rec
lam
atio
n.-.
.. F.
Gal
e... ...
....
....
....
..
Geo
. Wag
ner.
. ---
----
----
-
doPa
ul L
eonh
ardt
.-..-
.....
Her
bert
T. B
urt
on..--
-.-.
..
doJe
rry
Lat
hrop
.. --
----
----
---
do
I. D
. Whi
te...
.. ..... ..
.....
N.
R.
Fhill
ipL
. --.
._
..
..... do......-- ...... -
M. J
. K
esse
nger
___
__._
._._
__
U.S
. Bur
. of
Rec
lam
atio
n _ ..
J.
I. S
tubbs.
....-.
.----
B.
H.
Sm
erud -
.-- - .-
U.S
. Bur
. of
Rec
lam
atio
n---
..
E . A
lvey
... -.-
-___-.
--.....
Har
ry D
aueh
erty
..
. .....
1935
1940
1942
1948
1942
19
39
1940
1940
1940
1949
19
3419
35
1939
1941
"""1
948"
""
1948
~"I
948"
~
1942
19
3519
48
1938
1948
1941
1938
1945
"1949""
"
1940
1948
1949
1950
1949
19
48
1948
19
48
Dr
Dr
Dr
Dr
Dr
Dr
Dr
Dr
Dr
Dr
Dr
Dr
Dr
Dr
Dr
Dr
Dr
Dr
Dr
Dr
Dr
Dr
Dr
Dr
Dr
Dr
Dr
Dr
Dr
Dr
Du Dr
Dr
Dr
Dr
Dr
Dr
Dr
Dr
Dr
Dr
Dr
Dr
84 460
121.
519
5
183
149
500 58
.012
9.0
251 50 215 27
.575 10
0+92
.5
131.
024
410
7.0
161.
033
4
100
192
190 70 193
100
125
240
121.
010
.0
64.0
41.0
30.7
203
116.
0
129.
074
.074 27 59
.0
116.
010
0.0
5 6 4 78,
5 6 6 6
8,6 3 4 5
6,4 6 6 5 6 6 6 7 4 6 4
10, 8
, 6, 4 4 6 4 5 3 4 5 6 4 6 3 4 6 5
P P P P P P P P P P PI P P P P P P P P P P P P P P P P W P P PI P P P C P PI c P N
J, E
Cy,
EC
y, W
J, E
Cy,
EC
y, E
Cy,
HC
y,H
Cy,
GC
y,H
V Cy.
EC
y, H
Cy,
E NC
y, E
Cy,
HJ,
EC
y, H N J,
EC
y, H
Cy,
EJ,
E
Cy,
EC
y.E
Cy.
EC
y, E N
Cy,
HP,
H NC
y,E
Cy,
H
Cy,
HN
Cy,
E N N
Cy,
HC
y,E
D,S S
D,
SD D.S
D,
S
N 0 N D,S
S, 0
D,
S 0 D,
SD
, S
S
N,
0D
,SS,
0D
, S
D,
S
N D,
SD
, S
SD
, S
D,
SD
, SD
, S
D,
SN D S, 0 0 D,
SN D,S N D,S 0 N D,
SD
, S
Tea
T
ea
L L L Pb
Tea
L Hpc
L Tea
Tea
T
ea
Tea
L Tea
T
ea
Pb L Tea
L L L Tea
L Tea
L Tpl
T
mc
Tea
L Tea Pb
T
ea
L Tea
T
ea
Tea
T
pl
1.2 .7 .2
.3
1.5
1.5 .3
.5 .7 .9
.0
.0 .9 .3 .9 .3
.9
1.
5 .5 1.0 .9 2.0 .9 1.4 .5
5,19
9 5,
270
5,26
8
5,26
35,
236
5,18
35,
181
5,18
7 5,
159
5,15
1
5,14
25,
150.
8
5,13
35,
177
5,15
5 5,
154
5,18
3 5,
226
5,22
2
5,20
15,
260
5,24
65,
249
5,26
15,
260
5,24
55,
282
5,26
9
5,27
5 5,
274
5,27
5 5,
273
5,26
8
5,26
9 5,
239
5,25
85,
231.
65,
281
5,22
4 5,
249
25.0
257
.48
36 66 60 22.1
6 45
.41
70 11.9
5
70 14.6
2
4.27
19
.78
9.49
68 24
.86
30.9
6 32
.89
58 65.1
0 20 60 29
.72
16.2
0 70 24
.41
2.09
10.4
7 3.
20
9.11
60 27
.48
45.1
7 23
.07
65 8.42
33
.60
20.0
5 46
.82
5-10
-49
5-10
-49
5-10
-49
7-14
-48
10-2
0-48
3-30
-51
5-16
-49
5-16
-49
5-16
-49
11-3
1-48
5-
13-4
9 5-
13-4
9
5-12
-49
5-12
-49
5-12
-49
5-12
-49
5-12
-49
5-12
-49
7-14
-48
3-30
-51
5-11
-49
5-12
-49
5-13
-49
3-30
-51
5-13
-49
5-13
-49
5-13
-49
SC, L
SC
L L SC
.L
B,
L, D
h
SC
,L
SC, L
GC
.L
SC
,L
'L SC
, LQ
p
/*)/
*
T
L.S
CL L SC
, L
L
L BC
B
C
L L
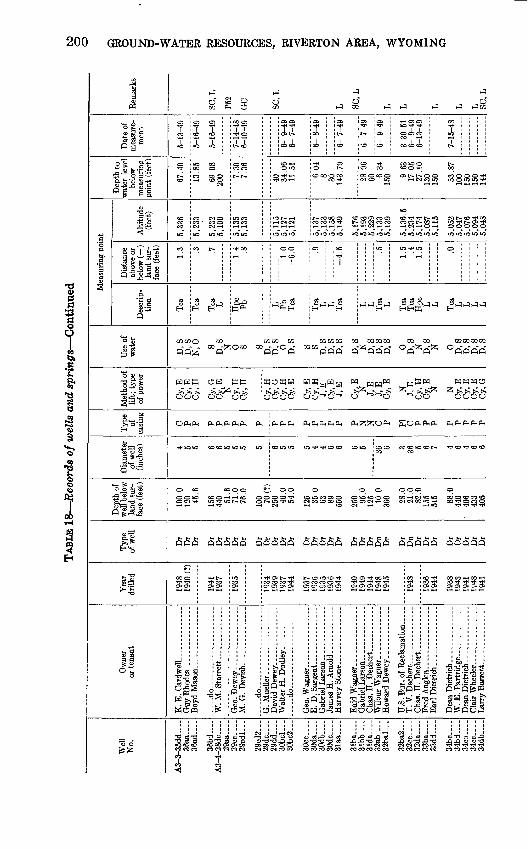
200 GROUND-WATER RESOURCES, RIVERTON AREA, WYOMING
TABLE 18 Records of wells and springs Continued
11
£|3
°1 .If^3 ' ' o n^-
^l^l'l o^3-g
-w ^^ao ^-> ,-,5 1°1|1 g Jjj-a^
iIN P~
11
13 P.S
11!a; M
a S-l
flfiajS
u,"O S.3)05 j^Jx **~i
°s
=36
1-3 1-5 J02 Pi O 03 1-503 tJi-;
05
1
So ^H
IP-
CO
U5
CO
§
Oi OS ^H ^CD CD
>a «5
U5 00
2 So
W5 W5 »O
S gjH H M
^oTTt- CO
OCOcocot-lr*
1C CO CO CO
W5 W3
-"
SsPw^
02000 02p'pV "Q *<=><" cr
OS Oi ^H -^
roipl-
COr-H O«5
o -^ *-<
r-HC^S
iffliraio
OOrt co
j£«
3 Sob *!.,0 CO
-t< O5o t^CDOOOCO
CO CO H3 -^ IP'
«««=« " oj «3
*n1
H^^H
CD CD COCO CD
O5 CO CD o S
(MCO^IO ^rtC^t
>n
O^ CM CO CO CO CO t-- O
1-5 H5
00 ^H
& 2Ir-
S COC «5C
J
hJoG
) »O fcO -^H
» fcO OS IP CD ^ OO
«««,« ««««« ««,«,««
U5 lO-^ilO
-1- SfS-
0
M SH3i-5h-)h-)
O3O3 O3 030202 CO O2EOO3 CO O3 02030303
PP P m pGP P PPP P C
KH « OH UH «0«H H« H H H S
QOQ QQ QQ [QOQO OO^O 1"5 C
5^ ^PPPP
l-jl-jQ i-^QQ QOQQ
QPiPi Pi pi Pi pi CL, Pi pipipi Pi fL, PI pi CL, Pi^;^;oPi EQP-iPH P_| p_| p_| p_| p_| p_|
^«S«5 COCO«,«« « C0«« ^^^HCOCO «0 COCO COCO^COt- ^.CO^
Ia3 SSS^ A5S a;..8 ,Sa S8 5SS»
COCO
3 r-H CO ^ OCO O * fcO -^ -^ Th Th
PPP ppppp ppppp PGPGP pppQp ppPPG PPPPP
ODOss
K.E.CardweU .......... Guy Rhodes..... _ .. __ .
^ C3U5 CO COCO
$ S§
r-HIP- ^f CO 01 01
I II o^* **a ^
§ SSo) 0 COC<,«
T5
W3
S
*o -c
n' (N
1 I
G. Mueller-. ........ ...... David Dewey.----.-.-.... Walter H. Dudley.. .......
_ -do. __________ .
Geo. Wagner.. -.----.--.-.
' T3 ""*' ^
.11 i i i
K. D.Sargent _ ........... Gabriel Larson ........ _ . James H. Arnold__------__ Harvey Stone. ............ Enid Waener..- __ . _ ..
§00rt £
Gabriel Larson .. __ __ .. Chas. H. Dechert. __ . __
Wilbur Wagner...- __ .-. Howard Dewey...... _ .. U.S. Bur. of Reclamation ...
T. V. Dechert
Chas. H. Dechert -------
HYpH AnffUti
^O-rt"0 ^ ^o °-rtJ *-H ~H CM <M <M CN1 <M e<eococoeo eocococ'1
3^ COCOr-iCOr-(3 -^ CO -^ -^ -^ -^
t lli $ B § Kd e^
4 a
'
1 if
e
|
Clair Wheeler..... ..-......-
Larry Barrett _____ ___
^
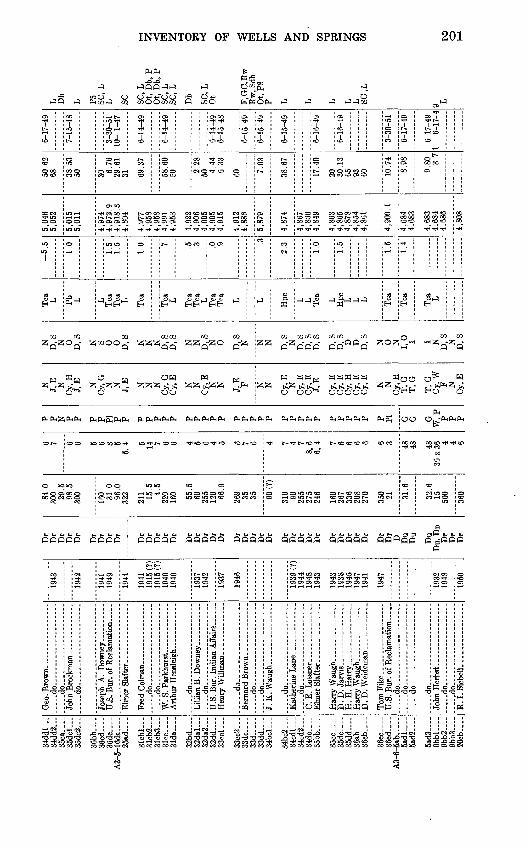
34dd
l.._
34dd
2...
35
ca
35dcl
35dc2
36bb.
36cd
... .
36dc -
A
3-5
-16da
.25
ad...
_
31cb
l...
31cb
2
31cb
3--
31da .
32bd
..._
32
dal
32da2
32
dd...
.33cc
l.-
33cc
2 33dc
33d. .
33
dd
. 3
4b
cl
34bc
2_...
34cdl
34
cd2.
..34dc
35
bb
--
35dc .
35
dd...
. 36ab -
36cb -
36cc-
36cd -
A3
-6-5
ab.
.5adl
5ad2 _
5ad3 -
9bbl
.9b
b2.._
.9
bb
3.
20cb
....
Geo
. Bro
wn.
. ...
....
....
. .do
....
.do
...-
. -..
...
..
....
.do
...
............ ...
U.S
. Bur
. of R
ecla
mat
ion.
.
.do -
do
-
.... _
do .
....
.da- .. -.-
....
.do
.
.....d
o
J. K
.Waugh ...........
do.
Kat
heri
ne L
ane.............
..... d
o. ... . ..
.. ..
.
D.
D. J
arvi
s -
. ..
. H
.H.H
arr
y . -
D. D
. Wei
dem
an -
-.-
Tom
Fik
e--
-
. d
o... ..
. ....... ..
. . d
o
.--d
o .....
..... d
o... .
.. ..
.. . ... ..
. -
.....d
o ......... ....-.
._... .
.do ... --
R. I
. S
iebel
l..... ....
"19
43
""
1942
1941
1949
1944
1941
1915
(?)
1915
(?)
1940
1940
1 Q
^7
1942
1 Q
^7
1946
------
1939
(?)
19
4419
4819
43
1943
1933
19
45
1947
1941
1947
1948
1950
Dr
Dr
Dr
Dr
Dr
Dr
Dr
Dr
Dr
Dr
Dr
Dr
Dr
Dr
Dr
Dr
Dr
Dr
Dr
Dr
Dr
Dr
Dr
Dr
Dr
Dr
Dr
Dr
Dr
Dr
Dr
Dr
Dr
Dr
Dr
Dr
D Du
Du
Du Dr
Dr
Dr
84.0
30
0 29.5
98.5
300
160 31
.0
96.0
322
211 15
.5 4.5
220
160 55
.560 255
120 66
.9
269 35 35 90
(?)
310 90
25
527
524
6
160
267
336
208
270
350 21 31
.6
32.6
15 500
360
6 7 6 6 5 6 3 55,
4 5 7 6 6 4 5 6 4 5 6 7 6 4 7 4 78,
66,
4 7 6 6 6 6 6
/to 48 48 4 4 6
P P N P P P P PI
P P P P P P P P P P P P P P P P P P P P P P P P P P P P PI G G GW
, P
P P P
N
J,E
N
C
y, H
J,
E NC
yN°
N
J, E N
N
N
C
y,G
C
y,E
N
N
Cy,
EN
N V N
N
Cy,
E
N
Cy,
E
W Cy,
E
Cy,
E
Cy,
H
Cy.
E
Cy,
E N
N
Cy.
H
T,G
T
, G
T,
G
Cy,
W
N
Cv.
E
N
D.S
N
0
D, S N S 0
0
D,
S
N
N
N
D,
S D
, S
N
N
D,S
N
0 D, S N N
N D,
S N
D
, S
D,
S D
, S
D,
S D
, S
D
D
D,
S
N
0
N
1,0
I I N
D
, S
N
D.S
Tea
L Pb
L L Tea
T
ea
L Tea
Tea
L Tea
T
ea
L Tea
T
ea L L Hpc L L Tea L Hpe
L L L Tea
Tea
Tea
L
-5.5 1.0
1.5
1.5
1 0 .7 .5
.3 .0 .9 .3
2.3
1.0
1.5
1.5
1.4
5,04
6 5,
052
5,01
5 5,
011
4,97
4 4,
972.
9 4,
918.
3 4,
804
4,97
7 4,
958
4,95
8 4,
991
4,95
3
4,92
2 4,
906
4,90
5 4,
905
4,91
5
4,91
2 4,
886
5,87
9
4,87
4
4,86
7 4,
886
4,84
9
4,86
3 4,
865
4,87
8 ,4
,854
4,
861
4,90
9.1
4,68
4 4,
683
4,68
3 4,
684
4,68
6
4,80
8
50.6
2 68 38
.53
50 30 6.76
29
.61
31 69.3
7
58.6
0 50 2.
28
50 4.44
6.
33
60 7.03
38.6
7
17.4
0
20
30.1
3 65
93
60 10
.74
8.98
9.80
3.
7
6-17
-49
7-15
-48
3-30
-51
10-
1-47
6-14
-49
6-14
-49
6-14
-49
6-15
-48
6-15
-49
6-15
-49
6-15
-49
6-16
-49
6-16
-49
3-30
-51
6-17
-49
6-17
-49
1 6-
17-4
L Dh
L P5
SC,
L L SC SC
, L
Ot,
Dh,
P
Ot,
Dh,
P
SC,
L SC
, L
Dh
SC, L
O
t
F.G
C.R
w
Rw
, Sd
h O
t, P8
P L L L L L S
C,L
9 Lto o
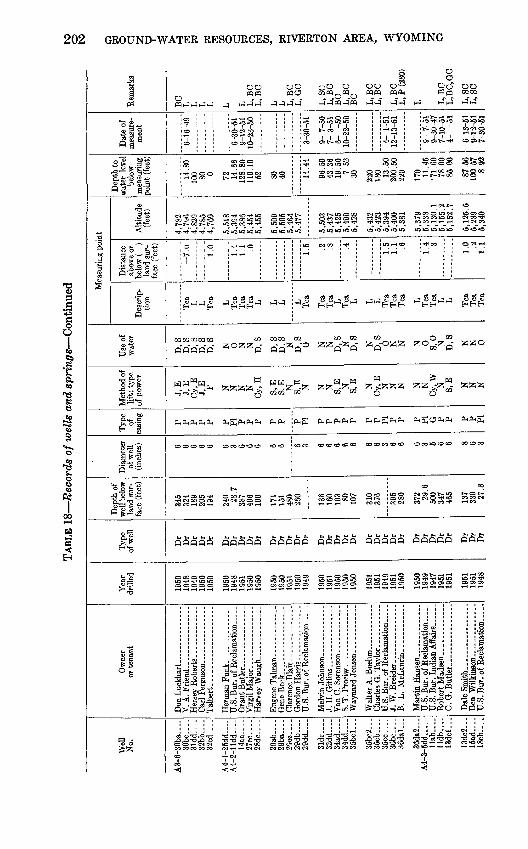
TABL
E 1
8 R
ecor
ds o
f wel
ls a
nd s
pri
ngs
Con
tinue
dto
Wel
l N
o.
A3-
6-30
ba._
- 30
bc.._
.31
dd._
- 32
bb.._
. 32
cd--
-
A4
-l-2
5d
d_
A
4-2
-lld
d -
14
aa...
.27
cc...
. 28dc -
29ab.
29ba-
..29
cc..-
- 29db .
2
9d
d .
Sid
e.--
32dd .
34ad -
34
dd...
. 35bcl
35bc
2..-
35cb
_
35cc
....
36bc -
36dal
36da
2...
A4-
3-5d
d....
_ ll
ab....
lldb....
13dc
l...
13dc
2...
15ad
.__.
18
cb...
.
Ow
ner
or te
nant
V. A
. Fri
end.
. ...
....
....
Car
l Fer
guso
n _ ............
Talb
ert
......
........
U.S
. Bur
. of R
ecla
mat
ion _ ..
Virg
il M
ajor.
.- -
..-.
--.-
..
Euge
ne T
alm
an.. . ....
Gor
don
Har
ris-
. ..
.-
U
.S. B
ur. o
f Rec
lam
atio
n _ --
J. H
. Git
lins
.... _
..... _ -
Van
C. S
oren
son.
. ---
._..-.
. S
.T.P
roci
w -
Wal
ter
A. B
oehm
.. __ ..
...
Cha
rles
G. T
aylo
r ...........
U.S
. Bur
. of R
ecla
mat
ion ..
J.
W. B
reid
er.. ..
....
....
...
U.S
. Bur
. of R
ecla
mat
ion _
_ .
C. G
. Butl
er
.............
Dal
e S
mit
h.. .
..............
U.S
. Bur
. of R
ecla
mat
ion _
..
Yea
r dr
illed
1950
19
48
1949
19
50
1950
1950
19
48
1951
19
50
1950
1950
19
50
1951
19
50
1949
1950
19
51
1950
19
50
1950
1951
19
51
1949
19
51
1950
1950
19
49
1947
19
51
1951
1951
19
51
1948
Typ
e of
wel
l
Dr
Dr
Dr
Dr
Dr
Dr
Dr
Dr
Dr
Dr
Dr
Dr
Dr
Dr
Dr
Dr
Dr
Dr
Dr
Dr
Dr
Dr
Dr
Dr
Dr
Dr
Dr
Dr
Dr
Dr
Dr
Dr
Dr
Dep
th o
f w
ell b
elow
la
nd s
ur-
'ace
(fee
t)
345
324
189
205
194
240 28
.7
387
406
100
171
151
480
260
136
160
103 80
10
7
310
376
395
280
372 29
.6
500
347
465
137
330 27
.3
Dia
met
er
of w
ell
(inch
es) 6 6 6 6 6 6 3 6 6 6 6 6 6 3 6 6 6 6 6 6 6 3 6 6 6 3 5 6 6 8 6 3
Typ
e of
as
ing
P
P
P
P P P PI
P
P P P P P
PI P P P P P P
P
PI
P P P PI
G
P P P P PI
Met
hod
of
lift;
type
of
pow
er
J, E
J,
E
Cy,
E
J,E
F N
N
N
N
C
y, H
S, E
S,
E
N
S, E N N
N
S, E
N
S
,E N
Cy,
E N
N
N N
N
Cy,
W
N
S,E N N
N
Use
of
wat
er
D,
S D
, S
D,
S D
,S
D,
S
N
0
N
N
D,
S
D,
S D
, S
N
D,S
0 N
N
D
, S
N
D,
S
N
D,
S 0 N
N N
0
8,0
N
D
, S N
N
0
Mea
suri
ng p
oint
Des
crip
tio
n
Tea
L L Tea L Tea
T
eaT
ea
L L L L Tea
Tea
T
ea
L Tea
L L L Tea
T
ea
Tea L Tea
T
ea
L L Tea
T
ea
Tea
Dis
tanc
e ab
ove
or
selo
w (
)
land
sur
fa
ce (
feet
)
-7.0 1.0
1.4
1.1 .0 1.5 .2
.8 .4 1.5
1.1 .6 1.4 .3 1.0 .2
1.
1
Alti
tude
(fee
t)
4,78
2 4,
796
4,82
9 4,
785
4,76
9
5,51
8 5,
394
5,38
6 5,
454
5,45
5
5,50
9 5,
505
5,46
45,
477
5,50
3 5,
437
5,42
5 5,
400
5,42
8
5,43
2 5,
423
5,39
4 5,
400
5,38
1
5,37
9 5,
338
5,13
0.1
5,15
5.2
5,15
2.7
5,12
5.5
5,23
9 5,
340
Dep
th to
w
ater
lev
el
belo
w
mea
suri
ng
poin
t (f
eet)
14.8
0 10
0 80 0 72
14.6
6 12
8.80
11
0.10
52 80
40 14
.44
96.5
0 43
.36
19.5
0 7.
52
30 220
180 13
.50
200.
50
220
170 11
.45
71.
60
78.0
0 85
.00
87.5
6 10
0.57
8.
92
Dat
e of
m
easu
re
men
t
6-16
-49
6-30
-51
9-12
-51
10-2
3-50
3-30
-51
9-7-
50
7- 3
-51
ft
Crt
10-2
2-50
4 1
5112
-13-
51
9- 7
-51
9-30
-47
7-10
-51
4-
-51
9-12
-51
7-30
-51
Rem
arks
BC
L L L L L L L,
BC
L
,BC
L L L,B
C
L, G
C
L, S
C
L, B
C
BC
L,
BC
B
C
L, B
C
L,B
C
L.B
C
L, P
(28
0)
L L, B
C
L.B
C.G
C
L, S
C
L, S
C
o
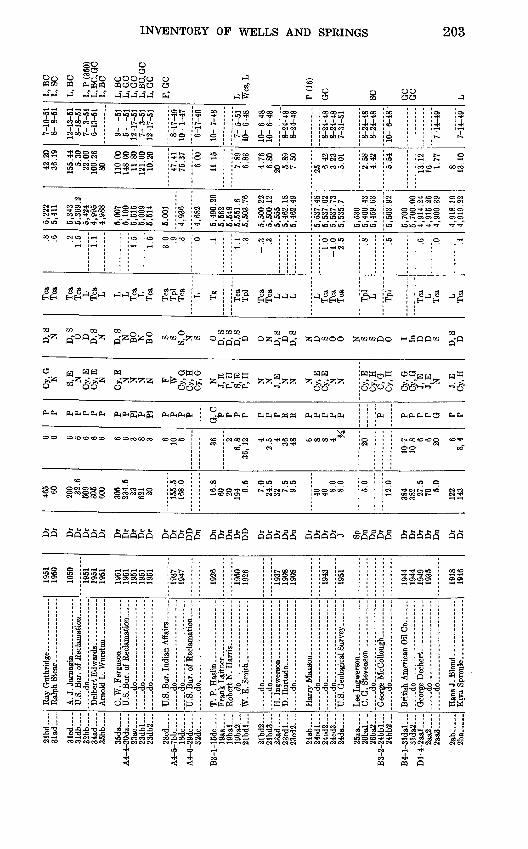
21bd
_._.
31ad
.-_
31cd
_.__
31db
32bb
.___
34ad
35bb
35da
A4-4
-20da
23dbl
23db2
28cd .
A4
-5-7
bb
18dc
..._
A4-6
-29dc
3
2d
c
B3-l
-15dc
.19aa .
19
bal
19ba
2...
21bd
l___
21bd
2.__
21bd3
23
ad
23cdl
23cd
2...
94. a
h
24cdl
24cd
2
24cd
3
9 A
H a
26ba
l- .
26ba
2...
B3-2
-24bbl
24bb
2...
B4-
l-31
dal.
..31
da2.
__D
l-4-
2aal
.._ .
2aa2
_._
_2
aa3
2ab .
2ba.
....
U.S
. Bur
. of R
ecla
mat
ion ..
--.d
o
U.S
. Bur
. of R
ecla
mat
ion _
. --.d
o... ...
. d
o
d
o
. d
o
. ...
-...d
o
..... d
o
...... ..
.
T.
P. H
asl
in.. ...... .
...
.d
o.
.
W. E
. S
mit
h.. ..
.. ..
....
..... d
o
..
do -
.... .d
o ..
. ... ..
.d
o..
. ............ ......
..... d
o... .
.... ...
. .. .
...
... .
.do... .
....
.
..... d
o- ... ..
. ... ..
... .
.do
....
. ................
Han
s J.
Blo
nd
...
...
...
Kw
a S
prou
le...
..
1951
1950
1950
"~195l"
"
1951
1951
1951
1951
19
5119
5119
51
1937
1947
1926
1950
1926
1937
1908
1908
1943
1951
1944
1944
1949
1935
1918
1946
Dr
Dr
Dr
Dr
Dr
Dr
Dr
Dr
Dr
Dr
Dr
Dr
Dr
Dr
Dr
DD
Du
Du
Dr
Dn
Dr
DD
Dr
Dr
Dr
Du
Du
Dr
Dr
Dr
Dr J Sp Du
Du Dr
Du
Dr
Dr
Dr
Dr
Du Dr
Dr
465 60 200 32
.6
509
305
600
305
234.
5 23 621 20 155.
516
8.0
16.8
60 20 194 9.
5
7.0
24.5
32 7.5
9.5
40 40 8.0
8.0
5.0
12.0
384
382 27
.570 5.
0
122
143
6 6 6 6 6 6 6 6 6 3 8 3 6 10 5 36 26,
836
, 12 4
2.5 4 36 48 6 8 8 4 */
20
10-7
10-8 6 6 20 6
8,4
P P P P
P P P P P PI P PI P P P P
G,
CP P P P P P P K K P P P P P P P P P P G P P
V S, E N
Cy,
Erv
i?
Cy,
E
r*_.
TH
Cy,
E
N N N F WC
y.G
Cy,
HC
y, G
N J,E
P, H
S,E
P, H N N J, E N N N
Cy.
B
N N
Cy,
EC
y, H
C,G
Cy,
H
Cy,
GC
y.G
J, B
J, E N J,E
Cy.
H
Tea
T
ea
Tea
T
ea
L Tea
L L L Tea
L Tea
Tea
Tpl
Tea L Tg
Tea
T
pl
Tea
T
ea
L L L L Tea
T
ea
Tea ¥ Tpl
Tea L Tea
L Tea
.8
.6 .2
1.5
1.1
1.5
1.5
3.0 .9 .3 .6
.1
1.1 .3
__
Q ^3 1.0
-1.0
2.
5 .8 .5 .6 .0 .4
5,22
2 5,
411
5,34
3 5,
369.
2 5,
424
4,99
5 4,
988
5,00
75,
100
5,51
5 5,
009
5,51
4
5,00
1
4,93
6
4,68
2
5,49
0.29
5,
562
5,54
85,
551.
6 5,
503.
76
5,50
0.22
5,
500.
12
5,55
55,
462.
185,
462.
49
5,53
7.48
5,53
7.62
5,
537.
73
5,53
5.7
5,53
05,
460.
43
5,45
9.63
5,56
3.92
5,70
05,
700.
004,
914.
244,
915.
254,
900.
39
4,91
8.19
4,91
9.22
42.2
0 36
.19
155.
44
5.30
22
.00
100.
26
80 110.
0014
8.00
11.8
0 12
1.00
10.2
0
47.4
175
.37
6.66
11.1
5
7.89
6.
83
4.76
6.
80
20 5.89
7.50
25 6.42
3.
23
5.01
2.58
4.
42
5.54
13.1
216 1.
77
8 13.1
0
7-10
-51
8- 8
-51
12-1
3-51
8-
18-5
1 7-
3-5
16-
13-5
1
9-
-51
5-
-51
12-1
7-51
7-
3-5
112
-17-
51
8-17
-49
10-
1-47
6-17
-49
10-
7-48
7- 5
-51
10-
6-48
10-
6-48
10
- 6-
48
8-24
-48
8-24
-48
8-24
-48
8-24
-48
7-31
-51
8-24
-48
8-24
-48
10-
6-48
'
7-14
-49
7-14
-49
L.B
C
L, S
C
L.B
C
L, P
(35
0)L
.BC
.GC
L,
BC
L,B
CL,
GC
L, G
C
L.B
C.G
CL
.GC
F, G
C
L Wcs
.L
P(1
6)
GC
SC GC
GC
L
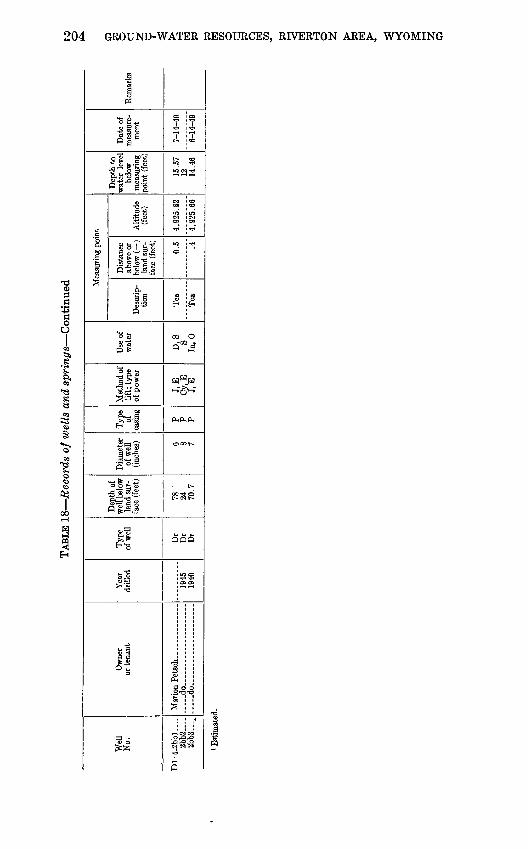
204 GROUND-WATER RESOURCES, RIVERTON AREA, WYOMING
O
13
1
|j|
|l|
il1 ^^
i 1.1Q^
II
il>» O'K
in'sj Si l"«ll
l! s!
i!
=3 .
f f^fl *<J«
O ^
s s
O TJ<
o
u S
CQ O
535,,».«,000^
t>- C3 t^-
Q Q Q
II
Marion Petsch _______ .
.....do....... .............. .....do.....................
322,0-a-a
,XQ
INDEX
Abstract. -----_--__-_-_------_________Acknowledgments ___.____..._j..__.._...Agriculture in the area.----------------.Alluvial deposits, drainage_____._....__
features- --___-_--------_-__-_____-occurrence of ground water________--
Aquifer tests, adjustments of data.-_..--_ computation of transmissibility and
storage coefficients____--__.estimate of well-field performance. _.- procedure -___--_---_---______-___-relation to project area_--...----.-
Aquifers, movement of ground water..-.--
Climate of the area_.-__._-----.-..._... Cody shale, features.--------_-__-----_-
occurrence of ground water._________Colluvial-alluvial deposits, features..-_._.
occurrence of ground water _________Cottonwood Creek, mean discharge.--.--.
Discharge of ground water, by evapo-transpiration..... _--__.__.-
by streams and drains.-------------into lakes_________________________into wells and springs.-_____________
Drainage system._---___------__.----._Drawdown data. See Hydraulic boundaries.
Erosion, by precipitation.-.- by wind--...-.---..--- factors determining rate-
Extent of the area..-.------
Page 1-2
6 12
39-40 38
38-39 56-63
63-66 68-69 53-56 69-70 49-51
8-11 23 23
35-3636-37
22
5151-5252-53
5318-19
181815
3-4
Fivemile Creek, maximum discharge- ----- 20mean discharge.------------------- 19-20minjmum discharge __.___------- 20problem of minimizing erosion. .___.. 21
Fluctuations of water level in wells. ------ 43-46Frost-free season, range and average
duration. _ ___.._.______... 11
Geologic history..---._...__-----_..-___ 14
Hydraulic boundaries - 57, 62, 63, 64, 65, 66-68, 69
Industry in the area.---------.---_-_--- 12Inventory of wells and springs._------. 175-204Irrigation, history of-------------------- 12-13
Location of the area.------------------- 3-4Logs of wells---..-..-_------------ 131-174
Mapping methods.--------------------- 6Mineral constituents of ground water. - 74-76, 78,
79, 80, 81, 82, 83, 84
PageMineral constituents of surface water. -_ _- 76-77 Mineral substances in rocks and soils. . . .. 86-90Movement of ground water, in confined
aquifers------------------- 50-51in unconfined aquifers__----------- 49-50
Muddy Creek, maximum discharge.------ 21mean discharge-.----------.-.----- 21sedimentation _ ------------------- 22
Piezometric-surface depth-__-___----- 42-43, 70Playa deposits, features----------------- 41Precipitation, annual____-.------------- 8,9
cumulative departure from average-.. 10-11monthly_ _____-______.._________ 11
Previous investigations------------------ 5Purpose and scope of investigation. ..--.- 5
Quality of ground water, general --------- 70-72Midvale district-.-_ 73, 74-75, 78, 80-82 miscellaneous wells.-.-.-.---------- 76Muddy Creek terraces..---------- 73,76,83North Pavillion area_---------- 76,82-83North Portal area-...----..--------- 76,83Riverton-Le Glair district--------_ 72-80
Quality of surface water.------..-------- 76-77Quality of water in relation to drainage. . . 85-86 Quality of water in relation to use.. __-_._ 90-92
Recharge to the ground-water reservoir,from irrigation_.....___.-__ 47-48
from precipitation.----------------- 47from surface-water infiltration .__--._ 48-49
Recovery data in wells during aquifer test- 62
Se'asonal fluctuations in quality of water.. 83-85 Storage coefficients. See Aquifer tests. Streams, direction of flow.__.._.-__.
Terrace deposits, description ______--_.development- _ ---------------------drainage ____..._.-_.__-_.-__-_---.occurrence of ground water....-----.
Transmissibility values. See Aquifer tests.
Water-table depth_.--------__--_------.Water-level measurements for wells in the
18-19
27-31 15-18 32-35 31-32
41-42
area.--.-..-___-------- 99-130Water-level measurements in wells during
aquifer test----------------Well-field performance, estimates_-------Well-numbering system._._____-_---_--.Wind River, mean discharge..----..---..Wind River formation, areal extent.------
influence on drainage.--------------lithologic character..---_._---.-_--- occurrence of ground water.---------thickness- _ _ ----------------------
58-6268-69
6-8192327
24-25 26 26
U. S. GOVERNMENT PRINTING OFFICE: 1959 42869O
205