ground water quality and quantity in europe
TRANSCRIPT
Technical report No 22
Groundwater quality and quantity in Europe
Data and basic information
Prepared by:
A. Scheidleder, J. Grath, G. Winkler, U. Stärk, C. Koreimann and C. Gmeiner,
Austrian Working Group on Water; P. Gravesen,
Geological Survey of Denmark and Greenland; J. Leonard, International Office for Water;
M. Elvira, Centro de Estudios y Experimentación de Obras Públicas; S. Nixon and J. Casillas, Water Research Centre;
T. J. Lack, ETC-IW Leader
July 1999
Project manager: Niels Thyssen
European Environment Agency
2
Cover design: Rolf Kuchling, EEA Legal notice The contents of this report do not necessarily reflect the official opinion of the European Communities or other European Communities institutions. Neither the European Environment Agency nor any person or company acting on the behalf of the Agency is responsible for the use that may be made of the information contained in this report. A great deal of additional information on the European Union is available on the Internet. It can be accessed through the Europa server (http://europa.eu.int) ©EEA, Copenhagen, 1999 Reproduction is authorised provided the source is acknowledged Printed in Copenhagen Printed on recycled and chlorine-free bleached paper European Environment Agency Kongens Nytorv 6 DK-1050 Copenhagen K Denmark Tel: +45 33 36 71 00 Fax: +45 33 36 71 99 E-mail: [email protected]
3
Table of contents
1. Introduction ....................................................................................................4
2. Groundwater quality and quantity in Europe ..................................................5
3. Contents of the technical report .....................................................................6
References ........................................................................................................95
Groundwater quantity and quality questionnaire ..............................................95
�
4
1. Introduction
This technical report contains detailed data which are underlying the information evaluated and presented in the EEA Environmental Assessment Report “Groundwater Quality and Quantity in Europe”, European Environment Agency (1999). Data were mainly received from questionnaires distributed to 44 European countries through the EEA´s Environmental Information and Observation Network (EIONET). These countries include the 18 EEA member countries, 13 Phare countries, 7 Tacis countries and 6 other European countries. Responses were received from 37 countries. The questionnaires were structured as follows: 1. General data on pesticide usage/sales. 2. Nitrate monitoring data. 3. Pesticide monitoring data. 4. Monitoring data on chloride, pH-value, alkalinity and electrical conductivity. 5. Other relevant sources of pollution. 6. Quantity data on inland water/groundwater. 7. Areas with groundwater over-exploitation. 8. Wetlands endangered from groundwater over-exploitation. 9. Most important human interventions affecting groundwater. 10. National strategies to improve groundwater quality and quantity. Additional information was found in reviews of literature and reports (e.g. National State of the Environment reports), reports prepared by international organisations (including EUROSTAT, FAO, OECD) and on the World Wide Web.
5
2. Groundwater quality and quantity in Europe
The European Topic Centre on Inland Waters (ETC/IW) has prepared an Environmental Assessment Report on groundwater quality and quantity on behalf of the European Environment Agency (EEA). The report also provides the basis for the groundwater chapter of the updated review of ‘Europe’s environment — the second assessment, 1998’ and for the groundwater aspects of the report ‘Environment in the European Union at the turn of the century’. It will also aid the European Commission’s review of progress made in implementing the 5th Environmental Action Programme "Towards Sustainability". The assessment report provides overviews (largely in the form of maps and other geographical applications) of groundwater status using key quality indicators such as nitrate, pesticides, chloride, pH, alkalinity and electrical conductivity. Indicators used for the evaluation of groundwater quantity issues include identification of areas with groundwater over-exploitation, saltwater intrusion and wetlands endangered by groundwater over-exploitation. Important human interventions in the hydrological cycle are also considered. The report follows where possible the, DPSIR framework for Integrated Environmental Assessment: Driving forces, Pressures, Status, Impacts and Responses.
6
3. Contents of the technical report
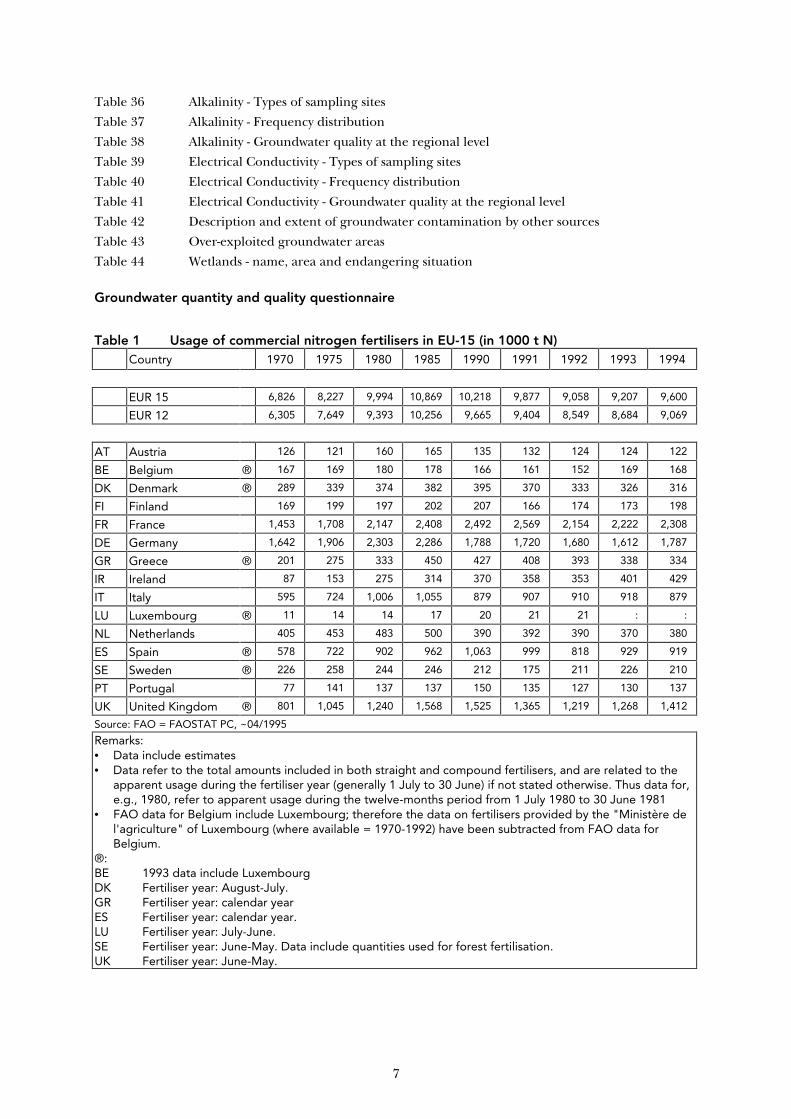
The information used in the assessment report on groundwater quantity and quality is listed below and then presented in the following pages. The questionnaire distributed to EEA National Focal Points through EIONET is also included. Table 1 Usage of commercial nitrogen fertilisers in EU-15 (in 1000 t N)
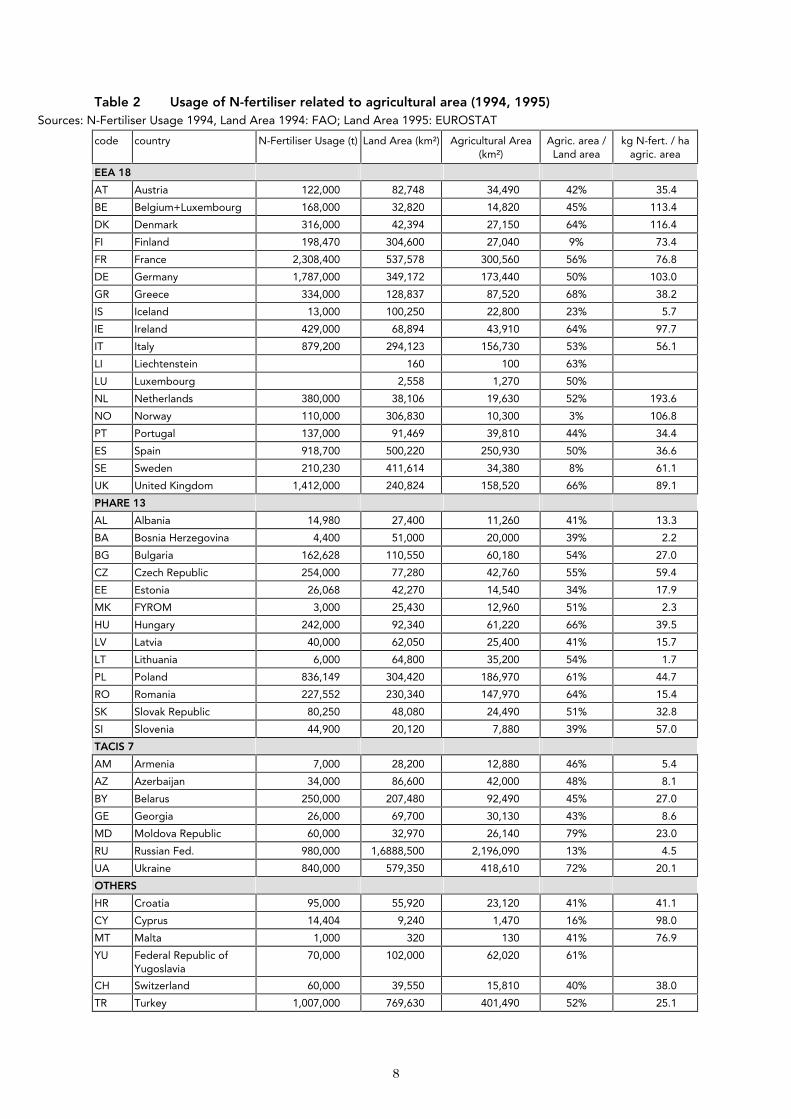
Table 2 Usage of N-fertiliser related to agricultural area (1994, 1995)
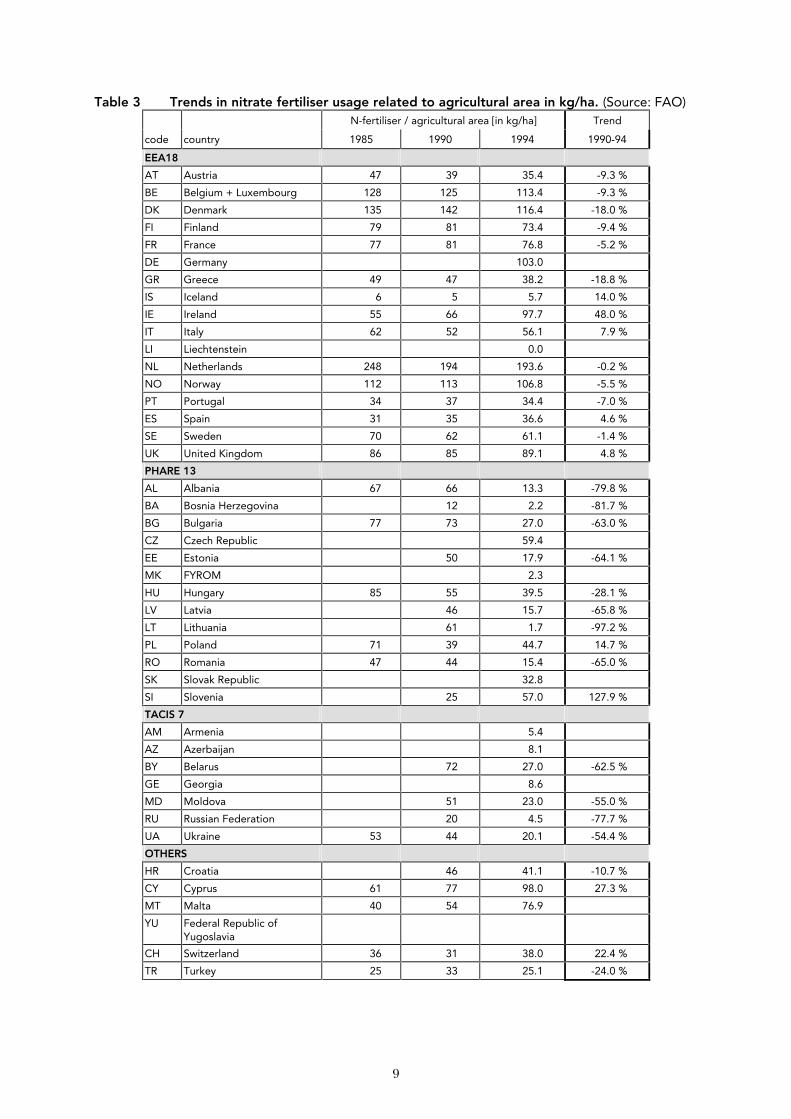
Table 3 Trends in nitrate fertiliser usage related to agricultural area in kg/ha.
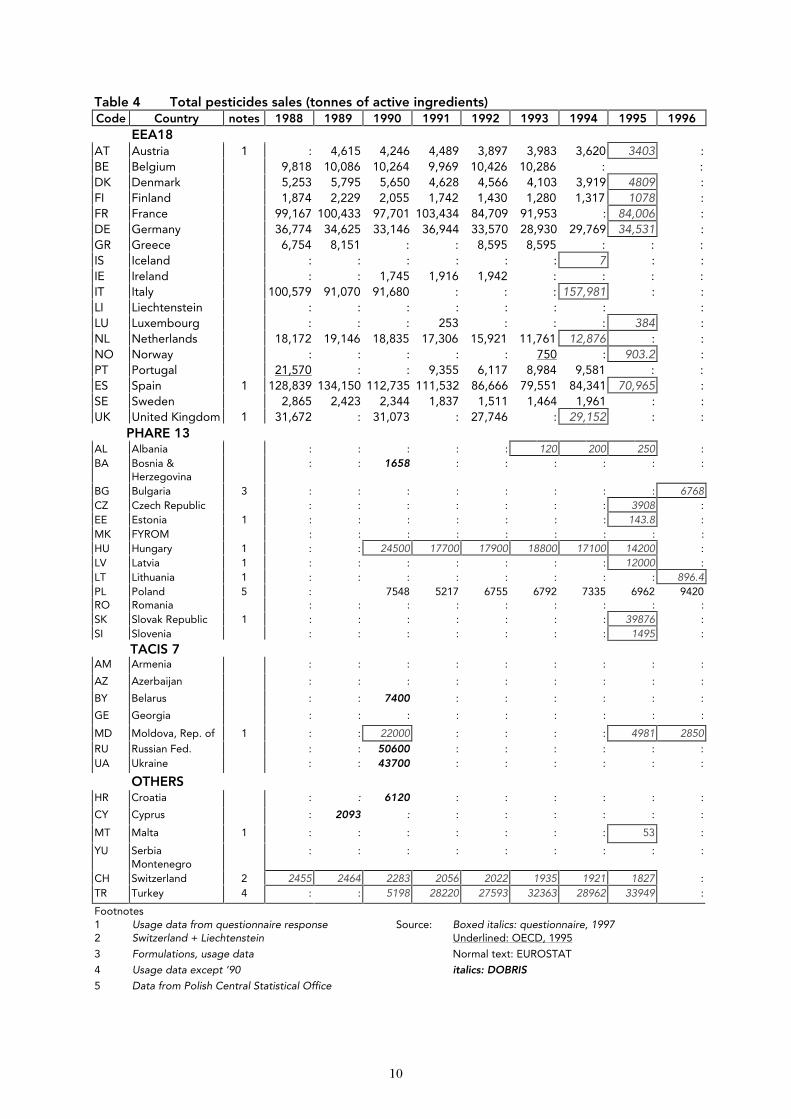
Table 4 Total sales/usage of pesticides (in tonnes of active ingredients).
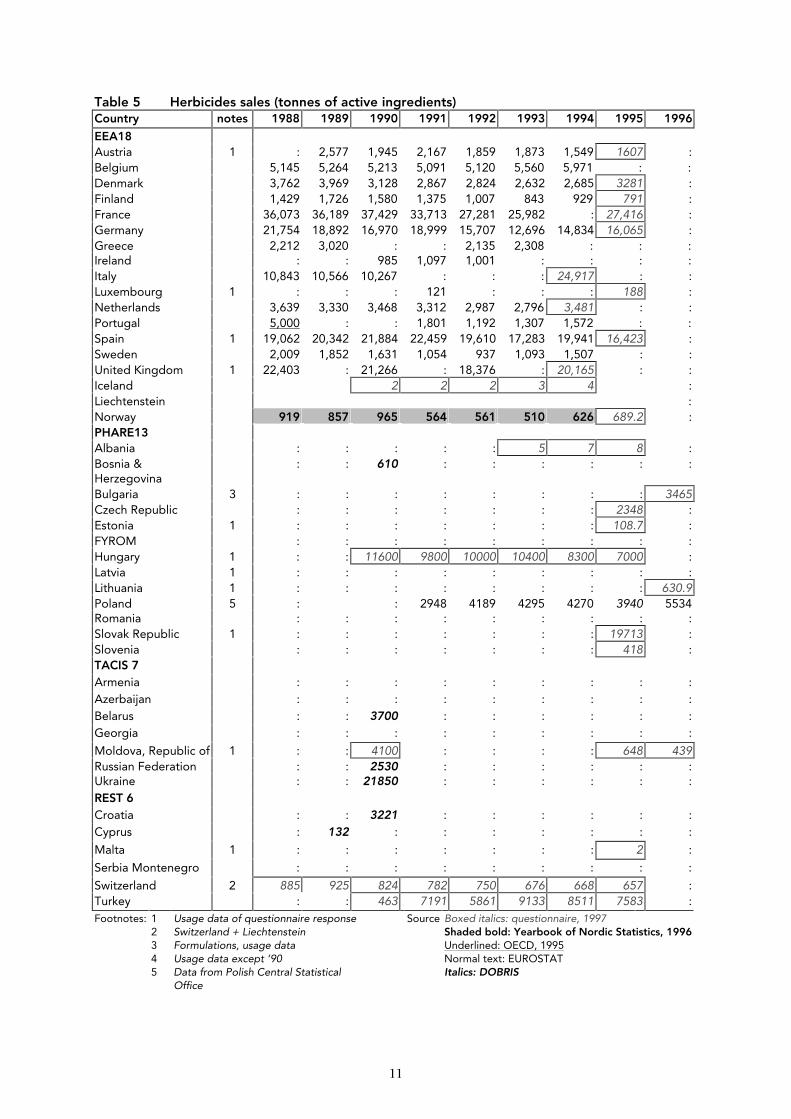
Table 5 Total sales/usage of herbicides (in tonnes of active ingredients).
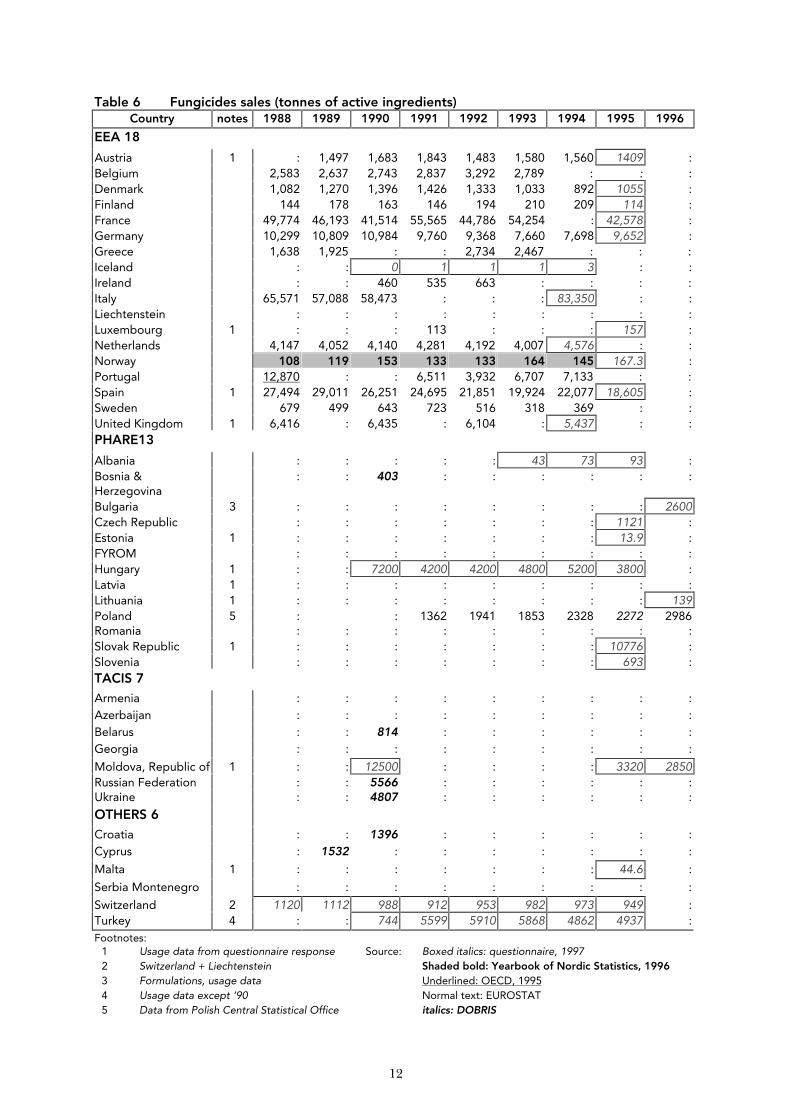
Table 6 Total sales/usage of fungicides (in tonnes of active ingredients).
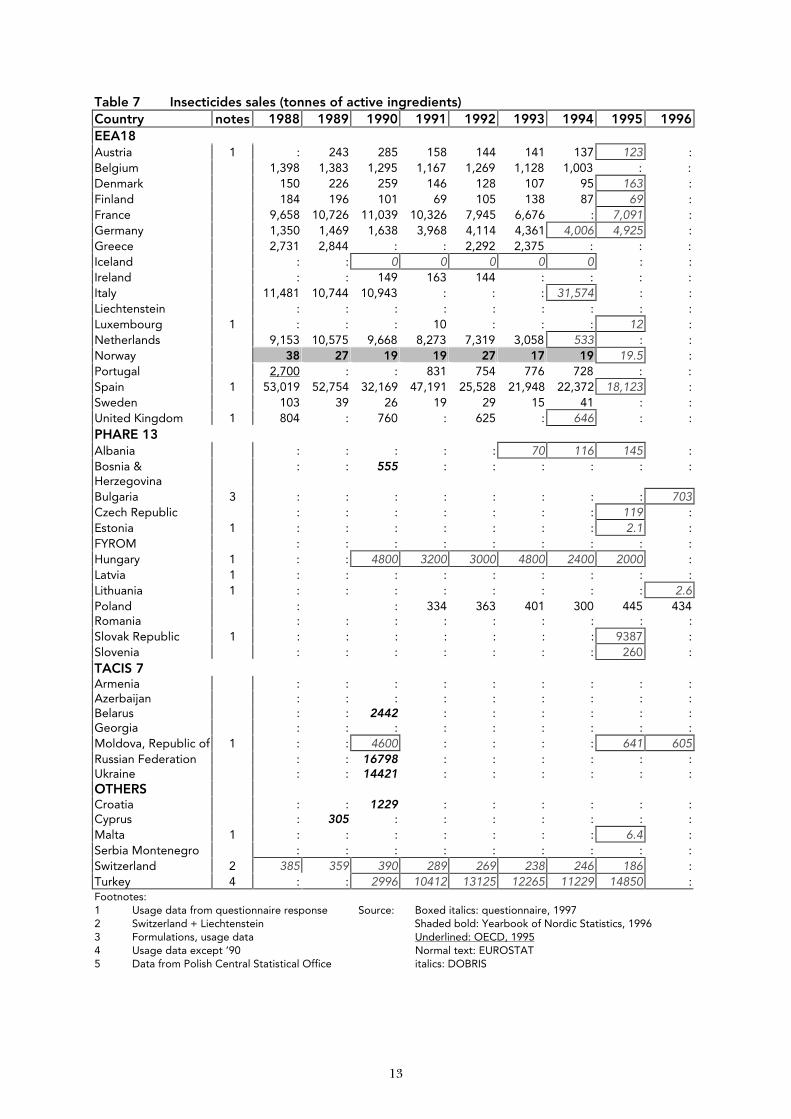
Table 7 Total sales/usage of insecticides (in tonnes of active ingredients).
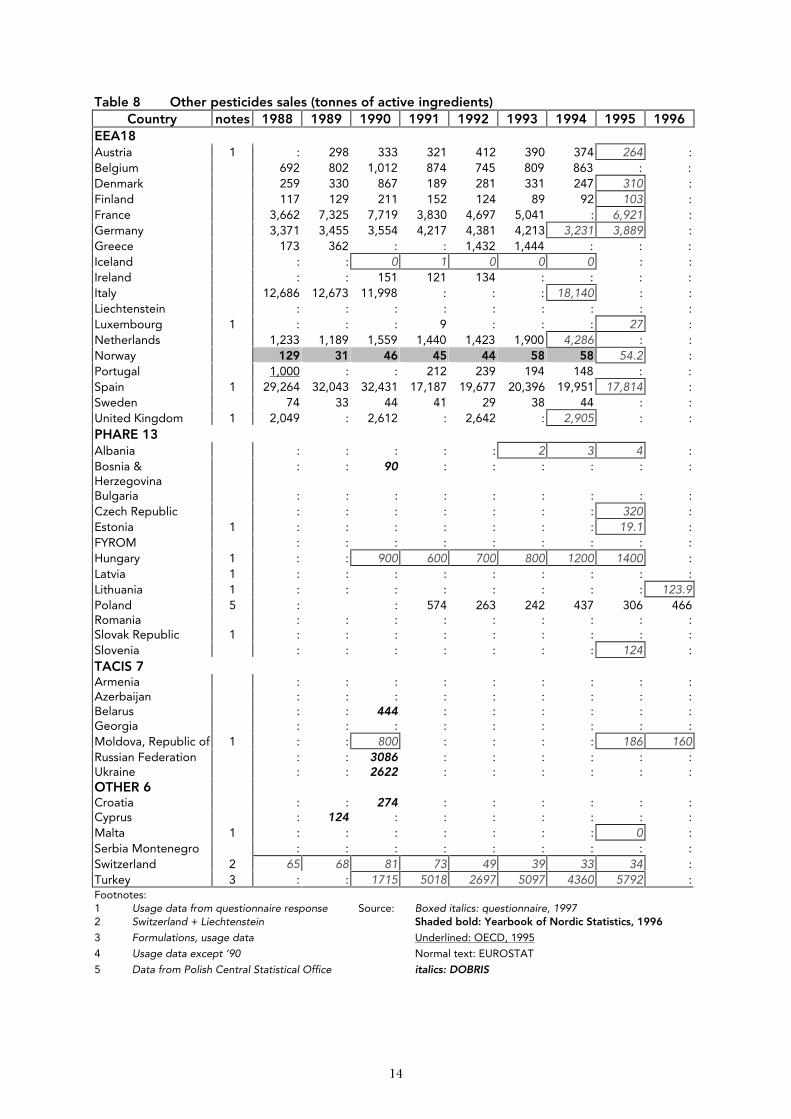
Table 8 Total sales/usage of other pesticides (in tonnes of active ingredients).
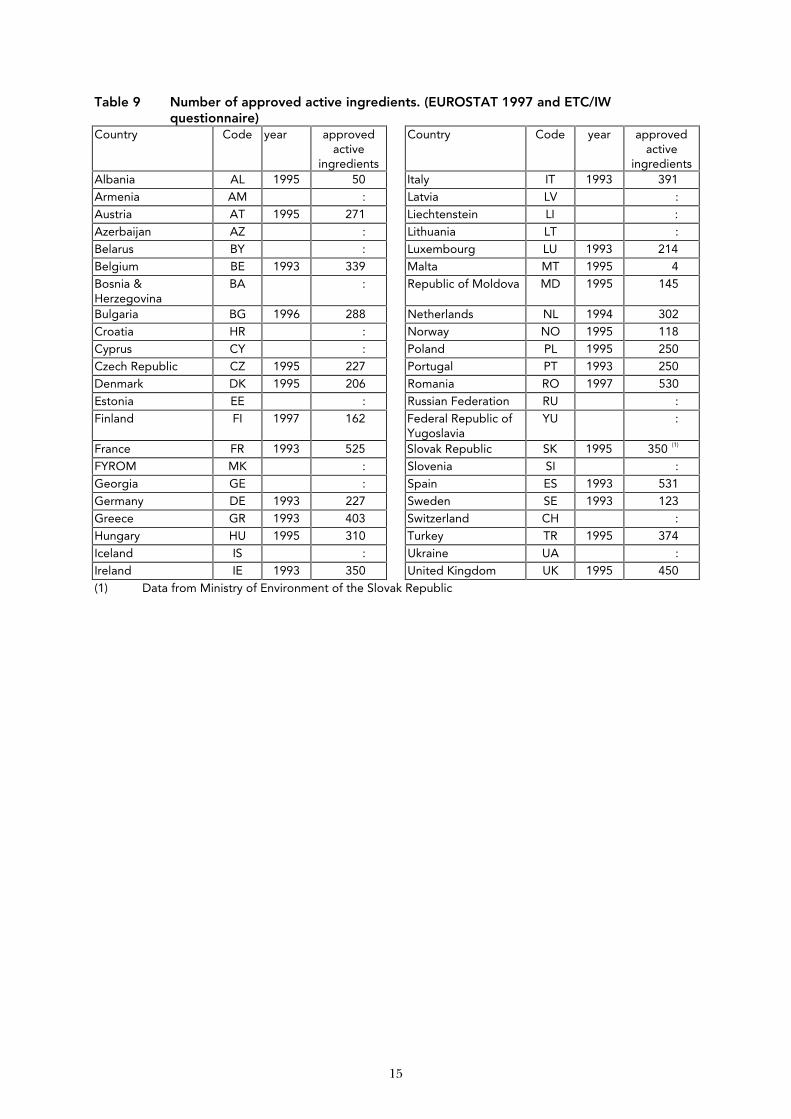
Table 9 Number of approved active ingredients
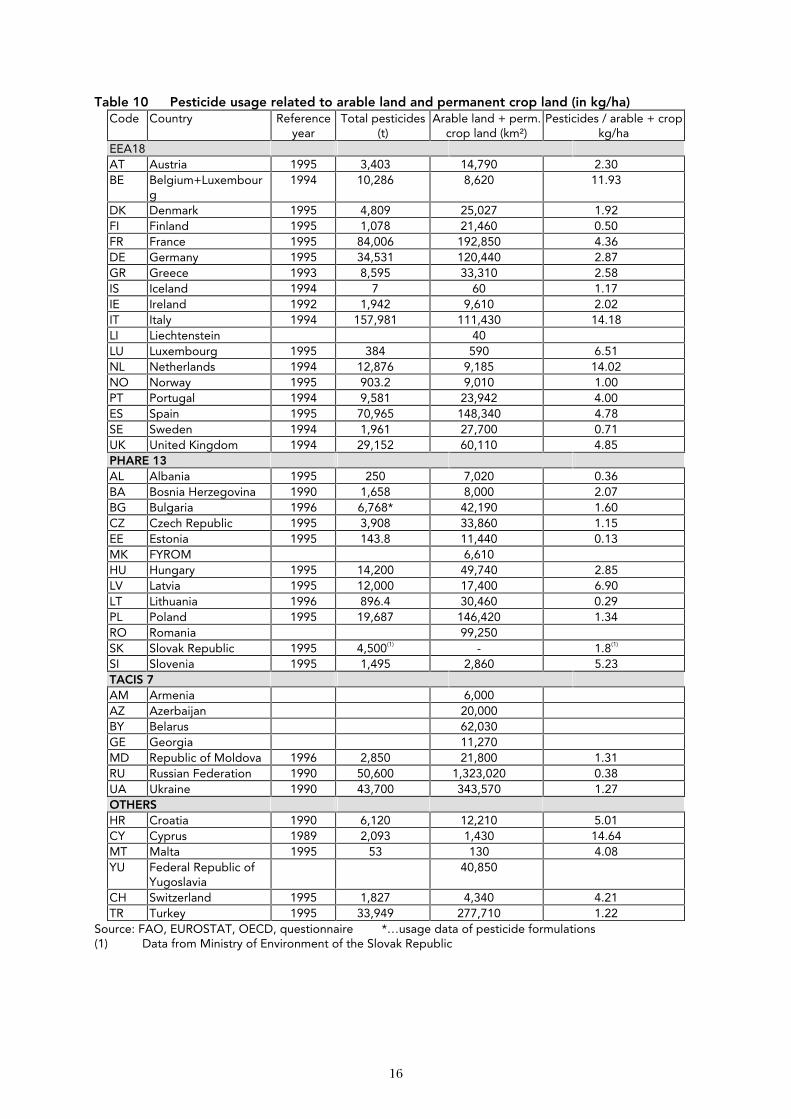
Table 10 Pesticide usage related to arable land and permanent crop land (in kg/ha)
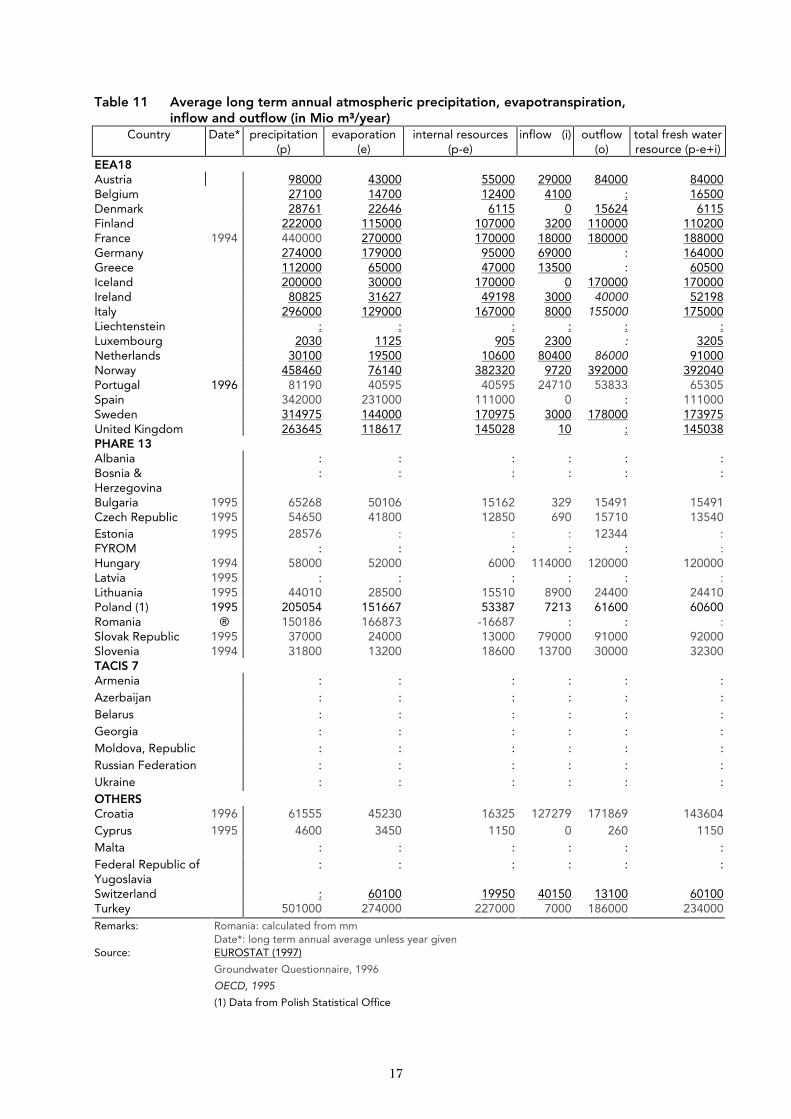
Table 11 Average long term annual atmospheric precipitation, evapotranspiration, inflow into the country and outflow (in Mio m³/year).
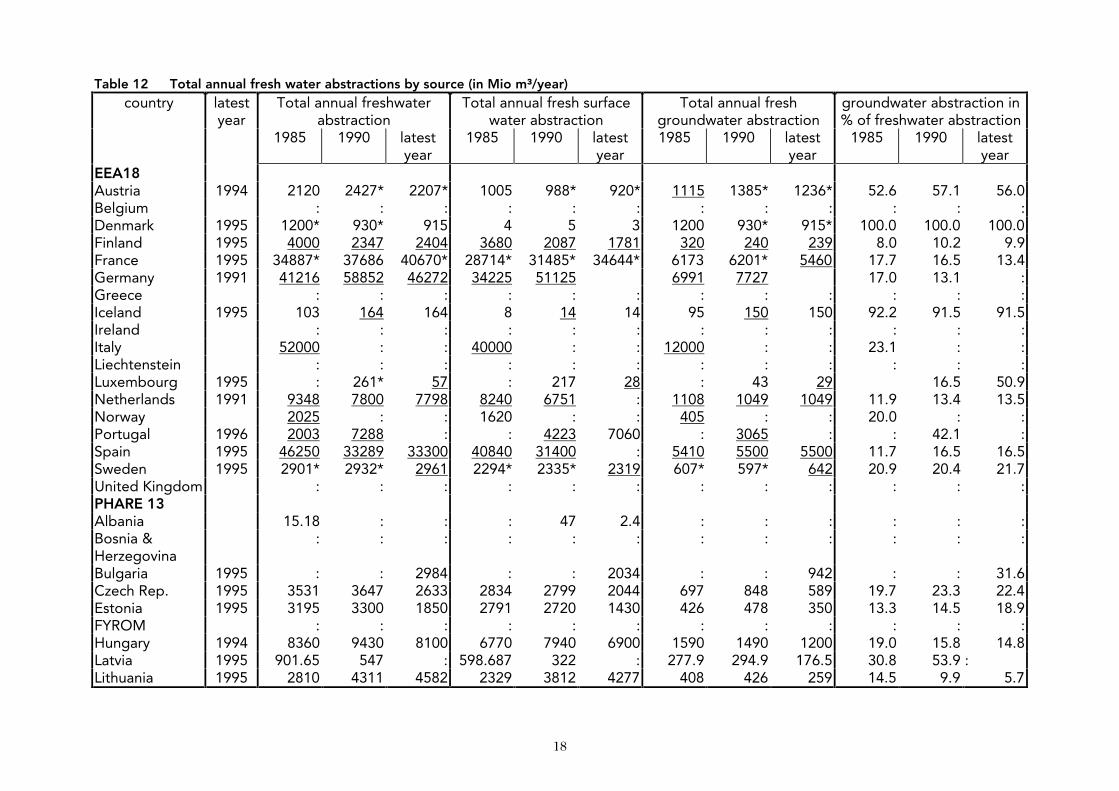
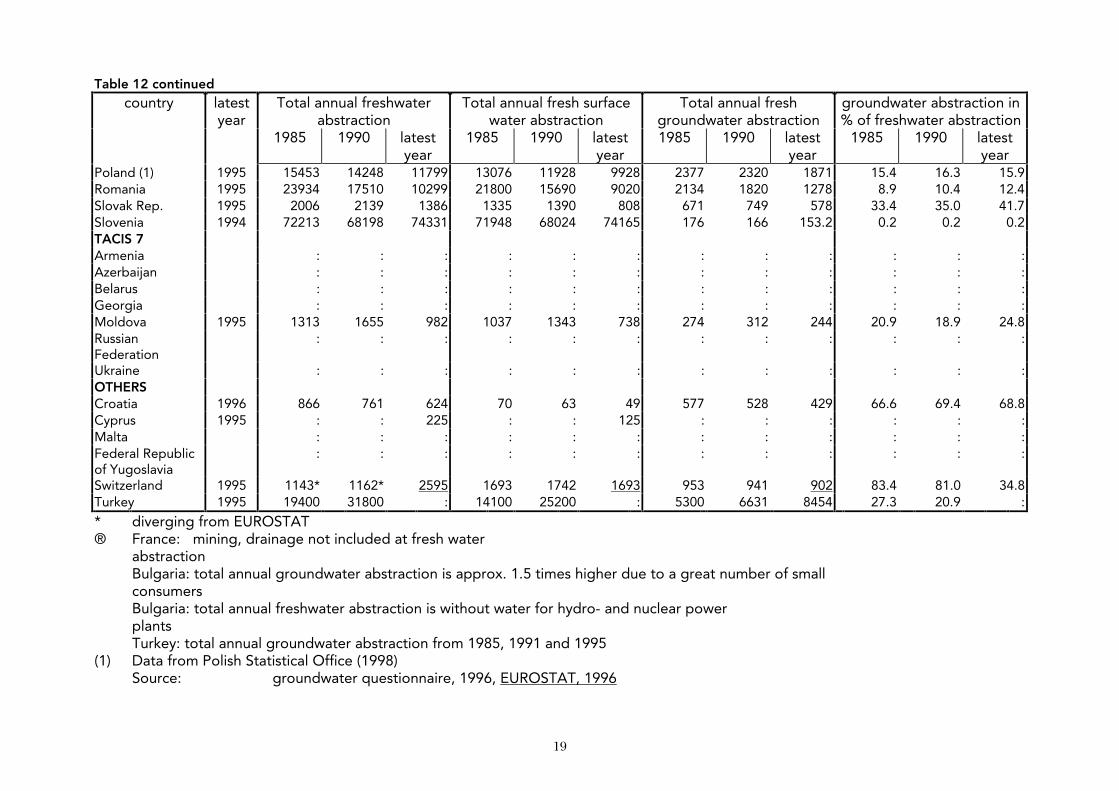
Table 12 Total annual fresh water abstraction by source (in Mio m³/year).
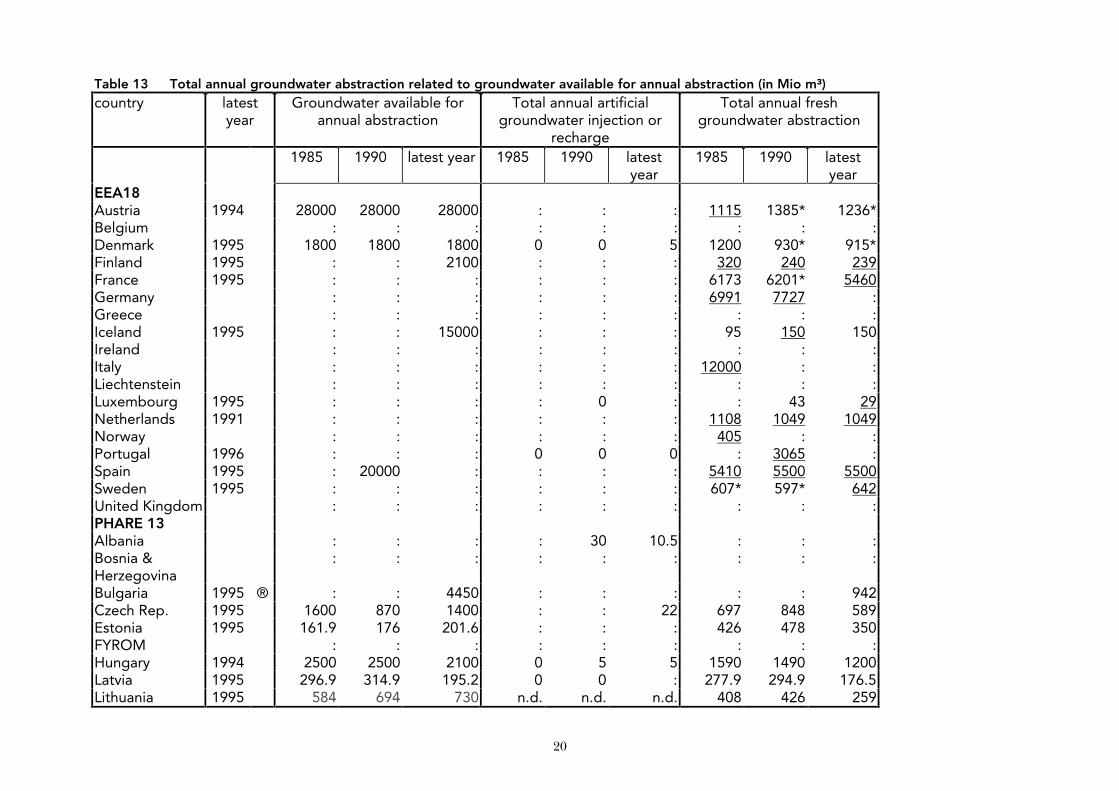
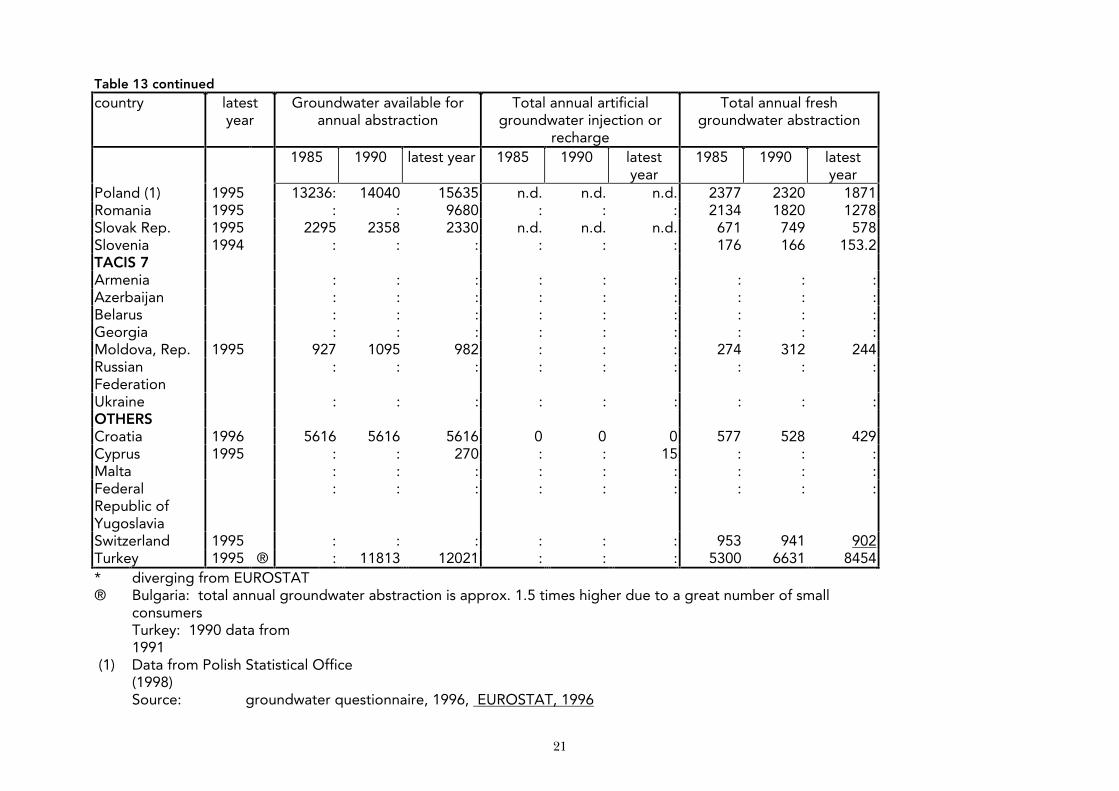
Table 13 Total annual groundwater abstraction related to groundwater available for annual abstraction (in Mio m³/year).
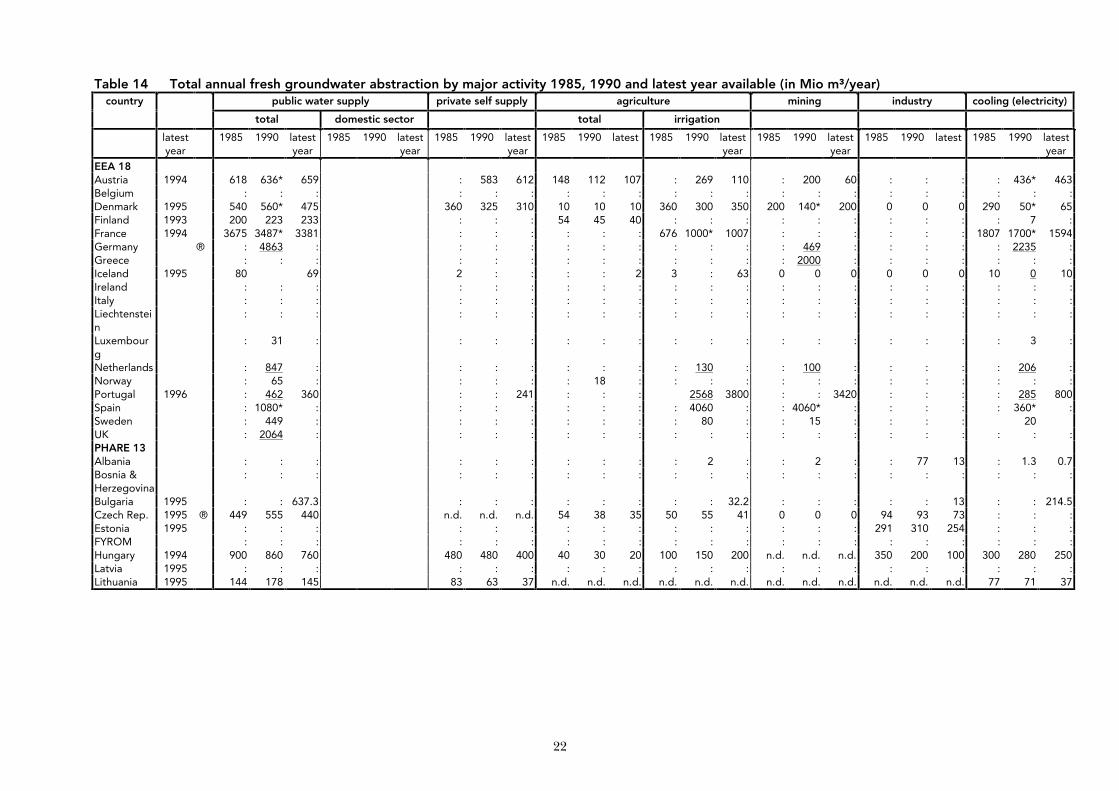
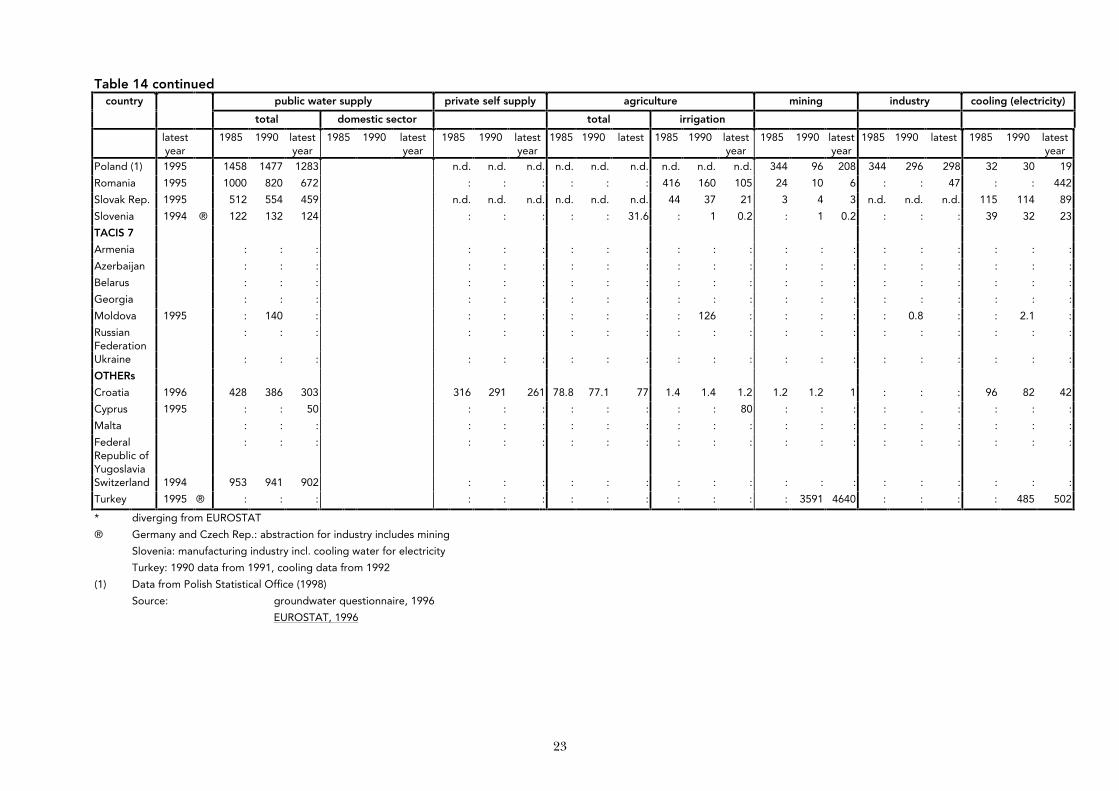
Table 14 Total annual fresh groundwater abstraction by major activity 1985, 1990 and latest year available (in Mio m³/year).
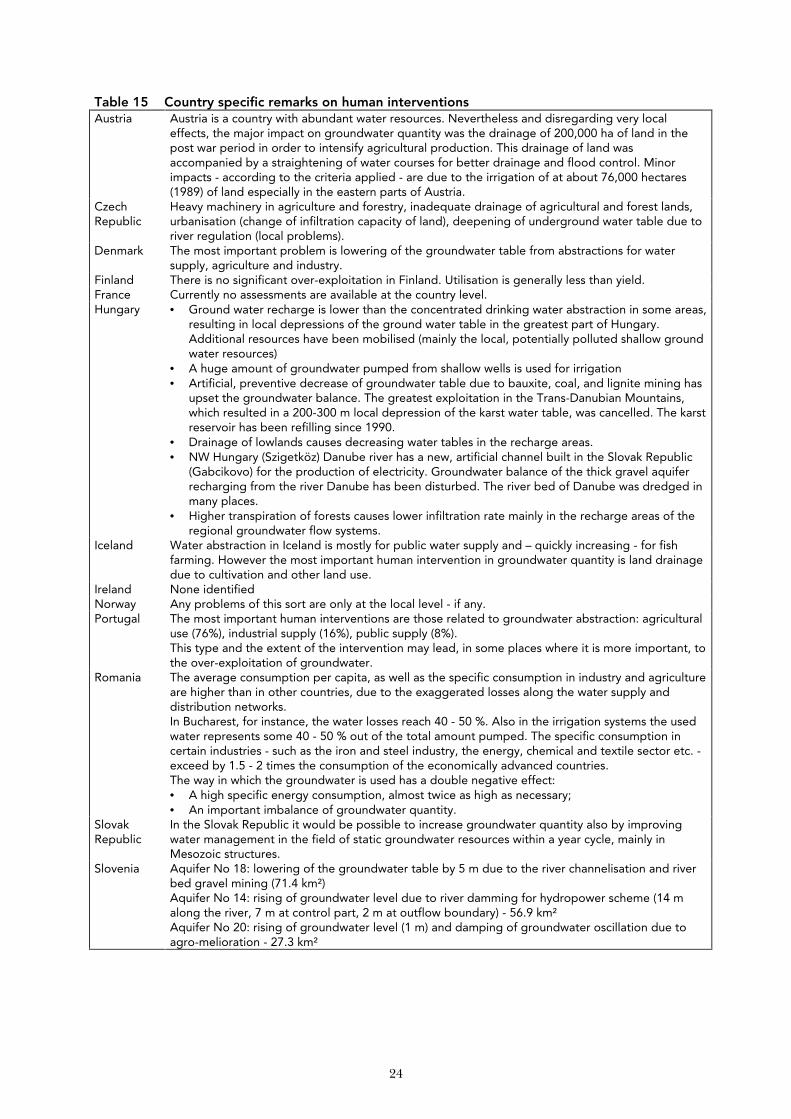
Table 15 Country specific remarks on human interventions
Table 16 Most important human interventions with related adverse effects on groundwater quantity. Selection and ranking.
Table 17 Name and approximate area of the selected groundwater areas for which quality data have been provided
Table 18 Country specific remarks on groundwater quality
Table 19 Country specific remarks on nitrate
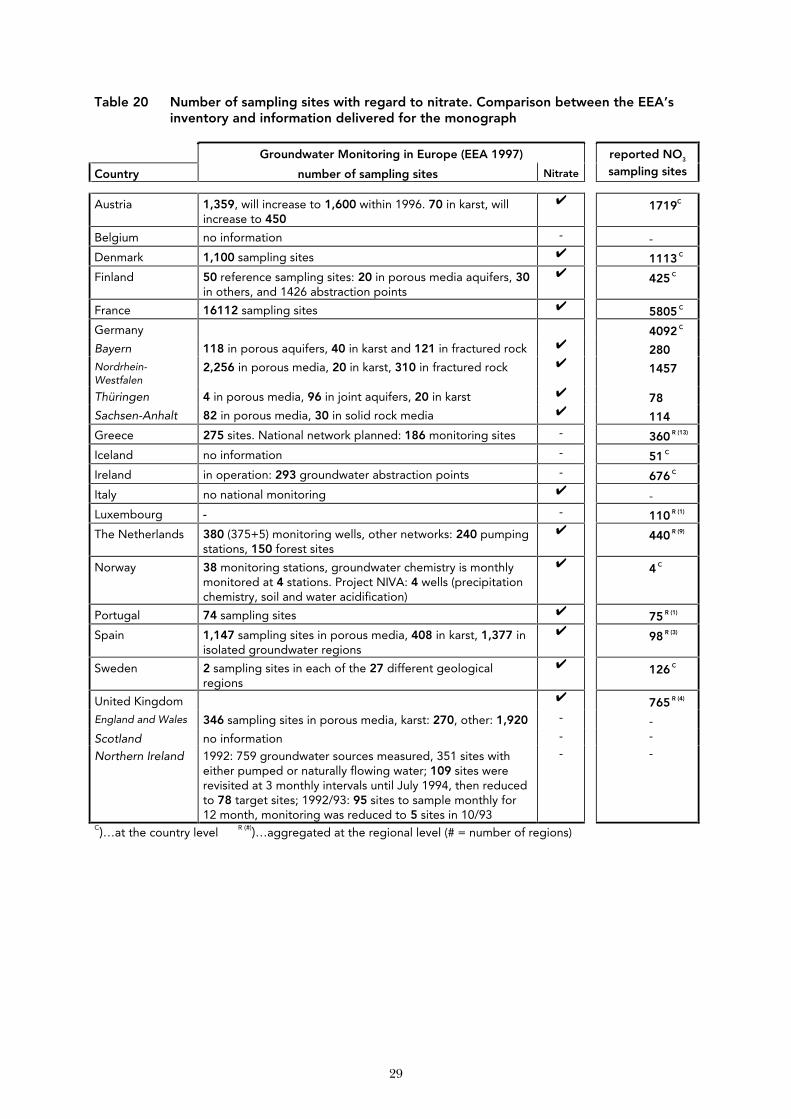
Table 20 Number of sampling sites with regard to nitrate. Comparison between the EEA’s inventory and information delivered for the monograph.
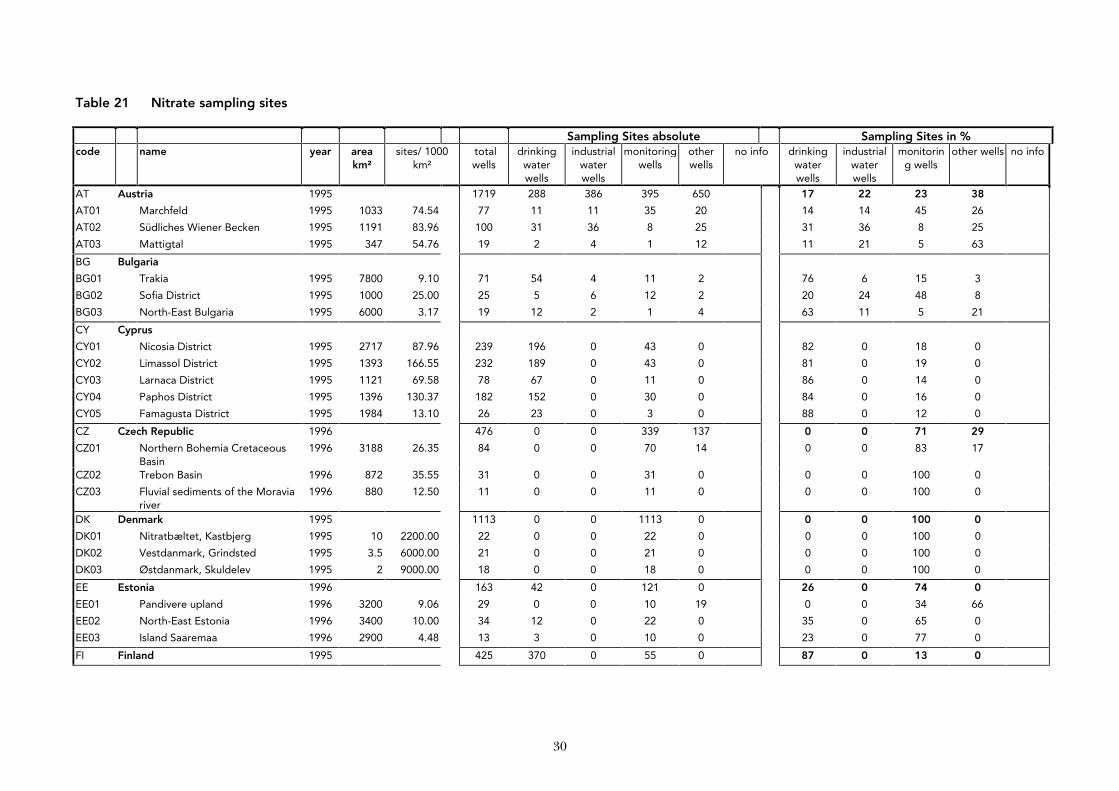
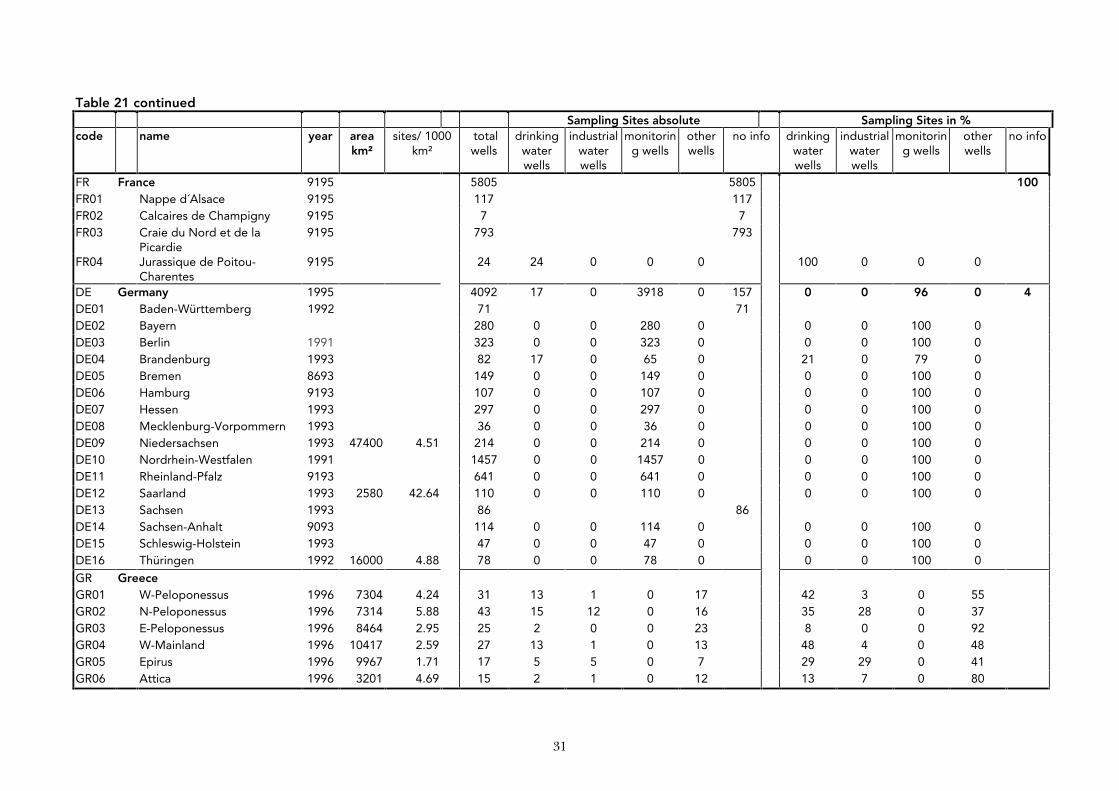
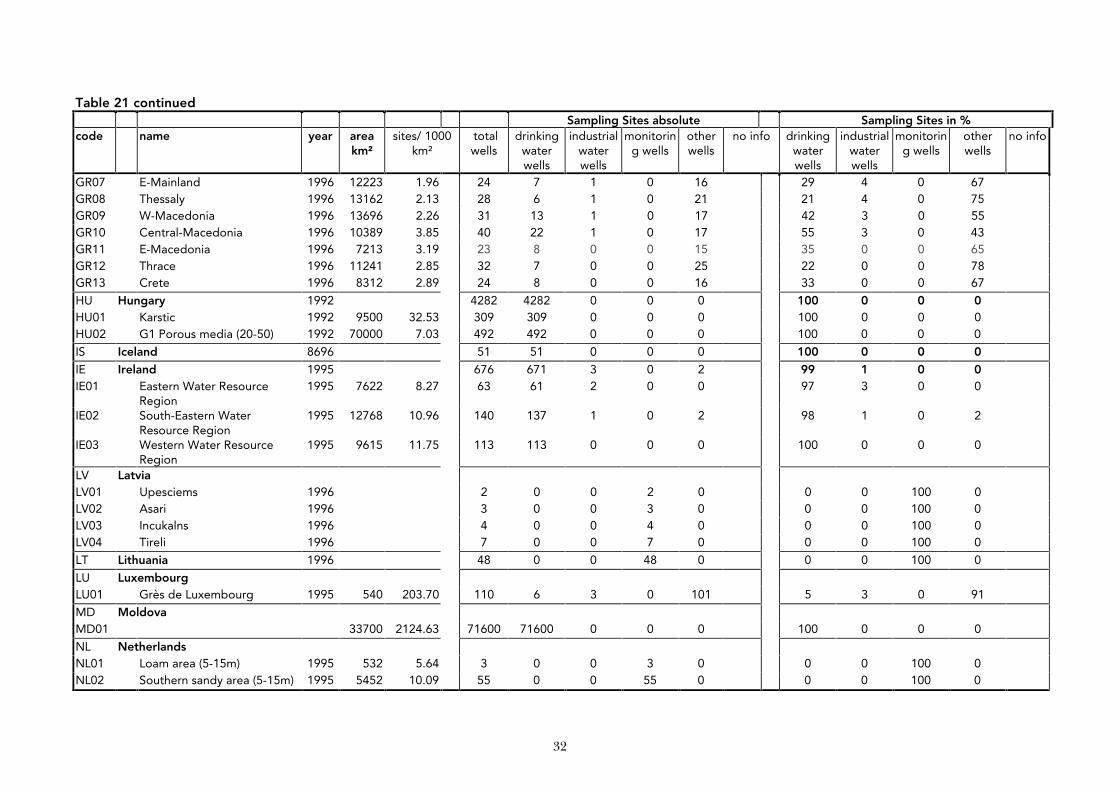
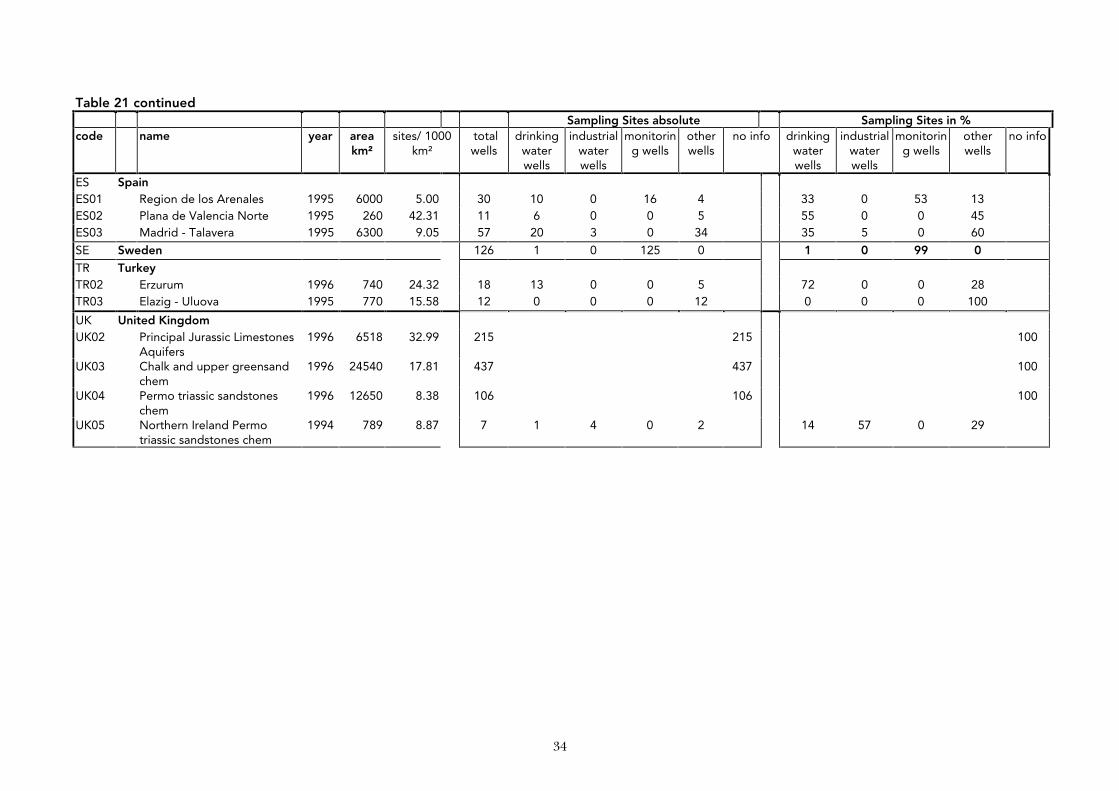
Table 21 Nitrate - Sampling sites
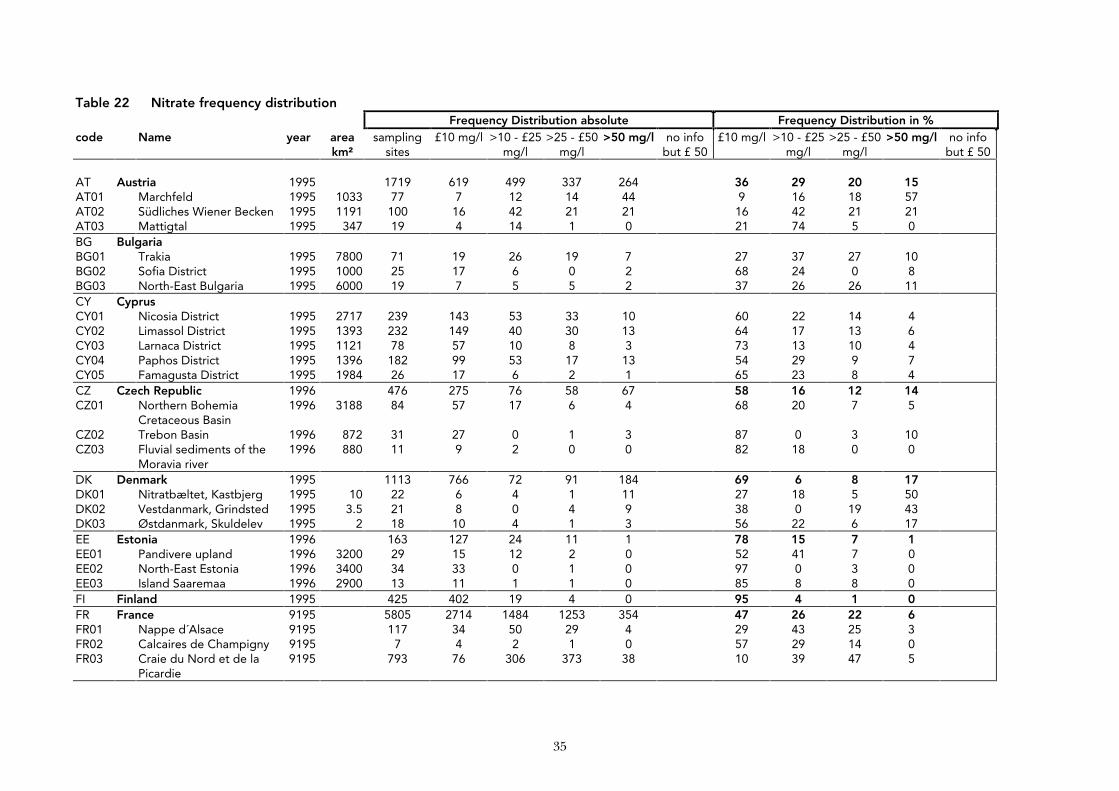
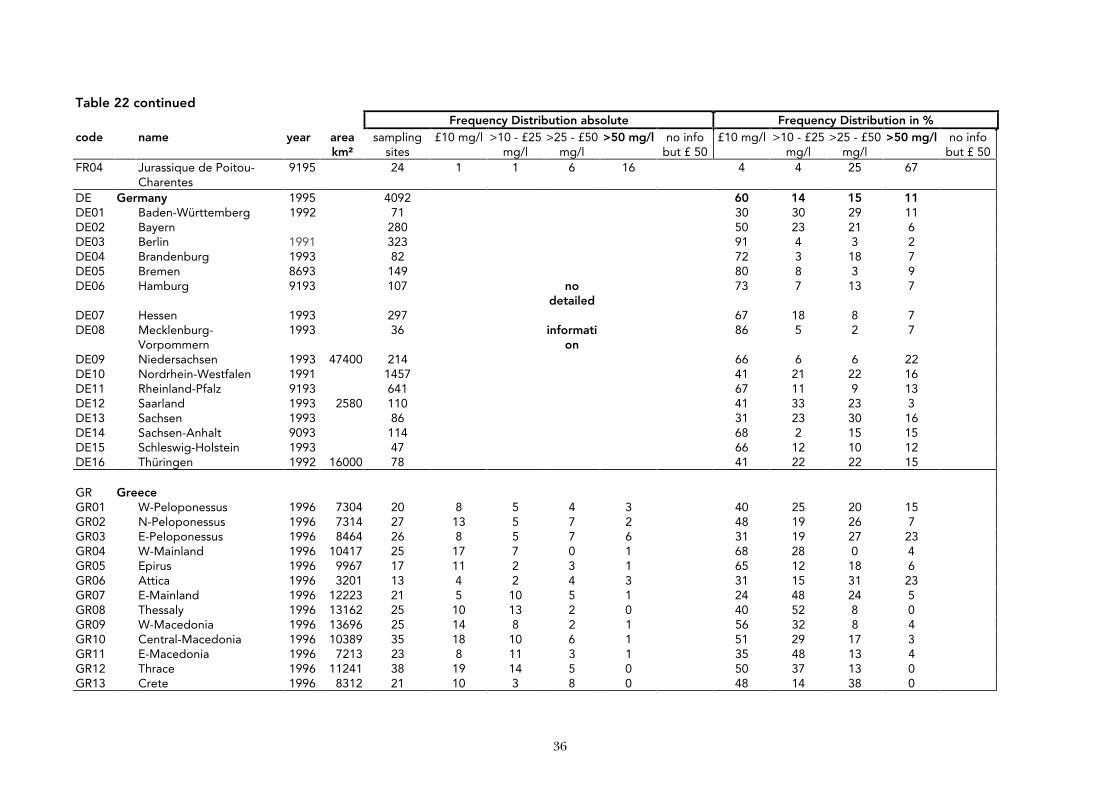
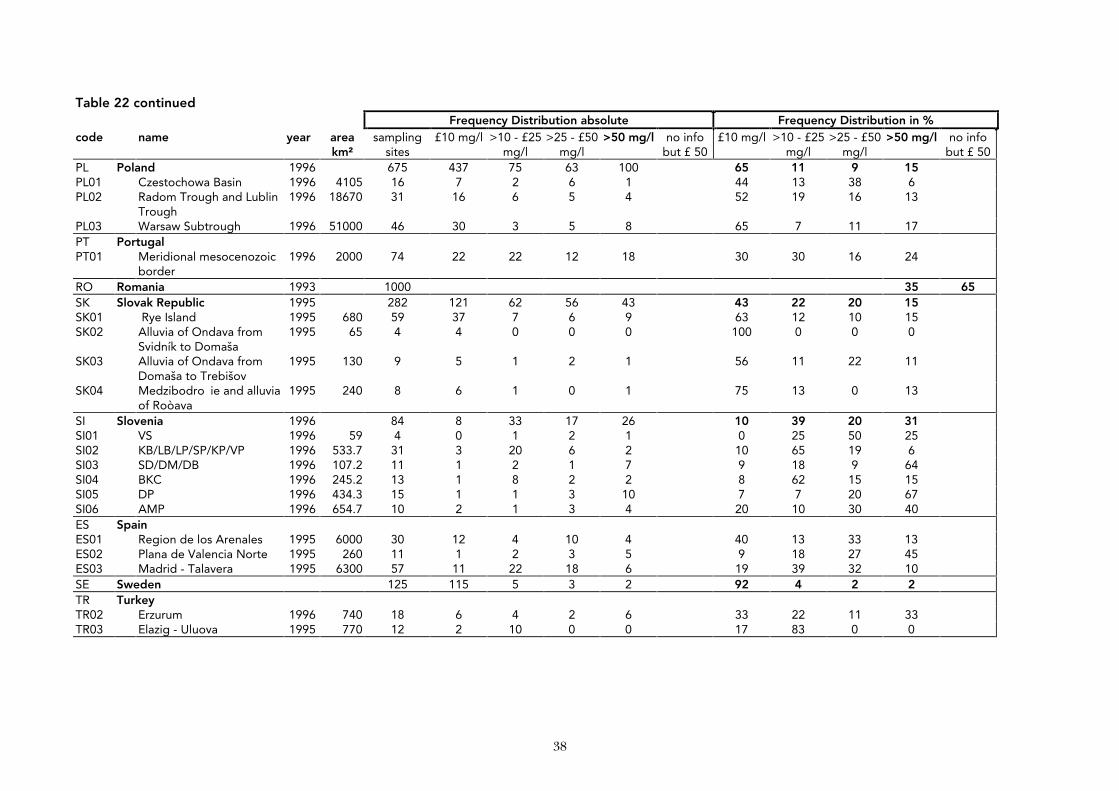
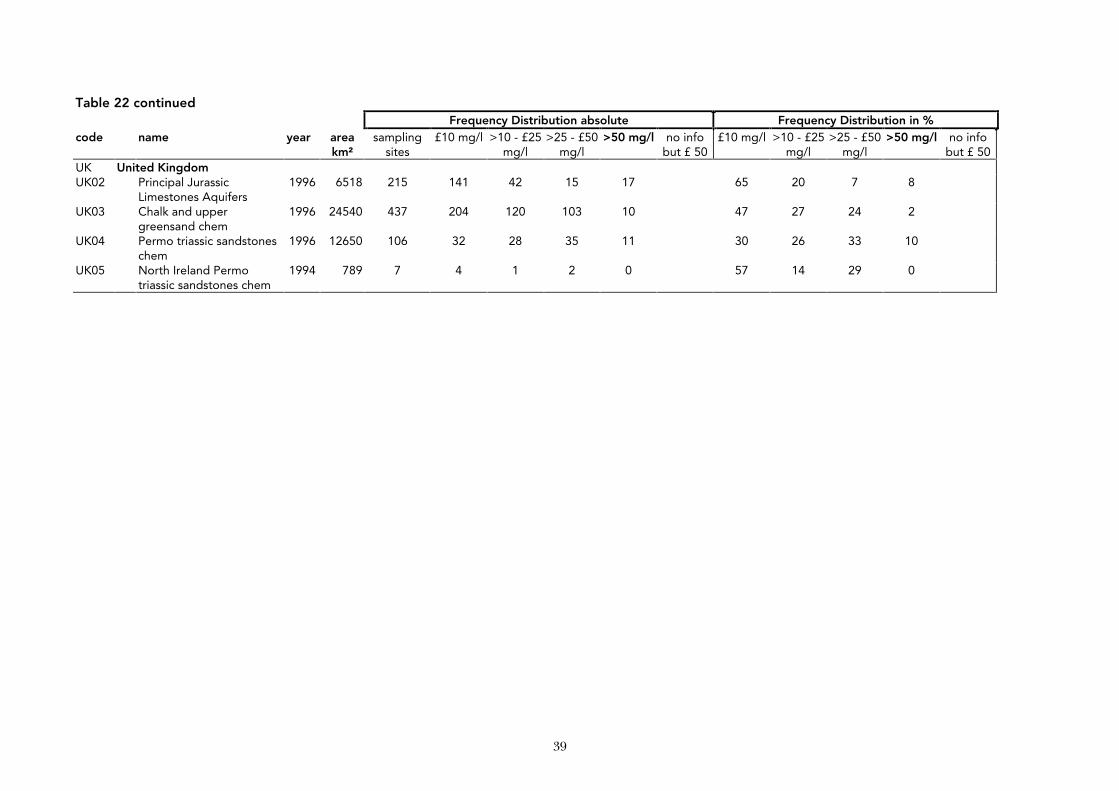
Table 22 Nitrate - Frequency distribution
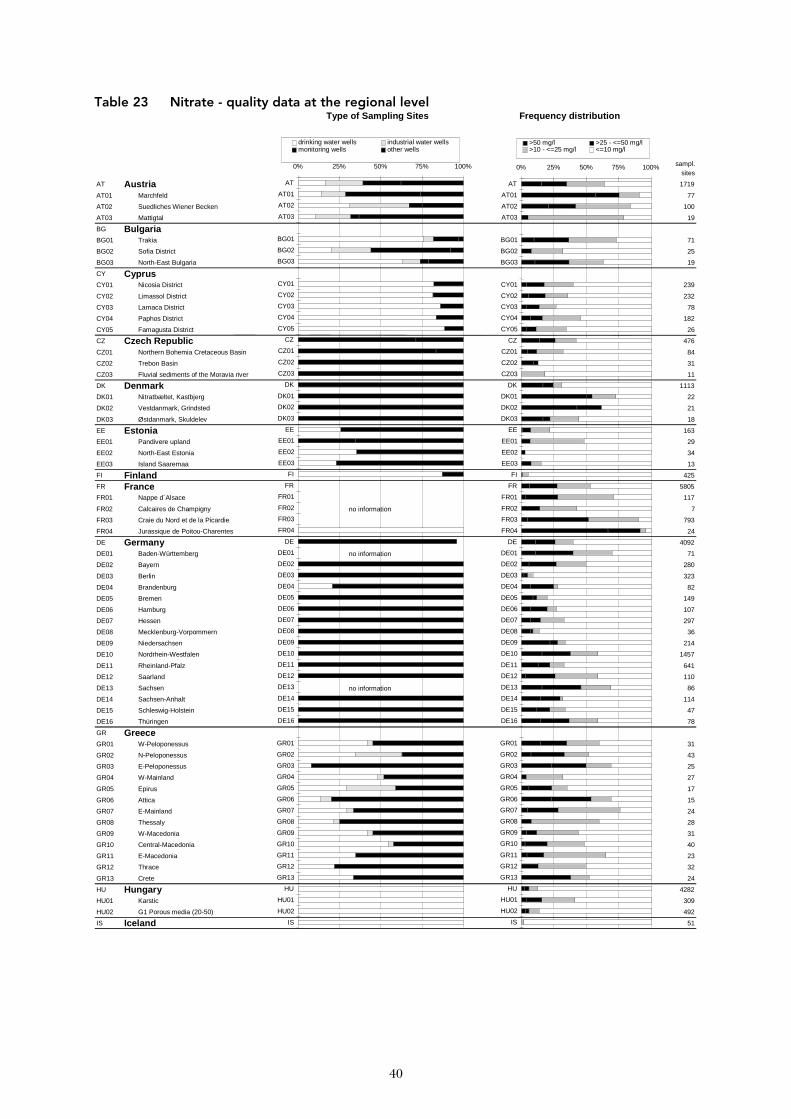
Table 23 Nitrate - quality data at the regional level
Table 24 Country specific remarks on pesticides
Table 25 Pesticides - Analysed active ingredients at the country level
Table 26 Number of sampling sites, sampling frequency and number of monitored pesticides for each groundwater area/region.
Table 27 Type and distribution of sampling sites monitoring pesticides
Table 28 Country specific remarks on chloride
Table 29 Chloride - Types of sampling sites
Table 30 Chloride - Frequency distribution
Table 31 Chloride - Groundwater quality at the regional level
Table 32 pH-value - Types of sampling sites
Table 33 pH-value - Frequency distribution
Table 34 pH - Groundwater quality at the regional level
Table 35 Country specific remarks on alkalinity and acidification
7
Table 36 Alkalinity - Types of sampling sites
Table 37 Alkalinity - Frequency distribution
Table 38 Alkalinity - Groundwater quality at the regional level
Table 39 Electrical Conductivity - Types of sampling sites
Table 40 Electrical Conductivity - Frequency distribution
Table 41 Electrical Conductivity - Groundwater quality at the regional level
Table 42 Description and extent of groundwater contamination by other sources
Table 43 Over-exploited groundwater areas
Table 44 Wetlands - name, area and endangering situation
Groundwater quantity and quality questionnaire
Table 1 Usage of commercial nitrogen fertilisers in EU-15 (in 1000 t N) Country 1970 1975 1980 1985 1990 1991 1992 1993 1994
EUR 15 6,826 8,227 9,994 10,869 10,218 9,877 9,058 9,207 9,600
EUR 12 6,305 7,649 9,393 10,256 9,665 9,404 8,549 8,684 9,069
AT Austria 126 121 160 165 135 132 124 124 122
BE Belgium ® 167 169 180 178 166 161 152 169 168
DK Denmark ® 289 339 374 382 395 370 333 326 316
FI Finland 169 199 197 202 207 166 174 173 198
FR France 1,453 1,708 2,147 2,408 2,492 2,569 2,154 2,222 2,308
DE Germany 1,642 1,906 2,303 2,286 1,788 1,720 1,680 1,612 1,787
GR Greece ® 201 275 333 450 427 408 393 338 334
IR Ireland 87 153 275 314 370 358 353 401 429
IT Italy 595 724 1,006 1,055 879 907 910 918 879
LU Luxembourg ® 11 14 14 17 20 21 21 : :
NL Netherlands 405 453 483 500 390 392 390 370 380
ES Spain ® 578 722 902 962 1,063 999 818 929 919
SE Sweden ® 226 258 244 246 212 175 211 226 210
PT Portugal 77 141 137 137 150 135 127 130 137
UK United Kingdom ® 801 1,045 1,240 1,568 1,525 1,365 1,219 1,268 1,412
Source: FAO = FAOSTAT PC, ~04/1995
Remarks: • Data include estimates • Data refer to the total amounts included in both straight and compound fertilisers, and are related to the
apparent usage during the fertiliser year (generally 1 July to 30 June) if not stated otherwise. Thus data for, e.g., 1980, refer to apparent usage during the twelve-months period from 1 July 1980 to 30 June 1981
• FAO data for Belgium include Luxembourg; therefore the data on fertilisers provided by the "Ministère de l'agriculture" of Luxembourg (where available = 1970-1992) have been subtracted from FAO data for Belgium.
®: BE 1993 data include Luxembourg DK Fertiliser year: August-July. GR Fertiliser year: calendar year ES Fertiliser year: calendar year. LU Fertiliser year: July-June. SE Fertiliser year: June-May. Data include quantities used for forest fertilisation. UK Fertiliser year: June-May.
8
Table 2 Usage of N-fertiliser related to agricultural area (1994, 1995) Sources: N-Fertiliser Usage 1994, Land Area 1994: FAO; Land Area 1995: EUROSTAT
code country N-Fertiliser Usage (t) Land Area (km²) Agricultural Area (km²)
Agric. area / Land area
kg N-fert. / ha agric. area
EEA 18
AT Austria 122,000 82,748 34,490 42% 35.4
BE Belgium+Luxembourg 168,000 32,820 14,820 45% 113.4
DK Denmark 316,000 42,394 27,150 64% 116.4
FI Finland 198,470 304,600 27,040 9% 73.4
FR France 2,308,400 537,578 300,560 56% 76.8
DE Germany 1,787,000 349,172 173,440 50% 103.0
GR Greece 334,000 128,837 87,520 68% 38.2
IS Iceland 13,000 100,250 22,800 23% 5.7
IE Ireland 429,000 68,894 43,910 64% 97.7
IT Italy 879,200 294,123 156,730 53% 56.1
LI Liechtenstein 160 100 63%
LU Luxembourg 2,558 1,270 50%
NL Netherlands 380,000 38,106 19,630 52% 193.6
NO Norway 110,000 306,830 10,300 3% 106.8
PT Portugal 137,000 91,469 39,810 44% 34.4
ES Spain 918,700 500,220 250,930 50% 36.6
SE Sweden 210,230 411,614 34,380 8% 61.1
UK United Kingdom 1,412,000 240,824 158,520 66% 89.1
PHARE 13
AL Albania 14,980 27,400 11,260 41% 13.3
BA Bosnia Herzegovina 4,400 51,000 20,000 39% 2.2
BG Bulgaria 162,628 110,550 60,180 54% 27.0
CZ Czech Republic 254,000 77,280 42,760 55% 59.4
EE Estonia 26,068 42,270 14,540 34% 17.9
MK FYROM 3,000 25,430 12,960 51% 2.3
HU Hungary 242,000 92,340 61,220 66% 39.5
LV Latvia 40,000 62,050 25,400 41% 15.7
LT Lithuania 6,000 64,800 35,200 54% 1.7
PL Poland 836,149 304,420 186,970 61% 44.7
RO Romania 227,552 230,340 147,970 64% 15.4
SK Slovak Republic 80,250 48,080 24,490 51% 32.8
SI Slovenia 44,900 20,120 7,880 39% 57.0
TACIS 7
AM Armenia 7,000 28,200 12,880 46% 5.4
AZ Azerbaijan 34,000 86,600 42,000 48% 8.1
BY Belarus 250,000 207,480 92,490 45% 27.0
GE Georgia 26,000 69,700 30,130 43% 8.6
MD Moldova Republic 60,000 32,970 26,140 79% 23.0
RU Russian Fed. 980,000 1,6888,500 2,196,090 13% 4.5
UA Ukraine 840,000 579,350 418,610 72% 20.1
OTHERS
HR Croatia 95,000 55,920 23,120 41% 41.1
CY Cyprus 14,404 9,240 1,470 16% 98.0
MT Malta 1,000 320 130 41% 76.9
YU Federal Republic of Yugoslavia
70,000 102,000 62,020 61%
CH Switzerland 60,000 39,550 15,810 40% 38.0
TR Turkey 1,007,000 769,630 401,490 52% 25.1
9
Table 3 Trends in nitrate fertiliser usage related to agricultural area in kg/ha. (Source: FAO) N-fertiliser / agricultural area [in kg/ha] Trend
code country 1985 1990 1994 1990-94
EEA18
AT Austria 47 39 35.4 -9.3 %
BE Belgium + Luxembourg 128 125 113.4 -9.3 %
DK Denmark 135 142 116.4 -18.0 %
FI Finland 79 81 73.4 -9.4 %
FR France 77 81 76.8 -5.2 %
DE Germany 103.0
GR Greece 49 47 38.2 -18.8 %
IS Iceland 6 5 5.7 14.0 %
IE Ireland 55 66 97.7 48.0 %
IT Italy 62 52 56.1 7.9 %
LI Liechtenstein 0.0
NL Netherlands 248 194 193.6 -0.2 %
NO Norway 112 113 106.8 -5.5 %
PT Portugal 34 37 34.4 -7.0 %
ES Spain 31 35 36.6 4.6 %
SE Sweden 70 62 61.1 -1.4 %
UK United Kingdom 86 85 89.1 4.8 %
PHARE 13
AL Albania 67 66 13.3 -79.8 %
BA Bosnia Herzegovina 12 2.2 -81.7 %
BG Bulgaria 77 73 27.0 -63.0 %
CZ Czech Republic 59.4
EE Estonia 50 17.9 -64.1 %
MK FYROM 2.3
HU Hungary 85 55 39.5 -28.1 %
LV Latvia 46 15.7 -65.8 %
LT Lithuania 61 1.7 -97.2 %
PL Poland 71 39 44.7 14.7 %
RO Romania 47 44 15.4 -65.0 %
SK Slovak Republic 32.8
SI Slovenia 25 57.0 127.9 %
TACIS 7
AM Armenia 5.4
AZ Azerbaijan 8.1
BY Belarus 72 27.0 -62.5 %
GE Georgia 8.6
MD Moldova 51 23.0 -55.0 %
RU Russian Federation 20 4.5 -77.7 %
UA Ukraine 53 44 20.1 -54.4 %
OTHERS
HR Croatia 46 41.1 -10.7 %
CY Cyprus 61 77 98.0 27.3 %
MT Malta 40 54 76.9
YU Federal Republic of Yugoslavia
CH Switzerland 36 31 38.0 22.4 %
TR Turkey 25 33 25.1 -24.0 %
10
Table 4 Total pesticides sales (tonnes of active ingredients) Code Country notes 1988 1989 1990 1991 1992 1993 1994 1995 1996 EEA18 AT Austria 1 : 4,615 4,246 4,489 3,897 3,983 3,620 3403 : BE Belgium 9,818 10,086 10,264 9,969 10,426 10,286 : : DK Denmark 5,253 5,795 5,650 4,628 4,566 4,103 3,919 4809 : FI Finland 1,874 2,229 2,055 1,742 1,430 1,280 1,317 1078 : FR France 99,167 100,433 97,701 103,434 84,709 91,953 : 84,006 : DE Germany 36,774 34,625 33,146 36,944 33,570 28,930 29,769 34,531 : GR Greece 6,754 8,151 : : 8,595 8,595 : : : IS Iceland : : : : : : 7 : : IE Ireland : : 1,745 1,916 1,942 : : : : IT Italy 100,579 91,070 91,680 : : : 157,981 : : LI Liechtenstein : : : : : : : : LU Luxembourg : : : 253 : : : 384 : NL Netherlands 18,172 19,146 18,835 17,306 15,921 11,761 12,876 : : NO Norway : : : : : 750 : 903.2 : PT Portugal 21,570 : : 9,355 6,117 8,984 9,581 : : ES Spain 1 128,839 134,150 112,735 111,532 86,666 79,551 84,341 70,965 : SE Sweden 2,865 2,423 2,344 1,837 1,511 1,464 1,961 : : UK United Kingdom 1 31,672 : 31,073 : 27,746 : 29,152 : : PHARE 13 AL Albania : : : : : 120 200 250 : BA Bosnia &
Herzegovina : : 1658 : : : : : :
BG Bulgaria 3 : : : : : : : : 6768 CZ Czech Republic : : : : : : : 3908 : EE Estonia 1 : : : : : : : 143.8 : MK FYROM : : : : : : : : : HU Hungary 1 : : 24500 17700 17900 18800 17100 14200 : LV Latvia 1 : : : : : : : 12000 : LT Lithuania 1 : : : : : : : : 896.4 PL Poland 5 : 7548 5217 6755 6792 7335 6962 9420 RO Romania : : : : : : : : : SK Slovak Republic 1 : : : : : : : 39876 : SI Slovenia : : : : : : : 1495 :
TACIS 7 AM Armenia : : : : : : : : :
AZ Azerbaijan : : : : : : : : :
BY Belarus : : 7400 : : : : : :
GE Georgia : : : : : : : : :
MD Moldova, Rep. of 1 : : 22000 : : : : 4981 2850 RU Russian Fed. : : 50600 : : : : : : UA Ukraine : : 43700 : : : : : :
OTHERS HR Croatia : : 6120 : : : : : :
CY Cyprus : 2093 : : : : : : :
MT Malta 1 : : : : : : : 53 :
YU Serbia Montenegro
: : : : : : : : :
CH Switzerland 2 2455 2464 2283 2056 2022 1935 1921 1827 : TR Turkey 4 : : 5198 28220 27593 32363 28962 33949 :
Footnotes 1 Usage data from questionnaire response Source: Boxed italics: questionnaire, 1997 2 Switzerland + Liechtenstein Underlined: OECD, 1995 3 Formulations, usage data Normal text: EUROSTAT
4 Usage data except ’90 italics: DOBRIS 5 Data from Polish Central Statistical Office
11
Table 5 Herbicides sales (tonnes of active ingredients) Country notes 1988 1989 1990 1991 1992 1993 1994 1995 1996
EEA18 Austria 1 : 2,577 1,945 2,167 1,859 1,873 1,549 1607 : Belgium 5,145 5,264 5,213 5,091 5,120 5,560 5,971 : : Denmark 3,762 3,969 3,128 2,867 2,824 2,632 2,685 3281 : Finland 1,429 1,726 1,580 1,375 1,007 843 929 791 : France 36,073 36,189 37,429 33,713 27,281 25,982 : 27,416 : Germany 21,754 18,892 16,970 18,999 15,707 12,696 14,834 16,065 : Greece 2,212 3,020 : : 2,135 2,308 : : : Ireland : : 985 1,097 1,001 : : : : Italy 10,843 10,566 10,267 : : : 24,917 : : Luxembourg 1 : : : 121 : : : 188 : Netherlands 3,639 3,330 3,468 3,312 2,987 2,796 3,481 : : Portugal 5,000 : : 1,801 1,192 1,307 1,572 : : Spain 1 19,062 20,342 21,884 22,459 19,610 17,283 19,941 16,423 : Sweden 2,009 1,852 1,631 1,054 937 1,093 1,507 : : United Kingdom 1 22,403 : 21,266 : 18,376 : 20,165 : : Iceland 2 2 2 3 4 : Liechtenstein : Norway 919 857 965 564 561 510 626 689.2 : PHARE13 Albania : : : : : 5 7 8 : Bosnia & Herzegovina
: : 610 : : : : : :
Bulgaria 3 : : : : : : : : 3465 Czech Republic : : : : : : : 2348 : Estonia 1 : : : : : : : 108.7 : FYROM : : : : : : : : : Hungary 1 : : 11600 9800 10000 10400 8300 7000 : Latvia 1 : : : : : : : : : Lithuania 1 : : : : : : : : 630.9 Poland 5 : : 2948 4189 4295 4270 3940 5534 Romania : : : : : : : : : Slovak Republic 1 : : : : : : : 19713 : Slovenia : : : : : : : 418 : TACIS 7 Armenia : : : : : : : : : Azerbaijan : : : : : : : : : Belarus : : 3700 : : : : : : Georgia : : : : : : : : :
Moldova, Republic of 1 : : 4100 : : : : 648 439 Russian Federation : : 2530 : : : : : : Ukraine : : 21850 : : : : : : REST 6 Croatia : : 3221 : : : : : : Cyprus : 132 : : : : : : :
Malta 1 : : : : : : : 2 :
Serbia Montenegro : : : : : : : : :
Switzerland 2 885 925 824 782 750 676 668 657 : Turkey : : 463 7191 5861 9133 8511 7583 : Footnotes: 1 Usage data of questionnaire response Source Boxed italics: questionnaire, 1997 2 Switzerland + Liechtenstein Shaded bold: Yearbook of Nordic Statistics, 1996 3 Formulations, usage data Underlined: OECD, 1995 4 Usage data except ’90 Normal text: EUROSTAT 5 Data from Polish Central Statistical
Office Italics: DOBRIS
12
Table 6 Fungicides sales (tonnes of active ingredients) Country notes 1988 1989 1990 1991 1992 1993 1994 1995 1996
EEA 18
Austria 1 : 1,497 1,683 1,843 1,483 1,580 1,560 1409 : Belgium 2,583 2,637 2,743 2,837 3,292 2,789 : : : Denmark 1,082 1,270 1,396 1,426 1,333 1,033 892 1055 : Finland 144 178 163 146 194 210 209 114 : France 49,774 46,193 41,514 55,565 44,786 54,254 : 42,578 : Germany 10,299 10,809 10,984 9,760 9,368 7,660 7,698 9,652 : Greece 1,638 1,925 : : 2,734 2,467 : : : Iceland : : 0 1 1 1 3 : : Ireland : : 460 535 663 : : : : Italy 65,571 57,088 58,473 : : : 83,350 : : Liechtenstein : : : : : : : : : Luxembourg 1 : : : 113 : : : 157 : Netherlands 4,147 4,052 4,140 4,281 4,192 4,007 4,576 : : Norway 108 119 153 133 133 164 145 167.3 : Portugal 12,870 : : 6,511 3,932 6,707 7,133 : : Spain 1 27,494 29,011 26,251 24,695 21,851 19,924 22,077 18,605 : Sweden 679 499 643 723 516 318 369 : : United Kingdom 1 6,416 : 6,435 : 6,104 : 5,437 : : PHARE13
Albania : : : : : 43 73 93 : Bosnia & Herzegovina
: : 403 : : : : : :
Bulgaria 3 : : : : : : : : 2600 Czech Republic : : : : : : : 1121 : Estonia 1 : : : : : : : 13.9 : FYROM : : : : : : : : : Hungary 1 : : 7200 4200 4200 4800 5200 3800 : Latvia 1 : : : : : : : : : Lithuania 1 : : : : : : : : 139 Poland 5 : : 1362 1941 1853 2328 2272 2986 Romania : : : : : : : : : Slovak Republic 1 : : : : : : : 10776 : Slovenia : : : : : : : 693 : TACIS 7 Armenia : : : : : : : : : Azerbaijan : : : : : : : : : Belarus : : 814 : : : : : : Georgia : : : : : : : : :
Moldova, Republic of 1 : : 12500 : : : : 3320 2850 Russian Federation : : 5566 : : : : : : Ukraine : : 4807 : : : : : :
OTHERS 6 Croatia : : 1396 : : : : : : Cyprus : 1532 : : : : : : :
Malta 1 : : : : : : : 44.6 :
Serbia Montenegro : : : : : : : : :
Switzerland 2 1120 1112 988 912 953 982 973 949 : Turkey 4 : : 744 5599 5910 5868 4862 4937 : Footnotes:
1 Usage data from questionnaire response Source: Boxed italics: questionnaire, 1997 2 Switzerland + Liechtenstein Shaded bold: Yearbook of Nordic Statistics, 1996 3 Formulations, usage data Underlined: OECD, 1995 4 Usage data except ‘90 Normal text: EUROSTAT 5 Data from Polish Central Statistical Office italics: DOBRIS
13
Table 7 Insecticides sales (tonnes of active ingredients) Country notes 1988 1989 1990 1991 1992 1993 1994 1995 1996 EEA18 Austria 1 : 243 285 158 144 141 137 123 : Belgium 1,398 1,383 1,295 1,167 1,269 1,128 1,003 : : Denmark 150 226 259 146 128 107 95 163 : Finland 184 196 101 69 105 138 87 69 : France 9,658 10,726 11,039 10,326 7,945 6,676 : 7,091 : Germany 1,350 1,469 1,638 3,968 4,114 4,361 4,006 4,925 : Greece 2,731 2,844 : : 2,292 2,375 : : : Iceland : : 0 0 0 0 0 : : Ireland : : 149 163 144 : : : : Italy 11,481 10,744 10,943 : : : 31,574 : : Liechtenstein : : : : : : : : : Luxembourg 1 : : : 10 : : : 12 : Netherlands 9,153 10,575 9,668 8,273 7,319 3,058 533 : : Norway 38 27 19 19 27 17 19 19.5 : Portugal 2,700 : : 831 754 776 728 : : Spain 1 53,019 52,754 32,169 47,191 25,528 21,948 22,372 18,123 : Sweden 103 39 26 19 29 15 41 : : United Kingdom 1 804 : 760 : 625 : 646 : : PHARE 13 Albania : : : : : 70 116 145 : Bosnia & Herzegovina
: : 555 : : : : : :
Bulgaria 3 : : : : : : : : 703 Czech Republic : : : : : : : 119 : Estonia 1 : : : : : : : 2.1 : FYROM : : : : : : : : : Hungary 1 : : 4800 3200 3000 4800 2400 2000 : Latvia 1 : : : : : : : : : Lithuania 1 : : : : : : : : 2.6 Poland : : 334 363 401 300 445 434 Romania : : : : : : : : : Slovak Republic 1 : : : : : : : 9387 : Slovenia : : : : : : : 260 : TACIS 7 Armenia : : : : : : : : : Azerbaijan : : : : : : : : : Belarus : : 2442 : : : : : : Georgia : : : : : : : : : Moldova, Republic of 1 : : 4600 : : : : 641 605 Russian Federation : : 16798 : : : : : : Ukraine : : 14421 : : : : : : OTHERS Croatia : : 1229 : : : : : : Cyprus : 305 : : : : : : : Malta 1 : : : : : : : 6.4 : Serbia Montenegro : : : : : : : : : Switzerland 2 385 359 390 289 269 238 246 186 : Turkey 4 : : 2996 10412 13125 12265 11229 14850 : Footnotes: 1 Usage data from questionnaire response Source: Boxed italics: questionnaire, 1997 2 Switzerland + Liechtenstein Shaded bold: Yearbook of Nordic Statistics, 1996 3 Formulations, usage data Underlined: OECD, 1995 4 Usage data except ’90 Normal text: EUROSTAT 5 Data from Polish Central Statistical Office italics: DOBRIS
14
Table 8 Other pesticides sales (tonnes of active ingredients) Country notes 1988 1989 1990 1991 1992 1993 1994 1995 1996
EEA18 Austria 1 : 298 333 321 412 390 374 264 : Belgium 692 802 1,012 874 745 809 863 : : Denmark 259 330 867 189 281 331 247 310 : Finland 117 129 211 152 124 89 92 103 : France 3,662 7,325 7,719 3,830 4,697 5,041 : 6,921 : Germany 3,371 3,455 3,554 4,217 4,381 4,213 3,231 3,889 : Greece 173 362 : : 1,432 1,444 : : : Iceland : : 0 1 0 0 0 : : Ireland : : 151 121 134 : : : : Italy 12,686 12,673 11,998 : : : 18,140 : : Liechtenstein : : : : : : : : : Luxembourg 1 : : : 9 : : : 27 : Netherlands 1,233 1,189 1,559 1,440 1,423 1,900 4,286 : : Norway 129 31 46 45 44 58 58 54.2 : Portugal 1,000 : : 212 239 194 148 : : Spain 1 29,264 32,043 32,431 17,187 19,677 20,396 19,951 17,814 : Sweden 74 33 44 41 29 38 44 : : United Kingdom 1 2,049 : 2,612 : 2,642 : 2,905 : : PHARE 13 Albania : : : : : 2 3 4 : Bosnia & Herzegovina
: : 90 : : : : : :
Bulgaria : : : : : : : : : Czech Republic : : : : : : : 320 : Estonia 1 : : : : : : : 19.1 : FYROM : : : : : : : : : Hungary 1 : : 900 600 700 800 1200 1400 : Latvia 1 : : : : : : : : : Lithuania 1 : : : : : : : : 123.9 Poland 5 : : 574 263 242 437 306 466 Romania : : : : : : : : : Slovak Republic 1 : : : : : : : : : Slovenia : : : : : : : 124 : TACIS 7 Armenia : : : : : : : : : Azerbaijan : : : : : : : : : Belarus : : 444 : : : : : : Georgia : : : : : : : : : Moldova, Republic of 1 : : 800 : : : : 186 160 Russian Federation : : 3086 : : : : : : Ukraine : : 2622 : : : : : : OTHER 6 Croatia : : 274 : : : : : : Cyprus : 124 : : : : : : : Malta 1 : : : : : : : 0 : Serbia Montenegro : : : : : : : : : Switzerland 2 65 68 81 73 49 39 33 34 : Turkey 3 : : 1715 5018 2697 5097 4360 5792 : Footnotes: 1 Usage data from questionnaire response Source: Boxed italics: questionnaire, 1997 2 Switzerland + Liechtenstein Shaded bold: Yearbook of Nordic Statistics, 1996 3 Formulations, usage data Underlined: OECD, 1995 4 Usage data except ’90 Normal text: EUROSTAT
5 Data from Polish Central Statistical Office italics: DOBRIS
15
Table 9 Number of approved active ingredients. (EUROSTAT 1997 and ETC/IW questionnaire) Country Code year approved
active ingredients
Country Code year approved active
ingredients Albania AL 1995 50 Italy IT 1993 391 Armenia AM : Latvia LV : Austria AT 1995 271 Liechtenstein LI : Azerbaijan AZ : Lithuania LT : Belarus BY : Luxembourg LU 1993 214 Belgium BE 1993 339 Malta MT 1995 4 Bosnia & Herzegovina
BA : Republic of Moldova MD 1995 145
Bulgaria BG 1996 288 Netherlands NL 1994 302 Croatia HR : Norway NO 1995 118 Cyprus CY : Poland PL 1995 250 Czech Republic CZ 1995 227 Portugal PT 1993 250 Denmark DK 1995 206 Romania RO 1997 530 Estonia EE : Russian Federation RU : Finland FI 1997 162 Federal Republic of
Yugoslavia YU :
France FR 1993 525 Slovak Republic SK 1995 350 (1) FYROM MK : Slovenia SI : Georgia GE : Spain ES 1993 531 Germany DE 1993 227 Sweden SE 1993 123 Greece GR 1993 403 Switzerland CH : Hungary HU 1995 310 Turkey TR 1995 374 Iceland IS : Ukraine UA : Ireland IE 1993 350 United Kingdom UK 1995 450 (1) Data from Ministry of Environment of the Slovak Republic
16
Table 10 Pesticide usage related to arable land and permanent crop land (in kg/ha) Code Country Reference
year Total pesticides
(t) Arable land + perm.
crop land (km²) Pesticides / arable + crop
kg/ha EEA18 AT Austria 1995 3,403 14,790 2.30 BE Belgium+Luxembour
g 1994 10,286 8,620 11.93
DK Denmark 1995 4,809 25,027 1.92 FI Finland 1995 1,078 21,460 0.50 FR France 1995 84,006 192,850 4.36 DE Germany 1995 34,531 120,440 2.87 GR Greece 1993 8,595 33,310 2.58 IS Iceland 1994 7 60 1.17 IE Ireland 1992 1,942 9,610 2.02 IT Italy 1994 157,981 111,430 14.18 LI Liechtenstein 40 LU Luxembourg 1995 384 590 6.51 NL Netherlands 1994 12,876 9,185 14.02 NO Norway 1995 903.2 9,010 1.00 PT Portugal 1994 9,581 23,942 4.00 ES Spain 1995 70,965 148,340 4.78 SE Sweden 1994 1,961 27,700 0.71 UK United Kingdom 1994 29,152 60,110 4.85 PHARE 13 AL Albania 1995 250 7,020 0.36 BA Bosnia Herzegovina 1990 1,658 8,000 2.07 BG Bulgaria 1996 6,768* 42,190 1.60 CZ Czech Republic 1995 3,908 33,860 1.15 EE Estonia 1995 143.8 11,440 0.13 MK FYROM 6,610 HU Hungary 1995 14,200 49,740 2.85 LV Latvia 1995 12,000 17,400 6.90 LT Lithuania 1996 896.4 30,460 0.29 PL Poland 1995 19,687 146,420 1.34 RO Romania 99,250 SK Slovak Republic 1995 4,500(1) - 1.8(1) SI Slovenia 1995 1,495 2,860 5.23 TACIS 7 AM Armenia 6,000 AZ Azerbaijan 20,000 BY Belarus 62,030 GE Georgia 11,270 MD Republic of Moldova 1996 2,850 21,800 1.31 RU Russian Federation 1990 50,600 1,323,020 0.38 UA Ukraine 1990 43,700 343,570 1.27 OTHERS HR Croatia 1990 6,120 12,210 5.01 CY Cyprus 1989 2,093 1,430 14.64 MT Malta 1995 53 130 4.08 YU Federal Republic of
Yugoslavia 40,850
CH Switzerland 1995 1,827 4,340 4.21 TR Turkey 1995 33,949 277,710 1.22
Source: FAO, EUROSTAT, OECD, questionnaire *…usage data of pesticide formulations (1) Data from Ministry of Environment of the Slovak Republic
17
Table 11 Average long term annual atmospheric precipitation, evapotranspiration, inflow and outflow (in Mio m³/year)
Country Date* precipitation (p)
evaporation (e)
internal resources (p-e)
inflow (i) outflow (o)
total fresh water resource (p-e+i)
EEA18 Austria 98000 43000 55000 29000 84000 84000 Belgium 27100 14700 12400 4100 : 16500 Denmark 28761 22646 6115 0 15624 6115 Finland 222000 115000 107000 3200 110000 110200 France 1994 440000 270000 170000 18000 180000 188000 Germany 274000 179000 95000 69000 : 164000 Greece 112000 65000 47000 13500 : 60500 Iceland 200000 30000 170000 0 170000 170000 Ireland 80825 31627 49198 3000 40000 52198 Italy 296000 129000 167000 8000 155000 175000 Liechtenstein : : : : : : Luxembourg 2030 1125 905 2300 : 3205 Netherlands 30100 19500 10600 80400 86000 91000 Norway 458460 76140 382320 9720 392000 392040 Portugal 1996 81190 40595 40595 24710 53833 65305 Spain 342000 231000 111000 0 : 111000 Sweden 314975 144000 170975 3000 178000 173975 United Kingdom 263645 118617 145028 10 : 145038 PHARE 13 Albania : : : : : : Bosnia & Herzegovina
: : : : : :
Bulgaria 1995 65268 50106 15162 329 15491 15491 Czech Republic 1995 54650 41800 12850 690 15710 13540 Estonia 1995 28576 : : : 12344 : FYROM : : : : : : Hungary 1994 58000 52000 6000 114000 120000 120000 Latvia 1995 : : : : : : Lithuania 1995 44010 28500 15510 8900 24400 24410 Poland (1) 1995 205054 151667 53387 7213 61600 60600 Romania ® 150186 166873 -16687 : : : Slovak Republic 1995 37000 24000 13000 79000 91000 92000 Slovenia 1994 31800 13200 18600 13700 30000 32300 TACIS 7 Armenia : : : : : : Azerbaijan : : : : : : Belarus : : : : : : Georgia : : : : : : Moldova, Republic : : : : : : Russian Federation : : : : : : Ukraine : : : : : : OTHERS Croatia 1996 61555 45230 16325 127279 171869 143604 Cyprus 1995 4600 3450 1150 0 260 1150 Malta : : : : : : Federal Republic of Yugoslavia
: : : : : :
Switzerland : 60100 19950 40150 13100 60100 Turkey 501000 274000 227000 7000 186000 234000 Remarks: Romania: calculated from mm
Date*: long term annual average unless year given Source: EUROSTAT (1997)
Groundwater Questionnaire, 1996
OECD, 1995 (1) Data from Polish Statistical Office
18
Table 12 Total annual fresh water abstractions by source (in Mio m³/year) country latest
year Total annual freshwater
abstraction Total annual fresh surface
water abstraction Total annual fresh
groundwater abstraction groundwater abstraction in % of freshwater abstraction
1985 1990 latest year
1985 1990 latest year
1985 1990 latest year
1985 1990 latest year
EEA18 Austria 1994 2120 2427* 2207* 1005 988* 920* 1115 1385* 1236* 52.6 57.1 56.0 Belgium : : : : : : : : : : : : Denmark 1995 1200* 930* 915 4 5 3 1200 930* 915* 100.0 100.0 100.0 Finland 1995 4000 2347 2404 3680 2087 1781 320 240 239 8.0 10.2 9.9 France 1995 34887* 37686 40670* 28714* 31485* 34644* 6173 6201* 5460 17.7 16.5 13.4 Germany 1991 41216 58852 46272 34225 51125 6991 7727 17.0 13.1 : Greece : : : : : : : : : : : : Iceland 1995 103 164 164 8 14 14 95 150 150 92.2 91.5 91.5 Ireland : : : : : : : : : : : : Italy 52000 : : 40000 : : 12000 : : 23.1 : : Liechtenstein : : : : : : : : : : : : Luxembourg 1995 : 261* 57 : 217 28 : 43 29 16.5 50.9 Netherlands 1991 9348 7800 7798 8240 6751 : 1108 1049 1049 11.9 13.4 13.5 Norway 2025 : : 1620 : : 405 : : 20.0 : : Portugal 1996 2003 7288 : : 4223 7060 : 3065 : : 42.1 : Spain 1995 46250 33289 33300 40840 31400 : 5410 5500 5500 11.7 16.5 16.5 Sweden 1995 2901* 2932* 2961 2294* 2335* 2319 607* 597* 642 20.9 20.4 21.7 United Kingdom : : : : : : : : : : : : PHARE 13 Albania 15.18 : : : 47 2.4 : : : : : : Bosnia & Herzegovina
: : : : : : : : : : : :
Bulgaria 1995 : : 2984 : : 2034 : : 942 : : 31.6 Czech Rep. 1995 3531 3647 2633 2834 2799 2044 697 848 589 19.7 23.3 22.4 Estonia 1995 3195 3300 1850 2791 2720 1430 426 478 350 13.3 14.5 18.9 FYROM : : : : : : : : : : : : Hungary 1994 8360 9430 8100 6770 7940 6900 1590 1490 1200 19.0 15.8 14.8 Latvia 1995 901.65 547 : 598.687 322 : 277.9 294.9 176.5 30.8 53.9 : Lithuania 1995 2810 4311 4582 2329 3812 4277 408 426 259 14.5 9.9 5.7
19
Table 12 continued country latest
year Total annual freshwater
abstraction Total annual fresh surface
water abstraction Total annual fresh
groundwater abstraction groundwater abstraction in % of freshwater abstraction
1985 1990 latest year
1985 1990 latest year
1985 1990 latest year
1985 1990 latest year
Poland (1) 1995 15453 14248 11799 13076 11928 9928 2377 2320 1871 15.4 16.3 15.9 Romania 1995 23934 17510 10299 21800 15690 9020 2134 1820 1278 8.9 10.4 12.4 Slovak Rep. 1995 2006 2139 1386 1335 1390 808 671 749 578 33.4 35.0 41.7 Slovenia 1994 72213 68198 74331 71948 68024 74165 176 166 153.2 0.2 0.2 0.2 TACIS 7 Armenia : : : : : : : : : : : : Azerbaijan : : : : : : : : : : : : Belarus : : : : : : : : : : : : Georgia : : : : : : : : : : : : Moldova 1995 1313 1655 982 1037 1343 738 274 312 244 20.9 18.9 24.8 Russian Federation
: : : : : : : : : : : :
Ukraine : : : : : : : : : : : : OTHERS Croatia 1996 866 761 624 70 63 49 577 528 429 66.6 69.4 68.8 Cyprus 1995 : : 225 : : 125 : : : : : : Malta : : : : : : : : : : : : Federal Republic of Yugoslavia
: : : : : : : : : : : :
Switzerland 1995 1143* 1162* 2595 1693 1742 1693 953 941 902 83.4 81.0 34.8 Turkey 1995 19400 31800 : 14100 25200 : 5300 6631 8454 27.3 20.9 :
* diverging from EUROSTAT ® France: mining, drainage not included at fresh water
abstraction
Bulgaria: total annual groundwater abstraction is approx. 1.5 times higher due to a great number of small consumers
Bulgaria: total annual freshwater abstraction is without water for hydro- and nuclear power plants
(1)
Turkey: total annual groundwater abstraction from 1985, 1991 and 1995 Data from Polish Statistical Office (1998)
Source: groundwater questionnaire, 1996, EUROSTAT, 1996
20
Table 13 Total annual groundwater abstraction related to groundwater available for annual abstraction (in Mio m³) country latest
year Groundwater available for
annual abstraction Total annual artificial
groundwater injection or recharge
Total annual fresh groundwater abstraction
1985 1990 latest year 1985 1990 latest year
1985 1990 latest year
EEA18 Austria 1994 28000 28000 28000 : : : 1115 1385* 1236* Belgium : : : : : : : : : Denmark 1995 1800 1800 1800 0 0 5 1200 930* 915* Finland 1995 : : 2100 : : : 320 240 239 France 1995 : : : : : : 6173 6201* 5460 Germany : : : : : : 6991 7727 : Greece : : : : : : : : : Iceland 1995 : : 15000 : : : 95 150 150 Ireland : : : : : : : : : Italy : : : : : : 12000 : : Liechtenstein : : : : : : : : : Luxembourg 1995 : : : : 0 : : 43 29 Netherlands 1991 : : : : : : 1108 1049 1049 Norway : : : : : : 405 : : Portugal 1996 : : : 0 0 0 : 3065 : Spain 1995 : 20000 : : : : 5410 5500 5500 Sweden 1995 : : : : : : 607* 597* 642 United Kingdom : : : : : : : : : PHARE 13 Albania : : : : 30 10.5 : : : Bosnia & Herzegovina
: : : : : : : : :
Bulgaria 1995 ® : : 4450 : : : : : 942 Czech Rep. 1995 1600 870 1400 : : 22 697 848 589 Estonia 1995 161.9 176 201.6 : : : 426 478 350 FYROM : : : : : : : : : Hungary 1994 2500 2500 2100 0 5 5 1590 1490 1200 Latvia 1995 296.9 314.9 195.2 0 0 : 277.9 294.9 176.5 Lithuania 1995 584 694 730 n.d. n.d. n.d. 408 426 259
21
Table 13 continued country latest
year Groundwater available for
annual abstraction Total annual artificial
groundwater injection or recharge
Total annual fresh groundwater abstraction
1985 1990 latest year 1985 1990 latest year
1985 1990 latest year
Poland (1) 1995 13236: 14040 15635 n.d. n.d. n.d. 2377 2320 1871 Romania 1995 : : 9680 : : : 2134 1820 1278 Slovak Rep. 1995 2295 2358 2330 n.d. n.d. n.d. 671 749 578 Slovenia 1994 : : : : : : 176 166 153.2 TACIS 7 Armenia : : : : : : : : : Azerbaijan : : : : : : : : : Belarus : : : : : : : : : Georgia : : : : : : : : : Moldova, Rep. 1995 927 1095 982 : : : 274 312 244 Russian Federation
: : : : : : : : :
Ukraine : : : : : : : : : OTHERS Croatia 1996 5616 5616 5616 0 0 0 577 528 429 Cyprus 1995 : : 270 : : 15 : : : Malta : : : : : : : : : Federal Republic of Yugoslavia
: : : : : : : : :
Switzerland 1995 : : : : : : 953 941 902 Turkey 1995 ® : 11813 12021 : : : 5300 6631 8454 * diverging from EUROSTAT ® Bulgaria: total annual groundwater abstraction is approx. 1.5 times higher due to a great number of small
consumers Turkey: 1990 data from
1991
(1) Data from Polish Statistical Office (1998)
Source: groundwater questionnaire, 1996, EUROSTAT, 1996
22
Table 14 Total annual fresh groundwater abstraction by major activity 1985, 1990 and latest year available (in Mio m³/year) country public water supply private self supply agriculture mining industry cooling (electricity)
total domestic sector total irrigation latest
year 1985 1990 latest
year 1985 1990 latest
year 1985 1990 latest
year 1985 1990 latest 1985 1990 latest
year 1985 1990 latest
year 1985 1990 latest 1985 1990 latest
year EEA 18 Austria 1994 618 636* 659 : 583 612 148 112 107 : 269 110 : 200 60 : : : : 436* 463 Belgium : : : : : : : : : : : : : : : : : : : : : Denmark 1995 540 560* 475 360 325 310 10 10 10 360 300 350 200 140* 200 0 0 0 290 50* 65 Finland 1993 200 223 233 : : : 54 45 40 : : : : : : : : : : 7 : France 1994 3675 3487* 3381 : : : : : : 676 1000* 1007 : : : : : : 1807 1700* 1594 Germany ® : 4863 : : : : : : : : : : : 469 : : : : : 2235 : Greece : : : : : : : : : : : : : 2000 : : : : : : : Iceland 1995 80 69 2 : : : : 2 3 : 63 0 0 0 0 0 0 10 0 10 Ireland : : : : : : : : : : : : : : : : : : : : : Italy : : : : : : : : : : : : : : : : : : : : : Liechtenstein
: : : : : : : : : : : : : : : : : : : : :
Luxembourg
: 31 : : : : : : : : : : : : : : : : : 3 :
Netherlands : 847 : : : : : : : : 130 : : 100 : : : : : 206 : Norway : 65 : : : : : 18 : : : : : : : : : : : : : Portugal 1996 : 462 360 : : 241 : : : 2568 3800 : : 3420 : : : : 285 800 Spain : 1080* : : : : : : : : 4060 : : 4060* : : : : : 360* : Sweden : 449 : : : : : : : : 80 : : 15 : : : : 20 UK : 2064 : : : : : : : : : : : : : : : : : : : PHARE 13 Albania : : : : : : : : : : 2 : : 2 : : 77 13 : 1.3 0.7 Bosnia & Herzegovina
: : : : : : : : : : : : : : : : : : : : :
Bulgaria 1995 : : 637.3 : : : : : : : : 32.2 : : : : : 13 : : 214.5 Czech Rep. 1995 ® 449 555 440 n.d. n.d. n.d. 54 38 35 50 55 41 0 0 0 94 93 73 : : : Estonia 1995 : : : : : : : : : : : : : : : 291 310 254 : : : FYROM : : : : : : : : : : : : : : : : : : : : : Hungary 1994 900 860 760 480 480 400 40 30 20 100 150 200 n.d. n.d. n.d. 350 200 100 300 280 250 Latvia 1995 : : : : : : : : : : : : : : : : : : : : : Lithuania 1995 144 178 145 83 63 37 n.d. n.d. n.d. n.d. n.d. n.d. n.d. n.d. n.d. n.d. n.d. n.d. 77 71 37
23
Table 14 continued country public water supply private self supply agriculture mining industry cooling (electricity)
total domestic sector total irrigation latest
year 1985 1990 latest
year 1985 1990 latest
year 1985 1990 latest
year 1985 1990 latest
1985 1990 latest
year 1985 1990 latest
year 1985 1990 latest 1985 1990 latest
year Poland (1) 1995 1458 1477 1283 n.d. n.d. n.d. n.d. n.d. n.d. n.d. n.d. n.d. 344 96 208 344 296 298 32 30 19
Romania 1995 1000 820 672 : : : : : : 416 160 105 24 10 6 : : 47 : : 442
Slovak Rep. 1995 512 554 459 n.d. n.d. n.d. n.d. n.d. n.d. 44 37 21 3 4 3 n.d. n.d. n.d. 115 114 89
Slovenia 1994 ® 122 132 124 : : : : : 31.6 : 1 0.2 : 1 0.2 : : : 39 32 23
TACIS 7
Armenia : : : : : : : : : : : : : : : : : : : : :
Azerbaijan : : : : : : : : : : : : : : : : : : : : :
Belarus : : : : : : : : : : : : : : : : : : : : :
Georgia : : : : : : : : : : : : : : : : : : : : :
Moldova 1995 : 140 : : : : : : : : 126 : : : : : 0.8 : : 2.1 :
Russian Federation
: : : : : : : : : : : : : : : : : : : : :
Ukraine : : : : : : : : : : : : : : : : : : : : :
OTHERs
Croatia 1996 428 386 303 316 291 261 78.8 77.1 77 1.4 1.4 1.2 1.2 1.2 1 : : : 96 82 42
Cyprus 1995 : : 50 : : : : : : : : 80 : : : : . : : : :
Malta : : : : : : : : : : : : : : : : : : : : :
Federal Republic of Yugoslavia
: : : : : : : : : : : : : : : : : : : : :
Switzerland 1994 953 941 902 : : : : : : : : : : : : : : : : : :
Turkey 1995 ® : : : : : : : : : : : : : 3591 4640 : : : : 485 502
* diverging from EUROSTAT
® Germany and Czech Rep.: abstraction for industry includes mining
Slovenia: manufacturing industry incl. cooling water for electricity
Turkey: 1990 data from 1991, cooling data from 1992
(1) Data from Polish Statistical Office (1998)
Source: groundwater questionnaire, 1996
EUROSTAT, 1996
24
Table 15 Country specific remarks on human interventions Austria Austria is a country with abundant water resources. Nevertheless and disregarding very local
effects, the major impact on groundwater quantity was the drainage of 200,000 ha of land in the post war period in order to intensify agricultural production. This drainage of land was accompanied by a straightening of water courses for better drainage and flood control. Minor impacts - according to the criteria applied - are due to the irrigation of at about 76,000 hectares (1989) of land especially in the eastern parts of Austria.
Czech Republic
Heavy machinery in agriculture and forestry, inadequate drainage of agricultural and forest lands, urbanisation (change of infiltration capacity of land), deepening of underground water table due to river regulation (local problems).
Denmark The most important problem is lowering of the groundwater table from abstractions for water supply, agriculture and industry.
Finland There is no significant over-exploitation in Finland. Utilisation is generally less than yield. France Currently no assessments are available at the country level. Hungary • Ground water recharge is lower than the concentrated drinking water abstraction in some areas,
resulting in local depressions of the ground water table in the greatest part of Hungary. Additional resources have been mobilised (mainly the local, potentially polluted shallow ground water resources)
• A huge amount of groundwater pumped from shallow wells is used for irrigation • Artificial, preventive decrease of groundwater table due to bauxite, coal, and lignite mining has
upset the groundwater balance. The greatest exploitation in the Trans-Danubian Mountains, which resulted in a 200-300 m local depression of the karst water table, was cancelled. The karst reservoir has been refilling since 1990.
• Drainage of lowlands causes decreasing water tables in the recharge areas. • NW Hungary (Szigetköz) Danube river has a new, artificial channel built in the Slovak Republic
(Gabcikovo) for the production of electricity. Groundwater balance of the thick gravel aquifer recharging from the river Danube has been disturbed. The river bed of Danube was dredged in many places.
• Higher transpiration of forests causes lower infiltration rate mainly in the recharge areas of the regional groundwater flow systems.
Iceland Water abstraction in Iceland is mostly for public water supply and – quickly increasing - for fish farming. However the most important human intervention in groundwater quantity is land drainage due to cultivation and other land use.
Ireland None identified Norway Any problems of this sort are only at the local level - if any. Portugal The most important human interventions are those related to groundwater abstraction: agricultural
use (76%), industrial supply (16%), public supply (8%). This type and the extent of the intervention may lead, in some places where it is more important, to the over-exploitation of groundwater.
Romania The average consumption per capita, as well as the specific consumption in industry and agriculture are higher than in other countries, due to the exaggerated losses along the water supply and distribution networks. In Bucharest, for instance, the water losses reach 40 - 50 %. Also in the irrigation systems the used water represents some 40 - 50 % out of the total amount pumped. The specific consumption in certain industries - such as the iron and steel industry, the energy, chemical and textile sector etc. - exceed by 1.5 - 2 times the consumption of the economically advanced countries. The way in which the groundwater is used has a double negative effect: • A high specific energy consumption, almost twice as high as necessary; • An important imbalance of groundwater quantity.
Slovak Republic
In the Slovak Republic it would be possible to increase groundwater quantity also by improving water management in the field of static groundwater resources within a year cycle, mainly in Mesozoic structures.
Slovenia Aquifer No 18: lowering of the groundwater table by 5 m due to the river channelisation and river bed gravel mining (71.4 km²) Aquifer No 14: rising of groundwater level due to river damming for hydropower scheme (14 m along the river, 7 m at control part, 2 m at outflow boundary) - 56.9 km² Aquifer No 20: rising of groundwater level (1 m) and damping of groundwater oscillation due to agro-melioration - 27.3 km²
25
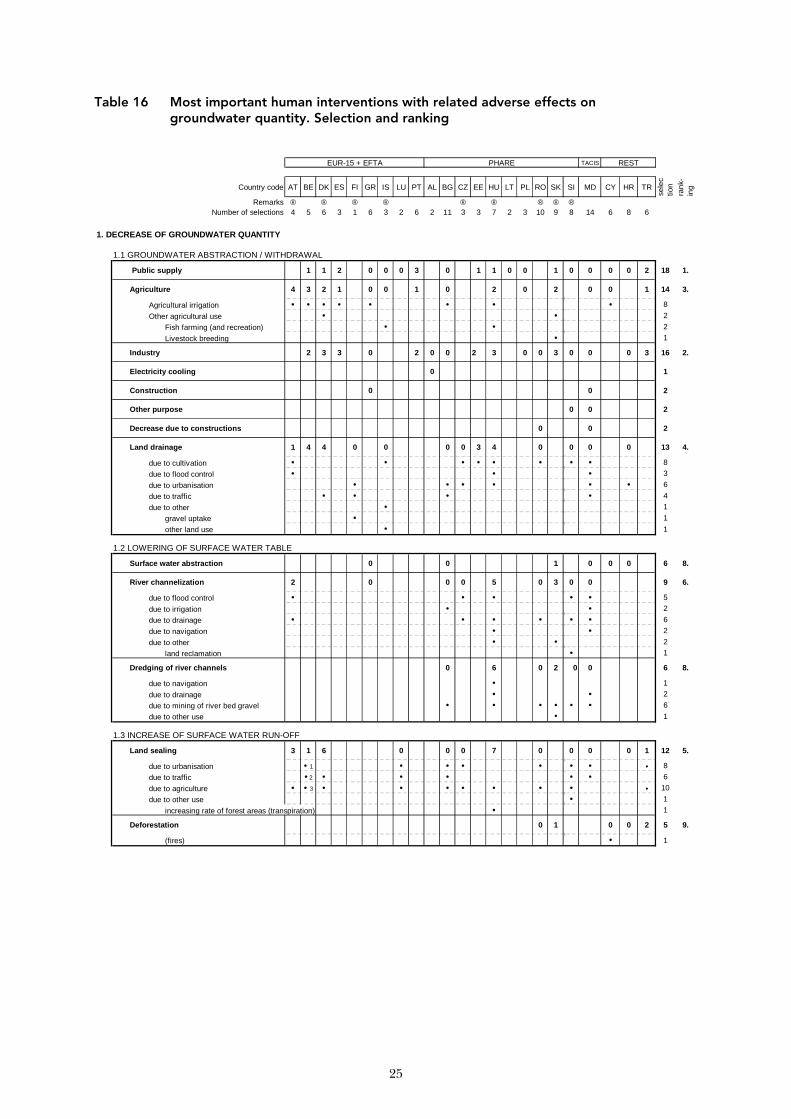
Table 16 Most important human interventions with related adverse effects on groundwater quantity. Selection and ranking
EUR-15 + EFTA PHARE TACIS REST
Country code AT BE DK ES FI GR IS LU PT AL BG CZ EE HU LT PL RO SK SI MD CY HR TR
sele
ctio
nra
nk-
ing
Remarks ® ® ® ® ® ® ® ® ®Number of selections 4 5 6 3 1 6 3 2 6 2 11 3 3 7 2 3 10 9 8 14 6 8 6
1. DECREASE OF GROUNDWATER QUANTITY
1.1 GROUNDWATER ABSTRACTION / WITHDRAWAL
Public supply 1 1 2 0 0 0 3 0 1 1 0 0 1 0 0 0 0 2 18 1.
Agriculture 4 3 2 1 0 0 1 0 2 0 2 0 0 1 14 3.
Agricultural irrigation • • • • • • • • 8
Other agricultural use • • 2
Fish farming (and recreation) • • 2
Livestock breeding • 1
Industry 2 3 3 0 2 0 0 2 3 0 0 3 0 0 0 3 16 2.
Electricity cooling 0 1
Construction 0 0 2
Other purpose 0 0 2
Decrease due to constructions 0 0 2
Land drainage 1 4 4 0 0 0 0 3 4 0 0 0 0 13 4.
due to cultivation • • • • • • • • 8
due to flood control • • • 3
due to urbanisation • • • • • • 6
due to traffic • • • • 4
due to other • 1
gravel uptake • 1
other land use • 1
1.2 LOWERING OF SURFACE WATER TABLE
Surface water abstraction 0 0 1 0 0 0 6 8.
River channelization 2 0 0 0 5 0 3 0 0 9 6.
due to flood control • • • • • 5
due to irrigation • • 2
due to drainage • • • • • • 6
due to navigation • • 2
due to other • • 2
land reclamation • 1
Dredging of river channels 0 6 0 2 0 0 6 8.
due to navigation • 1
due to drainage • • 2
due to mining of river bed gravel • • • • • • 6
due to other use • 1
1.3 INCREASE OF SURFACE WATER RUN-OFF
Land sealing 3 1 6 0 0 0 7 0 0 0 0 1 12 5.
due to urbanisation • 1 • • • • • • • 8
due to traffic • 2 • • • • • 6
due to agriculture • • 3 • • • • • • • • 10
due to other use • 1
increasing rate of forest areas (transpiration) • 1
Deforestation 0 1 0 0 2 5 9.
(fires) • 1
26
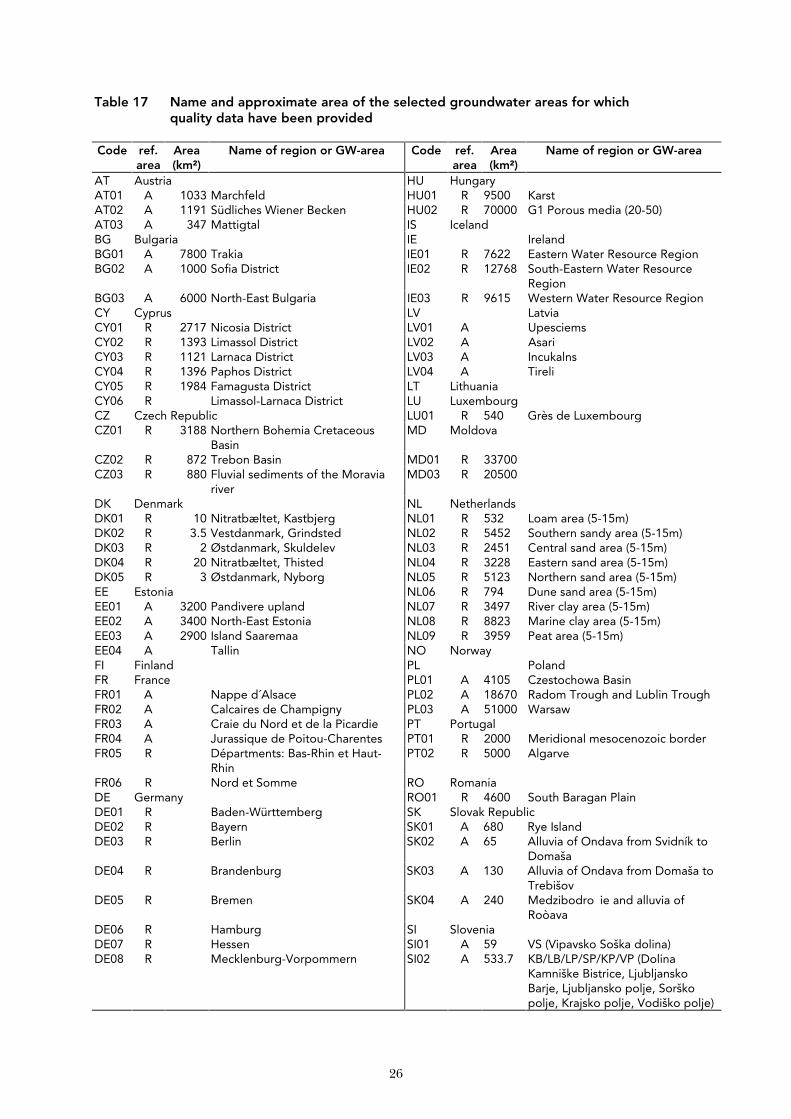
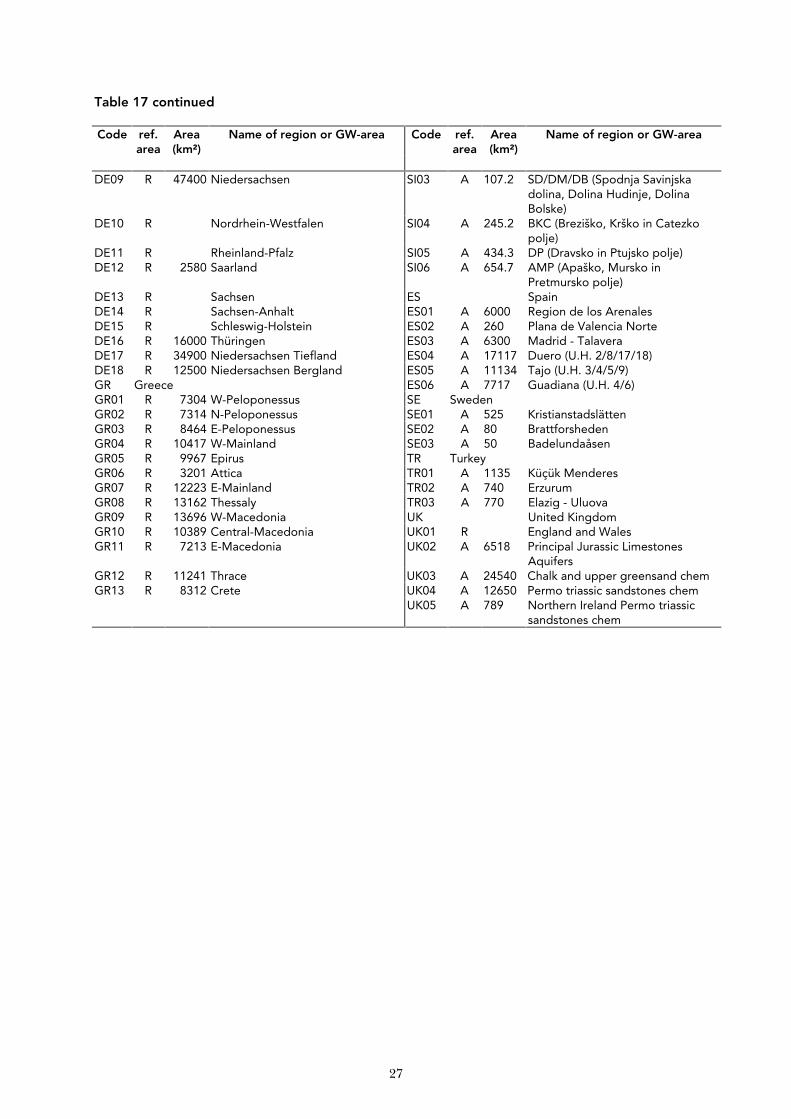
Table 17 Name and approximate area of the selected groundwater areas for which quality data have been provided Code ref.
area Area (km²)
Name of region or GW-area Code ref. area
Area (km²)
Name of region or GW-area
AT Austria HU Hungary AT01 A 1033 Marchfeld HU01 R 9500 Karst AT02 A 1191 Südliches Wiener Becken HU02 R 70000 G1 Porous media (20-50) AT03 A 347 Mattigtal IS Iceland BG Bulgaria IE Ireland BG01 A 7800 Trakia IE01 R 7622 Eastern Water Resource Region BG02 A 1000 Sofia District IE02 R 12768 South-Eastern Water Resource
Region BG03 A 6000 North-East Bulgaria IE03 R 9615 Western Water Resource Region CY Cyprus LV Latvia CY01 R 2717 Nicosia District LV01 A Upesciems CY02 R 1393 Limassol District LV02 A Asari CY03 R 1121 Larnaca District LV03 A Incukalns CY04 R 1396 Paphos District LV04 A Tireli CY05 R 1984 Famagusta District LT Lithuania CY06 R Limassol-Larnaca District LU Luxembourg CZ Czech Republic LU01 R 540 Grès de Luxembourg CZ01 R 3188 Northern Bohemia Cretaceous
Basin MD Moldova
CZ02 R 872 Trebon Basin MD01 R 33700 CZ03 R 880 Fluvial sediments of the Moravia
river MD03 R 20500
DK Denmark NL Netherlands DK01 R 10 Nitratbæltet, Kastbjerg NL01 R 532 Loam area (5-15m) DK02 R 3.5 Vestdanmark, Grindsted NL02 R 5452 Southern sandy area (5-15m) DK03 R 2 Østdanmark, Skuldelev NL03 R 2451 Central sand area (5-15m) DK04 R 20 Nitratbæltet, Thisted NL04 R 3228 Eastern sand area (5-15m) DK05 R 3 Østdanmark, Nyborg NL05 R 5123 Northern sand area (5-15m) EE Estonia NL06 R 794 Dune sand area (5-15m) EE01 A 3200 Pandivere upland NL07 R 3497 River clay area (5-15m) EE02 A 3400 North-East Estonia NL08 R 8823 Marine clay area (5-15m) EE03 A 2900 Island Saaremaa NL09 R 3959 Peat area (5-15m) EE04 A Tallin NO Norway FI Finland PL Poland FR France PL01 A 4105 Czestochowa Basin FR01 A Nappe d´Alsace PL02 A 18670 Radom Trough and Lublin Trough FR02 A Calcaires de Champigny PL03 A 51000 Warsaw FR03 A Craie du Nord et de la Picardie PT Portugal FR04 A Jurassique de Poitou-Charentes PT01 R 2000 Meridional mesocenozoic border FR05 R Départments: Bas-Rhin et Haut-
Rhin PT02 R 5000 Algarve
FR06 R Nord et Somme RO Romania DE Germany RO01 R 4600 South Baragan Plain DE01 R Baden-Württemberg SK Slovak Republic DE02 R Bayern SK01 A 680 Rye Island DE03 R Berlin SK02 A 65 Alluvia of Ondava from Svidník to
Domaša DE04 R Brandenburg SK03 A 130 Alluvia of Ondava from Domaša to
Trebišov DE05 R Bremen SK04 A 240 Medzibodro ie and alluvia of
Roòava DE06 R Hamburg SI Slovenia DE07 R Hessen SI01 A 59 VS (Vipavsko Soška dolina) DE08 R Mecklenburg-Vorpommern SI02 A 533.7 KB/LB/LP/SP/KP/VP (Dolina
Kamniške Bistrice, Ljubljansko Barje, Ljubljansko polje, Sorško polje, Krajsko polje, Vodiško polje)
27
Table 17 continued Code ref.
area Area (km²)
Name of region or GW-area Code ref. area
Area (km²)
Name of region or GW-area
DE09 R 47400 Niedersachsen SI03 A 107.2 SD/DM/DB (Spodnja Savinjska
dolina, Dolina Hudinje, Dolina Bolske)
DE10 R Nordrhein-Westfalen SI04 A 245.2 BKC (Breziško, Krško in Catezko polje)
DE11 R Rheinland-Pfalz SI05 A 434.3 DP (Dravsko in Ptujsko polje) DE12 R 2580 Saarland SI06 A 654.7 AMP (Apaško, Mursko in
Pretmursko polje) DE13 R Sachsen ES Spain DE14 R Sachsen-Anhalt ES01 A 6000 Region de los Arenales DE15 R Schleswig-Holstein ES02 A 260 Plana de Valencia Norte DE16 R 16000 Thüringen ES03 A 6300 Madrid - Talavera DE17 R 34900 Niedersachsen Tiefland ES04 A 17117 Duero (U.H. 2/8/17/18) DE18 R 12500 Niedersachsen Bergland ES05 A 11134 Tajo (U.H. 3/4/5/9) GR Greece ES06 A 7717 Guadiana (U.H. 4/6) GR01 R 7304 W-Peloponessus SE Sweden GR02 R 7314 N-Peloponessus SE01 A 525 Kristianstadslätten GR03 R 8464 E-Peloponessus SE02 A 80 Brattforsheden GR04 R 10417 W-Mainland SE03 A 50 Badelundaåsen GR05 R 9967 Epirus TR Turkey GR06 R 3201 Attica TR01 A 1135 Küçük Menderes GR07 R 12223 E-Mainland TR02 A 740 Erzurum GR08 R 13162 Thessaly TR03 A 770 Elazig - Uluova GR09 R 13696 W-Macedonia UK United Kingdom GR10 R 10389 Central-Macedonia UK01 R England and Wales GR11 R 7213 E-Macedonia UK02 A 6518 Principal Jurassic Limestones
Aquifers GR12 R 11241 Thrace UK03 A 24540 Chalk and upper greensand chem GR13 R 8312 Crete UK04 A 12650 Permo triassic sandstones chem
UK05 A 789 Northern Ireland Permo triassic sandstones chem
28
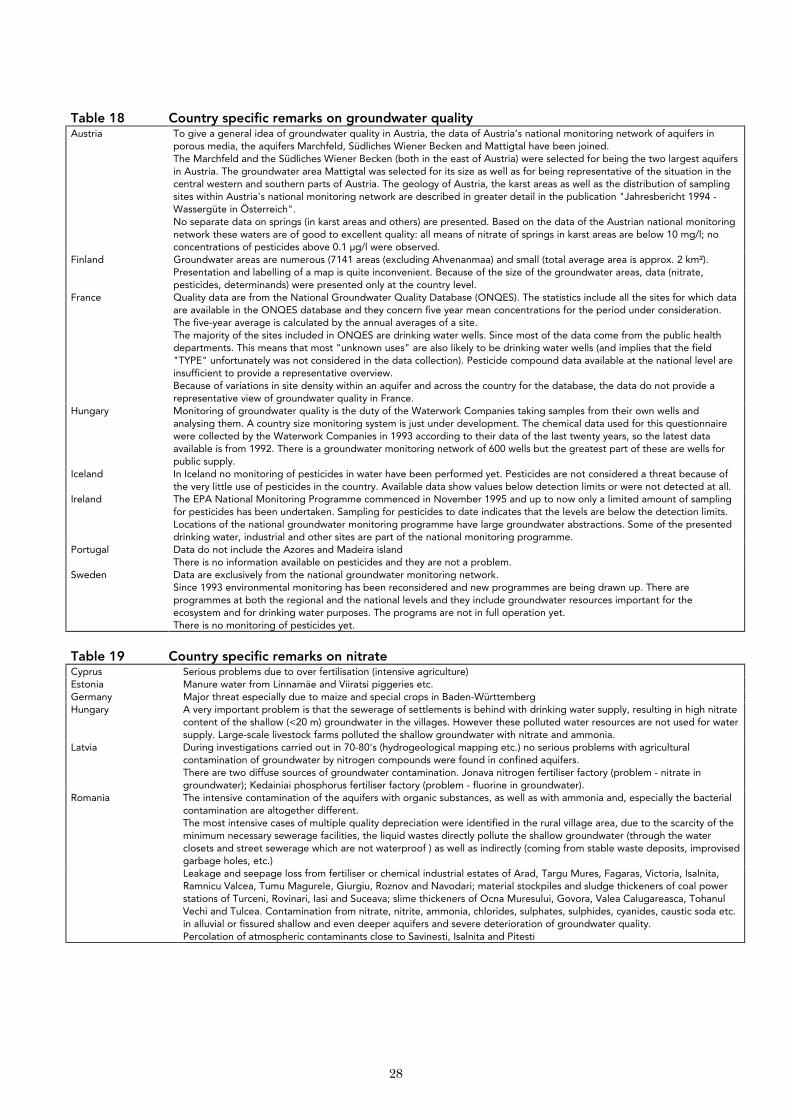
Table 18 Country specific remarks on groundwater quality Austria To give a general idea of groundwater quality in Austria, the data of Austria’s national monitoring network of aquifers in
porous media, the aquifers Marchfeld, Südliches Wiener Becken and Mattigtal have been joined. The Marchfeld and the Südliches Wiener Becken (both in the east of Austria) were selected for being the two largest aquifers in Austria. The groundwater area Mattigtal was selected for its size as well as for being representative of the situation in the central western and southern parts of Austria. The geology of Austria, the karst areas as well as the distribution of sampling sites within Austria's national monitoring network are described in greater detail in the publication "Jahresbericht 1994 - Wassergüte in Österreich". No separate data on springs (in karst areas and others) are presented. Based on the data of the Austrian national monitoring network these waters are of good to excellent quality: all means of nitrate of springs in karst areas are below 10 mg/l; no concentrations of pesticides above 0.1 µg/l were observed.
Finland Groundwater areas are numerous (7141 areas (excluding Ahvenanmaa) and small (total average area is approx. 2 km²). Presentation and labelling of a map is quite inconvenient. Because of the size of the groundwater areas, data (nitrate, pesticides, determinands) were presented only at the country level.
France Quality data are from the National Groundwater Quality Database (ONQES). The statistics include all the sites for which data are available in the ONQES database and they concern five year mean concentrations for the period under consideration. The five-year average is calculated by the annual averages of a site. The majority of the sites included in ONQES are drinking water wells. Since most of the data come from the public health departments. This means that most "unknown uses" are also likely to be drinking water wells (and implies that the field "TYPE" unfortunately was not considered in the data collection). Pesticide compound data available at the national level are insufficient to provide a representative overview. Because of variations in site density within an aquifer and across the country for the database, the data do not provide a representative view of groundwater quality in France.
Hungary Monitoring of groundwater quality is the duty of the Waterwork Companies taking samples from their own wells and analysing them. A country size monitoring system is just under development. The chemical data used for this questionnaire were collected by the Waterwork Companies in 1993 according to their data of the last twenty years, so the latest data available is from 1992. There is a groundwater monitoring network of 600 wells but the greatest part of these are wells for public supply.
Iceland In Iceland no monitoring of pesticides in water have been performed yet. Pesticides are not considered a threat because of the very little use of pesticides in the country. Available data show values below detection limits or were not detected at all.
Ireland The EPA National Monitoring Programme commenced in November 1995 and up to now only a limited amount of sampling for pesticides has been undertaken. Sampling for pesticides to date indicates that the levels are below the detection limits. Locations of the national groundwater monitoring programme have large groundwater abstractions. Some of the presented drinking water, industrial and other sites are part of the national monitoring programme.
Portugal Data do not include the Azores and Madeira island There is no information available on pesticides and they are not a problem.
Sweden Data are exclusively from the national groundwater monitoring network. Since 1993 environmental monitoring has been reconsidered and new programmes are being drawn up. There are programmes at both the regional and the national levels and they include groundwater resources important for the ecosystem and for drinking water purposes. The programs are not in full operation yet. There is no monitoring of pesticides yet.
Table 19 Country specific remarks on nitrate Cyprus Serious problems due to over fertilisation (intensive agriculture) Estonia Manure water from Linnamäe and Viiratsi piggeries etc. Germany Major threat especially due to maize and special crops in Baden-Württemberg Hungary A very important problem is that the sewerage of settlements is behind with drinking water supply, resulting in high nitrate
content of the shallow (<20 m) groundwater in the villages. However these polluted water resources are not used for water supply. Large-scale livestock farms polluted the shallow groundwater with nitrate and ammonia.
Latvia During investigations carried out in 70-80's (hydrogeological mapping etc.) no serious problems with agricultural contamination of groundwater by nitrogen compounds were found in confined aquifers. There are two diffuse sources of groundwater contamination. Jonava nitrogen fertiliser factory (problem - nitrate in groundwater); Kedainiai phosphorus fertiliser factory (problem - fluorine in groundwater).
Romania The intensive contamination of the aquifers with organic substances, as well as with ammonia and, especially the bacterial contamination are altogether different. The most intensive cases of multiple quality depreciation were identified in the rural village area, due to the scarcity of the minimum necessary sewerage facilities, the liquid wastes directly pollute the shallow groundwater (through the water closets and street sewerage which are not waterproof ) as well as indirectly (coming from stable waste deposits, improvised garbage holes, etc.)
Leakage and seepage loss from fertiliser or chemical industrial estates of Arad, Targu Mures, Fagaras, Victoria, Isalnita, Ramnicu Valcea, Tumu Magurele, Giurgiu, Roznov and Navodari; material stockpiles and sludge thickeners of coal power stations of Turceni, Rovinari, Iasi and Suceava; slime thickeners of Ocna Muresului, Govora, Valea Calugareasca, Tohanul Vechi and Tulcea. Contamination from nitrate, nitrite, ammonia, chlorides, sulphates, sulphides, cyanides, caustic soda etc. in alluvial or fissured shallow and even deeper aquifers and severe deterioration of groundwater quality. Percolation of atmospheric contaminants close to Savinesti, Isalnita and Pitesti
29
Table 20 Number of sampling sites with regard to nitrate. Comparison between the EEA’s inventory and information delivered for the monograph
Groundwater Monitoring in Europe (EEA 1997) reported NO3
Country number of sampling sites Nitrate sampling sites
Austria 1,359, will increase to 1,600 within 1996. 70 in karst, will increase to 450
✔ 1719C
Belgium no information - -
Denmark 1,100 sampling sites ✔ 1113 C
Finland 50 reference sampling sites: 20 in porous media aquifers, 30 in others, and 1426 abstraction points
✔ 425 C
France 16112 sampling sites ✔ 5805 C
Germany 4092 C Bayern 118 in porous aquifers, 40 in karst and 121 in fractured rock ✔ 280 Nordrhein-Westfalen
2,256 in porous media, 20 in karst, 310 in fractured rock ✔ 1457
Thüringen 4 in porous media, 96 in joint aquifers, 20 in karst ✔ 78 Sachsen-Anhalt 82 in porous media, 30 in solid rock media ✔ 114
Greece 275 sites. National network planned: 186 monitoring sites - 360 R (13)
Iceland no information - 51 C
Ireland in operation: 293 groundwater abstraction points - 676 C
Italy no national monitoring ✔ -
Luxembourg - - 110 R (1)
The Netherlands 380 (375+5) monitoring wells, other networks: 240 pumping stations, 150 forest sites
✔ 440 R (9)
Norway 38 monitoring stations, groundwater chemistry is monthly monitored at 4 stations. Project NIVA: 4 wells (precipitation chemistry, soil and water acidification)
✔ 4 C
Portugal 74 sampling sites ✔ 75 R (1)
Spain 1,147 sampling sites in porous media, 408 in karst, 1,377 in isolated groundwater regions
✔ 98 R (3)
Sweden 2 sampling sites in each of the 27 different geological regions
✔ 126 C
United Kingdom ✔ 765 R (4) England and Wales 346 sampling sites in porous media, karst: 270, other: 1,920 - - Scotland no information - -
Northern Ireland 1992: 759 groundwater sources measured, 351 sites with either pumped or naturally flowing water; 109 sites were revisited at 3 monthly intervals until July 1994, then reduced to 78 target sites; 1992/93: 95 sites to sample monthly for 12 month, monitoring was reduced to 5 sites in 10/93
- -
C)…at the country level R (#))…aggregated at the regional level (# = number of regions)
30
Table 21 Nitrate sampling sites
Sampling Sites absolute Sampling Sites in % code name year area
km² sites/ 1000
km² total wells
drinking water wells
industrial water wells
monitoring wells
other wells
no info drinking water wells
industrial water wells
monitoring wells
other wells no info
AT Austria 1995 1719 288 386 395 650 17 22 23 38
AT01 Marchfeld 1995 1033 74.54 77 11 11 35 20 14 14 45 26
AT02 Südliches Wiener Becken 1995 1191 83.96 100 31 36 8 25 31 36 8 25
AT03 Mattigtal 1995 347 54.76 19 2 4 1 12 11 21 5 63
BG Bulgaria
BG01 Trakia 1995 7800 9.10 71 54 4 11 2 76 6 15 3
BG02 Sofia District 1995 1000 25.00 25 5 6 12 2 20 24 48 8
BG03 North-East Bulgaria 1995 6000 3.17 19 12 2 1 4 63 11 5 21
CY Cyprus
CY01 Nicosia District 1995 2717 87.96 239 196 0 43 0 82 0 18 0
CY02 Limassol District 1995 1393 166.55 232 189 0 43 0 81 0 19 0
CY03 Larnaca District 1995 1121 69.58 78 67 0 11 0 86 0 14 0
CY04 Paphos District 1995 1396 130.37 182 152 0 30 0 84 0 16 0
CY05 Famagusta District 1995 1984 13.10 26 23 0 3 0 88 0 12 0
CZ Czech Republic 1996 476 0 0 339 137 0 0 71 29
CZ01 Northern Bohemia Cretaceous Basin
1996 3188 26.35 84 0 0 70 14 0 0 83 17
CZ02 Trebon Basin 1996 872 35.55 31 0 0 31 0 0 0 100 0
CZ03 Fluvial sediments of the Moravia river
1996 880 12.50 11 0 0 11 0 0 0 100 0
DK Denmark 1995 1113 0 0 1113 0 0 0 100 0
DK01 Nitratbæltet, Kastbjerg 1995 10 2200.00 22 0 0 22 0 0 0 100 0
DK02 Vestdanmark, Grindsted 1995 3.5 6000.00 21 0 0 21 0 0 0 100 0
DK03 Østdanmark, Skuldelev 1995 2 9000.00 18 0 0 18 0 0 0 100 0
EE Estonia 1996 163 42 0 121 0 26 0 74 0
EE01 Pandivere upland 1996 3200 9.06 29 0 0 10 19 0 0 34 66
EE02 North-East Estonia 1996 3400 10.00 34 12 0 22 0 35 0 65 0
EE03 Island Saaremaa 1996 2900 4.48 13 3 0 10 0 23 0 77 0
FI Finland 1995 425 370 0 55 0 87 0 13 0
31
Table 21 continued Sampling Sites absolute Sampling Sites in %
code name year area km²
sites/ 1000 km²
total wells
drinking water wells
industrial water wells
monitoring wells
other wells
no info drinking water wells
industrial water wells
monitoring wells
other wells
no info
FR France 9195 5805 5805 100 FR01 Nappe d´Alsace 9195 117 117 FR02 Calcaires de Champigny 9195 7 7 FR03 Craie du Nord et de la
Picardie 9195 793 793
FR04 Jurassique de Poitou-Charentes
9195 24 24 0 0 0 100 0 0 0
DE Germany 1995 4092 17 0 3918 0 157 0 0 96 0 4 DE01 Baden-Württemberg 1992 71 71 DE02 Bayern 280 0 0 280 0 0 0 100 0 DE03 Berlin 1991 323 0 0 323 0 0 0 100 0 DE04 Brandenburg 1993 82 17 0 65 0 21 0 79 0 DE05 Bremen 8693 149 0 0 149 0 0 0 100 0 DE06 Hamburg 9193 107 0 0 107 0 0 0 100 0 DE07 Hessen 1993 297 0 0 297 0 0 0 100 0 DE08 Mecklenburg-Vorpommern 1993 36 0 0 36 0 0 0 100 0 DE09 Niedersachsen 1993 47400 4.51 214 0 0 214 0 0 0 100 0 DE10 Nordrhein-Westfalen 1991 1457 0 0 1457 0 0 0 100 0 DE11 Rheinland-Pfalz 9193 641 0 0 641 0 0 0 100 0 DE12 Saarland 1993 2580 42.64 110 0 0 110 0 0 0 100 0 DE13 Sachsen 1993 86 86 DE14 Sachsen-Anhalt 9093 114 0 0 114 0 0 0 100 0 DE15 Schleswig-Holstein 1993 47 0 0 47 0 0 0 100 0 DE16 Thüringen 1992 16000 4.88 78 0 0 78 0 0 0 100 0
GR Greece GR01 W-Peloponessus 1996 7304 4.24 31 13 1 0 17 42 3 0 55 GR02 N-Peloponessus 1996 7314 5.88 43 15 12 0 16 35 28 0 37 GR03 E-Peloponessus 1996 8464 2.95 25 2 0 0 23 8 0 0 92 GR04 W-Mainland 1996 10417 2.59 27 13 1 0 13 48 4 0 48 GR05 Epirus 1996 9967 1.71 17 5 5 0 7 29 29 0 41 GR06 Attica 1996 3201 4.69 15 2 1 0 12 13 7 0 80
32
Table 21 continued Sampling Sites absolute Sampling Sites in %
code name year area km²
sites/ 1000 km²
total wells
drinking water wells
industrial water wells
monitoring wells
other wells
no info drinking water wells
industrial water wells
monitoring wells
other wells
no info
GR07 E-Mainland 1996 12223 1.96 24 7 1 0 16 29 4 0 67 GR08 Thessaly 1996 13162 2.13 28 6 1 0 21 21 4 0 75 GR09 W-Macedonia 1996 13696 2.26 31 13 1 0 17 42 3 0 55 GR10 Central-Macedonia 1996 10389 3.85 40 22 1 0 17 55 3 0 43 GR11 E-Macedonia 1996 7213 3.19 23 8 0 0 15 35 0 0 65 GR12 Thrace 1996 11241 2.85 32 7 0 0 25 22 0 0 78 GR13 Crete 1996 8312 2.89 24 8 0 0 16 33 0 0 67
HU Hungary 1992 4282 4282 0 0 0 100 0 0 0 HU01 Karstic 1992 9500 32.53 309 309 0 0 0 100 0 0 0 HU02 G1 Porous media (20-50) 1992 70000 7.03 492 492 0 0 0 100 0 0 0
IS Iceland 8696 51 51 0 0 0 100 0 0 0
IE Ireland 1995 676 671 3 0 2 99 1 0 0 IE01 Eastern Water Resource
Region 1995 7622 8.27 63 61 2 0 0 97 3 0 0
IE02 South-Eastern Water Resource Region
1995 12768 10.96 140 137 1 0 2 98 1 0 2
IE03 Western Water Resource Region
1995 9615 11.75 113 113 0 0 0 100 0 0 0
LV Latvia LV01 Upesciems 1996 2 0 0 2 0 0 0 100 0 LV02 Asari 1996 3 0 0 3 0 0 0 100 0 LV03 Incukalns 1996 4 0 0 4 0 0 0 100 0 LV04 Tireli 1996 7 0 0 7 0 0 0 100 0
LT Lithuania 1996 48 0 0 48 0 0 0 100 0
LU Luxembourg LU01 Grès de Luxembourg 1995 540 203.70 110 6 3 0 101 5 3 0 91
MD Moldova MD01 33700 2124.63 71600 71600 0 0 0 100 0 0 0
NL Netherlands NL01 Loam area (5-15m) 1995 532 5.64 3 0 0 3 0 0 0 100 0 NL02 Southern sandy area (5-15m) 1995 5452 10.09 55 0 0 55 0 0 0 100 0
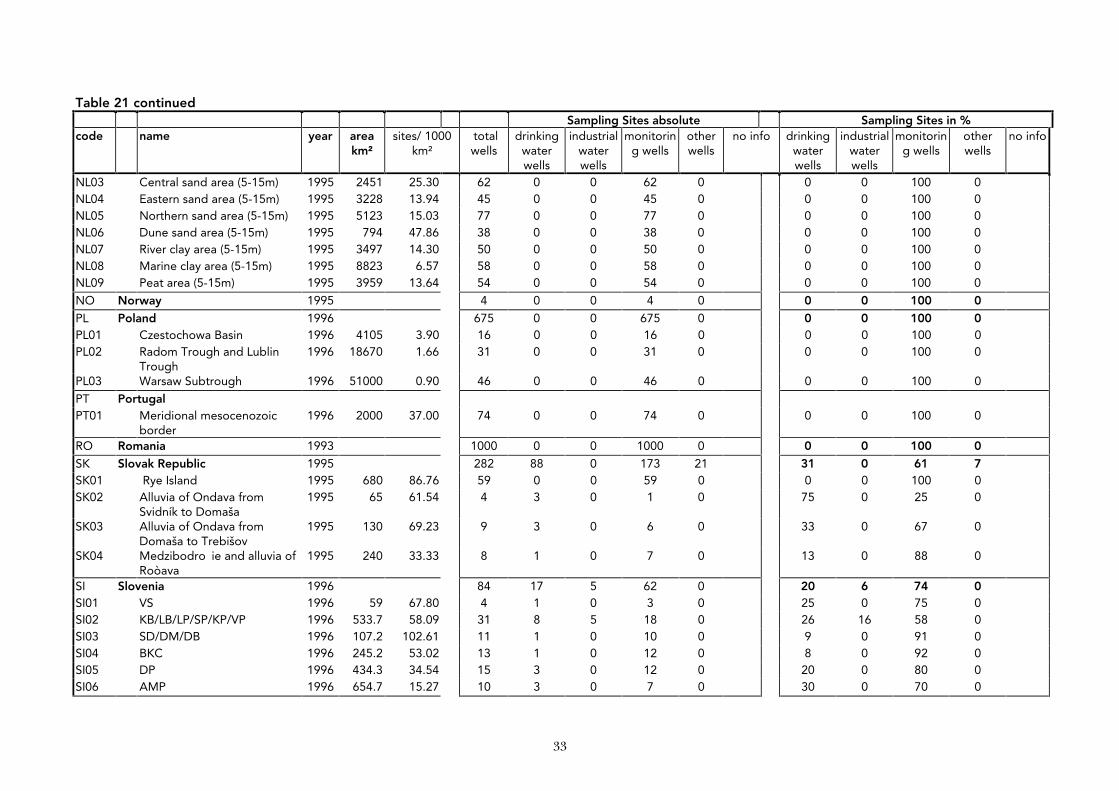
33
Table 21 continued Sampling Sites absolute Sampling Sites in %
code name year area km²
sites/ 1000 km²
total wells
drinking water wells
industrial water wells
monitoring wells
other wells
no info drinking water wells
industrial water wells
monitoring wells
other wells
no info
NL03 Central sand area (5-15m) 1995 2451 25.30 62 0 0 62 0 0 0 100 0 NL04 Eastern sand area (5-15m) 1995 3228 13.94 45 0 0 45 0 0 0 100 0 NL05 Northern sand area (5-15m) 1995 5123 15.03 77 0 0 77 0 0 0 100 0 NL06 Dune sand area (5-15m) 1995 794 47.86 38 0 0 38 0 0 0 100 0 NL07 River clay area (5-15m) 1995 3497 14.30 50 0 0 50 0 0 0 100 0 NL08 Marine clay area (5-15m) 1995 8823 6.57 58 0 0 58 0 0 0 100 0 NL09 Peat area (5-15m) 1995 3959 13.64 54 0 0 54 0 0 0 100 0
NO Norway 1995 4 0 0 4 0 0 0 100 0
PL Poland 1996 675 0 0 675 0 0 0 100 0 PL01 Czestochowa Basin 1996 4105 3.90 16 0 0 16 0 0 0 100 0 PL02 Radom Trough and Lublin
Trough 1996 18670 1.66 31 0 0 31 0 0 0 100 0
PL03 Warsaw Subtrough 1996 51000 0.90 46 0 0 46 0 0 0 100 0
PT Portugal PT01 Meridional mesocenozoic
border 1996 2000 37.00 74 0 0 74 0 0 0 100 0
RO Romania 1993 1000 0 0 1000 0 0 0 100 0
SK Slovak Republic 1995 282 88 0 173 21 31 0 61 7 SK01 Rye Island 1995 680 86.76 59 0 0 59 0 0 0 100 0 SK02 Alluvia of Ondava from
Svidník to Domaša 1995 65 61.54 4 3 0 1 0 75 0 25 0
SK03 Alluvia of Ondava from Domaša to Trebišov
1995 130 69.23 9 3 0 6 0 33 0 67 0
SK04 Medzibodro ie and alluvia of Roòava
1995 240 33.33 8 1 0 7 0 13 0 88 0
SI Slovenia 1996 84 17 5 62 0 20 6 74 0 SI01 VS 1996 59 67.80 4 1 0 3 0 25 0 75 0 SI02 KB/LB/LP/SP/KP/VP 1996 533.7 58.09 31 8 5 18 0 26 16 58 0 SI03 SD/DM/DB 1996 107.2 102.61 11 1 0 10 0 9 0 91 0 SI04 BKC 1996 245.2 53.02 13 1 0 12 0 8 0 92 0 SI05 DP 1996 434.3 34.54 15 3 0 12 0 20 0 80 0 SI06 AMP 1996 654.7 15.27 10 3 0 7 0 30 0 70 0
34
Table 21 continued Sampling Sites absolute Sampling Sites in %
code name year area km²
sites/ 1000 km²
total wells
drinking water wells
industrial water wells
monitoring wells
other wells
no info drinking water wells
industrial water wells
monitoring wells
other wells
no info
ES Spain ES01 Region de los Arenales 1995 6000 5.00 30 10 0 16 4 33 0 53 13 ES02 Plana de Valencia Norte 1995 260 42.31 11 6 0 0 5 55 0 0 45 ES03 Madrid - Talavera 1995 6300 9.05 57 20 3 0 34 35 5 0 60
SE Sweden 126 1 0 125 0 1 0 99 0
TR Turkey TR02 Erzurum 1996 740 24.32 18 13 0 0 5 72 0 0 28 TR03 Elazig - Uluova 1995 770 15.58 12 0 0 0 12 0 0 0 100
UK United Kingdom UK02 Principal Jurassic Limestones
Aquifers 1996 6518 32.99 215 215 100
UK03 Chalk and upper greensand chem
1996 24540 17.81 437 437 100
UK04 Permo triassic sandstones chem
1996 12650 8.38 106 106 100
UK05 Northern Ireland Permo triassic sandstones chem
1994 789 8.87 7 1 4 0 2 14 57 0 29
35
Table 22 Nitrate frequency distribution Frequency Distribution absolute Frequency Distribution in %
code Name year area km²
sampling sites
£10 mg/l >10 - £25 mg/l
>25 - £50 mg/l
>50 mg/l no info but £ 50
£10 mg/l >10 - £25 mg/l
>25 - £50 mg/l
>50 mg/l no info but £ 50
AT Austria 1995 1719 619 499 337 264 36 29 20 15 AT01 Marchfeld 1995 1033 77 7 12 14 44 9 16 18 57 AT02 Südliches Wiener Becken 1995 1191 100 16 42 21 21 16 42 21 21 AT03 Mattigtal 1995 347 19 4 14 1 0 21 74 5 0 BG Bulgaria BG01 Trakia 1995 7800 71 19 26 19 7 27 37 27 10 BG02 Sofia District 1995 1000 25 17 6 0 2 68 24 0 8 BG03 North-East Bulgaria 1995 6000 19 7 5 5 2 37 26 26 11 CY Cyprus CY01 Nicosia District 1995 2717 239 143 53 33 10 60 22 14 4 CY02 Limassol District 1995 1393 232 149 40 30 13 64 17 13 6 CY03 Larnaca District 1995 1121 78 57 10 8 3 73 13 10 4 CY04 Paphos District 1995 1396 182 99 53 17 13 54 29 9 7 CY05 Famagusta District 1995 1984 26 17 6 2 1 65 23 8 4 CZ Czech Republic 1996 476 275 76 58 67 58 16 12 14 CZ01 Northern Bohemia
Cretaceous Basin 1996 3188 84 57 17 6 4 68 20 7 5
CZ02 Trebon Basin 1996 872 31 27 0 1 3 87 0 3 10 CZ03 Fluvial sediments of the
Moravia river 1996 880 11 9 2 0 0 82 18 0 0
DK Denmark 1995 1113 766 72 91 184 69 6 8 17 DK01 Nitratbæltet, Kastbjerg 1995 10 22 6 4 1 11 27 18 5 50 DK02 Vestdanmark, Grindsted 1995 3.5 21 8 0 4 9 38 0 19 43 DK03 Østdanmark, Skuldelev 1995 2 18 10 4 1 3 56 22 6 17 EE Estonia 1996 163 127 24 11 1 78 15 7 1 EE01 Pandivere upland 1996 3200 29 15 12 2 0 52 41 7 0 EE02 North-East Estonia 1996 3400 34 33 0 1 0 97 0 3 0 EE03 Island Saaremaa 1996 2900 13 11 1 1 0 85 8 8 0 FI Finland 1995 425 402 19 4 0 95 4 1 0 FR France 9195 5805 2714 1484 1253 354 47 26 22 6 FR01 Nappe d´Alsace 9195 117 34 50 29 4 29 43 25 3 FR02 Calcaires de Champigny 9195 7 4 2 1 0 57 29 14 0 FR03 Craie du Nord et de la
Picardie 9195 793 76 306 373 38 10 39 47 5
36
Table 22 continued Frequency Distribution absolute Frequency Distribution in %
code name year area km²
sampling sites
£10 mg/l >10 - £25 mg/l
>25 - £50 mg/l
>50 mg/l no info but £ 50
£10 mg/l >10 - £25 mg/l
>25 - £50 mg/l
>50 mg/l no info but £ 50
FR04 Jurassique de Poitou-Charentes
9195 24 1 1 6 16 4 4 25 67
DE Germany 1995 4092 60 14 15 11 DE01 Baden-Württemberg 1992 71 30 30 29 11 DE02 Bayern 280 50 23 21 6 DE03 Berlin 1991 323 91 4 3 2 DE04 Brandenburg 1993 82 72 3 18 7 DE05 Bremen 8693 149 80 8 3 9 DE06 Hamburg 9193 107 no
detailed 73 7 13 7
DE07 Hessen 1993 297 67 18 8 7 DE08 Mecklenburg-
Vorpommern 1993 36 informati
on 86 5 2 7
DE09 Niedersachsen 1993 47400 214 66 6 6 22 DE10 Nordrhein-Westfalen 1991 1457 41 21 22 16 DE11 Rheinland-Pfalz 9193 641 67 11 9 13 DE12 Saarland 1993 2580 110 41 33 23 3 DE13 Sachsen 1993 86 31 23 30 16 DE14 Sachsen-Anhalt 9093 114 68 2 15 15 DE15 Schleswig-Holstein 1993 47 66 12 10 12 DE16 Thüringen 1992 16000 78 41 22 22 15 GR Greece GR01 W-Peloponessus 1996 7304 20 8 5 4 3 40 25 20 15 GR02 N-Peloponessus 1996 7314 27 13 5 7 2 48 19 26 7 GR03 E-Peloponessus 1996 8464 26 8 5 7 6 31 19 27 23 GR04 W-Mainland 1996 10417 25 17 7 0 1 68 28 0 4 GR05 Epirus 1996 9967 17 11 2 3 1 65 12 18 6 GR06 Attica 1996 3201 13 4 2 4 3 31 15 31 23 GR07 E-Mainland 1996 12223 21 5 10 5 1 24 48 24 5 GR08 Thessaly 1996 13162 25 10 13 2 0 40 52 8 0 GR09 W-Macedonia 1996 13696 25 14 8 2 1 56 32 8 4 GR10 Central-Macedonia 1996 10389 35 18 10 6 1 51 29 17 3 GR11 E-Macedonia 1996 7213 23 8 11 3 1 35 48 13 4 GR12 Thrace 1996 11241 38 19 14 5 0 50 37 13 0 GR13 Crete 1996 8312 21 10 3 8 0 48 14 38 0
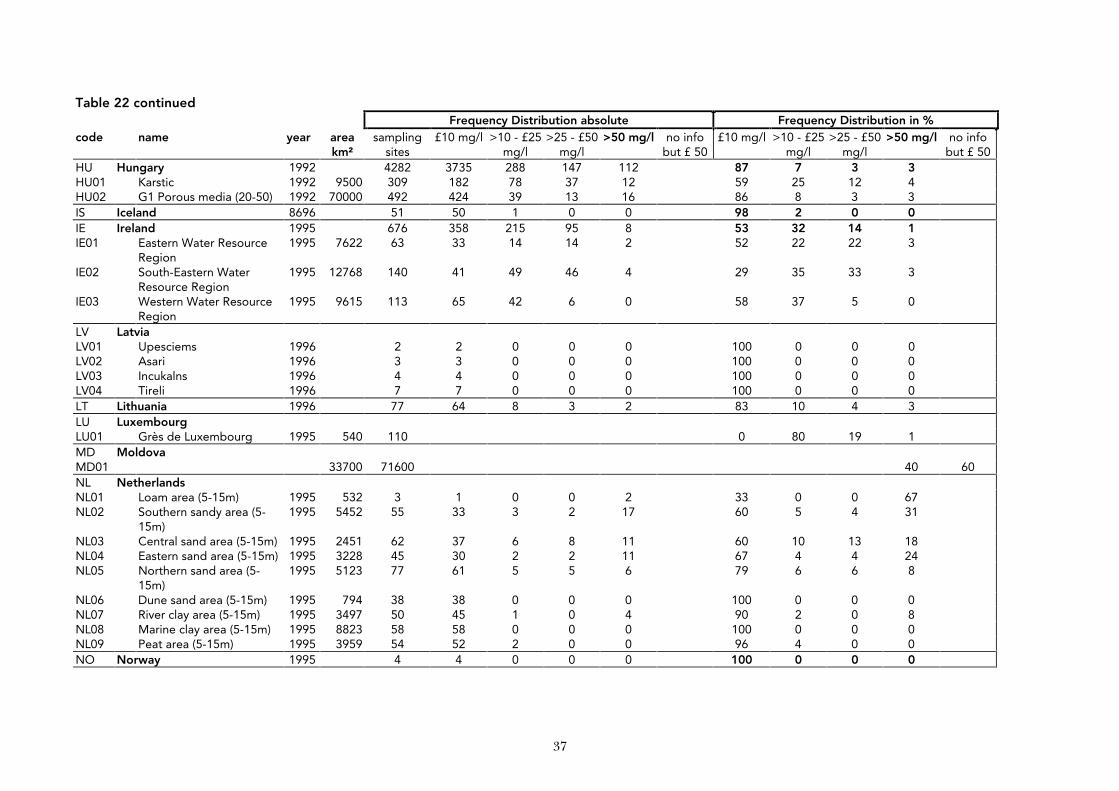
37
Table 22 continued Frequency Distribution absolute Frequency Distribution in %
code name year area km²
sampling sites
£10 mg/l >10 - £25 mg/l
>25 - £50 mg/l
>50 mg/l no info but £ 50
£10 mg/l >10 - £25 mg/l
>25 - £50 mg/l
>50 mg/l no info but £ 50
HU Hungary 1992 4282 3735 288 147 112 87 7 3 3 HU01 Karstic 1992 9500 309 182 78 37 12 59 25 12 4 HU02 G1 Porous media (20-50) 1992 70000 492 424 39 13 16 86 8 3 3 IS Iceland 8696 51 50 1 0 0 98 2 0 0 IE Ireland 1995 676 358 215 95 8 53 32 14 1 IE01 Eastern Water Resource
Region 1995 7622 63 33 14 14 2 52 22 22 3
IE02 South-Eastern Water Resource Region
1995 12768 140 41 49 46 4 29 35 33 3
IE03 Western Water Resource Region
1995 9615 113 65 42 6 0 58 37 5 0
LV Latvia LV01 Upesciems 1996 2 2 0 0 0 100 0 0 0 LV02 Asari 1996 3 3 0 0 0 100 0 0 0 LV03 Incukalns 1996 4 4 0 0 0 100 0 0 0 LV04 Tireli 1996 7 7 0 0 0 100 0 0 0 LT Lithuania 1996 77 64 8 3 2 83 10 4 3 LU Luxembourg LU01 Grès de Luxembourg 1995 540 110 0 80 19 1 MD Moldova MD01 33700 71600 40 60 NL Netherlands NL01 Loam area (5-15m) 1995 532 3 1 0 0 2 33 0 0 67 NL02 Southern sandy area (5-
15m) 1995 5452 55 33 3 2 17 60 5 4 31
NL03 Central sand area (5-15m) 1995 2451 62 37 6 8 11 60 10 13 18 NL04 Eastern sand area (5-15m) 1995 3228 45 30 2 2 11 67 4 4 24 NL05 Northern sand area (5-
15m) 1995 5123 77 61 5 5 6 79 6 6 8
NL06 Dune sand area (5-15m) 1995 794 38 38 0 0 0 100 0 0 0 NL07 River clay area (5-15m) 1995 3497 50 45 1 0 4 90 2 0 8 NL08 Marine clay area (5-15m) 1995 8823 58 58 0 0 0 100 0 0 0 NL09 Peat area (5-15m) 1995 3959 54 52 2 0 0 96 4 0 0 NO Norway 1995 4 4 0 0 0 100 0 0 0
38
Table 22 continued Frequency Distribution absolute Frequency Distribution in %
code name year area km²
sampling sites
£10 mg/l >10 - £25 mg/l
>25 - £50 mg/l
>50 mg/l no info but £ 50
£10 mg/l >10 - £25 mg/l
>25 - £50 mg/l
>50 mg/l no info but £ 50
PL Poland 1996 675 437 75 63 100 65 11 9 15 PL01 Czestochowa Basin 1996 4105 16 7 2 6 1 44 13 38 6 PL02 Radom Trough and Lublin
Trough 1996 18670 31 16 6 5 4 52 19 16 13
PL03 Warsaw Subtrough 1996 51000 46 30 3 5 8 65 7 11 17 PT Portugal PT01 Meridional mesocenozoic
border 1996 2000 74 22 22 12 18 30 30 16 24
RO Romania 1993 1000 35 65 SK Slovak Republic 1995 282 121 62 56 43 43 22 20 15 SK01 Rye Island 1995 680 59 37 7 6 9 63 12 10 15 SK02 Alluvia of Ondava from
Svidník to Domaša 1995 65 4 4 0 0 0 100 0 0 0
SK03 Alluvia of Ondava from Domaša to Trebišov
1995 130 9 5 1 2 1 56 11 22 11
SK04 Medzibodro ie and alluvia of Roòava
1995 240 8 6 1 0 1 75 13 0 13
SI Slovenia 1996 84 8 33 17 26 10 39 20 31 SI01 VS 1996 59 4 0 1 2 1 0 25 50 25 SI02 KB/LB/LP/SP/KP/VP 1996 533.7 31 3 20 6 2 10 65 19 6 SI03 SD/DM/DB 1996 107.2 11 1 2 1 7 9 18 9 64 SI04 BKC 1996 245.2 13 1 8 2 2 8 62 15 15 SI05 DP 1996 434.3 15 1 1 3 10 7 7 20 67 SI06 AMP 1996 654.7 10 2 1 3 4 20 10 30 40 ES Spain ES01 Region de los Arenales 1995 6000 30 12 4 10 4 40 13 33 13 ES02 Plana de Valencia Norte 1995 260 11 1 2 3 5 9 18 27 45 ES03 Madrid - Talavera 1995 6300 57 11 22 18 6 19 39 32 10 SE Sweden 125 115 5 3 2 92 4 2 2 TR Turkey TR02 Erzurum 1996 740 18 6 4 2 6 33 22 11 33 TR03 Elazig - Uluova 1995 770 12 2 10 0 0 17 83 0 0
39
Table 22 continued Frequency Distribution absolute Frequency Distribution in %
code name year area km²
sampling sites
£10 mg/l >10 - £25 mg/l
>25 - £50 mg/l
>50 mg/l no info but £ 50
£10 mg/l >10 - £25 mg/l
>25 - £50 mg/l
>50 mg/l no info but £ 50
UK United Kingdom UK02 Principal Jurassic
Limestones Aquifers 1996 6518 215 141 42 15 17 65 20 7 8
UK03 Chalk and upper greensand chem
1996 24540 437 204 120 103 10 47 27 24 2
UK04 Permo triassic sandstones chem
1996 12650 106 32 28 35 11 30 26 33 10
UK05 North Ireland Permo triassic sandstones chem
1994 789 7 4 1 2 0 57 14 29 0
40
Table 23 Nitrate - quality data at the regional level Type of Sampling Sites Frequency distribution
sampl.sites
AT Austria 1719
AT01 Marchfeld 77
AT02 Suedliches Wiener Becken 100
AT03 Mattigtal 19
BG BulgariaBG01 Trakia 71
BG02 Sofia District 25
BG03 North-East Bulgaria 19
CY CyprusCY01 Nicosia District 239
CY02 Limassol District 232
CY03 Larnaca District 78
CY04 Paphos District 182
CY05 Famagusta District 26
CZ Czech Republic 476
CZ01 Northern Bohemia Cretaceous Basin 84
CZ02 Trebon Basin 31
CZ03 Fluvial sediments of the Moravia river 11
DK Denmark 1113
DK01 Nitratbæltet, Kastbjerg 22
DK02 Vestdanmark, Grindsted 21
DK03 Østdanmark, Skuldelev 18
EE Estonia 163
EE01 Pandivere upland 29
EE02 North-East Estonia 34
EE03 Island Saaremaa 13
FI Finland 425
FR France 5805
FR01 Nappe d´Alsace 117
FR02 Calcaires de Champigny no information 7
FR03 Craie du Nord et de la Picardie 793
FR04 Jurassique de Poitou-Charentes 24
DE Germany 4092
DE01 Baden-Württemberg no information 71
DE02 Bayern 280
DE03 Berlin 323
DE04 Brandenburg 82
DE05 Bremen 149
DE06 Hamburg 107
DE07 Hessen 297
DE08 Mecklenburg-Vorpommern 36
DE09 Niedersachsen 214
DE10 Nordrhein-Westfalen 1457
DE11 Rheinland-Pfalz 641
DE12 Saarland 110
DE13 Sachsen no information 86
DE14 Sachsen-Anhalt 114
DE15 Schleswig-Holstein 47
DE16 Thüringen 78
GR GreeceGR01 W-Peloponessus 31
GR02 N-Peloponessus 43
GR03 E-Peloponessus 25
GR04 W-Mainland 27
GR05 Epirus 17
GR06 Attica 15
GR07 E-Mainland 24
GR08 Thessaly 28
GR09 W-Macedonia 31
GR10 Central-Macedonia 40
GR11 E-Macedonia 23
GR12 Thrace 32
GR13 Crete 24
HU Hungary 4282
HU01 Karstic 309
HU02 G1 Porous media (20-50) 492
IS Iceland 51
0% 25% 50% 75% 100%
AT
AT01
AT02
AT03
BG01
BG02
BG03
CY01
CY02
CY03
CY04
CY05
CZ
CZ01
CZ02
CZ03
DK
DK01
DK02
DK03
EE
EE01
EE02
EE03
FI
FR
FR01
FR02
FR03
FR04
DE
DE01
DE02
DE03
DE04
DE05
DE06
DE07
DE08
DE09
DE10
DE11
DE12
DE13
DE14
DE15
DE16
GR01
GR02
GR03
GR04
GR05
GR06
GR07
GR08
GR09
GR10
GR11
GR12
GR13
HU
HU01
HU02
IS
drinking water wells industrial water wellsmonitoring wells other wells
0% 25% 50% 75% 100%
AT
AT01
AT02
AT03
BG01
BG02
BG03
CY01
CY02
CY03
CY04
CY05
CZ
CZ01
CZ02
CZ03
DK
DK01
DK02
DK03
EE
EE01
EE02
EE03
FI
FR
FR01
FR02
FR03
FR04
DE
DE01
DE02
DE03
DE04
DE05
DE06
DE07
DE08
DE09
DE10
DE11
DE12
DE13
DE14
DE15
DE16
GR01
GR02
GR03
GR04
GR05
GR06
GR07
GR08
GR09
GR10
GR11
GR12
GR13
HU
HU01
HU02
IS
>50 mg/l >25 - <=50 mg/l>10 - <=25 mg/l <=10 mg/l
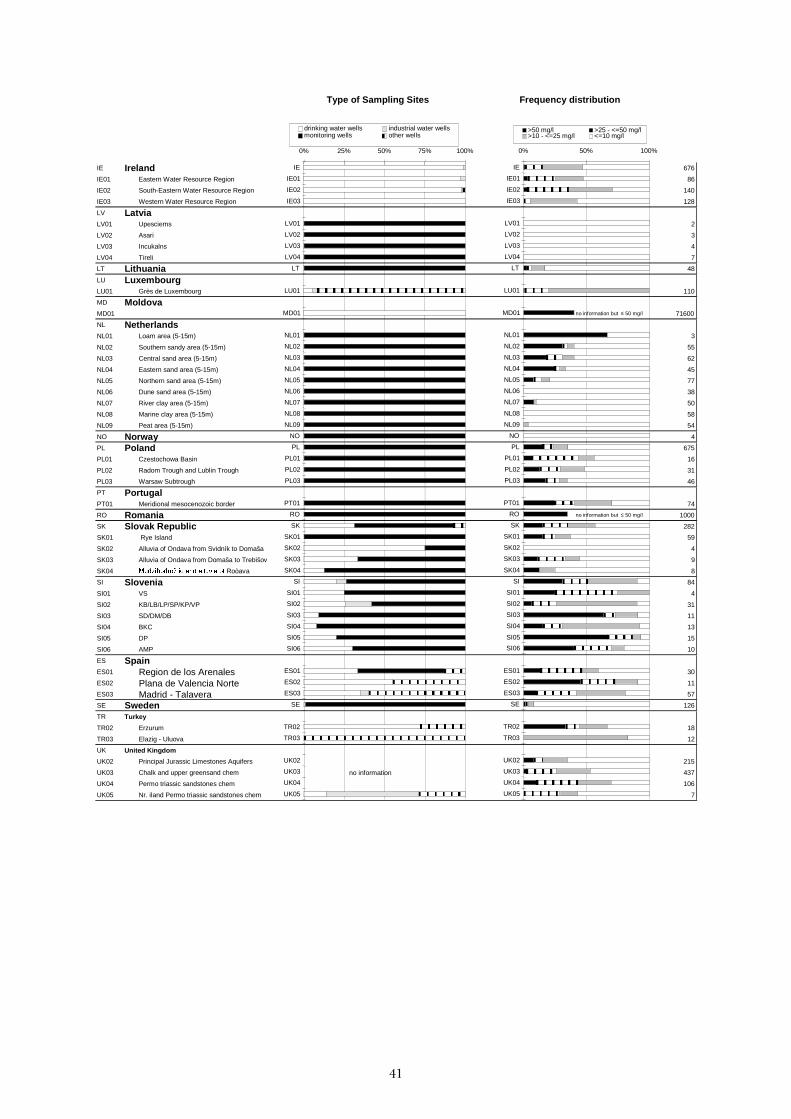
41
Type of Sampling Sites Frequency distribution
IE Ireland 676
IE01 Eastern Water Resource Region 86
IE02 South-Eastern Water Resource Region 140
IE03 Western Water Resource Region 128
LV LatviaLV01 Upesciems 2
LV02 Asari 3
LV03 Incukalns 4
LV04 Tireli 7
LT Lithuania 48
LU LuxembourgLU01 Grès de Luxembourg 110
MD MoldovaMD01 no information but ≤ 50 mg/l 71600
NL NetherlandsNL01 Loam area (5-15m) 3
NL02 Southern sandy area (5-15m) 55
NL03 Central sand area (5-15m) 62
NL04 Eastern sand area (5-15m) 45
NL05 Northern sand area (5-15m) 77
NL06 Dune sand area (5-15m) 38
NL07 River clay area (5-15m) 50
NL08 Marine clay area (5-15m) 58
NL09 Peat area (5-15m) 54
NO Norway 4
PL Poland 675
PL01 Czestochowa Basin 16
PL02 Radom Trough and Lublin Trough 31
PL03 Warsaw Subtrough 46
PT PortugalPT01 Meridional mesocenozoic border 74
RO Romania no information but ≤ 50 mg/l 1000
SK Slovak Republic 282
SK01 Rye Island 59
SK02 Alluvia of Ondava from Svidník to Domaša 4
SK03 Alluvia of Ondava from Domaša to Trebišov 9
SK04 0HG]LERGURå LH�DQG�DOOXYLD�RI�Roòava 8
SI Slovenia 84
SI01 VS 4
SI02 KB/LB/LP/SP/KP/VP 31
SI03 SD/DM/DB 11
SI04 BKC 13
SI05 DP 15
SI06 AMP 10
ES SpainES01 Region de los Arenales 30
ES02 Plana de Valencia Norte 11
ES03 Madrid - Talavera 57
SE Sweden 126
TR Turkey
TR02 Erzurum 18
TR03 Elazig - Uluova 12
UK United Kingdom
UK02 Principal Jurassic Limestones Aquifers 215
UK03 Chalk and upper greensand chem no information 437
UK04 Permo triassic sandstones chem 106
UK05 Nr. iland Permo triassic sandstones chem 7
0% 25% 50% 75% 100%
IE
IE01
IE02
IE03
LV01
LV02
LV03
LV04
LT
LU01
MD01
NL01
NL02
NL03
NL04
NL05
NL06
NL07
NL08
NL09
NO
PL
PL01
PL02
PL03
PT01
RO
SK
SK01
SK02
SK03
SK04
SI
SI01
SI02
SI03
SI04
SI05
SI06
ES01
ES02
ES03
SE
TR02
TR03
UK02
UK03
UK04
UK05
drinking water wells industrial water wellsmonitoring wells other wells
0% 50% 100%
IE
IE01
IE02
IE03
LV01
LV02
LV03
LV04
LT
LU01
MD01
NL01
NL02
NL03
NL04
NL05
NL06
NL07
NL08
NL09
NO
PL
PL01
PL02
PL03
PT01
RO
SK
SK01
SK02
SK03
SK04
SI
SI01
SI02
SI03
SI04
SI05
SI06
ES01
ES02
ES03
SE
TR02
TR03
UK02
UK03
UK04
UK05
>50 mg/l >25 - <=50 mg/l>10 - <=25 mg/l <=10 mg/l
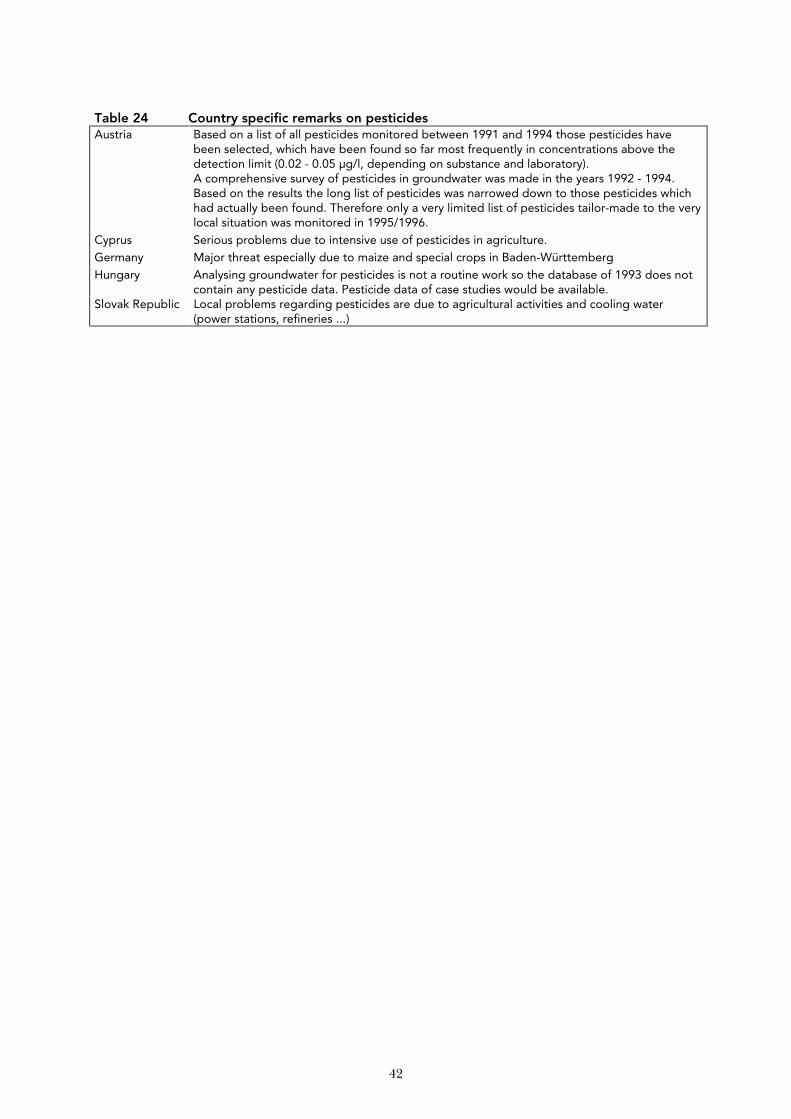
42
Table 24 Country specific remarks on pesticides Austria Based on a list of all pesticides monitored between 1991 and 1994 those pesticides have
been selected, which have been found so far most frequently in concentrations above the detection limit (0.02 - 0.05 µg/l, depending on substance and laboratory). A comprehensive survey of pesticides in groundwater was made in the years 1992 - 1994. Based on the results the long list of pesticides was narrowed down to those pesticides which had actually been found. Therefore only a very limited list of pesticides tailor-made to the very local situation was monitored in 1995/1996.
Cyprus Serious problems due to intensive use of pesticides in agriculture. Germany Major threat especially due to maize and special crops in Baden-Württemberg Hungary Analysing groundwater for pesticides is not a routine work so the database of 1993 does not
contain any pesticide data. Pesticide data of case studies would be available. Slovak Republic Local problems regarding pesticides are due to agricultural activities and cooling water
(power stations, refineries ...)
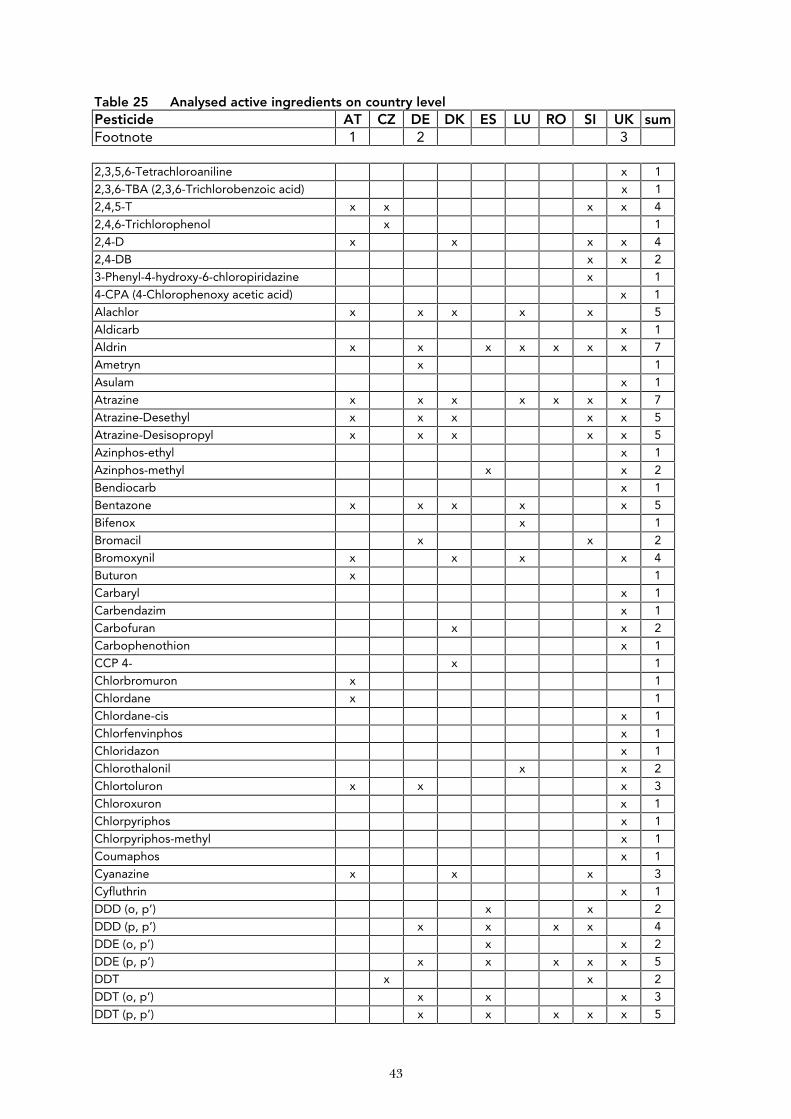
43
Table 25 Analysed active ingredients on country level Pesticide AT CZ DE DK ES LU RO SI UK sum Footnote 1 2 3
2,3,5,6-Tetrachloroaniline x 1
2,3,6-TBA (2,3,6-Trichlorobenzoic acid) x 1
2,4,5-T x x x x 4
2,4,6-Trichlorophenol x 1
2,4-D x x x x 4
2,4-DB x x 2
3-Phenyl-4-hydroxy-6-chloropiridazine x 1
4-CPA (4-Chlorophenoxy acetic acid) x 1
Alachlor x x x x x 5
Aldicarb x 1
Aldrin x x x x x x x 7
Ametryn x 1
Asulam x 1
Atrazine x x x x x x x 7
Atrazine-Desethyl x x x x x 5
Atrazine-Desisopropyl x x x x x 5
Azinphos-ethyl x 1
Azinphos-methyl x x 2
Bendiocarb x 1
Bentazone x x x x x 5
Bifenox x 1
Bromacil x x 2
Bromoxynil x x x x 4
Buturon x 1
Carbaryl x 1
Carbendazim x 1
Carbofuran x x 2
Carbophenothion x 1
CCP 4- x 1
Chlorbromuron x 1
Chlordane x 1
Chlordane-cis x 1
Chlorfenvinphos x 1
Chloridazon x 1
Chlorothalonil x x 2
Chlortoluron x x x 3
Chloroxuron x 1
Chlorpyriphos x 1
Chlorpyriphos-methyl x 1
Coumaphos x 1
Cyanazine x x x 3
Cyfluthrin x 1
DDD (o, p’) x x 2
DDD (p, p’) x x x x 4
DDE (o, p’) x x 2
DDE (p, p’) x x x x x 5
DDT x x 2
DDT (o, p’) x x x 3
DDT (p, p’) x x x x x 5
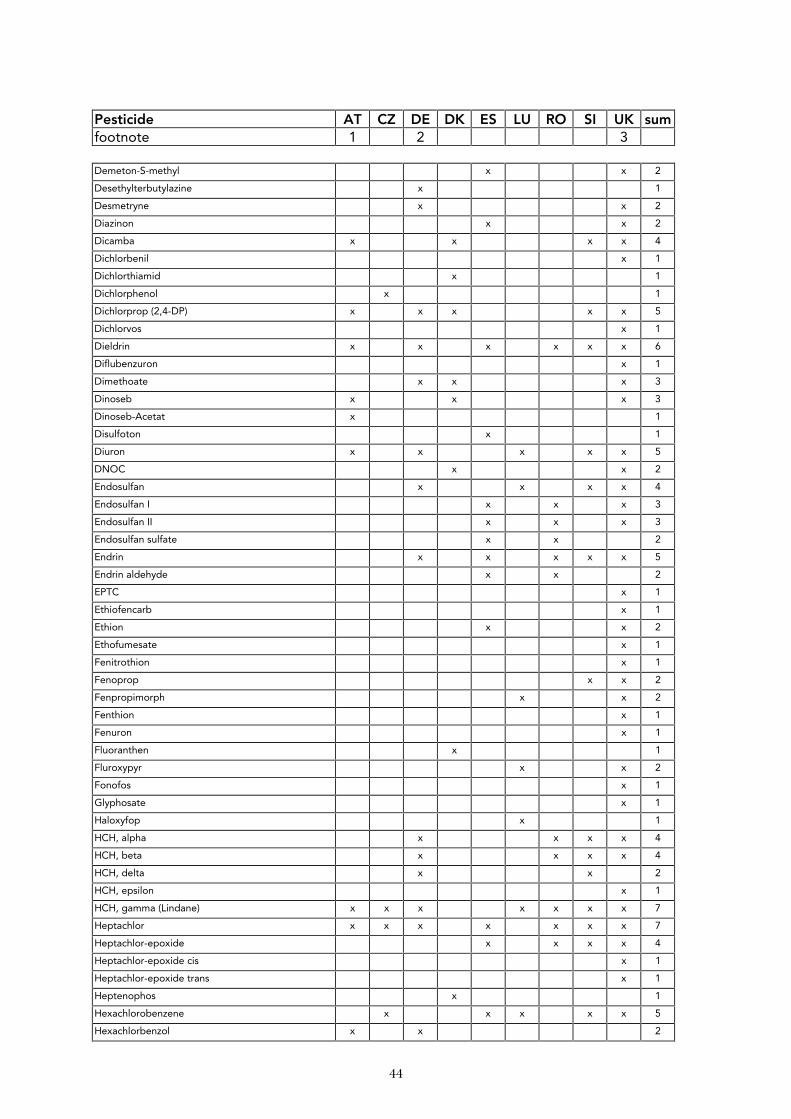
44
Pesticide AT CZ DE DK ES LU RO SI UK sum footnote 1 2 3
Demeton-S-methyl x x 2
Desethylterbutylazine x 1
Desmetryne x x 2
Diazinon x x 2
Dicamba x x x x 4
Dichlorbenil x 1
Dichlorthiamid x 1
Dichlorphenol x 1
Dichlorprop (2,4-DP) x x x x x 5
Dichlorvos x 1
Dieldrin x x x x x x 6
Diflubenzuron x 1
Dimethoate x x x 3
Dinoseb x x x 3
Dinoseb-Acetat x 1
Disulfoton x 1
Diuron x x x x x 5
DNOC x x 2
Endosulfan x x x x 4
Endosulfan I x x x 3
Endosulfan II x x x 3
Endosulfan sulfate x x 2
Endrin x x x x x 5
Endrin aldehyde x x 2
EPTC x 1
Ethiofencarb x 1
Ethion x x 2
Ethofumesate x 1
Fenitrothion x 1
Fenoprop x x 2
Fenpropimorph x x 2
Fenthion x 1
Fenuron x 1
Fluoranthen x 1
Fluroxypyr x x 2
Fonofos x 1
Glyphosate x 1
Haloxyfop x 1
HCH, alpha x x x x 4
HCH, beta x x x x 4
HCH, delta x x 2
HCH, epsilon x 1
HCH, gamma (Lindane) x x x x x x x 7
Heptachlor x x x x x x x 7
Heptachlor-epoxide x x x x 4
Heptachlor-epoxide cis x 1
Heptachlor-epoxide trans x 1
Heptenophos x 1
Hexachlorobenzene x x x x x 5
Hexachlorbenzol x x 2

45
Pesticide AT CZ DE DK ES LU RO SI UK sum footnote 1 2 3
Hexachlorbutadiene x 1
Hexazinon x x 2
Hydroxyatrazine x 1
Indeno(1,2,3-cd)pyrene x 1
Ioxynil x x x 3
Isodrin x 1
Isoproturon x x x x x 5
Linuron x x x x 4
Malathion x x 2
MCPA x x x x x 5
MCPB x x x 3
Mecoprop (MCPP) x x x x x 5
Metalaxyl x x x 3
Metamitron x x 2
Metazachlor x x x x x 5
Methabenzthiazuron x x x 3
Methiocarb x 1
Methomyl x 1
Methoxychlor x x 2
Metobromuron x x x 3
Metolachlor x x x x 4
Metoxuron x x 2
Metribuzin x x x 3
Mevinphos x 1
Monolinuron x x x 3
Monuron x 1
Napropamide x 1
Neburon x x 2
Orbencarb x 1
Oxadixyl x 1
Oxamyl x 1
Parathion x x x x 4
Parathion-methyl x x x x 4
PCSD (Eulan) x 1
Pendimethalin x x x x 4
Pentachlorophenol x x 2
Permethrin cis x 1
Permethrin trans x 1
Phenmedipham x 1
Phorate x 1
Pirimicarb x x 2
Pirimicarb-methyl x 1
Prometryne x x x x 4
Propazine x x x x x 5
Propetamphos x 1
Propiconazole x 1
Propoxur x 1
Propyzamide x x 2
Pyridate x 1
Pyridate-M x 1
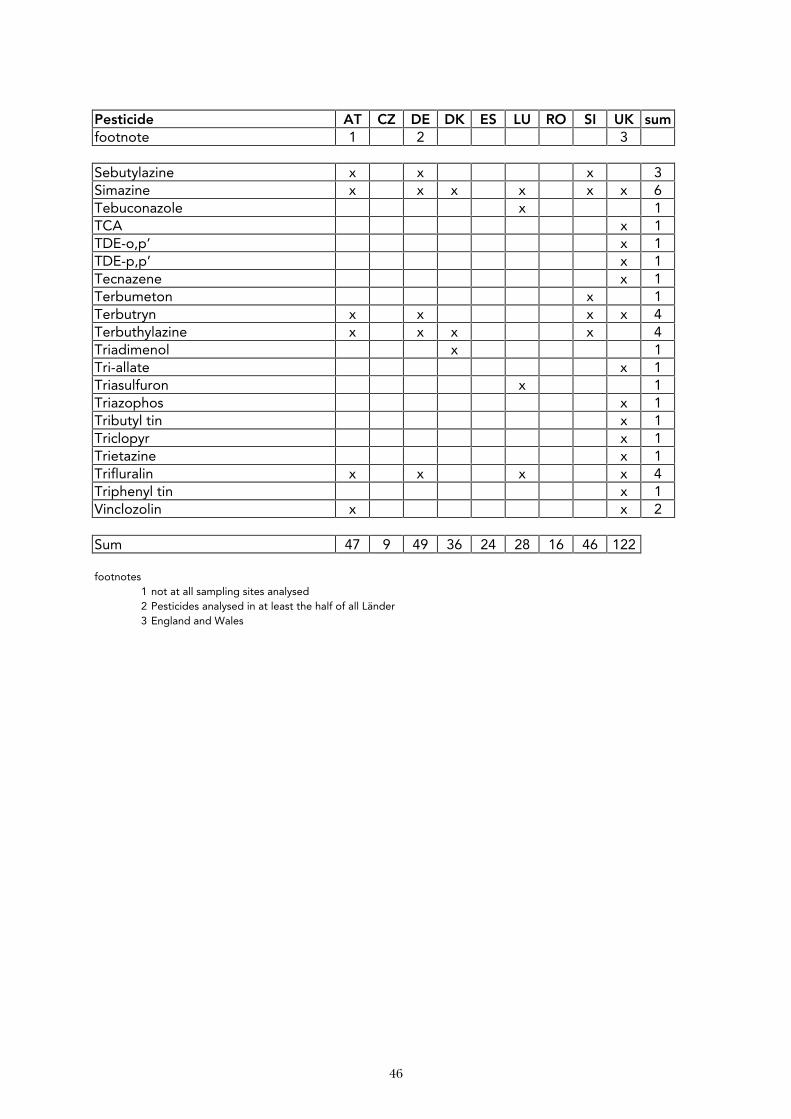
46
Pesticide AT CZ DE DK ES LU RO SI UK sum footnote 1 2 3
Sebutylazine x x x 3 Simazine x x x x x x 6 Tebuconazole x 1 TCA x 1 TDE-o,p’ x 1 TDE-p,p’ x 1 Tecnazene x 1 Terbumeton x 1 Terbutryn x x x x 4 Terbuthylazine x x x x 4 Triadimenol x 1 Tri-allate x 1 Triasulfuron x 1 Triazophos x 1 Tributyl tin x 1 Triclopyr x 1 Trietazine x 1 Trifluralin x x x x 4 Triphenyl tin x 1 Vinclozolin x x 2
Sum 47 9 49 36 24 28 16 46 122 footnotes
1 not at all sampling sites analysed 2 Pesticides analysed in at least the half of all Länder 3 England and Wales
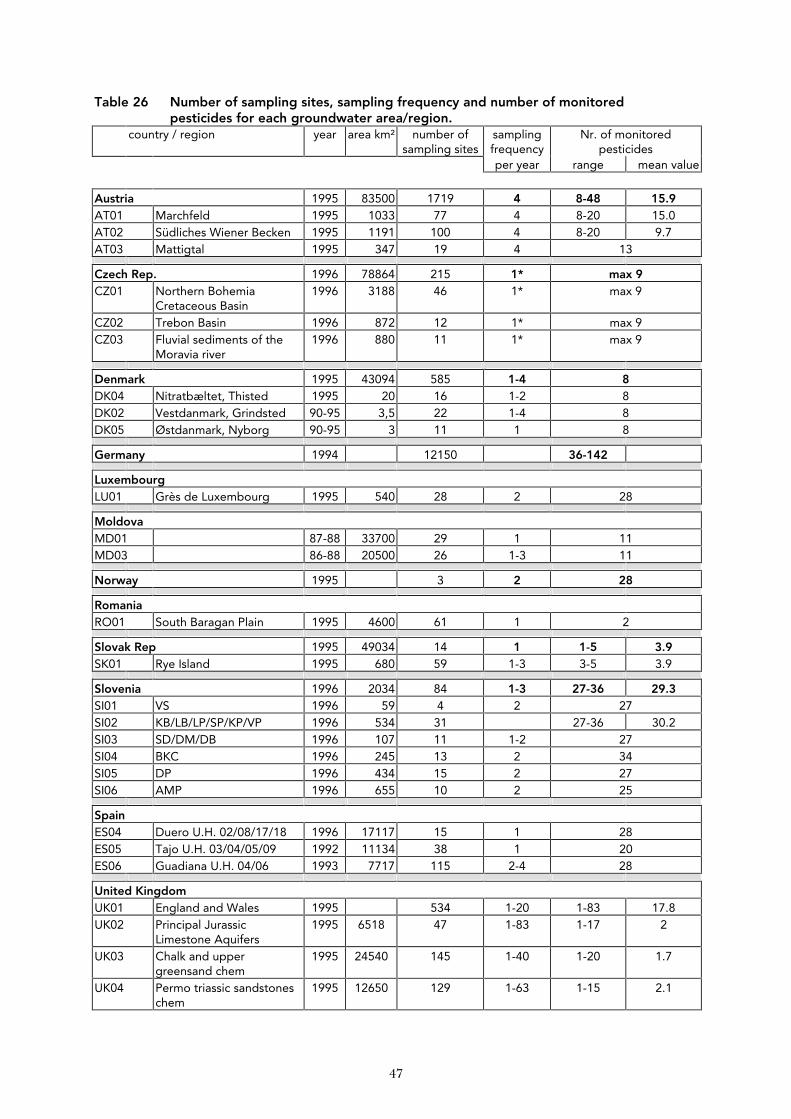
47
Table 26 Number of sampling sites, sampling frequency and number of monitored pesticides for each groundwater area/region. country / region year area km² number of
sampling sites sampling frequency
Nr. of monitored pesticides
per year range mean value Austria 1995 83500 1719 4 8-48 15.9 AT01 Marchfeld 1995 1033 77 4 8-20 15.0 AT02 Südliches Wiener Becken 1995 1191 100 4 8-20 9.7 AT03 Mattigtal 1995 347 19 4 13
Czech Rep. 1996 78864 215 1* max 9 CZ01 Northern Bohemia
Cretaceous Basin 1996 3188 46 1* max 9
CZ02 Trebon Basin 1996 872 12 1* max 9 CZ03 Fluvial sediments of the
Moravia river 1996 880 11 1* max 9
Denmark 1995 43094 585 1-4 8 DK04 Nitratbæltet, Thisted 1995 20 16 1-2 8 DK02 Vestdanmark, Grindsted 90-95 3,5 22 1-4 8 DK05 Østdanmark, Nyborg 90-95 3 11 1 8
Germany 1994 12150 36-142
Luxembourg LU01 Grès de Luxembourg 1995 540 28 2 28
Moldova MD01 87-88 33700 29 1 11 MD03 86-88 20500 26 1-3 11
Norway 1995 3 2 28
Romania RO01 South Baragan Plain 1995 4600 61 1 2
Slovak Rep 1995 49034 14 1 1-5 3.9 SK01 Rye Island 1995 680 59 1-3 3-5 3.9
Slovenia 1996 2034 84 1-3 27-36 29.3 SI01 VS 1996 59 4 2 27 SI02 KB/LB/LP/SP/KP/VP 1996 534 31 27-36 30.2 SI03 SD/DM/DB 1996 107 11 1-2 27 SI04 BKC 1996 245 13 2 34 SI05 DP 1996 434 15 2 27 SI06 AMP 1996 655 10 2 25
Spain ES04 Duero U.H. 02/08/17/18 1996 17117 15 1 28 ES05 Tajo U.H. 03/04/05/09 1992 11134 38 1 20 ES06 Guadiana U.H. 04/06 1993 7717 115 2-4 28
United Kingdom UK01 England and Wales 1995 534 1-20 1-83 17.8 UK02 Principal Jurassic
Limestone Aquifers 1995 6518 47 1-83 1-17 2
UK03 Chalk and upper greensand chem
1995 24540 145 1-40 1-20 1.7
UK04 Permo triassic sandstones chem
1995 12650 129 1-63 1-15 2.1
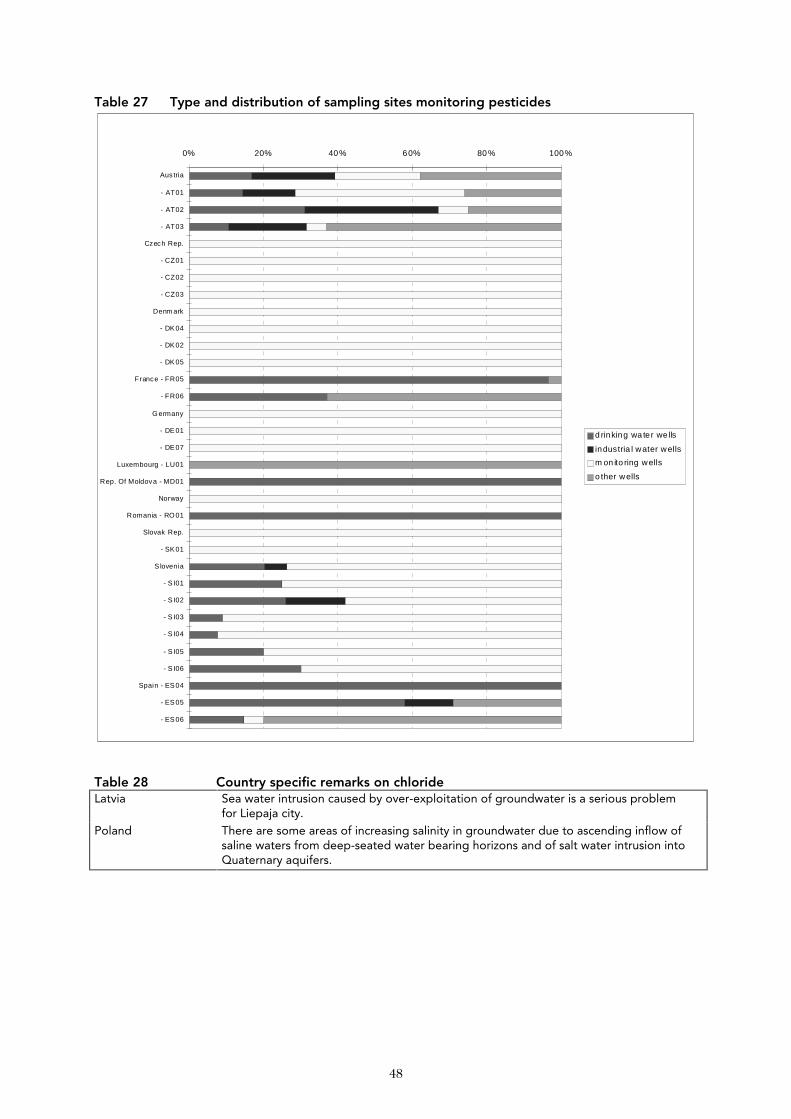
48
Table 27 Type and distribution of sampling sites monitoring pesticides
0% 20% 40% 60% 80 % 100%
Austria
- AT01
- AT02
- AT03
Czech Rep.
- CZ01
- CZ02
- CZ03
Denm ark
- DK04
- DK02
- DK05
France - FR05
- FR06
G ermany
- DE01
- DE07
Luxembourg - LU01
Rep. Of Moldova - MD01
Norway
Romania - RO 01
Slovak Rep.
- SK01
S lovenia
- S I01
- S I02
- S I03
- S I04
- S I05
- S I06
Spain - ES04
- ES05
- ES06
d rinking wa te r we lls
industria l water wells
m on ito ring wells
o ther wells
Table 28 Country specific remarks on chloride Latvia Sea water intrusion caused by over-exploitation of groundwater is a serious problem
for Liepaja city. Poland There are some areas of increasing salinity in groundwater due to ascending inflow of
saline waters from deep-seated water bearing horizons and of salt water intrusion into Quaternary aquifers.
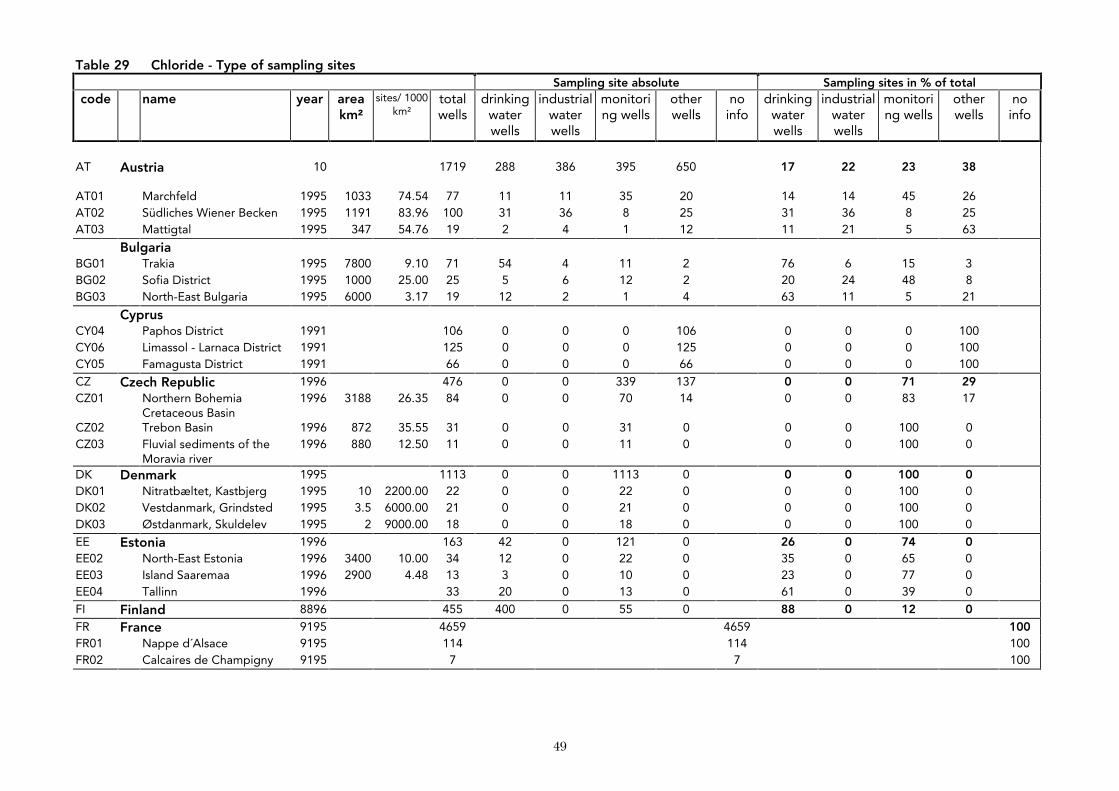
49
Table 29 Chloride - Type of sampling sites Sampling site absolute Sampling sites in % of total code name year area
km² sites/ 1000
km² total wells
drinking water wells
industrial water wells
monitoring wells
other wells
no info
drinking water wells
industrial water wells
monitoring wells
other wells
no info
AT Austria 10
1719 288 386 395 650 17 22 23 38
AT01 Marchfeld 1995 1033 74.54 77 11 11 35 20 14 14 45 26 AT02 Südliches Wiener Becken 1995 1191 83.96 100 31 36 8 25 31 36 8 25 AT03 Mattigtal 1995 347 54.76 19 2 4 1 12 11 21 5 63
Bulgaria BG01 Trakia 1995 7800 9.10 71 54 4 11 2 76 6 15 3 BG02 Sofia District 1995 1000 25.00 25 5 6 12 2 20 24 48 8 BG03 North-East Bulgaria 1995 6000 3.17 19 12 2 1 4 63 11 5 21
Cyprus CY04 Paphos District 1991 106 0 0 0 106 0 0 0 100 CY06 Limassol - Larnaca District 1991 125 0 0 0 125 0 0 0 100 CY05 Famagusta District 1991 66 0 0 0 66 0 0 0 100
CZ Czech Republic 1996 476 0 0 339 137 0 0 71 29 CZ01 Northern Bohemia
Cretaceous Basin 1996 3188 26.35 84 0 0 70 14 0 0 83 17
CZ02 Trebon Basin 1996 872 35.55 31 0 0 31 0 0 0 100 0 CZ03 Fluvial sediments of the
Moravia river 1996 880 12.50 11 0 0 11 0 0 0 100 0
DK Denmark 1995 1113 0 0 1113 0 0 0 100 0 DK01 Nitratbæltet, Kastbjerg 1995 10 2200.00 22 0 0 22 0 0 0 100 0 DK02 Vestdanmark, Grindsted 1995 3.5 6000.00 21 0 0 21 0 0 0 100 0 DK03 Østdanmark, Skuldelev 1995 2 9000.00 18 0 0 18 0 0 0 100 0
EE Estonia 1996 163 42 0 121 0 26 0 74 0 EE02 North-East Estonia 1996 3400 10.00 34 12 0 22 0 35 0 65 0 EE03 Island Saaremaa 1996 2900 4.48 13 3 0 10 0 23 0 77 0 EE04 Tallinn 1996 33 20 0 13 0 61 0 39 0
FI Finland 8896 455 400 0 55 0 88 0 12 0
FR France 9195 4659 4659 100 FR01 Nappe d´Alsace 9195 114 114 100 FR02 Calcaires de Champigny 9195 7 7 100
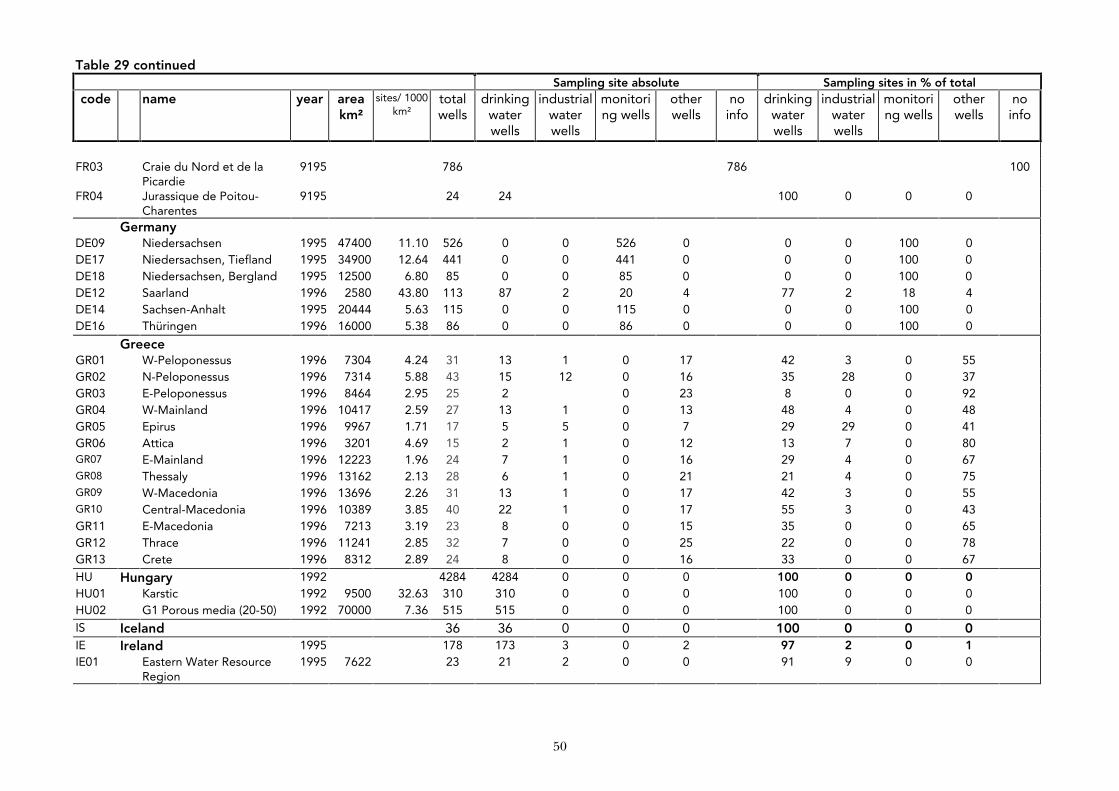
50
Table 29 continued Sampling site absolute Sampling sites in % of total code name year area
km² sites/ 1000
km² total wells
drinking water wells
industrial water wells
monitoring wells
other wells
no info
drinking water wells
industrial water wells
monitoring wells
other wells
no info
FR03 Craie du Nord et de la
Picardie 9195 786 786 100
FR04 Jurassique de Poitou-Charentes
9195 24 24 100 0 0 0
Germany DE09 Niedersachsen 1995 47400 11.10 526 0 0 526 0 0 0 100 0 DE17 Niedersachsen, Tiefland 1995 34900 12.64 441 0 0 441 0 0 0 100 0 DE18 Niedersachsen, Bergland 1995 12500 6.80 85 0 0 85 0 0 0 100 0 DE12 Saarland 1996 2580 43.80 113 87 2 20 4 77 2 18 4 DE14 Sachsen-Anhalt 1995 20444 5.63 115 0 0 115 0 0 0 100 0 DE16 Thüringen 1996 16000 5.38 86 0 0 86 0 0 0 100 0
Greece GR01 W-Peloponessus 1996 7304 4.24 31 13 1 0 17 42 3 0 55 GR02 N-Peloponessus 1996 7314 5.88 43 15 12 0 16 35 28 0 37 GR03 E-Peloponessus 1996 8464 2.95 25 2 0 23 8 0 0 92 GR04 W-Mainland 1996 10417 2.59 27 13 1 0 13 48 4 0 48 GR05 Epirus 1996 9967 1.71 17 5 5 0 7 29 29 0 41 GR06 Attica 1996 3201 4.69 15 2 1 0 12 13 7 0 80 GR07 E-Mainland 1996 12223 1.96 24 7 1 0 16 29 4 0 67 GR08 Thessaly 1996 13162 2.13 28 6 1 0 21 21 4 0 75 GR09 W-Macedonia 1996 13696 2.26 31 13 1 0 17 42 3 0 55 GR10 Central-Macedonia 1996 10389 3.85 40 22 1 0 17 55 3 0 43 GR11 E-Macedonia 1996 7213 3.19 23 8 0 0 15 35 0 0 65 GR12 Thrace 1996 11241 2.85 32 7 0 0 25 22 0 0 78 GR13 Crete 1996 8312 2.89 24 8 0 0 16 33 0 0 67
HU Hungary 1992 4284 4284 0 0 0 100 0 0 0 HU01 Karstic 1992 9500 32.63 310 310 0 0 0 100 0 0 0 HU02 G1 Porous media (20-50) 1992 70000 7.36 515 515 0 0 0 100 0 0 0
IS Iceland 36 36 0 0 0 100 0 0 0 IE Ireland 1995 178 173 3 0 2 97 2 0 1 IE01 Eastern Water Resource
Region 1995 7622 23 21 2 0 0 91 9 0 0
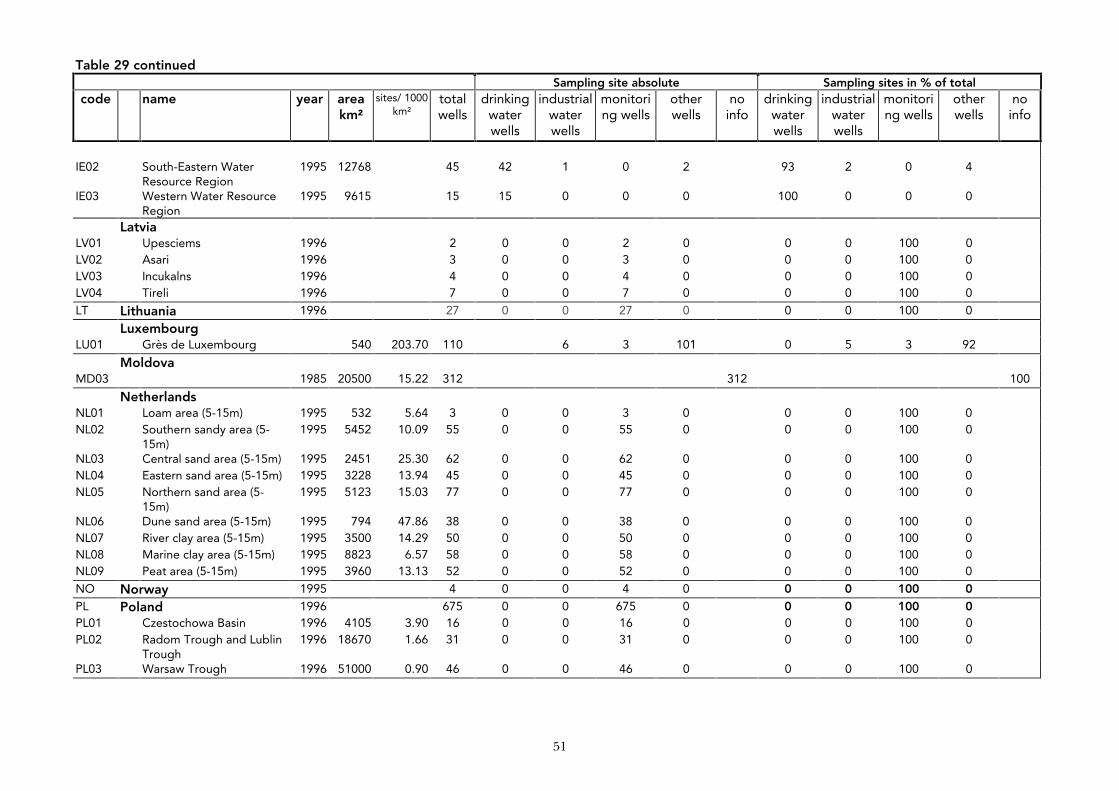
51
Table 29 continued Sampling site absolute Sampling sites in % of total code name year area
km² sites/ 1000
km² total wells
drinking water wells
industrial water wells
monitoring wells
other wells
no info
drinking water wells
industrial water wells
monitoring wells
other wells
no info
IE02 South-Eastern Water
Resource Region 1995 12768 45 42 1 0 2 93 2 0 4
IE03 Western Water Resource Region
1995 9615 15 15 0 0 0 100 0 0 0
Latvia LV01 Upesciems 1996 2 0 0 2 0 0 0 100 0 LV02 Asari 1996 3 0 0 3 0 0 0 100 0 LV03 Incukalns 1996 4 0 0 4 0 0 0 100 0 LV04 Tireli 1996 7 0 0 7 0 0 0 100 0
LT Lithuania 1996 27 0 0 27 0 0 0 100 0
Luxembourg LU01 Grès de Luxembourg 540 203.70 110 6 3 101 0 5 3 92
Moldova MD03 1985 20500 15.22 312 312 100
Netherlands NL01 Loam area (5-15m) 1995 532 5.64 3 0 0 3 0 0 0 100 0 NL02 Southern sandy area (5-
15m) 1995 5452 10.09 55 0 0 55 0 0 0 100 0
NL03 Central sand area (5-15m) 1995 2451 25.30 62 0 0 62 0 0 0 100 0 NL04 Eastern sand area (5-15m) 1995 3228 13.94 45 0 0 45 0 0 0 100 0 NL05 Northern sand area (5-
15m) 1995 5123 15.03 77 0 0 77 0 0 0 100 0
NL06 Dune sand area (5-15m) 1995 794 47.86 38 0 0 38 0 0 0 100 0 NL07 River clay area (5-15m) 1995 3500 14.29 50 0 0 50 0 0 0 100 0 NL08 Marine clay area (5-15m) 1995 8823 6.57 58 0 0 58 0 0 0 100 0 NL09 Peat area (5-15m) 1995 3960 13.13 52 0 0 52 0 0 0 100 0
NO Norway 1995 4 0 0 4 0 0 0 100 0
PL Poland 1996 675 0 0 675 0 0 0 100 0 PL01 Czestochowa Basin 1996 4105 3.90 16 0 0 16 0 0 0 100 0 PL02 Radom Trough and Lublin
Trough 1996 18670 1.66 31 0 0 31 0 0 0 100 0
PL03 Warsaw Trough 1996 51000 0.90 46 0 0 46 0 0 0 100 0

52
Table 29 continued Sampling site absolute Sampling sites in % of total code name year area
km² sites/ 1000
km² total wells
drinking water wells
industrial water wells
monitoring wells
other wells
no info
drinking water wells
industrial water wells
monitoring wells
other wells
no info
Portugal
PT02 Algarve 1996 5000 15.00 75 0 0 75 0 0 0 100 0
Romania RO01 South Baragan Plain 1995 4600 13.26 61 61 0 0 0 100 0 0 0
SK Slovak Republic 1995 282 88 0 173 21 31 0 61 7 SK01 Rye Island 1995 680 86.76 59 0 0 59 0 0 0 100 0 SK02 Alluvia of Ondava from
Svidník to Domaša 1995 65 61.54 4 3 0 1 0 75 0 25 0
SK03 Alluvia of Ondava from Domaša to Trebišov
1995 130 69.23 9 3 0 6 0 33 0 67 0
SK04 Medzibodro ie and alluvia of Roòava
1995 240 33.33 8 1 0 7 0 13 0 88 0
SI Slovenia 1996 84 17 5 62 0 20 6 74 0 SI01 VS 1996 59 67.80 4 1 0 3 0 25 0 75 0 SI02 KB/LB/LP/SP/KP/VP 1996 533.7 58.09 31 8 5 18 0 26 16 58 0 SI03 SD/DM/DB 1996 107.2 102.61 11 1 0 10 0 9 0 91 0 SI04 BKC 1996 245.2 53.02 13 1 0 12 0 8 0 92 0 SI05 DP 1996 434.3 34.54 15 3 0 12 0 20 0 80 0 SI06 AMP 1996 654.7 15.27 10 3 0 7 0 30 0 70 0
Spain ES01 Region de los Arenales 1995 6000 5.17 31 10 0 16 5 ES02 Plana de Valencia Norte 1995 260 42.31 11 6 0 0 5 ES03 Madrid - Talavera 1995 6300 8.89 56 20 3 0 33
SE Sweden 1995 114 0 0 114 0 0 0 100 0 SE01 Kristianstadslätten 1995 525 1.90 1 1 0 1 0 -1 100 0 100 0 -100 SE02 Brattforsheden 1995 80 12.50 1 0 0 1 0 0 0 100 0 SE03 Badelundaåsen 50 60.00 3 0 0 3 0 0 0 100 0
Turkey TR01 Küçük Menderes 1996 1135 12.33 14 0 0 0 14 0 0 0 100 TR02 Erzurum 1996 740 24.32 18 13 0 0 5 72 0 0 28 TR03 Elazig-Uluova 1995 770 33.77 26 0 0 0 26 0 0 0 100
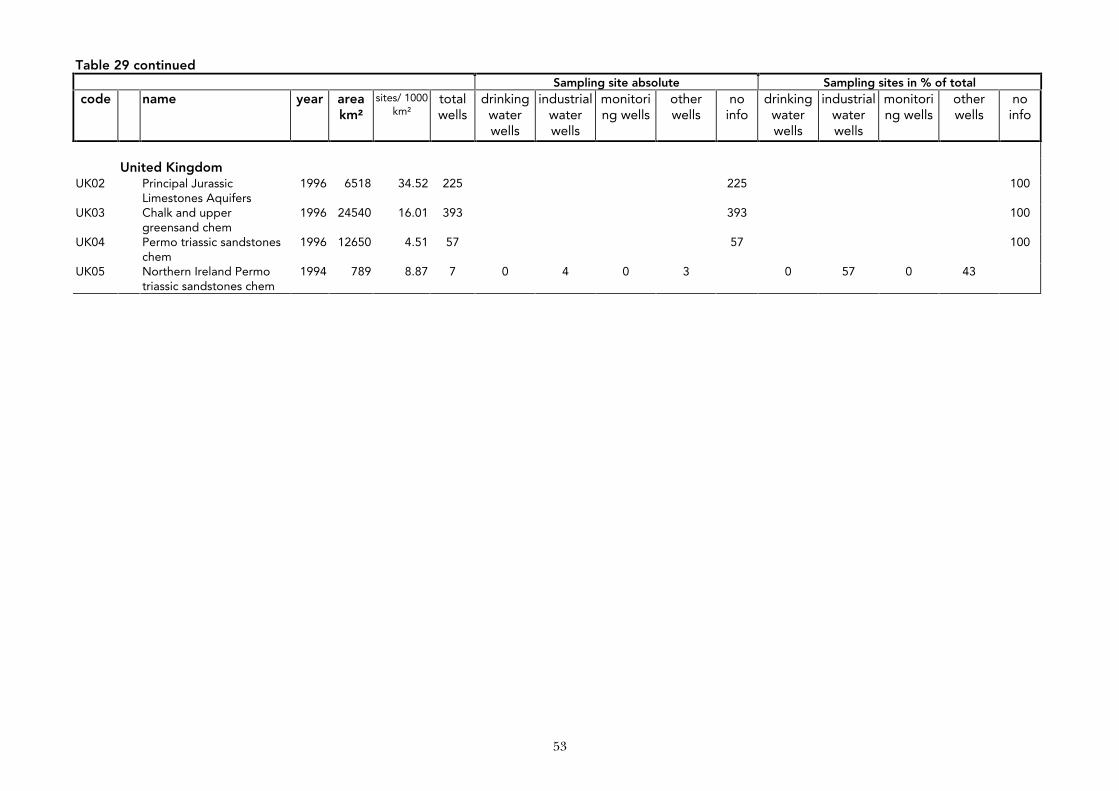
53
Table 29 continued Sampling site absolute Sampling sites in % of total code name year area
km² sites/ 1000
km² total wells
drinking water wells
industrial water wells
monitoring wells
other wells
no info
drinking water wells
industrial water wells
monitoring wells
other wells
no info
United Kingdom
UK02 Principal Jurassic Limestones Aquifers
1996 6518 34.52 225 225 100
UK03 Chalk and upper greensand chem
1996 24540 16.01 393 393 100
UK04 Permo triassic sandstones chem
1996 12650 4.51 57 57 100
UK05 Northern Ireland Permo triassic sandstones chem
1994 789 8.87 7 0 4 0 3 0 57 0 43
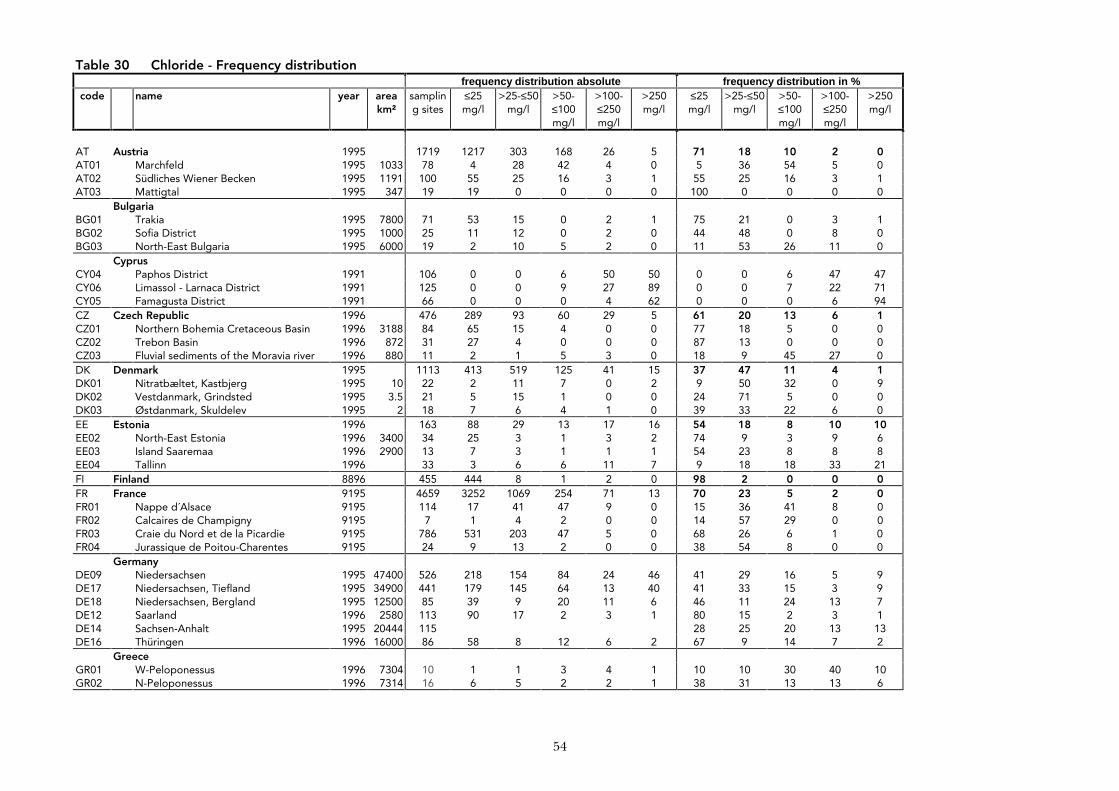
54
Table 30 Chloride - Frequency distribution frequency distribution absolute frequency distribution in %
code name year area km²
sampling sites
≤25 mg/l
>25-≤50 mg/l
>50-≤100 mg/l
>100-≤250 mg/l
>250 mg/l
≤25 mg/l
>25-≤50 mg/l
>50-≤100 mg/l
>100-≤250 mg/l
>250 mg/l
AT Austria 1995 1719 1217 303 168 26 5 71 18 10 2 0 AT01 Marchfeld 1995 1033 78 4 28 42 4 0 5 36 54 5 0 AT02 Südliches Wiener Becken 1995 1191 100 55 25 16 3 1 55 25 16 3 1 AT03 Mattigtal 1995 347 19 19 0 0 0 0 100 0 0 0 0
Bulgaria BG01 Trakia 1995 7800 71 53 15 0 2 1 75 21 0 3 1 BG02 Sofia District 1995 1000 25 11 12 0 2 0 44 48 0 8 0 BG03 North-East Bulgaria 1995 6000 19 2 10 5 2 0 11 53 26 11 0
Cyprus CY04 Paphos District 1991 106 0 0 6 50 50 0 0 6 47 47 CY06 Limassol - Larnaca District 1991 125 0 0 9 27 89 0 0 7 22 71 CY05 Famagusta District 1991 66 0 0 0 4 62 0 0 0 6 94 CZ Czech Republic 1996 476 289 93 60 29 5 61 20 13 6 1 CZ01 Northern Bohemia Cretaceous Basin 1996 3188 84 65 15 4 0 0 77 18 5 0 0 CZ02 Trebon Basin 1996 872 31 27 4 0 0 0 87 13 0 0 0 CZ03 Fluvial sediments of the Moravia river 1996 880 11 2 1 5 3 0 18 9 45 27 0 DK Denmark 1995 1113 413 519 125 41 15 37 47 11 4 1 DK01 Nitratbæltet, Kastbjerg 1995 10 22 2 11 7 0 2 9 50 32 0 9 DK02 Vestdanmark, Grindsted 1995 3.5 21 5 15 1 0 0 24 71 5 0 0 DK03 Østdanmark, Skuldelev 1995 2 18 7 6 4 1 0 39 33 22 6 0 EE Estonia 1996 163 88 29 13 17 16 54 18 8 10 10 EE02 North-East Estonia 1996 3400 34 25 3 1 3 2 74 9 3 9 6 EE03 Island Saaremaa 1996 2900 13 7 3 1 1 1 54 23 8 8 8 EE04 Tallinn 1996 33 3 6 6 11 7 9 18 18 33 21 FI Finland 8896 455 444 8 1 2 0 98 2 0 0 0 FR France 9195 4659 3252 1069 254 71 13 70 23 5 2 0 FR01 Nappe d´Alsace 9195 114 17 41 47 9 0 15 36 41 8 0 FR02 Calcaires de Champigny 9195 7 1 4 2 0 0 14 57 29 0 0 FR03 Craie du Nord et de la Picardie 9195 786 531 203 47 5 0 68 26 6 1 0 FR04 Jurassique de Poitou-Charentes 9195 24 9 13 2 0 0 38 54 8 0 0
Germany DE09 Niedersachsen 1995 47400 526 218 154 84 24 46 41 29 16 5 9 DE17 Niedersachsen, Tiefland 1995 34900 441 179 145 64 13 40 41 33 15 3 9 DE18 Niedersachsen, Bergland 1995 12500 85 39 9 20 11 6 46 11 24 13 7 DE12 Saarland 1996 2580 113 90 17 2 3 1 80 15 2 3 1 DE14 Sachsen-Anhalt 1995 20444 115 28 25 20 13 13 DE16 Thüringen 1996 16000 86 58 8 12 6 2 67 9 14 7 2
Greece GR01 W-Peloponessus 1996 7304 10 1 1 3 4 1 10 10 30 40 10 GR02 N-Peloponessus 1996 7314 16 6 5 2 2 1 38 31 13 13 6
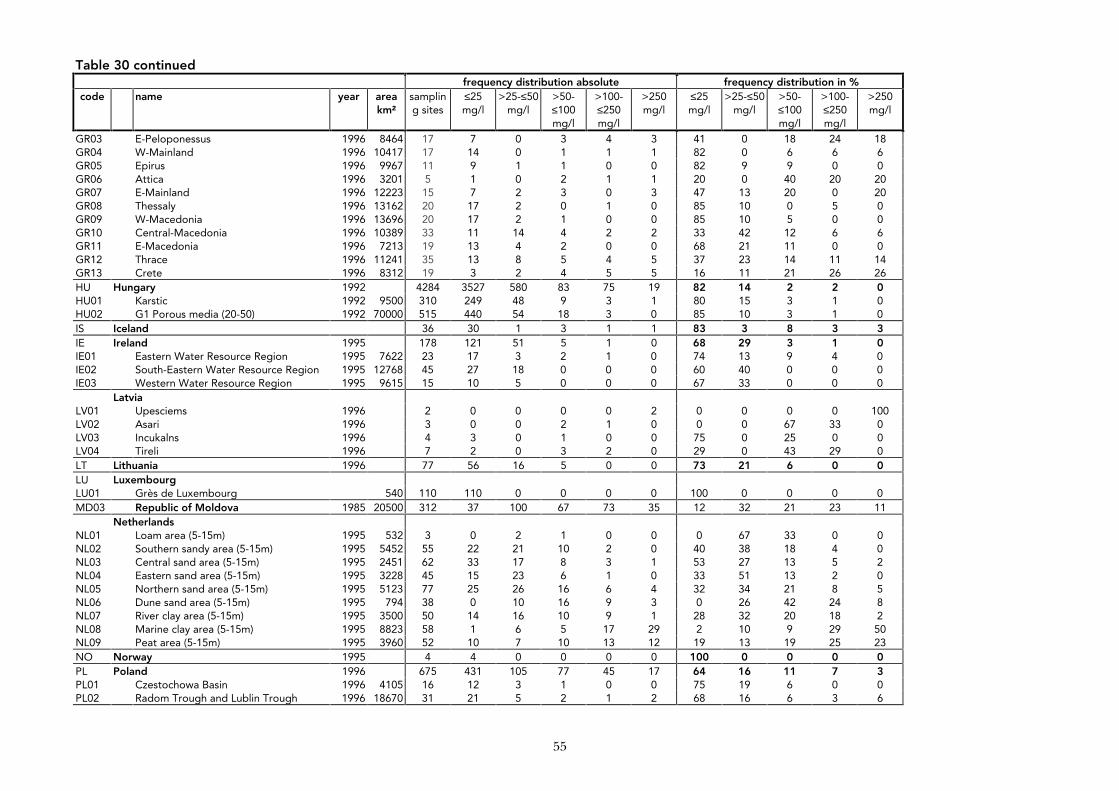
55
Table 30 continued frequency distribution absolute frequency distribution in %
code name year area km²
sampling sites
≤25 mg/l
>25-≤50 mg/l
>50-≤100 mg/l
>100-≤250 mg/l
>250 mg/l
≤25 mg/l
>25-≤50 mg/l
>50-≤100 mg/l
>100-≤250 mg/l
>250 mg/l
GR03 E-Peloponessus 1996 8464 17 7 0 3 4 3 41 0 18 24 18 GR04 W-Mainland 1996 10417 17 14 0 1 1 1 82 0 6 6 6 GR05 Epirus 1996 9967 11 9 1 1 0 0 82 9 9 0 0 GR06 Attica 1996 3201 5 1 0 2 1 1 20 0 40 20 20 GR07 E-Mainland 1996 12223 15 7 2 3 0 3 47 13 20 0 20 GR08 Thessaly 1996 13162 20 17 2 0 1 0 85 10 0 5 0 GR09 W-Macedonia 1996 13696 20 17 2 1 0 0 85 10 5 0 0 GR10 Central-Macedonia 1996 10389 33 11 14 4 2 2 33 42 12 6 6 GR11 E-Macedonia 1996 7213 19 13 4 2 0 0 68 21 11 0 0 GR12 Thrace 1996 11241 35 13 8 5 4 5 37 23 14 11 14 GR13 Crete 1996 8312 19 3 2 4 5 5 16 11 21 26 26 HU Hungary 1992 4284 3527 580 83 75 19 82 14 2 2 0 HU01 Karstic 1992 9500 310 249 48 9 3 1 80 15 3 1 0 HU02 G1 Porous media (20-50) 1992 70000 515 440 54 18 3 0 85 10 3 1 0 IS Iceland 36 30 1 3 1 1 83 3 8 3 3 IE Ireland 1995 178 121 51 5 1 0 68 29 3 1 0 IE01 Eastern Water Resource Region 1995 7622 23 17 3 2 1 0 74 13 9 4 0 IE02 South-Eastern Water Resource Region 1995 12768 45 27 18 0 0 0 60 40 0 0 0 IE03 Western Water Resource Region 1995 9615 15 10 5 0 0 0 67 33 0 0 0
Latvia LV01 Upesciems 1996 2 0 0 0 0 2 0 0 0 0 100 LV02 Asari 1996 3 0 0 2 1 0 0 0 67 33 0 LV03 Incukalns 1996 4 3 0 1 0 0 75 0 25 0 0 LV04 Tireli 1996 7 2 0 3 2 0 29 0 43 29 0 LT Lithuania 1996 77 56 16 5 0 0 73 21 6 0 0 LU Luxembourg LU01 Grès de Luxembourg 540 110 110 0 0 0 0 100 0 0 0 0 MD03 Republic of Moldova 1985 20500 312 37 100 67 73 35 12 32 21 23 11
Netherlands NL01 Loam area (5-15m) 1995 532 3 0 2 1 0 0 0 67 33 0 0 NL02 Southern sandy area (5-15m) 1995 5452 55 22 21 10 2 0 40 38 18 4 0 NL03 Central sand area (5-15m) 1995 2451 62 33 17 8 3 1 53 27 13 5 2 NL04 Eastern sand area (5-15m) 1995 3228 45 15 23 6 1 0 33 51 13 2 0 NL05 Northern sand area (5-15m) 1995 5123 77 25 26 16 6 4 32 34 21 8 5 NL06 Dune sand area (5-15m) 1995 794 38 0 10 16 9 3 0 26 42 24 8 NL07 River clay area (5-15m) 1995 3500 50 14 16 10 9 1 28 32 20 18 2 NL08 Marine clay area (5-15m) 1995 8823 58 1 6 5 17 29 2 10 9 29 50 NL09 Peat area (5-15m) 1995 3960 52 10 7 10 13 12 19 13 19 25 23 NO Norway 1995 4 4 0 0 0 0 100 0 0 0 0 PL Poland 1996 675 431 105 77 45 17 64 16 11 7 3 PL01 Czestochowa Basin 1996 4105 16 12 3 1 0 0 75 19 6 0 0 PL02 Radom Trough and Lublin Trough 1996 18670 31 21 5 2 1 2 68 16 6 3 6
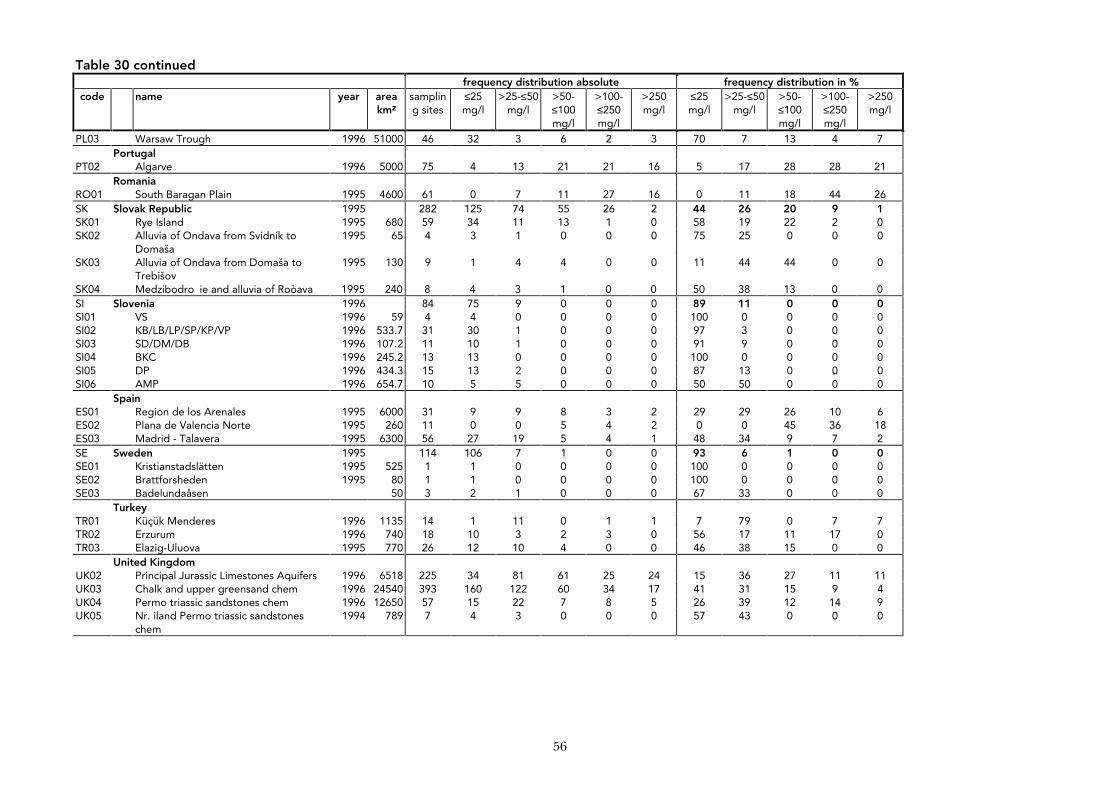
56
Table 30 continued frequency distribution absolute frequency distribution in %
code name year area km²
sampling sites
≤25 mg/l
>25-≤50 mg/l
>50-≤100 mg/l
>100-≤250 mg/l
>250 mg/l
≤25 mg/l
>25-≤50 mg/l
>50-≤100 mg/l
>100-≤250 mg/l
>250 mg/l
PL03 Warsaw Trough 1996 51000 46 32 3 6 2 3 70 7 13 4 7 Portugal
PT02 Algarve 1996 5000 75 4 13 21 21 16 5 17 28 28 21 Romania
RO01 South Baragan Plain 1995 4600 61 0 7 11 27 16 0 11 18 44 26 SK Slovak Republic 1995 282 125 74 55 26 2 44 26 20 9 1 SK01 Rye Island 1995 680 59 34 11 13 1 0 58 19 22 2 0 SK02 Alluvia of Ondava from Svidník to
Domaša 1995 65 4 3 1 0 0 0 75 25 0 0 0
SK03 Alluvia of Ondava from Domaša to Trebišov
1995 130 9 1 4 4 0 0 11 44 44 0 0
SK04 Medzibodro ie and alluvia of Roòava 1995 240 8 4 3 1 0 0 50 38 13 0 0 SI Slovenia 1996 84 75 9 0 0 0 89 11 0 0 0 SI01 VS 1996 59 4 4 0 0 0 0 100 0 0 0 0 SI02 KB/LB/LP/SP/KP/VP 1996 533.7 31 30 1 0 0 0 97 3 0 0 0 SI03 SD/DM/DB 1996 107.2 11 10 1 0 0 0 91 9 0 0 0 SI04 BKC 1996 245.2 13 13 0 0 0 0 100 0 0 0 0 SI05 DP 1996 434.3 15 13 2 0 0 0 87 13 0 0 0 SI06 AMP 1996 654.7 10 5 5 0 0 0 50 50 0 0 0
Spain ES01 Region de los Arenales 1995 6000 31 9 9 8 3 2 29 29 26 10 6 ES02 Plana de Valencia Norte 1995 260 11 0 0 5 4 2 0 0 45 36 18 ES03 Madrid - Talavera 1995 6300 56 27 19 5 4 1 48 34 9 7 2 SE Sweden 1995 114 106 7 1 0 0 93 6 1 0 0 SE01 Kristianstadslätten 1995 525 1 1 0 0 0 0 100 0 0 0 0 SE02 Brattforsheden 1995 80 1 1 0 0 0 0 100 0 0 0 0 SE03 Badelundaåsen 50 3 2 1 0 0 0 67 33 0 0 0
Turkey TR01 Küçük Menderes 1996 1135 14 1 11 0 1 1 7 79 0 7 7 TR02 Erzurum 1996 740 18 10 3 2 3 0 56 17 11 17 0 TR03 Elazig-Uluova 1995 770 26 12 10 4 0 0 46 38 15 0 0
United Kingdom UK02 Principal Jurassic Limestones Aquifers 1996 6518 225 34 81 61 25 24 15 36 27 11 11 UK03 Chalk and upper greensand chem 1996 24540 393 160 122 60 34 17 41 31 15 9 4 UK04 Permo triassic sandstones chem 1996 12650 57 15 22 7 8 5 26 39 12 14 9 UK05 Nr. iland Permo triassic sandstones
chem 1994 789 7 4 3 0 0 0 57 43 0 0 0
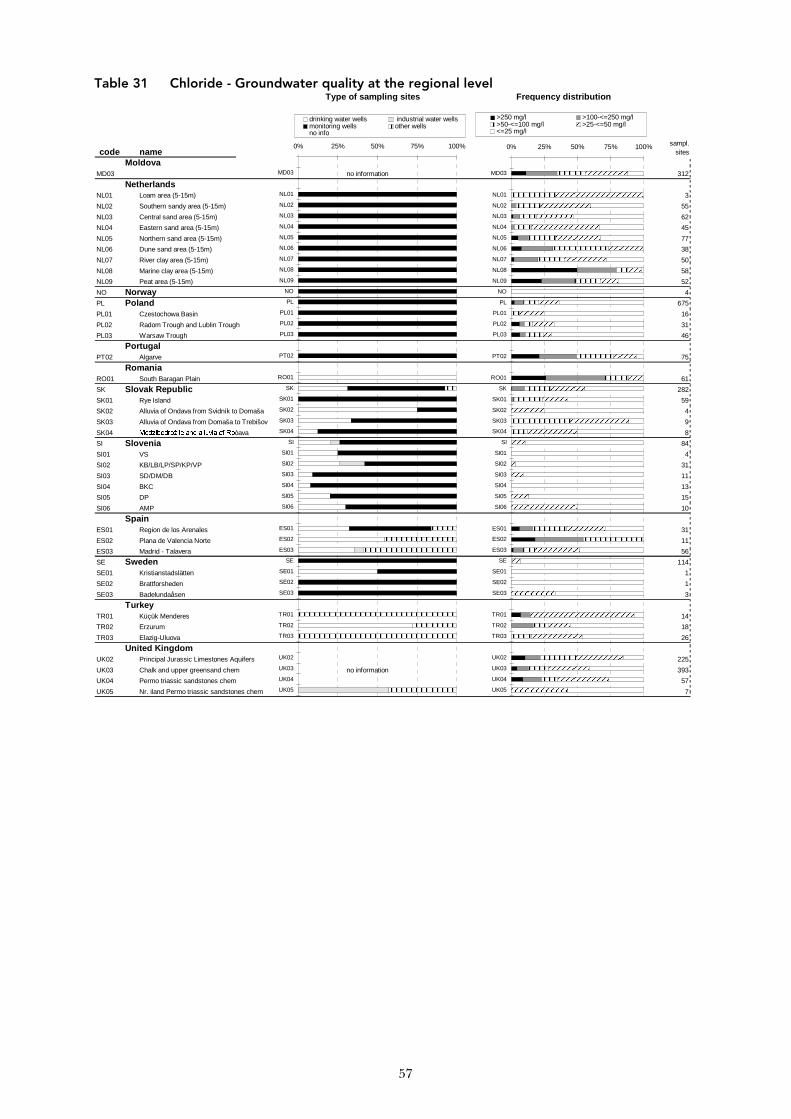
57
Table 31 Chloride - Groundwater quality at the regional level Type of sampling sites Frequency distribution
code namesampl.
sites
MoldovaMD03 no information 312
NetherlandsNL01 Loam area (5-15m) 3
NL02 Southern sandy area (5-15m) 55
NL03 Central sand area (5-15m) 62
NL04 Eastern sand area (5-15m) 45
NL05 Northern sand area (5-15m) 77
NL06 Dune sand area (5-15m) 38
NL07 River clay area (5-15m) 50
NL08 Marine clay area (5-15m) 58
NL09 Peat area (5-15m) 52
NO Norway 4
PL Poland 675
PL01 Czestochowa Basin 16
PL02 Radom Trough and Lublin Trough 31
PL03 Warsaw Trough 46
PortugalPT02 Algarve 75
RomaniaRO01 South Baragan Plain 61
SK Slovak Republic 282
SK01 Rye Island 59
SK02 Alluvia of Ondava from Svidník to Domaša 4
SK03 Alluvia of Ondava from Domaša to Trebišov 9
SK04 0HG]LERGURå LH�DQG�DOOXYLD�RI�5Ròava 8
SI Slovenia 84
SI01 VS 4
SI02 KB/LB/LP/SP/KP/VP 31
SI03 SD/DM/DB 11
SI04 BKC 13
SI05 DP 15
SI06 AMP 10
SpainES01 Region de los Arenales 31
ES02 Plana de Valencia Norte 11
ES03 Madrid - Talavera 56
SE Sweden 114
SE01 Kristianstadslätten 1
SE02 Brattforsheden 1
SE03 Badelundaåsen 3
TurkeyTR01 Küçük Menderes 14
TR02 Erzurum 18
TR03 Elazig-Uluova 26
United KingdomUK02 Principal Jurassic Limestones Aquifers 225
UK03 Chalk and upper greensand chem no information 393
UK04 Permo triassic sandstones chem 57
UK05 Nr. iland Permo triassic sandstones chem 7
0% 25% 50% 75% 100%
MD03
NL01
NL02
NL03
NL04
NL05
NL06
NL07
NL08
NL09
NO
PL
PL01
PL02
PL03
PT02
RO01
SK
SK01
SK02
SK03
SK04
SI
SI01
SI02
SI03
SI04
SI05
SI06
ES01
ES02
ES03
SE
SE01
SE02
SE03
TR01
TR02
TR03
UK02
UK03
UK04
UK05
drinking water wells industrial water wellsmonitoring wells other wellsno info
0% 25% 50% 75% 100%
MD03
NL01
NL02
NL03
NL04
NL05
NL06
NL07
NL08
NL09
NO
PL
PL01
PL02
PL03
PT02
RO01
SK
SK01
SK02
SK03
SK04
SI
SI01
SI02
SI03
SI04
SI05
SI06
ES01
ES02
ES03
SE
SE01
SE02
SE03
TR01
TR02
TR03
UK02
UK03
UK04
UK05
>250 mg/l >100-<=250 mg/l>50-<=100 mg/l >25-<=50 mg/l<=25 mg/l
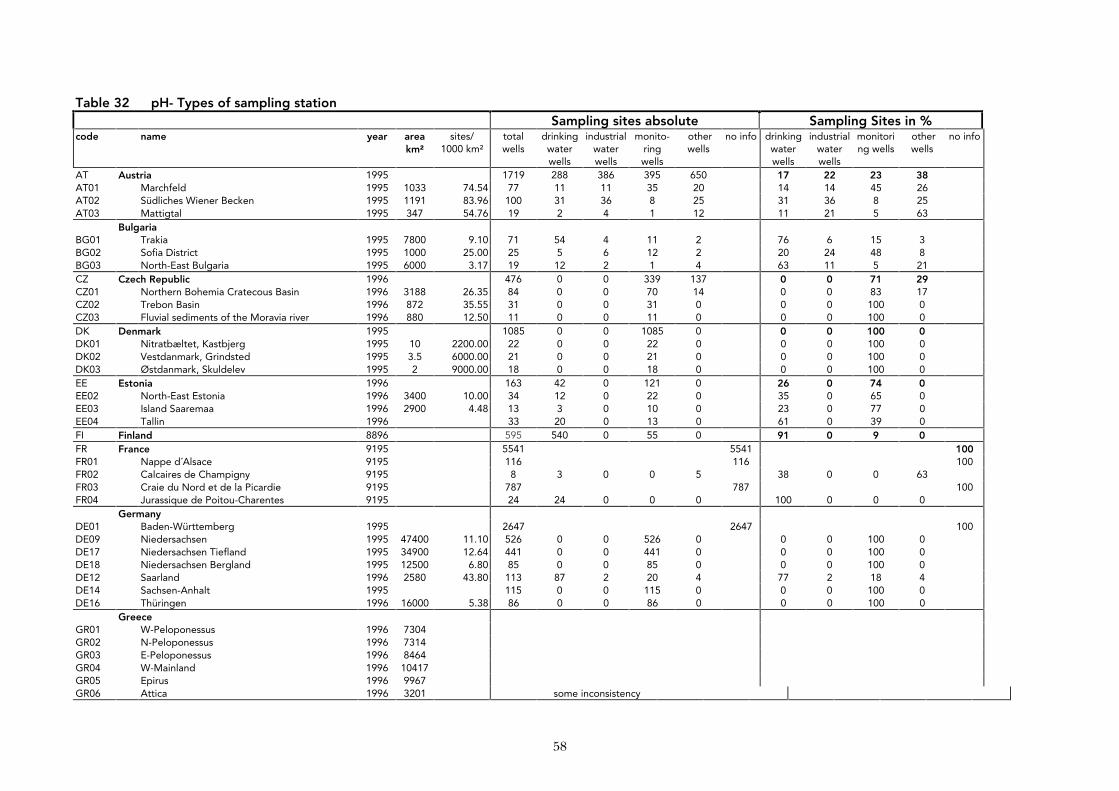
58
Table 32 pH- Types of sampling station Sampling sites absolute Sampling Sites in %
code name year area km²
sites/ 1000 km²
total wells
drinking water wells
industrial water wells
monito-ring wells
other wells
no info drinking water wells
industrial water wells
monitoring wells
other wells
no info
AT Austria 1995 1719 288 386 395 650 17 22 23 38 AT01 Marchfeld 1995 1033 74.54 77 11 11 35 20 14 14 45 26 AT02 Südliches Wiener Becken 1995 1191 83.96 100 31 36 8 25 31 36 8 25 AT03 Mattigtal 1995 347 54.76 19 2 4 1 12 11 21 5 63
Bulgaria BG01 Trakia 1995 7800 9.10 71 54 4 11 2 76 6 15 3 BG02 Sofia District 1995 1000 25.00 25 5 6 12 2 20 24 48 8 BG03 North-East Bulgaria 1995 6000 3.17 19 12 2 1 4 63 11 5 21 CZ Czech Republic 1996 476 0 0 339 137 0 0 71 29 CZ01 Northern Bohemia Cratecous Basin 1996 3188 26.35 84 0 0 70 14 0 0 83 17 CZ02 Trebon Basin 1996 872 35.55 31 0 0 31 0 0 0 100 0 CZ03 Fluvial sediments of the Moravia river 1996 880 12.50 11 0 0 11 0 0 0 100 0 DK Denmark 1995 1085 0 0 1085 0 0 0 100 0 DK01 Nitratbæltet, Kastbjerg 1995 10 2200.00 22 0 0 22 0 0 0 100 0 DK02 Vestdanmark, Grindsted 1995 3.5 6000.00 21 0 0 21 0 0 0 100 0 DK03 Østdanmark, Skuldelev 1995 2 9000.00 18 0 0 18 0 0 0 100 0 EE Estonia 1996 163 42 0 121 0 26 0 74 0 EE02 North-East Estonia 1996 3400 10.00 34 12 0 22 0 35 0 65 0 EE03 Island Saaremaa 1996 2900 4.48 13 3 0 10 0 23 0 77 0 EE04 Tallin 1996 33 20 0 13 0 61 0 39 0 FI Finland 8896 595 540 0 55 0 91 0 9 0 FR France 9195 5541 5541 100 FR01 Nappe d´Alsace 9195 116 116 100 FR02 Calcaires de Champigny 9195 8 3 0 0 5 38 0 0 63 FR03 Craie du Nord et de la Picardie 9195 787 787 100 FR04 Jurassique de Poitou-Charentes 9195 24 24 0 0 0 100 0 0 0
Germany DE01 Baden-Württemberg 1995 2647 2647 100 DE09 Niedersachsen 1995 47400 11.10 526 0 0 526 0 0 0 100 0 DE17 Niedersachsen Tiefland 1995 34900 12.64 441 0 0 441 0 0 0 100 0 DE18 Niedersachsen Bergland 1995 12500 6.80 85 0 0 85 0 0 0 100 0 DE12 Saarland 1996 2580 43.80 113 87 2 20 4 77 2 18 4 DE14 Sachsen-Anhalt 1995 115 0 0 115 0 0 0 100 0 DE16 Thüringen 1996 16000 5.38 86 0 0 86 0 0 0 100 0
Greece GR01 W-Peloponessus 1996 7304 GR02 N-Peloponessus 1996 7314 GR03 E-Peloponessus 1996 8464 GR04 W-Mainland 1996 10417 GR05 Epirus 1996 9967 GR06 Attica 1996 3201 some inconsistency
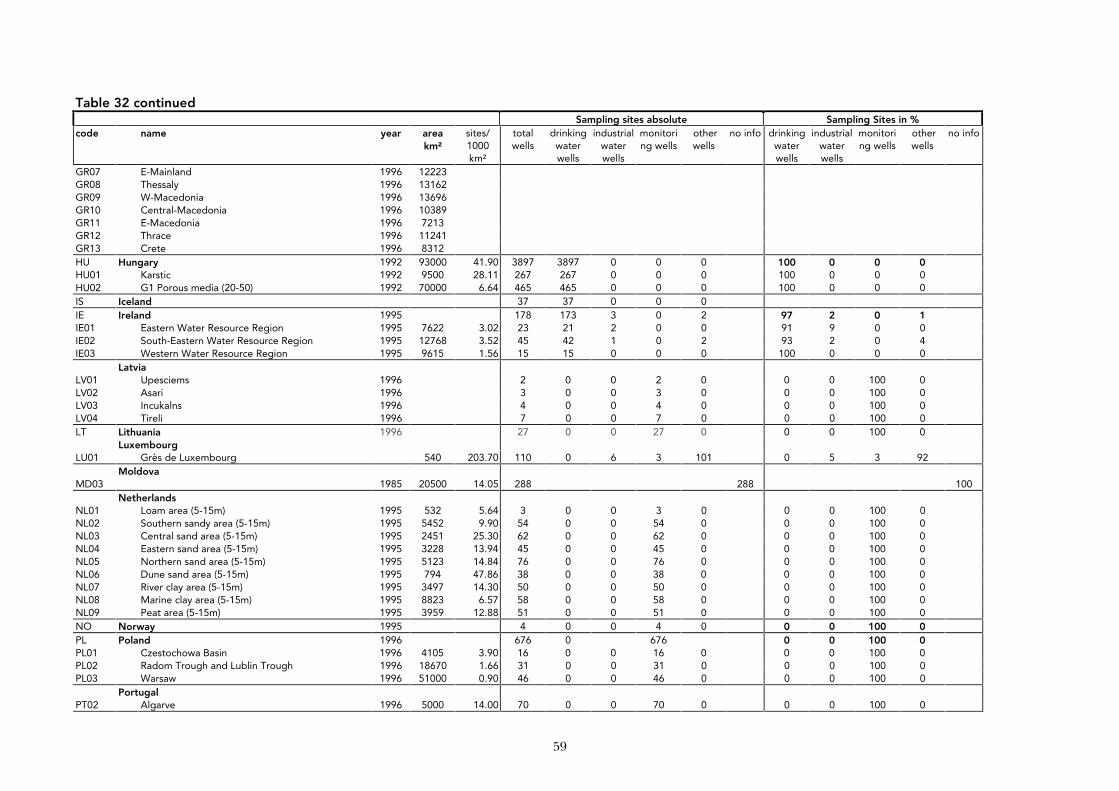
59
Table 32 continued Sampling sites absolute Sampling Sites in %
code name year area km²
sites/ 1000 km²
total wells
drinking water wells
industrial water wells
monitoring wells
other wells
no info drinking water wells
industrial water wells
monitoring wells
other wells
no info
GR07 E-Mainland 1996 12223 GR08 Thessaly 1996 13162 GR09 W-Macedonia 1996 13696 GR10 Central-Macedonia 1996 10389 GR11 E-Macedonia 1996 7213 GR12 Thrace 1996 11241 GR13 Crete 1996 8312 HU Hungary 1992 93000 41.90 3897 3897 0 0 0 100 0 0 0 HU01 Karstic 1992 9500 28.11 267 267 0 0 0 100 0 0 0 HU02 G1 Porous media (20-50) 1992 70000 6.64 465 465 0 0 0 100 0 0 0 IS Iceland 37 37 0 0 0 IE Ireland 1995 178 173 3 0 2 97 2 0 1 IE01 Eastern Water Resource Region 1995 7622 3.02 23 21 2 0 0 91 9 0 0 IE02 South-Eastern Water Resource Region 1995 12768 3.52 45 42 1 0 2 93 2 0 4 IE03 Western Water Resource Region 1995 9615 1.56 15 15 0 0 0 100 0 0 0
Latvia LV01 Upesciems 1996 2 0 0 2 0 0 0 100 0 LV02 Asari 1996 3 0 0 3 0 0 0 100 0 LV03 Incukalns 1996 4 0 0 4 0 0 0 100 0 LV04 Tireli 1996 7 0 0 7 0 0 0 100 0 LT Lithuania 1996 27 0 0 27 0 0 0 100 0
Luxembourg LU01 Grès de Luxembourg 540 203.70 110 0 6 3 101 0 5 3 92
Moldova MD03 1985 20500 14.05 288 288 100
Netherlands NL01 Loam area (5-15m) 1995 532 5.64 3 0 0 3 0 0 0 100 0 NL02 Southern sandy area (5-15m) 1995 5452 9.90 54 0 0 54 0 0 0 100 0 NL03 Central sand area (5-15m) 1995 2451 25.30 62 0 0 62 0 0 0 100 0 NL04 Eastern sand area (5-15m) 1995 3228 13.94 45 0 0 45 0 0 0 100 0 NL05 Northern sand area (5-15m) 1995 5123 14.84 76 0 0 76 0 0 0 100 0 NL06 Dune sand area (5-15m) 1995 794 47.86 38 0 0 38 0 0 0 100 0 NL07 River clay area (5-15m) 1995 3497 14.30 50 0 0 50 0 0 0 100 0 NL08 Marine clay area (5-15m) 1995 8823 6.57 58 0 0 58 0 0 0 100 0 NL09 Peat area (5-15m) 1995 3959 12.88 51 0 0 51 0 0 0 100 0 NO Norway 1995 4 0 0 4 0 0 0 100 0 PL Poland 1996 676 0 676 0 0 100 0 PL01 Czestochowa Basin 1996 4105 3.90 16 0 0 16 0 0 0 100 0 PL02 Radom Trough and Lublin Trough 1996 18670 1.66 31 0 0 31 0 0 0 100 0 PL03 Warsaw 1996 51000 0.90 46 0 0 46 0 0 0 100 0
Portugal PT02 Algarve 1996 5000 14.00 70 0 0 70 0 0 0 100 0
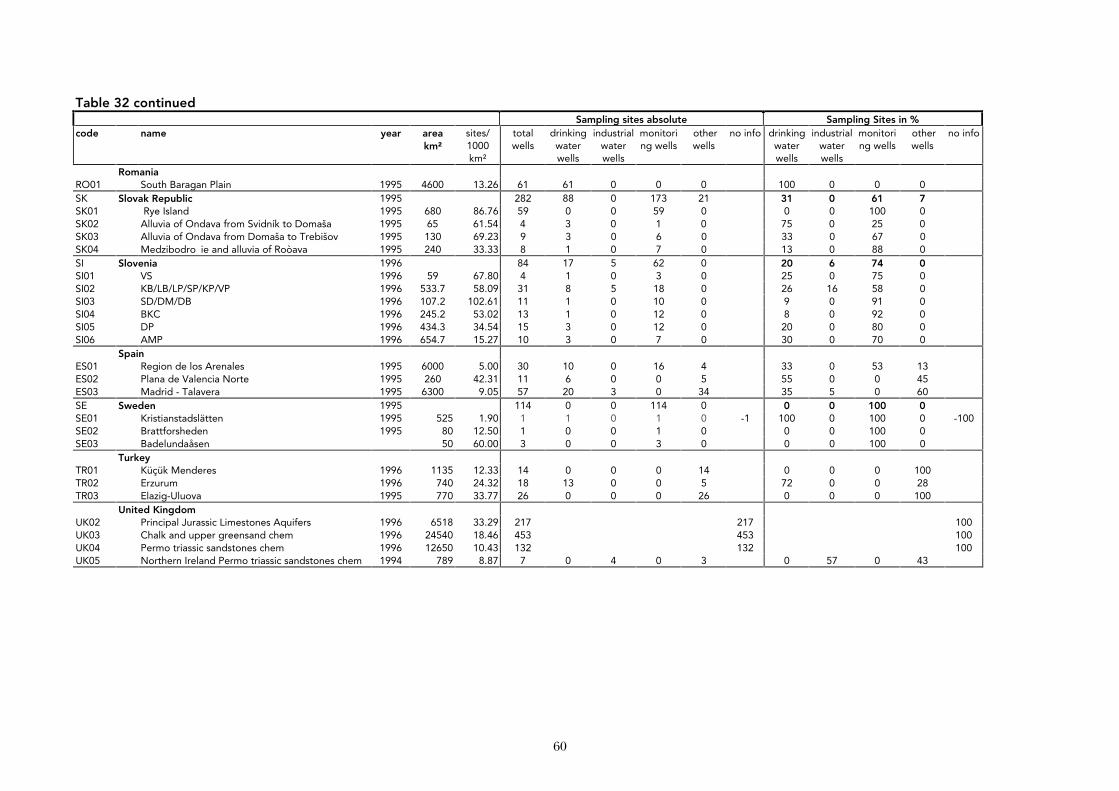
60
Table 32 continued Sampling sites absolute Sampling Sites in %
code name year area km²
sites/ 1000 km²
total wells
drinking water wells
industrial water wells
monitoring wells
other wells
no info drinking water wells
industrial water wells
monitoring wells
other wells
no info
Romania RO01 South Baragan Plain 1995 4600 13.26 61 61 0 0 0 100 0 0 0 SK Slovak Republic 1995 282 88 0 173 21 31 0 61 7 SK01 Rye Island 1995 680 86.76 59 0 0 59 0 0 0 100 0 SK02 Alluvia of Ondava from Svidník to Domaša 1995 65 61.54 4 3 0 1 0 75 0 25 0 SK03 Alluvia of Ondava from Domaša to Trebišov 1995 130 69.23 9 3 0 6 0 33 0 67 0 SK04 Medzibodro ie and alluvia of Roòava 1995 240 33.33 8 1 0 7 0 13 0 88 0 SI Slovenia 1996 84 17 5 62 0 20 6 74 0 SI01 VS 1996 59 67.80 4 1 0 3 0 25 0 75 0 SI02 KB/LB/LP/SP/KP/VP 1996 533.7 58.09 31 8 5 18 0 26 16 58 0 SI03 SD/DM/DB 1996 107.2 102.61 11 1 0 10 0 9 0 91 0 SI04 BKC 1996 245.2 53.02 13 1 0 12 0 8 0 92 0 SI05 DP 1996 434.3 34.54 15 3 0 12 0 20 0 80 0 SI06 AMP 1996 654.7 15.27 10 3 0 7 0 30 0 70 0
Spain ES01 Region de los Arenales 1995 6000 5.00 30 10 0 16 4 33 0 53 13 ES02 Plana de Valencia Norte 1995 260 42.31 11 6 0 0 5 55 0 0 45 ES03 Madrid - Talavera 1995 6300 9.05 57 20 3 0 34 35 5 0 60 SE Sweden 1995 114 0 0 114 0 0 0 100 0 SE01 Kristianstadslätten 1995 525 1.90 1 1 0 1 0 -1 100 0 100 0 -100 SE02 Brattforsheden 1995 80 12.50 1 0 0 1 0 0 0 100 0 SE03 Badelundaåsen 50 60.00 3 0 0 3 0 0 0 100 0
Turkey TR01 Küçük Menderes 1996 1135 12.33 14 0 0 0 14 0 0 0 100 TR02 Erzurum 1996 740 24.32 18 13 0 0 5 72 0 0 28 TR03 Elazig-Uluova 1995 770 33.77 26 0 0 0 26 0 0 0 100
United Kingdom UK02 Principal Jurassic Limestones Aquifers 1996 6518 33.29 217 217 100 UK03 Chalk and upper greensand chem 1996 24540 18.46 453 453 100 UK04 Permo triassic sandstones chem 1996 12650 10.43 132 132 100 UK05 Northern Ireland Permo triassic sandstones chem 1994 789 8.87 7 0 4 0 3 0 57 0 43
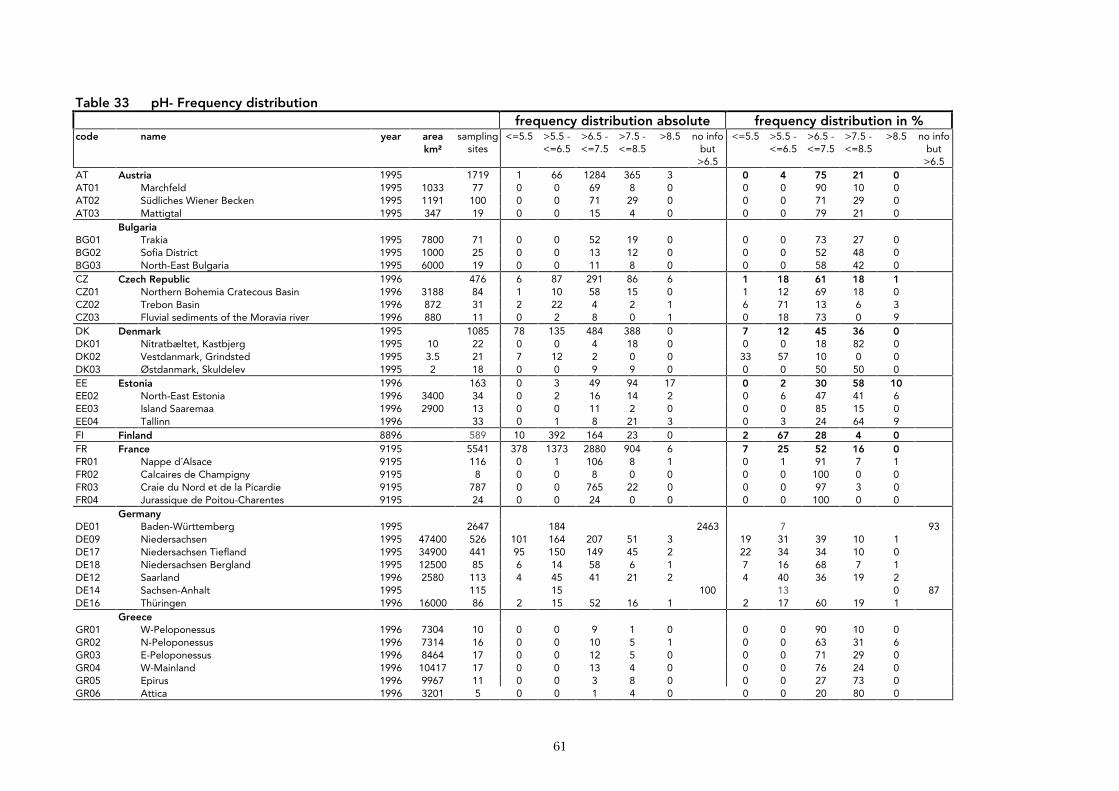
61
Table 33 pH- Frequency distribution frequency distribution absolute frequency distribution in %
code name year area km²
sampling sites
<=5.5 >5.5 - <=6.5
>6.5 - <=7.5
>7.5 - <=8.5
>8.5 no info but >6.5
<=5.5 >5.5 - <=6.5
>6.5 - <=7.5
>7.5 - <=8.5
>8.5 no info but >6.5
AT Austria 1995 1719 1 66 1284 365 3 0 4 75 21 0 AT01 Marchfeld 1995 1033 77 0 0 69 8 0 0 0 90 10 0 AT02 Südliches Wiener Becken 1995 1191 100 0 0 71 29 0 0 0 71 29 0 AT03 Mattigtal 1995 347 19 0 0 15 4 0 0 0 79 21 0
Bulgaria BG01 Trakia 1995 7800 71 0 0 52 19 0 0 0 73 27 0 BG02 Sofia District 1995 1000 25 0 0 13 12 0 0 0 52 48 0 BG03 North-East Bulgaria 1995 6000 19 0 0 11 8 0 0 0 58 42 0 CZ Czech Republic 1996 476 6 87 291 86 6 1 18 61 18 1 CZ01 Northern Bohemia Cratecous Basin 1996 3188 84 1 10 58 15 0 1 12 69 18 0 CZ02 Trebon Basin 1996 872 31 2 22 4 2 1 6 71 13 6 3 CZ03 Fluvial sediments of the Moravia river 1996 880 11 0 2 8 0 1 0 18 73 0 9 DK Denmark 1995 1085 78 135 484 388 0 7 12 45 36 0 DK01 Nitratbæltet, Kastbjerg 1995 10 22 0 0 4 18 0 0 0 18 82 0 DK02 Vestdanmark, Grindsted 1995 3.5 21 7 12 2 0 0 33 57 10 0 0 DK03 Østdanmark, Skuldelev 1995 2 18 0 0 9 9 0 0 0 50 50 0 EE Estonia 1996 163 0 3 49 94 17 0 2 30 58 10 EE02 North-East Estonia 1996 3400 34 0 2 16 14 2 0 6 47 41 6 EE03 Island Saaremaa 1996 2900 13 0 0 11 2 0 0 0 85 15 0 EE04 Tallinn 1996 33 0 1 8 21 3 0 3 24 64 9 FI Finland 8896 589 10 392 164 23 0 2 67 28 4 0 FR France 9195 5541 378 1373 2880 904 6 7 25 52 16 0 FR01 Nappe d´Alsace 9195 116 0 1 106 8 1 0 1 91 7 1 FR02 Calcaires de Champigny 9195 8 0 0 8 0 0 0 0 100 0 0 FR03 Craie du Nord et de la Picardie 9195 787 0 0 765 22 0 0 0 97 3 0 FR04 Jurassique de Poitou-Charentes 9195 24 0 0 24 0 0 0 0 100 0 0
Germany DE01 Baden-Württemberg 1995 2647 184 2463 7 93 DE09 Niedersachsen 1995 47400 526 101 164 207 51 3 19 31 39 10 1 DE17 Niedersachsen Tiefland 1995 34900 441 95 150 149 45 2 22 34 34 10 0 DE18 Niedersachsen Bergland 1995 12500 85 6 14 58 6 1 7 16 68 7 1 DE12 Saarland 1996 2580 113 4 45 41 21 2 4 40 36 19 2 DE14 Sachsen-Anhalt 1995 115 15 100 13 0 87 DE16 Thüringen 1996 16000 86 2 15 52 16 1 2 17 60 19 1
Greece GR01 W-Peloponessus 1996 7304 10 0 0 9 1 0 0 0 90 10 0 GR02 N-Peloponessus 1996 7314 16 0 0 10 5 1 0 0 63 31 6 GR03 E-Peloponessus 1996 8464 17 0 0 12 5 0 0 0 71 29 0 GR04 W-Mainland 1996 10417 17 0 0 13 4 0 0 0 76 24 0 GR05 Epirus 1996 9967 11 0 0 3 8 0 0 0 27 73 0 GR06 Attica 1996 3201 5 0 0 1 4 0 0 0 20 80 0
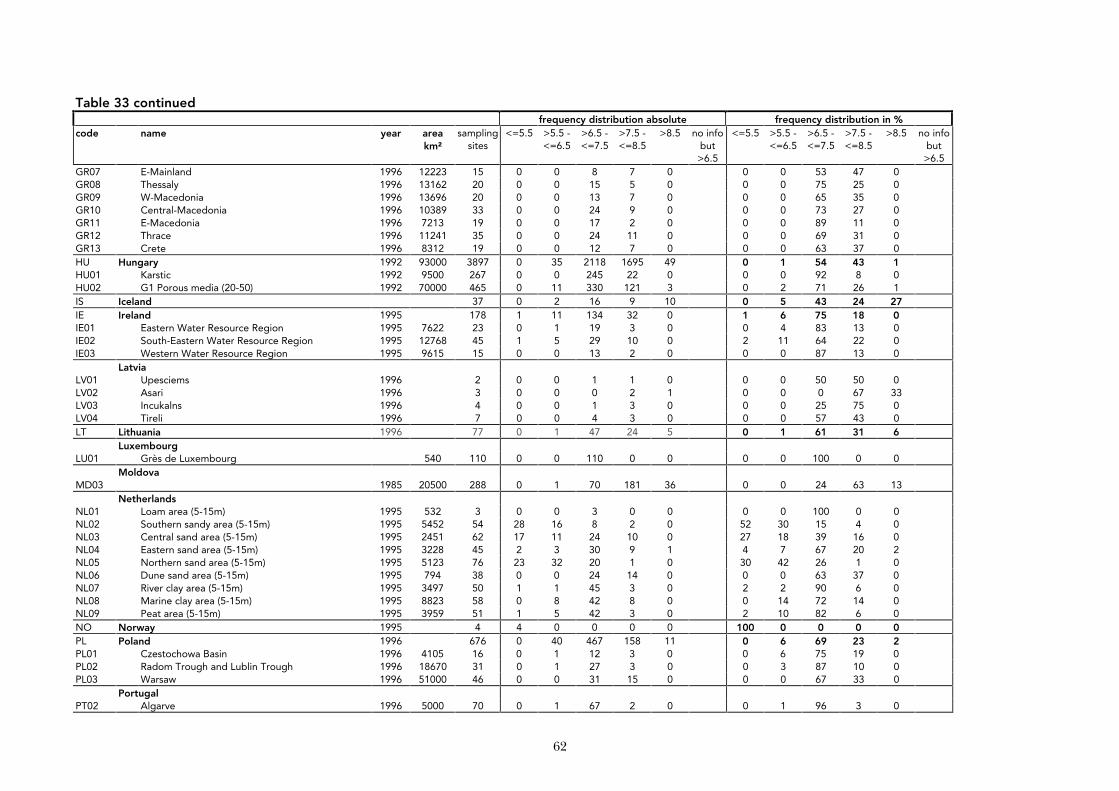
62
Table 33 continued frequency distribution absolute frequency distribution in %
code name year area km²
sampling sites
<=5.5 >5.5 - <=6.5
>6.5 - <=7.5
>7.5 - <=8.5
>8.5 no info but >6.5
<=5.5 >5.5 - <=6.5
>6.5 - <=7.5
>7.5 - <=8.5
>8.5 no info but >6.5
GR07 E-Mainland 1996 12223 15 0 0 8 7 0 0 0 53 47 0 GR08 Thessaly 1996 13162 20 0 0 15 5 0 0 0 75 25 0 GR09 W-Macedonia 1996 13696 20 0 0 13 7 0 0 0 65 35 0 GR10 Central-Macedonia 1996 10389 33 0 0 24 9 0 0 0 73 27 0 GR11 E-Macedonia 1996 7213 19 0 0 17 2 0 0 0 89 11 0 GR12 Thrace 1996 11241 35 0 0 24 11 0 0 0 69 31 0 GR13 Crete 1996 8312 19 0 0 12 7 0 0 0 63 37 0 HU Hungary 1992 93000 3897 0 35 2118 1695 49 0 1 54 43 1 HU01 Karstic 1992 9500 267 0 0 245 22 0 0 0 92 8 0 HU02 G1 Porous media (20-50) 1992 70000 465 0 11 330 121 3 0 2 71 26 1 IS Iceland 37 0 2 16 9 10 0 5 43 24 27 IE Ireland 1995 178 1 11 134 32 0 1 6 75 18 0 IE01 Eastern Water Resource Region 1995 7622 23 0 1 19 3 0 0 4 83 13 0 IE02 South-Eastern Water Resource Region 1995 12768 45 1 5 29 10 0 2 11 64 22 0 IE03 Western Water Resource Region 1995 9615 15 0 0 13 2 0 0 0 87 13 0
Latvia LV01 Upesciems 1996 2 0 0 1 1 0 0 0 50 50 0 LV02 Asari 1996 3 0 0 0 2 1 0 0 0 67 33 LV03 Incukalns 1996 4 0 0 1 3 0 0 0 25 75 0 LV04 Tireli 1996 7 0 0 4 3 0 0 0 57 43 0 LT Lithuania 1996 77 0 1 47 24 5 0 1 61 31 6
Luxembourg LU01 Grès de Luxembourg 540 110 0 0 110 0 0 0 0 100 0 0
Moldova MD03 1985 20500 288 0 1 70 181 36 0 0 24 63 13
Netherlands NL01 Loam area (5-15m) 1995 532 3 0 0 3 0 0 0 0 100 0 0 NL02 Southern sandy area (5-15m) 1995 5452 54 28 16 8 2 0 52 30 15 4 0 NL03 Central sand area (5-15m) 1995 2451 62 17 11 24 10 0 27 18 39 16 0 NL04 Eastern sand area (5-15m) 1995 3228 45 2 3 30 9 1 4 7 67 20 2 NL05 Northern sand area (5-15m) 1995 5123 76 23 32 20 1 0 30 42 26 1 0 NL06 Dune sand area (5-15m) 1995 794 38 0 0 24 14 0 0 0 63 37 0 NL07 River clay area (5-15m) 1995 3497 50 1 1 45 3 0 2 2 90 6 0 NL08 Marine clay area (5-15m) 1995 8823 58 0 8 42 8 0 0 14 72 14 0 NL09 Peat area (5-15m) 1995 3959 51 1 5 42 3 0 2 10 82 6 0 NO Norway 1995 4 4 0 0 0 0 100 0 0 0 0 PL Poland 1996 676 0 40 467 158 11 0 6 69 23 2 PL01 Czestochowa Basin 1996 4105 16 0 1 12 3 0 0 6 75 19 0 PL02 Radom Trough and Lublin Trough 1996 18670 31 0 1 27 3 0 0 3 87 10 0 PL03 Warsaw 1996 51000 46 0 0 31 15 0 0 0 67 33 0
Portugal PT02 Algarve 1996 5000 70 0 1 67 2 0 0 1 96 3 0
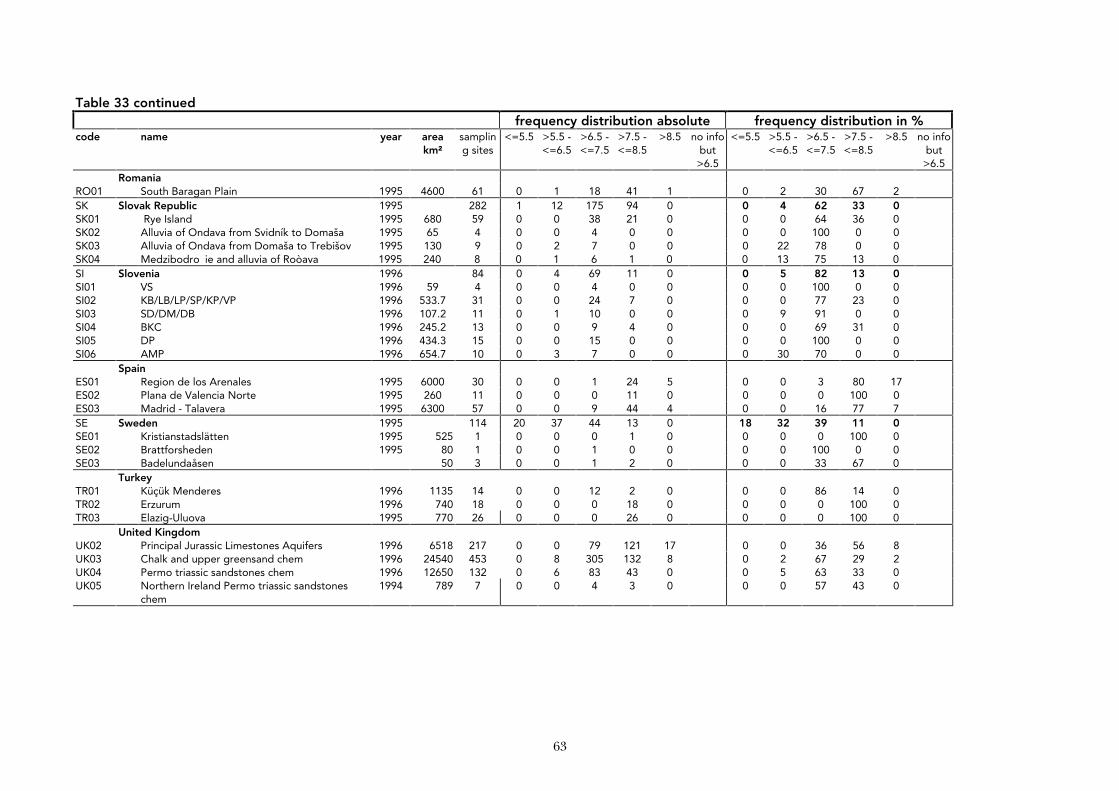
63
Table 33 continued frequency distribution absolute frequency distribution in %
code name year area km²
sampling sites
<=5.5 >5.5 - <=6.5
>6.5 - <=7.5
>7.5 - <=8.5
>8.5 no info but >6.5
<=5.5 >5.5 - <=6.5
>6.5 - <=7.5
>7.5 - <=8.5
>8.5 no info but >6.5
Romania RO01 South Baragan Plain 1995 4600 61 0 1 18 41 1 0 2 30 67 2 SK Slovak Republic 1995 282 1 12 175 94 0 0 4 62 33 0 SK01 Rye Island 1995 680 59 0 0 38 21 0 0 0 64 36 0 SK02 Alluvia of Ondava from Svidník to Domaša 1995 65 4 0 0 4 0 0 0 0 100 0 0 SK03 Alluvia of Ondava from Domaša to Trebišov 1995 130 9 0 2 7 0 0 0 22 78 0 0 SK04 Medzibodro ie and alluvia of Roòava 1995 240 8 0 1 6 1 0 0 13 75 13 0 SI Slovenia 1996 84 0 4 69 11 0 0 5 82 13 0 SI01 VS 1996 59 4 0 0 4 0 0 0 0 100 0 0 SI02 KB/LB/LP/SP/KP/VP 1996 533.7 31 0 0 24 7 0 0 0 77 23 0 SI03 SD/DM/DB 1996 107.2 11 0 1 10 0 0 0 9 91 0 0 SI04 BKC 1996 245.2 13 0 0 9 4 0 0 0 69 31 0 SI05 DP 1996 434.3 15 0 0 15 0 0 0 0 100 0 0 SI06 AMP 1996 654.7 10 0 3 7 0 0 0 30 70 0 0
Spain ES01 Region de los Arenales 1995 6000 30 0 0 1 24 5 0 0 3 80 17 ES02 Plana de Valencia Norte 1995 260 11 0 0 0 11 0 0 0 0 100 0 ES03 Madrid - Talavera 1995 6300 57 0 0 9 44 4 0 0 16 77 7 SE Sweden 1995 114 20 37 44 13 0 18 32 39 11 0 SE01 Kristianstadslätten 1995 525 1 0 0 0 1 0 0 0 0 100 0 SE02 Brattforsheden 1995 80 1 0 0 1 0 0 0 0 100 0 0 SE03 Badelundaåsen 50 3 0 0 1 2 0 0 0 33 67 0
Turkey TR01 Küçük Menderes 1996 1135 14 0 0 12 2 0 0 0 86 14 0 TR02 Erzurum 1996 740 18 0 0 0 18 0 0 0 0 100 0 TR03 Elazig-Uluova 1995 770 26 0 0 0 26 0 0 0 0 100 0
United Kingdom UK02 Principal Jurassic Limestones Aquifers 1996 6518 217 0 0 79 121 17 0 0 36 56 8 UK03 Chalk and upper greensand chem 1996 24540 453 0 8 305 132 8 0 2 67 29 2 UK04 Permo triassic sandstones chem 1996 12650 132 0 6 83 43 0 0 5 63 33 0 UK05 Northern Ireland Permo triassic sandstones
chem 1994 789 7 0 0 4 3 0 0 0 57 43 0
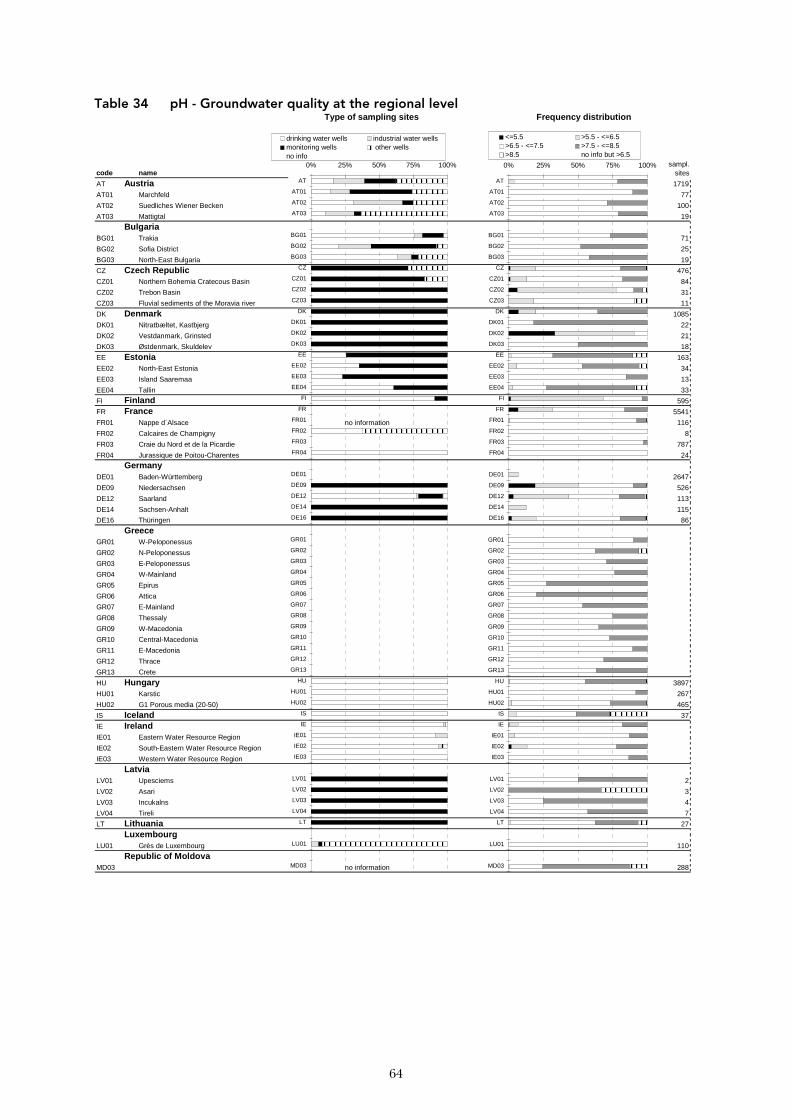
64
Table 34 pH - Groundwater quality at the regional level Type of sampling sites Frequency distribution
code namesampl.
sites
AT Austria 1719
AT01 Marchfeld 77
AT02 Suedliches Wiener Becken 100
AT03 Mattigtal 19
BulgariaBG01 Trakia 71
BG02 Sofia District 25
BG03 North-East Bulgaria 19
CZ Czech Republic 476
CZ01 Northern Bohemia Cratecous Basin 84
CZ02 Trebon Basin 31
CZ03 Fluvial sediments of the Moravia river 11
DK Denmark 1085
DK01 Nitratbæltet, Kastbjerg 22
DK02 Vestdanmark, Grinsted 21
DK03 Østdenmark, Skuldelev 18
EE Estonia 163
EE02 North-East Estonia 34
EE03 Island Saaremaa 13
EE04 Tallin 33
FI Finland 595
FR France 5541
FR01 Nappe d´Alsace no information 116
FR02 Calcaires de Champigny 8
FR03 Craie du Nord et de la Picardie 787
FR04 Jurassique de Poitou-Charentes 24
GermanyDE01 Baden-Württemberg 2647
DE09 Niedersachsen 526
DE12 Saarland 113
DE14 Sachsen-Anhalt 115
DE16 Thüringen 86
GreeceGR01 W-Peloponessus
GR02 N-Peloponessus
GR03 E-Peloponessus
GR04 W-Mainland
GR05 Epirus
GR06 Attica
GR07 E-Mainland
GR08 Thessaly
GR09 W-Macedonia
GR10 Central-Macedonia
GR11 E-Macedonia
GR12 Thrace
GR13 Crete
HU Hungary 3897
HU01 Karstic 267
HU02 G1 Porous media (20-50) 465
IS Iceland 37
IE IrelandIE01 Eastern Water Resource Region
IE02 South-Eastern Water Resource Region
IE03 Western Water Resource Region
LatviaLV01 Upesciems 2
LV02 Asari 3
LV03 Incukalns 4
LV04 Tireli 7
LT Lithuania 27
LuxembourgLU01 Grès de Luxembourg 110
Republic of MoldovaMD03 no information 288
0% 25% 50% 75% 100%
AT
AT01
AT02
AT03
BG01
BG02
BG03
CZ
CZ01
CZ02
CZ03
DK
DK01
DK02
DK03
EE
EE02
EE03
EE04
FI
FR
FR01
FR02
FR03
FR04
DE01
DE09
DE12
DE14
DE16
GR01
GR02
GR03
GR04
GR05
GR06
GR07
GR08
GR09
GR10
GR11
GR12
GR13
HU
HU01
HU02
IS
IE
IE01
IE02
IE03
LV01
LV02
LV03
LV04
LT
LU01
MD03
drinking water wells industrial water wellsmonitoring wells other wellsno info
0% 25% 50% 75% 100%
AT
AT01
AT02
AT03
BG01
BG02
BG03
CZ
CZ01
CZ02
CZ03
DK
DK01
DK02
DK03
EE
EE02
EE03
EE04
FI
FR
FR01
FR02
FR03
FR04
DE01
DE09
DE12
DE14
DE16
GR01
GR02
GR03
GR04
GR05
GR06
GR07
GR08
GR09
GR10
GR11
GR12
GR13
HU
HU01
HU02
IS
IE
IE01
IE02
IE03
LV01
LV02
LV03
LV04
LT
LU01
MD03
<=5.5 >5.5 - <=6.5>6.5 - <=7.5 >7.5 - <=8.5>8.5 no info but >6.5
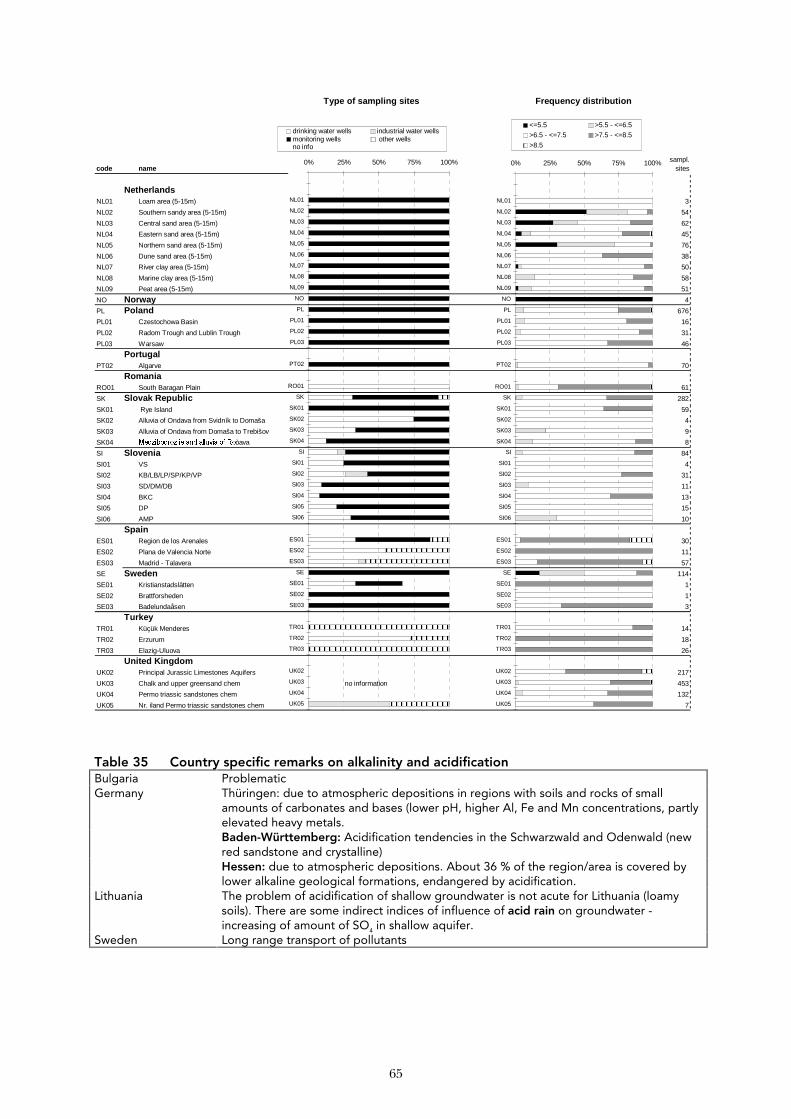
65
Type of sampling sites Frequency distribution
code namesampl.
sites
NetherlandsNL01 Loam area (5-15m) 3
NL02 Southern sandy area (5-15m) 54
NL03 Central sand area (5-15m) 62
NL04 Eastern sand area (5-15m) 45
NL05 Northern sand area (5-15m) 76
NL06 Dune sand area (5-15m) 38
NL07 River clay area (5-15m) 50
NL08 Marine clay area (5-15m) 58
NL09 Peat area (5-15m) 51
NO Norway 4
PL Poland 676
PL01 Czestochowa Basin 16
PL02 Radom Trough and Lublin Trough 31
PL03 Warsaw 46
PortugalPT02 Algarve 70
RomaniaRO01 South Baragan Plain 61
SK Slovak Republic 282
SK01 Rye Island 59
SK02 Alluvia of Ondava from Svidník to Domaša 4
SK03 Alluvia of Ondava from Domaša to Trebišov 9
SK04 0HG]LERGURå LH�DQG�DOOXYLD�RI�5Ròava 8
SI Slovenia 84
SI01 VS 4
SI02 KB/LB/LP/SP/KP/VP 31
SI03 SD/DM/DB 11
SI04 BKC 13
SI05 DP 15
SI06 AMP 10
SpainES01 Region de los Arenales 30
ES02 Plana de Valencia Norte 11
ES03 Madrid - Talavera 57
SE Sweden 114
SE01 Kristianstadslätten 1
SE02 Brattforsheden 1
SE03 Badelundaåsen 3
TurkeyTR01 Küçük Menderes 14
TR02 Erzurum 18
TR03 Elazig-Uluova 26
United KingdomUK02 Principal Jurassic Limestones Aquifers 217
UK03 Chalk and upper greensand chem no information 453
UK04 Permo triassic sandstones chem 132
UK05 Nr. iland Permo triassic sandstones chem 7
0% 25% 50% 75% 100%
NL01
NL02
NL03
NL04
NL05
NL06
NL07
NL08
NL09
NO
PL
PL01
PL02
PL03
PT02
RO01
SK
SK01
SK02
SK03
SK04
SI
SI01
SI02
SI03
SI04
SI05
SI06
ES01
ES02
ES03
SE
SE01
SE02
SE03
TR01
TR02
TR03
UK02
UK03
UK04
UK05
drinking water wells industrial water wellsmonitoring wells other wellsno info
0% 25% 50% 75% 100%
NL01
NL02
NL03
NL04
NL05
NL06
NL07
NL08
NL09
NO
PL
PL01
PL02
PL03
PT02
RO01
SK
SK01
SK02
SK03
SK04
SI
SI01
SI02
SI03
SI04
SI05
SI06
ES01
ES02
ES03
SE
SE01
SE02
SE03
TR01
TR02
TR03
UK02
UK03
UK04
UK05
<=5.5 >5.5 - <=6.5
>6.5 - <=7.5 >7.5 - <=8.5
>8.5
Table 35 Country specific remarks on alkalinity and acidification Bulgaria Problematic Germany Thüringen: due to atmospheric depositions in regions with soils and rocks of small
amounts of carbonates and bases (lower pH, higher Al, Fe and Mn concentrations, partly elevated heavy metals.
Baden-Württemberg: Acidification tendencies in the Schwarzwald and Odenwald (new red sandstone and crystalline)
Hessen: due to atmospheric depositions. About 36 % of the region/area is covered by lower alkaline geological formations, endangered by acidification.
Lithuania The problem of acidification of shallow groundwater is not acute for Lithuania (loamy soils). There are some indirect indices of influence of acid rain on groundwater - increasing of amount of SO4 in shallow aquifer.
Sweden Long range transport of pollutants
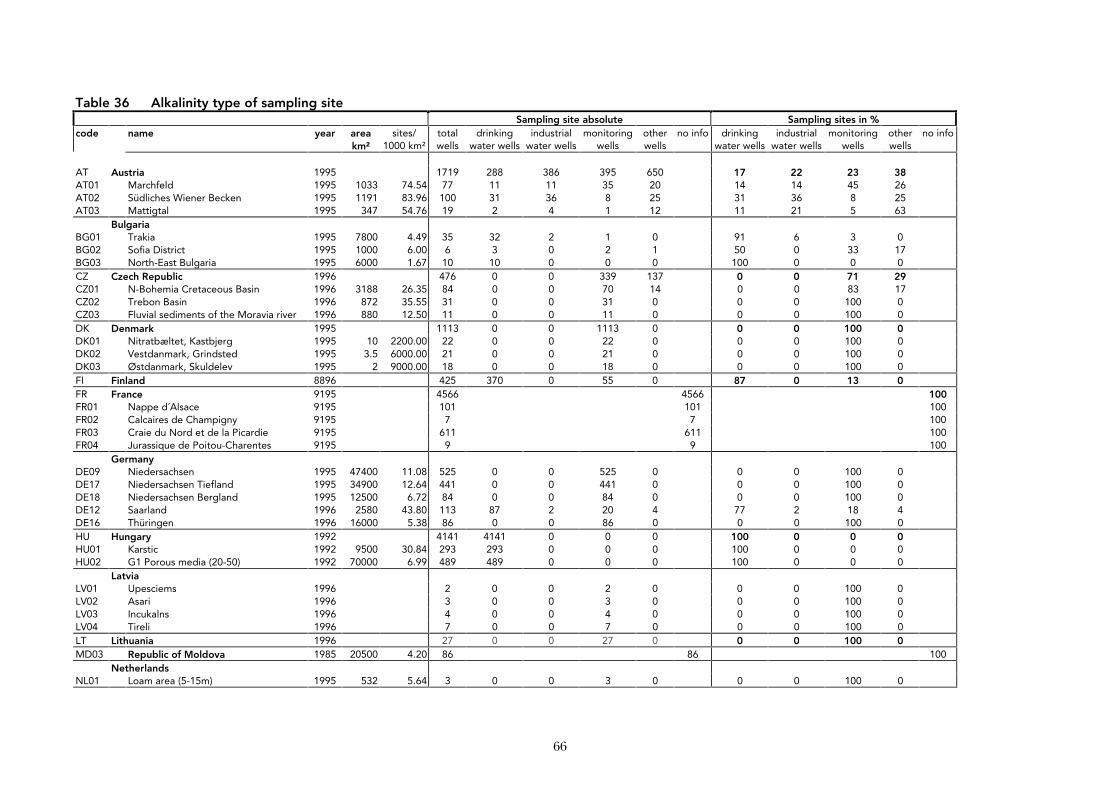
66
Table 36 Alkalinity type of sampling site Sampling site absolute Sampling sites in %
code name year area km²
sites/ 1000 km²
total wells
drinking water wells
industrial water wells
monitoring wells
other wells
no info drinking water wells
industrial water wells
monitoring wells
other wells
no info
AT Austria 1995 1719 288 386 395 650 17 22 23 38 AT01 Marchfeld 1995 1033 74.54 77 11 11 35 20 14 14 45 26 AT02 Südliches Wiener Becken 1995 1191 83.96 100 31 36 8 25 31 36 8 25 AT03 Mattigtal 1995 347 54.76 19 2 4 1 12 11 21 5 63
Bulgaria BG01 Trakia 1995 7800 4.49 35 32 2 1 0 91 6 3 0 BG02 Sofia District 1995 1000 6.00 6 3 0 2 1 50 0 33 17 BG03 North-East Bulgaria 1995 6000 1.67 10 10 0 0 0 100 0 0 0 CZ Czech Republic 1996 476 0 0 339 137 0 0 71 29 CZ01 N-Bohemia Cretaceous Basin 1996 3188 26.35 84 0 0 70 14 0 0 83 17 CZ02 Trebon Basin 1996 872 35.55 31 0 0 31 0 0 0 100 0 CZ03 Fluvial sediments of the Moravia river 1996 880 12.50 11 0 0 11 0 0 0 100 0 DK Denmark 1995 1113 0 0 1113 0 0 0 100 0 DK01 Nitratbæltet, Kastbjerg 1995 10 2200.00 22 0 0 22 0 0 0 100 0 DK02 Vestdanmark, Grindsted 1995 3.5 6000.00 21 0 0 21 0 0 0 100 0 DK03 Østdanmark, Skuldelev 1995 2 9000.00 18 0 0 18 0 0 0 100 0 FI Finland 8896 425 370 0 55 0 87 0 13 0 FR France 9195 4566 4566 100 FR01 Nappe d´Alsace 9195 101 101 100 FR02 Calcaires de Champigny 9195 7 7 100 FR03 Craie du Nord et de la Picardie 9195 611 611 100 FR04 Jurassique de Poitou-Charentes 9195 9 9 100
Germany DE09 Niedersachsen 1995 47400 11.08 525 0 0 525 0 0 0 100 0 DE17 Niedersachsen Tiefland 1995 34900 12.64 441 0 0 441 0 0 0 100 0 DE18 Niedersachsen Bergland 1995 12500 6.72 84 0 0 84 0 0 0 100 0 DE12 Saarland 1996 2580 43.80 113 87 2 20 4 77 2 18 4 DE16 Thüringen 1996 16000 5.38 86 0 0 86 0 0 0 100 0 HU Hungary 1992 4141 4141 0 0 0 100 0 0 0 HU01 Karstic 1992 9500 30.84 293 293 0 0 0 100 0 0 0 HU02 G1 Porous media (20-50) 1992 70000 6.99 489 489 0 0 0 100 0 0 0
Latvia LV01 Upesciems 1996 2 0 0 2 0 0 0 100 0 LV02 Asari 1996 3 0 0 3 0 0 0 100 0 LV03 Incukalns 1996 4 0 0 4 0 0 0 100 0 LV04 Tireli 1996 7 0 0 7 0 0 0 100 0 LT Lithuania 1996 27 0 0 27 0 0 0 100 0 MD03 Republic of Moldova 1985 20500 4.20 86 86 100
Netherlands NL01 Loam area (5-15m) 1995 532 5.64 3 0 0 3 0 0 0 100 0
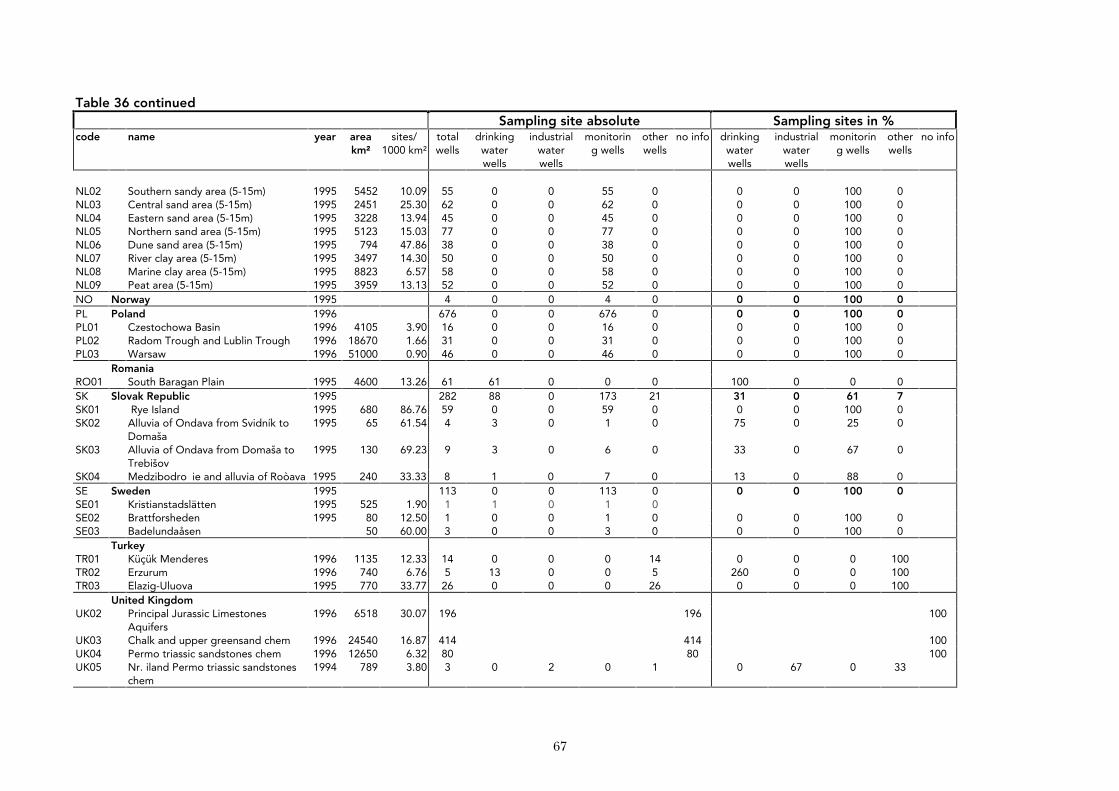
67
Table 36 continued Sampling site absolute Sampling sites in %
code name year area km²
sites/ 1000 km²
total wells
drinking water wells
industrial water wells
monitoring wells
other wells
no info drinking water wells
industrial water wells
monitoring wells
other wells
no info
NL02 Southern sandy area (5-15m) 1995 5452 10.09 55 0 0 55 0 0 0 100 0 NL03 Central sand area (5-15m) 1995 2451 25.30 62 0 0 62 0 0 0 100 0 NL04 Eastern sand area (5-15m) 1995 3228 13.94 45 0 0 45 0 0 0 100 0 NL05 Northern sand area (5-15m) 1995 5123 15.03 77 0 0 77 0 0 0 100 0 NL06 Dune sand area (5-15m) 1995 794 47.86 38 0 0 38 0 0 0 100 0 NL07 River clay area (5-15m) 1995 3497 14.30 50 0 0 50 0 0 0 100 0 NL08 Marine clay area (5-15m) 1995 8823 6.57 58 0 0 58 0 0 0 100 0 NL09 Peat area (5-15m) 1995 3959 13.13 52 0 0 52 0 0 0 100 0 NO Norway 1995 4 0 0 4 0 0 0 100 0 PL Poland 1996 676 0 0 676 0 0 0 100 0 PL01 Czestochowa Basin 1996 4105 3.90 16 0 0 16 0 0 0 100 0 PL02 Radom Trough and Lublin Trough 1996 18670 1.66 31 0 0 31 0 0 0 100 0 PL03 Warsaw 1996 51000 0.90 46 0 0 46 0 0 0 100 0
Romania RO01 South Baragan Plain 1995 4600 13.26 61 61 0 0 0 100 0 0 0 SK Slovak Republic 1995 282 88 0 173 21 31 0 61 7 SK01 Rye Island 1995 680 86.76 59 0 0 59 0 0 0 100 0 SK02 Alluvia of Ondava from Svidník to
Domaša 1995 65 61.54 4 3 0 1 0 75 0 25 0
SK03 Alluvia of Ondava from Domaša to Trebišov
1995 130 69.23 9 3 0 6 0 33 0 67 0
SK04 Medzibodro ie and alluvia of Roòava 1995 240 33.33 8 1 0 7 0 13 0 88 0 SE Sweden 1995 113 0 0 113 0 0 0 100 0 SE01 Kristianstadslätten 1995 525 1.90 1 1 0 1 0 SE02 Brattforsheden 1995 80 12.50 1 0 0 1 0 0 0 100 0 SE03 Badelundaåsen 50 60.00 3 0 0 3 0 0 0 100 0
Turkey TR01 Küçük Menderes 1996 1135 12.33 14 0 0 0 14 0 0 0 100 TR02 Erzurum 1996 740 6.76 5 13 0 0 5 260 0 0 100 TR03 Elazig-Uluova 1995 770 33.77 26 0 0 0 26 0 0 0 100
United Kingdom UK02 Principal Jurassic Limestones
Aquifers 1996 6518 30.07 196 196 100
UK03 Chalk and upper greensand chem 1996 24540 16.87 414 414 100 UK04 Permo triassic sandstones chem 1996 12650 6.32 80 80 100 UK05 Nr. iland Permo triassic sandstones
chem 1994 789 3.80 3 0 2 0 1 0 67 0 33
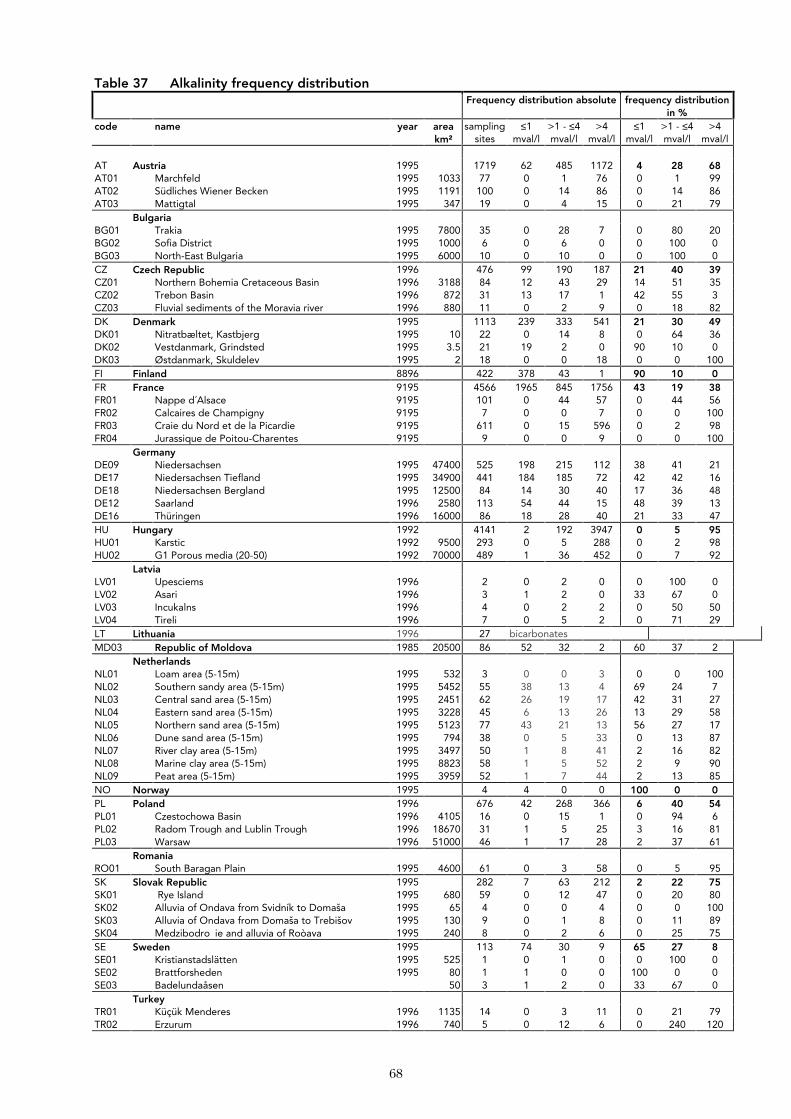
68
Table 37 Alkalinity frequency distribution Frequency distribution absolute frequency distribution
in % code name year area
km² sampling
sites ≤1
mval/l >1 - ≤4 mval/l
>4 mval/l
≤1 mval/l
>1 - ≤4 mval/l
>4 mval/l
AT Austria 1995 1719 62 485 1172 4 28 68 AT01 Marchfeld 1995 1033 77 0 1 76 0 1 99 AT02 Südliches Wiener Becken 1995 1191 100 0 14 86 0 14 86 AT03 Mattigtal 1995 347 19 0 4 15 0 21 79
Bulgaria BG01 Trakia 1995 7800 35 0 28 7 0 80 20 BG02 Sofia District 1995 1000 6 0 6 0 0 100 0 BG03 North-East Bulgaria 1995 6000 10 0 10 0 0 100 0 CZ Czech Republic 1996 476 99 190 187 21 40 39 CZ01 Northern Bohemia Cretaceous Basin 1996 3188 84 12 43 29 14 51 35 CZ02 Trebon Basin 1996 872 31 13 17 1 42 55 3 CZ03 Fluvial sediments of the Moravia river 1996 880 11 0 2 9 0 18 82 DK Denmark 1995 1113 239 333 541 21 30 49 DK01 Nitratbæltet, Kastbjerg 1995 10 22 0 14 8 0 64 36 DK02 Vestdanmark, Grindsted 1995 3.5 21 19 2 0 90 10 0 DK03 Østdanmark, Skuldelev 1995 2 18 0 0 18 0 0 100 FI Finland 8896 422 378 43 1 90 10 0 FR France 9195 4566 1965 845 1756 43 19 38 FR01 Nappe d´Alsace 9195 101 0 44 57 0 44 56 FR02 Calcaires de Champigny 9195 7 0 0 7 0 0 100 FR03 Craie du Nord et de la Picardie 9195 611 0 15 596 0 2 98 FR04 Jurassique de Poitou-Charentes 9195 9 0 0 9 0 0 100
Germany DE09 Niedersachsen 1995 47400 525 198 215 112 38 41 21 DE17 Niedersachsen Tiefland 1995 34900 441 184 185 72 42 42 16 DE18 Niedersachsen Bergland 1995 12500 84 14 30 40 17 36 48 DE12 Saarland 1996 2580 113 54 44 15 48 39 13 DE16 Thüringen 1996 16000 86 18 28 40 21 33 47 HU Hungary 1992 4141 2 192 3947 0 5 95 HU01 Karstic 1992 9500 293 0 5 288 0 2 98 HU02 G1 Porous media (20-50) 1992 70000 489 1 36 452 0 7 92
Latvia LV01 Upesciems 1996 2 0 2 0 0 100 0 LV02 Asari 1996 3 1 2 0 33 67 0 LV03 Incukalns 1996 4 0 2 2 0 50 50 LV04 Tireli 1996 7 0 5 2 0 71 29 LT Lithuania 1996 27 bicarbonates MD03 Republic of Moldova 1985 20500 86 52 32 2 60 37 2
Netherlands NL01 Loam area (5-15m) 1995 532 3 0 0 3 0 0 100 NL02 Southern sandy area (5-15m) 1995 5452 55 38 13 4 69 24 7 NL03 Central sand area (5-15m) 1995 2451 62 26 19 17 42 31 27 NL04 Eastern sand area (5-15m) 1995 3228 45 6 13 26 13 29 58 NL05 Northern sand area (5-15m) 1995 5123 77 43 21 13 56 27 17 NL06 Dune sand area (5-15m) 1995 794 38 0 5 33 0 13 87 NL07 River clay area (5-15m) 1995 3497 50 1 8 41 2 16 82 NL08 Marine clay area (5-15m) 1995 8823 58 1 5 52 2 9 90 NL09 Peat area (5-15m) 1995 3959 52 1 7 44 2 13 85 NO Norway 1995 4 4 0 0 100 0 0 PL Poland 1996 676 42 268 366 6 40 54 PL01 Czestochowa Basin 1996 4105 16 0 15 1 0 94 6 PL02 Radom Trough and Lublin Trough 1996 18670 31 1 5 25 3 16 81 PL03 Warsaw 1996 51000 46 1 17 28 2 37 61
Romania RO01 South Baragan Plain 1995 4600 61 0 3 58 0 5 95 SK Slovak Republic 1995 282 7 63 212 2 22 75 SK01 Rye Island 1995 680 59 0 12 47 0 20 80 SK02 Alluvia of Ondava from Svidník to Domaša 1995 65 4 0 0 4 0 0 100 SK03 Alluvia of Ondava from Domaša to Trebišov 1995 130 9 0 1 8 0 11 89 SK04 Medzibodro ie and alluvia of Roòava 1995 240 8 0 2 6 0 25 75 SE Sweden 1995 113 74 30 9 65 27 8 SE01 Kristianstadslätten 1995 525 1 0 1 0 0 100 0 SE02 Brattforsheden 1995 80 1 1 0 0 100 0 0 SE03 Badelundaåsen 50 3 1 2 0 33 67 0
Turkey TR01 Küçük Menderes 1996 1135 14 0 3 11 0 21 79 TR02 Erzurum 1996 740 5 0 12 6 0 240 120
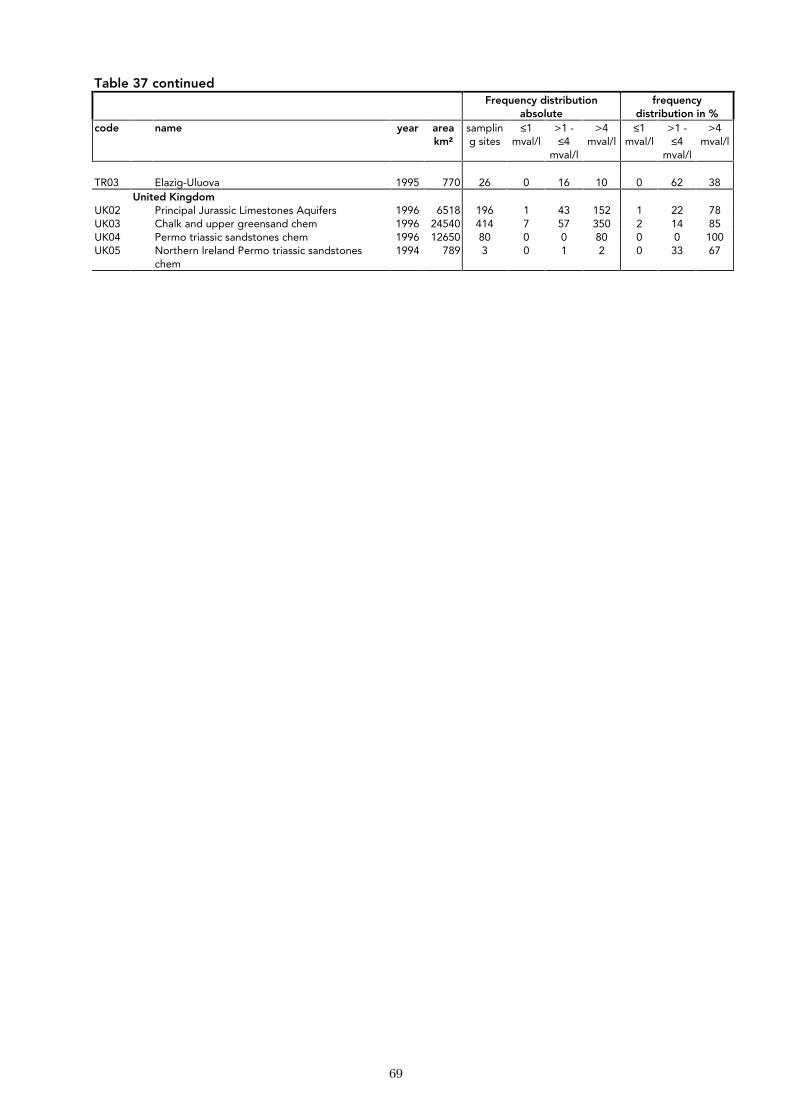
69
Table 37 continued Frequency distribution
absolute frequency
distribution in % code name year area
km² sampling sites
≤1 mval/l
>1 - ≤4
mval/l
>4 mval/l
≤1 mval/l
>1 - ≤4
mval/l
>4 mval/l
TR03 Elazig-Uluova 1995 770 26 0 16 10 0 62 38
United Kingdom UK02 Principal Jurassic Limestones Aquifers 1996 6518 196 1 43 152 1 22 78 UK03 Chalk and upper greensand chem 1996 24540 414 7 57 350 2 14 85 UK04 Permo triassic sandstones chem 1996 12650 80 0 0 80 0 0 100 UK05 Northern Ireland Permo triassic sandstones
chem 1994 789 3 0 1 2 0 33 67
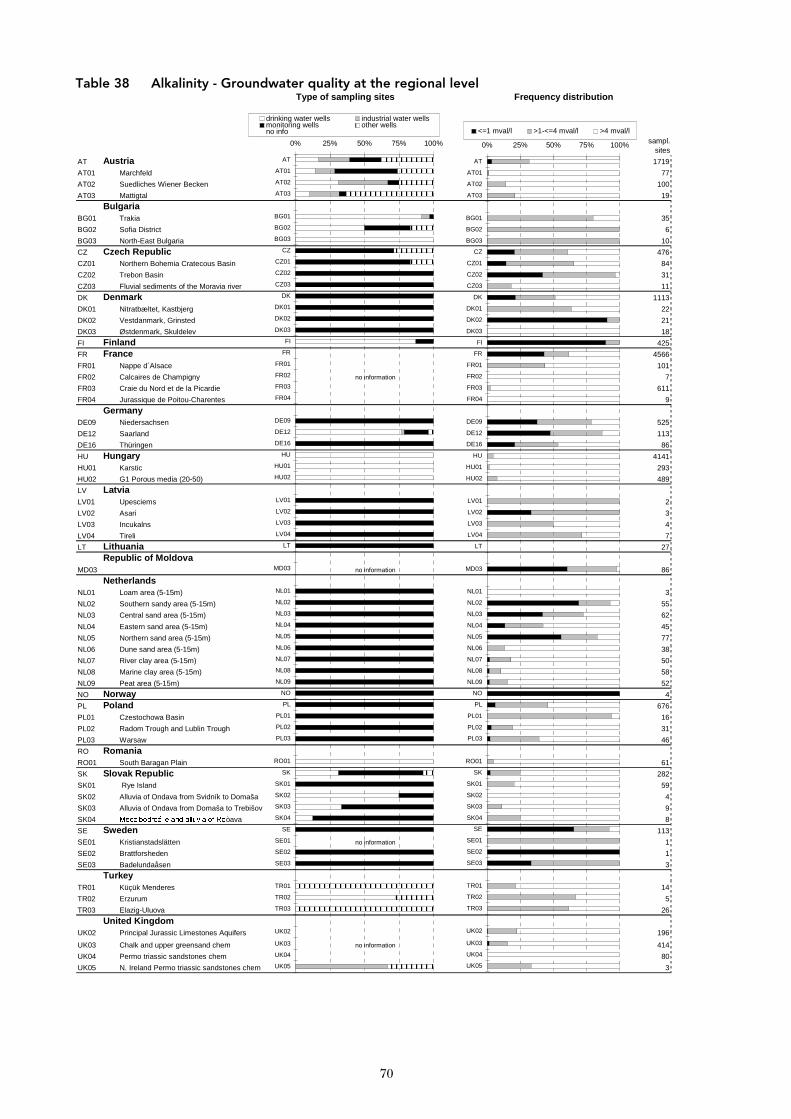
70
Table 38 Alkalinity - Groundwater quality at the regional level Type of sampling sites Frequency distribution
sampl. sites
AT Austria 1719
AT01 Marchfeld 77
AT02 Suedliches Wiener Becken 100
AT03 Mattigtal 19
BulgariaBG01 Trakia 35
BG02 Sofia District 6
BG03 North-East Bulgaria 10
CZ Czech Republic 476
CZ01 Northern Bohemia Cratecous Basin 84
CZ02 Trebon Basin 31
CZ03 Fluvial sediments of the Moravia river 11
DK Denmark 1113
DK01 Nitratbæltet, Kastbjerg 22
DK02 Vestdanmark, Grinsted 21
DK03 Østdenmark, Skuldelev 18
FI Finland 425
FR France 4566
FR01 Nappe d´Alsace 101
FR02 Calcaires de Champigny no information 7
FR03 Craie du Nord et de la Picardie 611
FR04 Jurassique de Poitou-Charentes 9
GermanyDE09 Niedersachsen 525
DE12 Saarland 113
DE16 Thüringen 86
HU Hungary 4141
HU01 Karstic 293
HU02 G1 Porous media (20-50) 489
LV LatviaLV01 Upesciems 2
LV02 Asari 3
LV03 Incukalns 4
LV04 Tireli 7
LT Lithuania 27
Republic of MoldovaMD03 no information 86
NetherlandsNL01 Loam area (5-15m) 3
NL02 Southern sandy area (5-15m) 55
NL03 Central sand area (5-15m) 62
NL04 Eastern sand area (5-15m) 45
NL05 Northern sand area (5-15m) 77
NL06 Dune sand area (5-15m) 38
NL07 River clay area (5-15m) 50
NL08 Marine clay area (5-15m) 58
NL09 Peat area (5-15m) 52
NO Norway 4
PL Poland 676
PL01 Czestochowa Basin 16
PL02 Radom Trough and Lublin Trough 31
PL03 Warsaw 46
RO RomaniaRO01 South Baragan Plain 61
SK Slovak Republic 282
SK01 Rye Island 59
SK02 Alluvia of Ondava from Svidník to Domaša 4
SK03 Alluvia of Ondava from Domaša to Trebišov 9
SK04 0HG]LERGURå LH�DQG�DOOXYLD�RI�5Ròava 8
SE Sweden 113
SE01 Kristianstadslätten no information 1
SE02 Brattforsheden 1
SE03 Badelundaåsen 3
TurkeyTR01 Küçük Menderes 14
TR02 Erzurum 5
TR03 Elazig-Uluova 26
United KingdomUK02 Principal Jurassic Limestones Aquifers 196
0% 25% 50% 75% 100%
AT
AT01
AT02
AT03
BG01
BG02
BG03
CZ
CZ01
CZ02
CZ03
DK
DK01
DK02
DK03
FI
FR
FR01
FR02
FR03
FR04
DE09
DE12
DE16
HU
HU01
HU02
LV01
LV02
LV03
LV04
LT
MD03
NL01
NL02
NL03
NL04
NL05
NL06
NL07
NL08
NL09
NO
PL
PL01
PL02
PL03
RO01
SK
SK01
SK02
SK03
SK04
SE
SE01
SE02
SE03
TR01
TR02
TR03
UK02
drinking water wells industrial water wellsmonitoring wells other wellsno info
0% 25% 50% 75% 100%
AT
AT01
AT02
AT03
BG01
BG02
BG03
CZ
CZ01
CZ02
CZ03
DK
DK01
DK02
DK03
FI
FR
FR01
FR02
FR03
FR04
DE09
DE12
DE16
HU
HU01
HU02
LV01
LV02
LV03
LV04
LT
MD03
NL01
NL02
NL03
NL04
NL05
NL06
NL07
NL08
NL09
NO
PL
PL01
PL02
PL03
RO01
SK
SK01
SK02
SK03
SK04
SE
SE01
SE02
SE03
TR01
TR02
TR03
UK02
<=1 mval/l >1-<=4 mval/l >4 mval/l
UK03 Chalk and upper greensand chem no information 414
UK04 Permo triassic sandstones chem 80
UK05 N. Ireland Permo triassic sandstones chem 3
UK03
UK04
UK05
UK03
UK04
UK05
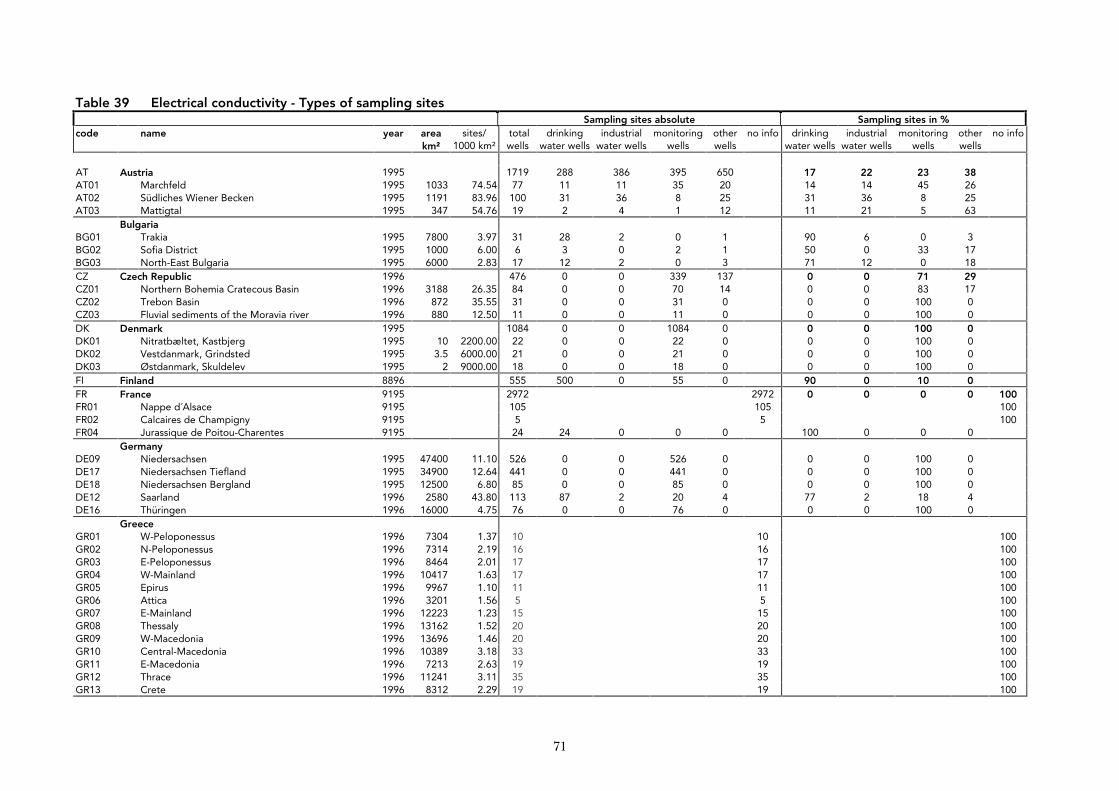
71
Table 39 Electrical conductivity - Types of sampling sites Sampling sites absolute Sampling sites in %
code name year area km²
sites/ 1000 km²
total wells
drinking water wells
industrial water wells
monitoring wells
other wells
no info drinking water wells
industrial water wells
monitoring wells
other wells
no info
AT Austria 1995 1719 288 386 395 650 17 22 23 38 AT01 Marchfeld 1995 1033 74.54 77 11 11 35 20 14 14 45 26 AT02 Südliches Wiener Becken 1995 1191 83.96 100 31 36 8 25 31 36 8 25 AT03 Mattigtal 1995 347 54.76 19 2 4 1 12 11 21 5 63
Bulgaria BG01 Trakia 1995 7800 3.97 31 28 2 0 1 90 6 0 3 BG02 Sofia District 1995 1000 6.00 6 3 0 2 1 50 0 33 17 BG03 North-East Bulgaria 1995 6000 2.83 17 12 2 0 3 71 12 0 18 CZ Czech Republic 1996 476 0 0 339 137 0 0 71 29 CZ01 Northern Bohemia Cratecous Basin 1996 3188 26.35 84 0 0 70 14 0 0 83 17 CZ02 Trebon Basin 1996 872 35.55 31 0 0 31 0 0 0 100 0 CZ03 Fluvial sediments of the Moravia river 1996 880 12.50 11 0 0 11 0 0 0 100 0 DK Denmark 1995 1084 0 0 1084 0 0 0 100 0 DK01 Nitratbæltet, Kastbjerg 1995 10 2200.00 22 0 0 22 0 0 0 100 0 DK02 Vestdanmark, Grindsted 1995 3.5 6000.00 21 0 0 21 0 0 0 100 0 DK03 Østdanmark, Skuldelev 1995 2 9000.00 18 0 0 18 0 0 0 100 0 FI Finland 8896 555 500 0 55 0 90 0 10 0 FR France 9195 2972 2972 0 0 0 0 100 FR01 Nappe d´Alsace 9195 105 105 100 FR02 Calcaires de Champigny 9195 5 5 100 FR04 Jurassique de Poitou-Charentes 9195 24 24 0 0 0 100 0 0 0
Germany DE09 Niedersachsen 1995 47400 11.10 526 0 0 526 0 0 0 100 0 DE17 Niedersachsen Tiefland 1995 34900 12.64 441 0 0 441 0 0 0 100 0 DE18 Niedersachsen Bergland 1995 12500 6.80 85 0 0 85 0 0 0 100 0 DE12 Saarland 1996 2580 43.80 113 87 2 20 4 77 2 18 4 DE16 Thüringen 1996 16000 4.75 76 0 0 76 0 0 0 100 0
Greece GR01 W-Peloponessus 1996 7304 1.37 10 10 100 GR02 N-Peloponessus 1996 7314 2.19 16 16 100 GR03 E-Peloponessus 1996 8464 2.01 17 17 100 GR04 W-Mainland 1996 10417 1.63 17 17 100 GR05 Epirus 1996 9967 1.10 11 11 100 GR06 Attica 1996 3201 1.56 5 5 100 GR07 E-Mainland 1996 12223 1.23 15 15 100 GR08 Thessaly 1996 13162 1.52 20 20 100 GR09 W-Macedonia 1996 13696 1.46 20 20 100 GR10 Central-Macedonia 1996 10389 3.18 33 33 100 GR11 E-Macedonia 1996 7213 2.63 19 19 100 GR12 Thrace 1996 11241 3.11 35 35 100 GR13 Crete 1996 8312 2.29 19 19 100
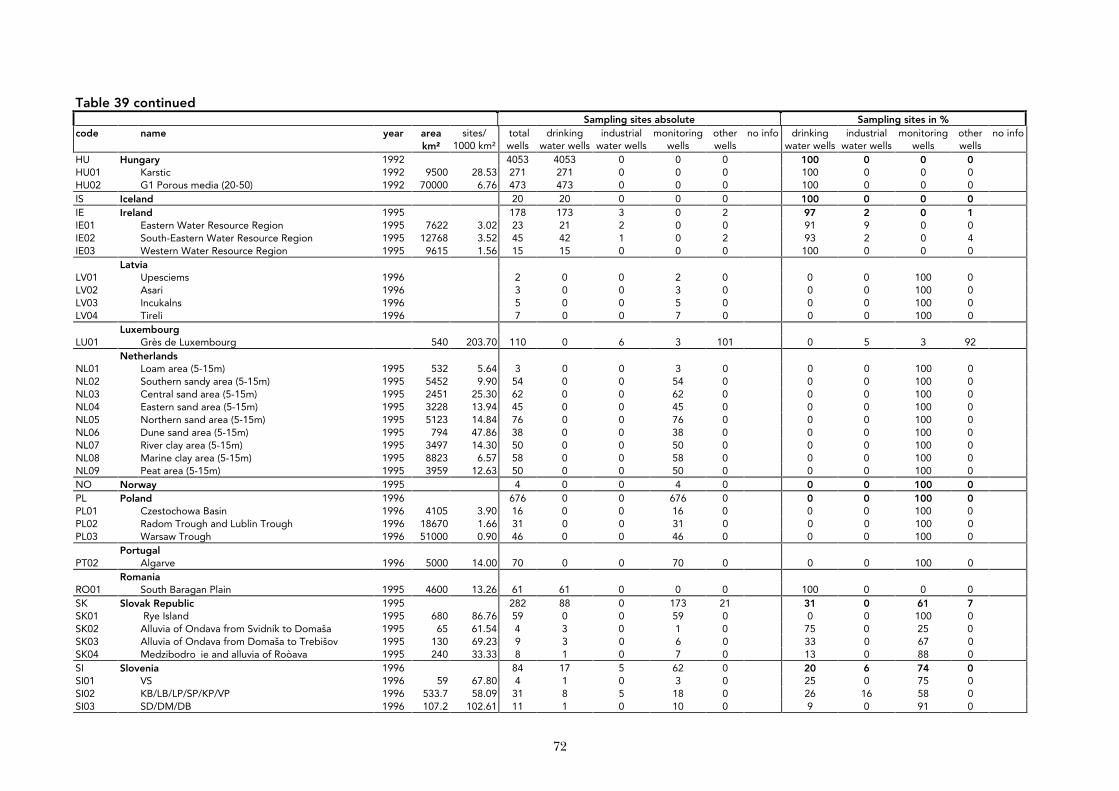
72
Table 39 continued Sampling sites absolute Sampling sites in %
code name year area km²
sites/ 1000 km²
total wells
drinking water wells
industrial water wells
monitoring wells
other wells
no info drinking water wells
industrial water wells
monitoring wells
other wells
no info
HU Hungary 1992 4053 4053 0 0 0 100 0 0 0 HU01 Karstic 1992 9500 28.53 271 271 0 0 0 100 0 0 0 HU02 G1 Porous media (20-50) 1992 70000 6.76 473 473 0 0 0 100 0 0 0 IS Iceland 20 20 0 0 0 100 0 0 0 IE Ireland 1995 178 173 3 0 2 97 2 0 1 IE01 Eastern Water Resource Region 1995 7622 3.02 23 21 2 0 0 91 9 0 0 IE02 South-Eastern Water Resource Region 1995 12768 3.52 45 42 1 0 2 93 2 0 4 IE03 Western Water Resource Region 1995 9615 1.56 15 15 0 0 0 100 0 0 0
Latvia LV01 Upesciems 1996 2 0 0 2 0 0 0 100 0 LV02 Asari 1996 3 0 0 3 0 0 0 100 0 LV03 Incukalns 1996 5 0 0 5 0 0 0 100 0 LV04 Tireli 1996 7 0 0 7 0 0 0 100 0
Luxembourg LU01 Grès de Luxembourg 540 203.70 110 0 6 3 101 0 5 3 92
Netherlands NL01 Loam area (5-15m) 1995 532 5.64 3 0 0 3 0 0 0 100 0 NL02 Southern sandy area (5-15m) 1995 5452 9.90 54 0 0 54 0 0 0 100 0 NL03 Central sand area (5-15m) 1995 2451 25.30 62 0 0 62 0 0 0 100 0 NL04 Eastern sand area (5-15m) 1995 3228 13.94 45 0 0 45 0 0 0 100 0 NL05 Northern sand area (5-15m) 1995 5123 14.84 76 0 0 76 0 0 0 100 0 NL06 Dune sand area (5-15m) 1995 794 47.86 38 0 0 38 0 0 0 100 0 NL07 River clay area (5-15m) 1995 3497 14.30 50 0 0 50 0 0 0 100 0 NL08 Marine clay area (5-15m) 1995 8823 6.57 58 0 0 58 0 0 0 100 0 NL09 Peat area (5-15m) 1995 3959 12.63 50 0 0 50 0 0 0 100 0 NO Norway 1995 4 0 0 4 0 0 0 100 0 PL Poland 1996 676 0 0 676 0 0 0 100 0 PL01 Czestochowa Basin 1996 4105 3.90 16 0 0 16 0 0 0 100 0 PL02 Radom Trough and Lublin Trough 1996 18670 1.66 31 0 0 31 0 0 0 100 0 PL03 Warsaw Trough 1996 51000 0.90 46 0 0 46 0 0 0 100 0
Portugal PT02 Algarve 1996 5000 14.00 70 0 0 70 0 0 0 100 0
Romania RO01 South Baragan Plain 1995 4600 13.26 61 61 0 0 0 100 0 0 0 SK Slovak Republic 1995 282 88 0 173 21 31 0 61 7 SK01 Rye Island 1995 680 86.76 59 0 0 59 0 0 0 100 0 SK02 Alluvia of Ondava from Svidník to Domaša 1995 65 61.54 4 3 0 1 0 75 0 25 0 SK03 Alluvia of Ondava from Domaša to Trebišov 1995 130 69.23 9 3 0 6 0 33 0 67 0 SK04 Medzibodro ie and alluvia of Roòava 1995 240 33.33 8 1 0 7 0 13 0 88 0 SI Slovenia 1996 84 17 5 62 0 20 6 74 0 SI01 VS 1996 59 67.80 4 1 0 3 0 25 0 75 0 SI02 KB/LB/LP/SP/KP/VP 1996 533.7 58.09 31 8 5 18 0 26 16 58 0 SI03 SD/DM/DB 1996 107.2 102.61 11 1 0 10 0 9 0 91 0
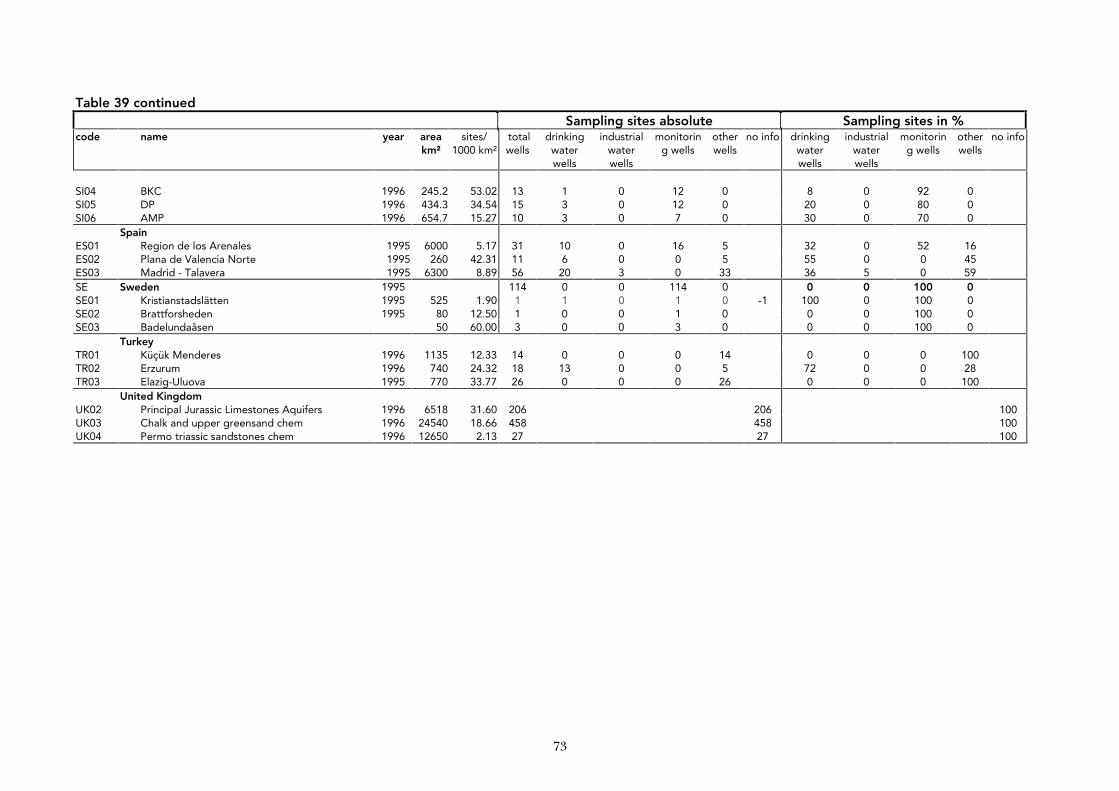
73
Table 39 continued Sampling sites absolute Sampling sites in %
code name year area km²
sites/ 1000 km²
total wells
drinking water wells
industrial water wells
monitoring wells
other wells
no info drinking water wells
industrial water wells
monitoring wells
other wells
no info
SI04 BKC 1996 245.2 53.02 13 1 0 12 0 8 0 92 0 SI05 DP 1996 434.3 34.54 15 3 0 12 0 20 0 80 0 SI06 AMP 1996 654.7 15.27 10 3 0 7 0 30 0 70 0
Spain ES01 Region de los Arenales 1995 6000 5.17 31 10 0 16 5 32 0 52 16 ES02 Plana de Valencia Norte 1995 260 42.31 11 6 0 0 5 55 0 0 45 ES03 Madrid - Talavera 1995 6300 8.89 56 20 3 0 33 36 5 0 59 SE Sweden 1995 114 0 0 114 0 0 0 100 0 SE01 Kristianstadslätten 1995 525 1.90 1 1 0 1 0 -1 100 0 100 0 SE02 Brattforsheden 1995 80 12.50 1 0 0 1 0 0 0 100 0 SE03 Badelundaåsen 50 60.00 3 0 0 3 0 0 0 100 0
Turkey TR01 Küçük Menderes 1996 1135 12.33 14 0 0 0 14 0 0 0 100 TR02 Erzurum 1996 740 24.32 18 13 0 0 5 72 0 0 28 TR03 Elazig-Uluova 1995 770 33.77 26 0 0 0 26 0 0 0 100
United Kingdom UK02 Principal Jurassic Limestones Aquifers 1996 6518 31.60 206 206 100 UK03 Chalk and upper greensand chem 1996 24540 18.66 458 458 100 UK04 Permo triassic sandstones chem 1996 12650 2.13 27 27 100
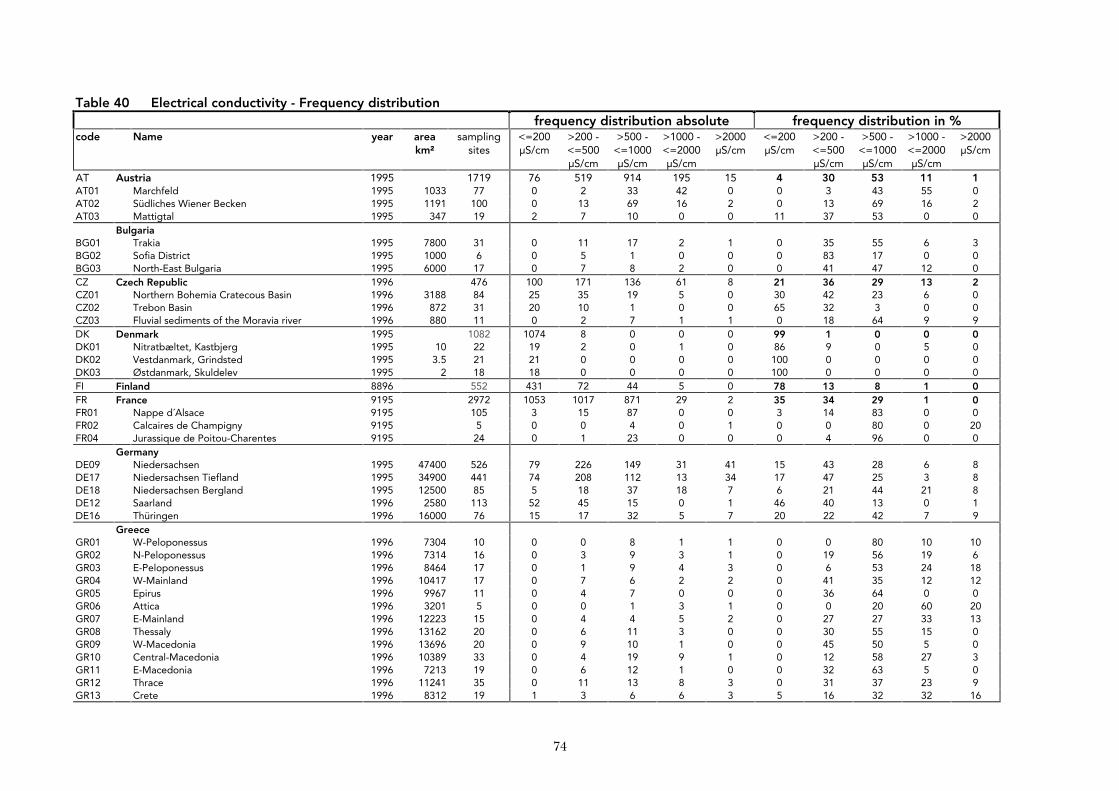
74
Table 40 Electrical conductivity - Frequency distribution frequency distribution absolute frequency distribution in %
code Name year area km²
sampling sites
<=200 µS/cm
>200 - <=500 µS/cm
>500 - <=1000 µS/cm
>1000 - <=2000 µS/cm
>2000 µS/cm
<=200 µS/cm
>200 - <=500 µS/cm
>500 - <=1000 µS/cm
>1000 - <=2000 µS/cm
>2000 µS/cm
AT Austria 1995 1719 76 519 914 195 15 4 30 53 11 1 AT01 Marchfeld 1995 1033 77 0 2 33 42 0 0 3 43 55 0 AT02 Südliches Wiener Becken 1995 1191 100 0 13 69 16 2 0 13 69 16 2 AT03 Mattigtal 1995 347 19 2 7 10 0 0 11 37 53 0 0
Bulgaria BG01 Trakia 1995 7800 31 0 11 17 2 1 0 35 55 6 3 BG02 Sofia District 1995 1000 6 0 5 1 0 0 0 83 17 0 0 BG03 North-East Bulgaria 1995 6000 17 0 7 8 2 0 0 41 47 12 0 CZ Czech Republic 1996 476 100 171 136 61 8 21 36 29 13 2 CZ01 Northern Bohemia Cratecous Basin 1996 3188 84 25 35 19 5 0 30 42 23 6 0 CZ02 Trebon Basin 1996 872 31 20 10 1 0 0 65 32 3 0 0 CZ03 Fluvial sediments of the Moravia river 1996 880 11 0 2 7 1 1 0 18 64 9 9 DK Denmark 1995 1082 1074 8 0 0 0 99 1 0 0 0 DK01 Nitratbæltet, Kastbjerg 1995 10 22 19 2 0 1 0 86 9 0 5 0 DK02 Vestdanmark, Grindsted 1995 3.5 21 21 0 0 0 0 100 0 0 0 0 DK03 Østdanmark, Skuldelev 1995 2 18 18 0 0 0 0 100 0 0 0 0 FI Finland 8896 552 431 72 44 5 0 78 13 8 1 0 FR France 9195 2972 1053 1017 871 29 2 35 34 29 1 0 FR01 Nappe d´Alsace 9195 105 3 15 87 0 0 3 14 83 0 0 FR02 Calcaires de Champigny 9195 5 0 0 4 0 1 0 0 80 0 20 FR04 Jurassique de Poitou-Charentes 9195 24 0 1 23 0 0 0 4 96 0 0
Germany DE09 Niedersachsen 1995 47400 526 79 226 149 31 41 15 43 28 6 8 DE17 Niedersachsen Tiefland 1995 34900 441 74 208 112 13 34 17 47 25 3 8 DE18 Niedersachsen Bergland 1995 12500 85 5 18 37 18 7 6 21 44 21 8 DE12 Saarland 1996 2580 113 52 45 15 0 1 46 40 13 0 1 DE16 Thüringen 1996 16000 76 15 17 32 5 7 20 22 42 7 9
Greece GR01 W-Peloponessus 1996 7304 10 0 0 8 1 1 0 0 80 10 10 GR02 N-Peloponessus 1996 7314 16 0 3 9 3 1 0 19 56 19 6 GR03 E-Peloponessus 1996 8464 17 0 1 9 4 3 0 6 53 24 18 GR04 W-Mainland 1996 10417 17 0 7 6 2 2 0 41 35 12 12 GR05 Epirus 1996 9967 11 0 4 7 0 0 0 36 64 0 0 GR06 Attica 1996 3201 5 0 0 1 3 1 0 0 20 60 20 GR07 E-Mainland 1996 12223 15 0 4 4 5 2 0 27 27 33 13 GR08 Thessaly 1996 13162 20 0 6 11 3 0 0 30 55 15 0 GR09 W-Macedonia 1996 13696 20 0 9 10 1 0 0 45 50 5 0 GR10 Central-Macedonia 1996 10389 33 0 4 19 9 1 0 12 58 27 3 GR11 E-Macedonia 1996 7213 19 0 6 12 1 0 0 32 63 5 0 GR12 Thrace 1996 11241 35 0 11 13 8 3 0 31 37 23 9 GR13 Crete 1996 8312 19 1 3 6 6 3 5 16 32 32 16
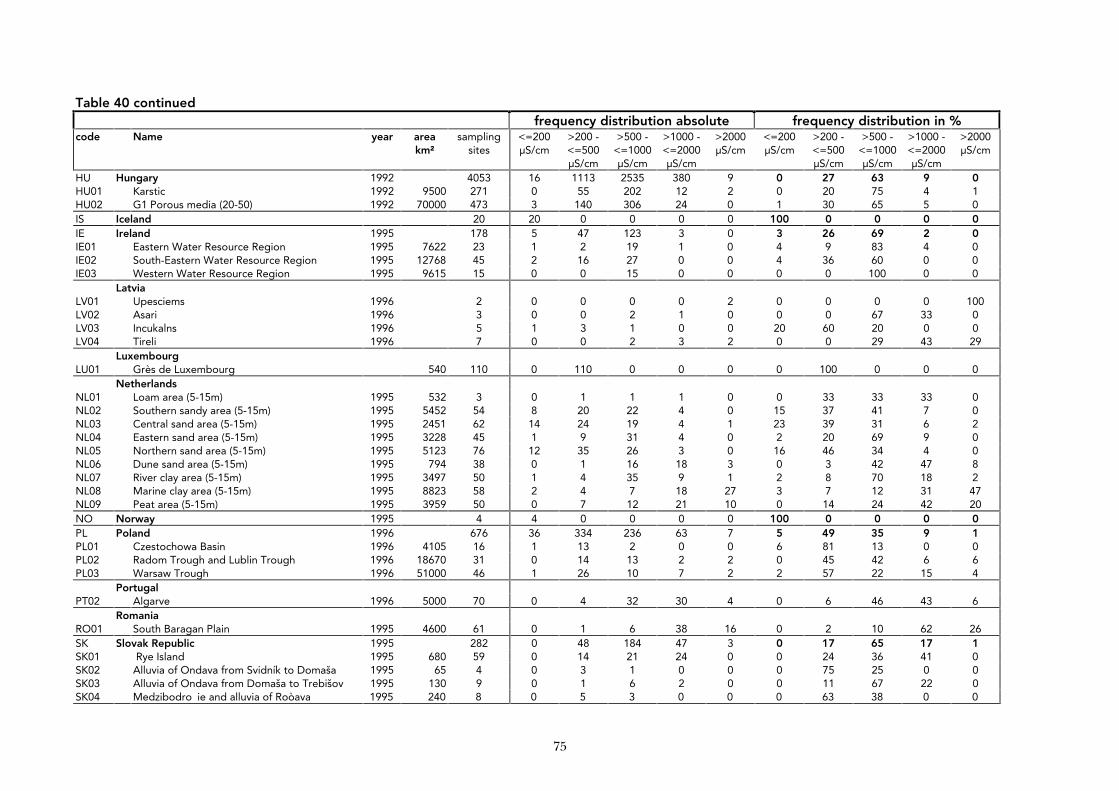
75
Table 40 continued frequency distribution absolute frequency distribution in % code Name year area
km² sampling
sites <=200 µS/cm
>200 - <=500 µS/cm
>500 - <=1000 µS/cm
>1000 - <=2000 µS/cm
>2000 µS/cm
<=200 µS/cm
>200 - <=500 µS/cm
>500 - <=1000 µS/cm
>1000 - <=2000 µS/cm
>2000 µS/cm
HU Hungary 1992 4053 16 1113 2535 380 9 0 27 63 9 0 HU01 Karstic 1992 9500 271 0 55 202 12 2 0 20 75 4 1 HU02 G1 Porous media (20-50) 1992 70000 473 3 140 306 24 0 1 30 65 5 0 IS Iceland 20 20 0 0 0 0 100 0 0 0 0 IE Ireland 1995 178 5 47 123 3 0 3 26 69 2 0 IE01 Eastern Water Resource Region 1995 7622 23 1 2 19 1 0 4 9 83 4 0 IE02 South-Eastern Water Resource Region 1995 12768 45 2 16 27 0 0 4 36 60 0 0 IE03 Western Water Resource Region 1995 9615 15 0 0 15 0 0 0 0 100 0 0
Latvia LV01 Upesciems 1996 2 0 0 0 0 2 0 0 0 0 100 LV02 Asari 1996 3 0 0 2 1 0 0 0 67 33 0 LV03 Incukalns 1996 5 1 3 1 0 0 20 60 20 0 0 LV04 Tireli 1996 7 0 0 2 3 2 0 0 29 43 29
Luxembourg LU01 Grès de Luxembourg 540 110 0 110 0 0 0 0 100 0 0 0
Netherlands NL01 Loam area (5-15m) 1995 532 3 0 1 1 1 0 0 33 33 33 0 NL02 Southern sandy area (5-15m) 1995 5452 54 8 20 22 4 0 15 37 41 7 0 NL03 Central sand area (5-15m) 1995 2451 62 14 24 19 4 1 23 39 31 6 2 NL04 Eastern sand area (5-15m) 1995 3228 45 1 9 31 4 0 2 20 69 9 0 NL05 Northern sand area (5-15m) 1995 5123 76 12 35 26 3 0 16 46 34 4 0 NL06 Dune sand area (5-15m) 1995 794 38 0 1 16 18 3 0 3 42 47 8 NL07 River clay area (5-15m) 1995 3497 50 1 4 35 9 1 2 8 70 18 2 NL08 Marine clay area (5-15m) 1995 8823 58 2 4 7 18 27 3 7 12 31 47 NL09 Peat area (5-15m) 1995 3959 50 0 7 12 21 10 0 14 24 42 20 NO Norway 1995 4 4 0 0 0 0 100 0 0 0 0 PL Poland 1996 676 36 334 236 63 7 5 49 35 9 1 PL01 Czestochowa Basin 1996 4105 16 1 13 2 0 0 6 81 13 0 0 PL02 Radom Trough and Lublin Trough 1996 18670 31 0 14 13 2 2 0 45 42 6 6 PL03 Warsaw Trough 1996 51000 46 1 26 10 7 2 2 57 22 15 4
Portugal PT02 Algarve 1996 5000 70 0 4 32 30 4 0 6 46 43 6
Romania RO01 South Baragan Plain 1995 4600 61 0 1 6 38 16 0 2 10 62 26 SK Slovak Republic 1995 282 0 48 184 47 3 0 17 65 17 1 SK01 Rye Island 1995 680 59 0 14 21 24 0 0 24 36 41 0 SK02 Alluvia of Ondava from Svidník to Domaša 1995 65 4 0 3 1 0 0 0 75 25 0 0 SK03 Alluvia of Ondava from Domaša to Trebišov 1995 130 9 0 1 6 2 0 0 11 67 22 0 SK04 Medzibodro ie and alluvia of Roòava 1995 240 8 0 5 3 0 0 0 63 38 0 0
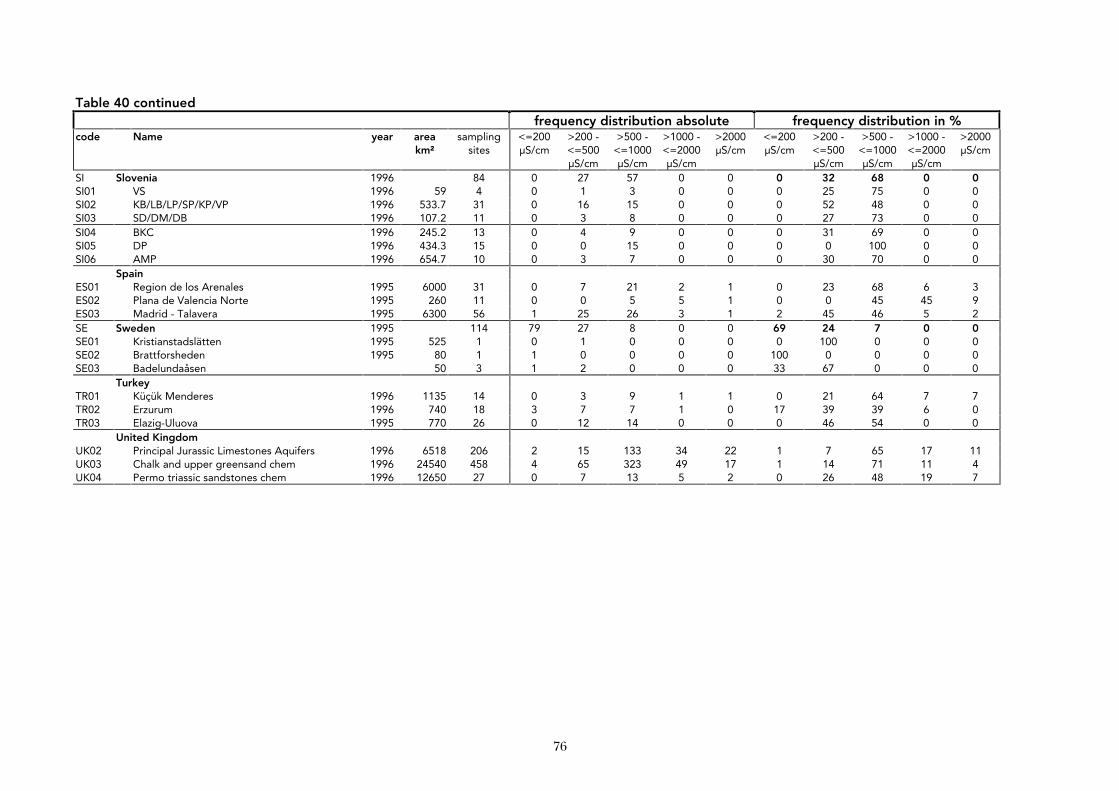
76
Table 40 continued frequency distribution absolute frequency distribution in %
code Name year area km²
sampling sites
<=200 µS/cm
>200 - <=500 µS/cm
>500 - <=1000 µS/cm
>1000 - <=2000 µS/cm
>2000 µS/cm
<=200 µS/cm
>200 - <=500 µS/cm
>500 - <=1000 µS/cm
>1000 - <=2000 µS/cm
>2000 µS/cm
SI Slovenia 1996 84 0 27 57 0 0 0 32 68 0 0 SI01 VS 1996 59 4 0 1 3 0 0 0 25 75 0 0 SI02 KB/LB/LP/SP/KP/VP 1996 533.7 31 0 16 15 0 0 0 52 48 0 0 SI03 SD/DM/DB 1996 107.2 11 0 3 8 0 0 0 27 73 0 0 SI04 BKC 1996 245.2 13 0 4 9 0 0 0 31 69 0 0 SI05 DP 1996 434.3 15 0 0 15 0 0 0 0 100 0 0 SI06 AMP 1996 654.7 10 0 3 7 0 0 0 30 70 0 0
Spain ES01 Region de los Arenales 1995 6000 31 0 7 21 2 1 0 23 68 6 3 ES02 Plana de Valencia Norte 1995 260 11 0 0 5 5 1 0 0 45 45 9 ES03 Madrid - Talavera 1995 6300 56 1 25 26 3 1 2 45 46 5 2 SE Sweden 1995 114 79 27 8 0 0 69 24 7 0 0 SE01 Kristianstadslätten 1995 525 1 0 1 0 0 0 0 100 0 0 0 SE02 Brattforsheden 1995 80 1 1 0 0 0 0 100 0 0 0 0 SE03 Badelundaåsen 50 3 1 2 0 0 0 33 67 0 0 0
Turkey TR01 Küçük Menderes 1996 1135 14 0 3 9 1 1 0 21 64 7 7 TR02 Erzurum 1996 740 18 3 7 7 1 0 17 39 39 6 0 TR03 Elazig-Uluova 1995 770 26 0 12 14 0 0 0 46 54 0 0
United Kingdom UK02 Principal Jurassic Limestones Aquifers 1996 6518 206 2 15 133 34 22 1 7 65 17 11 UK03 Chalk and upper greensand chem 1996 24540 458 4 65 323 49 17 1 14 71 11 4 UK04 Permo triassic sandstones chem 1996 12650 27 0 7 13 5 2 0 26 48 19 7
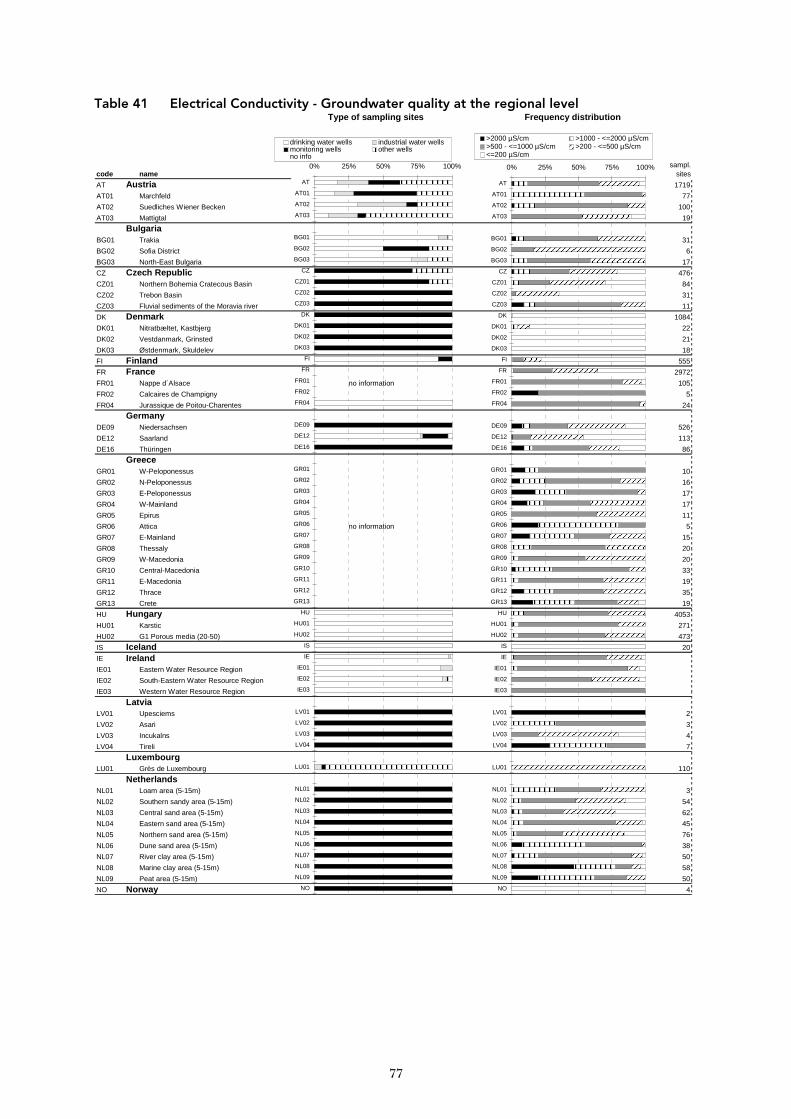
77
Table 41 Electrical Conductivity - Groundwater quality at the regional level Type of sampling sites Frequency distribution
code namesampl.
sites
AT Austria 1719
AT01 Marchfeld 77
AT02 Suedliches Wiener Becken 100
AT03 Mattigtal 19
BulgariaBG01 Trakia 31
BG02 Sofia District 6
BG03 North-East Bulgaria 17
CZ Czech Republic 476
CZ01 Northern Bohemia Cratecous Basin 84
CZ02 Trebon Basin 31
CZ03 Fluvial sediments of the Moravia river 11
DK Denmark 1084
DK01 Nitratbæltet, Kastbjerg 22
DK02 Vestdanmark, Grinsted 21
DK03 Østdenmark, Skuldelev 18
FI Finland 555
FR France 2972
FR01 Nappe d´Alsace no information 105
FR02 Calcaires de Champigny 5
FR04 Jurassique de Poitou-Charentes 24
GermanyDE09 Niedersachsen 526
DE12 Saarland 113
DE16 Thüringen 86
GreeceGR01 W-Peloponessus 10
GR02 N-Peloponessus 16
GR03 E-Peloponessus 17
GR04 W-Mainland 17
GR05 Epirus 11
GR06 Attica no information 5
GR07 E-Mainland 15
GR08 Thessaly 20
GR09 W-Macedonia 20
GR10 Central-Macedonia 33
GR11 E-Macedonia 19
GR12 Thrace 35
GR13 Crete 19
HU Hungary 4053
HU01 Karstic 271
HU02 G1 Porous media (20-50) 473
IS Iceland 20
IE IrelandIE01 Eastern Water Resource Region
IE02 South-Eastern Water Resource Region
IE03 Western Water Resource Region
LatviaLV01 Upesciems 2
LV02 Asari 3
LV03 Incukalns 4
LV04 Tireli 7
LuxembourgLU01 Grès de Luxembourg 110
NetherlandsNL01 Loam area (5-15m) 3
NL02 Southern sandy area (5-15m) 54
NL03 Central sand area (5-15m) 62
NL04 Eastern sand area (5-15m) 45
NL05 Northern sand area (5-15m) 76
NL06 Dune sand area (5-15m) 38
NL07 River clay area (5-15m) 50
NL08 Marine clay area (5-15m) 58
NL09 Peat area (5-15m) 50
NO Norway 4
0% 25% 50% 75% 100%
AT
AT01
AT02
AT03
BG01
BG02
BG03
CZ
CZ01
CZ02
CZ03
DK
DK01
DK02
DK03
FI
FR
FR01
FR02
FR04
DE09
DE12
DE16
GR01
GR02
GR03
GR04
GR05
GR06
GR07
GR08
GR09
GR10
GR11
GR12
GR13
HU
HU01
HU02
IS
IE
IE01
IE02
IE03
LV01
LV02
LV03
LV04
LU01
NL01
NL02
NL03
NL04
NL05
NL06
NL07
NL08
NL09
NO
drinking water wells industrial water wellsmonitoring wells other wellsno info
0% 25% 50% 75% 100%
AT
AT01
AT02
AT03
BG01
BG02
BG03
CZ
CZ01
CZ02
CZ03
DK
DK01
DK02
DK03
FI
FR
FR01
FR02
FR04
DE09
DE12
DE16
GR01
GR02
GR03
GR04
GR05
GR06
GR07
GR08
GR09
GR10
GR11
GR12
GR13
HU
HU01
HU02
IS
IE
IE01
IE02
IE03
LV01
LV02
LV03
LV04
LU01
NL01
NL02
NL03
NL04
NL05
NL06
NL07
NL08
NL09
NO
>2000 µS/cm >1000 - <=2000 µS/cm>500 - <=1000 µS/cm >200 - <=500 µS/cm<=200 µS/cm
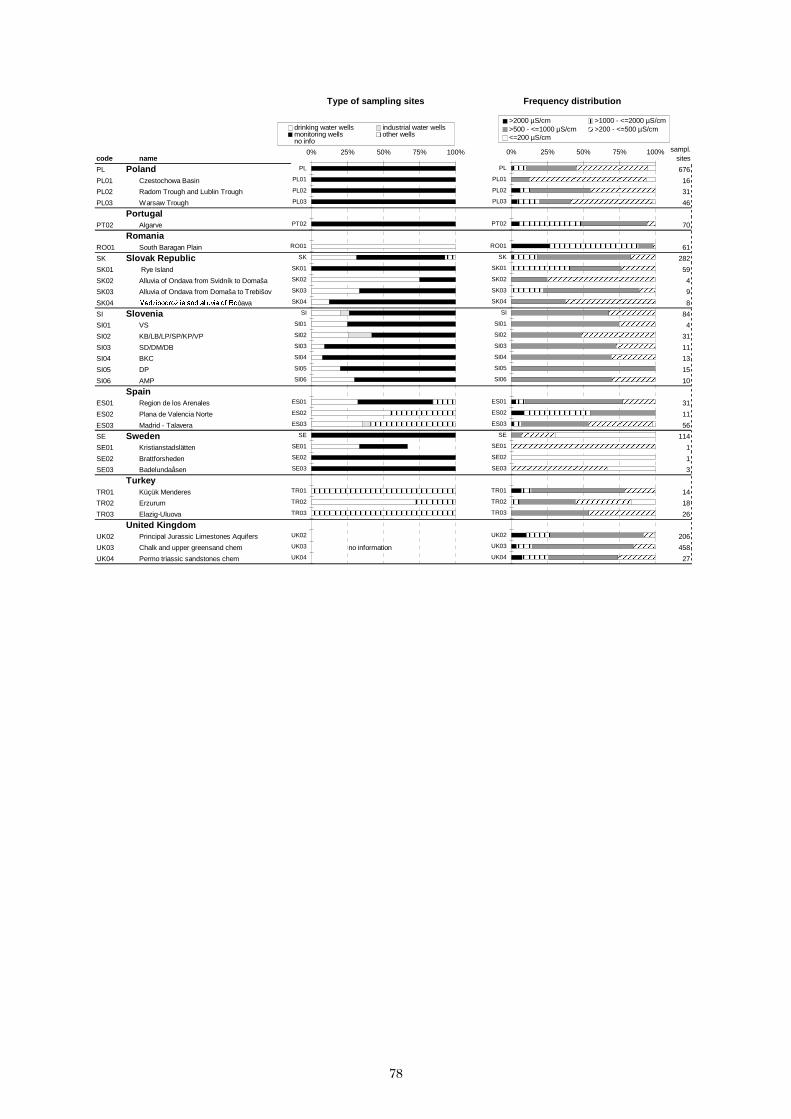
78
Type of sampling sites Frequency distribution
code namesampl.
sites
PL Poland 676
PL01 Czestochowa Basin 16
PL02 Radom Trough and Lublin Trough 31
PL03 Warsaw Trough 46
PortugalPT02 Algarve 70
RomaniaRO01 South Baragan Plain 61
SK Slovak Republic 282
SK01 Rye Island 59
SK02 Alluvia of Ondava from Svidník to Domaša 4
SK03 Alluvia of Ondava from Domaša to Trebišov 9
SK04 0HG]LERGURå LH�DQG�DOOXYLD�RI�5Ròava 8
SI Slovenia 84
SI01 VS 4
SI02 KB/LB/LP/SP/KP/VP 31
SI03 SD/DM/DB 11
SI04 BKC 13
SI05 DP 15
SI06 AMP 10
SpainES01 Region de los Arenales 31
ES02 Plana de Valencia Norte 11
ES03 Madrid - Talavera 56
SE Sweden 114
SE01 Kristianstadslätten 1
SE02 Brattforsheden 1
SE03 Badelundaåsen 3
TurkeyTR01 Küçük Menderes 14
TR02 Erzurum 18
TR03 Elazig-Uluova 26
United KingdomUK02 Principal Jurassic Limestones Aquifers 206
UK03 Chalk and upper greensand chem no information 458
UK04 Permo triassic sandstones chem 27
0% 25% 50% 75% 100%
PL
PL01
PL02
PL03
PT02
RO01
SK
SK01
SK02
SK03
SK04
SI
SI01
SI02
SI03
SI04
SI05
SI06
ES01
ES02
ES03
SE
SE01
SE02
SE03
TR01
TR02
TR03
UK02
UK03
UK04
drinking water wells industrial water wellsmonitoring wells other wellsno info
0% 25% 50% 75% 100%
PL
PL01
PL02
PL03
PT02
RO01
SK
SK01
SK02
SK03
SK04
SI
SI01
SI02
SI03
SI04
SI05
SI06
ES01
ES02
ES03
SE
SE01
SE02
SE03
TR01
TR02
TR03
UK02
UK03
UK04
>2000 µS/cm >1000 - <=2000 µS/cm>500 - <=1000 µS/cm >200 - <=500 µS/cm<=200 µS/cm
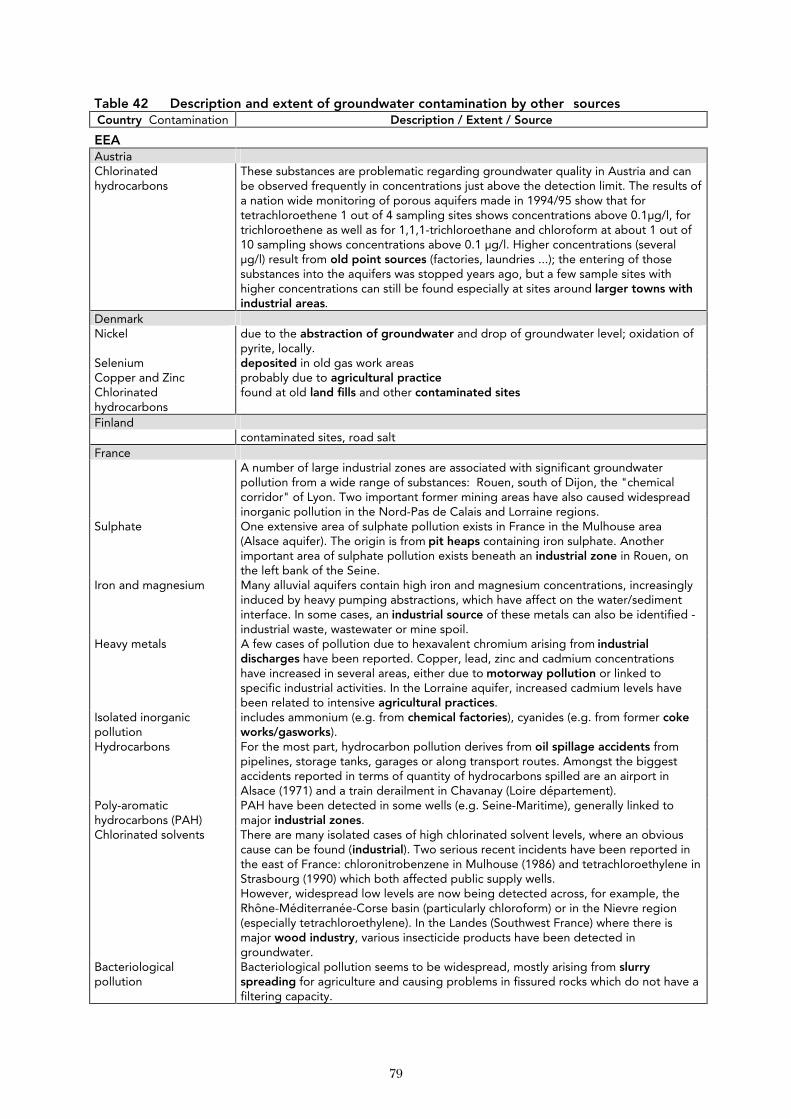
79
Table 42 Description and extent of groundwater contamination by other sources Country Contamination Description / Extent / Source
EEA Austria Chlorinated hydrocarbons
These substances are problematic regarding groundwater quality in Austria and can be observed frequently in concentrations just above the detection limit. The results of a nation wide monitoring of porous aquifers made in 1994/95 show that for tetrachloroethene 1 out of 4 sampling sites shows concentrations above 0.1µg/l, for trichloroethene as well as for 1,1,1-trichloroethane and chloroform at about 1 out of 10 sampling shows concentrations above 0.1 µg/l. Higher concentrations (several µg/l) result from old point sources (factories, laundries ...); the entering of those substances into the aquifers was stopped years ago, but a few sample sites with higher concentrations can still be found especially at sites around larger towns with industrial areas.
Denmark Nickel due to the abstraction of groundwater and drop of groundwater level; oxidation of
pyrite, locally. Selenium deposited in old gas work areas Copper and Zinc probably due to agricultural practice Chlorinated hydrocarbons
found at old land fills and other contaminated sites
Finland contaminated sites, road salt France A number of large industrial zones are associated with significant groundwater
pollution from a wide range of substances: Rouen, south of Dijon, the "chemical corridor" of Lyon. Two important former mining areas have also caused widespread inorganic pollution in the Nord-Pas de Calais and Lorraine regions.
Sulphate One extensive area of sulphate pollution exists in France in the Mulhouse area (Alsace aquifer). The origin is from pit heaps containing iron sulphate. Another important area of sulphate pollution exists beneath an industrial zone in Rouen, on the left bank of the Seine.
Iron and magnesium Many alluvial aquifers contain high iron and magnesium concentrations, increasingly induced by heavy pumping abstractions, which have affect on the water/sediment interface. In some cases, an industrial source of these metals can also be identified - industrial waste, wastewater or mine spoil.
Heavy metals A few cases of pollution due to hexavalent chromium arising from industrial discharges have been reported. Copper, lead, zinc and cadmium concentrations have increased in several areas, either due to motorway pollution or linked to specific industrial activities. In the Lorraine aquifer, increased cadmium levels have been related to intensive agricultural practices.
Isolated inorganic pollution
includes ammonium (e.g. from chemical factories), cyanides (e.g. from former coke works/gasworks).
Hydrocarbons For the most part, hydrocarbon pollution derives from oil spillage accidents from pipelines, storage tanks, garages or along transport routes. Amongst the biggest accidents reported in terms of quantity of hydrocarbons spilled are an airport in Alsace (1971) and a train derailment in Chavanay (Loire département).
Poly-aromatic hydrocarbons (PAH)
PAH have been detected in some wells (e.g. Seine-Maritime), generally linked to major industrial zones.
Chlorinated solvents There are many isolated cases of high chlorinated solvent levels, where an obvious cause can be found (industrial). Two serious recent incidents have been reported in the east of France: chloronitrobenzene in Mulhouse (1986) and tetrachloroethylene in Strasbourg (1990) which both affected public supply wells. However, widespread low levels are now being detected across, for example, the Rhône-Méditerranée-Corse basin (particularly chloroform) or in the Nievre region (especially tetrachloroethylene). In the Landes (Southwest France) where there is major wood industry, various insecticide products have been detected in groundwater.
Bacteriological pollution
Bacteriological pollution seems to be widespread, mostly arising from slurry spreading for agriculture and causing problems in fissured rocks which do not have a filtering capacity.

80
Table 42 continued Country Contamination Description / Extent / Source Germany Thüringen Volatile chlorinated hydrocarbons, mineral oil
in urban sites due to industrial activities, improper handling, accidents etc. Further due to old dumping sites, contaminated sites (abandoned industrial sites and waste deposits) and suspected contaminated sites
Baden-Württemberg Volatile chlorinated hydrocarbons
esp. tetrachloroethene and trichloroethene in highly industrialised and urbanised areas
Iceland No such sources known Ireland The EPA national groundwater quality monitoring programme commenced in Nov.
1995. At present it is too early to state whether existing pollution from point or diffuse sources.
Sweden Heavy metals long-range transport of pollutants and domestic sources
PHARE Bulgaria Heavy metals Geo-technical mining of uranium at separate (local) places in Trakia Czech Republic The main source of groundwater pollution was an inadequately high amount of
fertilisers and pesticides, etc. However, in the last seven years this amount decreased significantly. Now, old or large industrial dumping areas seem to be the main source of groundwater pollution, which is considered to be a diffuse source of pollution. Nowadays, most of them have been identified and many effort is being put in sanitation measures. Another important source of groundwater pollution are old, not sufficiently controlled urban and village dumping sites. These can be considered to be a local or point source of groundwater pollution.
Estonia Oil products, fuel oil landfills (Tuula etc.), accidents in Aruküla, Kärdla, Military air-fields of former Soviet
Army (Source: Estonian Environment 1993, Tallinn 1994)
airfield polluted water layer area of fuel area (ha) depth (m) layer (ha) Tapa 1600 25 600 Haapsalu 7.3 10 2.5 Ämari 237 20 16 Rakvere 50 20 0.2
Heavy metals landfills (Tuula etc.) SO4, Na, K Baltic Thermal Power Plant Waste water Rakvere, Tamsalu Hungary Arsenic Arsenic of natural origin seems to be one of the greatest groundwater quality
problem in Hungary as the standard for drinking water has decreased from 0.05 mg/l to 0.01 mg/l by the recommendation of the EU.
NH4, Fe, Mn, Methane, Organic compounds, Low hardness
The majority of the groundwater quality problems in Hungary are of natural origin. For more than ten thousand years chemical components (ammonia, iron, manganese, arsenic, methane, organic compounds, low hardness) of geogenic (natural) origin have been dissolved into groundwater by the water-rock interaction of the subsurface flow. The concentrations of these components in the deeper groundwater resources (>20 m) often exceed the quality standards for drinking water, mainly in the discharge areas of the regional groundwater flow systems. The vulnerable karst water and shallow groundwater resources contain these components in low concentration.
Heavy metals, Hydrocarbons, Chlorinated hydrocarbons etc.
The micro compounds (heavy metals, hydrocarbons, chlorinated hydrocarbons etc.) as polluting materials have been repeatedly monitored around the waste disposal sites, landfills and polluted industrial military sites. These polluted sites are usually out of the protected area of the wellfields used for public water supply.
Finishing the mining activity groundwater can fill up the former pits of mines and become polluted.
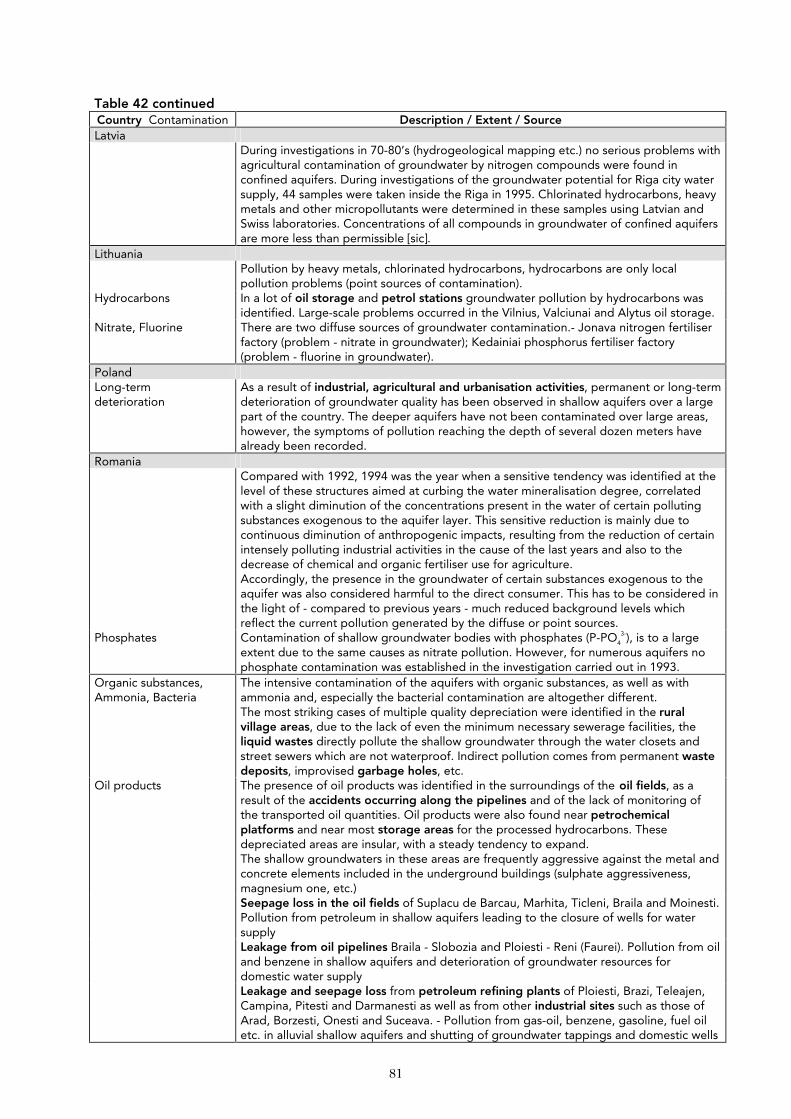
81
Table 42 continued Country Contamination Description / Extent / Source Latvia During investigations in 70-80’s (hydrogeological mapping etc.) no serious problems with
agricultural contamination of groundwater by nitrogen compounds were found in confined aquifers. During investigations of the groundwater potential for Riga city water supply, 44 samples were taken inside the Riga in 1995. Chlorinated hydrocarbons, heavy metals and other micropollutants were determined in these samples using Latvian and Swiss laboratories. Concentrations of all compounds in groundwater of confined aquifers are more less than permissible [sic].
Lithuania Pollution by heavy metals, chlorinated hydrocarbons, hydrocarbons are only local
pollution problems (point sources of contamination). Hydrocarbons In a lot of oil storage and petrol stations groundwater pollution by hydrocarbons was
identified. Large-scale problems occurred in the Vilnius, Valciunai and Alytus oil storage. Nitrate, Fluorine There are two diffuse sources of groundwater contamination.- Jonava nitrogen fertiliser
factory (problem - nitrate in groundwater); Kedainiai phosphorus fertiliser factory (problem - fluorine in groundwater).
Poland Long-term deterioration
As a result of industrial, agricultural and urbanisation activities, permanent or long-term deterioration of groundwater quality has been observed in shallow aquifers over a large part of the country. The deeper aquifers have not been contaminated over large areas, however, the symptoms of pollution reaching the depth of several dozen meters have already been recorded.
Romania Compared with 1992, 1994 was the year when a sensitive tendency was identified at the
level of these structures aimed at curbing the water mineralisation degree, correlated with a slight diminution of the concentrations present in the water of certain polluting substances exogenous to the aquifer layer. This sensitive reduction is mainly due to continuous diminution of anthropogenic impacts, resulting from the reduction of certain intensely polluting industrial activities in the cause of the last years and also to the decrease of chemical and organic fertiliser use for agriculture. Accordingly, the presence in the groundwater of certain substances exogenous to the aquifer was also considered harmful to the direct consumer. This has to be considered in the light of - compared to previous years - much reduced background levels which reflect the current pollution generated by the diffuse or point sources.
Phosphates Contamination of shallow groundwater bodies with phosphates (P-PO4
3-), is to a large extent due to the same causes as nitrate pollution. However, for numerous aquifers no phosphate contamination was established in the investigation carried out in 1993.
Organic substances, Ammonia, Bacteria
The intensive contamination of the aquifers with organic substances, as well as with ammonia and, especially the bacterial contamination are altogether different. The most striking cases of multiple quality depreciation were identified in the rural village areas, due to the lack of even the minimum necessary sewerage facilities, the liquid wastes directly pollute the shallow groundwater through the water closets and street sewers which are not waterproof. Indirect pollution comes from permanent waste deposits, improvised garbage holes, etc.
Oil products The presence of oil products was identified in the surroundings of the oil fields, as a result of the accidents occurring along the pipelines and of the lack of monitoring of the transported oil quantities. Oil products were also found near petrochemical platforms and near most storage areas for the processed hydrocarbons. These depreciated areas are insular, with a steady tendency to expand. The shallow groundwaters in these areas are frequently aggressive against the metal and concrete elements included in the underground buildings (sulphate aggressiveness, magnesium one, etc.)
Seepage loss in the oil fields of Suplacu de Barcau, Marhita, Ticleni, Braila and Moinesti. Pollution from petroleum in shallow aquifers leading to the closure of wells for water supply
Leakage from oil pipelines Braila - Slobozia and Ploiesti - Reni (Faurei). Pollution from oil and benzene in shallow aquifers and deterioration of groundwater resources for domestic water supply
Leakage and seepage loss from petroleum refining plants of Ploiesti, Brazi, Teleajen, Campina, Pitesti and Darmanesti as well as from other industrial sites such as those of Arad, Borzesti, Onesti and Suceava. - Pollution from gas-oil, benzene, gasoline, fuel oil etc. in alluvial shallow aquifers and shutting of groundwater tappings and domestic wells
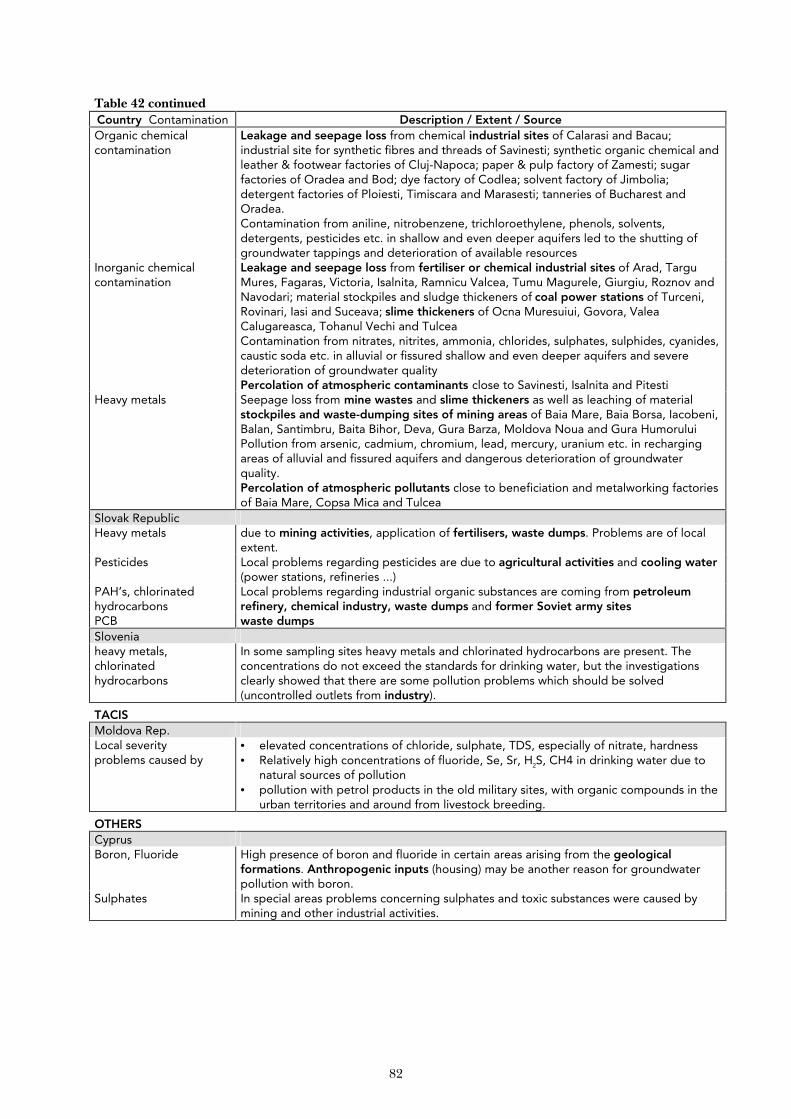
82
Table 42 continued Country Contamination Description / Extent / Source Organic chemical contamination
Leakage and seepage loss from chemical industrial sites of Calarasi and Bacau; industrial site for synthetic fibres and threads of Savinesti; synthetic organic chemical and leather & footwear factories of Cluj-Napoca; paper & pulp factory of Zamesti; sugar factories of Oradea and Bod; dye factory of Codlea; solvent factory of Jimbolia; detergent factories of Ploiesti, Timiscara and Marasesti; tanneries of Bucharest and Oradea. Contamination from aniline, nitrobenzene, trichloroethylene, phenols, solvents, detergents, pesticides etc. in shallow and even deeper aquifers led to the shutting of groundwater tappings and deterioration of available resources
Inorganic chemical contamination
Leakage and seepage loss from fertiliser or chemical industrial sites of Arad, Targu Mures, Fagaras, Victoria, Isalnita, Ramnicu Valcea, Tumu Magurele, Giurgiu, Roznov and Navodari; material stockpiles and sludge thickeners of coal power stations of Turceni, Rovinari, Iasi and Suceava; slime thickeners of Ocna Muresuiui, Govora, Valea Calugareasca, Tohanul Vechi and Tulcea Contamination from nitrates, nitrites, ammonia, chlorides, sulphates, sulphides, cyanides, caustic soda etc. in alluvial or fissured shallow and even deeper aquifers and severe deterioration of groundwater quality Percolation of atmospheric contaminants close to Savinesti, Isalnita and Pitesti
Heavy metals Seepage loss from mine wastes and slime thickeners as well as leaching of material stockpiles and waste-dumping sites of mining areas of Baia Mare, Baia Borsa, Iacobeni, Balan, Santimbru, Baita Bihor, Deva, Gura Barza, Moldova Noua and Gura Humorului Pollution from arsenic, cadmium, chromium, lead, mercury, uranium etc. in recharging areas of alluvial and fissured aquifers and dangerous deterioration of groundwater quality. Percolation of atmospheric pollutants close to beneficiation and metalworking factories of Baia Mare, Copsa Mica and Tulcea
Slovak Republic Heavy metals due to mining activities, application of fertilisers, waste dumps. Problems are of local
extent. Pesticides Local problems regarding pesticides are due to agricultural activities and cooling water
(power stations, refineries ...) PAH’s, chlorinated hydrocarbons
Local problems regarding industrial organic substances are coming from petroleum refinery, chemical industry, waste dumps and former Soviet army sites
PCB waste dumps Slovenia heavy metals, chlorinated hydrocarbons
In some sampling sites heavy metals and chlorinated hydrocarbons are present. The concentrations do not exceed the standards for drinking water, but the investigations clearly showed that there are some pollution problems which should be solved (uncontrolled outlets from industry).
TACIS Moldova Rep. Local severity problems caused by
• elevated concentrations of chloride, sulphate, TDS, especially of nitrate, hardness • Relatively high concentrations of fluoride, Se, Sr, H2S, CH4 in drinking water due to
natural sources of pollution • pollution with petrol products in the old military sites, with organic compounds in the
urban territories and around from livestock breeding.
OTHERS Cyprus Boron, Fluoride High presence of boron and fluoride in certain areas arising from the geological
formations. Anthropogenic inputs (housing) may be another reason for groundwater pollution with boron.
Sulphates In special areas problems concerning sulphates and toxic substances were caused by mining and other industrial activities.
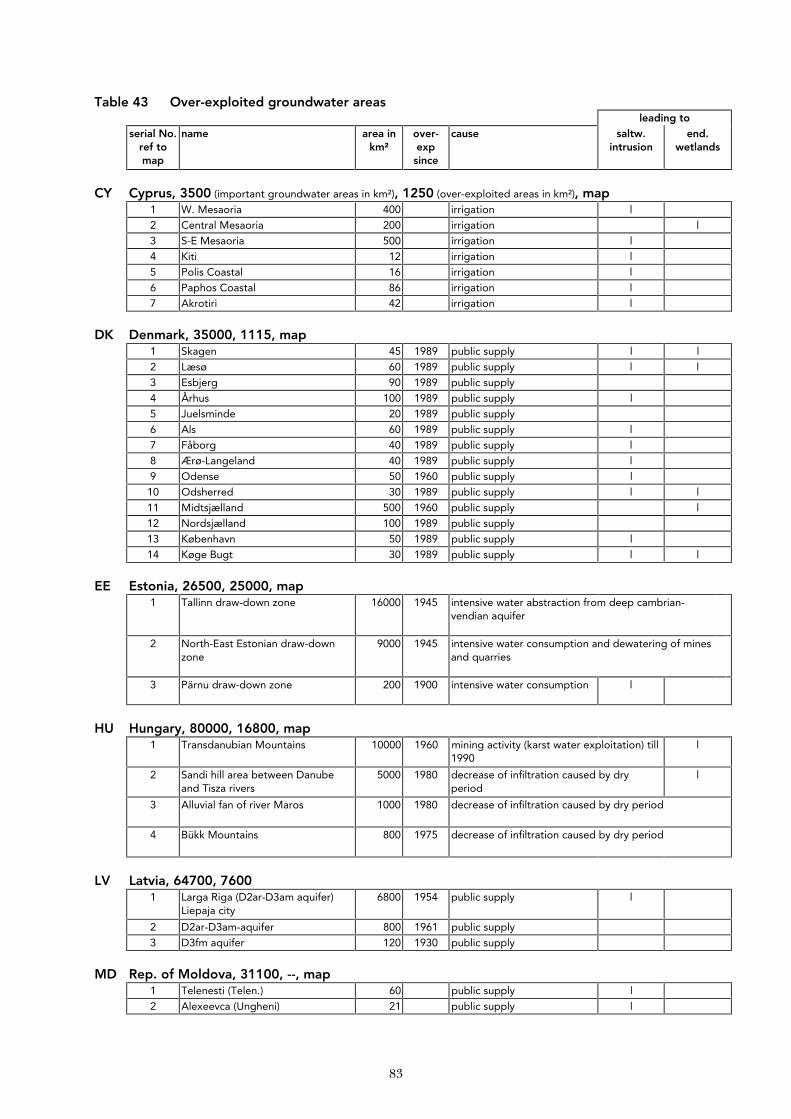
83
Table 43 Over-exploited groundwater areas leading to serial No.
ref to map
name area in km²
over-exp since
cause saltw. intrusion
end. wetlands
CY Cyprus, 3500 (important groundwater areas in km²), 1250 (over-exploited areas in km²), map 1 W. Mesaoria 400 irrigation l
2 Central Mesaoria 200 irrigation l
3 S-E Mesaoria 500 irrigation l
4 Kiti 12 irrigation l
5 Polis Coastal 16 irrigation l
6 Paphos Coastal 86 irrigation l
7 Akrotiri 42 irrigation l
DK Denmark, 35000, 1115, map 1 Skagen 45 1989 public supply l l
2 Læsø 60 1989 public supply l l
3 Esbjerg 90 1989 public supply
4 Århus 100 1989 public supply l
5 Juelsminde 20 1989 public supply
6 Als 60 1989 public supply l
7 Fåborg 40 1989 public supply l
8 Ærø-Langeland 40 1989 public supply l
9 Odense 50 1960 public supply l
10 Odsherred 30 1989 public supply l l
11 Midtsjælland 500 1960 public supply l
12 Nordsjælland 100 1989 public supply
13 København 50 1989 public supply l
14 Køge Bugt 30 1989 public supply l l
EE Estonia, 26500, 25000, map 1 Tallinn draw-down zone 16000 1945 intensive water abstraction from deep cambrian-
vendian aquifer
2 North-East Estonian draw-down zone
9000 1945 intensive water consumption and dewatering of mines and quarries
3 Pärnu draw-down zone 200 1900 intensive water consumption
l
HU Hungary, 80000, 16800, map 1 Transdanubian Mountains 10000 1960 mining activity (karst water exploitation) till
1990 l
2 Sandi hill area between Danube and Tisza rivers
5000 1980 decrease of infiltration caused by dry period
l
3 Alluvial fan of river Maros 1000 1980 decrease of infiltration caused by dry period
4 Bükk Mountains 800 1975 decrease of infiltration caused by dry period
LV Latvia, 64700, 7600 1 Larga Riga (D2ar-D3am aquifer)
Liepaja city 6800 1954 public supply l
2 D2ar-D3am-aquifer 800 1961 public supply
3 D3fm aquifer 120 1930 public supply
MD Rep. of Moldova, 31100, --, map 1 Telenesti (Telen.) 60 public supply l
2 Alexeevca (Ungheni) 21 public supply l
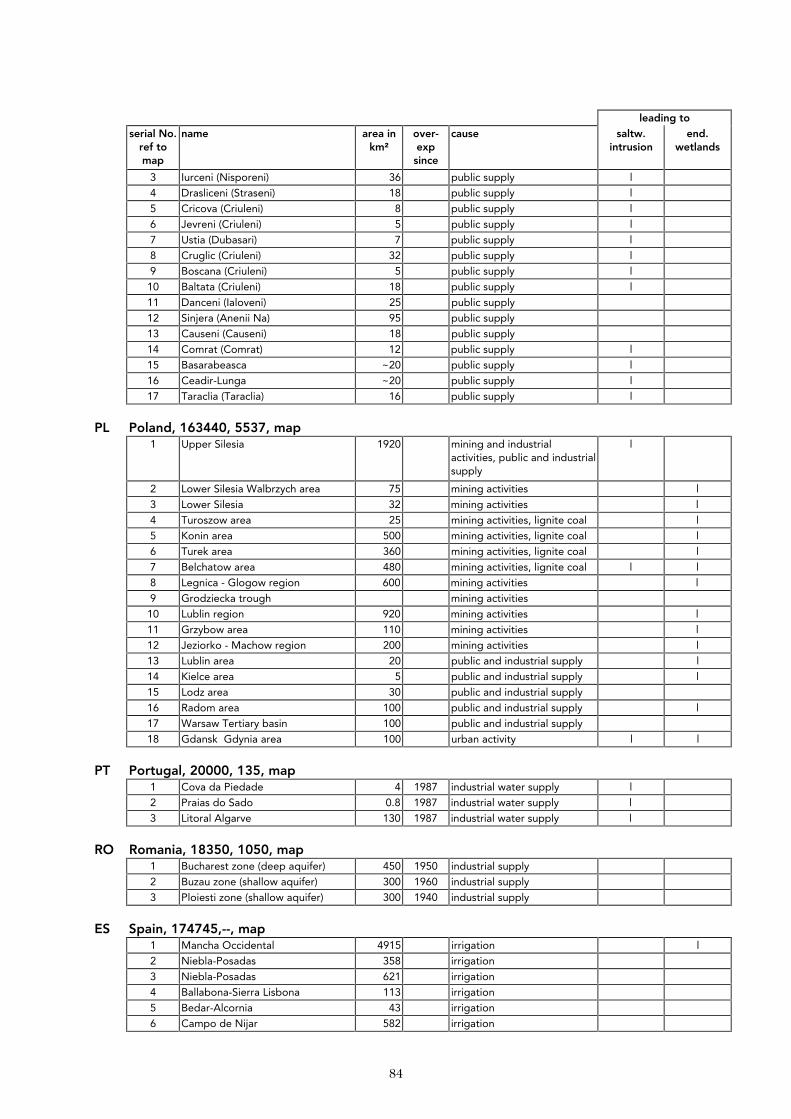
84
leading to serial No.
ref to map
name area in km²
over-exp since
cause saltw. intrusion
end. wetlands
3 Iurceni (Nisporeni) 36 public supply l
4 Drasliceni (Straseni) 18 public supply l
5 Cricova (Criuleni) 8 public supply l
6 Jevreni (Criuleni) 5 public supply l
7 Ustia (Dubasari) 7 public supply l
8 Cruglic (Criuleni) 32 public supply l
9 Boscana (Criuleni) 5 public supply l
10 Baltata (Criuleni) 18 public supply l
11 Danceni (Ialoveni) 25 public supply
12 Sinjera (Anenii Na) 95 public supply
13 Causeni (Causeni) 18 public supply
14 Comrat (Comrat) 12 public supply l
15 Basarabeasca ~20 public supply l
16 Ceadir-Lunga ~20 public supply l
17 Taraclia (Taraclia) 16 public supply l
PL Poland, 163440, 5537, map 1 Upper Silesia 1920 mining and industrial
activities, public and industrial supply
l
2 Lower Silesia Walbrzych area 75 mining activities l
3 Lower Silesia 32 mining activities l
4 Turoszow area 25 mining activities, lignite coal l
5 Konin area 500 mining activities, lignite coal l
6 Turek area 360 mining activities, lignite coal l
7 Belchatow area 480 mining activities, lignite coal l l
8 Legnica - Glogow region 600 mining activities l
9 Grodziecka trough mining activities
10 Lublin region 920 mining activities l
11 Grzybow area 110 mining activities l
12 Jeziorko - Machow region 200 mining activities l
13 Lublin area 20 public and industrial supply l
14 Kielce area 5 public and industrial supply l
15 Lodz area 30 public and industrial supply
16 Radom area 100 public and industrial supply l
17 Warsaw Tertiary basin 100 public and industrial supply
18 Gdansk Gdynia area 100 urban activity l l
PT Portugal, 20000, 135, map 1 Cova da Piedade 4 1987 industrial water supply l
2 Praias do Sado 0.8 1987 industrial water supply l
3 Litoral Algarve 130 1987 industrial water supply l
RO Romania, 18350, 1050, map 1 Bucharest zone (deep aquifer) 450 1950 industrial supply
2 Buzau zone (shallow aquifer) 300 1960 industrial supply
3 Ploiesti zone (shallow aquifer) 300 1940 industrial supply
ES Spain, 174745,--, map 1 Mancha Occidental 4915 irrigation l
2 Niebla-Posadas 358 irrigation
3 Niebla-Posadas 621 irrigation
4 Ballabona-Sierra Lisbona 113 irrigation
5 Bedar-Alcornia 43 irrigation
6 Campo de Nijar 582 irrigation
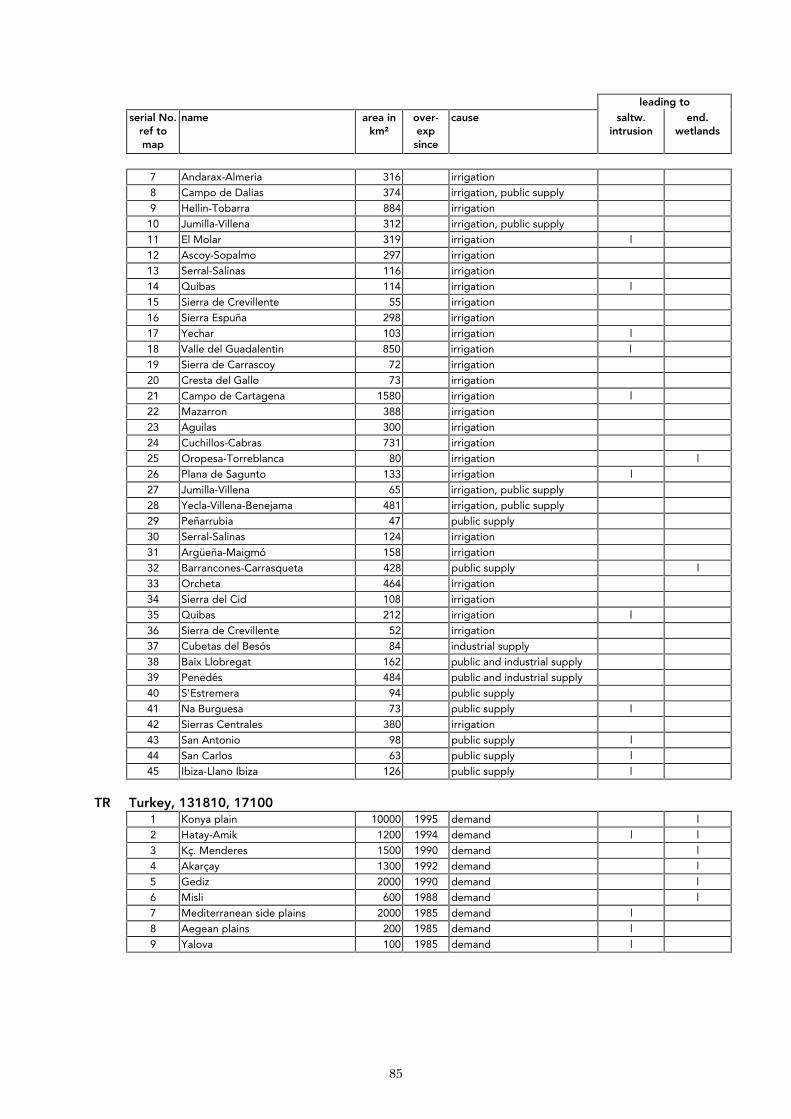
85
leading to serial No.
ref to map
name area in km²
over-exp since
cause saltw. intrusion
end. wetlands
7 Andarax-Almeria 316 irrigation
8 Campo de Dalias 374 irrigation, public supply
9 Hellin-Tobarra 884 irrigation
10 Jumilla-Villena 312 irrigation, public supply
11 El Molar 319 irrigation l
12 Ascoy-Sopalmo 297 irrigation
13 Serral-Salinas 116 irrigation
14 Quibas 114 irrigation l
15 Sierra de Crevillente 55 irrigation
16 Sierra Espuña 298 irrigation
17 Yechar 103 irrigation l
18 Valle del Guadalentin 850 irrigation l
19 Sierra de Carrascoy 72 irrigation
20 Cresta del Gallo 73 irrigation
21 Campo de Cartagena 1580 irrigation l
22 Mazarron 388 irrigation
23 Aguilas 300 irrigation
24 Cuchillos-Cabras 731 irrigation
25 Oropesa-Torreblanca 80 irrigation l
26 Plana de Sagunto 133 irrigation l
27 Jumilla-Villena 65 irrigation, public supply
28 Yecla-Villena-Benejama 481 irrigation, public supply
29 Peñarrubia 47 public supply
30 Serral-Salinas 124 irrigation
31 Argüeña-Maigmó 158 irrigation
32 Barrancones-Carrasqueta 428 public supply l
33 Orcheta 464 irrigation
34 Sierra del Cid 108 irrigation
35 Quibas 212 irrigation l
36 Sierra de Crevillente 52 irrigation
37 Cubetas del Besós 84 industrial supply
38 Baix Llobregat 162 public and industrial supply
39 Penedés 484 public and industrial supply
40 S'Estremera 94 public supply
41 Na Burguesa 73 public supply l
42 Sierras Centrales 380 irrigation
43 San Antonio 98 public supply l
44 San Carlos 63 public supply l
45 Ibiza-Llano Ibiza 126 public supply l
TR Turkey, 131810, 17100 1 Konya plain 10000 1995 demand l
2 Hatay-Amik 1200 1994 demand l l
3 Kç. Menderes 1500 1990 demand l
4 Akarçay 1300 1992 demand l
5 Gediz 2000 1990 demand l
6 Misli 600 1988 demand l
7 Mediterranean side plains 2000 1985 demand l
8 Aegean plains 200 1985 demand l
9 Yalova 100 1985 demand l
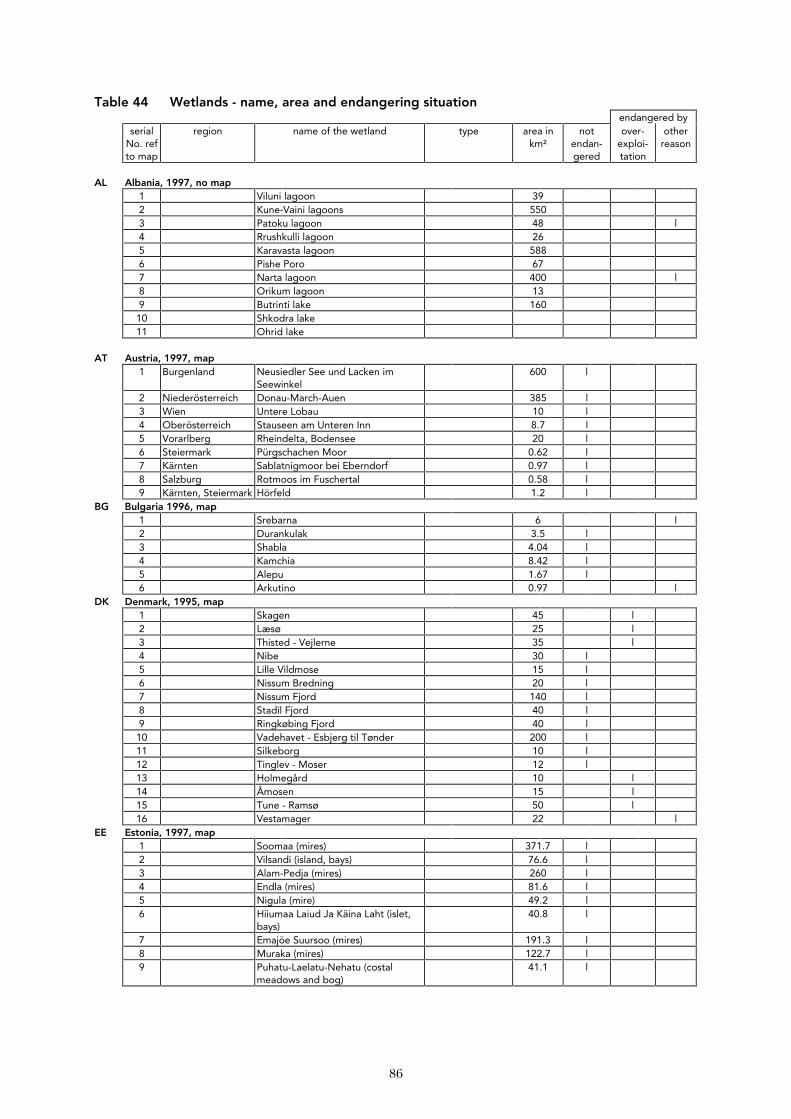
86
Table 44 Wetlands - name, area and endangering situation endangered by
serial No. ref to map
region name of the wetland type area in km²
not endan-gered
over-exploi-tation
other reason
AL Albania, 1997, no map
1 Viluni lagoon 39 2 Kune-Vaini lagoons 550 3 Patoku lagoon 48 l 4 Rrushkulli lagoon 26 5 Karavasta lagoon 588 6 Pishe Poro 67 7 Narta lagoon 400 l 8 Orikum lagoon 13 9 Butrinti lake 160 10 Shkodra lake 11 Ohrid lake
AT Austria, 1997, map 1 Burgenland Neusiedler See und Lacken im
Seewinkel 600 l
2 Niederösterreich Donau-March-Auen 385 l 3 Wien Untere Lobau 10 l 4 Oberösterreich Stauseen am Unteren Inn 8.7 l 5 Vorarlberg Rheindelta, Bodensee 20 l 6 Steiermark Pürgschachen Moor 0.62 l 7 Kärnten Sablatnigmoor bei Eberndorf 0.97 l 8 Salzburg Rotmoos im Fuschertal 0.58 l 9 Kärnten, Steiermark Hörfeld 1.2 l
BG Bulgaria 1996, map 1 Srebarna 6 l 2 Durankulak 3.5 l 3 Shabla 4.04 l 4 Kamchia 8.42 l 5 Alepu 1.67 l 6 Arkutino 0.97 l
DK Denmark, 1995, map 1 Skagen 45 l 2 Læsø 25 l 3 Thisted - Vejlerne 35 l 4 Nibe 30 l 5 Lille Vildmose 15 l 6 Nissum Bredning 20 l 7 Nissum Fjord 140 l 8 Stadil Fjord 40 l 9 Ringkøbing Fjord 40 l 10 Vadehavet - Esbjerg til Tønder 200 l 11 Silkeborg 10 l 12 Tinglev - Moser 12 l 13 Holmegård 10 l 14 Åmosen 15 l 15 Tune - Ramsø 50 l 16 Vestamager 22 l
EE Estonia, 1997, map 1 Soomaa (mires) 371.7 l 2 Vilsandi (island, bays) 76.6 l 3 Alam-Pedja (mires) 260 l 4 Endla (mires) 81.6 l 5 Nigula (mire) 49.2 l 6 Hiiumaa Laiud Ja Käina Laht (islet,
bays) 40.8 l
7 Emajöe Suursoo (mires) 191.3 l 8 Muraka (mires) 122.7 l 9 Puhatu-Laelatu-Nehatu (costal
meadows and bog) 41.1 l
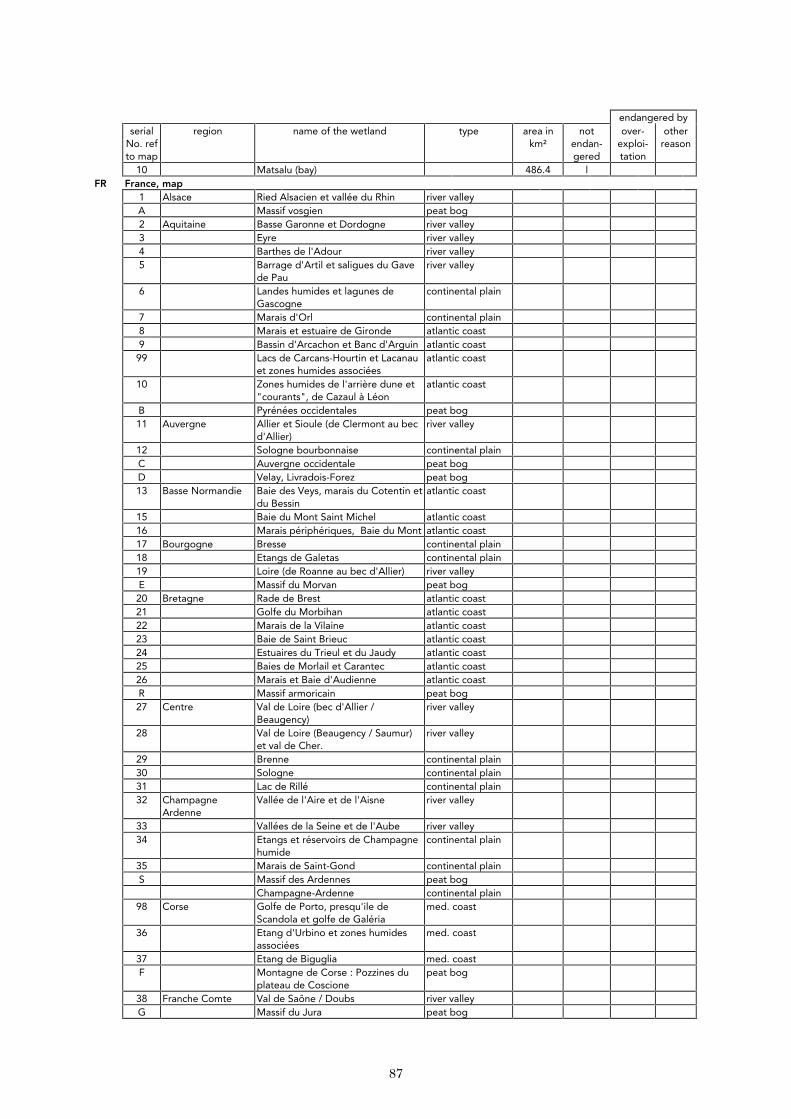
87
endangered by
serial No. ref to map
region name of the wetland type area in km²
not endan-gered
over-exploi-tation
other reason
10 Matsalu (bay) 486.4 l FR France, map
1 Alsace Ried Alsacien et vallée du Rhin river valley A Massif vosgien peat bog 2 Aquitaine Basse Garonne et Dordogne river valley 3 Eyre river valley 4 Barthes de l'Adour river valley 5 Barrage d'Artil et saligues du Gave
de Pau river valley
6 Landes humides et lagunes de Gascogne
continental plain
7 Marais d'Orl continental plain 8 Marais et estuaire de Gironde atlantic coast 9 Bassin d'Arcachon et Banc d'Arguin atlantic coast 99 Lacs de Carcans-Hourtin et Lacanau
et zones humides associées atlantic coast
10 Zones humides de l'arrière dune et "courants", de Cazaul à Léon
atlantic coast
B Pyrénées occidentales peat bog 11 Auvergne Allier et Sioule (de Clermont au bec
d'Allier) river valley
12 Sologne bourbonnaise continental plain C Auvergne occidentale peat bog D Velay, Livradois-Forez peat bog 13 Basse Normandie Baie des Veys, marais du Cotentin et
du Bessin atlantic coast
15 Baie du Mont Saint Michel atlantic coast 16 Marais périphériques, Baie du Mont atlantic coast 17 Bourgogne Bresse continental plain 18 Etangs de Galetas continental plain 19 Loire (de Roanne au bec d'Allier) river valley E Massif du Morvan peat bog 20 Bretagne Rade de Brest atlantic coast 21 Golfe du Morbihan atlantic coast 22 Marais de la Vilaine atlantic coast 23 Baie de Saint Brieuc atlantic coast 24 Estuaires du Trieul et du Jaudy atlantic coast 25 Baies de Morlail et Carantec atlantic coast 26 Marais et Baie d'Audienne atlantic coast R Massif armoricain peat bog 27 Centre Val de Loire (bec d'Allier /
Beaugency) river valley
28 Val de Loire (Beaugency / Saumur) et val de Cher.
river valley
29 Brenne continental plain 30 Sologne continental plain 31 Lac de Rillé continental plain 32 Champagne
Ardenne Vallée de l'Aire et de l'Aisne river valley
33 Vallées de la Seine et de l'Aube river valley 34 Etangs et réservoirs de Champagne
humide continental plain
35 Marais de Saint-Gond continental plain S Massif des Ardennes peat bog Champagne-Ardenne continental plain 98 Corse Golfe de Porto, presqu'ile de
Scandola et golfe de Galéria med. coast
36 Etang d'Urbino et zones humides associées
med. coast
37 Etang de Biguglia med. coast F Montagne de Corse : Pozzines du
plateau de Coscione peat bog
38 Franche Comte Val de Saône / Doubs river valley G Massif du Jura peat bog

88
endangered by
serial No. ref
to map
region name of the wetland type area in km²
not endan-gered
over-exploi-tation
other reason
39 Haute Normandie Estuaire et marais de la Seine atlantic coast 40 Ile de France Seine entre Montereau et
Nogent/Seine (la Bassée) river valley
41 Languedoc-Roussillon
Etangs et salins du Roussillon (de Cante à Vendres)
med. coast
42 Etangs et salins du Languedoc (d'Agde à la Grande Motte)
med. coast
H Massif central Méridional (Cevennes) peat bog J Montagne Noire peat bog K Pyrénées orientales peat bog 43 Limousin Etangs des Landes et étangs
périphériques continental plain
L Plateau du Limousin peat bog 44 Lorraine Moselle (+Meurthe, Seille, Nied,
Sarre) river valley
45 Vallées de Meuse et Chiers river valley 46 Etangs de la Woëvre continental plain 47 Etangs du Sud-Est Mosellan continental plain 48 Midi Pyrenees Garonne en amont de Moissac river valley M Pyrénées centrales peat bog 49 Nord Pas de Calais Scarpe et Escaut river valley 50 Pays de Loire Val de Loire aval (de Saumur à
Nantes) et marais de Basse Maine river valley
51 Marais de Brière atlantic coast 52 Estuaire de la Loire atlantic coast 53 Lac de Grand-Lieu atlantic coast 54 Baie de Bourgneuf, Marais Breton,
et Ile de Noirmoutier atlantic coast
55 Marais de Guérande et Mesquer atlantic coast 56 Marais d'Olonne atlantic coast 57 Marais de Talmont atlantic coast 58 Marais de Mazerolles... continental plain 59 Picardie littoral et marais de l'estuaire
Canche à l'estuaire Somme atlantic coast
60 Somme river valley 61 Poitou Charentes Charente de Villognon à Tonnay-
Charente et affluents river valley
62 Marais de Rochefort, Yves, anse de Fouras et estuaire Charente
atlantic coast
63 Marais de Brouage, de Seudre et d'Oléron
atlantic coast
64 Sèvre niortaise et Venise verte continental plain 65 Marais poitevin, Baie de l'Aiguillon
et marais de Ré atlantic coast
66 Paca Camargue med. coast 67 Zones humides entre Rhône et Crau,
Golfe de Fos et Etang de Berre med. coast
68 Zones humides hyéroises med. coast N Alpes méridionales (Alpes du Sud) peat bog 72 Marais de l'Ile Vieille river valley 69 Rhone Alpes Val de Saône river valley 70 Haut-Rhône, Basse vallée de l'Ain,
lac Léman, lac du Bourget, marais de Lavours et Chautagne
river valley
71 Moyenne vallée du Rhône river valley 73 Val de Drôme river valley 74 Plaine du Forez continental plain 75 Dombes continental plain P Alpes du Nord peat bog
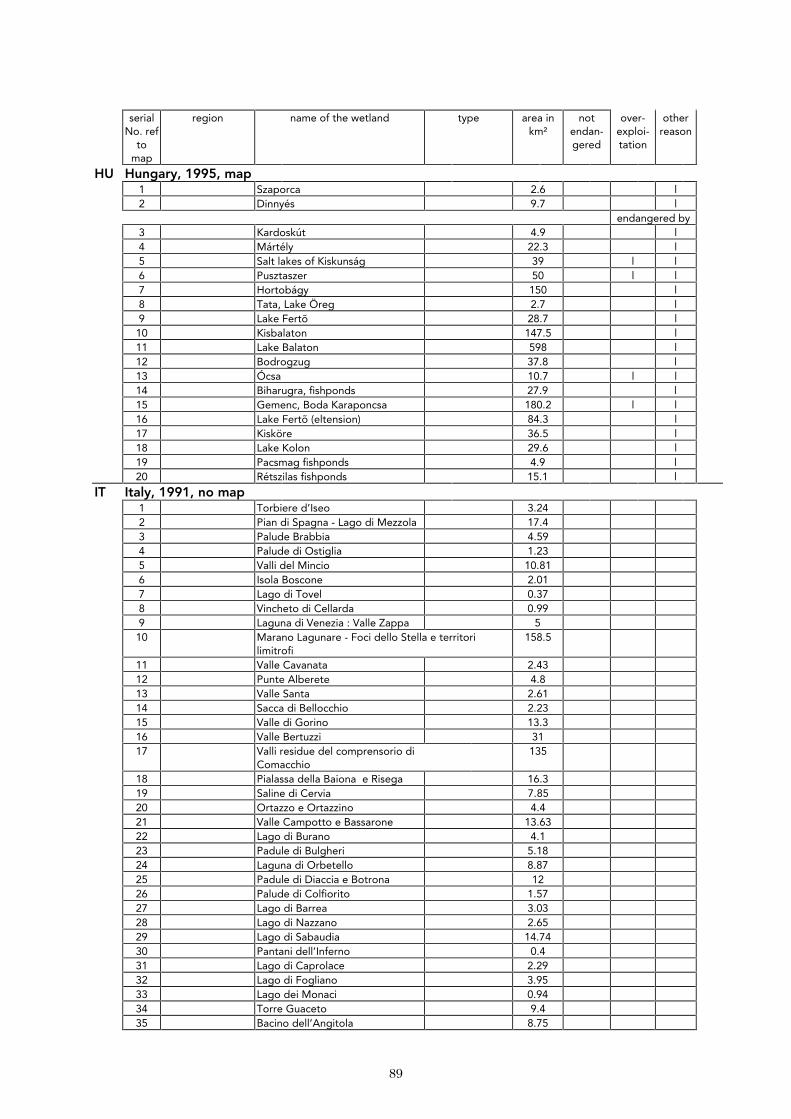
89
serial
No. ref to
map
region name of the wetland type area in km²
not endan-gered
over-exploi-tation
other reason
HU Hungary, 1995, map 1 Szaporca 2.6 l 2 Dinnyés 9.7 l endangered by 3 Kardoskút 4.9 l 4 Mártély 22.3 l 5 Salt lakes of Kiskunság 39 l l 6 Pusztaszer 50 l l 7 Hortobágy 150 l 8 Tata, Lake Öreg 2.7 l 9 Lake Fertõ 28.7 l 10 Kisbalaton 147.5 l 11 Lake Balaton 598 l 12 Bodrogzug 37.8 l 13 Ócsa 10.7 l l 14 Biharugra, fishponds 27.9 l 15 Gemenc, Boda Karaponcsa 180.2 l l 16 Lake Fertõ (eltension) 84.3 l 17 Kisköre 36.5 l 18 Lake Kolon 29.6 l 19 Pacsmag fishponds 4.9 l 20 Rétszilas fishponds 15.1 l
IT Italy, 1991, no map 1 Torbiere d’Iseo 3.24 2 Pian di Spagna - Lago di Mezzola 17.4 3 Palude Brabbia 4.59 4 Palude di Ostiglia 1.23 5 Valli del Mincio 10.81 6 Isola Boscone 2.01 7 Lago di Tovel 0.37 8 Vincheto di Cellarda 0.99 9 Laguna di Venezia : Valle Zappa 5 10 Marano Lagunare - Foci dello Stella e territori
limitrofi 158.5
11 Valle Cavanata 2.43 12 Punte Alberete 4.8 13 Valle Santa 2.61 14 Sacca di Bellocchio 2.23 15 Valle di Gorino 13.3 16 Valle Bertuzzi 31 17 Valli residue del comprensorio di
Comacchio 135
18 Pialassa della Baiona e Risega 16.3 19 Saline di Cervia 7.85 20 Ortazzo e Ortazzino 4.4 21 Valle Campotto e Bassarone 13.63 22 Lago di Burano 4.1 23 Padule di Bulgheri 5.18 24 Laguna di Orbetello 8.87 25 Padule di Diaccia e Botrona 12 26 Palude di Colfiorito 1.57 27 Lago di Barrea 3.03 28 Lago di Nazzano 2.65 29 Lago di Sabaudia 14.74 30 Pantani dell’Inferno 0.4 31 Lago di Caprolace 2.29 32 Lago di Fogliano 3.95 33 Lago dei Monaci 0.94 34 Torre Guaceto 9.4 35 Bacino dell’Angitola 8.75
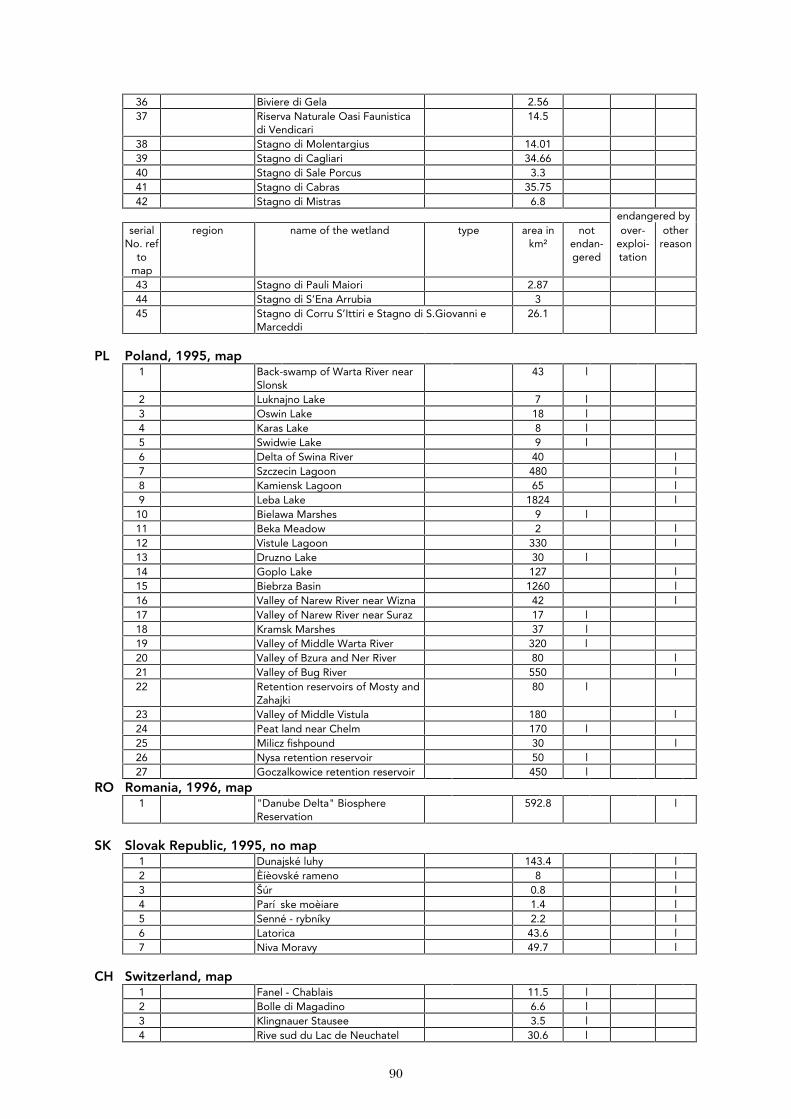
90
36 Biviere di Gela 2.56 37 Riserva Naturale Oasi Faunistica
di Vendicari 14.5
38 Stagno di Molentargius 14.01 39 Stagno di Cagliari 34.66 40 Stagno di Sale Porcus 3.3 41 Stagno di Cabras 35.75 42 Stagno di Mistras 6.8 endangered by
serial No. ref
to map
region name of the wetland type area in km²
not endan-gered
over-exploi-tation
other reason
43 Stagno di Pauli Maiori 2.87 44 Stagno di S’Ena Arrubia 3 45 Stagno di Corru S’Ittiri e Stagno di S.Giovanni e
Marceddi 26.1
PL Poland, 1995, map
1 Back-swamp of Warta River near Slonsk
43 l
2 Luknajno Lake 7 l 3 Oswin Lake 18 l 4 Karas Lake 8 l 5 Swidwie Lake 9 l 6 Delta of Swina River 40 l 7 Szczecin Lagoon 480 l 8 Kamiensk Lagoon 65 l 9 Leba Lake 1824 l 10 Bielawa Marshes 9 l 11 Beka Meadow 2 l 12 Vistule Lagoon 330 l 13 Druzno Lake 30 l 14 Goplo Lake 127 l 15 Biebrza Basin 1260 l 16 Valley of Narew River near Wizna 42 l 17 Valley of Narew River near Suraz 17 l 18 Kramsk Marshes 37 l 19 Valley of Middle Warta River 320 l 20 Valley of Bzura and Ner River 80 l 21 Valley of Bug River 550 l 22 Retention reservoirs of Mosty and
Zahajki 80 l
23 Valley of Middle Vistula 180 l 24 Peat land near Chelm 170 l 25 Milicz fishpound 30 l 26 Nysa retention reservoir 50 l 27 Goczalkowice retention reservoir 450 l
RO Romania, 1996, map 1 "Danube Delta" Biosphere
Reservation 592.8 l
SK Slovak Republic, 1995, no map
1 Dunajské luhy 143.4 l 2 Èíèovské rameno 8 l 3 Šúr 0.8 l 4 Parí ske moèiare 1.4 l 5 Senné - rybníky 2.2 l 6 Latorica 43.6 l 7 Niva Moravy 49.7 l
CH Switzerland, map 1 Fanel - Chablais 11.5 l 2 Bolle di Magadino 6.6 l 3 Klingnauer Stausee 3.5 l 4 Rive sud du Lac de Neuchatel 30.6 l
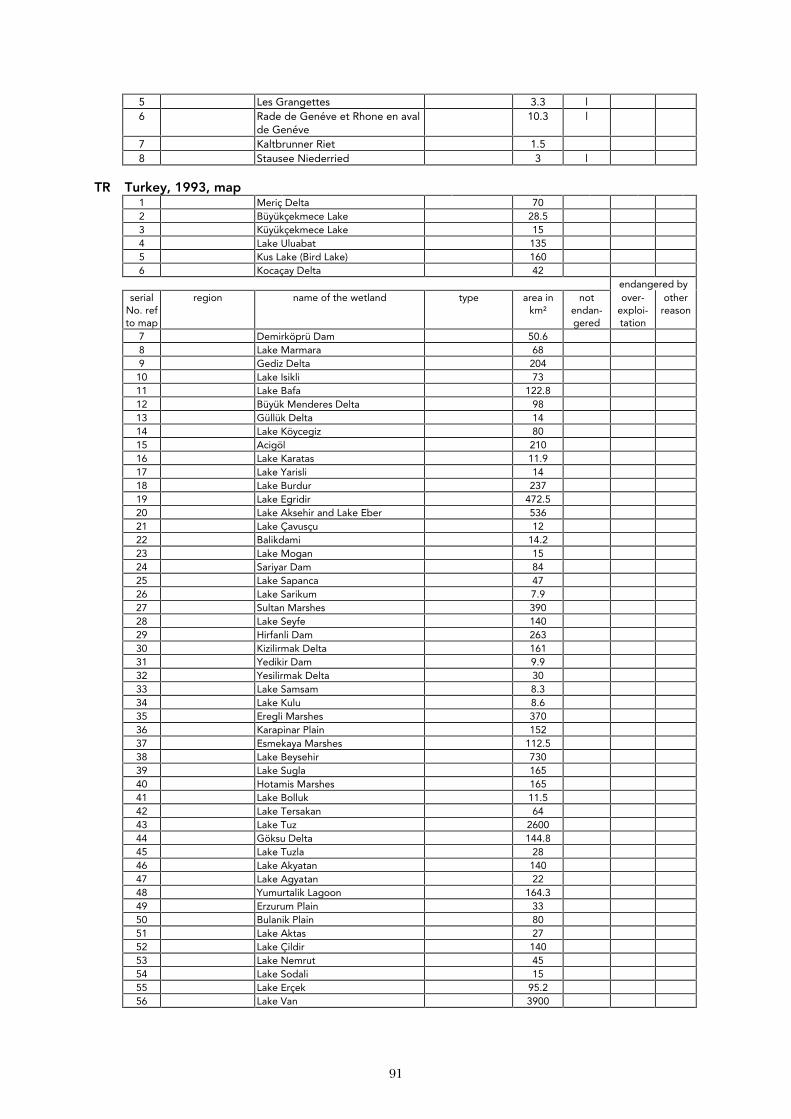
91
5 Les Grangettes 3.3 l 6 Rade de Genéve et Rhone en aval
de Genéve 10.3 l
7 Kaltbrunner Riet 1.5 8 Stausee Niederried 3 l
TR Turkey, 1993, map 1 Meriç Delta 70 2 Büyükçekmece Lake 28.5 3 Küyükçekmece Lake 15 4 Lake Uluabat 135 5 Kus Lake (Bird Lake) 160 6 Kocaçay Delta 42 endangered by
serial No. ref to map
region name of the wetland type area in km²
not endan-gered
over-exploi-tation
other reason
7 Demirköprü Dam 50.6 8 Lake Marmara 68 9 Gediz Delta 204 10 Lake Isikli 73 11 Lake Bafa 122.8 12 Büyük Menderes Delta 98 13 Güllük Delta 14 14 Lake Köycegiz 80 15 Acigöl 210 16 Lake Karatas 11.9 17 Lake Yarisli 14 18 Lake Burdur 237 19 Lake Egridir 472.5 20 Lake Aksehir and Lake Eber 536 21 Lake Çavusçu 12 22 Balikdami 14.2 23 Lake Mogan 15 24 Sariyar Dam 84 25 Lake Sapanca 47 26 Lake Sarikum 7.9 27 Sultan Marshes 390 28 Lake Seyfe 140 29 Hirfanli Dam 263 30 Kizilirmak Delta 161 31 Yedikir Dam 9.9 32 Yesilirmak Delta 30 33 Lake Samsam 8.3 34 Lake Kulu 8.6 35 Eregli Marshes 370 36 Karapinar Plain 152 37 Esmekaya Marshes 112.5 38 Lake Beysehir 730 39 Lake Sugla 165 40 Hotamis Marshes 165 41 Lake Bolluk 11.5 42 Lake Tersakan 64 43 Lake Tuz 2600 44 Göksu Delta 144.8 45 Lake Tuzla 28 46 Lake Akyatan 140 47 Lake Agyatan 22 48 Yumurtalik Lagoon 164.3 49 Erzurum Plain 33 50 Bulanik Plain 80 51 Lake Aktas 27 52 Lake Çildir 140 53 Lake Nemrut 45 54 Lake Sodali 15 55 Lake Erçek 95.2 56 Lake Van 3900
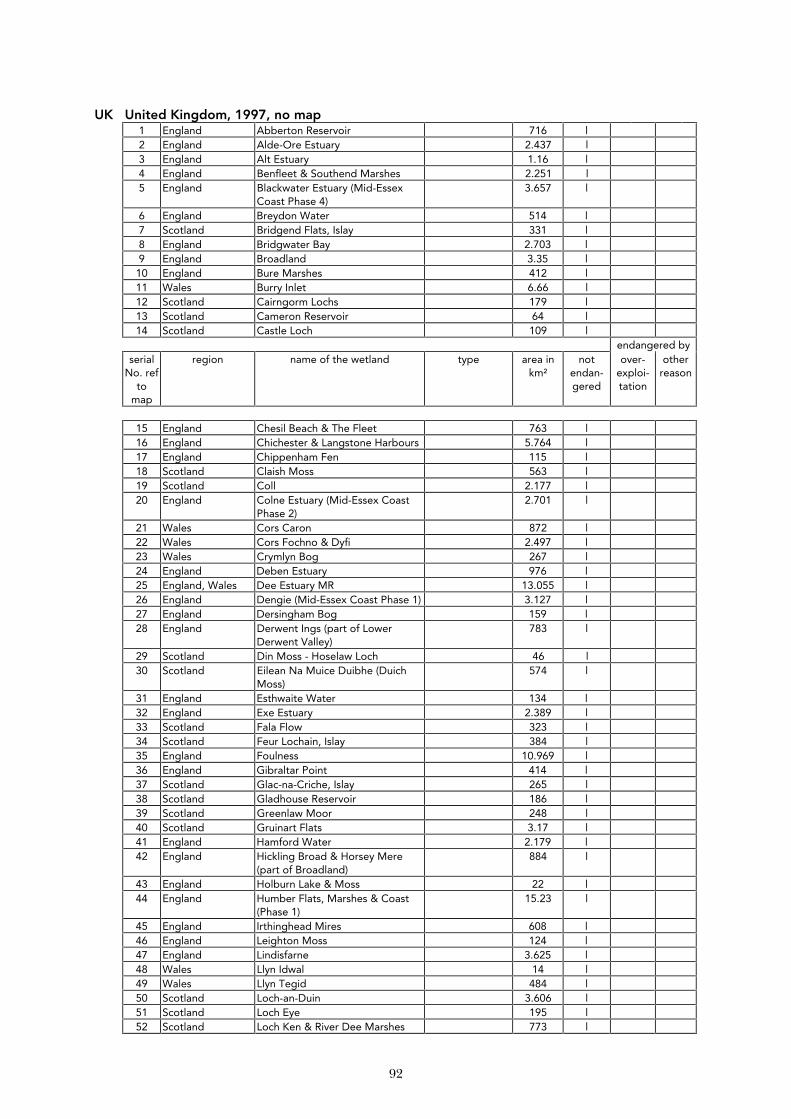
92
UK United Kingdom, 1997, no map 1 England Abberton Reservoir 716 l 2 England Alde-Ore Estuary 2.437 l 3 England Alt Estuary 1.16 l 4 England Benfleet & Southend Marshes 2.251 l 5 England Blackwater Estuary (Mid-Essex
Coast Phase 4) 3.657 l
6 England Breydon Water 514 l 7 Scotland Bridgend Flats, Islay 331 l 8 England Bridgwater Bay 2.703 l 9 England Broadland 3.35 l 10 England Bure Marshes 412 l 11 Wales Burry Inlet 6.66 l 12 Scotland Cairngorm Lochs 179 l 13 Scotland Cameron Reservoir 64 l 14 Scotland Castle Loch 109 l endangered by
serial No. ref
to map
region name of the wetland type area in km²
not endan-gered
over-exploi-tation
other reason
15 England Chesil Beach & The Fleet 763 l 16 England Chichester & Langstone Harbours 5.764 l 17 England Chippenham Fen 115 l 18 Scotland Claish Moss 563 l 19 Scotland Coll 2.177 l 20 England Colne Estuary (Mid-Essex Coast
Phase 2) 2.701 l
21 Wales Cors Caron 872 l 22 Wales Cors Fochno & Dyfi 2.497 l 23 Wales Crymlyn Bog 267 l 24 England Deben Estuary 976 l 25 England, Wales Dee Estuary MR 13.055 l 26 England Dengie (Mid-Essex Coast Phase 1) 3.127 l 27 England Dersingham Bog 159 l 28 England Derwent Ings (part of Lower
Derwent Valley) 783 l
29 Scotland Din Moss - Hoselaw Loch 46 l 30 Scotland Eilean Na Muice Duibhe (Duich
Moss) 574 l
31 England Esthwaite Water 134 l 32 England Exe Estuary 2.389 l 33 Scotland Fala Flow 323 l 34 Scotland Feur Lochain, Islay 384 l 35 England Foulness 10.969 l 36 England Gibraltar Point 414 l 37 Scotland Glac-na-Criche, Islay 265 l 38 Scotland Gladhouse Reservoir 186 l 39 Scotland Greenlaw Moor 248 l 40 Scotland Gruinart Flats 3.17 l 41 England Hamford Water 2.179 l 42 England Hickling Broad & Horsey Mere
(part of Broadland) 884 l
43 England Holburn Lake & Moss 22 l 44 England Humber Flats, Marshes & Coast
(Phase 1) 15.23 l
45 England Irthinghead Mires 608 l 46 England Leighton Moss 124 l 47 England Lindisfarne 3.625 l 48 Wales Llyn Idwal 14 l 49 Wales Llyn Tegid 484 l 50 Scotland Loch-an-Duin 3.606 l 51 Scotland Loch Eye 195 l 52 Scotland Loch Ken & River Dee Marshes 773 l
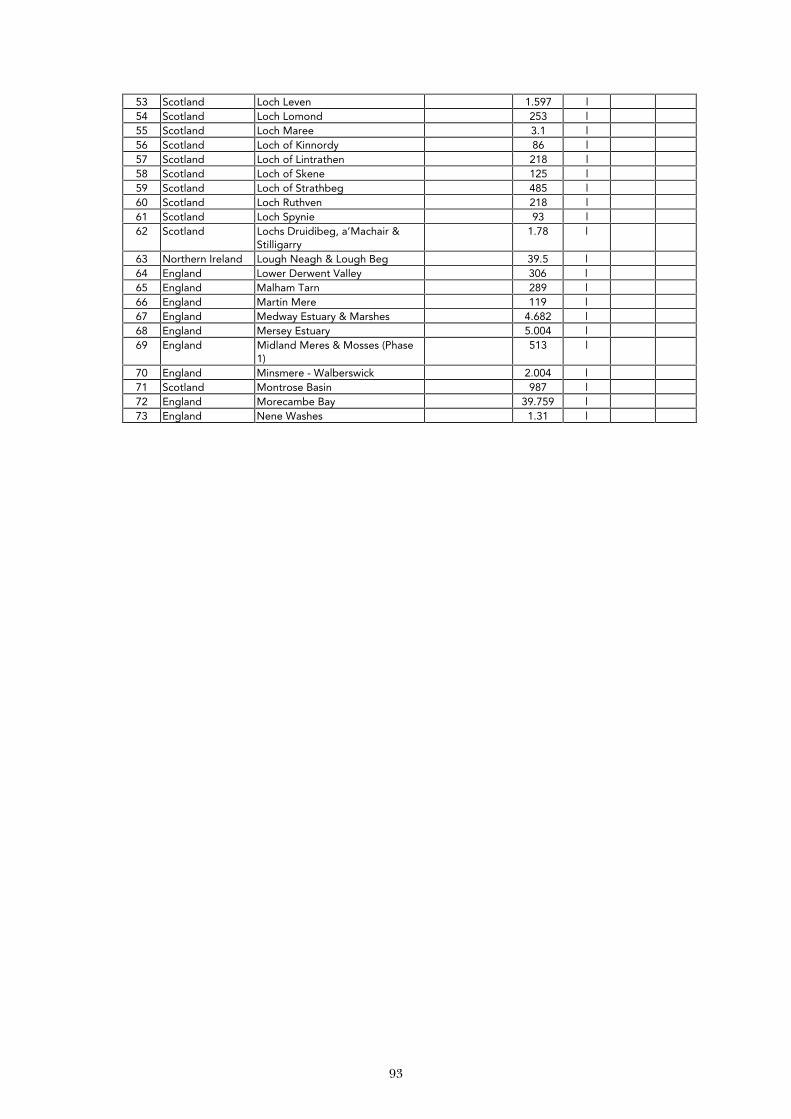
93
53 Scotland Loch Leven 1.597 l 54 Scotland Loch Lomond 253 l 55 Scotland Loch Maree 3.1 l 56 Scotland Loch of Kinnordy 86 l 57 Scotland Loch of Lintrathen 218 l 58 Scotland Loch of Skene 125 l 59 Scotland Loch of Strathbeg 485 l 60 Scotland Loch Ruthven 218 l 61 Scotland Loch Spynie 93 l 62 Scotland Lochs Druidibeg, a’Machair &
Stilligarry 1.78 l
63 Northern Ireland Lough Neagh & Lough Beg 39.5 l 64 England Lower Derwent Valley 306 l 65 England Malham Tarn 289 l 66 England Martin Mere 119 l 67 England Medway Estuary & Marshes 4.682 l 68 England Mersey Estuary 5.004 l 69 England Midland Meres & Mosses (Phase
1) 513 l
70 England Minsmere - Walberswick 2.004 l 71 Scotland Montrose Basin 987 l 72 England Morecambe Bay 39.759 l 73 England Nene Washes 1.31 l
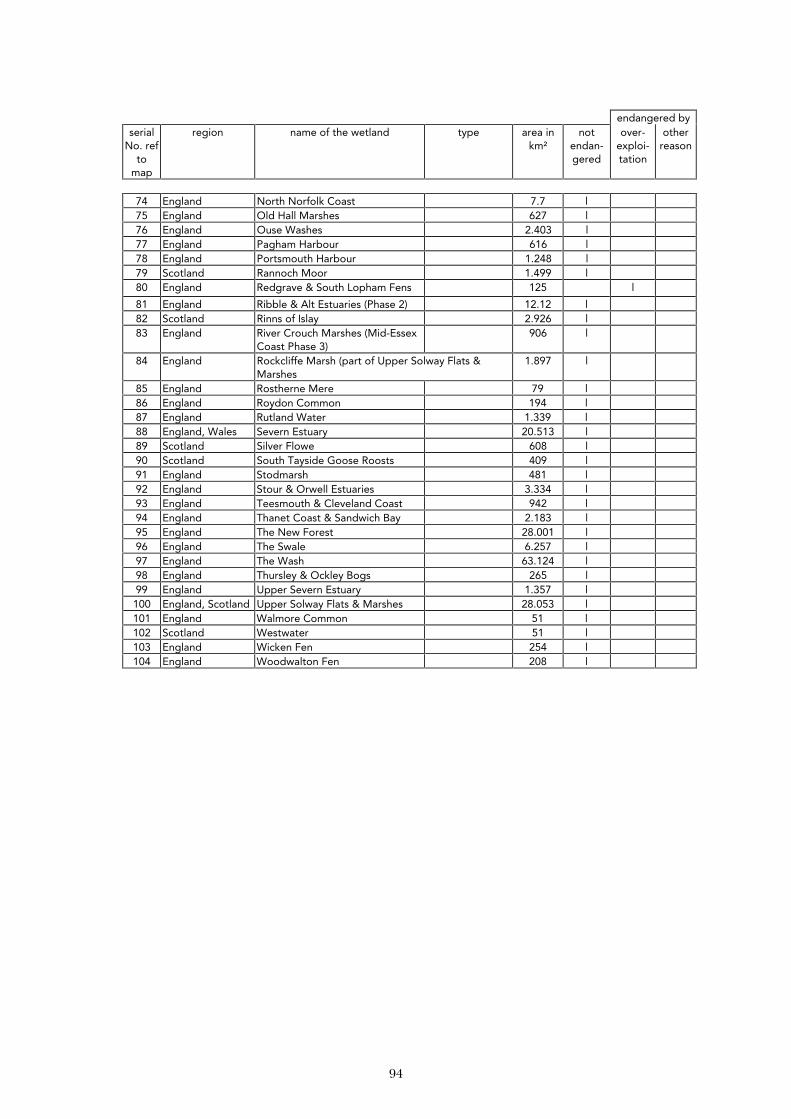
94
endangered by
serial No. ref
to map
region name of the wetland type area in km²
not endan-gered
over-exploi-tation
other reason
74 England North Norfolk Coast 7.7 l 75 England Old Hall Marshes 627 l 76 England Ouse Washes 2.403 l 77 England Pagham Harbour 616 l 78 England Portsmouth Harbour 1.248 l 79 Scotland Rannoch Moor 1.499 l 80 England Redgrave & South Lopham Fens 125 l
81 England Ribble & Alt Estuaries (Phase 2) 12.12 l 82 Scotland Rinns of Islay 2.926 l 83 England River Crouch Marshes (Mid-Essex
Coast Phase 3) 906 l
84 England Rockcliffe Marsh (part of Upper Solway Flats & Marshes
1.897 l
85 England Rostherne Mere 79 l 86 England Roydon Common 194 l 87 England Rutland Water 1.339 l 88 England, Wales Severn Estuary 20.513 l 89 Scotland Silver Flowe 608 l 90 Scotland South Tayside Goose Roosts 409 l 91 England Stodmarsh 481 l 92 England Stour & Orwell Estuaries 3.334 l 93 England Teesmouth & Cleveland Coast 942 l 94 England Thanet Coast & Sandwich Bay 2.183 l 95 England The New Forest 28.001 l 96 England The Swale 6.257 l 97 England The Wash 63.124 l 98 England Thursley & Ockley Bogs 265 l 99 England Upper Severn Estuary 1.357 l 100 England, Scotland Upper Solway Flats & Marshes 28.053 l 101 England Walmore Common 51 l 102 Scotland Westwater 51 l 103 England Wicken Fen 254 l 104 England Woodwalton Fen 208 l
95
References
EUROSTAT (1995) Europe’s Environment: Statistical Compendium for the Dobris Assessment. EUROSTAT (1997) Water resources in Europe. Internal working document. Water/97/4. FAOSTAT (1997) Information from World Wide Web. http://apps.fao.org/ OECD (1995) OECD Environmental Data, Données OCDE sur l’Environnement. Compendium 1995. Yearbook of Nordic Statistics (1996). The Nordic Council of Ministers, Copenhagen 1996.
Groundwater quantity and quality questionnaire
1. Objectives This questionnaire will contribute to a report providing overviews of important groundwater quality and quantity issues to support the further development of the EC Commission’s draft proposal for a Groundwater Action and Water Resources Management Program (GWAP) and to provide information in support of the EEA’s Report to the Commission (5EAP) and Dobris+3 Report. These overviews should reveal the distributions of measured values for certain important indicators of raw/untreated groundwater quality largely in form of maps, other graphical applications and tables. Therefore to make data comparable annual mean values per sampling site are required. Required indicators are nitrate, pesticides, chloride, alkalinity, pH-value and electrical conductivity. For an evaluation of groundwater quantity, problem areas with groundwater over-exploitation, saltwater intrusion and endangered wetlands due to groundwater over-exploitation have to be identified in order to update maps 5.5 and 5.6 in the Dobris report (see Annex). Further, the severity of the most important human interventions in the hydrological cycle with regard to groundwater will be assessed. Consequences for sustainable use and management of resources will be considered. The investigation will be carried out in each European country. 2. Contents This questionnaire comprises questions on measured values with regard to groundwater quality for certain indicators and questions on geographical distributions regarding groundwater quality and quantity to be marked on maps. Groundwater quality
Part 1 General data Part 2 Nitrate - monitoring data Part 3 Pesticide - monitoring data Part 4 Determinand - monitoring data (Chloride, pH-value, Electrical Conductivity and Alkalinity) Part 5 For defining other relevant sources of pollution as well (e.g. heavy metals, hydrocarbons,
acidification,…) Groundwater quantity
Part 6 Quantity data on inland water / groundwater Part 7 Groundwater over-exploitation - average long term Part 8 Wetlands, wet ecosystems Part 9 Human interventions
Required maps Part 10 Maps on important groundwater areas, determinands, groundwater over-exploitation,
wetlands, saltwater intrusion. National strategies
Part 11 National strategies to improve groundwater quality and quantity
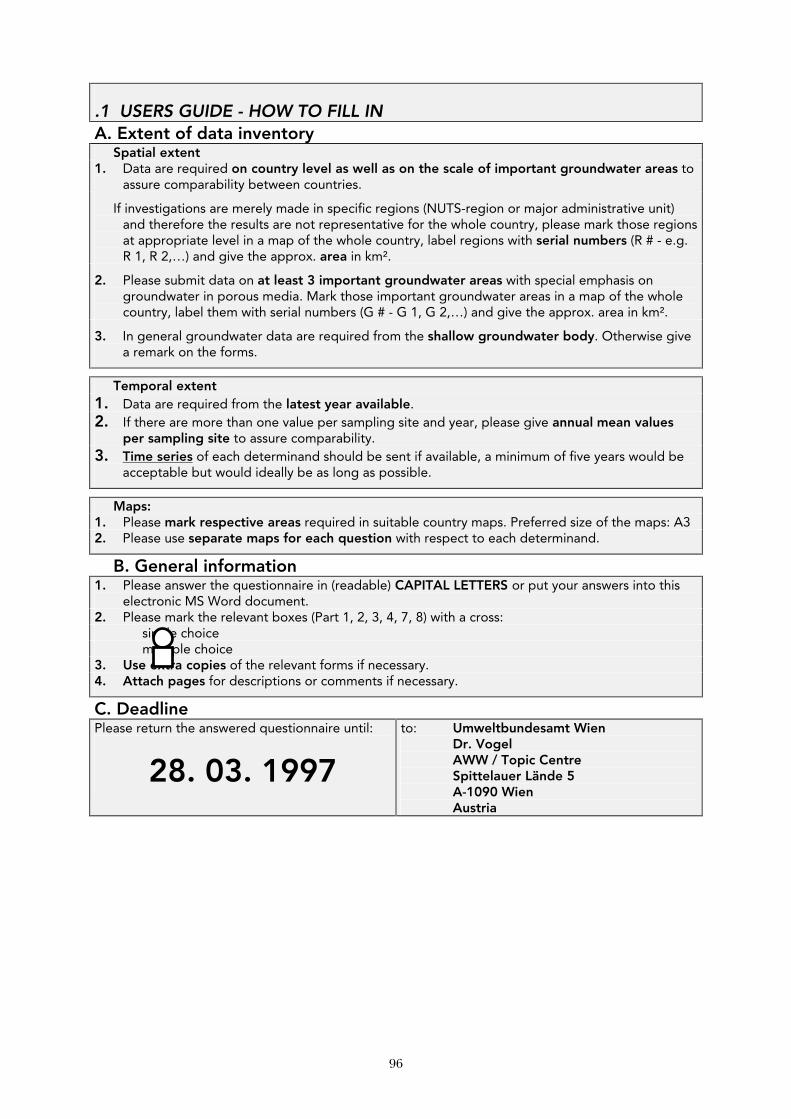
96
.1 USERS GUIDE - HOW TO FILL IN A. Extent of data inventory Spatial extent 1. Data are required on country level as well as on the scale of important groundwater areas to
assure comparability between countries.
If investigations are merely made in specific regions (NUTS-region or major administrative unit) and therefore the results are not representative for the whole country, please mark those regions at appropriate level in a map of the whole country, label regions with serial numbers (R # - e.g. R 1, R 2,…) and give the approx. area in km².
2. Please submit data on at least 3 important groundwater areas with special emphasis on groundwater in porous media. Mark those important groundwater areas in a map of the whole country, label them with serial numbers (G # - G 1, G 2,…) and give the approx. area in km².
3. In general groundwater data are required from the shallow groundwater body. Otherwise give a remark on the forms.
Temporal extent 1. Data are required from the latest year available. 2. If there are more than one value per sampling site and year, please give annual mean values
per sampling site to assure comparability. 3. Time series of each determinand should be sent if available, a minimum of five years would be
acceptable but would ideally be as long as possible.
Maps: 1. Please mark respective areas required in suitable country maps. Preferred size of the maps: A3 2. Please use separate maps for each question with respect to each determinand.
B. General information 1. Please answer the questionnaire in (readable) CAPITAL LETTERS or put your answers into this
electronic MS Word document. 2. Please mark the relevant boxes (Part 1, 2, 3, 4, 7, 8) with a cross: single choice multiple choice 3. Use extra copies of the relevant forms if necessary. 4. Attach pages for descriptions or comments if necessary.
C. Deadline Please return the answered questionnaire until:
28. 03. 1997
to: Umweltbundesamt Wien Dr. Vogel AWW / Topic Centre Spittelauer Lände 5 A-1090 Wien Austria
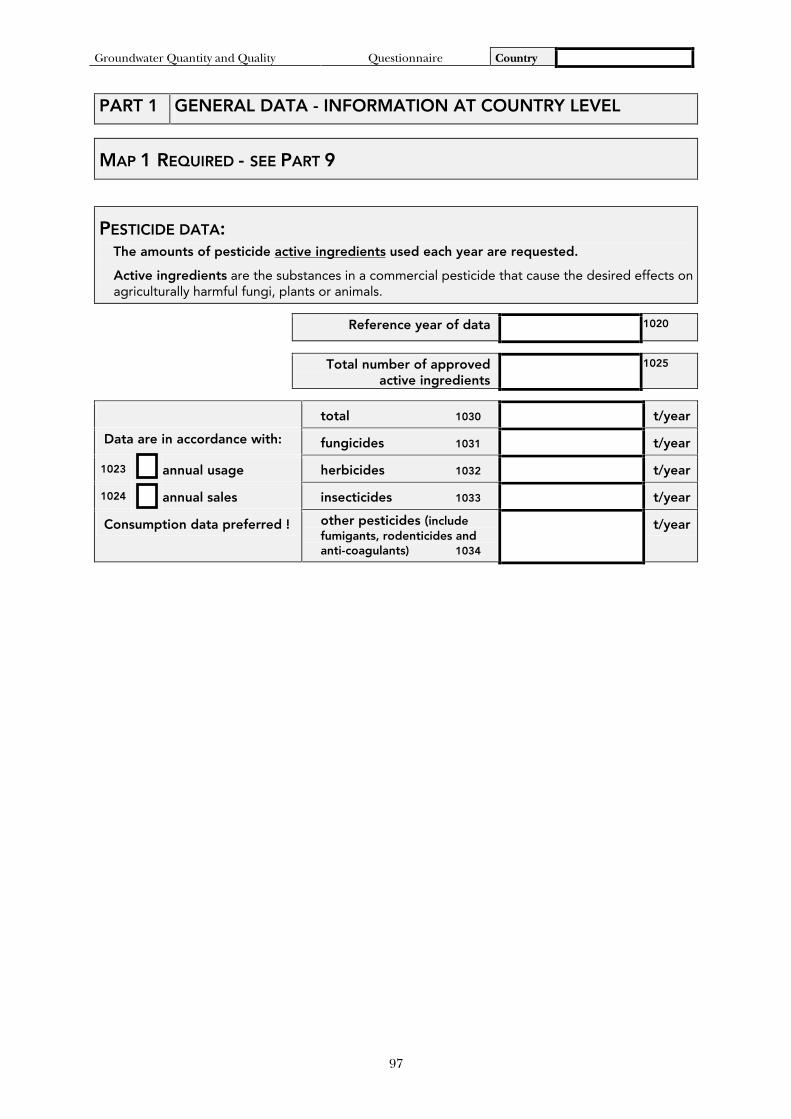
Groundwater Quantity and Quality Questionnaire Country
97
PART 1 GENERAL DATA - INFORMATION AT COUNTRY LEVEL
MAP 1 REQUIRED - SEE PART 9
PESTICIDE DATA: The amounts of pesticide active ingredients used each year are requested.
Active ingredients are the substances in a commercial pesticide that cause the desired effects on agriculturally harmful fungi, plants or animals.
Reference year of data 1020
Total number of approved active ingredients
1025
total 1030 t/year
Data are in accordance with: fungicides 1031 t/year
1023 annual usage herbicides 1032 t/year
1024 annual sales insecticides 1033 t/year
Consumption data preferred ! other pesticides (include fumigants, rodenticides and anti-coagulants) 1034
t/year
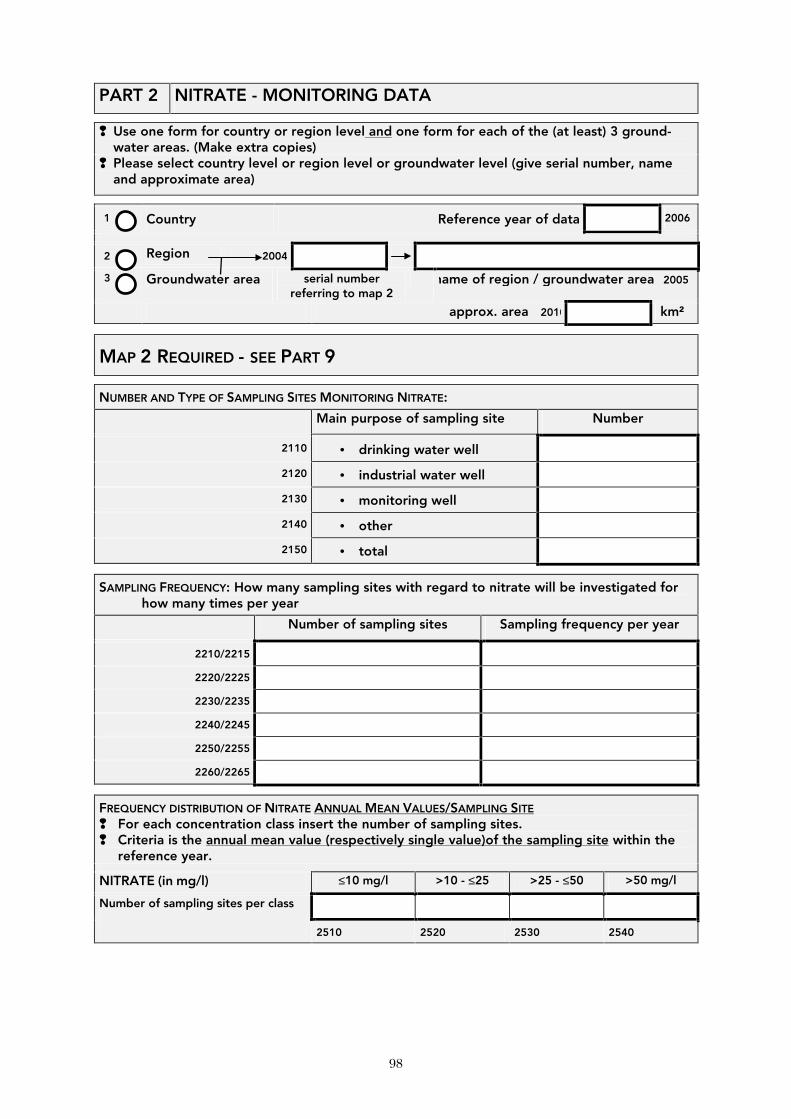
98
PART 2 NITRATE - MONITORING DATA
❢ Use one form for country or region level and one form for each of the (at least) 3 ground-water areas. (Make extra copies)
❢ Please select country level or region level or groundwater level (give serial number, name and approximate area)
1 Country Reference year of data 2006
2 Region 2004
3 Groundwater area serial number referring to map 2
name of region / groundwater area 2005
approx. area 2010 km²
MAP 2 REQUIRED - SEE PART 9
NUMBER AND TYPE OF SAMPLING SITES MONITORING NITRATE:
Main purpose of sampling site Number
2110 • drinking water well
2120 • industrial water well
2130 • monitoring well
2140 • other
2150 • total
SAMPLING FREQUENCY: How many sampling sites with regard to nitrate will be investigated for how many times per year
Number of sampling sites Sampling frequency per year
2210/2215
2220/2225
2230/2235
2240/2245
2250/2255
2260/2265
FREQUENCY DISTRIBUTION OF NITRATE ANNUAL MEAN VALUES/SAMPLING SITE ❢ For each concentration class insert the number of sampling sites. ❢ Criteria is the annual mean value (respectively single value)of the sampling site within the
reference year.
NITRATE (in mg/l) ≤10 mg/l >10 - ≤25 >25 - ≤50 >50 mg/l
Number of sampling sites per class
2510 2520 2530 2540
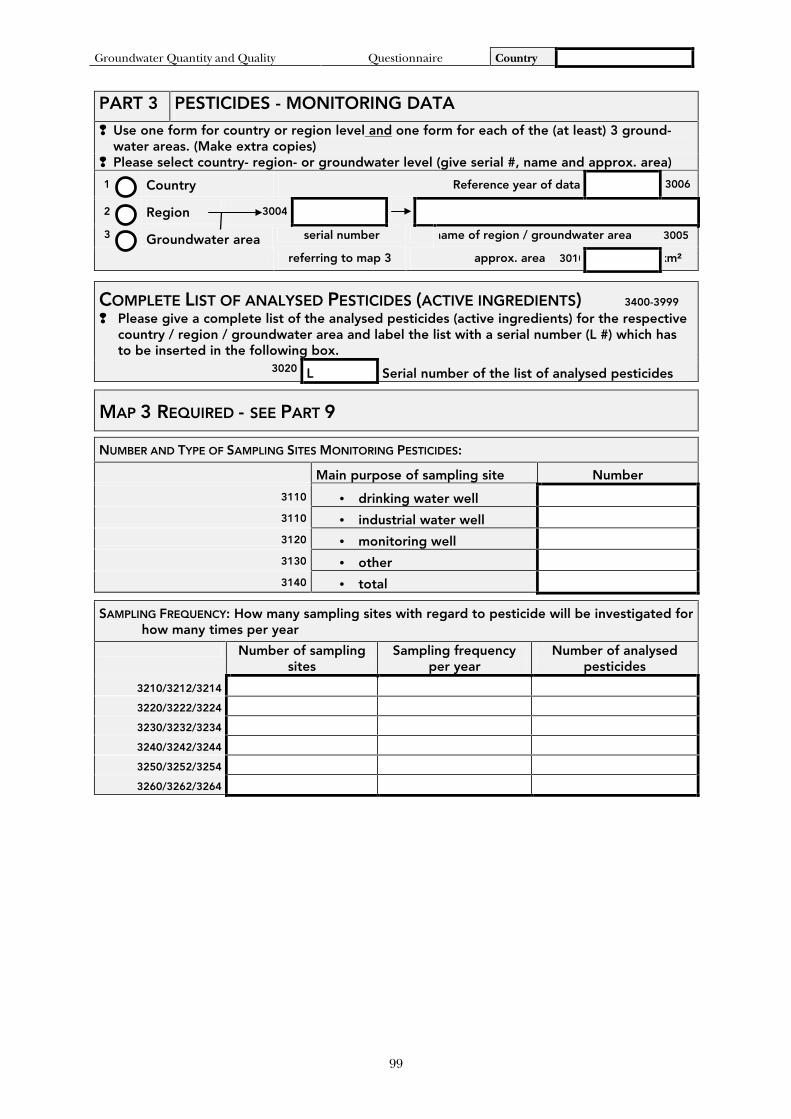
Groundwater Quantity and Quality Questionnaire Country
99
PART 3 PESTICIDES - MONITORING DATA
❢ Use one form for country or region level and one form for each of the (at least) 3 ground-water areas. (Make extra copies)
❢ Please select country- region- or groundwater level (give serial #, name and approx. area)
1 Country Reference year of data 3006
2 Region 3004
3 Groundwater area serial number name of region / groundwater area 3005
referring to map 3 approx. area 3010 km²
COMPLETE LIST OF ANALYSED PESTICIDES (ACTIVE INGREDIENTS) 3400-3999 ❢ Please give a complete list of the analysed pesticides (active ingredients) for the respective
country / region / groundwater area and label the list with a serial number (L #) which has to be inserted in the following box.
3020 L Serial number of the list of analysed pesticides
MAP 3 REQUIRED - SEE PART 9
NUMBER AND TYPE OF SAMPLING SITES MONITORING PESTICIDES:
Main purpose of sampling site Number
3110 • drinking water well
3110 • industrial water well
3120 • monitoring well
3130 • other
3140 • total
SAMPLING FREQUENCY: How many sampling sites with regard to pesticide will be investigated for how many times per year
Number of sampling sites
Sampling frequency per year
Number of analysed pesticides
3210/3212/3214
3220/3222/3224
3230/3232/3234
3240/3242/3244
3250/3252/3254
3260/3262/3264
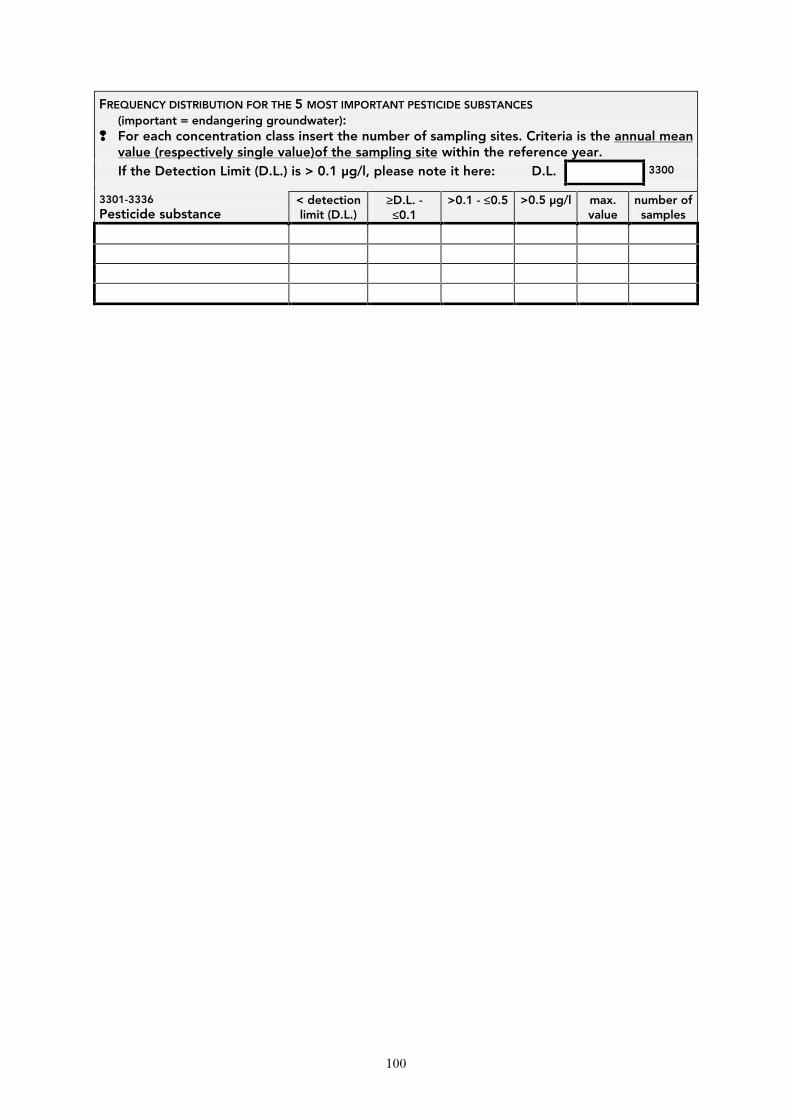
100
FREQUENCY DISTRIBUTION FOR THE 5 MOST IMPORTANT PESTICIDE SUBSTANCES (important = endangering groundwater): ❢ For each concentration class insert the number of sampling sites. Criteria is the annual mean
value (respectively single value)of the sampling site within the reference year. If the Detection Limit (D.L.) is > 0.1 µg/l, please note it here: D.L. 3300
3301-3336 Pesticide substance
< detection limit (D.L.)
≥D.L. - ≤0.1
>0.1 - ≤0.5 >0.5 µg/l max. value
number of samples
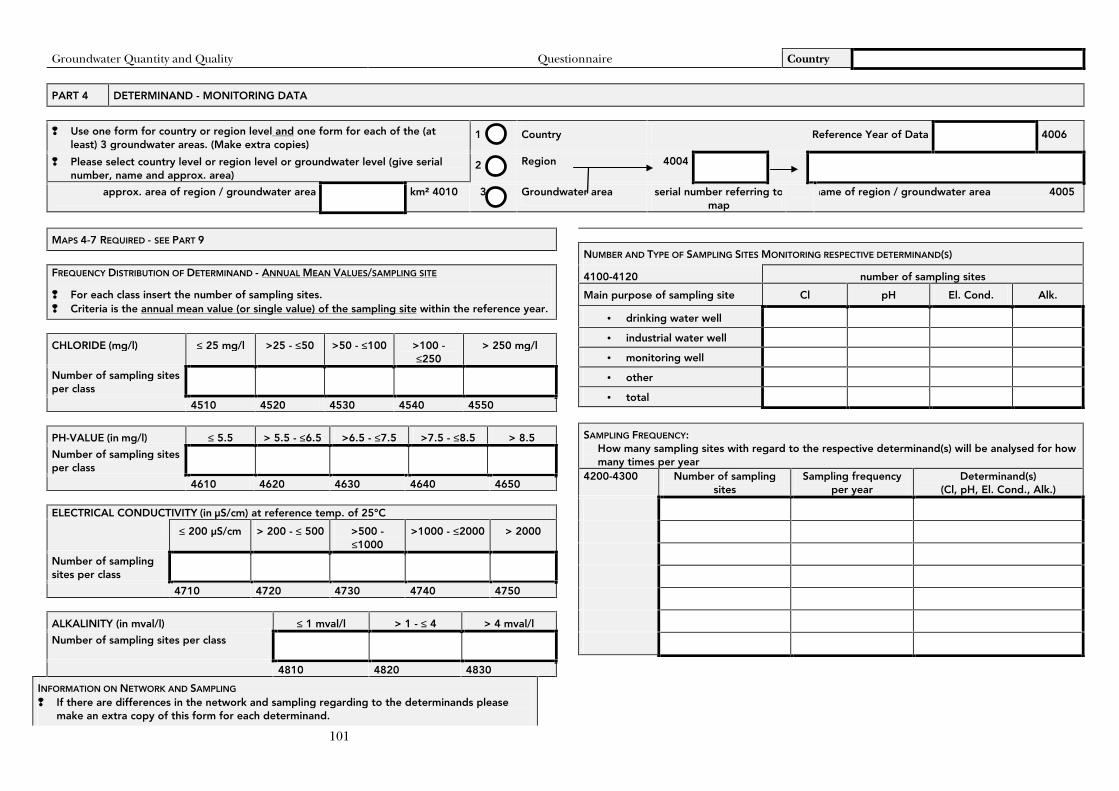
Groundwater Quantity and Quality Questionnaire Country
101
PART 4 DETERMINAND - MONITORING DATA
❢ Use one form for country or region level and one form for each of the (at least) 3 groundwater areas. (Make extra copies)
1 Country Reference Year of Data 4006
❢ Please select country level or region level or groundwater level (give serial number, name and approx. area)
2 Region 4004
approx. area of region / groundwater area km² 4010 3 Groundwater area serial number referring to map
name of region / groundwater area 4005
MAPS 4-7 REQUIRED - SEE PART 9
FREQUENCY DISTRIBUTION OF DETERMINAND - ANNUAL MEAN VALUES/SAMPLING SITE
❢ For each class insert the number of sampling sites. ❢ Criteria is the annual mean value (or single value) of the sampling site within the reference year.
CHLORIDE (mg/l) ≤ 25 mg/l >25 - ≤50 >50 - ≤100 >100 - ≤250
> 250 mg/l
Number of sampling sites per class
4510 4520 4530 4540 4550
PH-VALUE (in mg/l) ≤ 5.5 > 5.5 - ≤6.5 >6.5 - ≤7.5 >7.5 - ≤8.5 > 8.5
Number of sampling sites per class
4610 4620 4630 4640 4650 ELECTRICAL CONDUCTIVITY (in µS/cm) at reference temp. of 25°C
≤ 200 µS/cm > 200 - ≤ 500 >500 - ≤1000
>1000 - ≤2000 > 2000
Number of sampling sites per class
4710 4720 4730 4740 4750
ALKALINITY (in mval/l) ≤ 1 mval/l > 1 - ≤ 4 > 4 mval/l
Number of sampling sites per class
4810 4820 4830
INFORMATION ON NETWORK AND SAMPLING ❢ If there are differences in the network and sampling regarding to the determinands please
make an extra copy of this form for each determinand.
NUMBER AND TYPE OF SAMPLING SITES MONITORING RESPECTIVE DETERMINAND(S)
4100-4120 number of sampling sites
Main purpose of sampling site Cl pH El. Cond. Alk.
• drinking water well
• industrial water well
• monitoring well
• other
• total
SAMPLING FREQUENCY: How many sampling sites with regard to the respective determinand(s) will be analysed for how many times per year
4200-4300 Number of sampling sites
Sampling frequency per year
Determinand(s) (Cl, pH, El. Cond., Alk.)
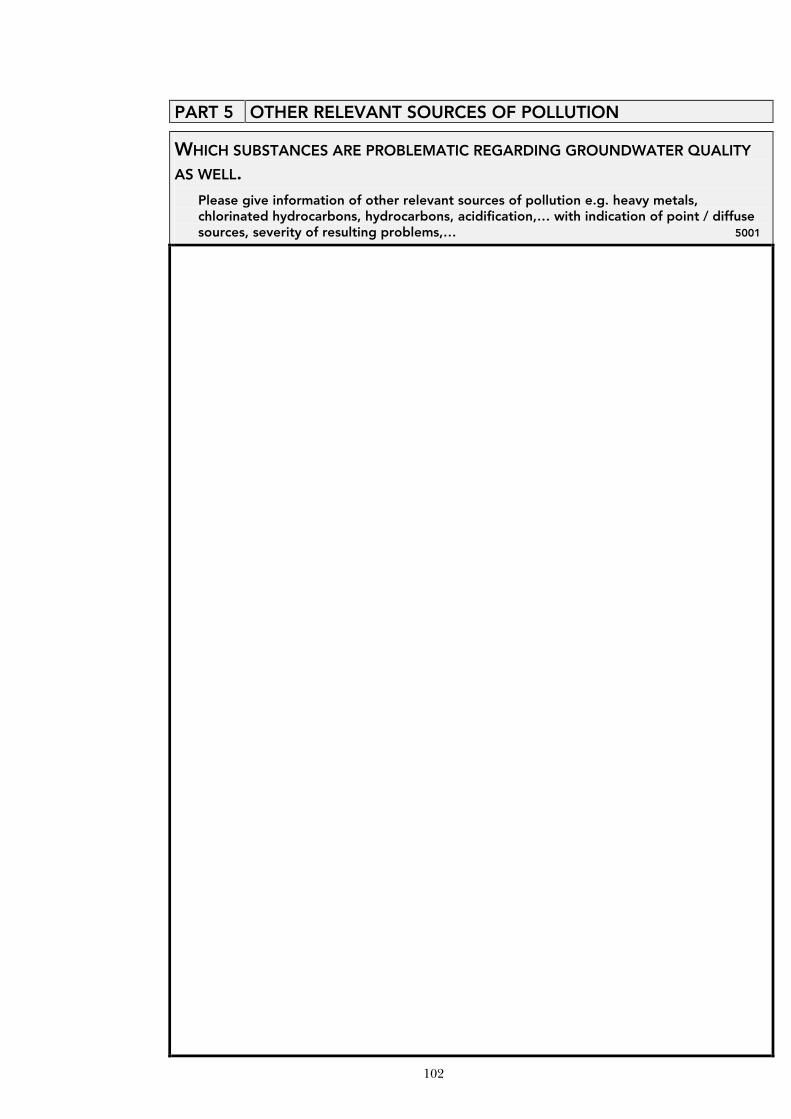
102
PART 5 OTHER RELEVANT SOURCES OF POLLUTION
WHICH SUBSTANCES ARE PROBLEMATIC REGARDING GROUNDWATER QUALITY
AS WELL. Please give information of other relevant sources of pollution e.g. heavy metals, chlorinated hydrocarbons, hydrocarbons, acidification,… with indication of point / diffuse sources, severity of resulting problems,… 5001
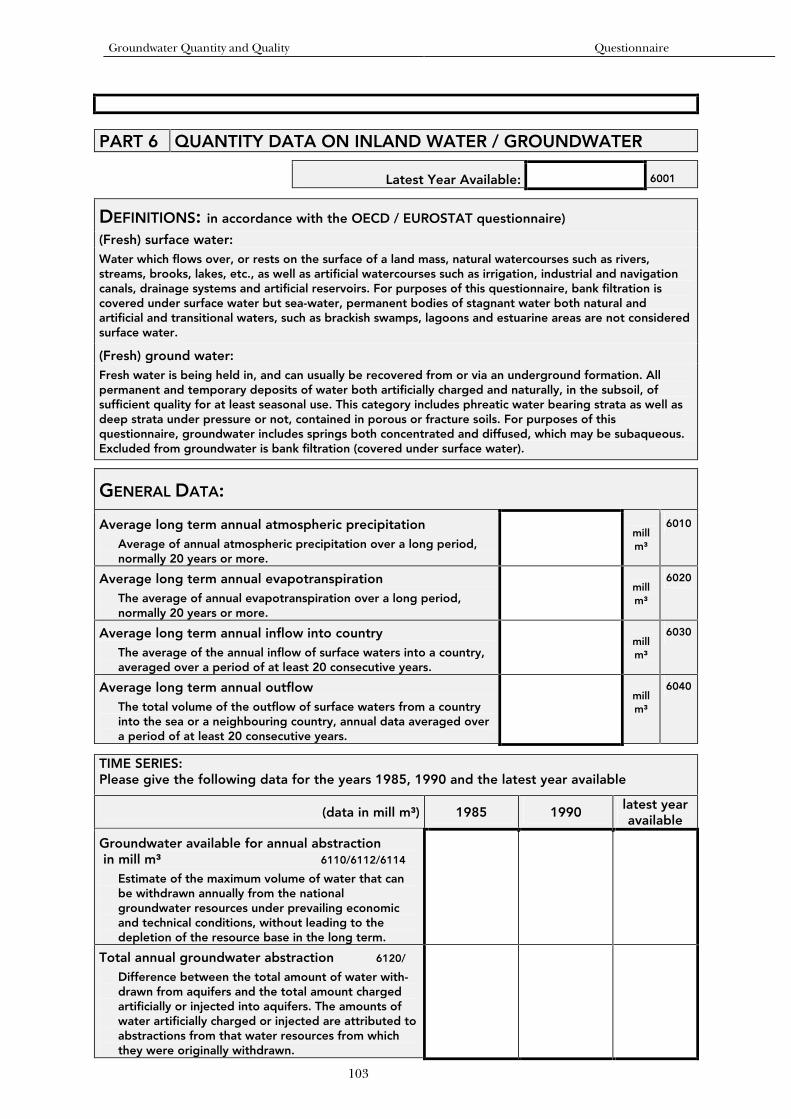
Groundwater Quantity and Quality Questionnaire
103
PART 6 QUANTITY DATA ON INLAND WATER / GROUNDWATER
Latest Year Available: 6001
DEFINITIONS: in accordance with the OECD / EUROSTAT questionnaire) (Fresh) surface water: Water which flows over, or rests on the surface of a land mass, natural watercourses such as rivers, streams, brooks, lakes, etc., as well as artificial watercourses such as irrigation, industrial and navigation canals, drainage systems and artificial reservoirs. For purposes of this questionnaire, bank filtration is covered under surface water but sea-water, permanent bodies of stagnant water both natural and artificial and transitional waters, such as brackish swamps, lagoons and estuarine areas are not considered surface water.
(Fresh) ground water: Fresh water is being held in, and can usually be recovered from or via an underground formation. All permanent and temporary deposits of water both artificially charged and naturally, in the subsoil, of sufficient quality for at least seasonal use. This category includes phreatic water bearing strata as well as deep strata under pressure or not, contained in porous or fracture soils. For purposes of this questionnaire, groundwater includes springs both concentrated and diffused, which may be subaqueous. Excluded from groundwater is bank filtration (covered under surface water).
GENERAL DATA:
Average long term annual atmospheric precipitation Average of annual atmospheric precipitation over a long period,
normally 20 years or more.
mill m³
6010
Average long term annual evapotranspiration The average of annual evapotranspiration over a long period,
normally 20 years or more.
mill m³
6020
Average long term annual inflow into country The average of the annual inflow of surface waters into a country,
averaged over a period of at least 20 consecutive years.
mill m³
6030
Average long term annual outflow The total volume of the outflow of surface waters from a country
into the sea or a neighbouring country, annual data averaged over a period of at least 20 consecutive years.
mill m³
6040
TIME SERIES: Please give the following data for the years 1985, 1990 and the latest year available
(data in mill m³) 1985 1990 latest year available
Groundwater available for annual abstraction in mill m³ 6110/6112/6114 Estimate of the maximum volume of water that can
be withdrawn annually from the national groundwater resources under prevailing economic and technical conditions, without leading to the depletion of the resource base in the long term.
Total annual groundwater abstraction 6120/ Difference between the total amount of water with-
drawn from aquifers and the total amount charged artificially or injected into aquifers. The amounts of water artificially charged or injected are attributed to abstractions from that water resources from which they were originally withdrawn.
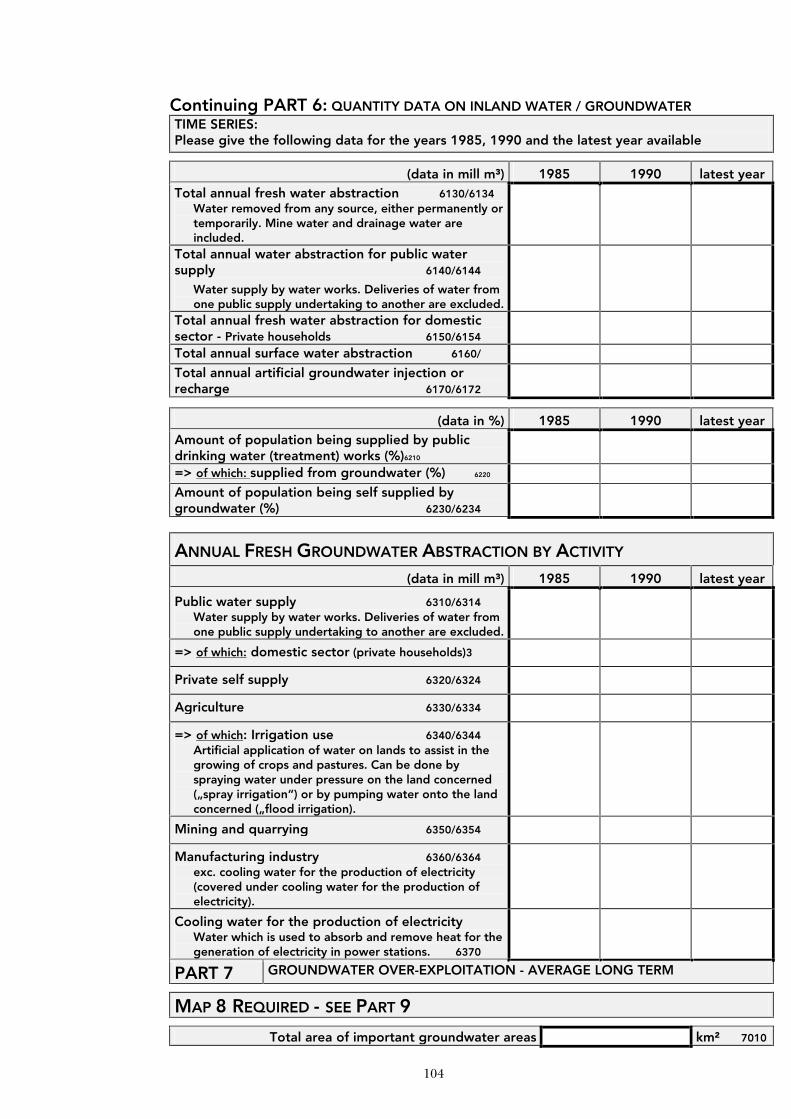
104
Continuing PART 6: QUANTITY DATA ON INLAND WATER / GROUNDWATER TIME SERIES: Please give the following data for the years 1985, 1990 and the latest year available
(data in mill m³) 1985 1990 latest year Total annual fresh water abstraction 6130/6134 Water removed from any source, either permanently or
temporarily. Mine water and drainage water are included.
Total annual water abstraction for public water supply 6140/6144 Water supply by water works. Deliveries of water from
one public supply undertaking to another are excluded.
Total annual fresh water abstraction for domestic sector - Private households 6150/6154
Total annual surface water abstraction 6160/
Total annual artificial groundwater injection or recharge 6170/6172
(data in %) 1985 1990 latest year Amount of population being supplied by public drinking water (treatment) works (%)6210
=> of which: supplied from groundwater (%) 6220
Amount of population being self supplied by groundwater (%) 6230/6234
ANNUAL FRESH GROUNDWATER ABSTRACTION BY ACTIVITY (data in mill m³) 1985 1990 latest year
Public water supply 6310/6314 Water supply by water works. Deliveries of water from
one public supply undertaking to another are excluded.
=> of which: domestic sector (private households)3
Private self supply 6320/6324
Agriculture 6330/6334
=> of which: Irrigation use 6340/6344 Artificial application of water on lands to assist in the
growing of crops and pastures. Can be done by spraying water under pressure on the land concerned („spray irrigation“) or by pumping water onto the land concerned („flood irrigation).
Mining and quarrying 6350/6354
Manufacturing industry 6360/6364 exc. cooling water for the production of electricity
(covered under cooling water for the production of electricity).
Cooling water for the production of electricity Water which is used to absorb and remove heat for the
generation of electricity in power stations. 6370
PART 7 GROUNDWATER OVER-EXPLOITATION - AVERAGE LONG TERM
MAP 8 REQUIRED - SEE PART 9
Total area of important groundwater areas km² 7010
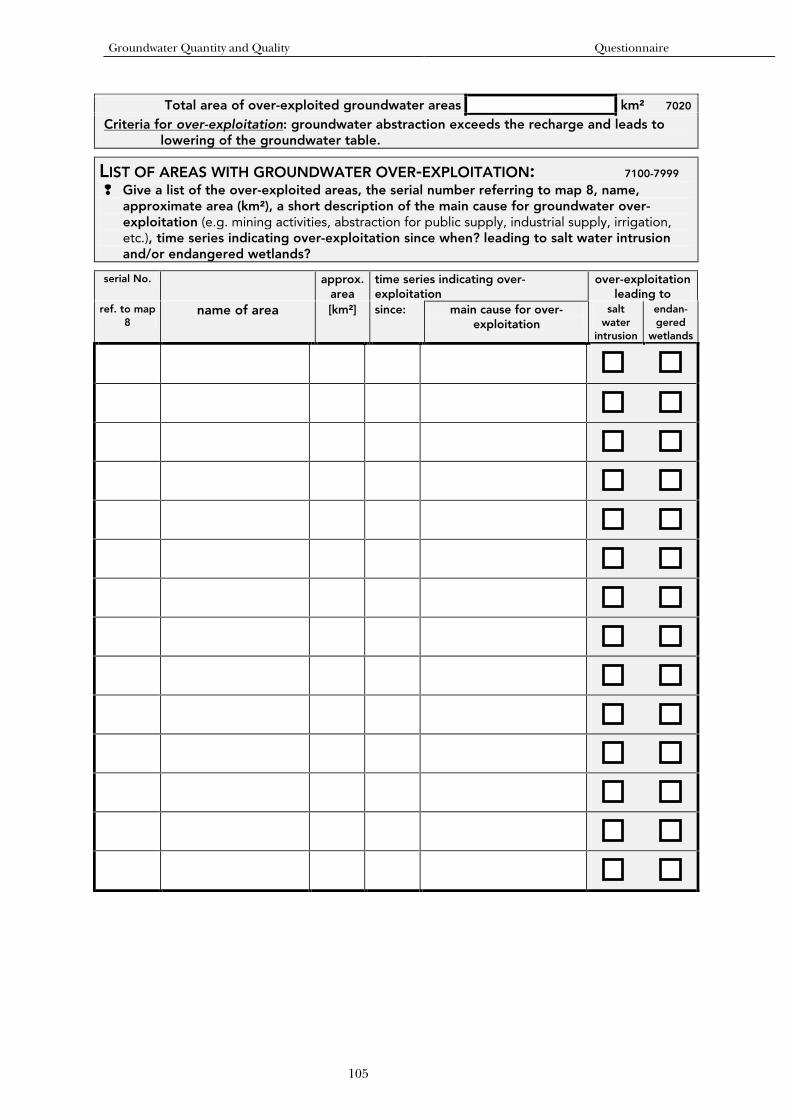
Groundwater Quantity and Quality Questionnaire
105
Total area of over-exploited groundwater areas km² 7020 Criteria for over-exploitation: groundwater abstraction exceeds the recharge and leads to
lowering of the groundwater table.
LIST OF AREAS WITH GROUNDWATER OVER-EXPLOITATION: 7100-7999
❢ Give a list of the over-exploited areas, the serial number referring to map 8, name, approximate area (km²), a short description of the main cause for groundwater over-exploitation (e.g. mining activities, abstraction for public supply, industrial supply, irrigation, etc.), time series indicating over-exploitation since when? leading to salt water intrusion and/or endangered wetlands?
serial No. approx. area
time series indicating over-exploitation
over-exploitation leading to
ref. to map 8
name of area [km²] since: main cause for over-exploitation
salt water
intrusion
endan-gered
wetlands
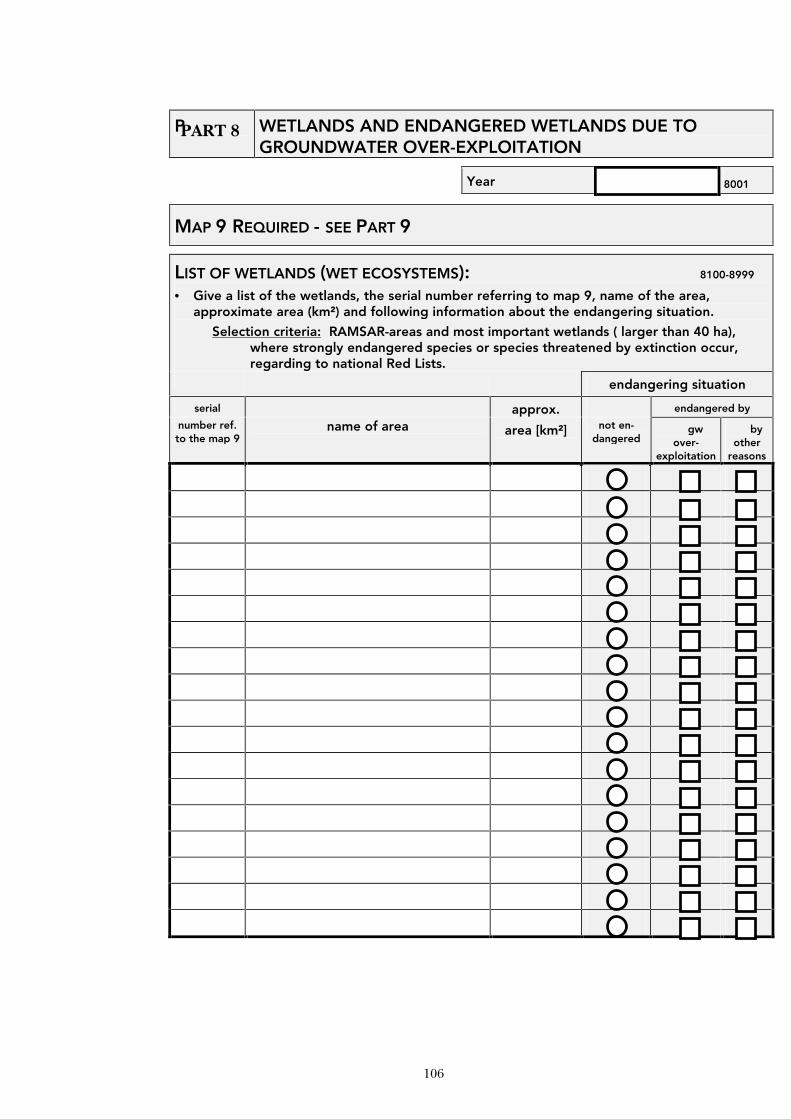
106
P WETLANDS AND ENDANGERED WETLANDS DUE TO GROUNDWATER OVER-EXPLOITATION
Year 8001
MAP 9 REQUIRED - SEE PART 9
LIST OF WETLANDS (WET ECOSYSTEMS): 8100-8999 • Give a list of the wetlands, the serial number referring to map 9, name of the area,
approximate area (km²) and following information about the endangering situation.
Selection criteria: RAMSAR-areas and most important wetlands ( larger than 40 ha), where strongly endangered species or species threatened by extinction occur, regarding to national Red Lists.
endangering situation
serial approx. endangered by
number ref. to the map 9
name of area area [km²] not en-dangered
gw over-
exploitation
by other
reasons
PART 8
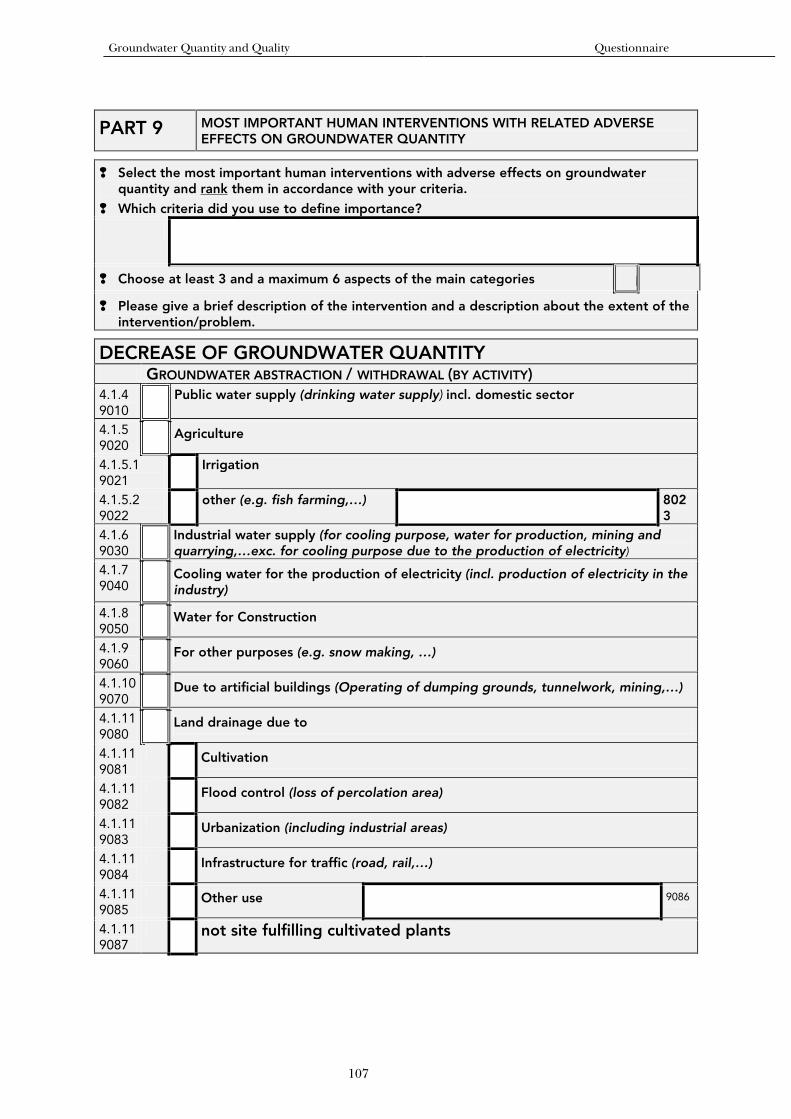
Groundwater Quantity and Quality Questionnaire
107
PART 9 MOST IMPORTANT HUMAN INTERVENTIONS WITH RELATED ADVERSE EFFECTS ON GROUNDWATER QUANTITY
❢ Select the most important human interventions with adverse effects on groundwater quantity and rank them in accordance with your criteria.
❢ Which criteria did you use to define importance?
❢ Choose at least 3 and a maximum 6 aspects of the main categories #
❢ Please give a brief description of the intervention and a description about the extent of the intervention/problem.
DECREASE OF GROUNDWATER QUANTITY GROUNDWATER ABSTRACTION / WITHDRAWAL (BY ACTIVITY) 4.1.4 9010 Public water supply (drinking water supply) incl. domestic sector
4.1.5 9020 Agriculture
4.1.5.1 9021 Irrigation
4.1.5.2 9022 other (e.g. fish farming,…) 802
3 4.1.6 9030 Industrial water supply (for cooling purpose, water for production, mining and
quarrying,…exc. for cooling purpose due to the production of electricity) 4.1.7 9040 Cooling water for the production of electricity (incl. production of electricity in the
industry)
4.1.8 9050 Water for Construction
4.1.9 9060 For other purposes (e.g. snow making, …)
4.1.109070 Due to artificial buildings (Operating of dumping grounds, tunnelwork, mining,…)
4.1.119080 Land drainage due to
4.1.11 9081
Cultivation
4.1.11 9082
Flood control (loss of percolation area)
4.1.11 9083
Urbanization (including industrial areas)
4.1.11 9084
Infrastructure for traffic (road, rail,…)
4.1.11 9085
Other use 9086
4.1.11 9087
not site fulfilling cultivated plants
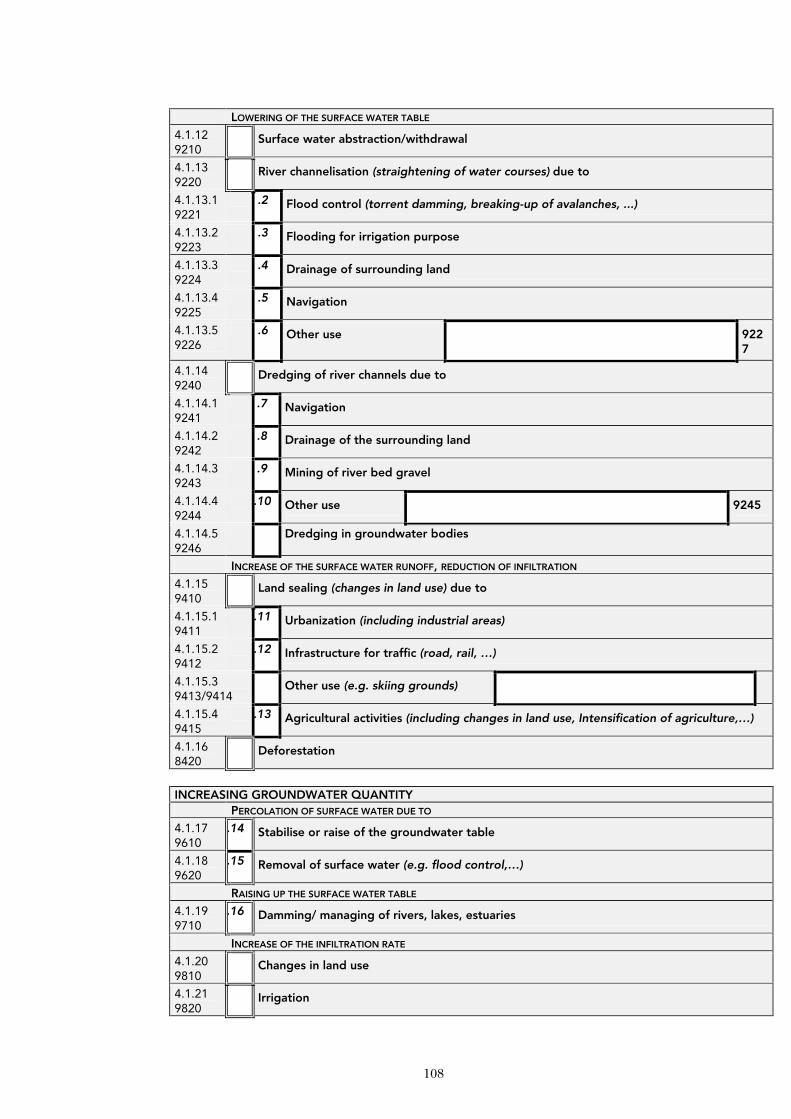
108
LOWERING OF THE SURFACE WATER TABLE
4.1.12 9210
Surface water abstraction/withdrawal
4.1.13 9220
River channelisation (straightening of water courses) due to
4.1.13.1 9221
.2 Flood control (torrent damming, breaking-up of avalanches, ...)
4.1.13.2 9223
.3 Flooding for irrigation purpose
4.1.13.3 9224
.4 Drainage of surrounding land
4.1.13.4 9225
.5 Navigation
4.1.13.5 9226
.6 Other use 9227
4.1.14 9240
Dredging of river channels due to
4.1.14.1 9241
.7 Navigation
4.1.14.2 9242
.8 Drainage of the surrounding land
4.1.14.3 9243
.9 Mining of river bed gravel
4.1.14.4 9244
.10 Other use 9245
4.1.14.5 9246
Dredging in groundwater bodies
INCREASE OF THE SURFACE WATER RUNOFF, REDUCTION OF INFILTRATION
4.1.15 9410
Land sealing (changes in land use) due to
4.1.15.19411
.11 Urbanization (including industrial areas)
4.1.15.29412
.12 Infrastructure for traffic (road, rail, …)
4.1.15.3 9413/9414
Other use (e.g. skiing grounds)
4.1.15.49415
.13 Agricultural activities (including changes in land use, Intensification of agriculture,…)
4.1.16 8420
Deforestation
INCREASING GROUNDWATER QUANTITY PERCOLATION OF SURFACE WATER DUE TO
4.1.17 9610
.14 Stabilise or raise of the groundwater table
4.1.18 9620
.15 Removal of surface water (e.g. flood control,…)
RAISING UP THE SURFACE WATER TABLE
4.1.19 9710
.16 Damming/ managing of rivers, lakes, estuaries
INCREASE OF THE INFILTRATION RATE
4.1.20 9810
Changes in land use
4.1.21 9820
Irrigation
Groundwater Quantity and Quality Questionnaire
109
Description - Extent:
110
PART 10 REQUIRED MAPS
SCALE: Preferred size of the maps is A3
LEGEND: The legends should correspond to the listed points of map 1- map 10
MAP 1 - GENERAL INFORMATION (see Part 1)
Please mark: • At least the three most important groundwater areas as well as karst areas, attach hydrogeological map if available;
• Areas with no groundwater; • Areas with no information about groundwater occurrence
MAP 2 - NITRATE (see Part 2) Please mark: • Important groundwater areas investigated on nitrate. Label them with serial
numbers referring to the form of Part 2. • Problem areas with 2 zones. Proposed criteria for problem areas:
• Zone 1: ≥25% of the sampling sites within a region/area, where the annual mean value exceeds 25 mg/l but is ≤ 50 mg/l
• Zone 2: ≥25% of the sampling sites within a region/area, where the annual mean value exceeds 50 mg/l
MAP 3 - PESTICIDES (see Part 3)
Please mark: • Important groundwater areas investigated on pesticides. Label them with serial numbers referring to the form of Part 3.
• Problem areas. Proposed criteria for problem areas: ≥25% of the sampling sites within a region/area, where the annual mean value exceeds 0.1 µg/l for the most detected (important) substances.
MAP 4 - CHLORIDE (see Part 2)
Please mark: • Important groundwater areas investigated on chloride. Label them with serial numbers referring to the form of Part 2.
• Problem areas. Proposed criteria for problem areas: ≥25% of the sampling sites within a region/area where the annual mean
value exceeds 250 mg/l.
MAP 5 - PH-VALUE (see Part 2)
Please mark: • Important groundwater areas investigated on pH-value. Label them with serial numbers referring to the form of Part 2.
• Problem areas with 2 zones. Proposed criteria for problem areas: • Zone 1: ≥25% of the sampling sites within a region/area where the
annual mean value falls below pH 5.5. • Zone 2: ≥25% of the sampling sites within a region/area where the
annual mean value exceeds pH 8.5.
Groundwater Quantity and Quality Questionnaire
111
MAP 6 - ELECTRICAL CONDUCTIVITY (see Part 2)
Please mark: • Important groundwater areas investigated on electrical conductivity. Label them with serial numbers referring to the form of Part 2.
• Problem areas. Proposed criteria for problem areas: ≥25% of the sampling sites within a region/area where the annual mean value exceeds 2000 µS/cm.
Continuing PART 10 - REQUIRED MAPS
MAP 7 - ALKALINITY (see Part 2)
Please mark: • Important groundwater areas investigated on alkalinity. Label them with serial numbers referring to the form of Part 2.
• Problem areas. Proposed criteria for problem areas: ≥25% of the sampling sites within a region/area where the annual mean value is below 1 mval/l.
MAP 8 - GROUNDWATER OVER-EXPLOITATION (see Part 6)
Please mark: • Areas with groundwater over-exploitation. Label them with serial numbers referring to the form of Part 6.
Criteria for over-exploitation: groundwater abstraction exceeds the recharge and leads to lowering of the groundwater table.
MAP 9 - WETLANDS (see Part 7)
Please mark: • Endangered wetlands due to groundwater over-exploitation. • Wetlands not endangered.
• Label them with serial numbers referring to the form of part 7.
MAP 10 - SALTWATER INTRUSION
Please mark: • Locations (points or coast lines/areas) with saltwater intrusion.
Saltwater intrusion: The flow of saltwater into the aquifer due to groundwater over-exploitation

112
PART 11 NATIONAL STRATEGIES TO IMPROVE GROUNDWATER
QUALITY: 9900 Please give a brief description on political strategies and instruments in order to ensure groundwater quality (concerning sustainable groundwater protection, conservation, remediation of groundwater, development of new sources etc.) that have already been realised or will be realised within the next five years.
QUANTITY: 9950 Please give a brief description on political strategies and instruments for integrated and sustainable planning and management ensuring quantitative maintenance of groundwater resources that have already been realised or will be realised within the next five years.
� �