ground water brochure of varanasi district, u.p. …cgwb.gov.in/district_profile/up/varanasi.pdf ·...
TRANSCRIPT

GROUND WATER BROCHURE OFVARANASI DISTRICT, U.P.
(A.A.P.: 2012-13)
By
J.P. GautamScientist 'C'
CONTENTS
Chapter Title Page No.
VARANASI DISTRICT AT A GLANCE ..................3
1.0 INTRODUCTION ..................5
2.0 PHYSIOGRAPHY ..................5
3.0 GEOLOGY
3.1 Sub-Surface Geology
..................5
4.0 HYDROMETROLOGY ..................6
5.0 HYDROGEOLOGY
5.1 Hydrogeological Setup5.2 Ground Water Condition5.3 Long Term Water Level Trend5.4 Ground Water Resources5.5 Ground Water Exploration
..................7
6.0 GROUND WATER QUALTIY
6.1 Quality of Shallow Ground Water6.2 Quality of Deeper Aquifer
..................13
7.0 GROUND WATER PROBLEMS ENCOUNTERED
7.1 Water Table Depletion
..................13
8.0 AWARENESS & TRAINING ACTIVITY ..................13
9.0 CONCLUSIONS ..................14
10.0 RECOMMENDATIONS ..................14

2
PLATES:
1.0 INDEX MAP OF VARANASI DISTRICT, U.P.
2.0 DEPTH TO WATER LEVEL PREMONSOON 2012, VARANASI
DISTRICT, U.P.
3.0 DEPTH TO WATER LEVEL POSTMONSOON 2012 VARANASI
DISTRICT, U.P.
4.0 GROUND WATER RESOURCE AND DRAFT OF VARANASI DISTRICT,
U.P.
5.0 GROUND WATER EXPLORATION MAP OF VARANASI DISTRICT,
U.P.

3
VARANASI DISTRICT AT GLANCE
1. GENERAL INFORMATION
District : Varanasi
Geographical Area (Sq. Km.) : 1578
Sub Divisiona) Number of Tehsil
b) Number of Block
:
:
02 VaranasiSadar & Pindra08
Population (as on 2011 census) : 3682194
Male : 1928641
Female : 1753553
Decadal Growth of Population : 23.84%
2. CLIMATOLOGICAL DATA
Normal Rainfall (mm) : 997.40
Mean Maximum Temperature : 44.000C
Mean Minimum Temperature : 5.200C
Average R. Humidity : 56%
Number of Rainy Days : 58
Wind Speed Maximum : 4.5 Km./Hr.
3. LAND USE (Ha.)
Total Area : 361595
Total Forest Area : 569
Barren Land : 7661
Present Fallow Land : 55023
Pasture : 682
Garden : 15900
4. IRRIGATION (Ha.)
Net Cultivated Area : 94605
Net Irrigated Area : 80349
By Canal : 8486
By Ground Water : 71862
Others : 4

4
5. HYDRAULIC STRUCTURES
Dugwells : 4867
Shallow Tubewells : 2488
Deep Tubewells : 434
Exploratory Tubewells of C.G.W.B. : 14
6. GROUND WATER RESOURCE POTENTIAL (ason 31.03.09)Net Ground Water Availability (Ham) : 47972.08
Gross Ground Water Draft (Ham) : 38569.60
Balance Ground Water Availability (Ham) : 4785.87
Stage of Ground Water Development : 80.40%
Number of Critical Blocks : 02
Number of Semi Critical Blocks 05
Number of Safe Block : 01

5
GROUND WATER BROCHURE OFVARANASI DISTRICT, U.P.
(A.A.P.: 2012-13)
By
J.P. GautamScientist 'C'
1.0 INTRODUCTION
Varanasi district covers an area of 1578 sq.km. and administratively the
district comprise 02 tehsils and 08 blocks. It has population of 3682194 persons. It is
bounded by Jaunpur district in north and northwest, by Mirzapur and Sant Ravidas
Nagar in south and southwest and in the east by Chandauli and Gazipur district.
Historically, Varanasi is also very famous as 'Kashi'. Varanasi district is characterized
by alluvial formations consisting of older and younger alluvium.
2.0 PHYSIOGRAPHY
The district is characterized with alluvial formations and plain topographic
features. The district area in general is more or less flat. River Ganga is most
important stream apart from river Varuna. There is significant meandering in the area
of the district where river Ganga has taken its course. The average elevation of the
land surface is about 85 to 105 mamsl. The general slope of the tract is from west to
east. The topography is influenced or modified by the existing rivers and streams.
3.0 GEOLOGY
Geologically the district is characterized by quaternary alluvium consisting of
older and younger alluvium. The geological succession is given below on Table-1.

6
Table-1
STRATIGRAPHIC SEQUENCE IN VARANASI DISTRICT, U.P.
Age Formation Lithology
Upper Pleistocene to
Recent
Newer Alluvium Clay, Sand and Kankar
Middle to Upper
Pleistocene
Older Alluvium Fairly consolidated clay
with kankar, sand, fine to
medium with some gravel.
----------------------------------------------Un conformity--------------------------------------------
Upper Vindhyan Kaimur Sandstone Sandstones, grey to white,buff, arkosic with cappingof laterites and Bauxite
3.1 Sub-Surface Geology:
Sub-surface geology of the district has been inferred on the basis of
exploratory boreholes drilled by C.G.W.B. Thickness of quaternary alluvium
increases from East to West. It ranges from 06 to 44 m. On a regional scale, on single
aquifer system is seen extending down to the drilled depth of 149 m. The thickness
varies between 40.25 and 90.00 mbgl. The aquifer system behaves as semiconfined to
unconfined depending upon the presence of clay beds and also the duration of
pumping. The sediments forming the aquifer are fine to coarse grained.
4.0 HYDROMETROLOGY
The average annual rainfall is 1036.00 mm. Climate is sub humid and is
characterized by hot summer and pleasant monsoon and cold season. About 90% of
rainfall takes place from June to September. During monsoon surplus water flows into
rivers and streams un-arrested due to hilly topographic features in northern part of the
district.
In February there is increase in temperature, May is the hottest month with the
mean daily maximum temperature is 41.50C and mean daily minimum temperature is
9.50C. The average temperature ranges from 14.150C to 39.800C. The average
temperature from March to June do not fluctuate much.

7
The average relative humidity is 82%. The average monthly relative humidity
of the district is 42%. Winds are generally high with some increase in force during
summer and southwest monsoon season. The mean wind velocity is 2 knots and
potential evapotranspiration rate is 1406.7 mm.
5.0 HYDROGEOLOGY
5.1 Hydrogeological Setup:
Exploratory drilling data of C.G.W.B. and state tubewells department show
that the ground water occurs in two distinct formations:
a) A shallow ground water body which occurs principally in clay and
kankar beds of back swamp deposits and
b) Deep or main ground water body which occurs in thick sands of the
meander belt deposits.
These two water bodies are hydraulically distinct. The back swamp deposits
are thick but are likely to be interconnected when they are comparatively thin. The
shallow ground water in back swamp deposits is generally unconfined and its static
water level is only few meters bgl.
5.2 Ground Water Condition:
Central Ground Water Board has established number of ground water
monitoring stations in Varanasi district to monitor the water level behaviour in space
and time. The data compiled on the basis of 14 NHS of Varanasi district.
Ground water is mainly controlled by drainage, topography and lithological
behaviour, it occurs under phreatic condition at shallow depths and fractures &
granular zones under at deeper depths. The depth to water levels recorded during the
year 2012 are given in Table-II. Depth to water in premonsoon ranges between 5.33 to
20.55 mbgl and the postmonsoon water level varies between 2.30 to 17.06 mbgl. The
depth to water level map for both premonsoon & postmonsoon periods of 2012 were
prepared (Plate-II & III). The water level fluctuation ranges from 0.65 to 4.11 m
Table-III. Water level fluctuation is maximum in Arazi Line block. The average

8
magnitude of falling trend over last 5 years is 50-65 cm/year. The yield of the wells
vary from 700 lpm to 3550 lpm.
5.3 Long Term Water Level Trend:
It provides a more realistic scenario in the water level of any particular period
depending upon occurrence of rainfall & ground water utilisation Table-III. The
Table-III indicates decline trend during premonsoon period (2008-2012) the falling of
water level ranges from 0.33 to 1.10 m/year entire the district. The post monsoon
water level trend also indicates falling trend except Cholapur and Varanasi NHS
which are showing rising trend (0.017 to 0.027 m/year). The falling of water level
ranges from (0.02 to 1.03 m/year).
Table-II
WATER LEVEL FLUCTUATION (PRE AND POST) FOR 2012
Sl.No.
Well Name Premonsoon(mbgl)
Postmonsoon(mbgl)
Fluctuation(m)
1. Anal 5.33 2.30 3.03
2. Babatpur 10.15 8.63 1.52
3. Babatpur Chaura - 12.65 -
4. Barwaon 14.36 12.49 1.87
5. Chobepur 10.30 8.47 1.83
6. Cholapur 1 8.89 7.80 1.09
7. Jikhan (Narsara) 11.75 8.78 2.97
8. Kakrahwan 20.05 17.06 2.99
9. Raja Talab 1 15.90 15.25 0.65
10. Rustampur 14.86 12.95 1.91
11. Tahipur 5.60 2.37 3.23
12. Thatra 20.55 16.44 4.11
13. Varanasi 13.72 10.03 3.69

9
Table-III
LONG TERM WATER LEVEL TRENDS VARANASI DISTRICT, U.P.State : Uttar Pradesh
District : Varanasi
S.No.
Location Pre-Monsoon Post-Monsoon AnnualData
pointsRise
(m/year)Fall
(m/year)Data
pointsRise
(m/year)Fall
(m/year)Datapoints
Rise(m/year)
Fall(m/year)
1 2 3 4 5 6 7 8 9 10 11
1. Siswa 1 0 2
2. Cholapur 1 9 0.2537 10 0.0169 39 0.0933
3. Chobepur 10 0.3812 10 0.4378 40 0.4750
4. Phulpur 1 7 0.7037 7 1.0060 26 0.9275
5. Sindhaura 7 0.5418 8 0.9382 29 0.8132
6. Babatpur Chaura 9 0.4171 8 0.8527 39 0.6030
7. Varanasi 10 0.1830 10 0.0270 40 0.0938
8. Thatra 7 0.7336 9 0.2338 36 0.5911
9. Babatpur 7 0.5550 10 0.5098 34 0.4797
10. Tahipur 10 0.0333 10 0.0201 40 0.0129
11. Barwaon 9 0.9913 9 1.0018 36 1.0290
12. Kakrahwan 9 1.1018 10 0.8774 38 0.8872
13. Raja Talab 1 5 6 1.0263 22
14. Anai 10 0.2862 10 0.0408 37 0.1161
15. Jikhan (Narsara) 9 0.1011 10 0.0939 36 0.1120
16. Rustampur 9 0.6280 10 0.1725 39 0.4565

10
5.4 Ground Water Resources:
To facilitate the ground water development the ground water resources of the
district have been worked out and are as follows (Table-IV).
Table-IV
BLOCKWISE GROUND WATER RESOURCES OF
VARANASI DISTRICT, U.P.
Sl.No.
Assessment Unit(Blocks)
GroundWater
Availability(Ham)
GroundWater Draft
(Ham)
Category as on31.03.2009
Level ofDevelopment
(%)
1. Arazi Line 6411.20 6180.01 Critical 96.39
2. Baragaon 6321.45 4511.15 Semi Critical 71.36
3. Chariagaon 5932.91 5319.41 Semi Critical 89.66
4. Cholapur 6298.92 4906.60 Semi Critical 77.90
5. Harhua 4632.70 4356.83 Critical 94.05
6. Kashi 4546.49 3210.45 Semi Critical 70.61
7. Pindra 8101.22 6222.85 Semi Critical 76.81
8. Sewapuri 5727.20 3862.30 Safe 67.44
Total 47972.08 38569.60
A perusal of above table shows that blockwise ground water resource (2009)
shows that out of 8 blocks, two blocks (Arazi Line & Harahaua) are critical, one block
(Sewapuri) is safe and rest five blocks are under semi critical category. The ground
water development of the district is 80.40%.
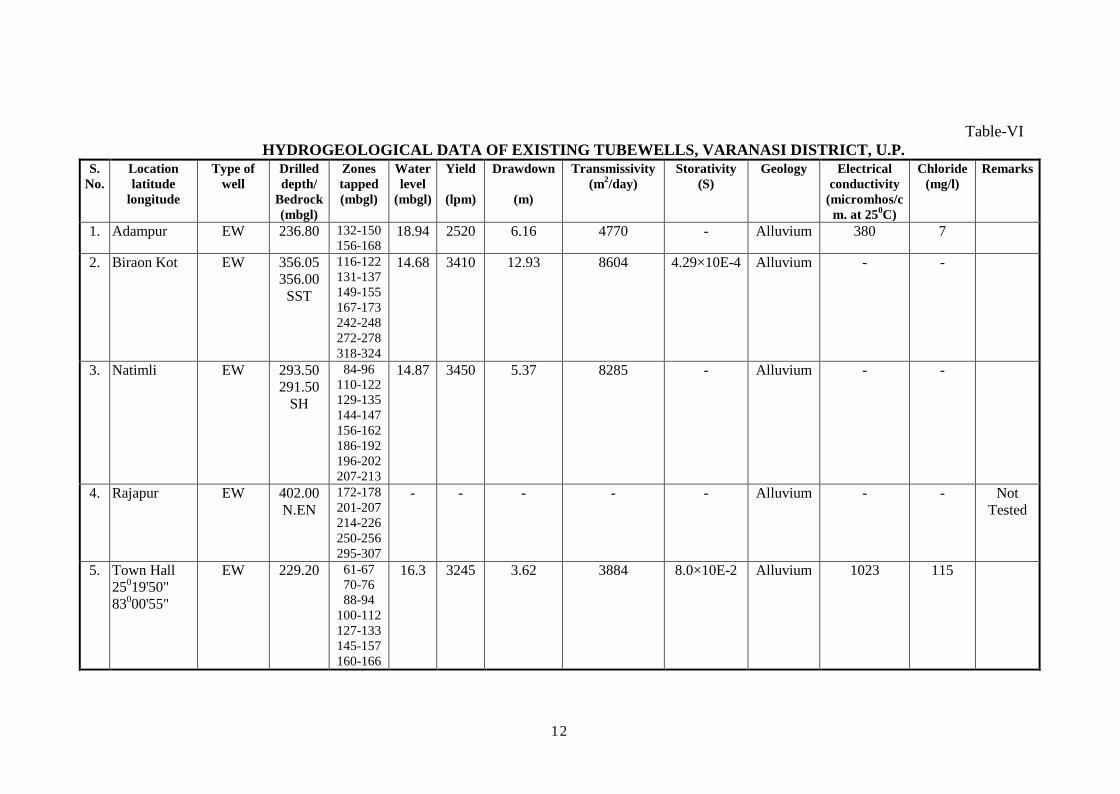
5.5 Ground Water Exploration:
Under ground water exploration of Varanasi district 5 exploratory wells
constructed by (Departmental) rotary rig between 229.20 and 402.00 mbgl, water
bearing zone tapped from 61 m to 324 mbgl. The yield of wells ranges 2520 to 3450
lpm with drawdown 3.15 to 12.93 m. The transmissivity varies from 3884 to
8604m2/day and Storativity ranges from 4.29×10E-4 to 8.0×10E-2 (Table-V & Plate-
V).

11
Table-V
GROUND WATER QUALITY OF VARANASI DISTRICT, U.P.
Sl.No.
District Block pH EC in µs/cmat 250C
----------------------------------------------------mg/l-----------------------------------------------
CO3 HCO3 Cl F NO3 SO4 TH Ca Mg Na K1. Varanasi Harahna 8.12 786 nd 183 124 0.58 28.00 13 345 16 73 5.5 2.8
2. Varanasi Sewapuri 7.48 600 nd 250 82 0.14 9.79 3 325 24 64 1.4 2.0
3. Varanasi Narhua 7.46 1050 nd 390 53 1.34 9.36 14 395 22 82 8.3 3.0
4. Varanasi Cholapur 7.88 706 nd 384 138 0.69 3.75 5 505 18 110 5.1 1.1
5. Varanasi K.V. Peeth 8.15 886 nd 470 40 0.42 3.62 9 430 8 98 7.9 2.3
6. Varanasi Chirraigaon 8.12 646 nd 183 106 0.46 1.17 25 300 6 68 3.8 1.8
12
Table-VIHYDROGEOLOGICAL DATA OF EXISTING TUBEWELLS, VARANASI DISTRICT, U.P.
S.No.
Locationlatitude
longitude
Type ofwell
Drilleddepth/
Bedrock(mbgl)
Zonestapped(mbgl)
Waterlevel
(mbgl)
Yield
(lpm)
Drawdown
(m)
Transmissivity(m2/day)
Storativity(S)
Geology Electricalconductivity
(micromhos/cm. at 250C)
Chloride(mg/l)
Remarks
1. Adampur EW 236.80 132-150156-168
18.94 2520 6.16 4770 - Alluvium 380 7
2. Biraon Kot EW 356.05356.00
SST
116-122131-137149-155167-173242-248272-278318-324
14.68 3410 12.93 8604 4.29×10E-4 Alluvium - -
3. Natimli EW 293.50291.50
SH
84-96110-122129-135144-147156-162186-192196-202207-213
14.87 3450 5.37 8285 - Alluvium - -
4. Rajapur EW 402.00N.EN
172-178201-207214-226250-256295-307
- - - - - Alluvium - - NotTested
5. Town Hall25019'50"83000'55"
EW 229.20 61-6770-7688-94
100-112127-133145-157160-166
16.3 3245 3.62 3884 8.0×10E-2 Alluvium 1023 115

13
6.0 GROUND WATER QUALITY
6.1 Quality of Shallow Ground Water:
The chemical analysis of shallow ground water consists of pH, E.C., Na, K,
Ca, Mg, HCO3, Cl, SO4, NO3, F and TH as CaCO3. The result reflects that the ground
water is safe and potable in the entire district. The details of table (blockwise) is
enclosed (Table-VI).
6.2 Quality of Deeper Aquifers:
Data of water samples collected from deeper aquifers reveals that the water is
safe and potable from deeper fractures/aquifers and better than shallow aquifer.
7.0 GROUND WATER PROBLEMS ENCOUNTERED
After study, it is inferred that the following ground water problems have been
encountered in the district.
7.1 Water Table Depletion:
In Varanasi district, there is depletion of water level over last ten years. In all
8 (eight) blocks there is decline in water level over the years (2003-2012). Even the
area which were experiencing water logging during year 2001 are showing water level
depletion since 2007. It is fact that the ground water level has declined significantly
over the years except canal command area due to canal seepage. Long term water
level trend reveals that it is declining in entire district. The average decline in water
level is 0.19 m to 1.03 m/year.
8.0 AWARENESS & TRAINING ACTIVITY
Water management training conducted in 2005-06 in Banaras Hindu
University, Varanasi. In this training 47 trainees participated from IT B.H.U. and
State Government Offices (Jal Nigam & Minor Irrigation) etc.

14
9.0 CONCLUSIONS
Varanasi district covers an area of 1578 sq.km. and falls in the Vindhyan super
group rocks. The district is characterized with plains made by alluvium. The district
contains two tehsil and eight blocks. River Ganga and Varuna are main drainage apart
from smaller streams in the district. The data of exploratory drilling conducted by
C.G.W.B. in the district that ground water occurs in porous as wells as weathered
zones. Yield of well varies from 30 to 3100 lpm with 30 m drawdown in the district.
Depth to water level in pre-monsoon ranges from 5.33 to 20.55 mbgl. Post-monsoon
water level varies between 2.30 and 17.06 mbgl. Water level data of all NHS falling
in the district were analyzed from 2003 to 2012 which clearly shows that the water
level fluctuation ranges from 0.65 to 4.11 m corroborating insignificant base flow of
ground water in the area. Long term water level trend has shown the decline in ground
water level from 0.11 to 1.03 m/year in entire district. The blockwise ground water
resource (2009) shows that out of eight blocks, two blocks (Arazi Line & Harahaua)
are critical, one block (Sewapuri) is safe and rest five blocks are under semi critical
category. The ground water development of the district is 80.40%. The net area
irrigated by ground water is 89.44% of net irrigated area of the district. The chemical
analysis of ground water samples of the district shows that the water quality is fresh
and potable.
10.0 RECOMMENDATIONS
(i) Delineation of buried and paleo-channels for potable ground water may be
searched out.
(ii) To counter the declining water level trend in the district the artificial recharge
practices and water-shed management should be adopted at large scale.
(iii) There is urgent need of quality assessment of shallow and deeper ground water
and its relationship with the lithological behavior.
(iv) Exploratory of potential sites for ground water withdrawal should be carried
out through the help of remote sensing, study of satellite imageries and
resistivity surveys.

15

16

17

18