ground-based calibration and characterization of the fermi gamma-ray burst monitor detectors
TRANSCRIPT
Exp Astron (2009) 2447ndash88DOI 101007s10686-008-9135-4
ORIGINAL ARTICLE
Ground-based calibration and characterizationof the Fermi gamma-ray burst monitor detectors
E Bissaldi middot A von Kienlin middot G Lichti middot H Steinle middot P N Bhat middotM S Briggs middot G J Fishman middot A S Hoover middot R M Kippen middotM Krumrey middot M Gerlach middot V Connaughton middot R Diehl middotJ Greiner middot A J van der Horst middot C Kouveliotou middot S McBreen middotC A Meegan middot W S Paciesas middot R D Preece middot C A Wilson-Hodge
Received 1 September 2008 Accepted 12 December 2008 Published online 30 January 2009copy The Author(s) 2009 This article is published with open access at Springerlinkcom
Abstract One of the scientific objectives of NASArsquos Fermi Gamma-ray SpaceTelescope is the study of Gamma-Ray Bursts (GRBs) The Fermi Gamma-Ray Burst Monitor (GBM) was designed to detect and localize bursts for theFermi mission By means of an array of 12 NaI(Tl) (8 keV to 1 MeV) andtwo BGO (02 to 40 MeV) scintillation detectors GBM extends the energyrange (20 MeV to gt 300 GeV) of Fermirsquos main instrument the Large AreaTelescope into the traditional range of current GRB databases The physicaldetector response of the GBM instrument to GRBs is determined with thehelp of Monte Carlo simulations which are supported and verified by on-ground individual detector calibration measurements We present the principalinstrument properties which have been determined as a function of energyand angle including the channel-energy relation the energy resolution theeffective area and the spatial homogeneity
E Bissaldi (B) middot A von Kienlin middot G Lichti middot H Steinle middot R Diehl middot J Greiner middot S McBreenMax-Planck-Institut fuumlr extraterrestrische PhysikGiessenbachstrasse 1 85748 Garching Germanye-mail ebsmpempgde
P N Bhat middot M S Briggs middot V Connaughton middot W S Paciesas middot R D PreeceNSSTC University of Alabama Huntsville AL USA
G J Fishman middot C Kouveliotou middot A J van der Horst middot C A Meegan middot C A Wilson-HodgeMarshall Space Flight Center Huntsville AL USA
A S Hoover middot R M KippenLos Alamos National Laboratory Los Alamos NM USA
M Krumrey middot M GerlachPhysikalisch-Technische Bundesanstalt Berlin Germany
48 Exp Astron (2009) 2447ndash88
Keywords Fermi Gamma-Ray space telescope middot GLAST middotGamma-Ray detectors middot Calibration middot NaI(Tl) middot BGO middot Gamma-Ray burst
PACS 9555Ka middot 9870Rz middot 2940Mc middot 0785-m middot 0785Fv
1 Introduction
The Fermi Gamma-ray Space Telescope (formerly known as GLAST) whichwas successfully launched on June 11 2008 is an international and multi-agency space observatory [2 26] that studies the cosmos in the photonenergy range of 8 keV to greater than 300 GeV The scientific motivationsfor the Fermi mission comprise a wide range of non-thermal processes andphenomena that can best be studied in high-energy gamma rays from solarflares to pulsars and cosmic rays in our Galaxy to blazars and Gamma-RayBursts (GRBs) at cosmological distances [11] Particularly in GRB science thedetection of energy emission beyond 50 MeV [6 17] still represents a puzzlingtopic mainly because only a few observations by the Energetic Gamma-RayExperiment Telescope (EGRET) [33] on-board the Compton Gamma-RayObservatory (CGRO) [12 15] and more recently by AGILE [10] are presentlyavailable above this energy Fermirsquos detection range extending approximatelyan order of magnitude beyond EGRETrsquos upper energy limit of 30 GeV willhopefully expand the catalogue of high-energy burst detections A greaternumber of detailed observations of burst emission at MeV and GeV energiesshould provide a better understanding of bursts thus testing GRB high-energyemission models [5 25 30 35] Fermi was specifically designed to avoidsome of the limitations of EGRET and it incorporates new technology andadvanced on-board software that will allow it to achieve scientific goals greaterthan previous space experiments
The main instrument on board the Fermi observatory is the Large AreaTelescope (LAT) a pair conversion telescope like EGRET operating inthe energy range between 20 MeV and 300 GeV This detector is based onsolid-state technology obviating the need for consumables (as was the casefor EGRETrsquos spark chambers whose detector gas needed to be periodicallyreplenished) and greatly decreasing (lt10 μs) dead time (EGRETrsquos high deadtime was due to the length of time required to re-charge the HV power suppliesafter event detection) These features combined with the large effective areaand excellent background rejection allow the LAT to detect both faint sourcesand transient signals in the gamma-ray sky Aside from the main instrumentthe Fermi Gamma-Ray Burst Monitor (GBM) extends the Fermi energy rangeto lower energies (from 8 keV to 40 MeV) The GBM helps the LAT with thediscovery of transient events within a larger FoV and performs time-resolvedspectroscopy of the measured burst emission In case of very strong and hardbursts the GRB position which is usually communicated by the GBM to theLAT allows a repointing of the main instrument in order to search for higherenergy prompt or delayed emission
Exp Astron (2009) 2447ndash88 49
+x
+z
+y
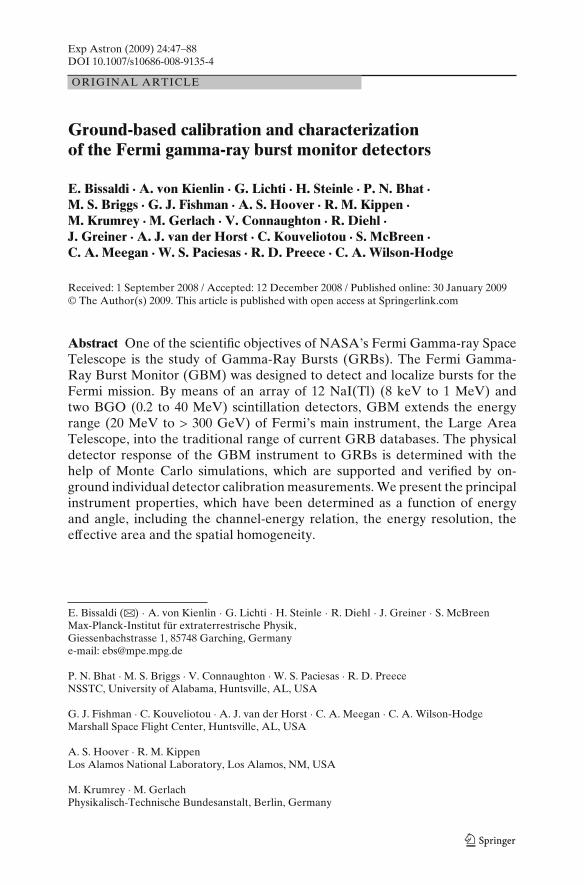
Fig 1 On the left Schematic representation of the Fermi spacecraft showing the placementof the 14 GBM detectors 12 NaI detectors (from n0 to nb) are located in groups of threeon the spacecraft edges while two BGOs (b0 and b1) are positioned on opposite sides of thespacecraft On the right Picture of Fermi taken at Cape Canaveral few days before the launchHere six NaIs and one BGO are visible on the spacecraftrsquos side Photo credit NASAKim Shiflett(httpmediaarchivekscnasagov)
The GBM is composed of unshielded and uncollimated scintillation detec-tors (12 NaI (Tl) and two BGO) which are distributed around the Fermi space-craft with different viewing angles as shown in Fig 1 in order to determinethe direction to a burst by comparing the count rates of different detectorsThe reconstruction of source locations and the determination of spectral andtemporal properties from GBM data requires very detailed knowledge of thefull GBM detectorsrsquo response This is mainly derived from computer modelingand Monte Carlo simulations [14 20] which are supported and verified byexperimental calibration measurements
In order to perform the above validations several calibration campaignswere carried out in the years 2005 to 2008 The calibration of each individualdetector (or detector-level calibration) comprises three distinct campaigns amain campaign with radioactive sources (from 144 keV to 44 MeV) whichwas performed in the laboratory of the Max-Planck-Institut fuumlr extrater-restrische Physik (MPE Munich Germany) and two additional campaignsfocusing on the low energy calibration of the NaI detectors (from 10 to60 keV) and on the high energy calibration of the BGO detectors (from 44to 176 MeV) respectively The first one was performed at the synchrotronradiation facility of the Berliner Elektronenspeicherring-Gesellschaft fuumlrSynchrotronstrahlung (BESSY Berlin Germany) with the support and col-laboration of the German Physikalisch-Technische Bundesanstalt (PTB)
50 Exp Astron (2009) 2447ndash88
while the second was carried out at the SLAC National AcceleratorLaboratory (Stanford CA USA)
Subsequent calibration campaigns of the GBM instrument were performedat system-level that comprises all flight detectors the flight Data ProcessingUnit (DPU) and the Power Supply Box (PSB) These were carried out in thelaboratories of the National Space Science and Technology Center (NSSTC)and of the Marshall Space Flight Center (MSFC) at Huntsville (AL USA) andinclude measurements for the determination of the channel-energy relationof the flight DPU and checking of the detectorsrsquo performance before andafter environmental tests After the integration of GBM onto the spacecrafta radioactive source survey was performed in order to verify the spacecraftbackscattering in the modeling of the instrument response These later mea-surements are summarized in internal NASA reports and will be not furtherdiscussed
This paper focuses on the detector-level calibration campaigns of the GBMinstrument and in particular on the analysis methods and results whichcrucially support the development of a consistent GBM instrument responseIt is organized as follows Section 2 outlines the technical characteristics of theGBM detectors Section 3 describes the various calibration campaigns whichhave been done highlighting simulations of the calibration in the laboratoryenvironment performed at MPE (see Section 34) Section 4 discusses theanalysis system for the calibration data and shows the calibration results InSection 5 final comments about the scientific capabilities of GBM are givenand the synergy of GBM with present space missions is outlined
2 The GBM detectors
The GBM flight hardware comprises a set of 12 Thallium activated SodiumIodide crystals (NaI(Tl) hereafter NaI) two Bismuth Germanate crystals (Bi4Ge3 O13 commonly abbreviated as BGO) a DPU and a PSB In total 17scintillation detectors were built 12 flight module (FM) NaI detectors twoFM BGO detectors one spare NaI detector and two engineering qualifica-tion models (EQM) one for each detector type Since detector NaI FM 06immediately showed low-level performances it was decided to replace it withthe spare detector which was consequently numbered FM 13 Note that thedetector numbering scheme used in the calibration and adopted throughoutthis paper is different to the one used for in-flight analysis as indicated inTable 4 (columns 2 and 3) in the Appendix
The cylindrical NaI crystals (see Fig 2) have a diameter of 127 cm (5rdquo) anda thickness of 127 cm (05rdquo) For light tightness and for sealing the crystalsagainst atmospheric moisture (NaI(Tl) is very hygroscopic) each crystal ispacked light-tight in a hermetically sealed Al-housing (with the exceptionof the glass window to which the PMT is attached) In order to allow mea-surements of X-rays down to 5 keV (original project goal [8]) the radiationentrance window is made of a 02 mm thick Beryllium sheet However due to
Exp Astron (2009) 2447ndash88 51
Photomultiplier
Voltage divider
Interface to SC
Photomultiplierhousing
NaI(Tl)crystal
Glassplate
Siliconerubberlayer
Beryllium window
Heater foilsand thermostats
Front End Electronics
Fig 2 On the top Schematic cross-section of a GBM NaI detector showing the main componentsA picture of a detector flight unit mounted on the calibration stand was taken in the laboratoryduring detector level calibration measurements and is shown in the bottom panel
mechanical stability reasons an additional 07 mm thick Silicone layer had tobe mounted between the Be window and the crystal causing a slight increaseof the low-energy detection threshold Moreover an 05 mm thick Tetratexlayer was placed in front of the NaI crystal in order to improve its reflectivityThe transmission probability as a function of energy for all components of thedetector windowrsquos system is shown in Fig 3 Consequently NaI detectors areable to detect gamma-rays in the energy range between sim 8 keV and sim 1 MeVThe individual detectors are mounted around the spacecraft and are orientedas shown schematically in Fig 1 (left panel) This arrangement results in anexposure of the whole sky unocculted by the earth in orbit
52 Exp Astron (2009) 2447ndash88
Fig 3 X-ray transmission ofall individual layers of a NaIdetector entrance window(the 02 mm thick Berylliumsheet in blue the 05 mm thickTetratex layer in green the07 mm thick Silicone layerin red and the sum of allcomponents in black Thetransmission at 10 keVis sim 30
0 5 10 15 20 25 3000
01
02
03
04
05
06
07
08
09
10
Tra
nsm
issi
on
Photon Energy (keV)
Be (200 m)
Tetratex (508 m)
Silicone (700 m)
Total
The Hamamatsu R877 photomultiplier tube (PMT) is used for all the GBMdetectors This is a 10-stage 5-inch phototube made from borosilicate glass witha bialkali (CsSb) photocathode which has been modified (R877RG-105) inorder to fulfill the GBM mechanical load-requirements
With their energy range extending between sim 02 and sim 40 MeV twoBGO detectors provide the overlap in energy with the LAT instrument andare crucial for in-flight inter-instrument calibration The two cylindrical BGOcrystals (see Fig 4) have a diameter and a length of 127 cm (5rdquo) and aremounted on opposite sides of the Fermi spacecraft (see Fig 1) providingnearly a 4 π sr FoV The BGO housings are made of CFRP (Carbon FibreReinforced Plastic) which provides the light tightness and improves the me-chanical stability of the BGO unit For thermal reasons the interface parts arefabricated of Titanium On each end the circular side windows of the crystalare polished in mirror quality and are viewed by a PMT (same type as used forthe NaI detectors) Viewing the crystal by two PMTs guarantees a better lightcollection and a higher level of redundancy
The output signals of all PMTs (for both NaIs and BGOs) are first amplifiedvia linear charge-sensitive amplifiers The preamplifier gains and the HVs areadjusted so that they produce a sim5 V signal for a 1 MeV gamma-ray incidenton a NaI detector and for a 30 MeV gamma-ray incident on a BGO detectorDue to a change of the BGO HV settings after launch this value changed to40 MeV thus extending the original BGO energy range [8] Signals are thensent through pulse shaping stages to an output amplifier supplying differentialsignals to the input stage of the DPU which are combined by a unity gainoperational amplifier in the DPU before digitizing In the particular case ofBGO detectors outputs from the two PMTs are divided by two and then addedat the preamplifier stage in the DPU
In the DPU the detector pulses are continuously digitized by a separateflash ADC at a speed of 01 μs The pulse peak is measured by a separatesoftware running in a Field Programmable Gate Array (FPGA) This schemeallows a fixed energy independent commendable dead-time for digitization
Exp Astron (2009) 2447ndash88 53
Photomultiplier 2BGO
crystal
Photomultiplier 1
FEE
unit 1
FEE
unit 2
Heater foils
and thermostats
Interfaces to SC
External
connector group
PMT
assembly 1
PMT
assembly 2
Silicone rubber layer
Fig 4 On the top Schematic cross-section of a GBM BGO detector The right hand side ofthe schematic is a cut away view whereas the left hand side is an external view The centralportion contains the BGO crystal (light blue) which is partially covered by the outer surface ofthe detectorrsquos assembly A picture of a BGO detector flight unit taken in the laboratory duringsystem level calibration measurements is shown in the bottom panel
The signal processor digitizes the amplified PMT anode signals into 4096 linearchannels Due to telemetry limitations these channels are mapped (pseudo-logarithmic compression) on-board into (1) 128-channel resolution spectrawith a nominal temporal resolution of 4096 s (Continuous High SPECtralresolution or CSPEC data) and (2) spectra with a poorer spectral resolutionof eight channels and better temporal resolution of 0256 s (Continuous highTIME resolution or CTIME data) by using uploaded look-up tables1 Thesewere defined with the help of the on-ground channel-energy relations (seeSection 42) Moreover time-tagged event (TTE) data are continuously storedby the DPU These data consist of individually digitized pulse height eventsfrom the GBM detectors which have the same channel boundaries as CSPECand 2 μs resolution TTE data are transmitted only when a burst trigger occursor by command More details on the GBM data type as well as a block diagramof the GBM flight hardware can be found in [24]
1The temporal resolution of CTIME and CSPEC data is adjustable nominal integration times aredecreased when a trigger occurs
54 Exp Astron (2009) 2447ndash88
Besides processing signals from the detectors the DPU processes com-mands formats data for transmission to the spacecraft and controls high andlow voltage (HV and LV) to the detectors Changes in the detector gains canbe due to several effects such as temperature changes of the detectors andof the HV power supply variations in the magnetic field at the PMT andPMT aging GBM adopts a technique previously employed on BATSE thatis Automatic Gain Control (AGC) In this way long timescale gain changesare compensated by the GBM flight software by adjusting the PMT HV tokeep the background 511 keV line at a specified energy channel
3 Calibration campaigns
To enable the location of a GRB and to derive its spectrum a detailed knowl-edge of the GBM detector response is necessary The information regardingthe detected energy of an infalling gamma-ray photon which is dependenton the direction from where it entered the detector is stored into a responsematrix This must be generated for each detector using computer simulationsThe actual detector response at discrete incidence angles and energies has tobe measured to verify the validity of the simulated responses The completeresponse matrix of the whole instrument system (including LAT and thespacecraft structure) is finally created by simulation of a dense grid of energiesand infalling photon directions using the verified simulation tool [21]
The following subsections are dedicated to the descriptions of the three cali-bration campaigns at detector level The most complete calibration of all flightand engineering qualification models was performed at the MPE laboratoryusing a set of calibrated radioactive sources whose type and properties arelisted in Table 1
Due to the lack of radioactive sources producing lines below 60 keV andin order to study spatial homogeneity properties of NaI detectors a dedicatedcalibration campaign was performed at PTBBESSY Here four NaI detectors(FM 01 FM 02 FM 03 and FM 04)2 were exposed to a monochromaticX-ray beam with energy ranging from 10 to 60 keV and the whole detectorrsquossurface was additionally raster-scanned at different energies with a pencilbeam perpendicular to the detectorrsquos surface
In order to extend the BGO calibration range another dedicated calibrationcampaign was carried out at the SLAC laboratory Here the BGO EQMdetector3 was exposed to three gamma-ray lines (up to 176 MeV) producedby the interaction of a proton beam of sim340 keV generated with a small Van-de-Graaff accelerator with a LiF-target A checklist showing which detectors
2Detectors were delivered to MPE for detector level calibration in batches of four and shortlythere after shipped to the US for system level calibration Therefore as the PTBBESSY facilitywas only available for a short time only one batch of NaIs could be calibrated there3The BGO flight modules were not available for calibration at the time of measurements sincethey had already been shipped for system integration
Exp Astron (2009) 2447ndash88 55
Table 1 Properties of radioactive nuclides used for NaI and BGO calibration campaigns (1)Half-lives in years (y) or days (d) (2) Decay type producing the gamma-ray (γ ) or X-ray (eg Kand L) radiation minus For nuclides which are part of decay chains the daughter nuclides producingthe corresponding radiation are also given (3) Line energies in keV (4) Photon-emissionprobabilities for the corresponding decays
Nuclide (1) Half-life (2) Line origin (3) Line Energies (4) Transition(keV) Probability
22Na 9505(4) d Annih 511 1798γ 127454 09994
40K 1277(8)E9 y γ 146083 0106754Mn 31215(8) d γ 83484 0999750(12)
γ 1441 00916(15)57Co 27183(8) d γ 12206 08560(17)
γ 13647 01068(8)60Co 52712(11) y γ 117323 09985(3)
γ 133249 0999826(6)88Y 106630(25) d γ 89804 0940(3)
γ 183606 09933(3)AgminusSumKα 221 0836(6)
109Cd 4621(14) d AgminusSumKβ 25 01777(19)γ 8803 003626(20)BaminusSumKα 3206 00553(10)
137Cs 3013(24) y BaminusSumKβ 366 001321(27)Baminus137m 66166 08500(20)
203Hg 46604(17) d γ 2792 08146(13)232Th 1405(6)E10 y 208Tl (γ ) 261453 03564241Am 4322(7) y γ 594 0359(4)241Am9Be 4322 (7) y γ 4430 000004
Values from [31]
were employed at each detector-level calibration campaign is given in Table 4(columns 4 to 6)
31 Laboratory setup and calibration instrumentation at MPE
The measurements performed at MPE resulted in an energy calibration withvarious radioactive sources and in addition a calibration of the angularresponse of the detectors at different incidence angles of the radiation Thedetectors and the radioactive sources were fixed on special holders whichwere placed on wooden stands above the laboratory floor to reduce scatteringfrom objects close to them (see Fig 5) The radioactive sources were placedalmost always at the same distance (d) from the detector The position of thedetectorrsquos wooden stand with respect to the laboratory was never changedduring measurements Due to the unavailability of the flight DPU and PSBcommercial HV and LV power supplies were used and the data were read outby a Breadboard DPU
The determination of the angular response of the detectors was achievedin the following way The center of the NaI detector calibration coordinatesystem was chosen at the center of the external surface of the Be-window ofthe detector unit with the X axis pointing toward the radioactive source the
56 Exp Astron (2009) 2447ndash88
Fig 5 Detector holders with NaI (left panel) and BGO detectors (right panel) are positionedin front of the radioactive source (on top of the red holder) on their wooden stands during thecalibration at the MPE laboratory
Y axis pointing toward left and Z axis pointing up (see Fig 8 left panel) Thedetectors were mounted on a specially developed holder in such a way thatthe front of the Be-window was parallel to the YZ plane (if the detector ispointed to the source ie 0 position) and so that detectors could be rotatedaround two axes in order to achieve all incidence angles of the radiation Thedetector rotation axes were the Z-axis (Azimuth) and around the X-axis (roll)For BGO detectors the mounting was such that the very center of the detector(center of crystal) was coincident with the origin of the coordinate system andthe 0 position was defined as the long detector axis coincident with the Y-axisThe BGO detectors were only rotated around the Z-axis and no roll angleswere measured in this case
32 NaI low-energy calibration at PTBBESSY
The calibration of the NaI detectors in the low photon energy range down to10 keV was performed with monochromatic synchrotron radiation with thesupport of the PTB A pencil beam of about 02 times 02 mm 2 was extracted froma wavelength-shifter beamline the ldquoBAMlinerdquo [29] at the electron storagering BESSY II which is equipped with a double-multilayer monochromator(DMM) and a double-crystal monochromator (DCM) [13] In the photonenergy range from 10 keV to 30 keV DCM and DMM were operated in seriesto combine the high resolving power of the DCM with the high spectral purityof the DMM Above 30 keV a high spectral purity with higher order contri-butions below 10minus4 was already achieved by the DCM alone The tunability ofthe photon energy was also used to investigate the detectors in the vicinity ofthe Iodine K-edge at 3317 keV
The absolute number of photons in the pencil beam was independentlydetermined by two different methods firstly by taking at each photon energy aspectrum with a high-purity germanium detector (HPGe) for which a quantum
Exp Astron (2009) 2447ndash88 57
detection efficiency (QDE) of unity had been determined earlier and secondlyby using silicon photodiodes which in turn had been calibrated against PTBprimary detector standards such as a cryogenic radiometer and a free-air ion-ization chamber [23] As these photodiodes are operated in the photovoltaicmode the photon fluxes had to be about four orders of magnitude higher thanfor the counting detectors Different pairs of Cu and Al filters were designedfor different photon energy ranges so that the transmittance of one filter was inthe order of 1 which can easily be measured Two identical filters were usedin series to achieve the required reduction in flux by four orders of magnitudeA picture of the calibration setup is shown in Fig 6
The effective area of the detectors as a function of the photon energy wasdetermined by scanning the detectors at discrete locations in x- and y-directionover the active area while the pencil beam was fixed in space During the scanthe intensity was monitored with a photodiode operated in transmission Theeffective area is just the product of the average QDE and the active areaIn addition the spatial homogeneity of the QDE was determined by thesemeasurements (see Section 44)
The measurements presented in this paper were recorded at 18 differentenergies namely from 10 to 20 kev in 2 keV steps from 30 to 37 keV in 1 keVsteps and at 328 40 50 and 60 keV These accurate measurements allowed toexactly determine the low-energy behavior of the channel-energy relation ofthe NaI detectors (see Section 421) and to fine tune the energy range around
Fig 6 NaI FM 04 detector photographed inside the measurement cave of the BAMline duringthe low-energy calibration campaign at the electron storage ring BESSY II in Berlin The HPGedetector is located left of the GBM detector Both are mounted on the XZ table which was movedby step motors during the scans The beam exit window of the BAMline is located below the redbox visible at the top right corner The Cu and Al filters holders are placed horizontally betweenthe window and the detectors
58 Exp Astron (2009) 2447ndash88
the Iodine K-edge at 3317 keV (see Section 422) Moreover three rasterscansof the detectorrsquos surface were performed at 10 36 and 60 keV in order to studythe detectorsrsquo spatial homogeneity (see Section 45 for more details)
33 BGO high-energy calibration at SLAC
In order to better constrain the channel-energy relation and the energy reso-lution at energies higher than 44 MeV an additional high-energy calibrationof the BGO EQM detector was performed at SLAC with a small electrostaticVan-de-Graaff accelerator [19] This produces a proton beam up to sim350 keVand was already used to verify the LAT photon effective area at the low endof the Fermi energy range (20 MeV) When the proton beam produced by theVan-de-Graaff accelerator strikes a LiF target which terminates the end ofthe vacuum pipe (see Fig 7 left panel) gammas with energies of 61 MeV146 MeV and 175 MeV are produced via the reactions
p (sim 340keV) + 7Li rarr 8 Be (1+)lowast rarr 8 Be + γ (146 or 175 MeV) (1)
p (sim 340keV) + 19 F rarr 16 Olowast + α rarr 16 O + γ (61 MeV) (2)
The highly excited 175 MeV state of 8Be is created by protons in a resonancecapture process at 340 keV on 7Li (see Eq 1) At lower energies photons arestill produced from the Breit-Wigner tail (Γ = 12 keV) of the 8Belowast resonanceThe narrow gamma-ray line at 175 MeV is produced by the transition to the8Be ground state in which the quantum energy is determined by hν = Q +78Ep where Q = 172 MeV is the energy available from the mass changeand Ep = 340 keV is the proton beam energy The gamma-ray line observedat 146 MeV which corresponds to transitions to the first excited state of 8Be
Fig 7 BGO EQM detector photographed in the SLAC laboratory during the high-energycalibration campaign (left panel) The grey box on the left is the end of the proton beam insidewhich the LiF target was placed in order to react and produce the desired gamma lines (see Eq 1and 2) The right panel shows a simulation of the gamma-ray interaction with the detector Onlygamma-rays whose first interaction is within the detector crystal are shown for clarity
Exp Astron (2009) 2447ndash88 59
Fig 8 Simulation of the laboratory environment The left panel shows in a top view of thelaboratory the components of the simulation model of all objects which were present during thecalibration campaign Also shown is the coordinate system adopted (X and Y axis of the right-handed system +Z axis pointing upward) The right panel shows an example of the simulatedscattering of the radiation in the laboratory In a view from the -Y axis the path of the first100 photons interacting with the detector are shown The radioactive source emitted radiationof 1275 MeV isotropically The major part of the detected photons is directly incident but asignificant fraction is scattered radiation by the laboratory environment (see Table 2)
is broadened with respect to the experimental resolution because of the shortlifetime of the state against decay into two alpha-particles Finally Eq 2 showsthat 61 MeV gamma-rays are generated when the narrow (Γ = 32 keV ) 16Oresonance at 340 keV is hit
For performing the measurements the EQM detector was placed as closeas possible to the LiF-target at an angle of sim45 with respect to the proton-beam line in order to guarantee a maximized flux of the generated gamma-rays Unfortunately measurements for the determination of the detectorrsquoseffective area could not be obtained since the gamma-ray flux was not closelymonitored
34 Simulation of the laboratory and the calibration setup at MPE
In order to simulate the recorded spectra of the calibration campaign at MPEto gain confidence in the simulation software used a very detailed model ofthe environment in which the calibration took place had to be created Thedetailed modeling of the laboratory was necessary as all scattered radiationfrom the surrounding material near and far had to be included to realisticallysimulate all the radiation reaching the detector4 Background measurementswith no radioactive sources present were taken to subtract the ever-present
4An important argument driving the decision not to use a collimator for measurements withradioactive sources was the fact that the simulation of the laboratory environment with all itsscattering represented a necessary and critical test for the simulation software which later had toinclude the spacecraft [34]
60 Exp Astron (2009) 2447ndash88
Table 2 Contribution of simulated laboratory components to the detected photons
Component NaI BGO22 keV 122 keV 1275 MeV 443 MeV
Direct incidence 940 910 750 700Scattered rad total 60 90 250 300Walls lt 01 06 120 130Source holder 46 75 30 20Source stand 01 lt 01 lt 01 lt 01Detector stand lt 01 lt 01 20 lt 01Floor lt 01 08 80 150Other furniture lt 01 lt 01 lt 01 lt 01Air 13 lt 01 lt 01 lt 01
natural background radiation in the laboratory However the source-inducedldquobackgroundrdquo radiation created by scattered radiation of the non-collimatedradioactive sources had to be included in the simulation to enable a detailedcomparison with the measured spectra
The detailed modeling of the calibration setup of the MPE laboratory wasperformed using the GEANT4 -based GRESS5 simulation software providedby the collaboration team based at the Los Alamos National Laboratory(LANL USA) who also provided the software model of the detectors [14]The modeling of the whole laboratory included laboratory walls (concrete)windows (aluminum glass) doors (steel) tables (wood aluminum) cupboards(wood) a shelf (wood) the electricity distributor closet (steel) the opticalbench (aluminum granite) and the floor (PVC) Moreover detector andsource stands (wood) source holder (PVC acrylic) and detector holder (alu-minum) were modeled in great detail (see Fig 8 left panel) A summary ofthe comparison of the measurements and the simulation with respect to theinfluence of the various components of the calibration environment is given inTable 2 and a sample plot of the scattered radiation is given in the right panelof Fig 8
Additional simulations of the other calibration campaigns in particular forthe PTB BESSY one are planned In the case of SLAC measurements thesimulation tools were only used to determine the ratios between full-energypeaks and escape peaks (see Fig 7 right panel) no further simulation of thecalibration setup is foreseen
5GEANT4 is a suite of high-energy interaction simulation tools created at CERN [1] GRESS isthe General Response Simulation System which is developed at LANL It is based on a modified(extended) version of GEANT4 [20]
Exp Astron (2009) 2447ndash88 61
4 Calibration data analysis and results
41 Processing of calibration runs
During each calibration campaign all spectra measured by the GBM detectorswere recor-ded together with the information necessary for the analysisShortly before or after the collection of data runs additional background mea-surements were recorded for longer periods Every run was then normalizedto an exposure time of 1 h and the background was subsequently subtractedfrom the data In the case of measurements performed at PTBBESSYnatural background contribution could be neglected due to the very high beamintensities and to the short measurement times
Figures 9 10 11 and 12 show a series of sample spectra collected withdetectors NaI FM 04 BGO FM02 and BGO EQM These particular detectors
0 100 200 300 400Channel
0
20
40
60
80
(Cou
nts
Hou
r) x
103
(a) NaISR (10 keV)
0 100 200 300 400Channel
0
100
200
300
(Cou
nts
Hou
r) x
103
(b) NaISR (33 keV)
0 100 200 300 400Channel
0
50
100
150
200
250
(Cou
nts
Hou
r) x
103
(c) NaISR (34 keV)
0 200 400 600Channel
0
50
100
150
(Cou
nts
Hou
r) x
103
(d) NaISR (60 keV)
Fig 9 Spectra measured with monochromatic synchrotron radiation (SR) at PTBBESSY withdetector NaI FM 04 Results for four different photon energies are shown a 10 keV b 33 keVc 34 keV and d 60 keV The two top panels (a and b) display spectra collected below the IodineK-edge energy (ie lt3317 keV) Above this energy (panels c and d) the characteristic Iodineescape peak is clearly visible to the left of the full-energy peak
62 Exp Astron (2009) 2447ndash88
0 200 400 600 800Channel
0
10
20
30
40
50
(Cou
nts
Hou
r) x
10
3
(a) NaI241Am
0 200 400 600 800Channel
0
5
10
15
20
25
30
(Cou
nts
Hou
r) x
103
(b) NaI109Cd
0 500 1000 1500Channel
0
2
4
6
(Cou
nts
Hou
r) x
103
(c) NaI57Co
0 500 1000 1500 2000Channel
0
2
4
6
8
10
12
(Cou
nts
Hou
r) x
103
(d) NaI203Hg
0 1000 2000 3000 4000Channel
0
1
2
3
4
5
(Cou
nts
Hou
r) x
103
(e) NaI22Na
0 1000 2000 3000 4000Channel
0
5
10
15
20
(Cou
nts
Hou
r) x
103
(f) NaI137Cs
0 1000 2000 3000 4000Channel
00
02
04
06
08
10
(Cou
nts
Hou
r) x
103
(g) NaI54Mn
Channel 0 1000 2000 3000 4000
00
02
04
06
08
10
(Cou
nts
Hou
r) x
103
(h) NaI88Y
Exp Astron (2009) 2447ndash88 63
Fig 10 Normalized background-subtracted spectra measured at MPE with detector NaI FM 04from the following radioactive sources a 241Am b 109Cd c 57Co d 203Hg e 22Na f 137Cs g 54Mnand h 88Y
were chosen arbitrarily to present the whole analysis since it was checked thatall other detectors behave in an identical way (see Section 43 and Section 44)In Fig 9 four calibration runs recorded at PTBBESSY at different photonenergies (10 33 34 and 60 keV) highlight the appearance of an importantfeature of the NaI spectra Below the characteristic Iodine (I) K-shell bindingenergy of 3317 keV (or ldquoK-edgerdquo energy) spectra display only the full-energypeak which moves toward higher channel numbers with increasing photonenergy (see panels a and b) For energies higher than the K-edge energy asecond peak appears to the left of the full-energy peak (see panels c and d)which is caused by the escape of characteristic X-rays resulting from K-shelltransitions (fluorescence of Iodine) The energy of this fluorescence escapepeak equals the one of the full-energy peak minus the X-ray line energy [4]The contributions of the different Iodine Kα and Kβ fluorescence lines cannot be resolved by the detector
NaI spectra from radioactive sources recorded at MPE are shown in Fig 10A detailed description of the full-energy peaks characterizing every source isgiven in Section 411 Beside full-energy and Iodine escape peaks spectra fromhigh-energy radioactive lines show more features (ie see the 137Cs spectrumin panel f ) such as the low-energy X radiation (due to internal scatteringof gamma-rays very close to the radioactive material) at the very left of thespectrum the Compton distribution which is a continuous distribution due toprimary gamma-rays undergoing Compton scattering within the crystal and abackscatter peak at the low-energy end of the Compton distribution
Similarly BGO spectra from radioactive sources collected at MPE andSLAC with detector FM 02 and BGO EQM are presented in Figs 11 and 12The spectrum produced by the Van-de-Graaff proton beam at SLAC whichwas measured by the spare detector BGO EQM is shown in panel c of Fig 12
411 Analysis of the full-energy peak
Radioactive lines emerge from the measured spectra as peaks of variousshapes and with multiple underlying contributions Depending on the specificspectrum one or more Gaussians in the form
G(x) = Aw
middotradic
4 ln 2
πeminus 4 ln 2 (x minus xc)
2
w 2(3)
were added in order to fit the data The three free parameters are (1) the peakarea A (2) the peak center xc and (3) the full width at half maximum w which
64 Exp Astron (2009) 2447ndash88
0 50 100 150 200Channel
0
5
10
15
(Cou
nts
Hou
r) x
103
(a) BGO57Co
0 50 100 150 200Channel
0
5
10
15
20
25
30
35
(Cou
nts
Hou
r) x
103
(b) BGO203Hg
0 100 200 300 400 500Channel
0
20
40
60
80
(Cou
nts
Hou
r) x
103
(c) BGO22Na
0 100 200 300 400 500Channel
0
20
40
60
80
100
120
140
(Cou
nts
Hou
r) x
103
(d) BGO137Cs
0 100 200 300 400 500Channel
0
2
4
6
8
(Cou
nts
Hou
r) x
103
(e) BGO54Mn
Channel 0 100 200 300 400 500
0
20
40
60
80
100
(Cou
nts
Hou
r) x
103
(f) BGO60Co
0 200 400 600 800 1000Channel
0
2
4
6
8
10
12
14
(Cou
nts
Hou
r) x
103
(g) BGO88Y
0 100 200 300 400 500Channel
0
2
4
6
8
10
12
14
(Cou
nts
Hou
r) x
103
(h) BGO40K
Exp Astron (2009) 2447ndash88 65
Fig 11 Normalized background-subtracted spectra measured at MPE with BGO FM 02 (panelsandashg) and EQM (panel h) from the following radioactive sources a 57Co b 203Hg c 22Na d 137Cse 54Mn f 60Co g 88Y and h 40K
is related to the standard deviation (σ ) of the distribution through the relationw = 2
radic2 ln 2 middot σ asymp 235 middot σ For the analysis of the measured full-energy
peaks further background components (linear quadratic or exponential) andGaussian components had to be modeled in addition to the main Gaussian(s)in order to account for non-photo-peak contributions such as the overlappingCompton distributions the backscattered radiation caused by the presence ofthe uncollimated radioactive source in the laboratory or other unknown back-ground features In the case of PTBBESSY spectra asymmetries appearingat the low energy tail of the full-energy peak were neglected by choosing asmaller region of interest and fitting only the right side of the peak As alreadymentioned no background was modeled under these spectra
0 100 200 300 400 500
Channel
0
2
4
6
8
10
12
14
(Cou
nts
Hou
r) x
103
(a) BGO208Tl
0 500 1000 1500 2000
Channel
00
05
10
15
(Cou
nts
Hou
r) x
103
(b) BGO AmBe
0 1000 2000 3000
Channel
000
005
010
015
020
025
030
(Cou
nts
Hou
r) x
103
(c) BGOVdG
Fig 12 Normalized background-subtracted spectra measured at SLAC with BGO EQM from tworadioactive sources a 208Tl and b AmBe The spectrum in panel c was recorded during one of theVan-de-Graaff (VdG) runs
66 Exp Astron (2009) 2447ndash88
Moreover since both NaI and BGO detectors are not always able to fullyseparate two lines lying close to each other and thus resulting in a singlebroadened peak particular constraints between line parameters of singlepeak components were fixed before running the fitting routines The relationbetween two line areas (lsquoA1rsquo and lsquoA2rsquo) arises from the transition probabilityP of the single line energies (see Table 1 column 4) A ratio between areasK area = P1P2 was obtained by considering those probabilities together withthe transmission probability for the detector entrance window and the relativetransmission of the photons between source and detector Finally the ratioswere cross-checked and determined through detailed simulations performedfor seven double lines measured with NaI and BGO detectors which are listedin Table 3
An important consideration when fitting mathematical functions to thesedata is that the calculated statistical errors of the fit parameters are alwayswithin 01 in the case of line areas and FWHM or even 001 in the caseof line-centers Such extreme precisions cause very high chi-square values insubsequent analysis as in the determination of the channel-energy relationwhich extends over an entire energy decade in the case of NaI detectorsMoreover it was noticed that by slightly changing the initial fitting conditionssuch as the region of interest around the peak or the type of backgroundparameter values suffered from substantial changes with respect to a precedentanalysis This effect is particularly strong in the analysis of multiple peaks weremore Gaussians and background functions are added and the number of freeparameters increases In order to account for this effects and to get a morerealistic evaluation of the fit parameter errors we decided to analyse severaltimes one spectrum per source (measured at normal incidence by detectors NaIFM 04 and BGO FM 02) each time putting different initial fitting conditionsThis procedure was repeated several times (usually sim10ndash20 times ie until thesystematic contribution was not further increasing and a good chi-square valueof the individual fit was produced) thus obtaining a dataset of fit parametersand respective errors For each error dataset standard deviations (σ ) werecalculated resulting in values of the order of 1 for line areas and FWHMsand of 01 for line-centers and were finally added to the fit error thusobtaining realistic errors
The fitting results for 17 lines measured by NaI FM 04 are presentedgraphically in Figs 13 and 14 In each panel the fitted line energies are
Table 3 Fit constraintsadopted for the analysis ofsome double peaks for NaIand BGO detectors
K area represents a calculatedratio between the peak areasof the given lines
Nuclide Detector Double line energy (keV) K area109Cd NaI 221 minus 25 488137Cs NaI 3206 minus 366 53357Co NaI 12206 minus 13647 81460Co BGO 117323 minus 133249 0998Be BGO 5619 minus 6130 0208Be BGO 14075 minus 14586 0298Be BGO 17108 minus 17619 027
Exp Astron (2009) 2447ndash88 67
20 40 60 80
Channel
0
20
40
60
80C
ount
s x
103
NaISR(a)(10 keV)
40 60 80 100
Channel
00
05
10
15
(Cou
nts
Hou
r) x
103
NaI57Co(1441 keV)
(b)
80 100 120 140 160
Channel
0
10
20
30
(Cou
nts
Hou
r) x
103
NaI109Cd(221 amp 250 keV)
(c)
120 150 180 210
Channel
0
5
10
15
20
25
30
(Cou
nts
Hou
r) x
103
NaI137Cs(3206 amp 366 keV)
(d)
140 160 180 200 220 240
Channel
0
20
40
60
80
100
120
140
Cou
nts
x 10
3
NaISR(e)(36 keV)
200 250 300 350Channel
0
20
40
60
80
(Cou
nts
Hou
r) x
103
NaI241Am(594 keV)
(f)
Fig 13 Full-energy peak analysis of NaI lines (a-f) Data points (in black) are plotted withstatistical errors Line fits (solid red curves) arise from the superposition of different components(i) one (or more) Gaussian functions describing the full-energy peak(s) (solid blue curves) (ii)secondary Gaussian functions modeling the Iodine escape peaks or other unknown backgroundfeatures (dashed blue curves) (iii) a constant linear quadratic or exponential function accountingfor background contributions (dotted green curves) For PTBBESSY line analysis (panels a ande) the background contributions could be neglected and only the fit to the full-energy peak wasperformed starting from 4 to 10 channels before the maximum
68 Exp Astron (2009) 2447ndash88
250 300 350Channel
0
50
100
150
Cou
nts
x 10
3
NaISR(a)(60 keV)
250 300 350 400 450 500Channel
00
01
02
03
04
05
06
(Cou
nts
Hou
r) x
103
NaI109Cd(8803 keV)
(b)
300 400 500 600 700Channel
0
2
4
6
8
10
(Cou
nts
Hou
r) x
103
NaI57Co(12206 amp 13647 keV)
(c)
1000 1100 1200 1300 1400Channel
0
2
4
6
8
10
12
(Cou
nts
Hou
r) x
103
NaI203Hg(2792 keV)
(d)
1800 2000 2200 2400Channel
0
1
2
3
4
(Cou
nts
Hou
r) x
103
NaI22Na(511 keV)
(e)
2400 2600 2800 3000Channel
0
1
2
3
4
(Cou
nts
Hou
r) x
103
NaI137Cs(66166 keV)
(f)
2800 3200 3600 4000Channel
000
005
010
015
020
(Cou
nts
Hou
r) x
103
NaI54Mn(83484 keV)
(g)
3200 3600 4000Channel
00
01
02
03
04
(Cou
nts
Hou
r) x
103
NaI88Y(89804 keV)
(h)
Exp Astron (2009) 2447ndash88 69
Fig 14 Full-energy peak analysis of NaI lines (a-h) Data points (in black) are plotted withstatistical errors Line fits (solid red curves) arise from the superposition of different components(i) one (or more) Gaussian functions describing the full-energy peak(s) (solid blue curves) (ii)secondary Gaussian functions modeling the Iodine escape peaks or other unknown backgroundfeatures (dashed blue curves) (iii) a constant linear quadratic or exponential function accountingfor background contributions (dotted green curves) For PTBBESSY line analysis (panel a)the background contributions could be neglected and only the fit to the full-energy peak wasperformed starting from 4 to 10 channels before the maximum
given in the top right corner Fits to the data are shown in red Gaussiancomponents describing the full-energy peaks and background componentsare shown as solid blue and dotted green curves respectively Dashed bluecurves represent either background (Fig 13 panels b c d and f) or Iodineescape peaks (Fig 14 panels b and c) For energies above 2792 keV (Fig 14panels d to h) the Iodine escape peak is no longer fitted as an extra componentbut is absorbed by the full-energy peak The tails observed at energies lowerthan 20 keV (Fig 13 panels a and b) are supposed to be due to scattering fromthe entrance window materials or to some L-shell escape X-rays
Results for 16 fitted BGO lines are shown in Figs 15 and 16 Each full-energy peak was modeled with a single Gaussian (solid blue curves) overan exponential background (dotted green curves) The line from 57Co at12459 keV (Fig 15 panel a) lies outside the nominal BGO energy range(200 keVndash40 MeV) and shows a strong asymmetric broadening on the leftof the full-energy peak which can be described by an additional Gaussiancomponent (dashed blue curve) Panels a c e f and g of Fig 16 show fittedlines from spectra taken at SLAC with BGO EQM For some spectra energiesof the first and second pair production escape peaks which lie sim 511 keV andsim 1 MeV below the full-energy peak respectively are reported in the top rightof each plot Some of these secondary lines were included in the determinationof the BGO channel-energy relation (see Section 424)
42 Channel-energy relation
421 NaI nonlinear response
Several decades of experimental studies of the response of NaI(Tl) to gamma-rays have indicated that the scintillation efficiency mildly varies with thedeposited energy [7 16 27 28] Such nonlinearity must be correctly takeninto account when relating the pulse-height scale (ie the channel numbers)to gamma-ray energies Figure 17 shows the pulse height per unit energy(normalized to a value of unity at 66166 keV) versus incident photon energyEγ as measured by detector NaI FM 04 The data points include radioactive
70 Exp Astron (2009) 2447ndash88
30 40 50 60Channel
0
5
10
15
20(C
ount
sH
our)
x 1
03
BGO57Co(12459 keV)
(a)
70 80 90 100 110Channel
0
10
20
30
40
(Cou
nts
Hou
r) x
103
BGO203Hg(2792 keV)
(b)
120 130 140 150 160 170 180Channel
0
20
40
60
80
100
(Cou
nts
Hou
r) x
103
BGO22Na(511 keV)
(c)
160 180 200 220Channel
0
50
100
150
(Cou
nts
Hou
r) x
10
3
BGO137Cs(66166 keV)
(d)
200 220 240 260 280Channel
0
2
4
6
8
10
(Cou
nts
Hou
r) x
10
3
BGO54Mn(83484 keV)
(e)
240 280Channel
0
5
10
15
(Cou
nts
Hou
r) x
103
BGO88Y(89804 keV)
(f)
140 160 180 200Channel
0
20
40
60
80
100
120
140
(Cou
nts
Hou
r) x
103
BGO60Co(117323 amp 133249 keV)
(g)
320 340 360 380 400Channel
0
5
10
15
20
25
30
(Cou
nts
Hou
r) x
103
BGO22Na(127454 keV)
(h)
Exp Astron (2009) 2447ndash88 71
Fig 15 Full-energy peak analysis of BGO lines Data points (in black) are plotted with statisticalerrors Line fits (solid red curves) arise from the superposition of different components (i) one(or more) Gaussian functions describing the full-energy peak(s) and the pair production escapepeaks (solid blue curves) (ii) a constant linear quadratic or exponential function accounting forbackground contributions (dotted green curves) (andashh)
source measurements performed at MPE (triangles) together with additionallow-energy measurements taken at PTBBESSY between 10 and 60 keV(squares) In this case nonlinearity clearly appears as a dip in the plot at acharacteristic energy corresponding to the K-shell binding energy in Iodineie 3317 keV (as previously mentioned in Section 41) Photoelectrons ejectedby incident gamma-rays just above the K-shell absorption edge have very littlekinetic energy so that the response drops Just below this energy howeverK-shell ionization is not possible and L-shell ionization takes place Since thebinding energy is lower the ejected photoelectrons are more energetic whichcauses a rise in the response
The addition of measurements taken at PTBBESSY with four NaI detec-tors (see Section 32) for computing the NaI response is particularly neces-sary in the region around the K-edge energy since the radioactive sourcesused at MPE only sample it with four lines three of which (221 25 and3206 keV) belong to double peaks and the first line from 57Co at 1441 keVshows asymmetries and broadening (see Fig 13 panel a) From the collectedPTBBESSY data line fitting results were obtained for 19 spectra collectedat energies between 10 and 60 keV Corrections of gain settings between thedetectors during the two different calibration campaigns were carefully takeninto account
In order to compute a valuable NaI channel-energy relation the energyrange was initially split into two regions one below and one above the K-edgeenergy For E lt 3317 keV data were fitted with a second degree polynomial(parabola) while for E gt 3317 keV the following empirical function wasadopted
E(x c) = a + b middot radicx c + c middot x c + d middot ln x c (4)
where E is the line energy in keV and x c is the line-center position inchannels Figure 18 shows an example of the channel-energy relation calcu-lated for detector FM 04 in the low-energy (left panel) and in the high-energyrange (right panel) Radioactive sources data (triangles) and PTBBESSY data(squares) are fitted together with a second degree polynomial (left panel redcurve) and with the empirical function of Eq 4 (right panel blue curve)Analysis of all detectors shows similar results In particular all calculatedrelations give fit residuals below 1 as required The obtained fit parametersare reported in the figurersquos caption
72 Exp Astron (2009) 2447ndash88
180 200 220 240Channel
0
2
4
6
8(C
ount
sH
our)
x 1
03
BGO40K(1460 keV)
(a)
440 480 520 560Channel
0
2
4
6
8
10
(Cou
nts
Hou
r) x
103
BGO88Y(183606 keV)
(b)
300 350 400Channel
0
1
2
3
4
5
(Cou
nts
Hou
r) x
103
BGO208Tl(2199 amp 2600 keV)
(c)
1000 1100 1200 1300Channel
00
01
02
03
04
(Cou
nts
Hou
r) x
103
BGO AmBe(3919 amp 4430 keV)
(d)
700 800 900Channel
000
002
004
006
008
010
012
014
(Cou
nts
Hou
r) x
103
BGO16O(5619 amp 6130 keV)
(e)
1200 1400 1600 1800 2000Channel
000
005
010
015
020
(Cou
nts
Hou
r) x
103
BGO8Be(135 amp 14 amp 145 MeV)
(f)
2200 2300 2400 2500Channel
000
002
004
006
008
010
(Cou
nts
Hou
r) x
103
BGO8Be(17 amp 175 MeV)
(g)
Exp Astron (2009) 2447ndash88 73
Fig 16 Full-energy peak analysis of BGO lines Data points (in black) are plotted with statisticalerrors Line fits (solid red curves) arise from the superposition of different components (i) one(or more) Gaussian functions describing the full-energy peak(s) and the pair production escapepeaks (solid blue curves) (ii) a constant linear quadratic or exponential function accounting forbackground contributions (dotted green curves) (andashg)
422 The iodine K-edge region
By taking a closer look to the region around the K-edge energy (see Fig 19left panel) the discrepancy between low and high-energy fits becomes clearlyvisible Thus assigning a unique energy to every channel is a more delicateissue A possible way to solve such an ambiguity is to divide the channelsdomain into three parts as shown in Fig 19 right panel xe and xq represent thechannels were the empirical and quadratic fit respectively assume the value ofEK = 3317 keV (red and blue diamonds) For all channels in the interval xe lt
x lt xq a linear relation was calculated in order to assign an average energyto each channel The green triangles represent the average energies of the twoenergies calculated with both relations (diamonds and circles) For the analysisof laboratory calibrations we calculated a K-edge region (region 2) of aboutfive to seven channels for every NaI detector On orbit however due to a muchsmaller number of channels (128) the flight DPU groups these channels intoone ldquotransitionrdquo channel (per detector) which is calculated through lookuptables
Fig 17 The differentiallinearity measured for NaIFM 04 normalized to unityat 66166 keV
10 100 1000
Photon energy Eγ (keV)
09
10
11
12
13
14
Puls
e H
eigh
tUni
t Ene
rgy(
arbi
tru
nits
)
Radioactive sourcesSynchrotron radiation
Eγ = 3317 keV
74 Exp Astron (2009) 2447ndash88
60 80 100 120 140 160
Channel
-1
0
1
Res
idua
ls(
)
10
15
20
25
30
35
Ene
rgy
(keV
)
NaI Detector(FM 04)10-33 keV
Radioactive sourcesSynchrotron radiationQuadratic fit
0 1000 2000 3000
Channel
-1
0
1
Res
idua
ls(
)
200
400
600
800
Ene
rgy
(keV
)
NaI Detector(FM 04) 34-900keV
Radioactive sourcesSynchrotron radiationEmpirical fit
a b
Fig 18 Channel-energy relation calculated below (left panel) and above (right panel) the K-edgeenergy for detector NaI FM 04 MPE data points (triangles) and PTBBESSY data points (squares)are fitted together with a second degree polynomial below 3317 keV (left panel red curve) andwith the empirical function (see Eq 4) above 3317 keV (right panel blue curve) Residuals tothe fits are given in the panel under the respective plots For the quadratic fit below the K-edgefollowing fit parameters were obtained a = 108 plusmn 005 b = 01495 plusmn 00009 c = (264 plusmn 004) middot10minus4 with a reduced χ 2 of 23 In the case of the empirical fit above the K-edge the fit parametersare a = 947 plusmn 14 b = 273 plusmn 009 c = 02306 plusmn 00008 d = minus262plusmn 04 with a reduced χ 2 of 60
423 Simulation validation
In order to check the accuracy of the obtained channel-energy relation andto validate simulations presented in Section 34 radioactive source spectrawere compared with simulated data Figures 20 and 21 show the 14 previouslyanalysed NaI lines (measured at normal incidence with detector FM 12)6 asa function of energy that is after applying the channel-energy conversionSimulated unbroadened and broadened spectra are overplotted as green andred histograms respectively Sample spectra over the full NaI energy rangecomparing simulation and measurements can be found in [14]
Unbroadened lines represent good guidelines to check the exact position ofthe full-energy and escape peaks A good example is the high-energy doublepeak of 57Co (Fig 20 panel f) where simulations confirm the position of both
6In this case simulations were not based on measurements performed with detector FM 04because at that time detector FM 12 was the first to have a complete set of collected spectra
Exp Astron (2009) 2447ndash88 75
50 100 150 200 250 300
Channel
-1
0
1
Res
idua
ls(
)
10
20
30
40
50
60
70
Ene
rgy
(keV
)
NaI Detector(FM 04)10-60 keVRadioactive sourcesSynchrotron radiationQuadratic fitEmpirical fit
Iodine K-edgeE=3317 keV
xe xq
Channel E
ner
gy
(k
eV)
EK
12
3
Quadratic fit
Empirical fit
Linear relation
Eq(xe)
Ee(xq)
a b
Fig 19 On the left Channel-energy relation around the Iodine K-edge for detector NaI FM04 Data points from radioactive source lines (triangles) and from synchrotron radiation (squares)are fitted together with a quadratic function below the K-edge energy (red curve) and with theempirical function above the K-edge energy (blue curve) Residuals to the fits are given in thepanel under the plot On the right Schematic representation of the channel-energy relation aroundthe Iodine K-edge energy In region 1 for x lt xe the quadratic relation is adopted (red curve) Inregion 3 for x gt xq the empirical function is adopted (blue curve) The ambiguity arises at channelxe (region 2) which could in principle be equally described by both relations ie we could assignto it either an energy Eq(xe) (red circle) or the K-edge energy EK (blue diamond) In order toavoid this ambiguity a linear relation (green curve) has been derived in order to assign an averageenergy value to each channel in region 2 (green triangles)
radioactive lines at 12206 and 13647 keV and the presence of the Iodineescape peak around sim90 keV Still some discrepancies are evident eg atlower energies One likely cause of the discrepancies below 60 keV mostlyresulting in a higher number of counts of the simulated data compared tothe real data and which is particularly visible for the 57Co line at 1441 keV(Fig 20 panel a) is the uncertainty about the detailed composition of theradioactive source Indeed radioactive isotopes are contained in a small (1mm) sphere of ldquosaltrdquo Simulations including this salt sphere were performedand a factor of 38 difference in the perceived 1441 keV line strength wasfound The true answer lies somewhere between this and the simulation withno source material as salt and radioactive isotope are mixed For the generalcalibration simulation a pointsphere of radioactive material not surroundedby salt had been used Another possible explanation could probably be theleakage of secondary electrons from the surface of the detector leading toa less-absorbed energy Further discrepancies at higher energies which arevisible eg in panels d and e of Fig 21 are smaller than 1
76 Exp Astron (2009) 2447ndash88
8 10 12 14 16 18 20
Energy (keV)
00
05
10
15(C
ount
sH
our)
x 1
03
NaI57Co(1441 keV)
(a)
15 20 25 30 35
Energy (keV)
0
5
10
15
20
25
(Cou
nts
Hou
r) x
103
NaI109Cd(b)(221 amp
250 keV)
20 25 30 35 40 45Energy (keV)
0
5
10
15
20
25
30
(Cou
nts
Hou
r) x
103
NaI137Cs(3206 amp 366 keV)
(c)
40 50 60 70Energy (keV)
0
20
40
60(C
ount
sH
our)
x 1
03
NaI241Am(594 keV)
(d)
60 80 100Energy (keV)
00
01
02
03
04
05
06
(Cou
nts
Hou
r) x
103
NaI109Cd(8803 keV)
(e)
60 80 100 120 140 160 180Energy (keV)
0
2
4
6
(Cou
nts
Hou
r) x
103
NaI57Co(f)(12206 amp
13647 keV)
Fig 20 Comparison between spectra collected with NaI FM 12 after channel-energy conversionand simulated spectra for 6 radioactive source lines Here line fits and various componentspreviously described in Figs 13 and 14 are shown as solid and dashed grey curves respectivelySimulated broadened spectra are overplotted in red Unbroadened spectra (green histograms) canbe considered as guidelines for the exact energy positions of lines and secondary escape peaks(see text) The height of the unbroadened peaks is truncated in most plots to better show thecomparison between real and broadened spectra (andashf)
Exp Astron (2009) 2447ndash88 77
220 240 260 280 300 320 340
Energy (keV)
00
05
10
15
20
25
30(C
ount
sH
our)
x 1
03
NaI203Hg(2792 keV)
(a)
400 450 500 550 600
Energy (keV)
0
1
2
3
(Cou
nts
Hou
r) x
103
NaI22Na(511 keV)
(b)
550 600 650 700 750
Energy (keV)
0
1
2
3
(Cou
nts
Hou
r) x
103
NaI137Cs(66166 keV)
(c)
700 800 900
Energy (keV)
000
005
010
015
(Cou
nts
Hou
r) x
103
NaI54Mn(83484 keV)
(d)
750 800 850 900 950
Energy (keV)
000
005
010
015
020
025
(Cou
nts
Hou
r) x
103
NaI88Y(89804 keV)
(e)
Fig 21 Comparison between spectra collected with NaI FM 12 after channel-energy conversionand simulated spectra for 5 radioactive source lines Here line fits and various componentspreviously described in Figs 13 and 14 are shown as solid and dashed grey curves respectivelySimulated broadened spectra are overplotted in red Unbroadened spectra (green histograms) canbe considered as guidelines for the exact energy positions of lines and secondary escape peaks(see text) The height of the unbroadened peaks is truncated in most plots to better show thecomparison between real and broadened spectra (andashe)
78 Exp Astron (2009) 2447ndash88
424 BGO response
The determination of a channel-energy relation for the BGO detectors re-quired the additional analysis of the high-energy data taken with the EQMmodule at SLAC to cover the energy domain between 5 MeV and 20 MeV Inorder to combine the radioactive source measurements made with the BGOFMs at MPE and the proton beam induced radiation measurements made withthe BGO EQM at SLAC (see Section 33) it was necessary to take into accountthe different gain settings by application of a scaling factor The scaling factorwas derived by comparing 22Na and AmBe measurements (at 511 1274 and4430 keV) which were done at both sites Due to the very low statistics inthe measurements from the high-energy reaction of the Van-de-Graaf beamon the LiF target (Eq 2) first and second electron escape peaks from pairannihilation of the 146 MeV line could not be considered in this analysis (seealso Fig 16 panel f) They were mainly used as background reference pointsin order to help finding the exact position of the 175 MeV line In this waya dataset of 23 detected lines was available for determining the BGO EQMchannel-energy relation
For the BGO flight modules analysis (FM 01 and FM 02) a smaller linesample between 125 keV and 44 MeV was adopted still leading to similarresults Differences are due to different gains caused by the setup constraintswhich are described in more detail in Section 43 Similarly to the NaI analysisBGO datasets were fitted with an empirical function (Eq 4) Figure 22
Fig 22 BGO channel-energy relation andcorresponding residualscalculated for EQM detectorapplying the empirical fit(blue curve) of Eq 4 over thefull energy domain between02 and 20 MeV Data takenat MPE and at SLAC aremarked with triangles andsquares respectively Fitparameters for this fit area = minus428 plusmn 23 b = minus54 plusmn 3c = 829 plusmn 006 and d = 167 plusmn11 with a reduced χ 2 of 7
0 500 1000 1500 2000 2500
Channel
-5
0
5
Res
idua
ls (
)
0
5
10
15
20
Ene
rgy
(MeV
)
BGO Detector(EQM)02-20 MeV
Radioactive sources
Van-de-Graaff (pγ)-reactionEmpirical fit
Exp Astron (2009) 2447ndash88 79
shows the BGO EQM channel-energy relation between 02 and 20 MeV Fitparameters are given in the caption In this case fit residuals are smallerthan 4
43 Energy resolution
The energy resolution R of a detector is conventionally defined as the fullwidth at half maximum (w) of the differential pulse height distribution dividedby the location of the peak centroid H0 [22] This quantity mainly reflects thestatistical fluctuations recorded from pulse to pulse In the case of an approx-imately linear response the average pulse amplitude is given by H0 = K Nwhere K is a proportionality constant and the limiting resolution of a detectorcan be calculated as
R equiv w
H0= 235 K
radicN
K N= 235radic
N(5)
where N represents the average number of charge carriers (in our case itrepresents the number of photoelectrons emitted from the PMT photocath-ode) and the standard deviation of the peak in the pulse height spectrumis given by σ = K
radicN However in real detectors the resolution is not only
determined by photoelectron statistics but can be affected by other effectssuch as (1) local fluctuations in the scintillation efficiency (2) nonuniform lightcollection (3) variance of the photoelectron collection over the photocathode(4) contribution from the nonlinearity of the NaI scintillation response (5)contributions from PMT gain drifts and (6) temperature drift (eg see [22])In order to take all these effects into account a nonlinear dependence of theenergy resolution was assumed
w =radic
a 2 + b 2 E + c 2 E 2 (6)
This formula is mainly based on traditional physical understanding of scin-tillation detectors and produces a physically motivated behavior outside therange of measurements It consists of (1) a constant term a which describeslimiting electronic resolution (typically not a noticeable effect in scintillators)(2) a term proportional to the square root of the energy explaining statisticalfluctuations in the numbers of scintillation photons and photo electrons and(3) a term proportional to the energy which accounts for the non-idealldquotransfer efficiencyrdquo of transporting scintillation photons from their creationsites to the PMT photocathode For the actual fits the first parameter a wasset to zero since no significant electronic broadening was observed Spatialnon-uniformity of the energy resolution will be discussed in Section 45
In order to fit the energy resolution it was necessary to convert themeasured widths (in channels) to energies in keV by applying to each detectorthe corresponding channel-energy relation previously obtained Fit results fordetector NaI FM 04 and for the three BGO detectors (EQM FM 01 and FM
80 Exp Astron (2009) 2447ndash88
0 200 400 600 800
Energy (keV)
-100
10
Res
idua
ls(
)
0
10
20
30
R (
)
0 5 10 15
Energy (MeV)
-200
20
Res
idua
ls(
)
0
10
20
30
R (
)
EQMFM01FM02
a b
Fig 23 Energy resolution R in percentage calculated for detector NaI FM 04 (left panel) and forall BGO detectors (right panel) ie BGO EQM (blue curve) BGO FM 01 (red curve) and BGOFM 02 (yellow curve) Residuals to Eq 6 are given in the panel under the plot NaI FM 04 fitparameters to Eq 6 are b = 0916 plusmn 0014 and c = 00994 plusmn 00010 with a reduced χ 2 of 5 Inthe case of the BGO detectors the fit parameters for EQM are b = 354 plusmn 005 and c = 00506 plusmn00013 with a reduced χ 2 of 22 for FM 01 b = 309 plusmn 003 and c = 0027 plusmn 0003 with a reducedχ 2 of 13 for FM 02 b = 3050 plusmn 0021 and c = 00361 plusmn 00012 with a reduced χ 2 of 24
02) are displayed in Fig 23 In the case of NaI (left panel) we noticed thatsimilar results could also be obtained by excluding those calibration lines whichare affected by greater uncertainties of w namely the 144 keV line from 57Coand all secondary lines ie the 25 keV line from 109Cd the 366 keV from 137Csand the 1366 keV line from 57Co As regards the BGO energy resolution (rightpanel) EQM results (blue triangles) show poorer energy resolution comparedto FM 01 (red squares) and FM 02 (yellow dots) which could be explained by
Fig 24 FWHM (in keV) asa function of Energy for the12 NaI FM detectors (bluesquares) and for the twoBGO FM detectors (greentriangles) For both detectortypes the standard fit to Eq 6is plotted
10 100 1000 10000
Energy (keV)
1
10
100
1000
FWH
M (
keV
)
NaI FM 01-13
BGO FM 01-02
Exp Astron (2009) 2447ndash88 81
Fig 25 On-axis effective areaof the 12 NaI FM detectorsand of the two BGO FMdetectors
10 100 1000
Energy (keV)
10
100
Eff
ectiv
e A
rea
(cm
2 )
NaI FM 01-13
BGO FM 01-02
minor differences in the detector design (optical coupling) Finally a commonplot of all NaI and BGO flight module detectors is shown in Fig 24
44 Full-energy peak effective area and angular response
The full-energy peak effective area in cm2 for both NaI and BGO detectorswas computed as
A Ef f = Aa c middot P T
middot 4 π d 2s (7)
where (1) A = Line area (counts) (2) a c = Current source activity (1s) (3)P T = Line transition probability (4) d s X = Distance between source anddetector (cm) No additional factor to account for flux attenuation between thesource and the detector was needed since its effect above 20 keV is less than1 The different line-transition probabilities for each radioactive nuclidewhich were applied for this analysis can be found in Table 1 (column 4) Thereference activities were provided in a calibration certificate by the supplierof the radioactive sources7 The radioactive source activities at the day ofmeasurement were calculated by taking into account the time elapsed sincethe calibration reference day The relative measurement uncertainty of thegiven activities for all sources is 3 with the exception of the Mercury source(203Hg) and the Cadmium source (109Cd) which have an uncertainty of 4
Results for the on-axis effective area as a function of the energy for allNaI and BGO FM detectors are shown in Fig 25 The initial drop below 20keV is due to a Silicone rubber layer placed between the NaI crystal and
7Calibrated radioactive sources were delivered by AEA Technology QSA GmbH (BraunschweigGermany) together with a calibration certificate from the Deutscher Kalibrierdienst (DKDCalibration laboratory for measurements of radioactivity Germany)
82 Exp Astron (2009) 2447ndash88
-90 0 90 180 270Source Angle (deg)
0
20
40
60
80
100
120
140
Eff
ectiv
e A
rea
(cm
2 )
137Cs -3289 keV203Hg -2792 keV137Cs -66166 keV
NaI FM 04
-90 0 90 180 270Source Angle (deg)
60
80
100
120
140
Eff
ectiv
e A
rea
(cm
2 )
88Y -89804 keV88Y -183606 keV
BGO EQMa b
Fig 26 Off-axis effective area as a function of the irradiation angle (from ndash90 to 270) for NaIFM 04 (left panel) and BGO EQM (right panel) Different curves represent different line-energiesIn the case of NaI results for three radioactive lines are shown namely 3206 keV from 137Cs (topgreen curve) 2792 keV from 203Hg (middle red curve) and 66166 keV from 137Cs (bottom yellowcurve) For BGO two lines from 88Y are shown 89804 keV (blue curve) and 183606 keV (redcurve)
the entrance window which absorbs low-energy gamma-rays At energieshigher than 300 keV NaI detectors become more transparent to radiationand a decrease in the response is observed The BGO on-axis effective areais constant over the energy range 150 keVndash2 MeV with a mean value of120 plusmn 6 cm 2 Unfortunately the effective area at 44 MeV could not bedetermined since the activity of the AmBe source was not known SLACmeasurements could not be used for this purpose either At 3317 keV theeffect of the Iodine K-edge is clearly visible as a drop This energy region wasextensively investigated during the PTBBESSY calibration campaign and isfurther described in Section 45
For several radioactive sources off-axis measurements of the NaI andBGO response have been performed These are extremely important for theinterpretation of scattered photon flux both from the spacecraft and fromthe atmosphere Figure 26 shows results for the NaI and the BGO effectivearea as a function of the irradiation angle over the full 360 The left panelpresents NaI FM 04 measurements from (i) the 3289 keV line8 from 137Cs (topgreen curve) (ii) the 2792 keV line from 203Hg (middle red curve) and (iii)the 66166 keV line from 137Cs (bottom yellow curve) Itrsquos worth noting thatall curves especially the middle one trace the detectorrsquos structure (crystalhousing and PMT) Furthermore the bottom curve (66166 keV) varies verylittle with the inclination angle because of the high penetration capability ofgamma-rays at those energies In the case of BGO measurements performedwith 88Y at 89804 and 183606 keV highlight the two drops in the response
8In this case the double line was fitted with a single Gaussian since the response dramaticallydrops above 90 and the fit algorithm is not capable of identifying two separate components
Exp Astron (2009) 2447ndash88 83
due to the presence of the PMTs on both sides of the crystal Although theBGO detectors are symmetrical an asymmetry in the curves is caused by theTitanium bracket on one side of the crystal housing which is necessary formounting the detectors onto the spacecraft (Fig 5 right panel) Comparisonsof the effective area for NaI and BGO with simulations can be found in [14]
45 Quantum detection efficiency (QDE) and spatialuniformity of NaI detectors
As already mentioned in Section 32 the QDE for detector NaI FM 04 couldbe determined through detailed measurements performed at PTBBESSY byfirstly relating the fitted full-energy peak area of the NaI spectrum with thesum of counts detected by the HPGe detector (for which QDE = 1) in thesame region of interest around the full-energy peak (which includes the smallGe escape peak appearing above 11 keV) and subsequently accounting for thedifferent beam fluxes The QDE was determined at all energies by analyzinga spectrum taken in the center of the detectorrsquos surface and at three energies(rasterscans at 10 36 and 60 keV) by analyzing spectra taken over the wholesurface area (see Fig 28 top panels for results obtained at 10 and 60 keV) Theeffective area (in cm 2) can then be calculated as the integral of the QDE overthe detectorrsquos active area (1267 cm 2) Results for 19 lines measured between10 and 60 keV are shown in Fig 27 This Figure can be considered as a zoomat low energies of the NaI effective area in Fig 25
The detectorrsquos spatial homogeneity was investigated at PTBBESSY bymeans of rasterscans of detector NaI FM 04 at three distinct energies namely10 36 and 60 keV During each rasterscan sim 700 runs per detector wererecorded with a spacing of 5 mm and for each one the full-energy peak wasanalysed as previously described in Section 411 For the rastercsan at 10 keV
Fig 27 NaI FM 04 effectivearea calculated from QDEdetermination ofPTBBESSY data collectedbetween 10 and 60 keV Arelative uncertainty of 5has been estimated
10 20 30 40 50 60
Energy (keV)
0
20
40
60
80
100
120
140
Phot
opea
k E
ffec
tive
Are
a (c
m2 )
Iodine K edge
E=3317 keV
84 Exp Astron (2009) 2447ndash88
the dependence of line-center (in channel ) and line resolution (in ) on therasterscan position in mm (DET_X and DET_Y) is shown in Fig 28 bottompanels Results for the line area are not further shown since the QDE plotspreviously discussed in Fig 28 top panels already reflect the surface behaviorfor this parameter)
From the line center spatial dependence one can notice that some bordereffects appear toward the edge of the NaI crystal shifting the full-energy peakto lower channel numbers ie energies This effect is of the order of 12 at
50 100 150DET X (mm)
900
950
DE
T Y
(m
m)
50 100 150DET X (mm)
900
950D
ET
Y (
mm
)
50 100 150
DET X (mm)
900
950
DE
T Y
(m
m)
50 100 150
DET X (mm)
900
950
DE
T Y
(m
m)
a b
c d
QDE
008 010 012 014 016
QDE
087 089 091 093 095
Line center (channel )
42 43 43 44 45 46 47
Line resolution ()
24 25 26 27 28 29 30
Fig 28 Contour plots showing results for the PTBBESSY rasterscans of detector NaI FM04 Atthe top QDE calculated over the active area (126 cm 2) at 10 and 60 keV (left and right panelrespectively) At the bottom Calculated fit parameters of the full-energy peak as a function of thebeam position (in mm) for the 10 keV rasterscan (1) line-center (in channel left panel) (2) lineresolution (in right panel) The color code is indicated in the colorbars above each plot
Exp Astron (2009) 2447ndash88 85
10 and 60 keV and of 7 at 36 keV The line resolution is homogeneous overthe whole detectorrsquos area with a mean value of 25 15 and 10 at 10 36and 60 keV respectively While the first two resolutions are comparable tothe results obtained with radioactive sources at 144 and 366 keV the 60 keVrasterscan gives an improved resolution when compared to the result of 15obtained with the 241Am source at 594 keV (see Fig 13 panel f )
5 Conclusions
After the successful launch of the Fermi mission and the proper activationof its instruments the 14 GBM detectors started to collect scientific data Thespectral overlap of the two BGO detectors (02 to 40 MeV) with the LAT lowerlimit of sim 20 MeV opens a promising epoch of investigation of the high-energyprompt and afterglow GRB emission in the yet poorly explored MeV-GeVenergy region
On ground the angular and energy response of each GBM detector wascalibrated using various radioactive sources between 144 keV and 44 MeVThe channel-energy relations energy resolutions on- and off-axis effectiveareas of the single detectors were determined Additional calibration mea-surements were performed for NaI detectors at PTBBESSY below 60 keVand for BGO detectors at SLAC above 5 MeV thus covering the whole GBMenergy domain As already mentioned in the introduction further calibrationmeasurements at system level and after integration onto the spacecraft werecarried out (see Table 4) All those measurements crucially contribute to thevalidation of Monte Carlo simulations of the direct GBM detector responseThese incorporate detailed models of the Fermi observatory including theGBM detectors instruments and all in-flight spacecraft components plus thescattering of gamma-rays from a burst in the spacecraft and in the Earthrsquosatmosphere [14] The response as a function of photon energy and directionis finally captured in a Direct Response Matrix (DRM) database allowing thedetermination of the true gamma-ray spectrum from the measured data
The results reported in this paper directly contribute to the DRM finaldetermination and they fully follow physical expectations [18] Measurementsand fit results for two sample detectors (NaI FM 04 and BGO FM 02) aregiven in Tables 5 and 6 respectively (see Appendix) Fit parameters for theenergy-channel relations and energy resolutions of those detectors are alwaysreported in the captions of the corresponding plots (see Figs 18 22 and 23) Itis worth noting that these parameters reflect the characteristics of all other NaIand BGO detectors not reported in this paper thus showing that all detectorsbehave the same within statistics
The channel-energy relation parameters obtained throughout this analysisare not directly used for in-flight calculations because of the different elec-tronic setup which was used during detector level calibration and in-flight (seeSection 31) The same analysis method described in Section 411 and the samefitting procedures of Section 42 were adopted to analyze data collected during
86 Exp Astron (2009) 2447ndash88
system level calibration These results confirm that the systematic uncertaintiesin the channel-energy conversions arise from the discussed sources ie fittingprocedure limited statistics in the case of high-energy lines of BGOs elec-tronics and non-uniform responses of detectors and are fully consistent withmeasurements presented in this paper
The GBM detectors will play an important role in the GRB field in thenext decade The unprecedented synergy between the GBM and the LATwill allow to observe burst spectra covering sim 7 decades in energy Moreoversimultaneous observations by the large number of gamma-ray burst detectorsoperating in the Fermi era will complement each other A nice overviewof the currently operating space missions can be found in Table 1 of [3]Here instrument characteristics such as FOVs effective areas localizationuncertainties and energy bands are compared The GBM detectors fit in thisoverall picture by providing a higher trigger energy range (50ndash300-keV) thaneg Swift-BAT [9] (15ndash150 keV) and a spectral coverage up to 40 MeV anenergy limit which can only be investigated with the LAT and the Mini-Calorimeter on-board AGILE [32] New insights into the GRB properties aretherefore expected from GBM thus advancing the study of GRB physics
Open Access This article is distributed under the terms of the Creative Commons AttributionNoncommercial License which permits any noncommercial use distribution and reproduction inany medium provided the original author(s) and source are credited
Appendix
Table 4 List of all calibrated GBM detectors
Detector Calibration campaignThis work In-flight MPE PTBBESSY SLAC
(144 keV minus 44 MeV) (10 minus 60 keV) (44 minus 176 MeV)
NaI EQM minus radic minus minusFM 01 n0
radic radic minusFM 02 n1
radic radic minusFM 03 n2
radic radic minusFM 04 n3
radic radic minusFM 05 n4
radic minus minusFM 07 n6
radic minus minusFM 08 n7
radic minus minusFM 09 n8
radic minus minusFM 10 n9
radic minus minusFM 11 na
radic minus minusFM 12 nb
radic minus minusFM 13 n5
radic minus minusBGO EQM minus radic minus radic
FM 01 b0radic minus minus
FM 02 b1radic minus minus
Columns 2 and 3 indicate the detector numbering schemes adopted during the presented calibra-tion analysis and in-flight respectively A checklist showing which detectors were employed ateach detector-level calibration campaign is given in columns 4 to 6
Exp Astron (2009) 2447ndash88 87
Table 5 Measured and fitted quantities with fit residuals (Res) for 14 lines from radioactivesources collected with detector NaI FM 04
Tabulatedline energy(keV)
Full-energy peak parameters
Center FWHM Eff area
Measured Fitted Res Measured Fitted Res cm 2
(channels) (keV) () (channels) (keV) () ()
1441 783 plusmn 08 1439 015 188 plusmn 14 4 26 minus4 46 plusmn 4221 11635 plusmn 019 2204 029 217 plusmn 05 5 21 minus5 98 plusmn 425 1304 plusmn 05 2505 minus020 225 plusmn 13 5 21 minus6 95 plusmn 43206 16172 plusmn 022 3214 minus026 259 plusmn 05 6 19 5 114 plusmn 4366 1791 plusmn 06 minus minus 286 plusmn 17 7 18 minus11 85 plusmn 3594 2919 plusmn 03 598 minus06 412 plusmn 06 9 15 minus18 101 plusmn 48803 4128 plusmn 06 874 08 564 plusmn 16 12 14 8 122 plusmn 512206 55625 plusmn 023 1215 04 655 plusmn 05 16 13 04 111 plusmn 413647 6151 plusmn 08 minus minus 670 plusmn 22 17 13 minus6 109 plusmn 42792 1195 plusmn 6 27860 021 144 plusmn 5 32 11 12 520 plusmn 18511 21361 plusmn 05 51223 minus024 2284 plusmn 26 55 11 29 180 plusmn 0766166 2732 plusmn 9 65976 029 274 plusmn 9 70 10 minus27 121 plusmn 0483484 34133 plusmn 22 8277 09 331 plusmn 6 87 10 minus6 90 plusmn 0389804 36696 plusmn 28 8908 08 367 plusmn 10 93 10 minus25 82 plusmn 04
Table 6 Measured and fitted quantities with fit residuals (Res) for 8 lines from radioactivesources collected with detector BGO FM 02
Tabulatedline energy(keV)
Full-energy peak parameters
Center FWHM Eff area
Measured Fitted Res Measured Fitted Res cm 2
(channels) (keV) () (channels) (keV) () ()
12459 4768 plusmn 003 12459 0002 142 plusmn 05 5196 1861 07 107 plusmn 32792 9013 plusmn 019 27927 minus0023 1946 plusmn 029 7136 1397 08 122 plusmn 7511 15287 plusmn 006 51082 003 224 plusmn 04 8207 1239 12 121 plusmn 466166 19390 plusmn 008 66266 minus015 252 plusmn 04 9307 1116 012 121 plusmn 483484 24015 plusmn 012 83388 012 2637 plusmn 014 9695 1080 07 119 plusmn 489804 25740 plusmn 006 89773 003 312 plusmn 03 11823 927 minus25 118 plusmn 4127454 35942 plusmn 010 127518 minus005 387 plusmn 05 14650 798 minus25 112 plusmn 4183606 51119 plusmn 012 183592 0008 711 plusmn 07 25830 583 10 101 plusmn 3
References
1 Agostinelli S et al Geant4 minus a simulation toolkit Nucl Instrum Methods A 506 250 (2003)2 Atwood WB Gamma Large Area Silicon Telescope (GLAST) applying silicon strip detec-
tor technology to the detection of gamma rays in space Nucl Instrum Methods A 342 302(1994)
3 Band DL The synergy of gamma-ray burst detectors in the GLAST era AIPC 1000 121(2008)
4 Thomson A Vaughan D (eds) X-ray data booklet Lawrence Berkeley National Labora-tory Berkeley CA httpxdblblgov (2001) Accessed 3 December 2008
5 Dermer CD Boumlttcher M Chiang J Spectral energy distributions of gamma-ray burstsenergized by external shocks ApJ 513 656 (1999)
6 Dingus BL Observations of the highest energy gamma-rays from gamma-ray Bursts AIPC558 383 (2001)
7 Engelkeimer D Nonlinear response of NaI(Tl) to photons Rev Sci Instrum 27 589 (1956)
88 Exp Astron (2009) 2447ndash88
8 GBM Proposal vol I Science Investigation and Technical Description httpgammaraymsfc nasagovgbmpublicationsproposal (1999) Accessed 3 December 2008
9 Gehrels N et al The swift gamma-ray Burst Mission Ap J 611 1005ndash1020 (2004)10 Giuliani A et al AGILE detection of delayed gamma-ray emission from GRB 080514B
AampA 491 25 (2008)11 GLAST Science Brochure Exploring Naturersquos Highest Energy Processes with the Gamma-
Ray Large Area Space Telescope Document ID 20010070290 Report Number NAS 1839-107-GSFC NASANP-2000-9-107-GSFC (2001) Accessed 3 December 2008
12 Gonzalez MM et al A γ -ray burst with a high-energy spectral component inconsistent withthe synchrotron shock model Nature 424 751 (2003)
13 Goumlrner W et al BAMline the first hard X-ray beamline at BESSY II Nucl InstrumMethods A 467ndash468 703ndash706 (2001)
14 Hoover AS et al GLAST burst monitor instrument simulation and modeling AIPC 1000565 (2008)
15 Hurley K et al Detection of a γ -ray burst of very long duration and very high-energy Nature372 652 (1994)
16 Iredale P The non-proportional response of NaI(Tl) crystals to γ -rays Nucl Instr Meth 11336 (1961)
17 Kaneko Y et al Broadband spectral properties of bright high-energy gamma-ray burstsobserved with BATSE and EGRET ApJ 677 1168 (2008)
18 von Kienlin A et al The GLAST burst monitor SPIE 5488 763 (2004)19 von Kienlin A et al High-energy calibration of a BGO detector of the GLAST burst
monitor AIPC 921 576ndash577 (2007)20 Kippen RM The GEANT low-energy Compton scattering (GLECS) package for use in
simulating advanced Compton telescopes New Astron Rev 48 221 (2004)21 Kippen RM et al Instrument response modeling and simulation for the GLAST burst
monitor AIPC 921 590 (2007)22 Knoll GF Radiation Detection and Measurement 3rd edn Wiley New York (1989)23 Krumrey M Gerlach M Scholze F Ulma G Calibration and characterization of semi-
conductor X-ray detectors with synchrotron radiation Nucl Instrum Methods A 568 364ndash368(2006)
24 Meegan CA et al The GLAST burst monitor AIPC 921 13 (2007)25 Meacuteszaacuteros P Rees MJ Papathanassiou H Spectral properties of blast-wave models of
gamma-ray burst sources ApJ 432 181 (1994)26 Michelson P et al GLAST a detector for high-energy gamma rays Proc SPIE 2806 31
(1996)27 Moszynskynski M et al Intrinsic energy resolution of NaI(Tl) Nucl Instr Nucl Instrum
Methods Phys Rev A 484 259 (2002)28 Prescott JR Narayan GH Electron response and intrinsic line-widths in NaI(Tl) Nucl
Instrum Methods 75 51 (1969)29 Riesemeier H et al Layout and first XRF applications of the BAMline at BESSY II X-Ray
Spectrom 34 160ndash163 (2005)30 Sari R Esin AA On the synchrotron self-compton emission from relativistic shocks and its
implications for gamma-ray burst afterglows ApJ 548 787 (2001)31 Schoumltzig U Schrader H Halbwertszeiten und Photonen-Emissionswahrscheinlichkeiten
von haumlufig verwendeten Radionukliden PTB-Bericht PTB-Ra-165 5th edition (1998)32 Tavani M et al The AGILE mission and its scientific instrument SPIE 6266 2 (2006)33 Thompson DJ et al Calibration of the energetic Gamma-ray experiment telescope
(EGRET) for the compton Gamma-ray observatory ApJS 86 629 (1993)34 Wallace M et al Full spacecraft source modeling and validation for the GLAST burst
monitor AIPC 921 58-59 (2007)35 Waxman E Gamma-Ray-burst afterglow supporting the cosmological fireball model
constraining parameters and making predictions ApJ 485 5 (1997)
- Ground-based calibration and characterization of the Fermi gamma-ray burst monitor detectors
-
- Abstract
-
- Introduction
- The GBM detectors
- Calibration campaigns
-
- Laboratory setup and calibration instrumentation at MPE
- NaI low-energy calibration at PTBBESSY
- BGO high-energy calibration at SLAC
- Simulation of the laboratory and the calibration setup at MPE
-
- Calibration data analysis and results
-
- Processing of calibration runs
-
- Analysis of the full-energy peak
-
- Channel-energy relation
-
- NaI nonlinear response
- The iodine K-edge region
- Simulation validation
- BGO response
-
- Energy resolution
- Full-energy peak effective area and angular response
- Quantum detection efficiency (QDE) and spatial uniformity of NaI detectors
-
- Conclusions
- Appendix
- References
-
48 Exp Astron (2009) 2447ndash88
Keywords Fermi Gamma-Ray space telescope middot GLAST middotGamma-Ray detectors middot Calibration middot NaI(Tl) middot BGO middot Gamma-Ray burst
PACS 9555Ka middot 9870Rz middot 2940Mc middot 0785-m middot 0785Fv
1 Introduction
The Fermi Gamma-ray Space Telescope (formerly known as GLAST) whichwas successfully launched on June 11 2008 is an international and multi-agency space observatory [2 26] that studies the cosmos in the photonenergy range of 8 keV to greater than 300 GeV The scientific motivationsfor the Fermi mission comprise a wide range of non-thermal processes andphenomena that can best be studied in high-energy gamma rays from solarflares to pulsars and cosmic rays in our Galaxy to blazars and Gamma-RayBursts (GRBs) at cosmological distances [11] Particularly in GRB science thedetection of energy emission beyond 50 MeV [6 17] still represents a puzzlingtopic mainly because only a few observations by the Energetic Gamma-RayExperiment Telescope (EGRET) [33] on-board the Compton Gamma-RayObservatory (CGRO) [12 15] and more recently by AGILE [10] are presentlyavailable above this energy Fermirsquos detection range extending approximatelyan order of magnitude beyond EGRETrsquos upper energy limit of 30 GeV willhopefully expand the catalogue of high-energy burst detections A greaternumber of detailed observations of burst emission at MeV and GeV energiesshould provide a better understanding of bursts thus testing GRB high-energyemission models [5 25 30 35] Fermi was specifically designed to avoidsome of the limitations of EGRET and it incorporates new technology andadvanced on-board software that will allow it to achieve scientific goals greaterthan previous space experiments
The main instrument on board the Fermi observatory is the Large AreaTelescope (LAT) a pair conversion telescope like EGRET operating inthe energy range between 20 MeV and 300 GeV This detector is based onsolid-state technology obviating the need for consumables (as was the casefor EGRETrsquos spark chambers whose detector gas needed to be periodicallyreplenished) and greatly decreasing (lt10 μs) dead time (EGRETrsquos high deadtime was due to the length of time required to re-charge the HV power suppliesafter event detection) These features combined with the large effective areaand excellent background rejection allow the LAT to detect both faint sourcesand transient signals in the gamma-ray sky Aside from the main instrumentthe Fermi Gamma-Ray Burst Monitor (GBM) extends the Fermi energy rangeto lower energies (from 8 keV to 40 MeV) The GBM helps the LAT with thediscovery of transient events within a larger FoV and performs time-resolvedspectroscopy of the measured burst emission In case of very strong and hardbursts the GRB position which is usually communicated by the GBM to theLAT allows a repointing of the main instrument in order to search for higherenergy prompt or delayed emission
Exp Astron (2009) 2447ndash88 49
+x
+z
+y
Fig 1 On the left Schematic representation of the Fermi spacecraft showing the placementof the 14 GBM detectors 12 NaI detectors (from n0 to nb) are located in groups of threeon the spacecraft edges while two BGOs (b0 and b1) are positioned on opposite sides of thespacecraft On the right Picture of Fermi taken at Cape Canaveral few days before the launchHere six NaIs and one BGO are visible on the spacecraftrsquos side Photo credit NASAKim Shiflett(httpmediaarchivekscnasagov)
The GBM is composed of unshielded and uncollimated scintillation detec-tors (12 NaI (Tl) and two BGO) which are distributed around the Fermi space-craft with different viewing angles as shown in Fig 1 in order to determinethe direction to a burst by comparing the count rates of different detectorsThe reconstruction of source locations and the determination of spectral andtemporal properties from GBM data requires very detailed knowledge of thefull GBM detectorsrsquo response This is mainly derived from computer modelingand Monte Carlo simulations [14 20] which are supported and verified byexperimental calibration measurements
In order to perform the above validations several calibration campaignswere carried out in the years 2005 to 2008 The calibration of each individualdetector (or detector-level calibration) comprises three distinct campaigns amain campaign with radioactive sources (from 144 keV to 44 MeV) whichwas performed in the laboratory of the Max-Planck-Institut fuumlr extrater-restrische Physik (MPE Munich Germany) and two additional campaignsfocusing on the low energy calibration of the NaI detectors (from 10 to60 keV) and on the high energy calibration of the BGO detectors (from 44to 176 MeV) respectively The first one was performed at the synchrotronradiation facility of the Berliner Elektronenspeicherring-Gesellschaft fuumlrSynchrotronstrahlung (BESSY Berlin Germany) with the support and col-laboration of the German Physikalisch-Technische Bundesanstalt (PTB)
50 Exp Astron (2009) 2447ndash88
while the second was carried out at the SLAC National AcceleratorLaboratory (Stanford CA USA)
Subsequent calibration campaigns of the GBM instrument were performedat system-level that comprises all flight detectors the flight Data ProcessingUnit (DPU) and the Power Supply Box (PSB) These were carried out in thelaboratories of the National Space Science and Technology Center (NSSTC)and of the Marshall Space Flight Center (MSFC) at Huntsville (AL USA) andinclude measurements for the determination of the channel-energy relationof the flight DPU and checking of the detectorsrsquo performance before andafter environmental tests After the integration of GBM onto the spacecrafta radioactive source survey was performed in order to verify the spacecraftbackscattering in the modeling of the instrument response These later mea-surements are summarized in internal NASA reports and will be not furtherdiscussed
This paper focuses on the detector-level calibration campaigns of the GBMinstrument and in particular on the analysis methods and results whichcrucially support the development of a consistent GBM instrument responseIt is organized as follows Section 2 outlines the technical characteristics of theGBM detectors Section 3 describes the various calibration campaigns whichhave been done highlighting simulations of the calibration in the laboratoryenvironment performed at MPE (see Section 34) Section 4 discusses theanalysis system for the calibration data and shows the calibration results InSection 5 final comments about the scientific capabilities of GBM are givenand the synergy of GBM with present space missions is outlined
2 The GBM detectors
The GBM flight hardware comprises a set of 12 Thallium activated SodiumIodide crystals (NaI(Tl) hereafter NaI) two Bismuth Germanate crystals (Bi4Ge3 O13 commonly abbreviated as BGO) a DPU and a PSB In total 17scintillation detectors were built 12 flight module (FM) NaI detectors twoFM BGO detectors one spare NaI detector and two engineering qualifica-tion models (EQM) one for each detector type Since detector NaI FM 06immediately showed low-level performances it was decided to replace it withthe spare detector which was consequently numbered FM 13 Note that thedetector numbering scheme used in the calibration and adopted throughoutthis paper is different to the one used for in-flight analysis as indicated inTable 4 (columns 2 and 3) in the Appendix
The cylindrical NaI crystals (see Fig 2) have a diameter of 127 cm (5rdquo) anda thickness of 127 cm (05rdquo) For light tightness and for sealing the crystalsagainst atmospheric moisture (NaI(Tl) is very hygroscopic) each crystal ispacked light-tight in a hermetically sealed Al-housing (with the exceptionof the glass window to which the PMT is attached) In order to allow mea-surements of X-rays down to 5 keV (original project goal [8]) the radiationentrance window is made of a 02 mm thick Beryllium sheet However due to
Exp Astron (2009) 2447ndash88 51
Photomultiplier
Voltage divider
Interface to SC
Photomultiplierhousing
NaI(Tl)crystal
Glassplate
Siliconerubberlayer
Beryllium window
Heater foilsand thermostats
Front End Electronics
Fig 2 On the top Schematic cross-section of a GBM NaI detector showing the main componentsA picture of a detector flight unit mounted on the calibration stand was taken in the laboratoryduring detector level calibration measurements and is shown in the bottom panel
mechanical stability reasons an additional 07 mm thick Silicone layer had tobe mounted between the Be window and the crystal causing a slight increaseof the low-energy detection threshold Moreover an 05 mm thick Tetratexlayer was placed in front of the NaI crystal in order to improve its reflectivityThe transmission probability as a function of energy for all components of thedetector windowrsquos system is shown in Fig 3 Consequently NaI detectors areable to detect gamma-rays in the energy range between sim 8 keV and sim 1 MeVThe individual detectors are mounted around the spacecraft and are orientedas shown schematically in Fig 1 (left panel) This arrangement results in anexposure of the whole sky unocculted by the earth in orbit
52 Exp Astron (2009) 2447ndash88
Fig 3 X-ray transmission ofall individual layers of a NaIdetector entrance window(the 02 mm thick Berylliumsheet in blue the 05 mm thickTetratex layer in green the07 mm thick Silicone layerin red and the sum of allcomponents in black Thetransmission at 10 keVis sim 30
0 5 10 15 20 25 3000
01
02
03
04
05
06
07
08
09
10
Tra
nsm
issi
on
Photon Energy (keV)
Be (200 m)
Tetratex (508 m)
Silicone (700 m)
Total
The Hamamatsu R877 photomultiplier tube (PMT) is used for all the GBMdetectors This is a 10-stage 5-inch phototube made from borosilicate glass witha bialkali (CsSb) photocathode which has been modified (R877RG-105) inorder to fulfill the GBM mechanical load-requirements
With their energy range extending between sim 02 and sim 40 MeV twoBGO detectors provide the overlap in energy with the LAT instrument andare crucial for in-flight inter-instrument calibration The two cylindrical BGOcrystals (see Fig 4) have a diameter and a length of 127 cm (5rdquo) and aremounted on opposite sides of the Fermi spacecraft (see Fig 1) providingnearly a 4 π sr FoV The BGO housings are made of CFRP (Carbon FibreReinforced Plastic) which provides the light tightness and improves the me-chanical stability of the BGO unit For thermal reasons the interface parts arefabricated of Titanium On each end the circular side windows of the crystalare polished in mirror quality and are viewed by a PMT (same type as used forthe NaI detectors) Viewing the crystal by two PMTs guarantees a better lightcollection and a higher level of redundancy
The output signals of all PMTs (for both NaIs and BGOs) are first amplifiedvia linear charge-sensitive amplifiers The preamplifier gains and the HVs areadjusted so that they produce a sim5 V signal for a 1 MeV gamma-ray incidenton a NaI detector and for a 30 MeV gamma-ray incident on a BGO detectorDue to a change of the BGO HV settings after launch this value changed to40 MeV thus extending the original BGO energy range [8] Signals are thensent through pulse shaping stages to an output amplifier supplying differentialsignals to the input stage of the DPU which are combined by a unity gainoperational amplifier in the DPU before digitizing In the particular case ofBGO detectors outputs from the two PMTs are divided by two and then addedat the preamplifier stage in the DPU
In the DPU the detector pulses are continuously digitized by a separateflash ADC at a speed of 01 μs The pulse peak is measured by a separatesoftware running in a Field Programmable Gate Array (FPGA) This schemeallows a fixed energy independent commendable dead-time for digitization
Exp Astron (2009) 2447ndash88 53
Photomultiplier 2BGO
crystal
Photomultiplier 1
FEE
unit 1
FEE
unit 2
Heater foils
and thermostats
Interfaces to SC
External
connector group
PMT
assembly 1
PMT
assembly 2
Silicone rubber layer
Fig 4 On the top Schematic cross-section of a GBM BGO detector The right hand side ofthe schematic is a cut away view whereas the left hand side is an external view The centralportion contains the BGO crystal (light blue) which is partially covered by the outer surface ofthe detectorrsquos assembly A picture of a BGO detector flight unit taken in the laboratory duringsystem level calibration measurements is shown in the bottom panel
The signal processor digitizes the amplified PMT anode signals into 4096 linearchannels Due to telemetry limitations these channels are mapped (pseudo-logarithmic compression) on-board into (1) 128-channel resolution spectrawith a nominal temporal resolution of 4096 s (Continuous High SPECtralresolution or CSPEC data) and (2) spectra with a poorer spectral resolutionof eight channels and better temporal resolution of 0256 s (Continuous highTIME resolution or CTIME data) by using uploaded look-up tables1 Thesewere defined with the help of the on-ground channel-energy relations (seeSection 42) Moreover time-tagged event (TTE) data are continuously storedby the DPU These data consist of individually digitized pulse height eventsfrom the GBM detectors which have the same channel boundaries as CSPECand 2 μs resolution TTE data are transmitted only when a burst trigger occursor by command More details on the GBM data type as well as a block diagramof the GBM flight hardware can be found in [24]
1The temporal resolution of CTIME and CSPEC data is adjustable nominal integration times aredecreased when a trigger occurs
54 Exp Astron (2009) 2447ndash88
Besides processing signals from the detectors the DPU processes com-mands formats data for transmission to the spacecraft and controls high andlow voltage (HV and LV) to the detectors Changes in the detector gains canbe due to several effects such as temperature changes of the detectors andof the HV power supply variations in the magnetic field at the PMT andPMT aging GBM adopts a technique previously employed on BATSE thatis Automatic Gain Control (AGC) In this way long timescale gain changesare compensated by the GBM flight software by adjusting the PMT HV tokeep the background 511 keV line at a specified energy channel
3 Calibration campaigns
To enable the location of a GRB and to derive its spectrum a detailed knowl-edge of the GBM detector response is necessary The information regardingthe detected energy of an infalling gamma-ray photon which is dependenton the direction from where it entered the detector is stored into a responsematrix This must be generated for each detector using computer simulationsThe actual detector response at discrete incidence angles and energies has tobe measured to verify the validity of the simulated responses The completeresponse matrix of the whole instrument system (including LAT and thespacecraft structure) is finally created by simulation of a dense grid of energiesand infalling photon directions using the verified simulation tool [21]
The following subsections are dedicated to the descriptions of the three cali-bration campaigns at detector level The most complete calibration of all flightand engineering qualification models was performed at the MPE laboratoryusing a set of calibrated radioactive sources whose type and properties arelisted in Table 1
Due to the lack of radioactive sources producing lines below 60 keV andin order to study spatial homogeneity properties of NaI detectors a dedicatedcalibration campaign was performed at PTBBESSY Here four NaI detectors(FM 01 FM 02 FM 03 and FM 04)2 were exposed to a monochromaticX-ray beam with energy ranging from 10 to 60 keV and the whole detectorrsquossurface was additionally raster-scanned at different energies with a pencilbeam perpendicular to the detectorrsquos surface
In order to extend the BGO calibration range another dedicated calibrationcampaign was carried out at the SLAC laboratory Here the BGO EQMdetector3 was exposed to three gamma-ray lines (up to 176 MeV) producedby the interaction of a proton beam of sim340 keV generated with a small Van-de-Graaff accelerator with a LiF-target A checklist showing which detectors
2Detectors were delivered to MPE for detector level calibration in batches of four and shortlythere after shipped to the US for system level calibration Therefore as the PTBBESSY facilitywas only available for a short time only one batch of NaIs could be calibrated there3The BGO flight modules were not available for calibration at the time of measurements sincethey had already been shipped for system integration
Exp Astron (2009) 2447ndash88 55
Table 1 Properties of radioactive nuclides used for NaI and BGO calibration campaigns (1)Half-lives in years (y) or days (d) (2) Decay type producing the gamma-ray (γ ) or X-ray (eg Kand L) radiation minus For nuclides which are part of decay chains the daughter nuclides producingthe corresponding radiation are also given (3) Line energies in keV (4) Photon-emissionprobabilities for the corresponding decays
Nuclide (1) Half-life (2) Line origin (3) Line Energies (4) Transition(keV) Probability
22Na 9505(4) d Annih 511 1798γ 127454 09994
40K 1277(8)E9 y γ 146083 0106754Mn 31215(8) d γ 83484 0999750(12)
γ 1441 00916(15)57Co 27183(8) d γ 12206 08560(17)
γ 13647 01068(8)60Co 52712(11) y γ 117323 09985(3)
γ 133249 0999826(6)88Y 106630(25) d γ 89804 0940(3)
γ 183606 09933(3)AgminusSumKα 221 0836(6)
109Cd 4621(14) d AgminusSumKβ 25 01777(19)γ 8803 003626(20)BaminusSumKα 3206 00553(10)
137Cs 3013(24) y BaminusSumKβ 366 001321(27)Baminus137m 66166 08500(20)
203Hg 46604(17) d γ 2792 08146(13)232Th 1405(6)E10 y 208Tl (γ ) 261453 03564241Am 4322(7) y γ 594 0359(4)241Am9Be 4322 (7) y γ 4430 000004
Values from [31]
were employed at each detector-level calibration campaign is given in Table 4(columns 4 to 6)
31 Laboratory setup and calibration instrumentation at MPE
The measurements performed at MPE resulted in an energy calibration withvarious radioactive sources and in addition a calibration of the angularresponse of the detectors at different incidence angles of the radiation Thedetectors and the radioactive sources were fixed on special holders whichwere placed on wooden stands above the laboratory floor to reduce scatteringfrom objects close to them (see Fig 5) The radioactive sources were placedalmost always at the same distance (d) from the detector The position of thedetectorrsquos wooden stand with respect to the laboratory was never changedduring measurements Due to the unavailability of the flight DPU and PSBcommercial HV and LV power supplies were used and the data were read outby a Breadboard DPU
The determination of the angular response of the detectors was achievedin the following way The center of the NaI detector calibration coordinatesystem was chosen at the center of the external surface of the Be-window ofthe detector unit with the X axis pointing toward the radioactive source the
56 Exp Astron (2009) 2447ndash88
Fig 5 Detector holders with NaI (left panel) and BGO detectors (right panel) are positionedin front of the radioactive source (on top of the red holder) on their wooden stands during thecalibration at the MPE laboratory
Y axis pointing toward left and Z axis pointing up (see Fig 8 left panel) Thedetectors were mounted on a specially developed holder in such a way thatthe front of the Be-window was parallel to the YZ plane (if the detector ispointed to the source ie 0 position) and so that detectors could be rotatedaround two axes in order to achieve all incidence angles of the radiation Thedetector rotation axes were the Z-axis (Azimuth) and around the X-axis (roll)For BGO detectors the mounting was such that the very center of the detector(center of crystal) was coincident with the origin of the coordinate system andthe 0 position was defined as the long detector axis coincident with the Y-axisThe BGO detectors were only rotated around the Z-axis and no roll angleswere measured in this case
32 NaI low-energy calibration at PTBBESSY
The calibration of the NaI detectors in the low photon energy range down to10 keV was performed with monochromatic synchrotron radiation with thesupport of the PTB A pencil beam of about 02 times 02 mm 2 was extracted froma wavelength-shifter beamline the ldquoBAMlinerdquo [29] at the electron storagering BESSY II which is equipped with a double-multilayer monochromator(DMM) and a double-crystal monochromator (DCM) [13] In the photonenergy range from 10 keV to 30 keV DCM and DMM were operated in seriesto combine the high resolving power of the DCM with the high spectral purityof the DMM Above 30 keV a high spectral purity with higher order contri-butions below 10minus4 was already achieved by the DCM alone The tunability ofthe photon energy was also used to investigate the detectors in the vicinity ofthe Iodine K-edge at 3317 keV
The absolute number of photons in the pencil beam was independentlydetermined by two different methods firstly by taking at each photon energy aspectrum with a high-purity germanium detector (HPGe) for which a quantum
Exp Astron (2009) 2447ndash88 57
detection efficiency (QDE) of unity had been determined earlier and secondlyby using silicon photodiodes which in turn had been calibrated against PTBprimary detector standards such as a cryogenic radiometer and a free-air ion-ization chamber [23] As these photodiodes are operated in the photovoltaicmode the photon fluxes had to be about four orders of magnitude higher thanfor the counting detectors Different pairs of Cu and Al filters were designedfor different photon energy ranges so that the transmittance of one filter was inthe order of 1 which can easily be measured Two identical filters were usedin series to achieve the required reduction in flux by four orders of magnitudeA picture of the calibration setup is shown in Fig 6
The effective area of the detectors as a function of the photon energy wasdetermined by scanning the detectors at discrete locations in x- and y-directionover the active area while the pencil beam was fixed in space During the scanthe intensity was monitored with a photodiode operated in transmission Theeffective area is just the product of the average QDE and the active areaIn addition the spatial homogeneity of the QDE was determined by thesemeasurements (see Section 44)
The measurements presented in this paper were recorded at 18 differentenergies namely from 10 to 20 kev in 2 keV steps from 30 to 37 keV in 1 keVsteps and at 328 40 50 and 60 keV These accurate measurements allowed toexactly determine the low-energy behavior of the channel-energy relation ofthe NaI detectors (see Section 421) and to fine tune the energy range around
Fig 6 NaI FM 04 detector photographed inside the measurement cave of the BAMline duringthe low-energy calibration campaign at the electron storage ring BESSY II in Berlin The HPGedetector is located left of the GBM detector Both are mounted on the XZ table which was movedby step motors during the scans The beam exit window of the BAMline is located below the redbox visible at the top right corner The Cu and Al filters holders are placed horizontally betweenthe window and the detectors
58 Exp Astron (2009) 2447ndash88
the Iodine K-edge at 3317 keV (see Section 422) Moreover three rasterscansof the detectorrsquos surface were performed at 10 36 and 60 keV in order to studythe detectorsrsquo spatial homogeneity (see Section 45 for more details)
33 BGO high-energy calibration at SLAC
In order to better constrain the channel-energy relation and the energy reso-lution at energies higher than 44 MeV an additional high-energy calibrationof the BGO EQM detector was performed at SLAC with a small electrostaticVan-de-Graaff accelerator [19] This produces a proton beam up to sim350 keVand was already used to verify the LAT photon effective area at the low endof the Fermi energy range (20 MeV) When the proton beam produced by theVan-de-Graaff accelerator strikes a LiF target which terminates the end ofthe vacuum pipe (see Fig 7 left panel) gammas with energies of 61 MeV146 MeV and 175 MeV are produced via the reactions
p (sim 340keV) + 7Li rarr 8 Be (1+)lowast rarr 8 Be + γ (146 or 175 MeV) (1)
p (sim 340keV) + 19 F rarr 16 Olowast + α rarr 16 O + γ (61 MeV) (2)
The highly excited 175 MeV state of 8Be is created by protons in a resonancecapture process at 340 keV on 7Li (see Eq 1) At lower energies photons arestill produced from the Breit-Wigner tail (Γ = 12 keV) of the 8Belowast resonanceThe narrow gamma-ray line at 175 MeV is produced by the transition to the8Be ground state in which the quantum energy is determined by hν = Q +78Ep where Q = 172 MeV is the energy available from the mass changeand Ep = 340 keV is the proton beam energy The gamma-ray line observedat 146 MeV which corresponds to transitions to the first excited state of 8Be
Fig 7 BGO EQM detector photographed in the SLAC laboratory during the high-energycalibration campaign (left panel) The grey box on the left is the end of the proton beam insidewhich the LiF target was placed in order to react and produce the desired gamma lines (see Eq 1and 2) The right panel shows a simulation of the gamma-ray interaction with the detector Onlygamma-rays whose first interaction is within the detector crystal are shown for clarity
Exp Astron (2009) 2447ndash88 59
Fig 8 Simulation of the laboratory environment The left panel shows in a top view of thelaboratory the components of the simulation model of all objects which were present during thecalibration campaign Also shown is the coordinate system adopted (X and Y axis of the right-handed system +Z axis pointing upward) The right panel shows an example of the simulatedscattering of the radiation in the laboratory In a view from the -Y axis the path of the first100 photons interacting with the detector are shown The radioactive source emitted radiationof 1275 MeV isotropically The major part of the detected photons is directly incident but asignificant fraction is scattered radiation by the laboratory environment (see Table 2)
is broadened with respect to the experimental resolution because of the shortlifetime of the state against decay into two alpha-particles Finally Eq 2 showsthat 61 MeV gamma-rays are generated when the narrow (Γ = 32 keV ) 16Oresonance at 340 keV is hit
For performing the measurements the EQM detector was placed as closeas possible to the LiF-target at an angle of sim45 with respect to the proton-beam line in order to guarantee a maximized flux of the generated gamma-rays Unfortunately measurements for the determination of the detectorrsquoseffective area could not be obtained since the gamma-ray flux was not closelymonitored
34 Simulation of the laboratory and the calibration setup at MPE
In order to simulate the recorded spectra of the calibration campaign at MPEto gain confidence in the simulation software used a very detailed model ofthe environment in which the calibration took place had to be created Thedetailed modeling of the laboratory was necessary as all scattered radiationfrom the surrounding material near and far had to be included to realisticallysimulate all the radiation reaching the detector4 Background measurementswith no radioactive sources present were taken to subtract the ever-present
4An important argument driving the decision not to use a collimator for measurements withradioactive sources was the fact that the simulation of the laboratory environment with all itsscattering represented a necessary and critical test for the simulation software which later had toinclude the spacecraft [34]
60 Exp Astron (2009) 2447ndash88
Table 2 Contribution of simulated laboratory components to the detected photons
Component NaI BGO22 keV 122 keV 1275 MeV 443 MeV
Direct incidence 940 910 750 700Scattered rad total 60 90 250 300Walls lt 01 06 120 130Source holder 46 75 30 20Source stand 01 lt 01 lt 01 lt 01Detector stand lt 01 lt 01 20 lt 01Floor lt 01 08 80 150Other furniture lt 01 lt 01 lt 01 lt 01Air 13 lt 01 lt 01 lt 01
natural background radiation in the laboratory However the source-inducedldquobackgroundrdquo radiation created by scattered radiation of the non-collimatedradioactive sources had to be included in the simulation to enable a detailedcomparison with the measured spectra
The detailed modeling of the calibration setup of the MPE laboratory wasperformed using the GEANT4 -based GRESS5 simulation software providedby the collaboration team based at the Los Alamos National Laboratory(LANL USA) who also provided the software model of the detectors [14]The modeling of the whole laboratory included laboratory walls (concrete)windows (aluminum glass) doors (steel) tables (wood aluminum) cupboards(wood) a shelf (wood) the electricity distributor closet (steel) the opticalbench (aluminum granite) and the floor (PVC) Moreover detector andsource stands (wood) source holder (PVC acrylic) and detector holder (alu-minum) were modeled in great detail (see Fig 8 left panel) A summary ofthe comparison of the measurements and the simulation with respect to theinfluence of the various components of the calibration environment is given inTable 2 and a sample plot of the scattered radiation is given in the right panelof Fig 8
Additional simulations of the other calibration campaigns in particular forthe PTB BESSY one are planned In the case of SLAC measurements thesimulation tools were only used to determine the ratios between full-energypeaks and escape peaks (see Fig 7 right panel) no further simulation of thecalibration setup is foreseen
5GEANT4 is a suite of high-energy interaction simulation tools created at CERN [1] GRESS isthe General Response Simulation System which is developed at LANL It is based on a modified(extended) version of GEANT4 [20]
Exp Astron (2009) 2447ndash88 61
4 Calibration data analysis and results
41 Processing of calibration runs
During each calibration campaign all spectra measured by the GBM detectorswere recor-ded together with the information necessary for the analysisShortly before or after the collection of data runs additional background mea-surements were recorded for longer periods Every run was then normalizedto an exposure time of 1 h and the background was subsequently subtractedfrom the data In the case of measurements performed at PTBBESSYnatural background contribution could be neglected due to the very high beamintensities and to the short measurement times
Figures 9 10 11 and 12 show a series of sample spectra collected withdetectors NaI FM 04 BGO FM02 and BGO EQM These particular detectors
0 100 200 300 400Channel
0
20
40
60
80
(Cou
nts
Hou
r) x
103
(a) NaISR (10 keV)
0 100 200 300 400Channel
0
100
200
300
(Cou
nts
Hou
r) x
103
(b) NaISR (33 keV)
0 100 200 300 400Channel
0
50
100
150
200
250
(Cou
nts
Hou
r) x
103
(c) NaISR (34 keV)
0 200 400 600Channel
0
50
100
150
(Cou
nts
Hou
r) x
103
(d) NaISR (60 keV)
Fig 9 Spectra measured with monochromatic synchrotron radiation (SR) at PTBBESSY withdetector NaI FM 04 Results for four different photon energies are shown a 10 keV b 33 keVc 34 keV and d 60 keV The two top panels (a and b) display spectra collected below the IodineK-edge energy (ie lt3317 keV) Above this energy (panels c and d) the characteristic Iodineescape peak is clearly visible to the left of the full-energy peak
62 Exp Astron (2009) 2447ndash88
0 200 400 600 800Channel
0
10
20
30
40
50
(Cou
nts
Hou
r) x
10
3
(a) NaI241Am
0 200 400 600 800Channel
0
5
10
15
20
25
30
(Cou
nts
Hou
r) x
103
(b) NaI109Cd
0 500 1000 1500Channel
0
2
4
6
(Cou
nts
Hou
r) x
103
(c) NaI57Co
0 500 1000 1500 2000Channel
0
2
4
6
8
10
12
(Cou
nts
Hou
r) x
103
(d) NaI203Hg
0 1000 2000 3000 4000Channel
0
1
2
3
4
5
(Cou
nts
Hou
r) x
103
(e) NaI22Na
0 1000 2000 3000 4000Channel
0
5
10
15
20
(Cou
nts
Hou
r) x
103
(f) NaI137Cs
0 1000 2000 3000 4000Channel
00
02
04
06
08
10
(Cou
nts
Hou
r) x
103
(g) NaI54Mn
Channel 0 1000 2000 3000 4000
00
02
04
06
08
10
(Cou
nts
Hou
r) x
103
(h) NaI88Y
Exp Astron (2009) 2447ndash88 63
Fig 10 Normalized background-subtracted spectra measured at MPE with detector NaI FM 04from the following radioactive sources a 241Am b 109Cd c 57Co d 203Hg e 22Na f 137Cs g 54Mnand h 88Y
were chosen arbitrarily to present the whole analysis since it was checked thatall other detectors behave in an identical way (see Section 43 and Section 44)In Fig 9 four calibration runs recorded at PTBBESSY at different photonenergies (10 33 34 and 60 keV) highlight the appearance of an importantfeature of the NaI spectra Below the characteristic Iodine (I) K-shell bindingenergy of 3317 keV (or ldquoK-edgerdquo energy) spectra display only the full-energypeak which moves toward higher channel numbers with increasing photonenergy (see panels a and b) For energies higher than the K-edge energy asecond peak appears to the left of the full-energy peak (see panels c and d)which is caused by the escape of characteristic X-rays resulting from K-shelltransitions (fluorescence of Iodine) The energy of this fluorescence escapepeak equals the one of the full-energy peak minus the X-ray line energy [4]The contributions of the different Iodine Kα and Kβ fluorescence lines cannot be resolved by the detector
NaI spectra from radioactive sources recorded at MPE are shown in Fig 10A detailed description of the full-energy peaks characterizing every source isgiven in Section 411 Beside full-energy and Iodine escape peaks spectra fromhigh-energy radioactive lines show more features (ie see the 137Cs spectrumin panel f ) such as the low-energy X radiation (due to internal scatteringof gamma-rays very close to the radioactive material) at the very left of thespectrum the Compton distribution which is a continuous distribution due toprimary gamma-rays undergoing Compton scattering within the crystal and abackscatter peak at the low-energy end of the Compton distribution
Similarly BGO spectra from radioactive sources collected at MPE andSLAC with detector FM 02 and BGO EQM are presented in Figs 11 and 12The spectrum produced by the Van-de-Graaff proton beam at SLAC whichwas measured by the spare detector BGO EQM is shown in panel c of Fig 12
411 Analysis of the full-energy peak
Radioactive lines emerge from the measured spectra as peaks of variousshapes and with multiple underlying contributions Depending on the specificspectrum one or more Gaussians in the form
G(x) = Aw
middotradic
4 ln 2
πeminus 4 ln 2 (x minus xc)
2
w 2(3)
were added in order to fit the data The three free parameters are (1) the peakarea A (2) the peak center xc and (3) the full width at half maximum w which
64 Exp Astron (2009) 2447ndash88
0 50 100 150 200Channel
0
5
10
15
(Cou
nts
Hou
r) x
103
(a) BGO57Co
0 50 100 150 200Channel
0
5
10
15
20
25
30
35
(Cou
nts
Hou
r) x
103
(b) BGO203Hg
0 100 200 300 400 500Channel
0
20
40
60
80
(Cou
nts
Hou
r) x
103
(c) BGO22Na
0 100 200 300 400 500Channel
0
20
40
60
80
100
120
140
(Cou
nts
Hou
r) x
103
(d) BGO137Cs
0 100 200 300 400 500Channel
0
2
4
6
8
(Cou
nts
Hou
r) x
103
(e) BGO54Mn
Channel 0 100 200 300 400 500
0
20
40
60
80
100
(Cou
nts
Hou
r) x
103
(f) BGO60Co
0 200 400 600 800 1000Channel
0
2
4
6
8
10
12
14
(Cou
nts
Hou
r) x
103
(g) BGO88Y
0 100 200 300 400 500Channel
0
2
4
6
8
10
12
14
(Cou
nts
Hou
r) x
103
(h) BGO40K
Exp Astron (2009) 2447ndash88 65
Fig 11 Normalized background-subtracted spectra measured at MPE with BGO FM 02 (panelsandashg) and EQM (panel h) from the following radioactive sources a 57Co b 203Hg c 22Na d 137Cse 54Mn f 60Co g 88Y and h 40K
is related to the standard deviation (σ ) of the distribution through the relationw = 2
radic2 ln 2 middot σ asymp 235 middot σ For the analysis of the measured full-energy
peaks further background components (linear quadratic or exponential) andGaussian components had to be modeled in addition to the main Gaussian(s)in order to account for non-photo-peak contributions such as the overlappingCompton distributions the backscattered radiation caused by the presence ofthe uncollimated radioactive source in the laboratory or other unknown back-ground features In the case of PTBBESSY spectra asymmetries appearingat the low energy tail of the full-energy peak were neglected by choosing asmaller region of interest and fitting only the right side of the peak As alreadymentioned no background was modeled under these spectra
0 100 200 300 400 500
Channel
0
2
4
6
8
10
12
14
(Cou
nts
Hou
r) x
103
(a) BGO208Tl
0 500 1000 1500 2000
Channel
00
05
10
15
(Cou
nts
Hou
r) x
103
(b) BGO AmBe
0 1000 2000 3000
Channel
000
005
010
015
020
025
030
(Cou
nts
Hou
r) x
103
(c) BGOVdG
Fig 12 Normalized background-subtracted spectra measured at SLAC with BGO EQM from tworadioactive sources a 208Tl and b AmBe The spectrum in panel c was recorded during one of theVan-de-Graaff (VdG) runs
66 Exp Astron (2009) 2447ndash88
Moreover since both NaI and BGO detectors are not always able to fullyseparate two lines lying close to each other and thus resulting in a singlebroadened peak particular constraints between line parameters of singlepeak components were fixed before running the fitting routines The relationbetween two line areas (lsquoA1rsquo and lsquoA2rsquo) arises from the transition probabilityP of the single line energies (see Table 1 column 4) A ratio between areasK area = P1P2 was obtained by considering those probabilities together withthe transmission probability for the detector entrance window and the relativetransmission of the photons between source and detector Finally the ratioswere cross-checked and determined through detailed simulations performedfor seven double lines measured with NaI and BGO detectors which are listedin Table 3
An important consideration when fitting mathematical functions to thesedata is that the calculated statistical errors of the fit parameters are alwayswithin 01 in the case of line areas and FWHM or even 001 in the caseof line-centers Such extreme precisions cause very high chi-square values insubsequent analysis as in the determination of the channel-energy relationwhich extends over an entire energy decade in the case of NaI detectorsMoreover it was noticed that by slightly changing the initial fitting conditionssuch as the region of interest around the peak or the type of backgroundparameter values suffered from substantial changes with respect to a precedentanalysis This effect is particularly strong in the analysis of multiple peaks weremore Gaussians and background functions are added and the number of freeparameters increases In order to account for this effects and to get a morerealistic evaluation of the fit parameter errors we decided to analyse severaltimes one spectrum per source (measured at normal incidence by detectors NaIFM 04 and BGO FM 02) each time putting different initial fitting conditionsThis procedure was repeated several times (usually sim10ndash20 times ie until thesystematic contribution was not further increasing and a good chi-square valueof the individual fit was produced) thus obtaining a dataset of fit parametersand respective errors For each error dataset standard deviations (σ ) werecalculated resulting in values of the order of 1 for line areas and FWHMsand of 01 for line-centers and were finally added to the fit error thusobtaining realistic errors
The fitting results for 17 lines measured by NaI FM 04 are presentedgraphically in Figs 13 and 14 In each panel the fitted line energies are
Table 3 Fit constraintsadopted for the analysis ofsome double peaks for NaIand BGO detectors
K area represents a calculatedratio between the peak areasof the given lines
Nuclide Detector Double line energy (keV) K area109Cd NaI 221 minus 25 488137Cs NaI 3206 minus 366 53357Co NaI 12206 minus 13647 81460Co BGO 117323 minus 133249 0998Be BGO 5619 minus 6130 0208Be BGO 14075 minus 14586 0298Be BGO 17108 minus 17619 027
Exp Astron (2009) 2447ndash88 67
20 40 60 80
Channel
0
20
40
60
80C
ount
s x
103
NaISR(a)(10 keV)
40 60 80 100
Channel
00
05
10
15
(Cou
nts
Hou
r) x
103
NaI57Co(1441 keV)
(b)
80 100 120 140 160
Channel
0
10
20
30
(Cou
nts
Hou
r) x
103
NaI109Cd(221 amp 250 keV)
(c)
120 150 180 210
Channel
0
5
10
15
20
25
30
(Cou
nts
Hou
r) x
103
NaI137Cs(3206 amp 366 keV)
(d)
140 160 180 200 220 240
Channel
0
20
40
60
80
100
120
140
Cou
nts
x 10
3
NaISR(e)(36 keV)
200 250 300 350Channel
0
20
40
60
80
(Cou
nts
Hou
r) x
103
NaI241Am(594 keV)
(f)
Fig 13 Full-energy peak analysis of NaI lines (a-f) Data points (in black) are plotted withstatistical errors Line fits (solid red curves) arise from the superposition of different components(i) one (or more) Gaussian functions describing the full-energy peak(s) (solid blue curves) (ii)secondary Gaussian functions modeling the Iodine escape peaks or other unknown backgroundfeatures (dashed blue curves) (iii) a constant linear quadratic or exponential function accountingfor background contributions (dotted green curves) For PTBBESSY line analysis (panels a ande) the background contributions could be neglected and only the fit to the full-energy peak wasperformed starting from 4 to 10 channels before the maximum
68 Exp Astron (2009) 2447ndash88
250 300 350Channel
0
50
100
150
Cou
nts
x 10
3
NaISR(a)(60 keV)
250 300 350 400 450 500Channel
00
01
02
03
04
05
06
(Cou
nts
Hou
r) x
103
NaI109Cd(8803 keV)
(b)
300 400 500 600 700Channel
0
2
4
6
8
10
(Cou
nts
Hou
r) x
103
NaI57Co(12206 amp 13647 keV)
(c)
1000 1100 1200 1300 1400Channel
0
2
4
6
8
10
12
(Cou
nts
Hou
r) x
103
NaI203Hg(2792 keV)
(d)
1800 2000 2200 2400Channel
0
1
2
3
4
(Cou
nts
Hou
r) x
103
NaI22Na(511 keV)
(e)
2400 2600 2800 3000Channel
0
1
2
3
4
(Cou
nts
Hou
r) x
103
NaI137Cs(66166 keV)
(f)
2800 3200 3600 4000Channel
000
005
010
015
020
(Cou
nts
Hou
r) x
103
NaI54Mn(83484 keV)
(g)
3200 3600 4000Channel
00
01
02
03
04
(Cou
nts
Hou
r) x
103
NaI88Y(89804 keV)
(h)
Exp Astron (2009) 2447ndash88 69
Fig 14 Full-energy peak analysis of NaI lines (a-h) Data points (in black) are plotted withstatistical errors Line fits (solid red curves) arise from the superposition of different components(i) one (or more) Gaussian functions describing the full-energy peak(s) (solid blue curves) (ii)secondary Gaussian functions modeling the Iodine escape peaks or other unknown backgroundfeatures (dashed blue curves) (iii) a constant linear quadratic or exponential function accountingfor background contributions (dotted green curves) For PTBBESSY line analysis (panel a)the background contributions could be neglected and only the fit to the full-energy peak wasperformed starting from 4 to 10 channels before the maximum
given in the top right corner Fits to the data are shown in red Gaussiancomponents describing the full-energy peaks and background componentsare shown as solid blue and dotted green curves respectively Dashed bluecurves represent either background (Fig 13 panels b c d and f) or Iodineescape peaks (Fig 14 panels b and c) For energies above 2792 keV (Fig 14panels d to h) the Iodine escape peak is no longer fitted as an extra componentbut is absorbed by the full-energy peak The tails observed at energies lowerthan 20 keV (Fig 13 panels a and b) are supposed to be due to scattering fromthe entrance window materials or to some L-shell escape X-rays
Results for 16 fitted BGO lines are shown in Figs 15 and 16 Each full-energy peak was modeled with a single Gaussian (solid blue curves) overan exponential background (dotted green curves) The line from 57Co at12459 keV (Fig 15 panel a) lies outside the nominal BGO energy range(200 keVndash40 MeV) and shows a strong asymmetric broadening on the leftof the full-energy peak which can be described by an additional Gaussiancomponent (dashed blue curve) Panels a c e f and g of Fig 16 show fittedlines from spectra taken at SLAC with BGO EQM For some spectra energiesof the first and second pair production escape peaks which lie sim 511 keV andsim 1 MeV below the full-energy peak respectively are reported in the top rightof each plot Some of these secondary lines were included in the determinationof the BGO channel-energy relation (see Section 424)
42 Channel-energy relation
421 NaI nonlinear response
Several decades of experimental studies of the response of NaI(Tl) to gamma-rays have indicated that the scintillation efficiency mildly varies with thedeposited energy [7 16 27 28] Such nonlinearity must be correctly takeninto account when relating the pulse-height scale (ie the channel numbers)to gamma-ray energies Figure 17 shows the pulse height per unit energy(normalized to a value of unity at 66166 keV) versus incident photon energyEγ as measured by detector NaI FM 04 The data points include radioactive
70 Exp Astron (2009) 2447ndash88
30 40 50 60Channel
0
5
10
15
20(C
ount
sH
our)
x 1
03
BGO57Co(12459 keV)
(a)
70 80 90 100 110Channel
0
10
20
30
40
(Cou
nts
Hou
r) x
103
BGO203Hg(2792 keV)
(b)
120 130 140 150 160 170 180Channel
0
20
40
60
80
100
(Cou
nts
Hou
r) x
103
BGO22Na(511 keV)
(c)
160 180 200 220Channel
0
50
100
150
(Cou
nts
Hou
r) x
10
3
BGO137Cs(66166 keV)
(d)
200 220 240 260 280Channel
0
2
4
6
8
10
(Cou
nts
Hou
r) x
10
3
BGO54Mn(83484 keV)
(e)
240 280Channel
0
5
10
15
(Cou
nts
Hou
r) x
103
BGO88Y(89804 keV)
(f)
140 160 180 200Channel
0
20
40
60
80
100
120
140
(Cou
nts
Hou
r) x
103
BGO60Co(117323 amp 133249 keV)
(g)
320 340 360 380 400Channel
0
5
10
15
20
25
30
(Cou
nts
Hou
r) x
103
BGO22Na(127454 keV)
(h)
Exp Astron (2009) 2447ndash88 71
Fig 15 Full-energy peak analysis of BGO lines Data points (in black) are plotted with statisticalerrors Line fits (solid red curves) arise from the superposition of different components (i) one(or more) Gaussian functions describing the full-energy peak(s) and the pair production escapepeaks (solid blue curves) (ii) a constant linear quadratic or exponential function accounting forbackground contributions (dotted green curves) (andashh)
source measurements performed at MPE (triangles) together with additionallow-energy measurements taken at PTBBESSY between 10 and 60 keV(squares) In this case nonlinearity clearly appears as a dip in the plot at acharacteristic energy corresponding to the K-shell binding energy in Iodineie 3317 keV (as previously mentioned in Section 41) Photoelectrons ejectedby incident gamma-rays just above the K-shell absorption edge have very littlekinetic energy so that the response drops Just below this energy howeverK-shell ionization is not possible and L-shell ionization takes place Since thebinding energy is lower the ejected photoelectrons are more energetic whichcauses a rise in the response
The addition of measurements taken at PTBBESSY with four NaI detec-tors (see Section 32) for computing the NaI response is particularly neces-sary in the region around the K-edge energy since the radioactive sourcesused at MPE only sample it with four lines three of which (221 25 and3206 keV) belong to double peaks and the first line from 57Co at 1441 keVshows asymmetries and broadening (see Fig 13 panel a) From the collectedPTBBESSY data line fitting results were obtained for 19 spectra collectedat energies between 10 and 60 keV Corrections of gain settings between thedetectors during the two different calibration campaigns were carefully takeninto account
In order to compute a valuable NaI channel-energy relation the energyrange was initially split into two regions one below and one above the K-edgeenergy For E lt 3317 keV data were fitted with a second degree polynomial(parabola) while for E gt 3317 keV the following empirical function wasadopted
E(x c) = a + b middot radicx c + c middot x c + d middot ln x c (4)
where E is the line energy in keV and x c is the line-center position inchannels Figure 18 shows an example of the channel-energy relation calcu-lated for detector FM 04 in the low-energy (left panel) and in the high-energyrange (right panel) Radioactive sources data (triangles) and PTBBESSY data(squares) are fitted together with a second degree polynomial (left panel redcurve) and with the empirical function of Eq 4 (right panel blue curve)Analysis of all detectors shows similar results In particular all calculatedrelations give fit residuals below 1 as required The obtained fit parametersare reported in the figurersquos caption
72 Exp Astron (2009) 2447ndash88
180 200 220 240Channel
0
2
4
6
8(C
ount
sH
our)
x 1
03
BGO40K(1460 keV)
(a)
440 480 520 560Channel
0
2
4
6
8
10
(Cou
nts
Hou
r) x
103
BGO88Y(183606 keV)
(b)
300 350 400Channel
0
1
2
3
4
5
(Cou
nts
Hou
r) x
103
BGO208Tl(2199 amp 2600 keV)
(c)
1000 1100 1200 1300Channel
00
01
02
03
04
(Cou
nts
Hou
r) x
103
BGO AmBe(3919 amp 4430 keV)
(d)
700 800 900Channel
000
002
004
006
008
010
012
014
(Cou
nts
Hou
r) x
103
BGO16O(5619 amp 6130 keV)
(e)
1200 1400 1600 1800 2000Channel
000
005
010
015
020
(Cou
nts
Hou
r) x
103
BGO8Be(135 amp 14 amp 145 MeV)
(f)
2200 2300 2400 2500Channel
000
002
004
006
008
010
(Cou
nts
Hou
r) x
103
BGO8Be(17 amp 175 MeV)
(g)
Exp Astron (2009) 2447ndash88 73
Fig 16 Full-energy peak analysis of BGO lines Data points (in black) are plotted with statisticalerrors Line fits (solid red curves) arise from the superposition of different components (i) one(or more) Gaussian functions describing the full-energy peak(s) and the pair production escapepeaks (solid blue curves) (ii) a constant linear quadratic or exponential function accounting forbackground contributions (dotted green curves) (andashg)
422 The iodine K-edge region
By taking a closer look to the region around the K-edge energy (see Fig 19left panel) the discrepancy between low and high-energy fits becomes clearlyvisible Thus assigning a unique energy to every channel is a more delicateissue A possible way to solve such an ambiguity is to divide the channelsdomain into three parts as shown in Fig 19 right panel xe and xq represent thechannels were the empirical and quadratic fit respectively assume the value ofEK = 3317 keV (red and blue diamonds) For all channels in the interval xe lt
x lt xq a linear relation was calculated in order to assign an average energyto each channel The green triangles represent the average energies of the twoenergies calculated with both relations (diamonds and circles) For the analysisof laboratory calibrations we calculated a K-edge region (region 2) of aboutfive to seven channels for every NaI detector On orbit however due to a muchsmaller number of channels (128) the flight DPU groups these channels intoone ldquotransitionrdquo channel (per detector) which is calculated through lookuptables
Fig 17 The differentiallinearity measured for NaIFM 04 normalized to unityat 66166 keV
10 100 1000
Photon energy Eγ (keV)
09
10
11
12
13
14
Puls
e H
eigh
tUni
t Ene
rgy(
arbi
tru
nits
)
Radioactive sourcesSynchrotron radiation
Eγ = 3317 keV
74 Exp Astron (2009) 2447ndash88
60 80 100 120 140 160
Channel
-1
0
1
Res
idua
ls(
)
10
15
20
25
30
35
Ene
rgy
(keV
)
NaI Detector(FM 04)10-33 keV
Radioactive sourcesSynchrotron radiationQuadratic fit
0 1000 2000 3000
Channel
-1
0
1
Res
idua
ls(
)
200
400
600
800
Ene
rgy
(keV
)
NaI Detector(FM 04) 34-900keV
Radioactive sourcesSynchrotron radiationEmpirical fit
a b
Fig 18 Channel-energy relation calculated below (left panel) and above (right panel) the K-edgeenergy for detector NaI FM 04 MPE data points (triangles) and PTBBESSY data points (squares)are fitted together with a second degree polynomial below 3317 keV (left panel red curve) andwith the empirical function (see Eq 4) above 3317 keV (right panel blue curve) Residuals tothe fits are given in the panel under the respective plots For the quadratic fit below the K-edgefollowing fit parameters were obtained a = 108 plusmn 005 b = 01495 plusmn 00009 c = (264 plusmn 004) middot10minus4 with a reduced χ 2 of 23 In the case of the empirical fit above the K-edge the fit parametersare a = 947 plusmn 14 b = 273 plusmn 009 c = 02306 plusmn 00008 d = minus262plusmn 04 with a reduced χ 2 of 60
423 Simulation validation
In order to check the accuracy of the obtained channel-energy relation andto validate simulations presented in Section 34 radioactive source spectrawere compared with simulated data Figures 20 and 21 show the 14 previouslyanalysed NaI lines (measured at normal incidence with detector FM 12)6 asa function of energy that is after applying the channel-energy conversionSimulated unbroadened and broadened spectra are overplotted as green andred histograms respectively Sample spectra over the full NaI energy rangecomparing simulation and measurements can be found in [14]
Unbroadened lines represent good guidelines to check the exact position ofthe full-energy and escape peaks A good example is the high-energy doublepeak of 57Co (Fig 20 panel f) where simulations confirm the position of both
6In this case simulations were not based on measurements performed with detector FM 04because at that time detector FM 12 was the first to have a complete set of collected spectra
Exp Astron (2009) 2447ndash88 75
50 100 150 200 250 300
Channel
-1
0
1
Res
idua
ls(
)
10
20
30
40
50
60
70
Ene
rgy
(keV
)
NaI Detector(FM 04)10-60 keVRadioactive sourcesSynchrotron radiationQuadratic fitEmpirical fit
Iodine K-edgeE=3317 keV
xe xq
Channel E
ner
gy
(k
eV)
EK
12
3
Quadratic fit
Empirical fit
Linear relation
Eq(xe)
Ee(xq)
a b
Fig 19 On the left Channel-energy relation around the Iodine K-edge for detector NaI FM04 Data points from radioactive source lines (triangles) and from synchrotron radiation (squares)are fitted together with a quadratic function below the K-edge energy (red curve) and with theempirical function above the K-edge energy (blue curve) Residuals to the fits are given in thepanel under the plot On the right Schematic representation of the channel-energy relation aroundthe Iodine K-edge energy In region 1 for x lt xe the quadratic relation is adopted (red curve) Inregion 3 for x gt xq the empirical function is adopted (blue curve) The ambiguity arises at channelxe (region 2) which could in principle be equally described by both relations ie we could assignto it either an energy Eq(xe) (red circle) or the K-edge energy EK (blue diamond) In order toavoid this ambiguity a linear relation (green curve) has been derived in order to assign an averageenergy value to each channel in region 2 (green triangles)
radioactive lines at 12206 and 13647 keV and the presence of the Iodineescape peak around sim90 keV Still some discrepancies are evident eg atlower energies One likely cause of the discrepancies below 60 keV mostlyresulting in a higher number of counts of the simulated data compared tothe real data and which is particularly visible for the 57Co line at 1441 keV(Fig 20 panel a) is the uncertainty about the detailed composition of theradioactive source Indeed radioactive isotopes are contained in a small (1mm) sphere of ldquosaltrdquo Simulations including this salt sphere were performedand a factor of 38 difference in the perceived 1441 keV line strength wasfound The true answer lies somewhere between this and the simulation withno source material as salt and radioactive isotope are mixed For the generalcalibration simulation a pointsphere of radioactive material not surroundedby salt had been used Another possible explanation could probably be theleakage of secondary electrons from the surface of the detector leading toa less-absorbed energy Further discrepancies at higher energies which arevisible eg in panels d and e of Fig 21 are smaller than 1
76 Exp Astron (2009) 2447ndash88
8 10 12 14 16 18 20
Energy (keV)
00
05
10
15(C
ount
sH
our)
x 1
03
NaI57Co(1441 keV)
(a)
15 20 25 30 35
Energy (keV)
0
5
10
15
20
25
(Cou
nts
Hou
r) x
103
NaI109Cd(b)(221 amp
250 keV)
20 25 30 35 40 45Energy (keV)
0
5
10
15
20
25
30
(Cou
nts
Hou
r) x
103
NaI137Cs(3206 amp 366 keV)
(c)
40 50 60 70Energy (keV)
0
20
40
60(C
ount
sH
our)
x 1
03
NaI241Am(594 keV)
(d)
60 80 100Energy (keV)
00
01
02
03
04
05
06
(Cou
nts
Hou
r) x
103
NaI109Cd(8803 keV)
(e)
60 80 100 120 140 160 180Energy (keV)
0
2
4
6
(Cou
nts
Hou
r) x
103
NaI57Co(f)(12206 amp
13647 keV)
Fig 20 Comparison between spectra collected with NaI FM 12 after channel-energy conversionand simulated spectra for 6 radioactive source lines Here line fits and various componentspreviously described in Figs 13 and 14 are shown as solid and dashed grey curves respectivelySimulated broadened spectra are overplotted in red Unbroadened spectra (green histograms) canbe considered as guidelines for the exact energy positions of lines and secondary escape peaks(see text) The height of the unbroadened peaks is truncated in most plots to better show thecomparison between real and broadened spectra (andashf)
Exp Astron (2009) 2447ndash88 77
220 240 260 280 300 320 340
Energy (keV)
00
05
10
15
20
25
30(C
ount
sH
our)
x 1
03
NaI203Hg(2792 keV)
(a)
400 450 500 550 600
Energy (keV)
0
1
2
3
(Cou
nts
Hou
r) x
103
NaI22Na(511 keV)
(b)
550 600 650 700 750
Energy (keV)
0
1
2
3
(Cou
nts
Hou
r) x
103
NaI137Cs(66166 keV)
(c)
700 800 900
Energy (keV)
000
005
010
015
(Cou
nts
Hou
r) x
103
NaI54Mn(83484 keV)
(d)
750 800 850 900 950
Energy (keV)
000
005
010
015
020
025
(Cou
nts
Hou
r) x
103
NaI88Y(89804 keV)
(e)
Fig 21 Comparison between spectra collected with NaI FM 12 after channel-energy conversionand simulated spectra for 5 radioactive source lines Here line fits and various componentspreviously described in Figs 13 and 14 are shown as solid and dashed grey curves respectivelySimulated broadened spectra are overplotted in red Unbroadened spectra (green histograms) canbe considered as guidelines for the exact energy positions of lines and secondary escape peaks(see text) The height of the unbroadened peaks is truncated in most plots to better show thecomparison between real and broadened spectra (andashe)
78 Exp Astron (2009) 2447ndash88
424 BGO response
The determination of a channel-energy relation for the BGO detectors re-quired the additional analysis of the high-energy data taken with the EQMmodule at SLAC to cover the energy domain between 5 MeV and 20 MeV Inorder to combine the radioactive source measurements made with the BGOFMs at MPE and the proton beam induced radiation measurements made withthe BGO EQM at SLAC (see Section 33) it was necessary to take into accountthe different gain settings by application of a scaling factor The scaling factorwas derived by comparing 22Na and AmBe measurements (at 511 1274 and4430 keV) which were done at both sites Due to the very low statistics inthe measurements from the high-energy reaction of the Van-de-Graaf beamon the LiF target (Eq 2) first and second electron escape peaks from pairannihilation of the 146 MeV line could not be considered in this analysis (seealso Fig 16 panel f) They were mainly used as background reference pointsin order to help finding the exact position of the 175 MeV line In this waya dataset of 23 detected lines was available for determining the BGO EQMchannel-energy relation
For the BGO flight modules analysis (FM 01 and FM 02) a smaller linesample between 125 keV and 44 MeV was adopted still leading to similarresults Differences are due to different gains caused by the setup constraintswhich are described in more detail in Section 43 Similarly to the NaI analysisBGO datasets were fitted with an empirical function (Eq 4) Figure 22
Fig 22 BGO channel-energy relation andcorresponding residualscalculated for EQM detectorapplying the empirical fit(blue curve) of Eq 4 over thefull energy domain between02 and 20 MeV Data takenat MPE and at SLAC aremarked with triangles andsquares respectively Fitparameters for this fit area = minus428 plusmn 23 b = minus54 plusmn 3c = 829 plusmn 006 and d = 167 plusmn11 with a reduced χ 2 of 7
0 500 1000 1500 2000 2500
Channel
-5
0
5
Res
idua
ls (
)
0
5
10
15
20
Ene
rgy
(MeV
)
BGO Detector(EQM)02-20 MeV
Radioactive sources
Van-de-Graaff (pγ)-reactionEmpirical fit
Exp Astron (2009) 2447ndash88 79
shows the BGO EQM channel-energy relation between 02 and 20 MeV Fitparameters are given in the caption In this case fit residuals are smallerthan 4
43 Energy resolution
The energy resolution R of a detector is conventionally defined as the fullwidth at half maximum (w) of the differential pulse height distribution dividedby the location of the peak centroid H0 [22] This quantity mainly reflects thestatistical fluctuations recorded from pulse to pulse In the case of an approx-imately linear response the average pulse amplitude is given by H0 = K Nwhere K is a proportionality constant and the limiting resolution of a detectorcan be calculated as
R equiv w
H0= 235 K
radicN
K N= 235radic
N(5)
where N represents the average number of charge carriers (in our case itrepresents the number of photoelectrons emitted from the PMT photocath-ode) and the standard deviation of the peak in the pulse height spectrumis given by σ = K
radicN However in real detectors the resolution is not only
determined by photoelectron statistics but can be affected by other effectssuch as (1) local fluctuations in the scintillation efficiency (2) nonuniform lightcollection (3) variance of the photoelectron collection over the photocathode(4) contribution from the nonlinearity of the NaI scintillation response (5)contributions from PMT gain drifts and (6) temperature drift (eg see [22])In order to take all these effects into account a nonlinear dependence of theenergy resolution was assumed
w =radic
a 2 + b 2 E + c 2 E 2 (6)
This formula is mainly based on traditional physical understanding of scin-tillation detectors and produces a physically motivated behavior outside therange of measurements It consists of (1) a constant term a which describeslimiting electronic resolution (typically not a noticeable effect in scintillators)(2) a term proportional to the square root of the energy explaining statisticalfluctuations in the numbers of scintillation photons and photo electrons and(3) a term proportional to the energy which accounts for the non-idealldquotransfer efficiencyrdquo of transporting scintillation photons from their creationsites to the PMT photocathode For the actual fits the first parameter a wasset to zero since no significant electronic broadening was observed Spatialnon-uniformity of the energy resolution will be discussed in Section 45
In order to fit the energy resolution it was necessary to convert themeasured widths (in channels) to energies in keV by applying to each detectorthe corresponding channel-energy relation previously obtained Fit results fordetector NaI FM 04 and for the three BGO detectors (EQM FM 01 and FM
80 Exp Astron (2009) 2447ndash88
0 200 400 600 800
Energy (keV)
-100
10
Res
idua
ls(
)
0
10
20
30
R (
)
0 5 10 15
Energy (MeV)
-200
20
Res
idua
ls(
)
0
10
20
30
R (
)
EQMFM01FM02
a b
Fig 23 Energy resolution R in percentage calculated for detector NaI FM 04 (left panel) and forall BGO detectors (right panel) ie BGO EQM (blue curve) BGO FM 01 (red curve) and BGOFM 02 (yellow curve) Residuals to Eq 6 are given in the panel under the plot NaI FM 04 fitparameters to Eq 6 are b = 0916 plusmn 0014 and c = 00994 plusmn 00010 with a reduced χ 2 of 5 Inthe case of the BGO detectors the fit parameters for EQM are b = 354 plusmn 005 and c = 00506 plusmn00013 with a reduced χ 2 of 22 for FM 01 b = 309 plusmn 003 and c = 0027 plusmn 0003 with a reducedχ 2 of 13 for FM 02 b = 3050 plusmn 0021 and c = 00361 plusmn 00012 with a reduced χ 2 of 24
02) are displayed in Fig 23 In the case of NaI (left panel) we noticed thatsimilar results could also be obtained by excluding those calibration lines whichare affected by greater uncertainties of w namely the 144 keV line from 57Coand all secondary lines ie the 25 keV line from 109Cd the 366 keV from 137Csand the 1366 keV line from 57Co As regards the BGO energy resolution (rightpanel) EQM results (blue triangles) show poorer energy resolution comparedto FM 01 (red squares) and FM 02 (yellow dots) which could be explained by
Fig 24 FWHM (in keV) asa function of Energy for the12 NaI FM detectors (bluesquares) and for the twoBGO FM detectors (greentriangles) For both detectortypes the standard fit to Eq 6is plotted
10 100 1000 10000
Energy (keV)
1
10
100
1000
FWH
M (
keV
)
NaI FM 01-13
BGO FM 01-02
Exp Astron (2009) 2447ndash88 81
Fig 25 On-axis effective areaof the 12 NaI FM detectorsand of the two BGO FMdetectors
10 100 1000
Energy (keV)
10
100
Eff
ectiv
e A
rea
(cm
2 )
NaI FM 01-13
BGO FM 01-02
minor differences in the detector design (optical coupling) Finally a commonplot of all NaI and BGO flight module detectors is shown in Fig 24
44 Full-energy peak effective area and angular response
The full-energy peak effective area in cm2 for both NaI and BGO detectorswas computed as
A Ef f = Aa c middot P T
middot 4 π d 2s (7)
where (1) A = Line area (counts) (2) a c = Current source activity (1s) (3)P T = Line transition probability (4) d s X = Distance between source anddetector (cm) No additional factor to account for flux attenuation between thesource and the detector was needed since its effect above 20 keV is less than1 The different line-transition probabilities for each radioactive nuclidewhich were applied for this analysis can be found in Table 1 (column 4) Thereference activities were provided in a calibration certificate by the supplierof the radioactive sources7 The radioactive source activities at the day ofmeasurement were calculated by taking into account the time elapsed sincethe calibration reference day The relative measurement uncertainty of thegiven activities for all sources is 3 with the exception of the Mercury source(203Hg) and the Cadmium source (109Cd) which have an uncertainty of 4
Results for the on-axis effective area as a function of the energy for allNaI and BGO FM detectors are shown in Fig 25 The initial drop below 20keV is due to a Silicone rubber layer placed between the NaI crystal and
7Calibrated radioactive sources were delivered by AEA Technology QSA GmbH (BraunschweigGermany) together with a calibration certificate from the Deutscher Kalibrierdienst (DKDCalibration laboratory for measurements of radioactivity Germany)
82 Exp Astron (2009) 2447ndash88
-90 0 90 180 270Source Angle (deg)
0
20
40
60
80
100
120
140
Eff
ectiv
e A
rea
(cm
2 )
137Cs -3289 keV203Hg -2792 keV137Cs -66166 keV
NaI FM 04
-90 0 90 180 270Source Angle (deg)
60
80
100
120
140
Eff
ectiv
e A
rea
(cm
2 )
88Y -89804 keV88Y -183606 keV
BGO EQMa b
Fig 26 Off-axis effective area as a function of the irradiation angle (from ndash90 to 270) for NaIFM 04 (left panel) and BGO EQM (right panel) Different curves represent different line-energiesIn the case of NaI results for three radioactive lines are shown namely 3206 keV from 137Cs (topgreen curve) 2792 keV from 203Hg (middle red curve) and 66166 keV from 137Cs (bottom yellowcurve) For BGO two lines from 88Y are shown 89804 keV (blue curve) and 183606 keV (redcurve)
the entrance window which absorbs low-energy gamma-rays At energieshigher than 300 keV NaI detectors become more transparent to radiationand a decrease in the response is observed The BGO on-axis effective areais constant over the energy range 150 keVndash2 MeV with a mean value of120 plusmn 6 cm 2 Unfortunately the effective area at 44 MeV could not bedetermined since the activity of the AmBe source was not known SLACmeasurements could not be used for this purpose either At 3317 keV theeffect of the Iodine K-edge is clearly visible as a drop This energy region wasextensively investigated during the PTBBESSY calibration campaign and isfurther described in Section 45
For several radioactive sources off-axis measurements of the NaI andBGO response have been performed These are extremely important for theinterpretation of scattered photon flux both from the spacecraft and fromthe atmosphere Figure 26 shows results for the NaI and the BGO effectivearea as a function of the irradiation angle over the full 360 The left panelpresents NaI FM 04 measurements from (i) the 3289 keV line8 from 137Cs (topgreen curve) (ii) the 2792 keV line from 203Hg (middle red curve) and (iii)the 66166 keV line from 137Cs (bottom yellow curve) Itrsquos worth noting thatall curves especially the middle one trace the detectorrsquos structure (crystalhousing and PMT) Furthermore the bottom curve (66166 keV) varies verylittle with the inclination angle because of the high penetration capability ofgamma-rays at those energies In the case of BGO measurements performedwith 88Y at 89804 and 183606 keV highlight the two drops in the response
8In this case the double line was fitted with a single Gaussian since the response dramaticallydrops above 90 and the fit algorithm is not capable of identifying two separate components
Exp Astron (2009) 2447ndash88 83
due to the presence of the PMTs on both sides of the crystal Although theBGO detectors are symmetrical an asymmetry in the curves is caused by theTitanium bracket on one side of the crystal housing which is necessary formounting the detectors onto the spacecraft (Fig 5 right panel) Comparisonsof the effective area for NaI and BGO with simulations can be found in [14]
45 Quantum detection efficiency (QDE) and spatialuniformity of NaI detectors
As already mentioned in Section 32 the QDE for detector NaI FM 04 couldbe determined through detailed measurements performed at PTBBESSY byfirstly relating the fitted full-energy peak area of the NaI spectrum with thesum of counts detected by the HPGe detector (for which QDE = 1) in thesame region of interest around the full-energy peak (which includes the smallGe escape peak appearing above 11 keV) and subsequently accounting for thedifferent beam fluxes The QDE was determined at all energies by analyzinga spectrum taken in the center of the detectorrsquos surface and at three energies(rasterscans at 10 36 and 60 keV) by analyzing spectra taken over the wholesurface area (see Fig 28 top panels for results obtained at 10 and 60 keV) Theeffective area (in cm 2) can then be calculated as the integral of the QDE overthe detectorrsquos active area (1267 cm 2) Results for 19 lines measured between10 and 60 keV are shown in Fig 27 This Figure can be considered as a zoomat low energies of the NaI effective area in Fig 25
The detectorrsquos spatial homogeneity was investigated at PTBBESSY bymeans of rasterscans of detector NaI FM 04 at three distinct energies namely10 36 and 60 keV During each rasterscan sim 700 runs per detector wererecorded with a spacing of 5 mm and for each one the full-energy peak wasanalysed as previously described in Section 411 For the rastercsan at 10 keV
Fig 27 NaI FM 04 effectivearea calculated from QDEdetermination ofPTBBESSY data collectedbetween 10 and 60 keV Arelative uncertainty of 5has been estimated
10 20 30 40 50 60
Energy (keV)
0
20
40
60
80
100
120
140
Phot
opea
k E
ffec
tive
Are
a (c
m2 )
Iodine K edge
E=3317 keV
84 Exp Astron (2009) 2447ndash88
the dependence of line-center (in channel ) and line resolution (in ) on therasterscan position in mm (DET_X and DET_Y) is shown in Fig 28 bottompanels Results for the line area are not further shown since the QDE plotspreviously discussed in Fig 28 top panels already reflect the surface behaviorfor this parameter)
From the line center spatial dependence one can notice that some bordereffects appear toward the edge of the NaI crystal shifting the full-energy peakto lower channel numbers ie energies This effect is of the order of 12 at
50 100 150DET X (mm)
900
950
DE
T Y
(m
m)
50 100 150DET X (mm)
900
950D
ET
Y (
mm
)
50 100 150
DET X (mm)
900
950
DE
T Y
(m
m)
50 100 150
DET X (mm)
900
950
DE
T Y
(m
m)
a b
c d
QDE
008 010 012 014 016
QDE
087 089 091 093 095
Line center (channel )
42 43 43 44 45 46 47
Line resolution ()
24 25 26 27 28 29 30
Fig 28 Contour plots showing results for the PTBBESSY rasterscans of detector NaI FM04 Atthe top QDE calculated over the active area (126 cm 2) at 10 and 60 keV (left and right panelrespectively) At the bottom Calculated fit parameters of the full-energy peak as a function of thebeam position (in mm) for the 10 keV rasterscan (1) line-center (in channel left panel) (2) lineresolution (in right panel) The color code is indicated in the colorbars above each plot
Exp Astron (2009) 2447ndash88 85
10 and 60 keV and of 7 at 36 keV The line resolution is homogeneous overthe whole detectorrsquos area with a mean value of 25 15 and 10 at 10 36and 60 keV respectively While the first two resolutions are comparable tothe results obtained with radioactive sources at 144 and 366 keV the 60 keVrasterscan gives an improved resolution when compared to the result of 15obtained with the 241Am source at 594 keV (see Fig 13 panel f )
5 Conclusions
After the successful launch of the Fermi mission and the proper activationof its instruments the 14 GBM detectors started to collect scientific data Thespectral overlap of the two BGO detectors (02 to 40 MeV) with the LAT lowerlimit of sim 20 MeV opens a promising epoch of investigation of the high-energyprompt and afterglow GRB emission in the yet poorly explored MeV-GeVenergy region
On ground the angular and energy response of each GBM detector wascalibrated using various radioactive sources between 144 keV and 44 MeVThe channel-energy relations energy resolutions on- and off-axis effectiveareas of the single detectors were determined Additional calibration mea-surements were performed for NaI detectors at PTBBESSY below 60 keVand for BGO detectors at SLAC above 5 MeV thus covering the whole GBMenergy domain As already mentioned in the introduction further calibrationmeasurements at system level and after integration onto the spacecraft werecarried out (see Table 4) All those measurements crucially contribute to thevalidation of Monte Carlo simulations of the direct GBM detector responseThese incorporate detailed models of the Fermi observatory including theGBM detectors instruments and all in-flight spacecraft components plus thescattering of gamma-rays from a burst in the spacecraft and in the Earthrsquosatmosphere [14] The response as a function of photon energy and directionis finally captured in a Direct Response Matrix (DRM) database allowing thedetermination of the true gamma-ray spectrum from the measured data
The results reported in this paper directly contribute to the DRM finaldetermination and they fully follow physical expectations [18] Measurementsand fit results for two sample detectors (NaI FM 04 and BGO FM 02) aregiven in Tables 5 and 6 respectively (see Appendix) Fit parameters for theenergy-channel relations and energy resolutions of those detectors are alwaysreported in the captions of the corresponding plots (see Figs 18 22 and 23) Itis worth noting that these parameters reflect the characteristics of all other NaIand BGO detectors not reported in this paper thus showing that all detectorsbehave the same within statistics
The channel-energy relation parameters obtained throughout this analysisare not directly used for in-flight calculations because of the different elec-tronic setup which was used during detector level calibration and in-flight (seeSection 31) The same analysis method described in Section 411 and the samefitting procedures of Section 42 were adopted to analyze data collected during
86 Exp Astron (2009) 2447ndash88
system level calibration These results confirm that the systematic uncertaintiesin the channel-energy conversions arise from the discussed sources ie fittingprocedure limited statistics in the case of high-energy lines of BGOs elec-tronics and non-uniform responses of detectors and are fully consistent withmeasurements presented in this paper
The GBM detectors will play an important role in the GRB field in thenext decade The unprecedented synergy between the GBM and the LATwill allow to observe burst spectra covering sim 7 decades in energy Moreoversimultaneous observations by the large number of gamma-ray burst detectorsoperating in the Fermi era will complement each other A nice overviewof the currently operating space missions can be found in Table 1 of [3]Here instrument characteristics such as FOVs effective areas localizationuncertainties and energy bands are compared The GBM detectors fit in thisoverall picture by providing a higher trigger energy range (50ndash300-keV) thaneg Swift-BAT [9] (15ndash150 keV) and a spectral coverage up to 40 MeV anenergy limit which can only be investigated with the LAT and the Mini-Calorimeter on-board AGILE [32] New insights into the GRB properties aretherefore expected from GBM thus advancing the study of GRB physics
Open Access This article is distributed under the terms of the Creative Commons AttributionNoncommercial License which permits any noncommercial use distribution and reproduction inany medium provided the original author(s) and source are credited
Appendix
Table 4 List of all calibrated GBM detectors
Detector Calibration campaignThis work In-flight MPE PTBBESSY SLAC
(144 keV minus 44 MeV) (10 minus 60 keV) (44 minus 176 MeV)
NaI EQM minus radic minus minusFM 01 n0
radic radic minusFM 02 n1
radic radic minusFM 03 n2
radic radic minusFM 04 n3
radic radic minusFM 05 n4
radic minus minusFM 07 n6
radic minus minusFM 08 n7
radic minus minusFM 09 n8
radic minus minusFM 10 n9
radic minus minusFM 11 na
radic minus minusFM 12 nb
radic minus minusFM 13 n5
radic minus minusBGO EQM minus radic minus radic
FM 01 b0radic minus minus
FM 02 b1radic minus minus
Columns 2 and 3 indicate the detector numbering schemes adopted during the presented calibra-tion analysis and in-flight respectively A checklist showing which detectors were employed ateach detector-level calibration campaign is given in columns 4 to 6
Exp Astron (2009) 2447ndash88 87
Table 5 Measured and fitted quantities with fit residuals (Res) for 14 lines from radioactivesources collected with detector NaI FM 04
Tabulatedline energy(keV)
Full-energy peak parameters
Center FWHM Eff area
Measured Fitted Res Measured Fitted Res cm 2
(channels) (keV) () (channels) (keV) () ()
1441 783 plusmn 08 1439 015 188 plusmn 14 4 26 minus4 46 plusmn 4221 11635 plusmn 019 2204 029 217 plusmn 05 5 21 minus5 98 plusmn 425 1304 plusmn 05 2505 minus020 225 plusmn 13 5 21 minus6 95 plusmn 43206 16172 plusmn 022 3214 minus026 259 plusmn 05 6 19 5 114 plusmn 4366 1791 plusmn 06 minus minus 286 plusmn 17 7 18 minus11 85 plusmn 3594 2919 plusmn 03 598 minus06 412 plusmn 06 9 15 minus18 101 plusmn 48803 4128 plusmn 06 874 08 564 plusmn 16 12 14 8 122 plusmn 512206 55625 plusmn 023 1215 04 655 plusmn 05 16 13 04 111 plusmn 413647 6151 plusmn 08 minus minus 670 plusmn 22 17 13 minus6 109 plusmn 42792 1195 plusmn 6 27860 021 144 plusmn 5 32 11 12 520 plusmn 18511 21361 plusmn 05 51223 minus024 2284 plusmn 26 55 11 29 180 plusmn 0766166 2732 plusmn 9 65976 029 274 plusmn 9 70 10 minus27 121 plusmn 0483484 34133 plusmn 22 8277 09 331 plusmn 6 87 10 minus6 90 plusmn 0389804 36696 plusmn 28 8908 08 367 plusmn 10 93 10 minus25 82 plusmn 04
Table 6 Measured and fitted quantities with fit residuals (Res) for 8 lines from radioactivesources collected with detector BGO FM 02
Tabulatedline energy(keV)
Full-energy peak parameters
Center FWHM Eff area
Measured Fitted Res Measured Fitted Res cm 2
(channels) (keV) () (channels) (keV) () ()
12459 4768 plusmn 003 12459 0002 142 plusmn 05 5196 1861 07 107 plusmn 32792 9013 plusmn 019 27927 minus0023 1946 plusmn 029 7136 1397 08 122 plusmn 7511 15287 plusmn 006 51082 003 224 plusmn 04 8207 1239 12 121 plusmn 466166 19390 plusmn 008 66266 minus015 252 plusmn 04 9307 1116 012 121 plusmn 483484 24015 plusmn 012 83388 012 2637 plusmn 014 9695 1080 07 119 plusmn 489804 25740 plusmn 006 89773 003 312 plusmn 03 11823 927 minus25 118 plusmn 4127454 35942 plusmn 010 127518 minus005 387 plusmn 05 14650 798 minus25 112 plusmn 4183606 51119 plusmn 012 183592 0008 711 plusmn 07 25830 583 10 101 plusmn 3
References
1 Agostinelli S et al Geant4 minus a simulation toolkit Nucl Instrum Methods A 506 250 (2003)2 Atwood WB Gamma Large Area Silicon Telescope (GLAST) applying silicon strip detec-
tor technology to the detection of gamma rays in space Nucl Instrum Methods A 342 302(1994)
3 Band DL The synergy of gamma-ray burst detectors in the GLAST era AIPC 1000 121(2008)
4 Thomson A Vaughan D (eds) X-ray data booklet Lawrence Berkeley National Labora-tory Berkeley CA httpxdblblgov (2001) Accessed 3 December 2008
5 Dermer CD Boumlttcher M Chiang J Spectral energy distributions of gamma-ray burstsenergized by external shocks ApJ 513 656 (1999)
6 Dingus BL Observations of the highest energy gamma-rays from gamma-ray Bursts AIPC558 383 (2001)
7 Engelkeimer D Nonlinear response of NaI(Tl) to photons Rev Sci Instrum 27 589 (1956)
88 Exp Astron (2009) 2447ndash88
8 GBM Proposal vol I Science Investigation and Technical Description httpgammaraymsfc nasagovgbmpublicationsproposal (1999) Accessed 3 December 2008
9 Gehrels N et al The swift gamma-ray Burst Mission Ap J 611 1005ndash1020 (2004)10 Giuliani A et al AGILE detection of delayed gamma-ray emission from GRB 080514B
AampA 491 25 (2008)11 GLAST Science Brochure Exploring Naturersquos Highest Energy Processes with the Gamma-
Ray Large Area Space Telescope Document ID 20010070290 Report Number NAS 1839-107-GSFC NASANP-2000-9-107-GSFC (2001) Accessed 3 December 2008
12 Gonzalez MM et al A γ -ray burst with a high-energy spectral component inconsistent withthe synchrotron shock model Nature 424 751 (2003)
13 Goumlrner W et al BAMline the first hard X-ray beamline at BESSY II Nucl InstrumMethods A 467ndash468 703ndash706 (2001)
14 Hoover AS et al GLAST burst monitor instrument simulation and modeling AIPC 1000565 (2008)
15 Hurley K et al Detection of a γ -ray burst of very long duration and very high-energy Nature372 652 (1994)
16 Iredale P The non-proportional response of NaI(Tl) crystals to γ -rays Nucl Instr Meth 11336 (1961)
17 Kaneko Y et al Broadband spectral properties of bright high-energy gamma-ray burstsobserved with BATSE and EGRET ApJ 677 1168 (2008)
18 von Kienlin A et al The GLAST burst monitor SPIE 5488 763 (2004)19 von Kienlin A et al High-energy calibration of a BGO detector of the GLAST burst
monitor AIPC 921 576ndash577 (2007)20 Kippen RM The GEANT low-energy Compton scattering (GLECS) package for use in
simulating advanced Compton telescopes New Astron Rev 48 221 (2004)21 Kippen RM et al Instrument response modeling and simulation for the GLAST burst
monitor AIPC 921 590 (2007)22 Knoll GF Radiation Detection and Measurement 3rd edn Wiley New York (1989)23 Krumrey M Gerlach M Scholze F Ulma G Calibration and characterization of semi-
conductor X-ray detectors with synchrotron radiation Nucl Instrum Methods A 568 364ndash368(2006)
24 Meegan CA et al The GLAST burst monitor AIPC 921 13 (2007)25 Meacuteszaacuteros P Rees MJ Papathanassiou H Spectral properties of blast-wave models of
gamma-ray burst sources ApJ 432 181 (1994)26 Michelson P et al GLAST a detector for high-energy gamma rays Proc SPIE 2806 31
(1996)27 Moszynskynski M et al Intrinsic energy resolution of NaI(Tl) Nucl Instr Nucl Instrum
Methods Phys Rev A 484 259 (2002)28 Prescott JR Narayan GH Electron response and intrinsic line-widths in NaI(Tl) Nucl
Instrum Methods 75 51 (1969)29 Riesemeier H et al Layout and first XRF applications of the BAMline at BESSY II X-Ray
Spectrom 34 160ndash163 (2005)30 Sari R Esin AA On the synchrotron self-compton emission from relativistic shocks and its
implications for gamma-ray burst afterglows ApJ 548 787 (2001)31 Schoumltzig U Schrader H Halbwertszeiten und Photonen-Emissionswahrscheinlichkeiten
von haumlufig verwendeten Radionukliden PTB-Bericht PTB-Ra-165 5th edition (1998)32 Tavani M et al The AGILE mission and its scientific instrument SPIE 6266 2 (2006)33 Thompson DJ et al Calibration of the energetic Gamma-ray experiment telescope
(EGRET) for the compton Gamma-ray observatory ApJS 86 629 (1993)34 Wallace M et al Full spacecraft source modeling and validation for the GLAST burst
monitor AIPC 921 58-59 (2007)35 Waxman E Gamma-Ray-burst afterglow supporting the cosmological fireball model
constraining parameters and making predictions ApJ 485 5 (1997)
- Ground-based calibration and characterization of the Fermi gamma-ray burst monitor detectors
-
- Abstract
-
- Introduction
- The GBM detectors
- Calibration campaigns
-
- Laboratory setup and calibration instrumentation at MPE
- NaI low-energy calibration at PTBBESSY
- BGO high-energy calibration at SLAC
- Simulation of the laboratory and the calibration setup at MPE
-
- Calibration data analysis and results
-
- Processing of calibration runs
-
- Analysis of the full-energy peak
-
- Channel-energy relation
-
- NaI nonlinear response
- The iodine K-edge region
- Simulation validation
- BGO response
-
- Energy resolution
- Full-energy peak effective area and angular response
- Quantum detection efficiency (QDE) and spatial uniformity of NaI detectors
-
- Conclusions
- Appendix
- References
-
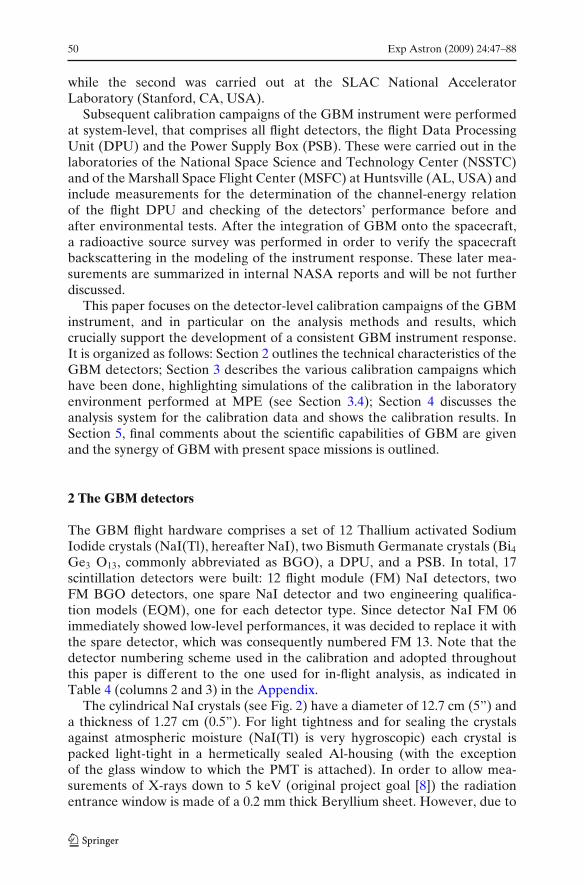
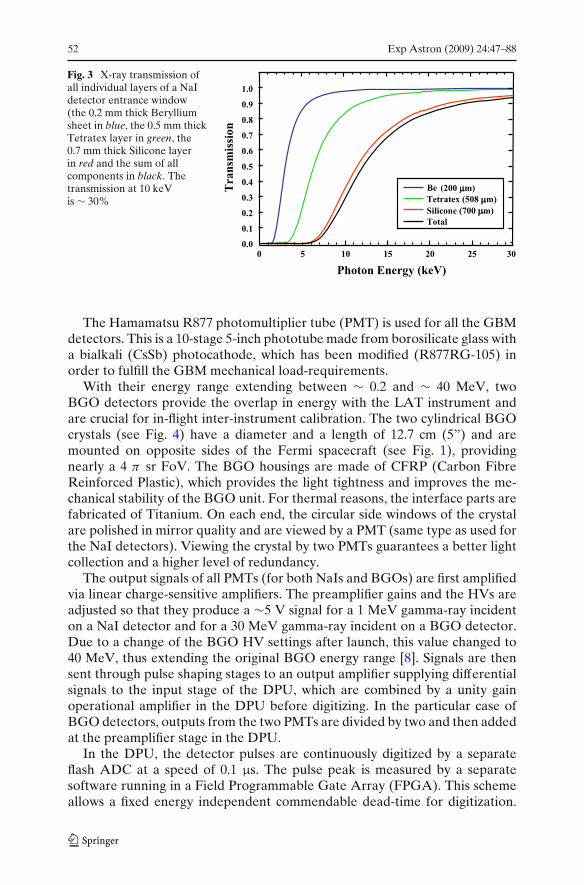
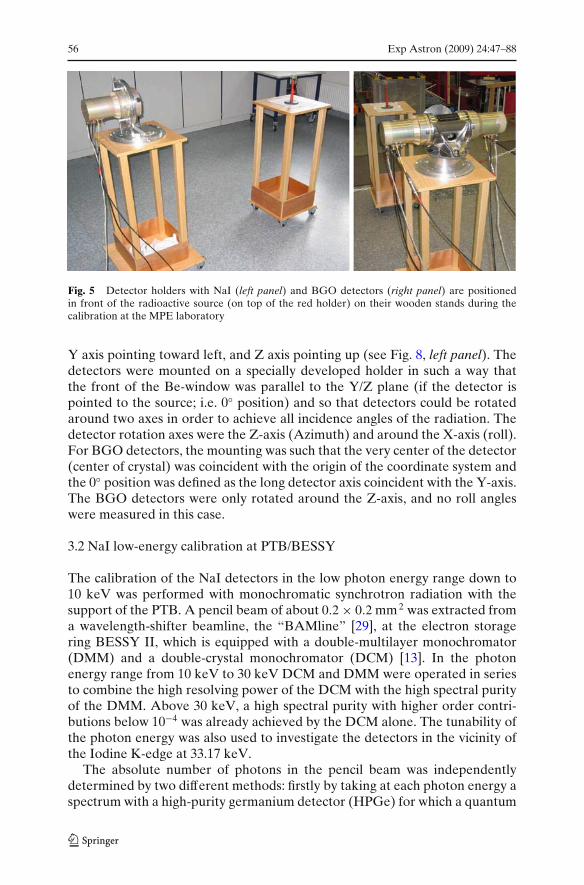
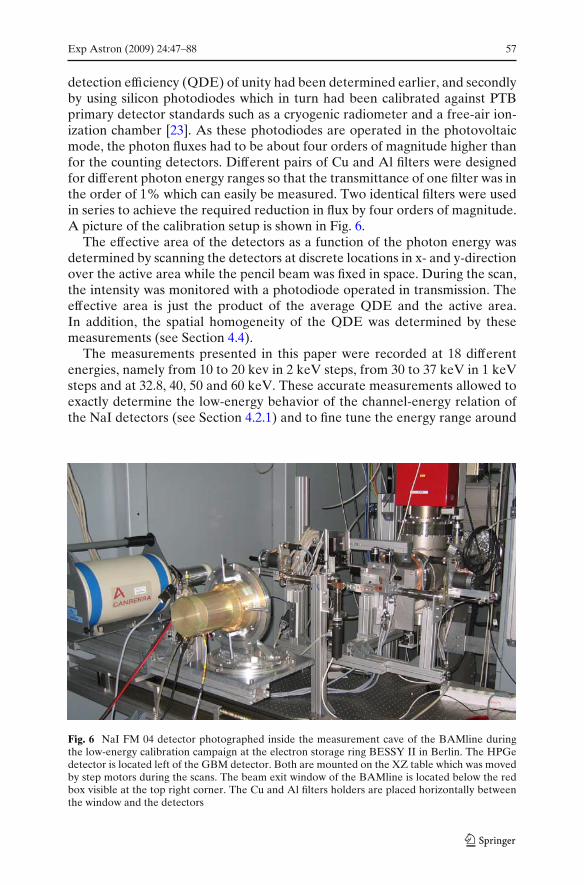
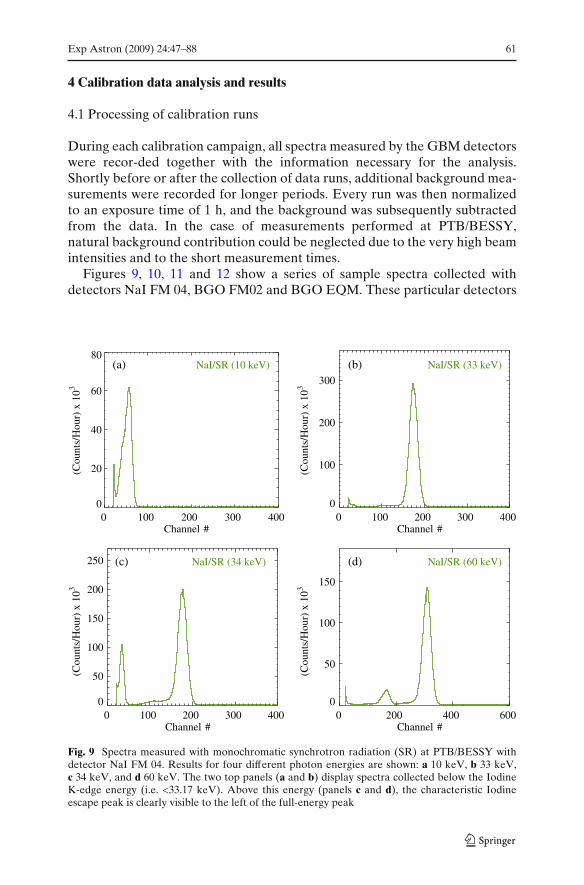
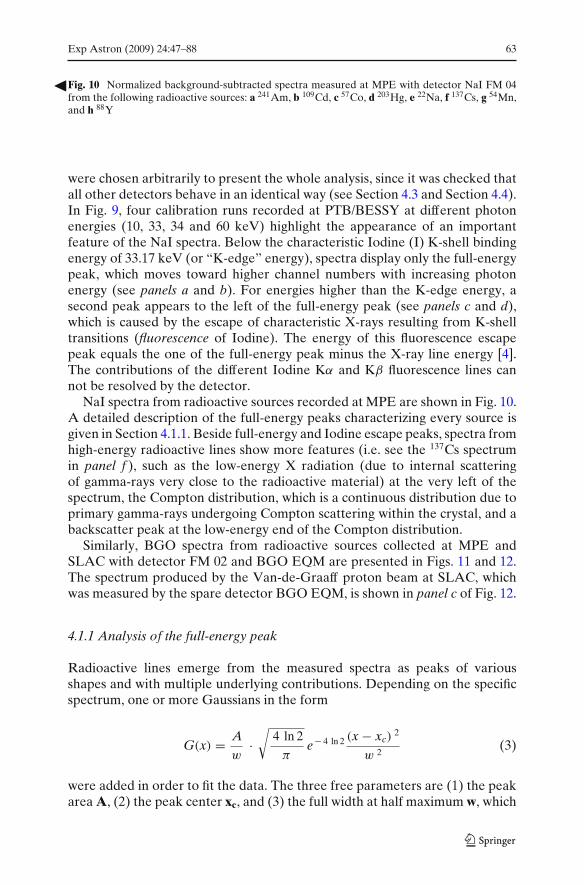
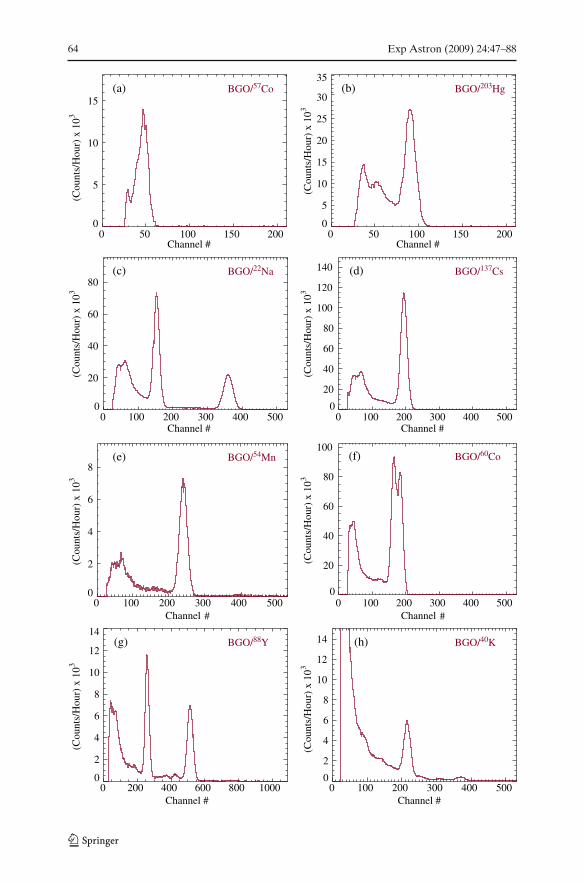
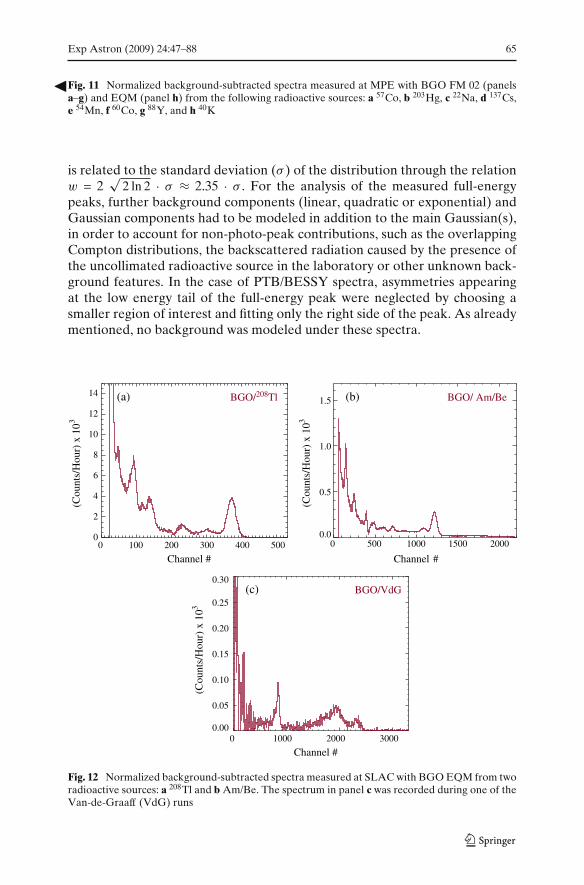
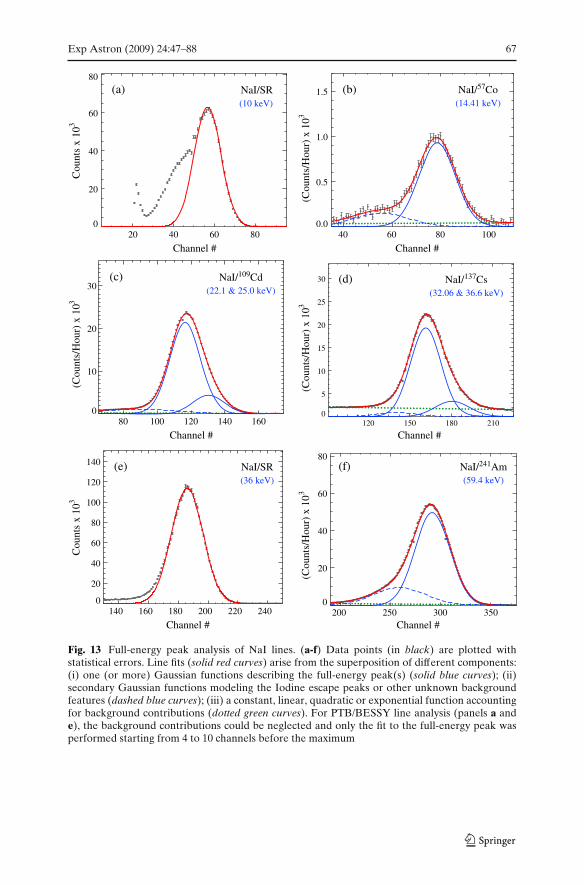
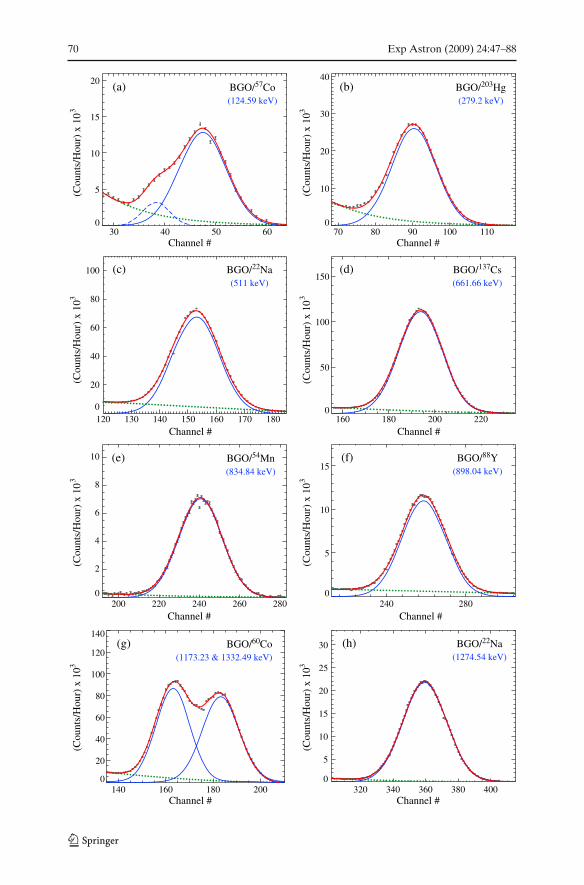
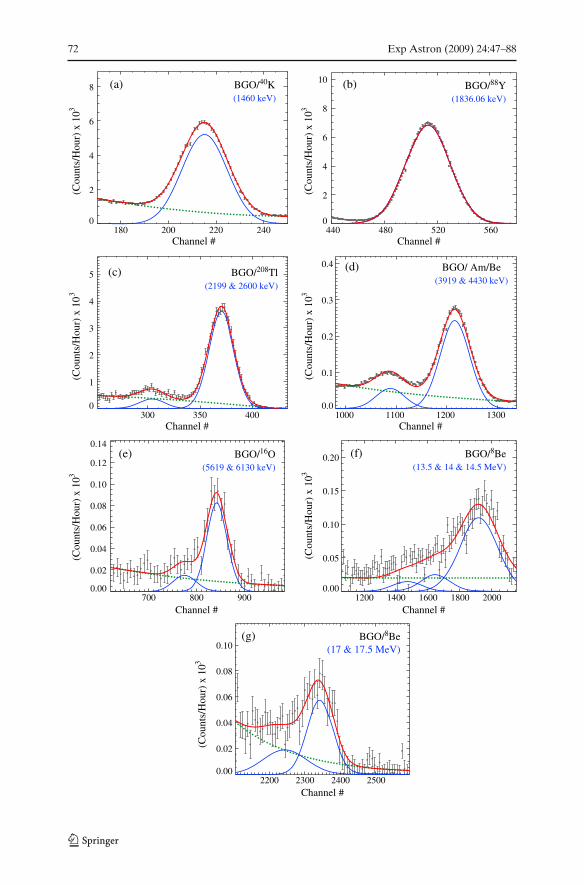
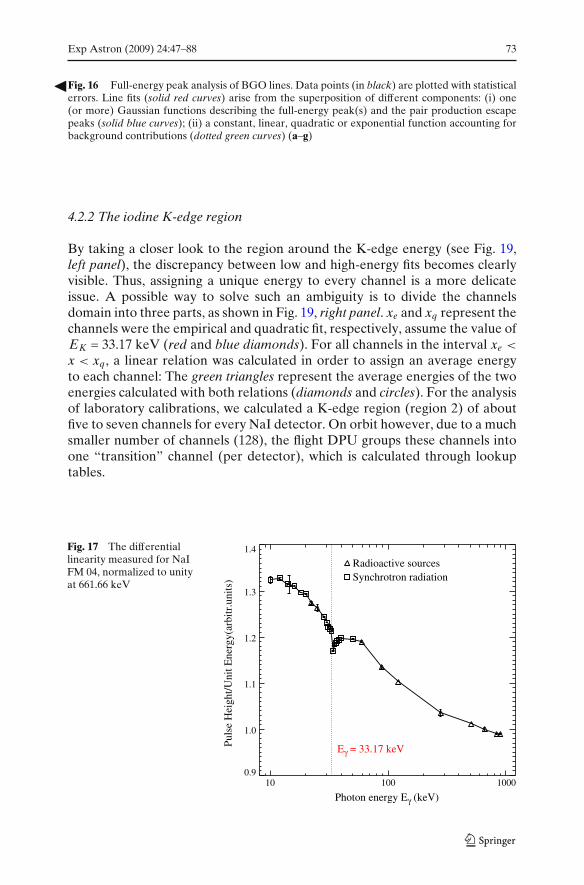
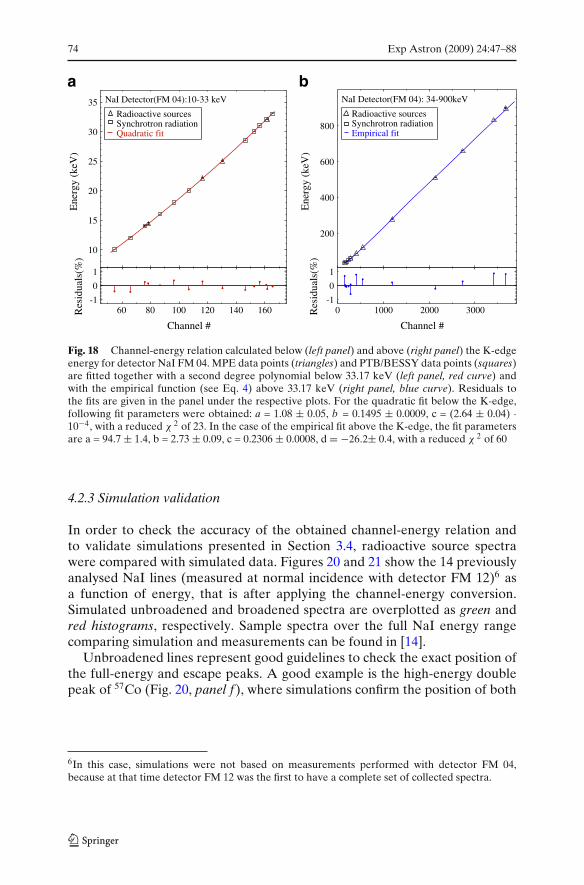
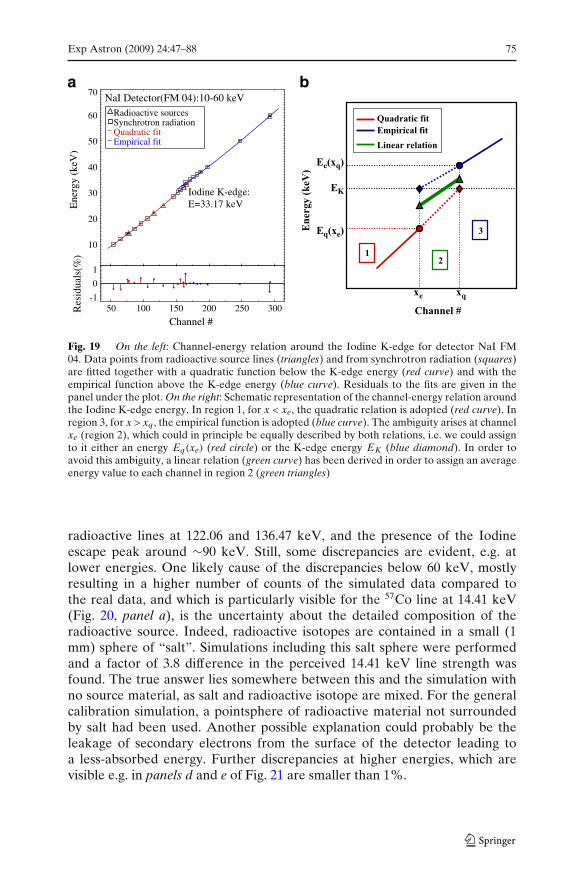
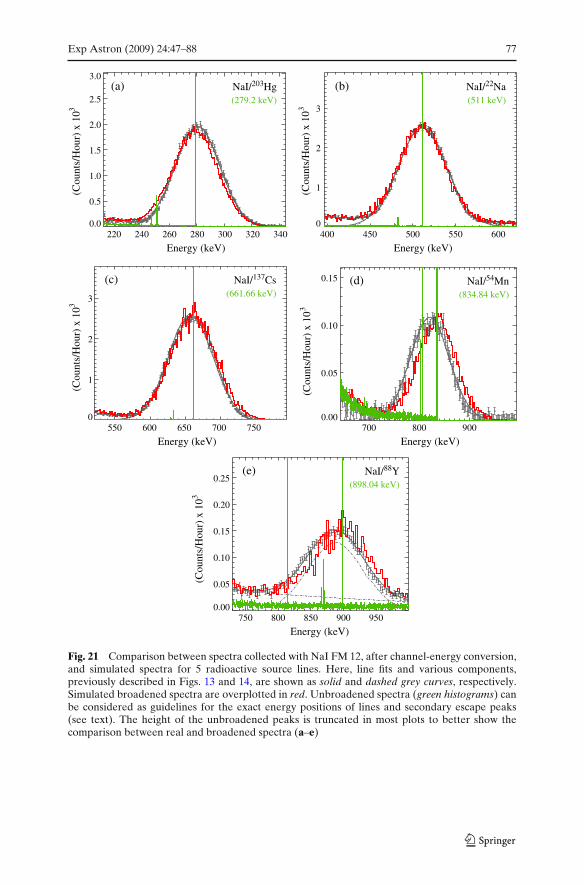
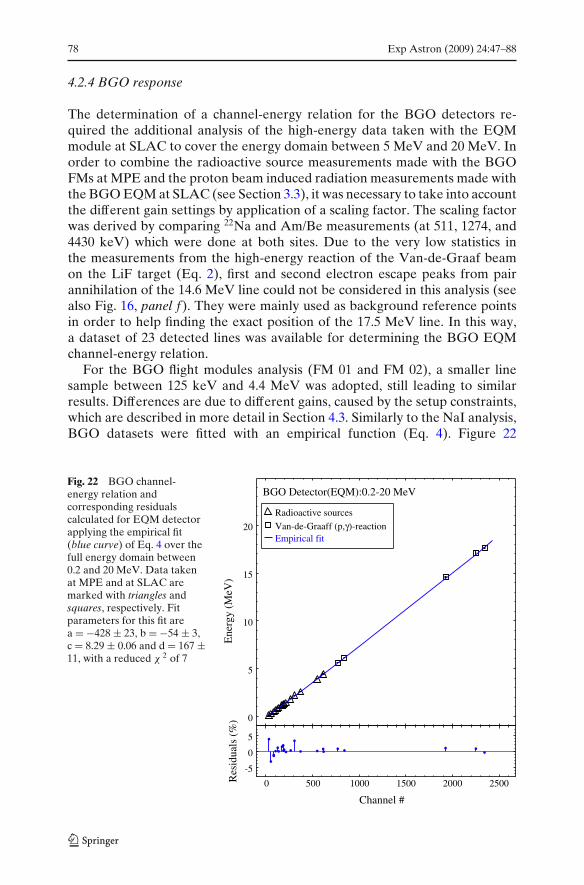
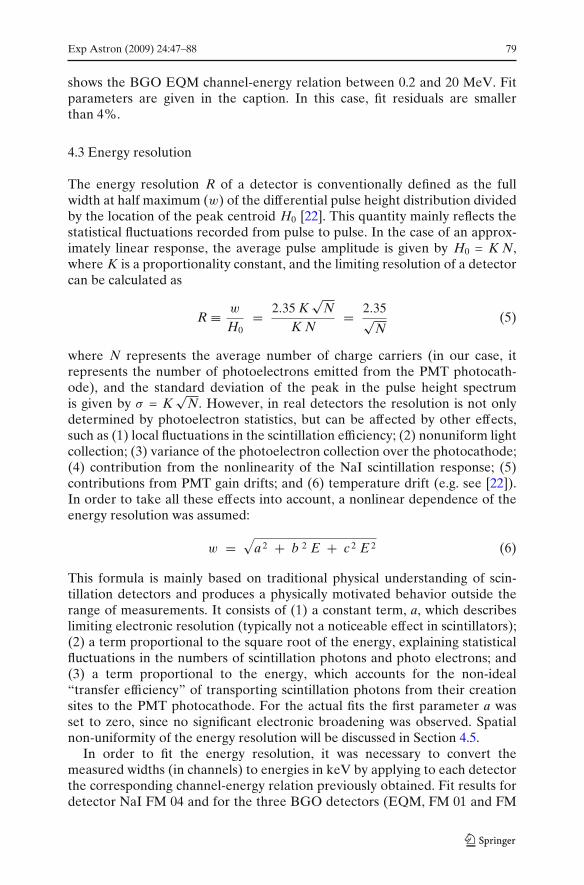
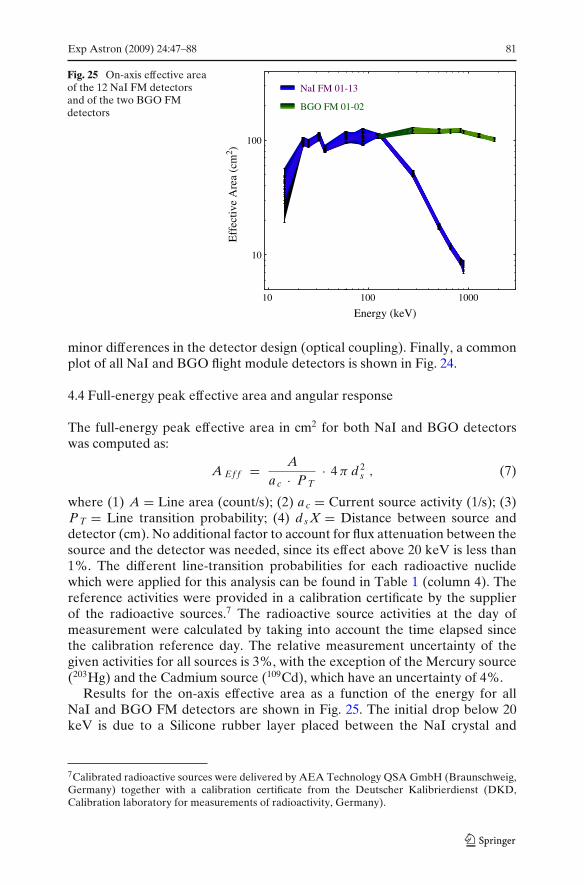
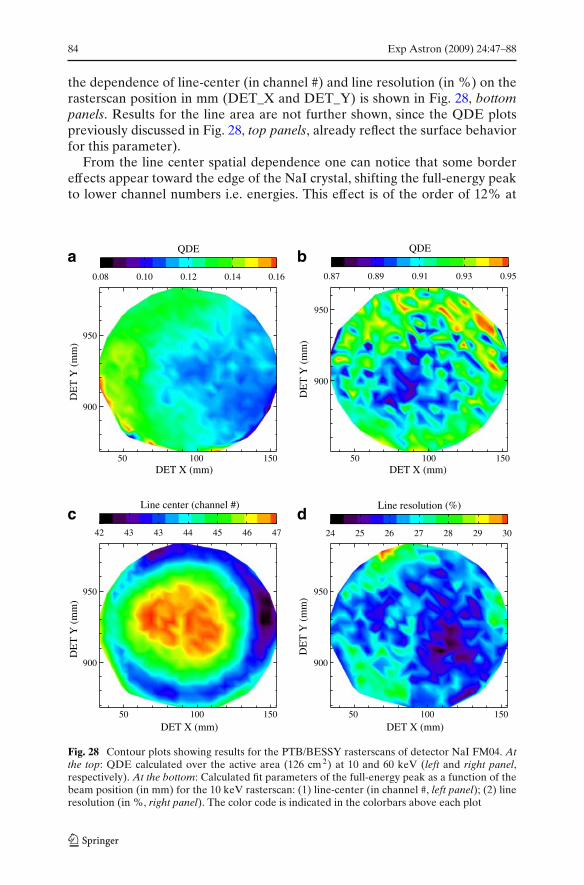
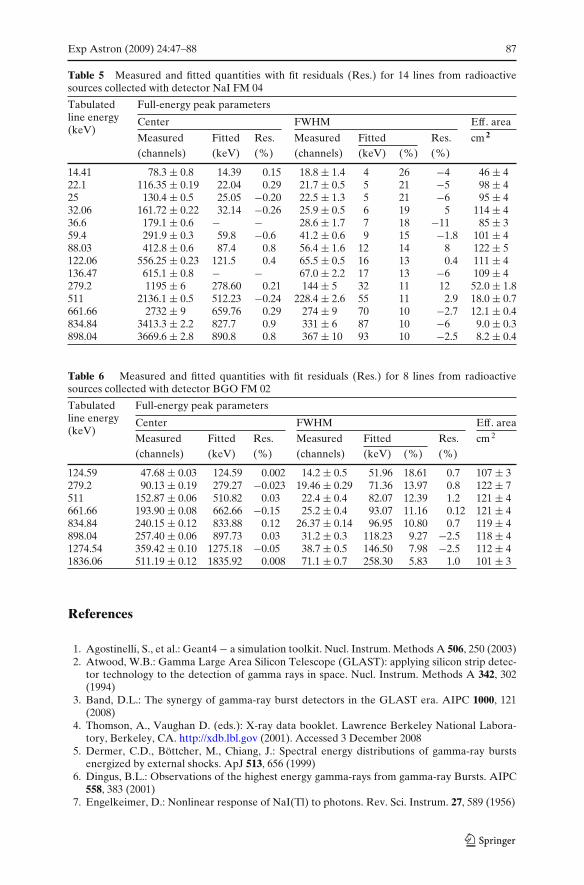