greenfield electronic manufacturing cluster at vikruthamala · pdf file ·...
TRANSCRIPT

June 2017
GREENFIELD ELECTRONIC
MANUFACTURING CLUSTER
AT VIKRUTHAMALA (V), YERPEDU (M),
CHITTOOR (D), AP
Environment Appraisal Questionnaire (EAQ)
ANDHRA PRADESH INDUSTRIAL INFRASTRUCTURE
CORPORATION LIMITED
Submitted By
L&T Infrastructure Engineering Limited
Environmental Appraisal Questionnaire (EAQ) for Greenfield Electronic Manufacturing Cluster
Table of Contents Page i
TABLE OF CONTENTS Environmental Appraisal Questionnaire for New Industrial Estates (IE)
LIST OF ANNEXURES Annexure A Land Purchase Agreement ...................................................................................... A-1
A.1 Land Acquisition .................................................................................................................... A-1
Annexure B Land use/Zoning particulars-relevant portions from the prevailing local Regulations B-1
B.1 Proposed Land use ............................................................................................................... B-1
Annexure C Cost estimates inclusive of land cost .................................................................... C-1
C.1 Project Cost........................................................................................................................... C-1 C.2 Budgetary Estimate for Environmental Management ........................................................... C-1
Annexure D Landscape plans with proposed tree plantation ................................................... D-1
D.1 Greenbelt Development Plan ................................................................................................ D-1 D.1.1 Objectives of Greenbelt Development Plan................................................................ D-1 D.1.2 Greenbelt Areas .......................................................................................................... D-1 D.1.3 Plant Species for Greenbelt Development ................................................................. D-1 D.1.4 Greenbelt Development Plan ..................................................................................... D-2
Annexure E Water Balance Statement......................................................................................... E-1
Annexure F Rainwater Harvesting Plan ...................................................................................... F-1
F.1 Estimation of Rainwater Harvesting Potential ....................................................................... F-1 F.2 Harvesting Plan and Recharge Structures ........................................................................... F-1
F.2.1 Rooftop Rainwater Harvesting .................................................................................... F-1 F.2.2 Storage Ponds/Tanks/ use of Existing nearby Pond .................................................. F-2 F.2.3 Recharge Pits-Typical Arrangements ......................................................................... F-3 F.2.4 Rainwater Harvesting and Utilisation Plan ................................................................. F-5 F.2.5 Monitoring Wells for Impact Assessment ................................................................... F-5
Annexure G Storm water drainage .............................................................................................. G-1
Annexure H Common Effluent Treatment Plant Details with a write up .................................. H-1
H.1 Wastewater Management ..................................................................................................... H-1
Annexure I Statement on the machinery & manpower during construction........................... I-1
Annexure J Fire protection measures & approvals obtained ................................................... J-1
J.1 Fire Protection Facilities ........................................................................................................ J-1
Annexure K Proceedings of Environment Public Hearing also provide response to points raised in the public hearing ............................................................................................................... K-1
K.1 Public Hearing Minutes of Meeting ....................................................................................... K-1 K.2 Public Hearing Advertisement............................................................................................. K-10 K.3 Responses to the Points raised in the Public Hearing ........................................................ K-10
Annexure L Approval of competent authorities in case of conversion of agriculture land, change of land use, DC Rules – Letter form TUDA......................................................................... L-1
Annexure M Construction Schedule ........................................................................................... M-1
M.1 Project Implementation Schedule ........................................................................................ M-1
Annexure N Approvals from special bodies (State Industries Commissioner/SIDC/financial institutions) N-1
N.1 In principle approval letter for EMC from MoC&IT ................................................................ N-1
Annexure O Solid waste collection, treatment, storage, transportation and disposal plan . O-1

Environmental Appraisal Questionnaire (EAQ) for Greenfield Electronic Manufacturing Cluster
Table of Contents Page ii
O.1 Solid Waste Management .................................................................................................... O-1
Annexure P Vehicle Parking and Management .......................................................................... P-1
P.1 Internal Roads ....................................................................................................................... P-1 P.1.1 Internal traffic assessment .......................................................................................... P-1 P.1.2 Parking ........................................................................................................................ P-6

Environmental Appraisal
Questionnaire (EAQ)
Environmental Appraisal Questionnaire (EAQ) for Greenfield Electronic Manufacturing Cluster
Page 1
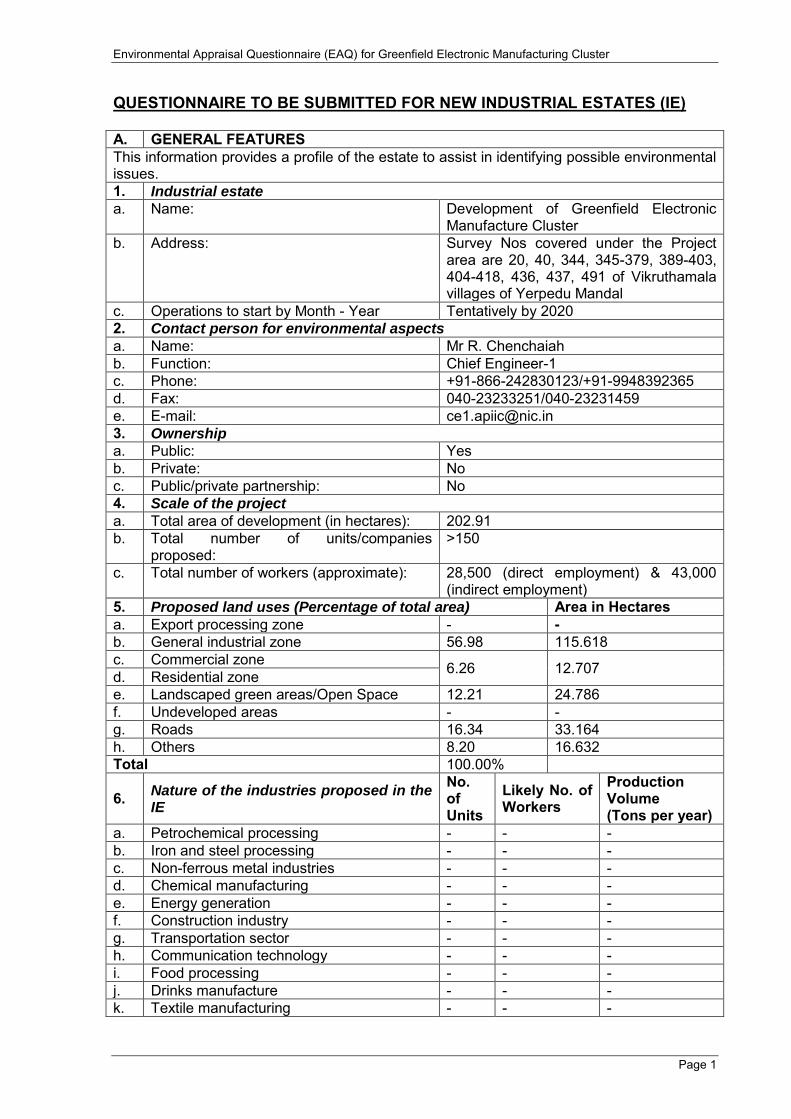
QUESTIONNAIRE TO BE SUBMITTED FOR NEW INDUSTRIAL ESTATES (IE) A. GENERAL FEATURES This information provides a profile of the estate to assist in identifying possible environmental issues. 1. Industrial estate a. Name: Development of Greenfield Electronic
Manufacture Cluster b. Address: Survey Nos covered under the Project
area are 20, 40, 344, 345-379, 389-403, 404-418, 436, 437, 491 of Vikruthamala villages of Yerpedu Mandal
c. Operations to start by Month - Year Tentatively by 2020 2. Contact person for environmental aspects a. Name: Mr R. Chenchaiah b. Function: Chief Engineer-1 c. Phone: +91-866-242830123/+91-9948392365 d. Fax: 040-23233251/040-23231459 e. E-mail: [email protected] 3. Ownership a. Public: Yes b. Private: No c. Public/private partnership: No 4. Scale of the project a. Total area of development (in hectares): 202.91 b. Total number of units/companies
proposed: >150
c. Total number of workers (approximate): 28,500 (direct employment) & 43,000 (indirect employment)
5. Proposed land uses (Percentage of total area) Area in Hectares a. Export processing zone - - b. General industrial zone 56.98 115.618 c. Commercial zone 6.26 12.707 d. Residential zone
e. Landscaped green areas/Open Space 12.21 24.786 f. Undeveloped areas - - g. Roads 16.34 33.164 h. Others 8.20 16.632 Total 100.00%
6. Nature of the industries proposed in the IE
No. of Units
Likely No. of Workers
Production Volume (Tons per year)
a. Petrochemical processing - - - b. Iron and steel processing - - - c. Non-ferrous metal industries - - - d. Chemical manufacturing - - - e. Energy generation - - - f. Construction industry - - - g. Transportation sector - - - h. Communication technology - - - i. Food processing - - - j. Drinks manufacture - - - k. Textile manufacturing - - -
Environmental Appraisal Questionnaire (EAQ) for Greenfield Electronic Manufacturing Cluster
Page 2
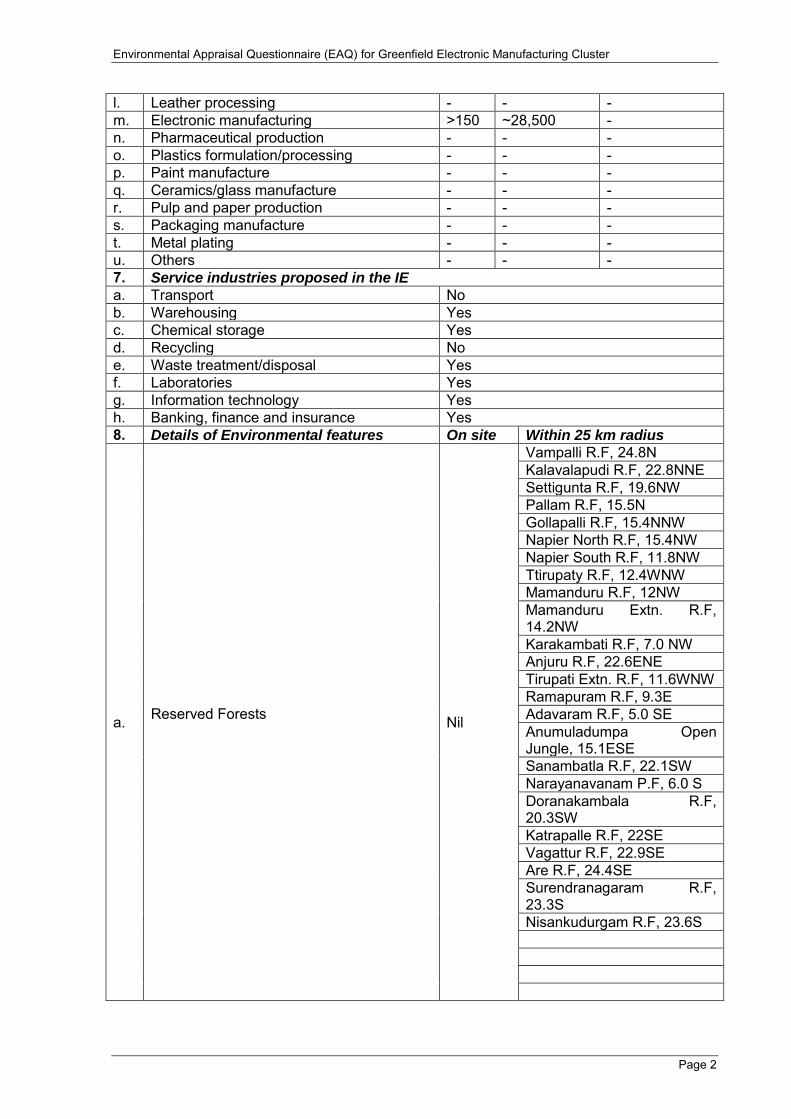
l. Leather processing - - - m. Electronic manufacturing >150 ~28,500 - n. Pharmaceutical production - - - o. Plastics formulation/processing - - - p. Paint manufacture - - - q. Ceramics/glass manufacture - - - r. Pulp and paper production - - - s. Packaging manufacture - - - t. Metal plating - - - u. Others - - - 7. Service industries proposed in the IE a. Transport No b. Warehousing Yes c. Chemical storage Yes d. Recycling No e. Waste treatment/disposal Yes f. Laboratories Yes g. Information technology Yes h. Banking, finance and insurance Yes 8. Details of Environmental features On site Within 25 km radius
a. Reserved Forests Nil
Vampalli R.F, 24.8N Kalavalapudi R.F, 22.8NNE Settigunta R.F, 19.6NW Pallam R.F, 15.5N Gollapalli R.F, 15.4NNW Napier North R.F, 15.4NW Napier South R.F, 11.8NW Ttirupaty R.F, 12.4WNW Mamanduru R.F, 12NW Mamanduru Extn. R.F, 14.2NW Karakambati R.F, 7.0 NW Anjuru R.F, 22.6ENE Tirupati Extn. R.F, 11.6WNW Ramapuram R.F, 9.3E Adavaram R.F, 5.0 SE Anumuladumpa Open Jungle, 15.1ESE Sanambatla R.F, 22.1SW Narayanavanam P.F, 6.0 S Doranakambala R.F, 20.3SW Katrapalle R.F, 22SE Vagattur R.F, 22.9SE Are R.F, 24.4SE Surendranagaram R.F, 23.3S Nisankudurgam R.F, 23.6S
Environmental Appraisal Questionnaire (EAQ) for Greenfield Electronic Manufacturing Cluster
Page 3
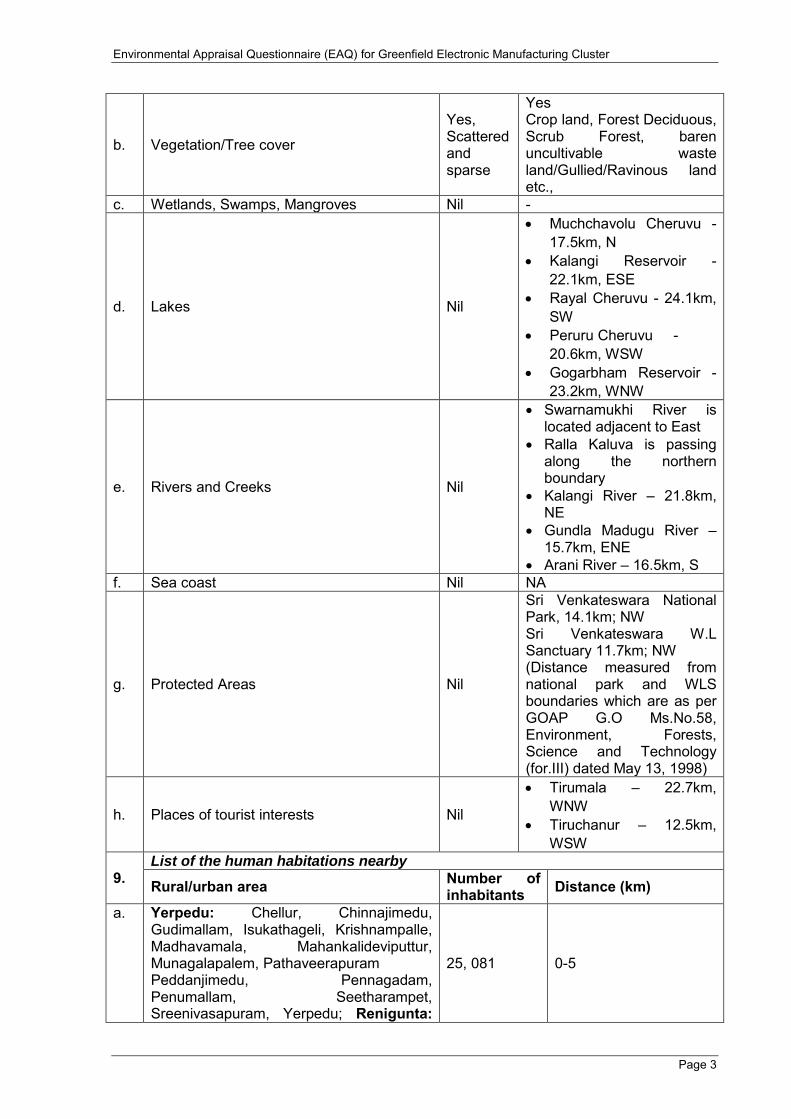
b. Vegetation/Tree cover
Yes, Scattered and sparse
Yes Crop land, Forest Deciduous, Scrub Forest, baren uncultivable waste land/Gullied/Ravinous land etc.,
c. Wetlands, Swamps, Mangroves Nil -
d. Lakes Nil
Muchchavolu Cheruvu - 17.5km, N
Kalangi Reservoir - 22.1km, ESE
Rayal Cheruvu - 24.1km, SW
Peruru Cheruvu - 20.6km, WSW
Gogarbham Reservoir - 23.2km, WNW
e. Rivers and Creeks Nil
Swarnamukhi River is located adjacent to East
Ralla Kaluva is passing along the northern boundary
Kalangi River – 21.8km, NE
Gundla Madugu River – 15.7km, ENE
Arani River – 16.5km, S f. Sea coast Nil NA
g. Protected Areas Nil
Sri Venkateswara National Park, 14.1km; NW Sri Venkateswara W.L Sanctuary 11.7km; NW (Distance measured from national park and WLS boundaries which are as per GOAP G.O Ms.No.58, Environment, Forests, Science and Technology (for.III) dated May 13, 1998)
h. Places of tourist interests Nil
Tirumala – 22.7km, WNW
Tiruchanur – 12.5km, WSW
9. List of the human habitations nearby
Rural/urban area Number of inhabitants Distance (km)
a. Yerpedu: Chellur, Chinnajimedu, Gudimallam, Isukathageli, Krishnampalle, Madhavamala, Mahankalideviputtur, Munagalapalem, Pathaveerapuram Peddanjimedu, Pennagadam, Penumallam, Seetharampet, Sreenivasapuram, Yerpedu; Renigunta:
25, 081 0-5

Environmental Appraisal Questionnaire (EAQ) for Greenfield Electronic Manufacturing Cluster
Page 4
Adusupalem, Kurukalva, Vedullacheruvu; Srikalahasti: Kothuru @ Chellamambapuram
b. Yerpedu: Kandadu, Kobaka, Mannasamudram, Modugulapalem, Musalipedu, Nagampalle, Venkatapuram, Vikruthamala, Srikalahasti: Bokkasam, Palem, Madamala, Narayanapuram; Vadamalapeta: Kadirimangalam, Kallur: K.V.B.Puram: Adavaram; Renigunta: Annasamipalle, Athuru, Dharmapuram Khandriga, Gajulamandyam, Karakambadi (Rural), Kothapalem, Krishnaiah Kalva, Krishnapuram, Molagamudi, Nallapalem, R. Mallavaram; Renigunta (CT): Sanjeevarayanipatteda, Thandlam, Thathaiah Kalva, Thukivakam (Rural), Venkatapuram
90,881 5-10
10. Transport links a. Bus NH716 (old NH 205), 5.2 km W
NH 71(old SH 61), 2.0km; N SH 55, 5.5 km; NE SH 31, 5.8 km; W
b. Train Renigunta at 6.3 km c. Others Renigunta Airport (Tirupati) adjacent
International airport is at Chennai located ~ 97 km
Ennore Port (93 km) Krishnapatnam Port (90 km) Chennai Port (99 km) Kattupalli shipyard (91 km).
B. INFRASTRUCTURE FACILITIES PROPOSED IN THE IE This identifies a number of services and features that may be linked to environmental performance. Who provides or is responsible for the following services, tools or actions? 1. Industrial Estate Authority
1 2 3 4 5 2. Operational Units 3. Government Authority 4. Private Sector 5. Other (Please specify) 1. Energy (also State requirement in K Cal) (Power requirement: 14.3 MW) a. Centralized energy supply b. Individual energy supply c. Supply and recovery of waste heat
(cogeneration)
d. District heating system e. Energy from waste facility f. Energy from renewable resources facility 2. Water (also State requirement in KL) (Water Requirement: 2.85 MLD) a. Municipal service b. Tube wells c. Treatment facilities d. Waste water disposal (ZLD) e. Liquid waste disposal

Environmental Appraisal Questionnaire (EAQ) for Greenfield Electronic Manufacturing Cluster
Page 5
f. Waste water recycling g. Rainwater harvesting h. Sewage disposal (ZLD) 3. Solid waste (in Metric Tons) a. Solid waste disposal b. Composting of biological waste c. Industrial liquid waste disposal d. Hazardous waste disposal e. Waste exchange clearing house f. Multi-material resource recovery g. Including collection, storage & treatment 4. Transport (attach traffic risk assessment report) a. Traffic and transport management plan 5. Management a. Environmental monitoring b. Effluent monitoring c. Air emission monitoring d. Environmental auditing e. EMP & implementation of risk mitigation
measures
f. Environmental technology assessment g. Environmental training and education h. Emergency preparedness and response
capability
i. Self-regulation and operational standards j. Finance and insurance services 6. Miscellaneous a. Restoring natural features of the site b. Landscaping and gardening c. Analytical and laboratory services d. Protection and security system C. MAIN STAKEHOLDERS 1. List of units requiring individual
environmental clearance (in future) Nil. As per EIA Notification 2006, (as
Amended), IE/IP obtains prior environmental clearance, individual industries including proposed industrial housing within such estates /complexes will not be required to take prior environmental clearance, so long as the Terms and Conditions for the industrial estate/complex are complied with except the category of projects and activities given in Annexure of OM dated April 04, 2016.
2. Details of issues raised in the environmental public hearing
Details of public hearing are given in Annexure K of EAQ.
D. FINANCE ARRANGEMENTS Yes No 1. Local financial institutions and banks a. If yes, what influence do they have? 2. Owners 3. Conditionalities on investments and credits 4. Others (GoI Grant)

Environmental Appraisal Questionnaire (EAQ) for Greenfield Electronic Manufacturing Cluster
Page 6
(The project will be funded with a combination of Equity, Grant in Aid from GoI, Sales proceeds during the construction, upfront lease charges from sheds and Debt from the commercial banks, during the Project Development Stage)
E. ENVIRONMENTAL IMPACT ASSESSMENT TO COVER 1. Baseline Conditions Covered in Chapter 3 of the EIA Report -
Description of Environment 2. Impact Assessment including carrying
capacity of the area
Covered in Chapter 4 of the EIA Report - Anticipated Environmental Impacts and Mitigations Measures
3. Social Impact Assessment including Rehabilitation Action Plan (if any)
Covered in Chapter 7 of the EIA Report - Additional Studies; Section 7.5
4. Risk Assessment and Onsite and offsite Emergency Response Planning
Covered in Chapter 7 of the EIA Report - Additional Studies; Section 7.2 and 7.3
5. Environmental Management Plan Covered in Chapter 9 of the EIA Report - Environment Management Plan (EMP)
6. Details of environmental parameters to be monitored (frequency and implementation agency)
Covered in Chapter 6 of the EIA Report - Environmental Monitoring Programme
F. POTENTIAL ENVIRONMENTAL THREATS This assessment is for the entire estate, not for individual units 1. ‘Imminent threats’ to human health and/or the environment (‘imminent’ means high-risk
threats that require immediate action to reduce risks and liabilities) Threat Actions proposed to be taken
a. IE consists of Electronic product/components manufacturing, Semiconductor designing and R&D and Electronic manufacturing services which may pose threat if its emissions and discharges are not controlled.
Member industry shall use all available air pollution control measures such as Point-of-use (POU) systems that are relatively small and typically dedicated to a single process tool. These systems can remove up to 99.99 percent of effluent gases
Periodical Monitoring of pollutants at stacks
STP/CETP with Zero Discharge No untreated WW will be sent out Emissions from the proposed EMC
will be within the standards prescribed by APPCB/CPCB/MoEF&CC.
2. Likely Environmental ‘trouble spots’ Trouble spot Actions proposed to be taken
a. IE consists of Electronic product/components manufacturing, Semiconductor designing and R&D and Electronic manufacturing services which may pose threat if its emissions and discharges are not controlled.
Member industry shall use all available air pollution control measures such as Point-of-use (POU) systems that are relatively small and typically dedicated to a single process tool. These systems can remove up to 99.99 percent of

Environmental Appraisal Questionnaire (EAQ) for Greenfield Electronic Manufacturing Cluster
Page 7
effluent gases Periodical Monitoring of pollutants at
stacks STP/CETP with Zero Discharge No untreated WW will be sent out Emissions from the proposed EMC
will be within the standards prescribed by APPCB/CPCB/MoEF&CC
3. Major sources & quantities of wastes (solid, air, liquid) likely to be generated in the IE Sources Inventory Actions proposed to be taken
a. Solid Waste i.
Hazardous Waste
Used oil – 500 L/Year
Wastes/ Residue containing Oil /Oil Soaked rags/Cotton Waste – 0.5 MT/year
Waste and Residues – 100 kg/year
Discarded container etc. – 500 Nos. year
Will be sent to common hazardous facility/TSDF nearby
ii. Non-hazardous Waste
Biodegradable Waste 8.55 TPD
Composting and Greenbelt application and rest will be disposed to local municipality
Total Recyclable Waste
2.13 TPD Will be given to APPCB approved recycling units/vendors
Inert material 3.57 Will be given to Municipal Landfill
b. Air Inventory of Air emissions from the EMC and mitigation measures proposed to be taken are covered in Section 4.5.2 in Chapter 4 of the EIA Report
c. Liquid wastes Total wastewater generation in the EMC will be around 1.96 MLD (0.18 MLD from cooling tower blow down, 0.36 MLD from process, 1.416 MLD from sewage and 0.06 MLD from miscellaneous activities). For the wastewater treatment Common Effluent
Environmental Appraisal Questionnaire (EAQ) for Greenfield Electronic Manufacturing Cluster
Page 8
Treatment Plant (CETP) of 2 MLD is proposed which comprised of a STP and two ETPs.
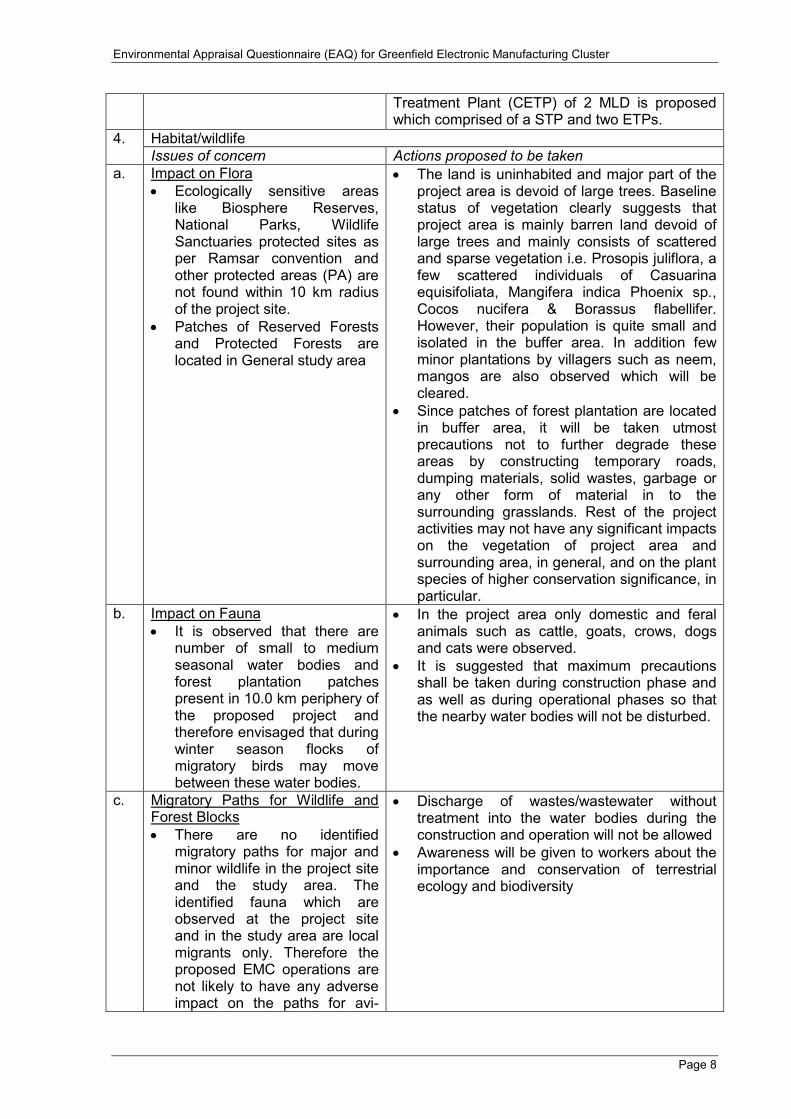
4. Habitat/wildlife Issues of concern Actions proposed to be taken
a. Impact on Flora Ecologically sensitive areas
like Biosphere Reserves, National Parks, Wildlife Sanctuaries protected sites as per Ramsar convention and other protected areas (PA) are not found within 10 km radius of the project site.
Patches of Reserved Forests and Protected Forests are located in General study area
The land is uninhabited and major part of the project area is devoid of large trees. Baseline status of vegetation clearly suggests that project area is mainly barren land devoid of large trees and mainly consists of scattered and sparse vegetation i.e. Prosopis juliflora, a few scattered individuals of Casuarina equisifoliata, Mangifera indica Phoenix sp., Cocos nucifera & Borassus flabellifer. However, their population is quite small and isolated in the buffer area. In addition few minor plantations by villagers such as neem, mangos are also observed which will be cleared.
Since patches of forest plantation are located in buffer area, it will be taken utmost precautions not to further degrade these areas by constructing temporary roads, dumping materials, solid wastes, garbage or any other form of material in to the surrounding grasslands. Rest of the project activities may not have any significant impacts on the vegetation of project area and surrounding area, in general, and on the plant species of higher conservation significance, in particular.
b. Impact on Fauna It is observed that there are
number of small to medium seasonal water bodies and forest plantation patches present in 10.0 km periphery of the proposed project and therefore envisaged that during winter season flocks of migratory birds may move between these water bodies.
In the project area only domestic and feral animals such as cattle, goats, crows, dogs and cats were observed.
It is suggested that maximum precautions shall be taken during construction phase and as well as during operational phases so that the nearby water bodies will not be disturbed.
c. Migratory Paths for Wildlife and Forest Blocks There are no identified
migratory paths for major and minor wildlife in the project site and the study area. The identified fauna which are observed at the project site and in the study area are local migrants only. Therefore the proposed EMC operations are not likely to have any adverse impact on the paths for avi-
Discharge of wastes/wastewater without treatment into the water bodies during the construction and operation will not be allowed
Awareness will be given to workers about the importance and conservation of terrestrial ecology and biodiversity

Environmental Appraisal Questionnaire (EAQ) for Greenfield Electronic Manufacturing Cluster
Page 9
fauna. 5. Potential sources of industrial accidents, explosions and fires, health and safety issues
Potential sources Actions proposed to be taken a. Accidents during Construction
Phase o Mechanical Hazards o Transportation Hazards o Physical Hazards o Storage and Handling of
Hazardous Materials Accidents during Operation
Phase o Material Hazards o Mechanical Hazards o Handling, Storage and
Transportation Hazards o Plant/Industry Hazards
Accidents due to Natural Calamities o Earthquake o Cyclone/Flood
Risk Assessment studies were carried out for the potential industries causing accidents, explosions and fires, health and safety issues and present in the EIA report.
Proper wiring of the electrical appliances like lights, exhausts, etc., would be made to ensure that there are no live wires causing short circuits to ignite materials.
All electrical fittings and cables are to be provided as per the specified standards.
Spillages are to be collected and neutralized for toxic contents before disposal.
Extra care shall be taken by providing rupture disc, pressure release valve and temperature controller
Eye wash/Drench shower is to be provided at a strategic location for emergency purpose
Chemical Safety Data Sheets and handling procedure, First Aid measures are to be prepared and displayed for information and safety of the working personnel.
Other Risk mitigation measures are covered in Section 7.2.5 in Chapter 7 of the EIA Report
6. Sources of environmental threats in adjacent areas Sources Actions proposed to be taken
a. None -

Environmental Appraisal Questionnaire (EAQ) for Greenfield Electronic Manufacturing Cluster
Page 10
LIST OF ENCLOSURES 1. Land purchase agreement Annexure-A
2. Land use/Zoning particulars-relevant portions from the prevailing local Regulations Annexure-B
3. Cost estimates inclusive of land cost Annexure-C 4. Landscape plans with proposed tree plantation Annexure-D 5. Water balance statement Annexure-E 6. Rainwater harvesting plan Annexure-F 7. Storm water drainage Annexure-G 8. Material balance studies, if carried out - 9. Common effluent treatment plant-details with a write up Annexure-H 10. Statement on the machinery & manpower during construction Annexure-I 11. Fire protection measures & approvals obtained Annexure-J
12. Proceedings of Environmental Public Hearing also provide response to points raised in the public hearing Annexure-K
13. Approval of competent authorities in case of conversion of agricultural land, change of land use, DC rules Annexure-L
14. Construction schedule Annexure-M
15. Approval from special bodies (State Industries Commissioner/SIDC/financial institutions) Annexure-N
16. Approvals if applicable from ASI, Civil Aviation, ecologically sensitive areas, coastal development regulations, etc -
17. Solid waste collection, treatment, storage, transportation and disposal plan Annexure-O
18. Vehicle parking and management Annexure-P
19. Environment Impact Assessment Study (including Executive summary)
Standalone Documents
20. Schedule-II Application Form for EC - 21. Questionnaire for IE This Document

Annexure-A
Land purchase agreement

Environmental Appraisal Questionnaire (EAQ) for Greenfield Electronic Manufacturing Cluster
Page A-1
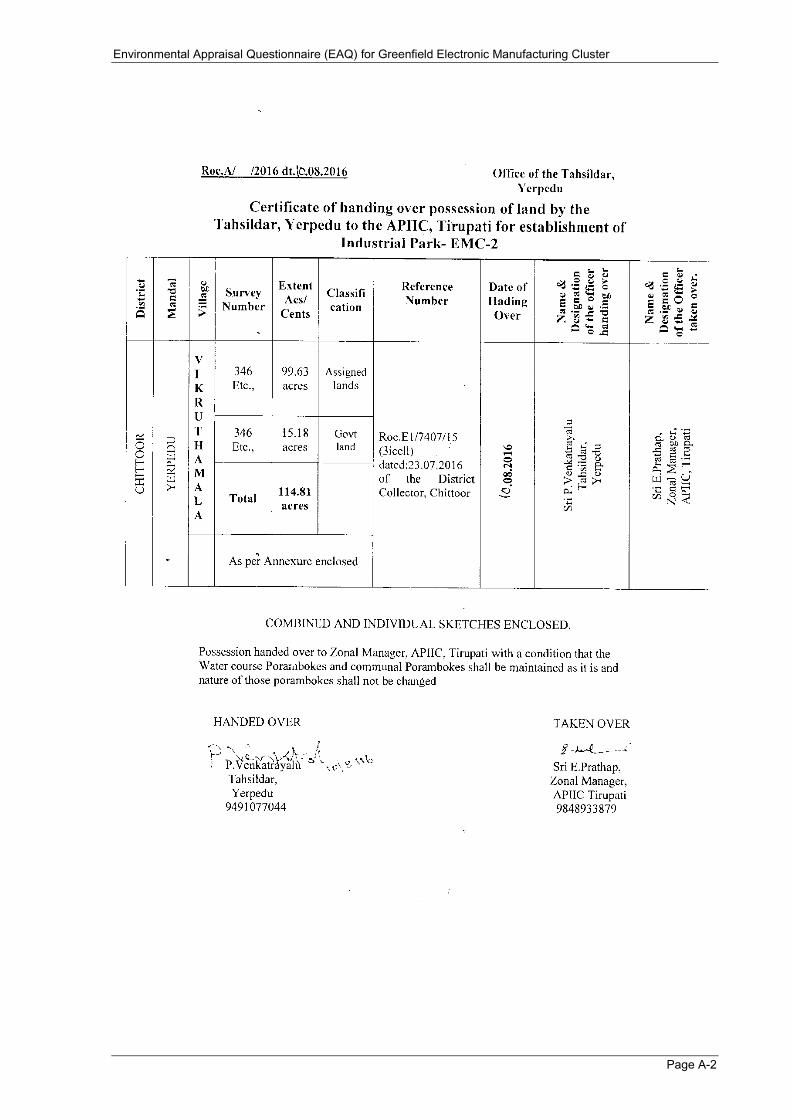
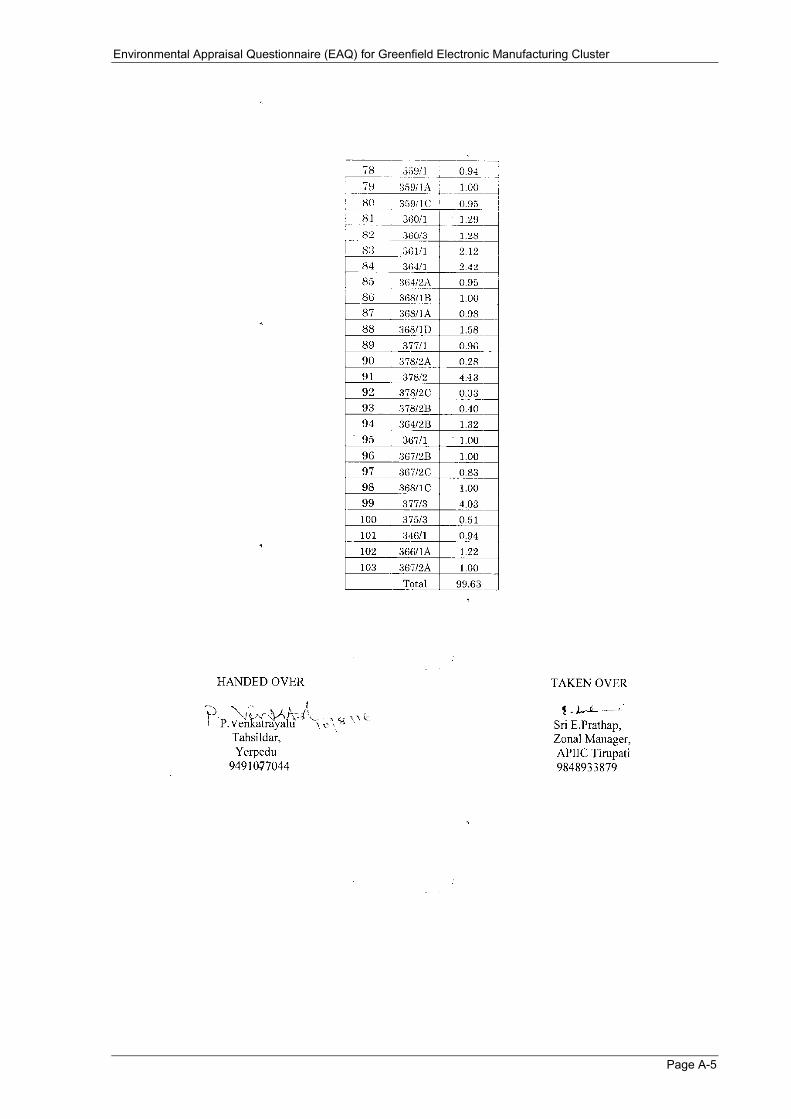
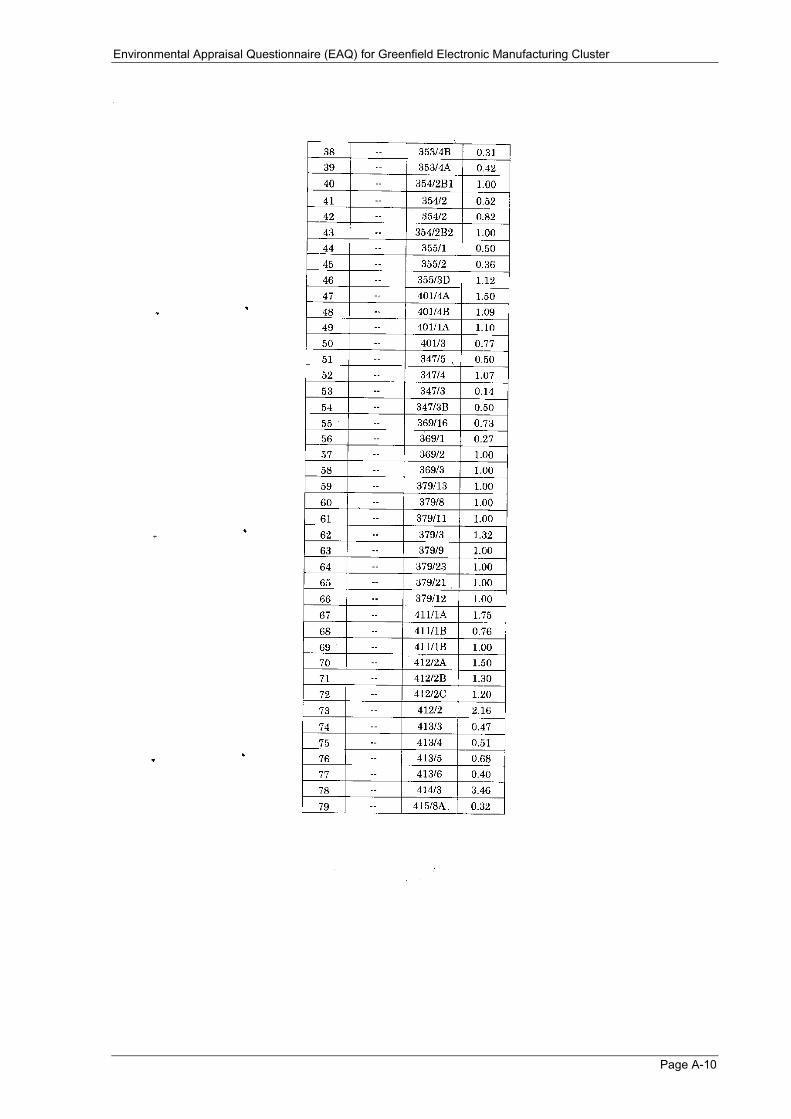
Annexure A Land Purchase Agreement A.1 Land Acquisition EMC is planned to be developed in a land of 501.4 acres. This land is under the possession of APIIC from GoAP. There is no forest land involved in the proposed project development. The land is devoid of any settlements and hence there will be no Resettlement or Rehabilitation (R&R) for development of the EMC. A copy of the land transfer documents issued by Government of Andhra Pradesh (GoAP) is given as below.
Environmental Appraisal Questionnaire (EAQ) for Greenfield Electronic Manufacturing Cluster
Page A-2

Environmental Appraisal Questionnaire (EAQ) for Greenfield Electronic Manufacturing Cluster
Page A-3

Environmental Appraisal Questionnaire (EAQ) for Greenfield Electronic Manufacturing Cluster
Page A-4
Environmental Appraisal Questionnaire (EAQ) for Greenfield Electronic Manufacturing Cluster
Page A-5

Environmental Appraisal Questionnaire (EAQ) for Greenfield Electronic Manufacturing Cluster
Page A-6

Environmental Appraisal Questionnaire (EAQ) for Greenfield Electronic Manufacturing Cluster
Page A-7

Environmental Appraisal Questionnaire (EAQ) for Greenfield Electronic Manufacturing Cluster
Page A-8

Environmental Appraisal Questionnaire (EAQ) for Greenfield Electronic Manufacturing Cluster
Page A-9
Environmental Appraisal Questionnaire (EAQ) for Greenfield Electronic Manufacturing Cluster
Page A-10

Environmental Appraisal Questionnaire (EAQ) for Greenfield Electronic Manufacturing Cluster
Page A-11

Environmental Appraisal Questionnaire (EAQ) for Greenfield Electronic Manufacturing Cluster
Page A-12

Environmental Appraisal Questionnaire (EAQ) for Greenfield Electronic Manufacturing Cluster
Page A-13

Environmental Appraisal Questionnaire (EAQ) for Greenfield Electronic Manufacturing Cluster
Page A-14

Environmental Appraisal Questionnaire (EAQ) for Greenfield Electronic Manufacturing Cluster
Page A-15

Environmental Appraisal Questionnaire (EAQ) for Greenfield Electronic Manufacturing Cluster
Page A-16
Source APIIC

Environmental Appraisal Questionnaire (EAQ) for Greenfield Electronic Manufacturing Cluster
Page A-17

Environmental Appraisal Questionnaire (EAQ) for Greenfield Electronic Manufacturing Cluster
Page A-18

Environmental Appraisal Questionnaire (EAQ) for Greenfield Electronic Manufacturing Cluster
Page A-19

Environmental Appraisal Questionnaire (EAQ) for Greenfield Electronic Manufacturing Cluster
Page A-20

Environmental Appraisal Questionnaire (EAQ) for Greenfield Electronic Manufacturing Cluster
Page A-21

Environmental Appraisal Questionnaire (EAQ) for Greenfield Electronic Manufacturing Cluster
Page A-22
Environmental Appraisal Questionnaire (EAQ) for Greenfield Electronic Manufacturing Cluster
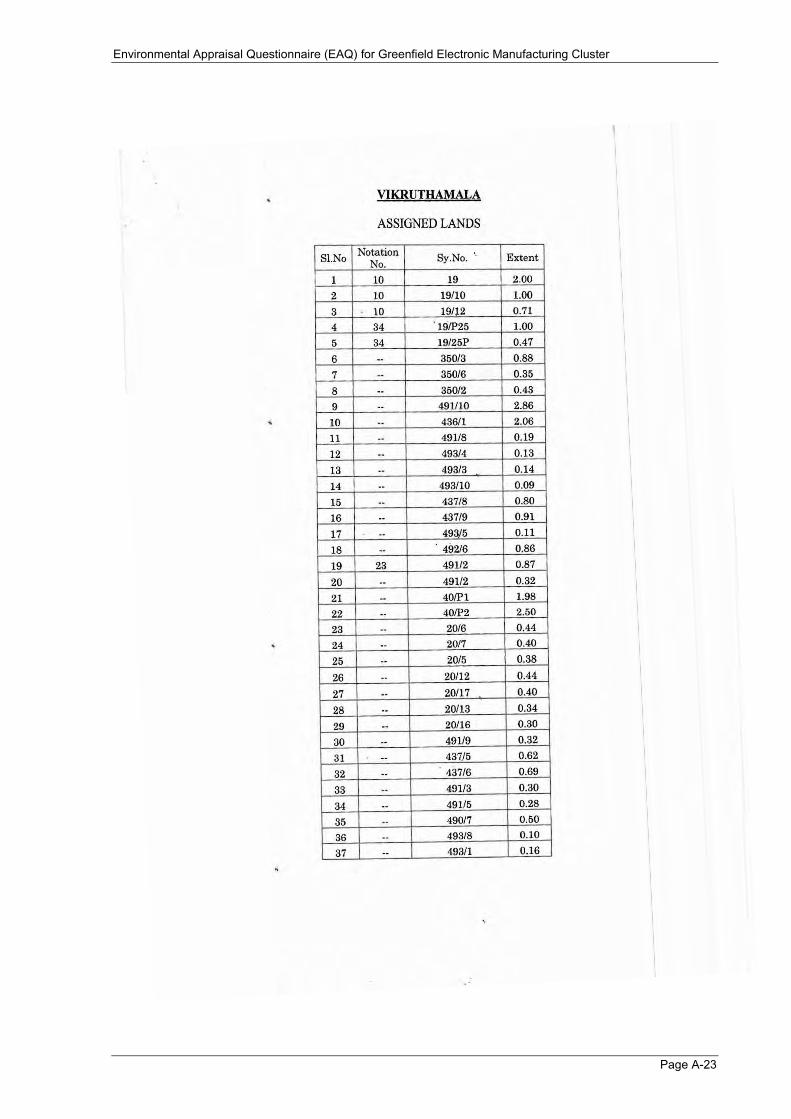
Page A-23

Environmental Appraisal Questionnaire (EAQ) for Greenfield Electronic Manufacturing Cluster
Page A-24

Environmental Appraisal Questionnaire (EAQ) for Greenfield Electronic Manufacturing Cluster
Page A-25
Annexure-B
Land use/Zoning particulars
Environmental Appraisal Questionnaire (EAQ) for Greenfield Electronic Manufacturing Cluster
Page B-1
Annexure B Land use/Zoning particulars-relevant portions from the prevailing local Regulations
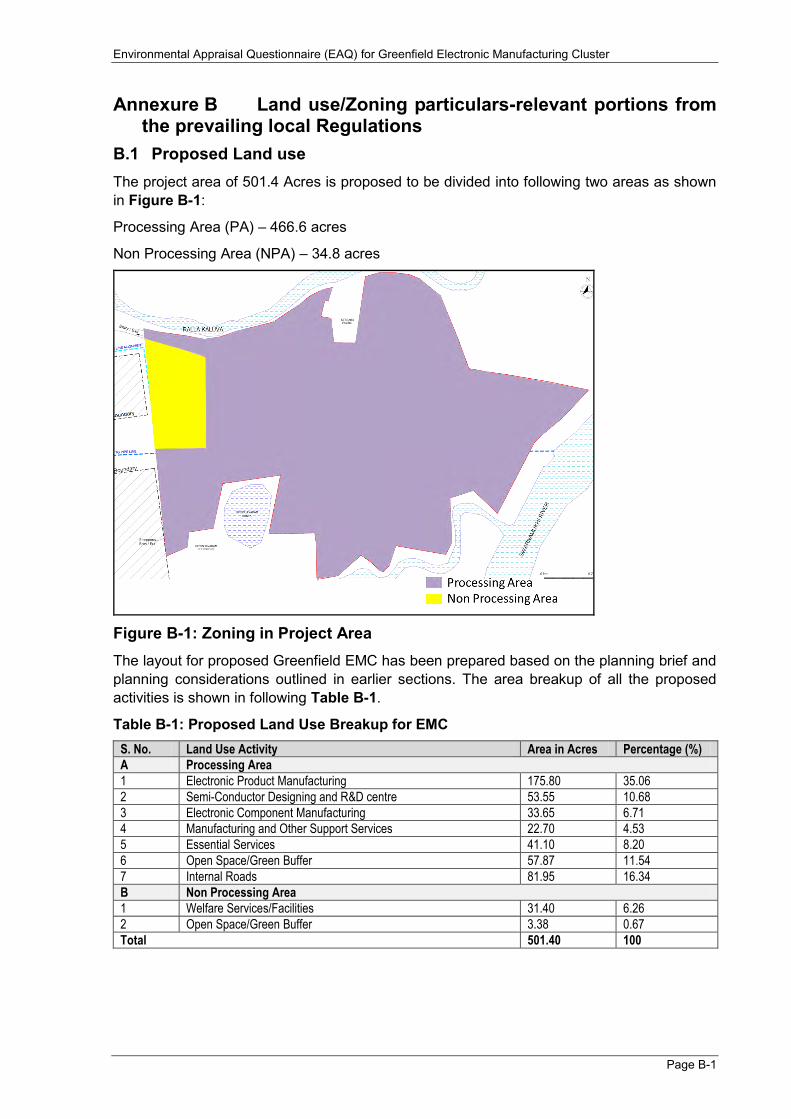
B.1 Proposed Land use The project area of 501.4 Acres is proposed to be divided into following two areas as shown in Figure B-1:
Processing Area (PA) – 466.6 acres
Non Processing Area (NPA) – 34.8 acres
Figure B-1: Zoning in Project Area The layout for proposed Greenfield EMC has been prepared based on the planning brief and planning considerations outlined in earlier sections. The area breakup of all the proposed activities is shown in following Table B-1.
Table B-1: Proposed Land Use Breakup for EMC S. No. Land Use Activity Area in Acres Percentage (%)
A Processing Area
1 Electronic Product Manufacturing 175.80 35.06
2 Semi-Conductor Designing and R&D centre 53.55 10.68
3 Electronic Component Manufacturing 33.65 6.71
4 Manufacturing and Other Support Services 22.70 4.53
5 Essential Services 41.10 8.20
6 Open Space/Green Buffer 57.87 11.54
7 Internal Roads 81.95 16.34
B Non Processing Area
1 Welfare Services/Facilities 31.40 6.26
2 Open Space/Green Buffer 3.38 0.67
Total 501.40 100

Annexure-C
Cost estimates

Environmental Appraisal Questionnaire (EAQ) for Greenfield Electronic Manufacturing Cluster
Page C-1
Annexure C Cost estimates inclusive of land cost C.1 Project Cost The summary of the Project cost including land cost, are given below in Table C-2.
Table C-1: Summary of Project Cost Estimates (in Rs. Crores) S. No Item In Rs Mn
1. Basic Development 98.36
2. Essential Services 59.35
3. Manufacturing and Other Support Services 108.48
4. Administrative and Office Block and Others 4.67
5. Welfare Services 17.31
6. Block Cost 288.26
7. Land Cost 62.68
C.2 Budgetary Estimate for Environmental Management The budgetary estimate (Capital Cost) for Environmental Management is INR 422 Million (Rupees 42.20 Crores) and the annual recurring cost is INR 54 Million (Rupees 5.4 Crores). The breakup of cost is given in Table C-2 and Table C-3.
Table C-2: Environmental Management - Capital Cost S. No. Purpose Cost items Million (INR) Crore (INR)
1. Greenbelt development Tree (Greenbelt) Plantation 15.49 1.55
2. Solid Waste Management Waste dustbin 0.25 0.03
3. Capacity building Training workshop 0.20 0.02
4. Dust Sweeper Housekeeping 15.00 1.50
5. Air Pollution Control Water Sprinkling during Construction Phase Only 20.00 2.00
6. Storm water drainage Installation of Storm water drains and construction of CETP, WTP and pipelines for conveyance*
163.80 16.38
7. CETP 112.70 11.27
8. WTP 33.00 3.30
9. Effluent Conveyance 59.00 5.90
10. Environmental Monitoring Construction Phase
Terrestrial Environment 2.22 0.22
Total Capital Cost 421.50 42.16
Round off 422 42.2
*It may be noted that cost items for storm water drainage, CETP, WTP and effluent conveyance are already accounted for in the Project Cost and will not be additional as a part of Environmental Management.
Table C-3: Environmental Management - Annual Recurring Cost S. No. Purpose Items Million (INR) Crore (INR)
1. EMC Running expenditure
Salary of Env. Eng. 0.5 0.05
Doc Asst. 0.2 0.02
Support Staff 0.1 0.01
Office Expenses 1.2 0.12
House Keeping 0.5 0.05
2. Greenbelt Maintenance General Maintenance
0.77 0.08
3. Maintenance of Dust bins 0.25 0.03
4. Awareness campaigns-Training Two Workshop programs 0.2 0.02
5. Maintenance of Dust sweepers
General Maintenance
3 0.3
7. Storm water drainage 16.4 1.64
8. CETP 11.3 1.13
9. Water Treatment Plant 3.3 0.33
10. Effluent Conveyance 5.9 0.59
11. Wetting of Roads 0.5 0.05

Environmental Appraisal Questionnaire (EAQ) for Greenfield Electronic Manufacturing Cluster
Page C-2
S. No. Purpose Items Million (INR) Crore (INR)
12. Statutory compliance for environmental protection
Environmental Monitoring 9.89 0.99
Total Annual Recurring Cost 54.01 5.41
Round off 54 5.4

Annexure-D
Landscape plans with
proposed tree plantation
Environmental Appraisal Questionnaire (EAQ) for Greenfield Electronic Manufacturing Cluster
Page D-1
Annexure D Landscape plans with proposed tree plantation D.1 Greenbelt Development Plan Trees play a vital role in the environment in preventing the horizontal dispersion of the pollutants to the surrounding areas. Trees are very suitable and effective for detecting, recognizing, reducing and controlling air pollution, minimising noise pollution and will also check soil erosion, make the ecosystem more complete and functionally more stable and conducive.
Owing to their large surface area besides their bio-aesthetical values trees are to be used as indicators of biological effects of pollutant.
D.1.1 Objectives of Greenbelt Development Plan
The objectives of greenbelt development plan are as follows:
Mitigation of Fugitive Emissions and improve ambient air quality Provide a shelter belt around the project area for dust absorption and noise reduction Prevention of land degradation due to activities during construction phase Balancing Eco Environment Enhancement of the overall environmental quality Provide adequate shelter and habitat to the local fauna Enhancing the ecological equilibrium of the area Providing aesthetic value to the project area Conserve soil quality and improve moisture level in ambient atmosphere Compliance of the conditions stipulated in the environment clearance Improving the forest cover and maintaining the biodiversity of the region Create awareness for environmental conservation and tree planting Generate employment for the local people
D.1.2 Greenbelt Areas
Greenbelt/green area development will be carried out in and around the EMC, along the boundary, roadside and on the vacant areas with above objectives. A total area of 61.25 Acres was earmarked for greenbelt/green areas development which is about ~12.2% of total EMC area and provisions shall be made for green area development of additional ~33% of total area in upcoming industrial units. Width of the green belt is varying from 10-20m (more width near the habitation).
D.1.3 Plant Species for Greenbelt Development
Emphasis shall be on native plant species on the basis of air pollution tolerance index of tree. The selection of plant species for the development depends on various factors such as climate, elevation and soil.
While selecting the plant species for the proposed greenbelt, they should exhibit the following desirable characteristics in order to be considered:
Tolerance to specific conditions or alternatively wide adaptability to eco-physiological conditions
Fast growing type and providing optimum penetrability Capacity to endure water stress and climate extremes after initial establishment Should be wind-firm and deep-rooted Should form a dense canopy and perennial green Species tolerant to air pollutants like PM, SO2and NOX should be preferred
Environmental Appraisal Questionnaire (EAQ) for Greenfield Electronic Manufacturing Cluster
Page D-2
Be able to attenuate noise generated within the area Native origin and locally available Be well adapted to the existing soil conditions Should have a large leaf area index. Should be permeable to help create air turbulence and mixing within the belt Introduction of monocultures and alien plant species would be avoided to the maximum
possible extent Should be able to thrive along with diverse species
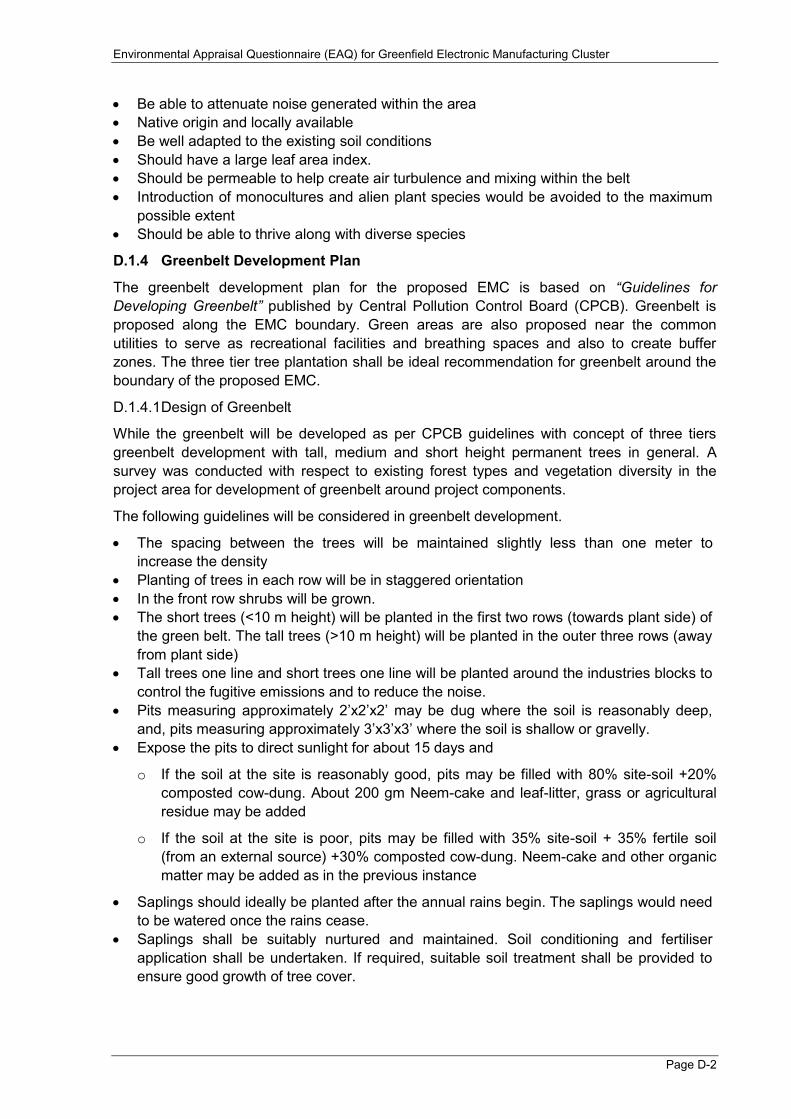
D.1.4 Greenbelt Development Plan
The greenbelt development plan for the proposed EMC is based on “Guidelines for Developing Greenbelt” published by Central Pollution Control Board (CPCB). Greenbelt is proposed along the EMC boundary. Green areas are also proposed near the common utilities to serve as recreational facilities and breathing spaces and also to create buffer zones. The three tier tree plantation shall be ideal recommendation for greenbelt around the boundary of the proposed EMC.
D.1.4.1 Design of Greenbelt
While the greenbelt will be developed as per CPCB guidelines with concept of three tiers greenbelt development with tall, medium and short height permanent trees in general. A survey was conducted with respect to existing forest types and vegetation diversity in the project area for development of greenbelt around project components.
The following guidelines will be considered in greenbelt development.
The spacing between the trees will be maintained slightly less than one meter to increase the density
Planting of trees in each row will be in staggered orientation In the front row shrubs will be grown. The short trees (<10 m height) will be planted in the first two rows (towards plant side) of
the green belt. The tall trees (>10 m height) will be planted in the outer three rows (away from plant side)
Tall trees one line and short trees one line will be planted around the industries blocks to control the fugitive emissions and to reduce the noise.
Pits measuring approximately 2’x2’x2’ may be dug where the soil is reasonably deep, and, pits measuring approximately 3’x3’x3’ where the soil is shallow or gravelly.
Expose the pits to direct sunlight for about 15 days and
o If the soil at the site is reasonably good, pits may be filled with 80% site-soil +20% composted cow-dung. About 200 gm Neem-cake and leaf-litter, grass or agricultural residue may be added
o If the soil at the site is poor, pits may be filled with 35% site-soil + 35% fertile soil (from an external source) +30% composted cow-dung. Neem-cake and other organic matter may be added as in the previous instance
Saplings should ideally be planted after the annual rains begin. The saplings would need to be watered once the rains cease.
Saplings shall be suitably nurtured and maintained. Soil conditioning and fertiliser application shall be undertaken. If required, suitable soil treatment shall be provided to ensure good growth of tree cover.

Environmental Appraisal Questionnaire (EAQ) for Greenfield Electronic Manufacturing Cluster
Page D-3
Construction of temporary shelters of locally available materials such as bamboo and grass around the growing saplings is recommended in the summer, to help the plants withstand the hot sun.
During construction period
o Ground-vegetation should be allowed to shed seeds before cutting or moving it for mulch. This would leave behind a seed-bank to flourish in the next growing-season, providing a natural source of mulch for the following year.
o Open Burning of bushes and other waste on land must be avoided, as it reduces soil-quality, and harms the ground-vegetation, amphibians, reptiles and ground-nesting birds.
Development of greenbelt shall start with construction phase and shall be continued full fledge with operation phase of the proposed EMC.
As a part of improving biodiversity areas need to be ear marked for the growth of creepers that are always neglected in greenbelt development category. Creepers are becoming increasingly threatened due to lack of concerns and selective dereliction of this species.
The indicative sketch of three tier greenbelt development is given in Figure D-1.
Figure D-1: Hypothetical Representation of Three Tier Greenbelt Development
D.1.4.2 Cost estimations for Greenbelt Development
Approximately 61,968 trees are proposed to be planted in entire EMC to follow the concept of 2500 trees/Ha. The survival of the plantation shall be monitored frequently and survival rate of the plantation during operational phase shall not be less than 80%.
A capital cost of INR 15.49 million (Rupees 1.55Crores) shall be earmarked for this purpose and INR of 2.60 million (Rupees 0.26 Crores) shall be allocated for recurring expenses towards greenbelt development and maintenance. In addition to this, all other industrial units shall develop green areas within their premises as per the prevailing Andhra Pradesh Pollution Control Board (APPCB) provisions.
D.1.4.3 Recommended Species for Plantation
Based on climate and soil characteristics of the study area, some species are recommended for plantation. The climate of the region is extreme where there is heavy rainfall as well as
Environmental Appraisal Questionnaire (EAQ) for Greenfield Electronic Manufacturing Cluster
Page D-4
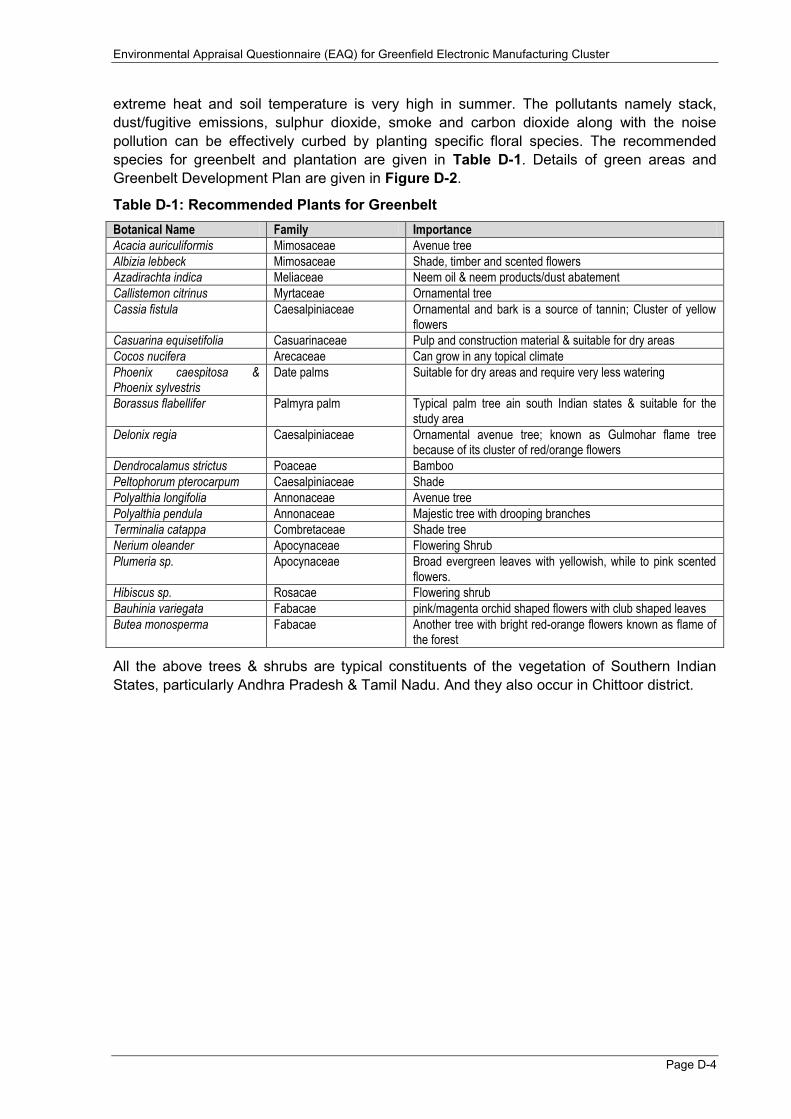
extreme heat and soil temperature is very high in summer. The pollutants namely stack, dust/fugitive emissions, sulphur dioxide, smoke and carbon dioxide along with the noise pollution can be effectively curbed by planting specific floral species. The recommended species for greenbelt and plantation are given in Table D-1. Details of green areas and Greenbelt Development Plan are given in Figure D-2.
Table D-1: Recommended Plants for Greenbelt Botanical Name Family Importance
Acacia auriculiformis Mimosaceae Avenue tree
Albizia lebbeck Mimosaceae Shade, timber and scented flowers
Azadirachta indica Meliaceae Neem oil & neem products/dust abatement
Callistemon citrinus Myrtaceae Ornamental tree
Cassia fistula Caesalpiniaceae Ornamental and bark is a source of tannin; Cluster of yellow flowers
Casuarina equisetifolia Casuarinaceae Pulp and construction material & suitable for dry areas
Cocos nucifera Arecaceae Can grow in any topical climate
Phoenix caespitosa & Phoenix sylvestris
Date palms Suitable for dry areas and require very less watering
Borassus flabellifer Palmyra palm Typical palm tree ain south Indian states & suitable for the study area
Delonix regia Caesalpiniaceae Ornamental avenue tree; known as Gulmohar flame tree because of its cluster of red/orange flowers
Dendrocalamus strictus Poaceae Bamboo
Peltophorum pterocarpum Caesalpiniaceae Shade
Polyalthia longifolia Annonaceae Avenue tree
Polyalthia pendula Annonaceae Majestic tree with drooping branches
Terminalia catappa Combretaceae Shade tree
Nerium oleander Apocynaceae Flowering Shrub
Plumeria sp. Apocynaceae Broad evergreen leaves with yellowish, while to pink scented flowers.
Hibiscus sp. Rosacae Flowering shrub
Bauhinia variegata Fabacae pink/magenta orchid shaped flowers with club shaped leaves
Butea monosperma Fabacae Another tree with bright red-orange flowers known as flame of the forest
All the above trees & shrubs are typical constituents of the vegetation of Southern Indian States, particularly Andhra Pradesh & Tamil Nadu. And they also occur in Chittoor district.

Environmental Appraisal Questionnaire (EAQ) for Greenfield Electronic Manufacturing Cluster
Page D-5
Figure D-2: Green Belt Development Plan

Annexure-E
Water balance statement

Environmental Appraisal Questionnaire (EAQ) for Greenfield Electronic Manufacturing Cluster
Page E-1
Annexure E Water Balance Statement The water demands have been estimated based on experiences of similar such projects and is arrived from following calculations and assumption:
Table E-1: Water Demand for Industrial Area
S No.
Type of Industry
Area (Acre)
Water Demand
for Industrial Process
(KLD)
Approx. Work Force (No.)
Potable Water
Demand For
Work Force (KLD)
Approx. Floating
Population (No.)
Potable Water
Demand For
Floating Pop
(KL/day)
Total Water
Demand (KLD)
Total demand(KLD)
with ~11% losses
1 Electronic Products-Mfg.
175.8 1010.85 7032 316.44 703 10.545 1337.83 1486.48
2 Electronic Components-Mfg.
33.65 193.48 1346 60.57 135 2.025 256.08 284.54
3 Semiconductor designing and R&D centre
53.55 307.91 2142 96.39 214 3.21 407.51 452.79
4 Manufacturing Support Services
22.7 130.52 908 40.86 91 1.36 172.75 191.94
Total 285.7 1642.77 11428 514.26 1143 17.14 2174.18 2415.76
Total 2420
Assumptions:
Water demand for industrial area is considered as 5.75 KL/acre/day Water demand for workforce is considered as 45 litres/capita/day Water demand for floating population is considered as 15 litres/capita/day
Table E-2: Water Demand for Public and Semi Public Places
S. No.
Type of Area Area
(Acre)
Approx. Work Force
Water Demand For Work
Force (KLD)
Approx. Floating
Population
Water Demand For
Floating Population
(KLD)
Water Demand for Hostels
(KLD)
Total Water
Demand (KLD)
1 Essential Services 41.1 2055 71.925 308 9.24 - 81.165
2 Welfare facilities 31.4 1570 54.95 236 7.08 914.47 976.5
Total 1057.67
Assumptions:
135 LPCD for hostel and 35 LPCD for other works Water demand for work force and floating population taken as 30 LPCD Hostel facility is being provided for 45% of the total population
Horticultural and other Miscellaneous Water Demand
Roads, Green Area and other miscellaneous (143.2 acres) demand is 343.68 KLD and 381.90 KLD including losses.
Fire-fighting Water Demand
The firefighting water demand is estimated as 500 KLD

Environmental Appraisal Questionnaire (EAQ) for Greenfield Electronic Manufacturing Cluster
Page E-2
Table E-3: Water Demand S. No. Industry Total fresh water demand (MLD)
1 Industrial Water Demand 1.85
2 Domestic Water Demand (Industries) 0.57
3 Domestic Water Demand (Welfare + Essential) 1.20
4 Water Demand (make up and misc.) 0.39
5 Fire Fighting 0.50
Total 4.51
Total water demand is 4.51 MLD among which 2.85 MLD (including losses) is fresh water and remaining 1.80 MLD as recycled water. The total water balance is shown in Figure E-1.
Figure E-1: Water Balance
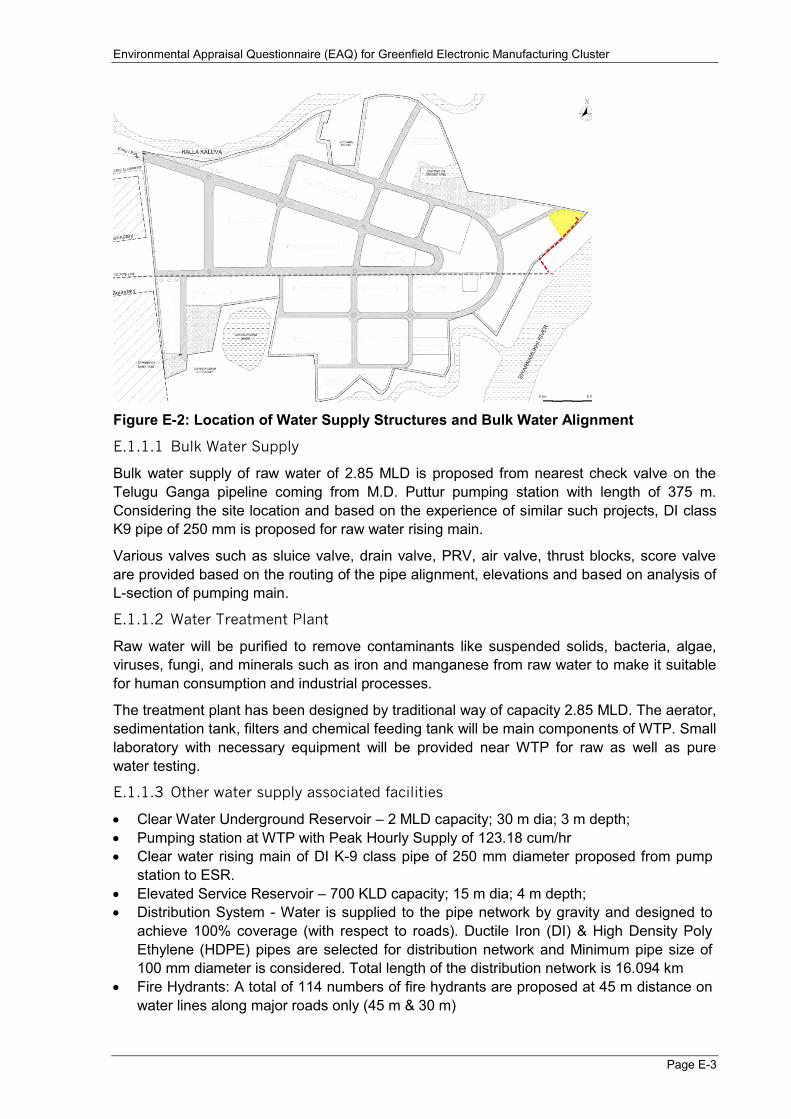
Water supply structures are planned as shown in the figure on the eastern side and water will be distributed from this location. Water treatment plant is located at this location as shown in the below figure.
Environmental Appraisal Questionnaire (EAQ) for Greenfield Electronic Manufacturing Cluster
Page E-3
Figure E-2: Location of Water Supply Structures and Bulk Water Alignment
E.1.1.1 Bulk Water Supply
Bulk water supply of raw water of 2.85 MLD is proposed from nearest check valve on the Telugu Ganga pipeline coming from M.D. Puttur pumping station with length of 375 m. Considering the site location and based on the experience of similar such projects, DI class K9 pipe of 250 mm is proposed for raw water rising main.
Various valves such as sluice valve, drain valve, PRV, air valve, thrust blocks, score valve are provided based on the routing of the pipe alignment, elevations and based on analysis of L-section of pumping main.
E.1.1.2 Water Treatment Plant
Raw water will be purified to remove contaminants like suspended solids, bacteria, algae, viruses, fungi, and minerals such as iron and manganese from raw water to make it suitable for human consumption and industrial processes.
The treatment plant has been designed by traditional way of capacity 2.85 MLD. The aerator, sedimentation tank, filters and chemical feeding tank will be main components of WTP. Small laboratory with necessary equipment will be provided near WTP for raw as well as pure water testing.
E.1.1.3 Other water supply associated facilities
Clear Water Underground Reservoir – 2 MLD capacity; 30 m dia; 3 m depth; Pumping station at WTP with Peak Hourly Supply of 123.18 cum/hr Clear water rising main of DI K-9 class pipe of 250 mm diameter proposed from pump
station to ESR. Elevated Service Reservoir – 700 KLD capacity; 15 m dia; 4 m depth; Distribution System - Water is supplied to the pipe network by gravity and designed to
achieve 100% coverage (with respect to roads). Ductile Iron (DI) & High Density Poly Ethylene (HDPE) pipes are selected for distribution network and Minimum pipe size of 100 mm diameter is considered. Total length of the distribution network is 16.094 km
Fire Hydrants: A total of 114 numbers of fire hydrants are proposed at 45 m distance on water lines along major roads only (45 m & 30 m)

Environmental Appraisal Questionnaire (EAQ) for Greenfield Electronic Manufacturing Cluster
Page E-4
Recycled Water Supply: The total quantity of recycled water is 1.8 MLD. Recycled water ground service reservoir of 1,500 KLD capacity; 25 m dia; 3 m depth; and this will be pumped to the ESR (12 m dia; 4 m depth) with storage capacity (500 KL). For recycled water distribution network 100mm diameter and above HDPE pipes are considered. The total length of the recycled water distribution network is 15.338 km.

Annexure-F
Rainwater harvesting plan

Environmental Appraisal Questionnaire (EAQ) for Greenfield Electronic Manufacturing Cluster
Page F-1
Annexure F Rainwater Harvesting Plan Rainwater Harvesting (RWH) refers to collection of rain falling on earth surface for beneficial uses before it drains away as run-off. However as a developmental activity to improve groundwater in the region rainwater harvesting is proposed within the EMC. Rainwater harvesting and conservation practices reduce the soil erosion, increases soil moisture and enhance recharge to groundwater body.
The objectives of rainwater harvesting proposed for the EMC are as follows:
Rainfall – runoff management Control soil erosion Increase the soil moisture Prevent rush of surface flow of water Recharge to groundwater in favourable areas Direct use of harvested rainwater Saving in pumping cost
F.1 Estimation of Rainwater Harvesting Potential
Rainwater Harvesting shall be implemented at EMC to conserve rainwater. Rooftop area, greenbelt/green area, road/paved area and open areas proposed in the EMC are considered for calculating the amount of rainwater that can be harvested.
The approximate quantities of rainwater that can be harvested at EMC are given in Table F-1. The equation used for run off estimation is based on CPCB guidelines on ‘Concepts and Practices for Rain water Harvesting’ - Oct 2001. The calculations are based on the following:
Average annual rainfall is 1133.9 mm based on 1980-2000 IMD data Average No of rainy days are 56.6 Run of co-efficient are considered as given by CPCB guidelines
Table F-1: Estimated Volume of run-off that can be harvested
S. No.
Land Use Distribution in
EMC
Plot Land Use Area
(Acre) Area (m2)
Volume (m3)
Run Off Coefficient
Total Volume of run-off harvested m3/Year
Volume of run-off
harvested (m3/day)
1 Roof top area 179.1 724800 821851 0.8 657480.58 11616
2 Road Area 81.95 331643 376050 0.7 263235.00 4651
3 Open
Space/Green Area
61.25 247873 281063 0.2 56213.00 993
Total 322.3 1304316 1478964 - 976928.21 17260
Note: - Roof top area is considered as 50% of the plotted area.
F.2 Harvesting Plan and Recharge Structures
F.2.1 Rooftop Rainwater Harvesting
Rooftop rainwater harvesting is one of the appropriate options for augmenting groundwater recharge/storage where natural recharge is considerably reduced and not much land is available for implementing any other artificial recharge measure.
In a typical roof top rainwater harvesting system, rainwater from the roof is collected in a storage vessel or tank for use during periods of scarcity. Such systems are usually designed to support the drinking and cooking needs of the family and comprise a roof, a storage tank

Environmental Appraisal Questionnaire (EAQ) for Greenfield Electronic Manufacturing Cluster
Page F-2
and guttering to transport the water from the roof to the storage tank. In addition, a first flush system to divert the dirty water, which contains debris, collected on the roof during non-rainy periods and a filter unit to remove debris and contaminants before water enters the storage tank are also provided. Therefore, a typical Rooftop Rainwater Harvesting System comprises following components:
Roof catchment Filter unit Drain pipes Storage tank. Gutters
Collection sump. Down pipe Pump unit First flush pipe
A typical Rooftop rainwater harvesting system is given in Exhibit F-1. However, during detailed engineering of the industries suitable structure will be arrived for rainwater harvesting.
Exhibit F-1: A Typical Rainwater Harvesting System
Filtration forms the most important process in the purification of water. It usually involves allowing water to pass through a filter media e.g. sand. Filtration essentially involves removal of suspended and colloidal impurities present in water. Depending on the type of filtration, the chemical characteristics of water may be altered and the bacterial content may be considerably reduced. These effects take place due to various processes such as mechanical straining, sedimentation, biological metabolism and electrolytic changes.
The sand being used for filter in rooftop rainwater harvesting systems should be free from clay, loam, vegetable matter, organic impurities, etc. and should also be uniform in nature and grain size. There are three types of filters:
i) Slow Sand Filters ii) Rapid Sand Filters (gravity type) iii) Pressure Filters
F.2.2 Storage Ponds/Tanks/ use of Existing nearby Pond
In addition to roof top rainwater harvesting, industries in the EMC will also adopt storage tank /pond system for storm water storage. Storage ponds/tanks are civil structures to store
Environmental Appraisal Questionnaire (EAQ) for Greenfield Electronic Manufacturing Cluster
Page F-3
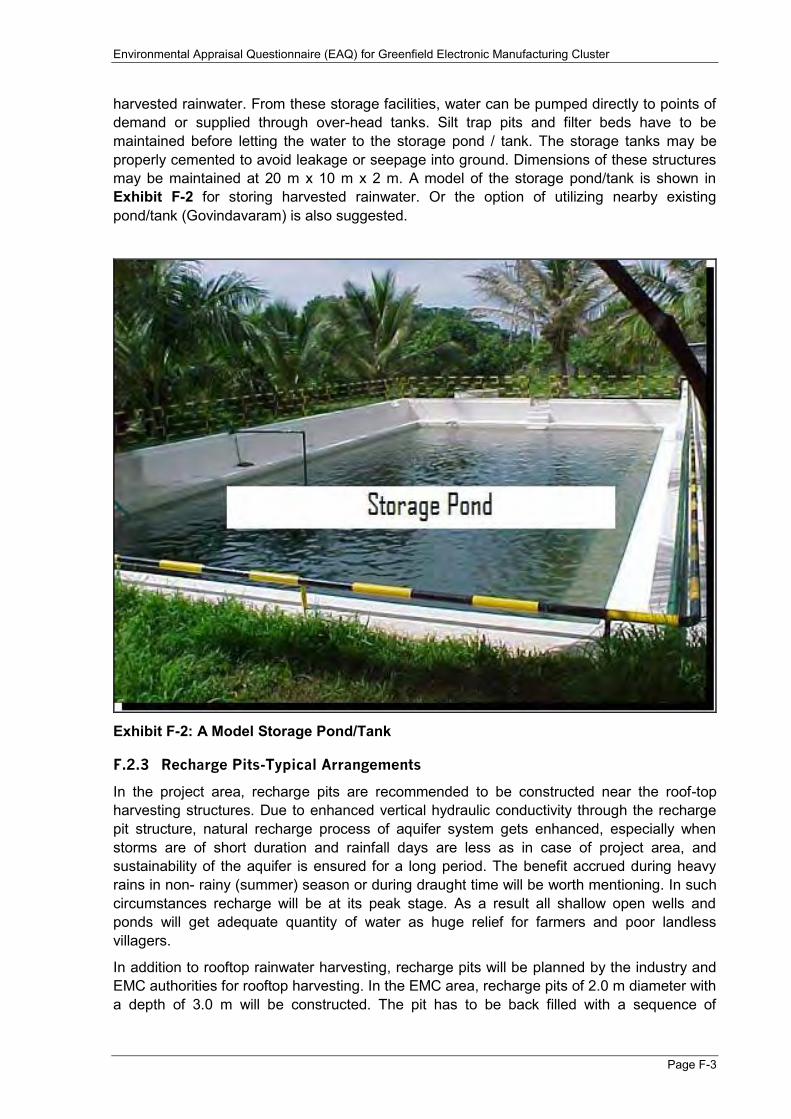
harvested rainwater. From these storage facilities, water can be pumped directly to points of demand or supplied through over-head tanks. Silt trap pits and filter beds have to be maintained before letting the water to the storage pond / tank. The storage tanks may be properly cemented to avoid leakage or seepage into ground. Dimensions of these structures may be maintained at 20 m x 10 m x 2 m. A model of the storage pond/tank is shown in Exhibit F-2 for storing harvested rainwater. Or the option of utilizing nearby existing pond/tank (Govindavaram) is also suggested.
Exhibit F-2: A Model Storage Pond/Tank
F.2.3 Recharge Pits-Typical Arrangements
In the project area, recharge pits are recommended to be constructed near the roof-top harvesting structures. Due to enhanced vertical hydraulic conductivity through the recharge pit structure, natural recharge process of aquifer system gets enhanced, especially when storms are of short duration and rainfall days are less as in case of project area, and sustainability of the aquifer is ensured for a long period. The benefit accrued during heavy rains in non- rainy (summer) season or during draught time will be worth mentioning. In such circumstances recharge will be at its peak stage. As a result all shallow open wells and ponds will get adequate quantity of water as huge relief for farmers and poor landless villagers.
In addition to rooftop rainwater harvesting, recharge pits will be planned by the industry and EMC authorities for rooftop harvesting. In the EMC area, recharge pits of 2.0 m diameter with a depth of 3.0 m will be constructed. The pit has to be back filled with a sequence of

Environmental Appraisal Questionnaire (EAQ) for Greenfield Electronic Manufacturing Cluster
Page F-4
boulders, gravel, pebbles and coarse sand from bottom to top. A constructed model recharge pit is shown in Exhibit F-3. A schematic diagram of the recharge pit is given in Exhibit F-4. It is recommended to dig a trial pit of 5.0 m before constructing the recharge pit. The site may be avoided if groundwater table is encountered within a depth range of 5 m.
Exhibit F-3: Model Recharge Pit (Source: Google)
Exhibit F-4: Schematic of Recharge Pit (Source: Google)
F.2.3.1 Recharge Wells-Typical Arrangements
Recharge wells are the structures to recharge water in the sub-surface levels directly to the aquifer. Gravity recharge wells in the vicinity of storage ponds are useful in recharging the deeper aquifer system.
A schematic design of the recharge well is presented in Exhibit F-5. The collected rain water in the pond may be diverted through well maintained channels, two desilting pits and two filter beds into each recharge well by gravity. From bottom of last filter bed, pipe carrying the recharge water may have to go down the recharge well up to piezometric surface.
Exhibit F-5: Schematic Diagram of Recharge Well
INLET
OUTLET FOR
EXCESS
WATER
SAN
D
BOULD
ERS

Environmental Appraisal Questionnaire (EAQ) for Greenfield Electronic Manufacturing Cluster
Page F-5
F.2.4 Rainwater Harvesting and Utilisation Plan
Based upon hydrogeological conditions of the project area, harvesting and recharge structures are proposed for rainwater harvesting and groundwater recharging. The proposed harvesting and recharge structures in EMC are:
Roof-top rainwater harvesting Storage ponds/tanks
Recharge pits Recharge shafts/wells
The flash flood water can be recharged directly to the deeper aquifer through recharge wells for enhancing the depleting resource and make it sustainable.
Rainwater which will be harvested from building roof-tops can be stored at higher level storage tanks below the roof-top level and be directly supplied by gravity flow to the points of demand without the process of pumping. This water can also be used as grey water for domestic flushing purposes. The overall rainwater that could be harvested by implementing rooftop rainwater harvesting is estimated to be about 6,57,480m3 in a year.
Harvested water should be sent through desilting and filter bed pits to allow silt-free water into the storage facilities. Dimensions of these structures may be maintained at 20m x 10m x 2m and proposed conservation structures (i.e. about 15 nos. are suggested) are expected to harvest and store at least about 6000 m3The overflow water during heavy rains can be diverted to outfalls through proposed storm water drainage.
F.2.5 Monitoring Wells for Impact Assessment
The effectiveness of artificial recharge structures is known by closely monitoring the groundwater levels of the phreatic and confined aquifer systems. Monitoring of the groundwater regime is done by establishing a network of observation wells tapping the shallow and deeper aquifer systems separately.
The phreatic aquifer can be monitored by measuring groundwater levels in the open dug wells or dedicated shallow water table wells. The existing dug wells may also be selected for monitoring. Piezometric surface in the deeper aquifer may have to be monitored by installing dedicated piezometers. Piezometer is a small diameter (38 mm) tube with a 2 to 3 m perforated pipe at the bottom lowered in a borehole (100 to 150 mm) drilled down into the confined aquifer. The perforated portion of the tube has to be positioned against the bottom of the confined aquifer with clean sorted gravel shrouded between the tube and the borehole surface. Rest of the borehole may be filled with unsorted gravel or clay.
The observation wells/piezometers are to be monitored at least four times in a year, i.e. in the months of January, May, August and November. Data collected from these wells, provide more meaningful record / database and clarity in the changes in the ground water regime in the Project area.
Digital water level recorders, which collect water level information automatically ranging in time from 1 hour to 1 month, provide accurate and valuable data for groundwater management. The recorder is an electronic device which is installed within the water column of the observation well. The device collects the groundwater level data at the desired interval of time and stores the digital data on board which can be retrieved through data retrieval systems or hand held computers and can be downloaded directly into office computers for further analysis. Groundwater chemical quality monitoring also can be done through these devices with appropriate add-on probes.

Annexure-G
Storm water drainage
Environmental Appraisal Questionnaire (EAQ) for Greenfield Electronic Manufacturing Cluster
Page G-1
Annexure G Storm water drainage Storm water drainage arrangement is proposed along road side to cater water from the road surface and adjoining land area of project site. Accordingly each road side drain runoff is arrived and connected to road side drain on downstream side, forming as grid type arrangement based on the natural slope (gravity flow) which has finally to be discharged into natural stream located south-eastern side of the project site. The surface and sub-surface drainage system is designed as per IRC SP: 42 and 50. A minimum longitudinal gradient of 0.3% is maintained in such a way that it attains the minimum self-cleaning velocity of storm water drains. Closed box, Open box and trapezoidal type storm water drain are proposed along both side of the new construction road in project site. The factors considered for the design of storm water drainage is as follows.
Storm drains are designed to route peak runoff generated by rainfall of IRC specified duration and recurrence interval. As per Section 10.11 of IRC SP: 42, design storm shall be taken for 25 years return period for National Highway. One hour rainfall data for 25 years return period in the project area has been considered as 101 mm as given in Fig 6.(b) of IRC SP: 42
The peak runoff or the peak discharge for the given area is found out by using the formula Q= 0.028 PAIc as per Section 10.4 of IRC SP 42: Where Q = Peak runoff rate cum/sec; P = Coefficient of runoff for catchment characteristics; A = Catchment area in hectares; Ic = Average rainfall intensity in cm/hr from intensity-duration frequency relationship for a specific return period and duration t in minutes.
Coefficient of runoff (P) for the given catchment area is not constant and it depends on porosity of soil, type of ground cover, catchment area, slope and initial state of wetness and duration of storm. The suggested values of ‘P’ used in Rational Formula as given in Table 2 of IRC SP: 42. The values of Co-efficient of runoff (P) have been considered for the project stretch: (i) Main Carriageway, Service Road and Paved Shoulder -0.9 (ii) Earthen Shoulder, Embankment and Ground Surfaces -0.3
The area of runoff catchment for each link road is considered as half of road width (from centre to drain location) and adjoining land width. Adjoining land width towards the drain location is considered as per grading plan
Time of concentration for surface flow of water (As per Section 4.4 of IRC SP: 50)
As per Section 10.10 of IRC SP: 42, the rainfall intensity for shorter durations of small catchments is estimated
Hydralic design: Minimum width of line drain – 0.25 m (As per section 4.9.3.c of IRC SP: 50)
Minimum free board required as given in the Section 4.9.3 of IRC SP: 50 are (i) Drain width Less than 300 mm bed width - 10 cm as Min FB; (ii) Drain width Beyond 300 mm and up to 900 mm bed width - 15 cmas Min FB; (iii) Drain width Beyond 900 mm and up to 1500 mm bed width - 30 cm as Min FB; and (iv) Drain width For Larger Drains - Up to 90 cmas Min FB
Manning’s coefficient (n) is considered as per Table 6 of IRC SP: 42 and the ‘n’ value adopted are (i) Open Box drain- 0.014; (ii) Trapezoidal pcc lined drain -0.014 and (iii) Closed Box drain - 0.014
As per Section 4.9.1 of IRC SP: 50, the velocity of drain is calculated using Manning’s equation. Minimum self-cleaning velocity (0.75 m/s) and allowable velocity (6.0 m/s) for

Environmental Appraisal Questionnaire (EAQ) for Greenfield Electronic Manufacturing Cluster
Page G-2
different drains are considered as given in section 4.9.3 of IRC SP: 50 and Table 6 of IRC SP: 42.
Capacity of the longitudinal box and trapezoidal open drain is normally designed using Manning’s equation as given in Section 11.2 of IRC SP: 42
The cross sectional elements of the culvert structures shall be provided in accordance with the requirements of MoRTH specifications
The storm water drain layout and drain schedule is shown in Figure G-1 respectively.

Environmental Appraisal Questionnaire (EAQ) for Greenfield Electronic Manufacturing Cluster
Page G-3
Figure G-1: Storm Water Drain Layout
Annexure-H
Common effluent treatment
plant details

Environmental Appraisal Questionnaire (EAQ) for Greenfield Electronic Manufacturing Cluster
Page H-1
Annexure H Common Effluent Treatment Plant Details with a write up
H.1 Wastewater Management
In the proposed EMC of 501.4 acres, approximately 52% of it will be industrial area. Adequate wastewater management system is primary requirement for hygienic environmental condition. So that sewerage system shall be adequately designed to carry the wastewater generated from the area and the industrial effluent collection system is proposed by tankers, primarily for the collection of industrial effluent from the cooling tower process units of the industries.
For the wastewater treatment Common Effluent Treatment Plant (CETP) of 2 MLD is proposed. Transport of process wastewater shall be by tankers only. The wastewater shall be received at the CETP and its pathway of treatment shall be arrived at based on the nature of the characteristics of the wastewater. Total length of the domestic wastewater collection network is 18.40 km of RCC NP2 and NP3 pipes. The diameter ranges from 200 mm to 300 mm. Details of the treatment plant is provided in the subsequent sections which comprises of an STP and two ETPs (ETP-I and EPT-II).
H.1.1.1 Wastewater Generation
Based on the demand, the following are the major consumers of water:
Cooling water makeup Water for human consumption Garden and Miscellaneous Process
Since the units shall be electronic and related type, many places there shall be requirement of clean and air-conditioned facilities. It has been considered that for total air conditioning, the refrigeration requirement shall be 6600 TR.
With a ΔT 8°C, and initial raw water TDS of 300 mg/L the cooling water requirement has been worked out at 1,000 kl per day (for makeup) of which 180 kl per day shall be discharged as blowdown water. The balance shall be lost by way of evaporation and drift.
About 80% of the raw water supplied for the domestic use at industries and hostel shall be generated as wastewater. Entire water used in gardens shall be lost as seepage/ percolation water.
The units are expected to use about 400 kl per day of water in the process. The quality of water used at the process could be raw water as such or high purity water depending on the requirement. About 360 kl per day of wastewater is expected to be generated from process.
The overall water demand for the EMC, the estimated quantity of wastewater generation from the various sources, the Horticulture water demand and the source of water for meeting the demands are given in below table.
Table H-1: Wastewater Generation Source Quantity (KLD)
Cooling tower blow down 180
Process 360
Sewage 1,416
Misc 60
Total 1,960
90% will be available for reuse 1,764

Environmental Appraisal Questionnaire (EAQ) for Greenfield Electronic Manufacturing Cluster
Page H-2
Source Quantity (KLD)
Say (KLD) 1,800
H.1.1.2 Sewerage System
In the sewage system convey the wastewater by gravity to a sewage treatment plant and wastewater from the industries is transported by the tankers to the effluent treatment plant.
It is proposed to maintain a self-cleansing velocity 0.8 m/s at design peak flow in sanitary sewer subject to minimum velocity of 0.6 m/s for present peak flow.
Erosion is caused by sand and other gritty material and is compounded by high velocities and hence the maximum velocity shall be limited to 3 m/s.
In order to ensure smooth flow for carrying peak discharge and easy cleaning, it is proposed to have minimum diameter of trunk sewer 250mm and branch sewer /lateral of 200mm. For property/plot connection 160mm UPVC HDPE pipe shall be used.
H.1.1.3 Sewage Treatment
Wastewater from the sanitary and domestic blocks at the industrial units, hostels and after common facilities and blow-down from the CT's (Cooling Towers) shall be conveyed to STP by gravity to the STP proposed to be located at the lowest point.
The total quantity of sewage + CT blow-down is estimated at 1600 KL/day. Since the development is in phased manner, it is proposed to have the STP in two equal modules of 800 KL/day each.
The preliminary units i.e., screens, grit trap and equalization tank shall be for the ultimate capacity. The aeration tank and the settling tank shall be provided in two equal modules catering to 800 KL/day. The STP shall have secondary and tertiary stage treatment. The tertiary treated sewage shall be mixed with the other wastes at the UF feed tank. The basic data considered for designing the sewage plant is as given below:
Sewage quantity: 1600 m3/day; Characteristics of raw sewage: The characteristics of the sewage considered for designing the STP are as given in Table H-2.
Table H-2: Expected characteristics of sewage and CT blowdown S. No. Parameter Concentration*
1 pH 6.5 - 9
2 TSS 200 - 300
3 TDiS 1200 - 1500
4 BOD 200 - 250
5 COD 400 - 500
6 Total N 30 - 40
7 Total P 3 to 5
* All parameters except pH expressed as mg/l
Characteristics of treated sewage: The expected characteristics of the treated sewage on adopting the scheme of treatment given under item 3 are as given in Table H-3.
Table H-3: Expected characteristics of treated sewage and CT blowdown S. No. Parameter Concentration*
1 pH 7.5 - 8.5
2 TSS < 10
3 TDiS 1200 - 1500
4 BOD < 20
5 COD < 200
Environmental Appraisal Questionnaire (EAQ) for Greenfield Electronic Manufacturing Cluster
Page H-3
* All parameters except pH expressed as mg/l
H.1.1.3.1 Proposed Scheme of Treatment of STP
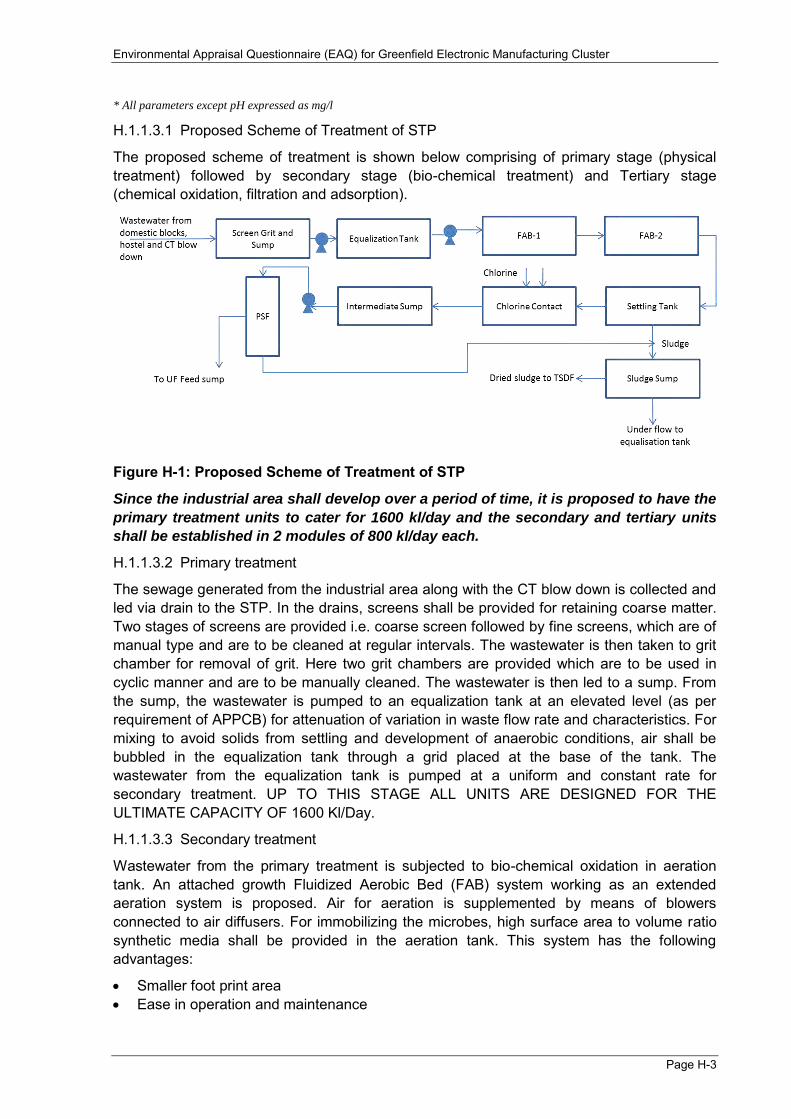
The proposed scheme of treatment is shown below comprising of primary stage (physical treatment) followed by secondary stage (bio-chemical treatment) and Tertiary stage (chemical oxidation, filtration and adsorption).
Figure H-1: Proposed Scheme of Treatment of STP
Since the industrial area shall develop over a period of time, it is proposed to have the
primary treatment units to cater for 1600 kl/day and the secondary and tertiary units
shall be established in 2 modules of 800 kl/day each.
H.1.1.3.2 Primary treatment
The sewage generated from the industrial area along with the CT blow down is collected and led via drain to the STP. In the drains, screens shall be provided for retaining coarse matter. Two stages of screens are provided i.e. coarse screen followed by fine screens, which are of manual type and are to be cleaned at regular intervals. The wastewater is then taken to grit chamber for removal of grit. Here two grit chambers are provided which are to be used in cyclic manner and are to be manually cleaned. The wastewater is then led to a sump. From the sump, the wastewater is pumped to an equalization tank at an elevated level (as per requirement of APPCB) for attenuation of variation in waste flow rate and characteristics. For mixing to avoid solids from settling and development of anaerobic conditions, air shall be bubbled in the equalization tank through a grid placed at the base of the tank. The wastewater from the equalization tank is pumped at a uniform and constant rate for secondary treatment. UP TO THIS STAGE ALL UNITS ARE DESIGNED FOR THE ULTIMATE CAPACITY OF 1600 Kl/Day.
H.1.1.3.3 Secondary treatment
Wastewater from the primary treatment is subjected to bio-chemical oxidation in aeration tank. An attached growth Fluidized Aerobic Bed (FAB) system working as an extended aeration system is proposed. Air for aeration is supplemented by means of blowers connected to air diffusers. For immobilizing the microbes, high surface area to volume ratio synthetic media shall be provided in the aeration tank. This system has the following advantages:
Smaller foot print area Ease in operation and maintenance

Environmental Appraisal Questionnaire (EAQ) for Greenfield Electronic Manufacturing Cluster
Page H-4
Operator skills required are minimal System less susceptible to upset conditions (shock loading, power failure, etc.) Lower energy requirements No clogging or chocking of the media.
Following bio-chemical oxidation, the wastewater from the aeration tank is taken to a tube-deck (secondary settling tank) for solid-liquid separation. The sludge collected in the hopper bottom of the settling tank is periodically withdrawn and applied to the sludge drying beds for dewatering and drying. The underflow of the sludge drying beds is sent back to the equalization tank.
H.1.1.3.4 Tertiary treatment
Overflow from the settling tank is subjected to tertiary treatment. The first stage is chemical oxidation tank for chemically oxidizing the residual contaminants. Chlorine as sodium hypo chlorite shall be added for chemical oxidation. For adequate contact time a chlorine contact chamber with 30 minutes detention time and mixing arrangement (baffle walls) is proposed. The wastewater from chlorine contact chamber is then collected in an intermediate sump and pumped to a pressure sand filter for removal of particulate matter. The wastewater is then taken through an activated carbon column for removal of trace organics and pollutants (chlorine, colour, trace organics, etc.). The backwash of the pressure sand filters and activated carbon column are taken to sludge drying beds.
The overflow of the carbon filter is taken to the UF sump at the main ETP for further treatment and recovery of water for reuse.
The above 2 stages are designed in 2 modules. One module will be established now
and the other module in due course of time as and when the occupancy of the park
reaches beyond 50%.
H.1.1.3.5 Salient features of the proposed system
The following are the salient features of the system being proposed:
The entire plant is virtually maintenance free No special operational skills (sludge recycles, etc.) are required Total area required is minimum The system is rugged and is easy to operate and maintain System has been optimally designed At all critical points stand-by provision has been made
H.1.1.4 ETP-I
ETP-I is designed for:
a) Exhausted process bath solutions b) Wastewater from Electro-plating (reuse water and exhausted process bath solutions)
To cater for most needs, a 2 stage reaction followed by settling is provided. This plant can cater to fluoride bearing wastewater, chromium bearing wastewater, cyanide bearing wastewater and other wastewater streams.
H.1.1.4.1 Proposed Scheme of Treatment of ETP-I
Proposed scheme of treatment is shown in Figure H-2.
Environmental Appraisal Questionnaire (EAQ) for Greenfield Electronic Manufacturing Cluster
Page H-5
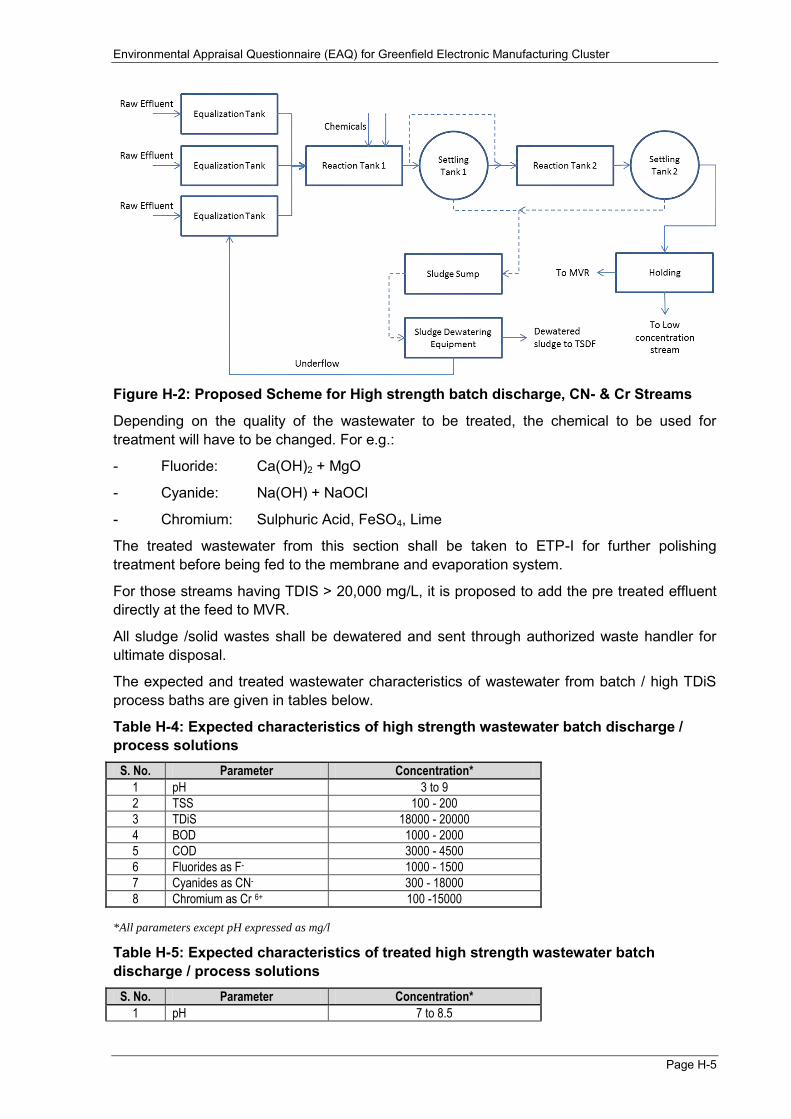
Figure H-2: Proposed Scheme for High strength batch discharge, CN- & Cr Streams
Depending on the quality of the wastewater to be treated, the chemical to be used for treatment will have to be changed. For e.g.:
- Fluoride: Ca(OH)2 + MgO
- Cyanide: Na(OH) + NaOCl
- Chromium: Sulphuric Acid, FeSO4, Lime
The treated wastewater from this section shall be taken to ETP-I for further polishing treatment before being fed to the membrane and evaporation system.
For those streams having TDIS > 20,000 mg/L, it is proposed to add the pre treated effluent directly at the feed to MVR.
All sludge /solid wastes shall be dewatered and sent through authorized waste handler for ultimate disposal.
The expected and treated wastewater characteristics of wastewater from batch / high TDiS process baths are given in tables below.
Table H-4: Expected characteristics of high strength wastewater batch discharge / process solutions
S. No. Parameter Concentration*
1 pH 3 to 9
2 TSS 100 - 200
3 TDiS 18000 - 20000
4 BOD 1000 - 2000
5 COD 3000 - 4500
6 Fluorides as F- 1000 - 1500
7 Cyanides as CN- 300 - 18000
8 Chromium as Cr 6+ 100 -15000
*All parameters except pH expressed as mg/l
Table H-5: Expected characteristics of treated high strength wastewater batch discharge / process solutions
S. No. Parameter Concentration*
1 pH 7 to 8.5
Environmental Appraisal Questionnaire (EAQ) for Greenfield Electronic Manufacturing Cluster
Page H-6
S. No. Parameter Concentration*
2 TSS < 50
3 TDiS 18000 - 20000
4 BOD 20 - 30
5 COD 200 - 250
6 Fluorides as F- < 100
7 Cyanides as CN - < 2
8 Chromium as Cr 6+ < 2
*All parameters except pH expressed as mg/l
H.1.1.5 ETP-II
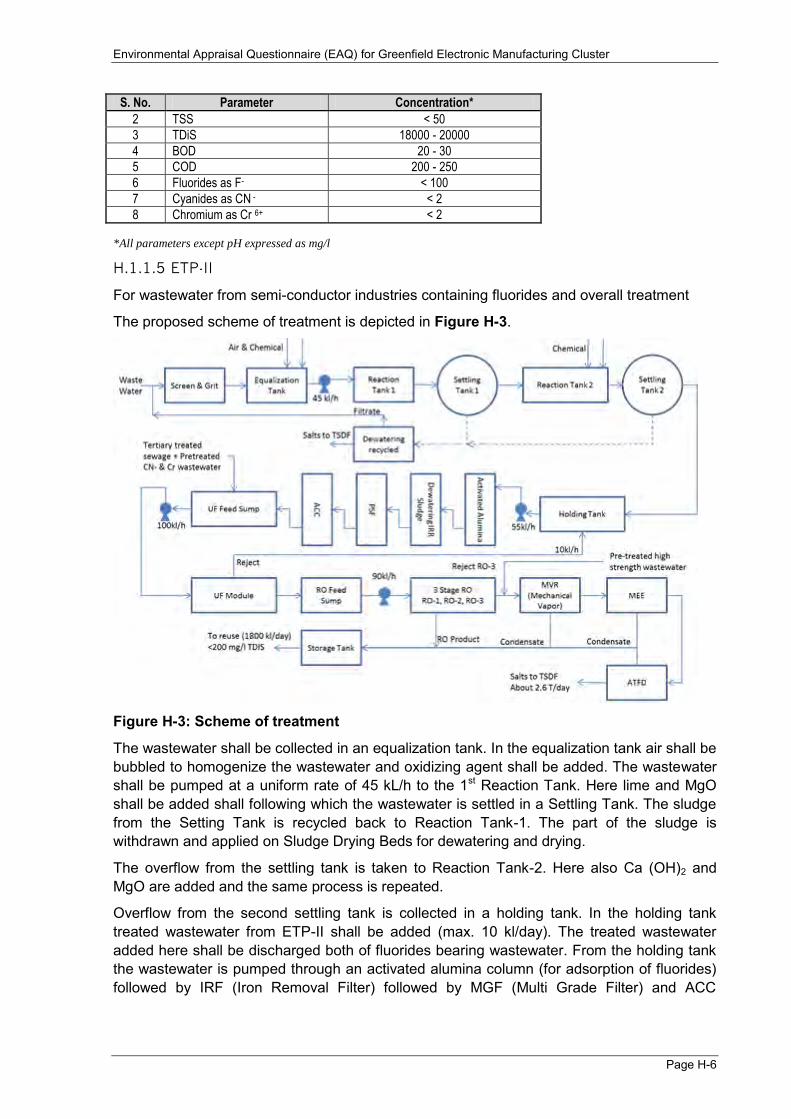
For wastewater from semi-conductor industries containing fluorides and overall treatment
The proposed scheme of treatment is depicted in Figure H-3.
Figure H-3: Scheme of treatment
The wastewater shall be collected in an equalization tank. In the equalization tank air shall be bubbled to homogenize the wastewater and oxidizing agent shall be added. The wastewater shall be pumped at a uniform rate of 45 kL/h to the 1st Reaction Tank. Here lime and MgO shall be added shall following which the wastewater is settled in a Settling Tank. The sludge from the Setting Tank is recycled back to Reaction Tank-1. The part of the sludge is withdrawn and applied on Sludge Drying Beds for dewatering and drying.
The overflow from the settling tank is taken to Reaction Tank-2. Here also Ca (OH)2 and MgO are added and the same process is repeated.
Overflow from the second settling tank is collected in a holding tank. In the holding tank treated wastewater from ETP-II shall be added (max. 10 kl/day). The treated wastewater added here shall be discharged both of fluorides bearing wastewater. From the holding tank the wastewater is pumped through an activated alumina column (for adsorption of fluorides) followed by IRF (Iron Removal Filter) followed by MGF (Multi Grade Filter) and ACC

Environmental Appraisal Questionnaire (EAQ) for Greenfield Electronic Manufacturing Cluster
Page H-7
(Activated Carbon Column). The expected characteristics of low strength wastewater before and after treatment are given in tables below.
Table H-6: Expected characteristics of low strength wastewater semi-conductor and electroplating
S. No. Parameter Concentration*
1 pH 6.5 - 9
2 TSS 100 - 200
3 TDiS < 2000
4 BOD 20- 30
5 COD 80- 100
6 Fluorides as F- < 110
7 Cyanides as CN- < 3
8 Chromium as Cr 6+ < 3
*All parameters except pH expressed as mg/l
Table H-7: Condensate Water Quality S. No. Parameter MVR MEE ATFD
1 Flow 36kl/day 9kl/day 5kl/day
2 TDiS 200-300 300-400 400-600
3 BOD <5 <5 <5
4 COD <10 <20 <20
Table H-8: Expected characteristics of treated low strength wastewater semi-conductor and electroplating
S. No. Parameter Concentration*
1 pH 7 to 8.5
2 TSS <10
3 TDiS <2000
4 Fluorides as F- <1.5
5 Cyanides as CN- <0 .5
6 Chromium as Cr 6+ <0.5
*All parameters except pH expressed as mg/l
Following ACC the water is collected in a tank (UF feed tank). Treated wastewater from ETP-II (non-fluoride bearing wastewater) is added at the UF feed tank. The treated wastewater (sewage + boiler blowdown) is also added at the UF feed tank.
The total wastewater to be treated at this junction shall be maximum 1,970 kl per day (360 from ETP-I, 10 kl from ETP-II and 1600 kl from STP).
The UF shall be designed for 20 hours operation per day with 90% recovery. The UF capacity shall be to handle 100 kl/hour. The reject from UF shall be taken back to holding tank prior to activate alumina column. The quality of water before and after UF is given in Table H-9.
Table H-9: Water Quality – UF Feed and Product
S. No. Parameter UF*
Inlet Outlet
1 pH 7 - 8 7 - 8
2 TSS <20 <1.0
3 TDiS <2000 <2000
4 BOD (5 day @ 20oC) <20 <5
5 COD <100 <20 *All parameters except pH expressed as mg/l
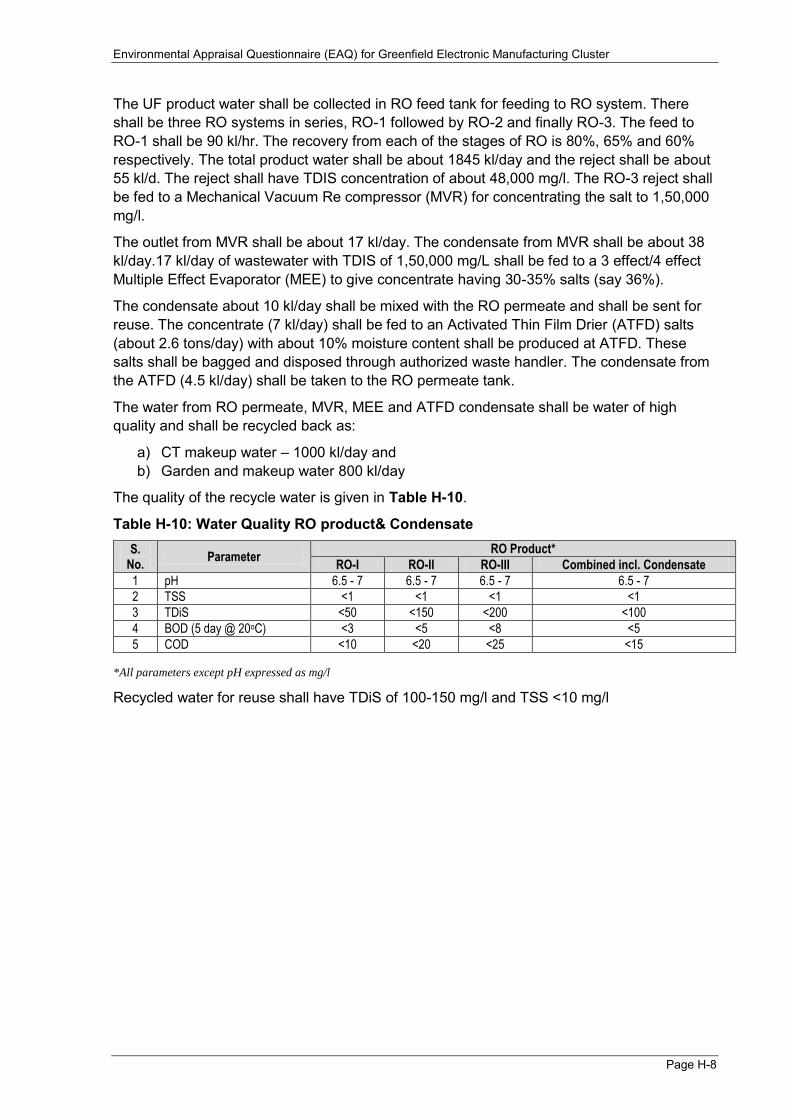
Environmental Appraisal Questionnaire (EAQ) for Greenfield Electronic Manufacturing Cluster
Page H-8
The UF product water shall be collected in RO feed tank for feeding to RO system. There shall be three RO systems in series, RO-1 followed by RO-2 and finally RO-3. The feed to RO-1 shall be 90 kl/hr. The recovery from each of the stages of RO is 80%, 65% and 60% respectively. The total product water shall be about 1845 kl/day and the reject shall be about 55 kl/d. The reject shall have TDIS concentration of about 48,000 mg/l. The RO-3 reject shall be fed to a Mechanical Vacuum Re compressor (MVR) for concentrating the salt to 1,50,000 mg/l.
The outlet from MVR shall be about 17 kl/day. The condensate from MVR shall be about 38 kl/day.17 kl/day of wastewater with TDIS of 1,50,000 mg/L shall be fed to a 3 effect/4 effect Multiple Effect Evaporator (MEE) to give concentrate having 30-35% salts (say 36%).
The condensate about 10 kl/day shall be mixed with the RO permeate and shall be sent for reuse. The concentrate (7 kl/day) shall be fed to an Activated Thin Film Drier (ATFD) salts (about 2.6 tons/day) with about 10% moisture content shall be produced at ATFD. These salts shall be bagged and disposed through authorized waste handler. The condensate from the ATFD (4.5 kl/day) shall be taken to the RO permeate tank.
The water from RO permeate, MVR, MEE and ATFD condensate shall be water of high quality and shall be recycled back as:
a) CT makeup water – 1000 kl/day and b) Garden and makeup water 800 kl/day
The quality of the recycle water is given in Table H-10.
Table H-10: Water Quality RO product& Condensate S.
No. Parameter
RO Product*
RO-I RO-II RO-III Combined incl. Condensate
1 pH 6.5 - 7 6.5 - 7 6.5 - 7 6.5 - 7
2 TSS <1 <1 <1 <1
3 TDiS <50 <150 <200 <100
4 BOD (5 day @ 20oC) <3 <5 <8 <5
5 COD <10 <20 <25 <15
*All parameters except pH expressed as mg/l
Recycled water for reuse shall have TDiS of 100-150 mg/l and TSS <10 mg/l

Annexure-I
Statement on the machinery &
manpower during
construction

Environmental Appraisal Questionnaire (EAQ) for Greenfield Electronic Manufacturing Cluster
Page I-1
Annexure I Statement on the machinery & manpower during construction
Machinery will be used for
Site clearance and use of heavy vehicles and machinery Transport of raw materials, borrow and quarry material to construction site Earthworks Handling and storage of aggregates Asphalt mixing plant operations
During the construction phase of the project there will be large-scale employment generation (around 1000 personnel) in the form of skilled and semi-skilled labours. Also, majority of the works will be sub-contracted. As the construction period is anticipated to span nearly 24 months, temporary workers camps is planned to be set up for semi-skilled labourers in the project area.
.

Annexure-J
Fire protection measures

Environmental Appraisal Questionnaire (EAQ) for Greenfield Electronic Manufacturing Cluster
Page J-1
Annexure J Fire protection measures & approvals obtained J.1 Fire Protection Facilities Proposed EMC product verticals and focused horizontal Industries are prone to hazards including fire, In order to provide the best facilities to fight the hazards related to fire, the following fire protection services with automated response system are conceived:
Dedicated firefighting water network
Fire stations strategically located within the cluster
In addition to this, the statutory requirements (as per Development Control Rules) for firefighting provisions within individual industrial plots to be enforced as a part of the development guidelines. As per this, each industrial unit should have storage tank + fire pumps + hydrants.
Fire mitigation system consists of Fire station (1,000 sft), fire fighting facilities, fire water storage and Distribution system is proposed as part of essential services in EMC. A total of 114 numbers of fire hydrants are proposed at 45 m distance on water lines along major roads only (45m & 30m).
J.1.1.1 Fire Detection and Alarm System
Fire detection and alarm system can be provided for the entire area which will be microprocessor based Intelligent Analog Addressable type. The system will consist of central monitoring station located in unit control room. A comprehensive fire detection and protection system will be envisaged for the complete power station. This system will generally conform to the recommendations of TAC and NFPA (latest edition).
J.1.1.2 Automated Response System
An automated firefighting system for the cluster is conceived to respond to fire outbreak without any delay in response time. The automated system mainly includes means of detection, actuation and delivery. The fire detectors could be operated mechanical or electrical means as explained below:
Mechanical detection uses fusible-link or thermo bulb detectors that are designed to separate at specific temperatures and thus actuate alarm system
Electrical detection uses heat detectors equipped with self-restoring, normally open contacts which close when a predetermined temperature is reached. These detectors are connected to alarm systems which activate the delivery system.
The fire detectors along with an alarming system shall continuously monitor facilities throughout the project site in case of a fire outbreak. The fire detection devices (smoke detector, thermal detector, infrared flame detector, manual alarm, limit switch, flow switch, etc.) to be placed at identified locations. Signals are then transferred by local fire control panels to the main fire control. The main control room/ fire stations are alerted of the need for fire-fighting or evacuation efforts once the signal has been processed by software in the main fire control panel.
The delivery system is accomplished by means of piping and nozzles or sprinkler system. Though commonly water is used as the exclusive fire suppression agent, it still has its limitations. Different extinguisher types along with water and firefighting media are given in the Table J-1.
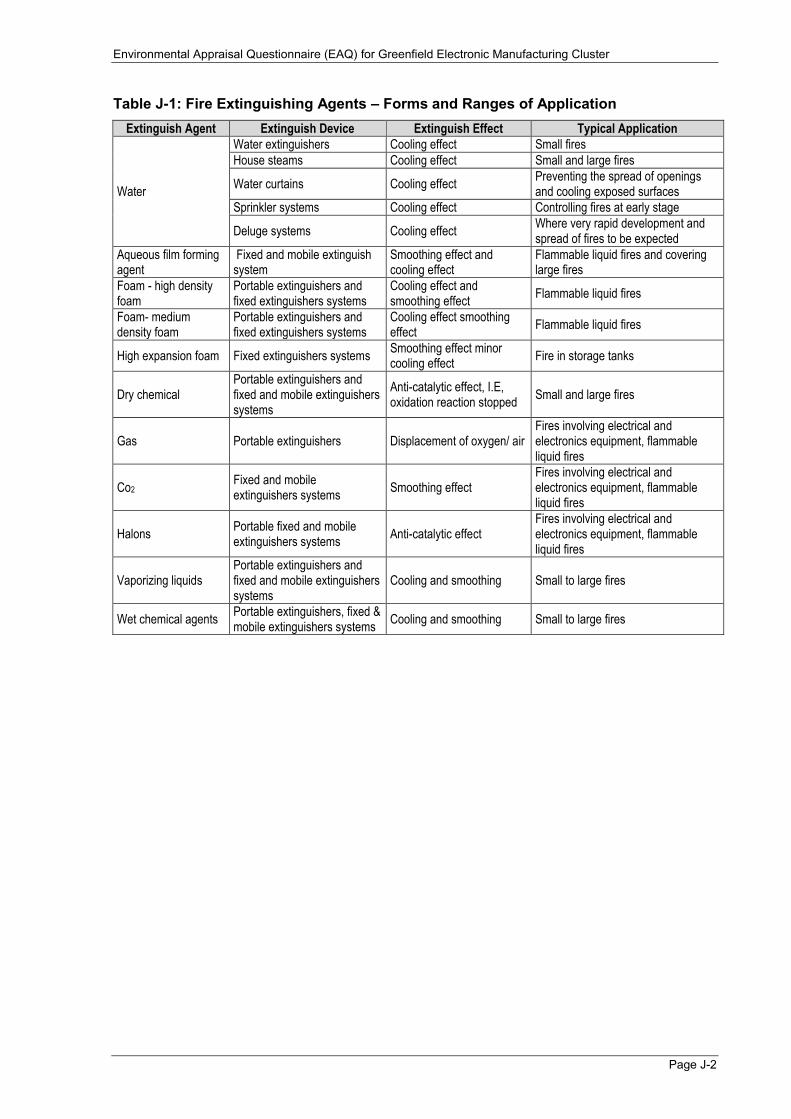
Environmental Appraisal Questionnaire (EAQ) for Greenfield Electronic Manufacturing Cluster
Page J-2
Table J-1: Fire Extinguishing Agents – Forms and Ranges of Application Extinguish Agent Extinguish Device Extinguish Effect Typical Application
Water
Water extinguishers Cooling effect Small fires
House steams Cooling effect Small and large fires
Water curtains Cooling effect Preventing the spread of openings and cooling exposed surfaces
Sprinkler systems Cooling effect Controlling fires at early stage
Deluge systems Cooling effect Where very rapid development and spread of fires to be expected
Aqueous film forming agent
Fixed and mobile extinguish system
Smoothing effect and cooling effect
Flammable liquid fires and covering large fires
Foam - high density foam
Portable extinguishers and fixed extinguishers systems
Cooling effect and smoothing effect
Flammable liquid fires
Foam- medium density foam
Portable extinguishers and fixed extinguishers systems
Cooling effect smoothing effect
Flammable liquid fires
High expansion foam Fixed extinguishers systems Smoothing effect minor cooling effect
Fire in storage tanks
Dry chemical Portable extinguishers and fixed and mobile extinguishers systems
Anti-catalytic effect, I.E, oxidation reaction stopped
Small and large fires
Gas Portable extinguishers Displacement of oxygen/ air Fires involving electrical and electronics equipment, flammable liquid fires
Co2 Fixed and mobile extinguishers systems
Smoothing effect Fires involving electrical and electronics equipment, flammable liquid fires
Halons Portable fixed and mobile extinguishers systems
Anti-catalytic effect Fires involving electrical and electronics equipment, flammable liquid fires
Vaporizing liquids Portable extinguishers and fixed and mobile extinguishers systems
Cooling and smoothing Small to large fires
Wet chemical agents Portable extinguishers, fixed & mobile extinguishers systems
Cooling and smoothing Small to large fires
Annexure-K
Proceedings of environment
public hearing & responses
to points raised in public
hearing
Environmental Appraisal Questionnaire (EAQ) for Greenfield Electronic Manufacturing Cluster
Page K-1
Annexure K Proceedings of Environment Public Hearing also provide response to points raised in the public hearing
K.1 Public Hearing Minutes of Meeting
As a part of compliance to SEAC, SEIAA suggested ToR, Public Hearing for development of Greenfield Electronic Manufacturing Cluster was conducted at the project site, Vikruthamala village, Yerpedu mandal, Chittoor district, Andhra Pradesh. For conducting Public Hearing, the Draft EIA Report was prepared in accordance to EAC, SEIAA approved ToR and Executive summaries in English and Local (Telugu) languages were submitted to Andhra Pradesh Pollution Control Board (APPCB). The Public Hearing was conducted on March 15, 2017 by APPCB. The meeting was conducted by the panel consisting of Sri. Siddartha Jain (IAS), the Collector & the District Magistrate, Chittoor District (Chairman of the Environmental Public Hearing Panel), Sri. Nishanth Kumar (IAS), Sub-Collector, Tirupati Chittoor district, Sri. A. Narendra Babu, Member Convener & Environment Engineer APPCB, Regional Office (RO), Tirupati and other officials APPCB, RO, Tirupati. It was attended by the local public and public representatives. The proceeding of Public Hearing issued by APPCB is given as below.

Environmental Appraisal Questionnaire (EAQ) for Greenfield Electronic Manufacturing Cluster
Page K-2

Environmental Appraisal Questionnaire (EAQ) for Greenfield Electronic Manufacturing Cluster
Page K-3
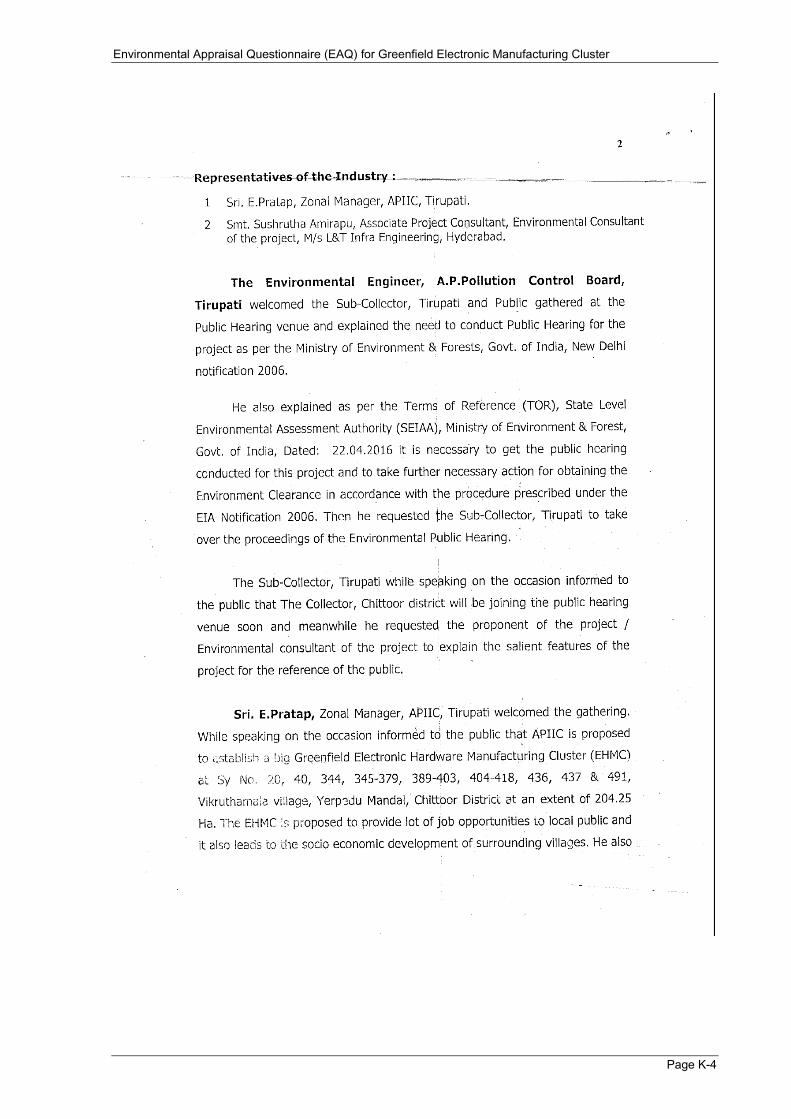
Environmental Appraisal Questionnaire (EAQ) for Greenfield Electronic Manufacturing Cluster
Page K-4
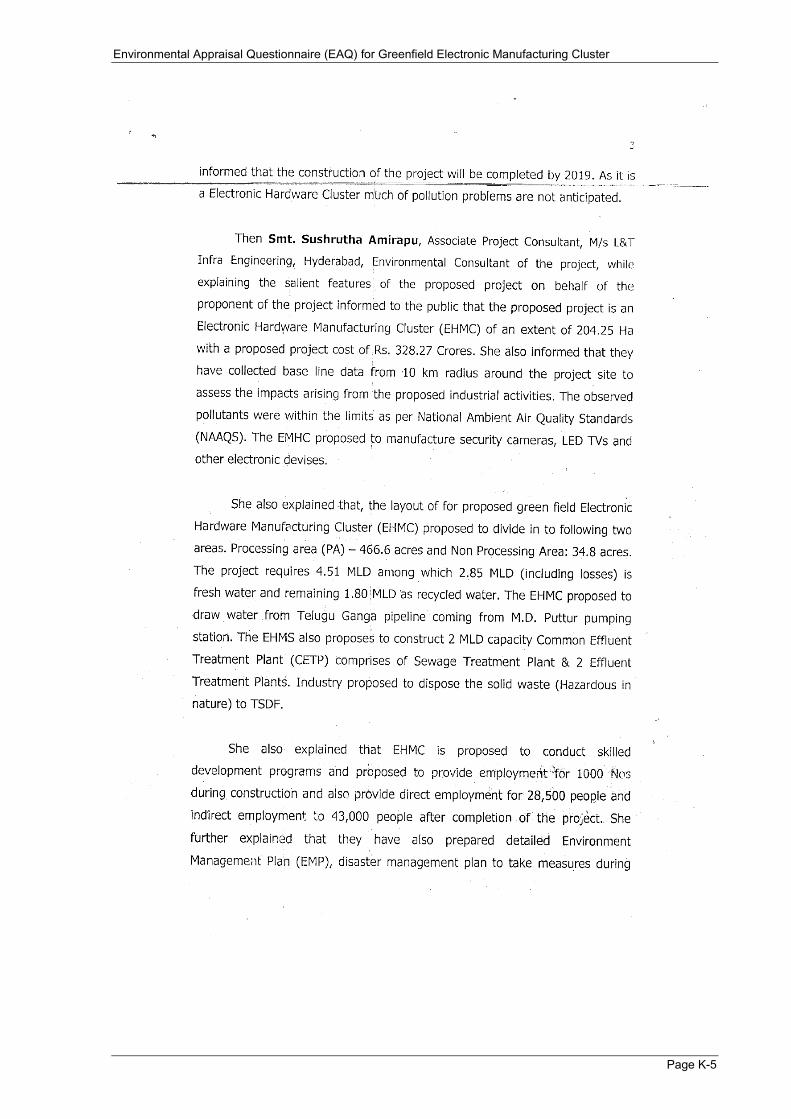
Environmental Appraisal Questionnaire (EAQ) for Greenfield Electronic Manufacturing Cluster
Page K-5

Environmental Appraisal Questionnaire (EAQ) for Greenfield Electronic Manufacturing Cluster
Page K-6

Environmental Appraisal Questionnaire (EAQ) for Greenfield Electronic Manufacturing Cluster
Page K-7

Environmental Appraisal Questionnaire (EAQ) for Greenfield Electronic Manufacturing Cluster
Page K-8

Environmental Appraisal Questionnaire (EAQ) for Greenfield Electronic Manufacturing Cluster
Page K-9

Environmental Appraisal Questionnaire (EAQ) for Greenfield Electronic Manufacturing Cluster
Page K-10
K.2 Public Hearing Advertisement
K.3 Responses to the Points raised in the Public Hearing
Detailed point wise response to each issue raised during Public Hearing and replies for written representations are given in Table K-1. Public Hearing photographs are shown in Exhibit K-1 to Exhibit K-8.
Exhibit K-1:Arrangements at Public Hearing Venue Exhibit K-2: Crowd at the Public Hearing

Environmental Appraisal Questionnaire (EAQ) for Greenfield Electronic Manufacturing Cluster
Page K-11
Exhibit K-3: Proponent and Consultant Explaining Salient Features of the Project
Exhibit K-4: Representative from one of the Member Industry explaining the Benefits
Exhibit K-5: Stakeholder presenting concerns-I Exhibit K-6: Stakeholder presenting concerns-II
Exhibit K-7: Stakeholder presenting concerns-III Exhibit K-8: Stakeholder presenting concerns-IV
Table K-1: Response for Public Hearing Minutes of Meeting
Date of Public Hearing: March 15, 2017; Place of Public Hearing: Near the Proposed Project Site, Vikruthamala village, Yerpedu mandal, Chittoor district, Andhra Pradesh
S. No. Name and Place of
Public Hearing Public View or Comments Responses of APIIC
1.
Sri R. Mallikarjuna Naidu, Surpanch, Madibaka village
While speaking on the occasion expressed his un-happiness on the land compensation issues. The Government has not paid compensation to majority of the land losers. He also expressed his un-happiness on the job opportunities provided to the local public in the recently
The District Collector and Magistrate and also the chairman of the Environmental Public Hearing panel have informed that the compensation issues are being resolved. He also informed that the land compensation issues are being reviewed once in two
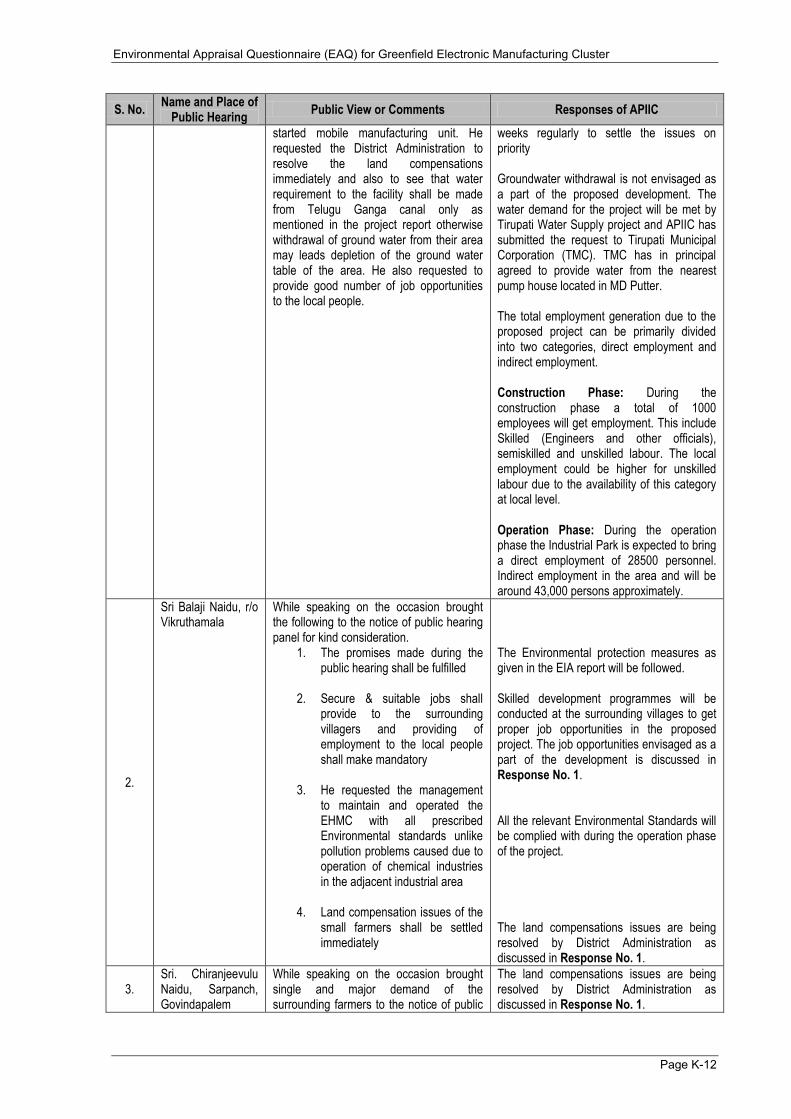
Environmental Appraisal Questionnaire (EAQ) for Greenfield Electronic Manufacturing Cluster
Page K-12
S. No. Name and Place of
Public Hearing Public View or Comments Responses of APIIC
started mobile manufacturing unit. He requested the District Administration to resolve the land compensations immediately and also to see that water requirement to the facility shall be made from Telugu Ganga canal only as mentioned in the project report otherwise withdrawal of ground water from their area may leads depletion of the ground water table of the area. He also requested to provide good number of job opportunities to the local people.
weeks regularly to settle the issues on priority Groundwater withdrawal is not envisaged as a part of the proposed development. The water demand for the project will be met by Tirupati Water Supply project and APIIC has submitted the request to Tirupati Municipal Corporation (TMC). TMC has in principal agreed to provide water from the nearest pump house located in MD Putter. The total employment generation due to the proposed project can be primarily divided into two categories, direct employment and indirect employment. Construction Phase: During the construction phase a total of 1000 employees will get employment. This include Skilled (Engineers and other officials), semiskilled and unskilled labour. The local employment could be higher for unskilled labour due to the availability of this category at local level. Operation Phase: During the operation phase the Industrial Park is expected to bring a direct employment of 28500 personnel. Indirect employment in the area and will be around 43,000 persons approximately.
2.
Sri Balaji Naidu, r/o Vikruthamala
While speaking on the occasion brought the following to the notice of public hearing panel for kind consideration.
1. The promises made during the public hearing shall be fulfilled
2. Secure & suitable jobs shall
provide to the surrounding villagers and providing of employment to the local people shall make mandatory
3. He requested the management to maintain and operated the EHMC with all prescribed Environmental standards unlike pollution problems caused due to operation of chemical industries in the adjacent industrial area
4. Land compensation issues of the
small farmers shall be settled immediately
The Environmental protection measures as given in the EIA report will be followed. Skilled development programmes will be conducted at the surrounding villages to get proper job opportunities in the proposed project. The job opportunities envisaged as a part of the development is discussed in Response No. 1. All the relevant Environmental Standards will be complied with during the operation phase of the project. The land compensations issues are being resolved by District Administration as discussed in Response No. 1.
3. Sri. Chiranjeevulu Naidu, Sarpanch, Govindapalem
While speaking on the occasion brought single and major demand of the surrounding farmers to the notice of public
The land compensations issues are being resolved by District Administration as discussed in Response No. 1.

Environmental Appraisal Questionnaire (EAQ) for Greenfield Electronic Manufacturing Cluster
Page K-13
S. No. Name and Place of
Public Hearing Public View or Comments Responses of APIIC
hearing panel is that non-payment of land compensation to the local farmers and it is made only 40 to 45 % and the payment for remaining farmers is still pending with the Government. He also requested to provide secure & suitable jobs to the local public
4. Smt. Kamakshi, r/o Vikruthamala
Made a request that all the compensation issues shall be settled immediately without causing any delay
The land compensations issues are being resolved by District Administration as discussed in Response No. 1.

Annexure-L
Approvals of competent
authorities in case of
conversion of agriculture
land, change in land use, dc
rules

Environmental Appraisal Questionnaire (EAQ) for Greenfield Electronic Manufacturing Cluster
Page L-1
Annexure L Approval of competent authorities in case of conversion of agriculture land, change of land use, DC Rules – Letter form TUDA

Annexure-M
Construction schedule
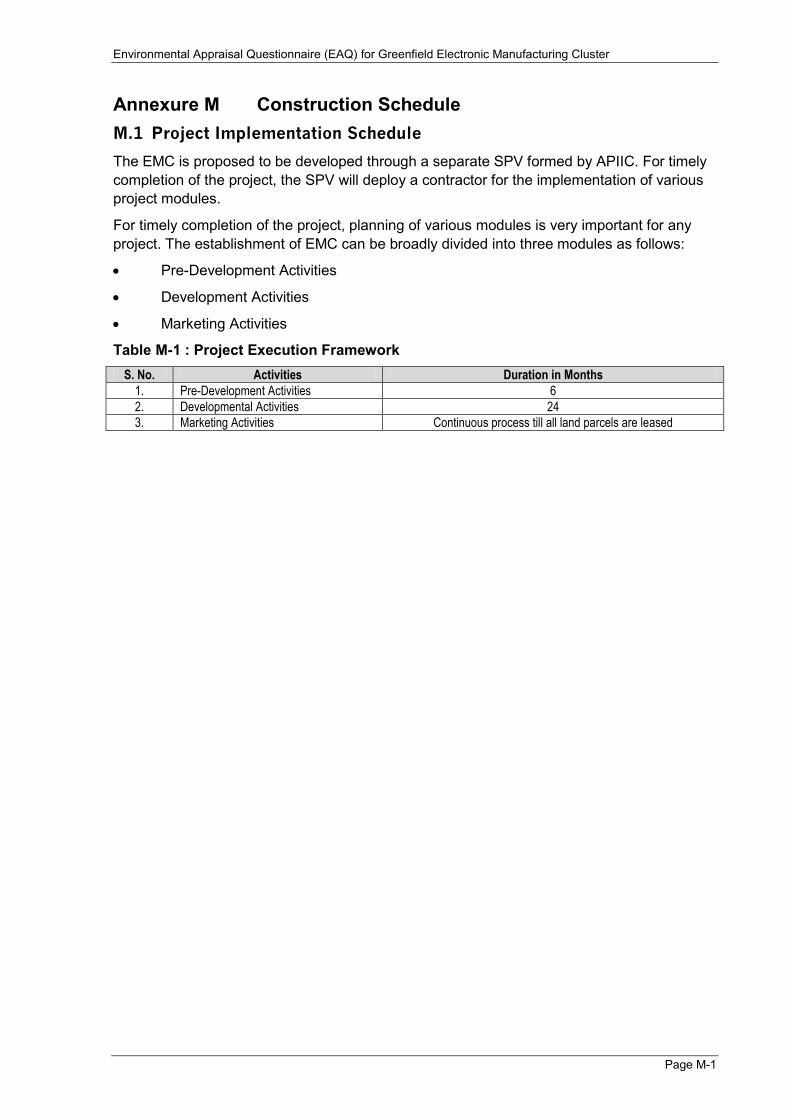
Environmental Appraisal Questionnaire (EAQ) for Greenfield Electronic Manufacturing Cluster
Page M-1
Annexure M Construction Schedule M.1 Project Implementation Schedule
The EMC is proposed to be developed through a separate SPV formed by APIIC. For timely completion of the project, the SPV will deploy a contractor for the implementation of various project modules.
For timely completion of the project, planning of various modules is very important for any project. The establishment of EMC can be broadly divided into three modules as follows:
Pre-Development Activities
Development Activities
Marketing Activities
Table M-1 : Project Execution Framework S. No. Activities Duration in Months
1. Pre-Development Activities 6
2. Developmental Activities 24
3. Marketing Activities Continuous process till all land parcels are leased
Annexure-N
Approvals from special
bodies (state industries
commissioner/sidc/financial
institutions)

Environmental Appraisal Questionnaire (EAQ) for Greenfield Electronic Manufacturing Cluster
Page N-1
Annexure N Approvals from special bodies (State Industries Commissioner/SIDC/financial institutions)
N.1 In principle approval letter for EMC from MoC&IT
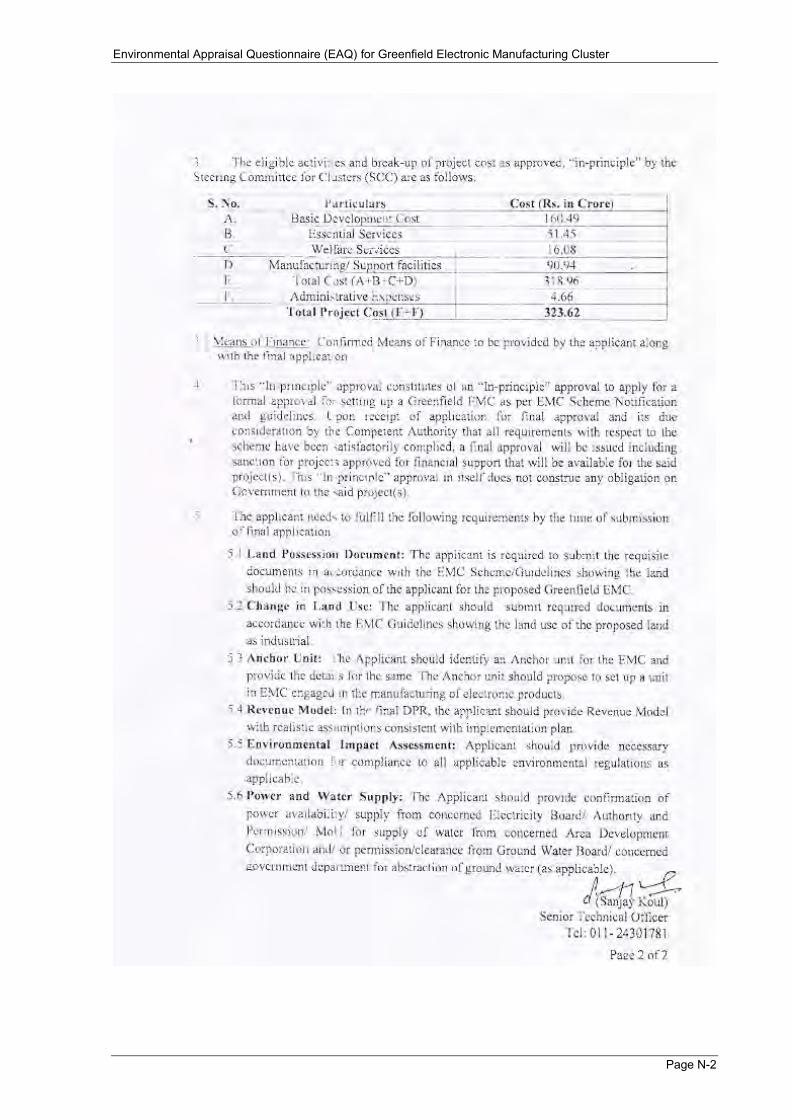
Environmental Appraisal Questionnaire (EAQ) for Greenfield Electronic Manufacturing Cluster
Page N-2
Annexure-o
Solid waste collection,
treatment, storage,
transportation and disposal
plan

Environmental Appraisal Questionnaire (EAQ) for Greenfield Electronic Manufacturing Cluster
Page O-1
Annexure O Solid waste collection, treatment, storage, transportation and disposal plan
O.1 Solid Waste Management
Municipal wastes in the form of canteen wastes, domestic wastes, papers, etc. will be generated. Disposal of municipal solid waste will be carried out as per prevailing norms. The quantity of municipal solid waste generated from canteen and administrative areas is estimated about 14.25 TPD, of which 60% will be bio-degradable and 40% non-biodegradable. The municipal waste generated will be given to the Municipal authorities.
Used oil/Spent oil & Used Battery, Containers/Barrels/liners Contaminated with HW/Chemicals and Sludge from oil water separator will be collected and disposed to APPCB approved vendors. Hazardous wastes, if any will be handled as per Hazardous Waste Management Rules (as amended). Hazardous wastes will be disposed through approved APPCB vendors. The detail of Hazardous waste expected during EMC Operations is given in Table O-1. Over and above all the individual units shall obtain respective Consent from APPCB to handle their Hazardous wastes.
Table O-1: List of Hazardous Wastes
S. No.
Details of Unit Process generating Hazardous Waste as listed in column 2 of
Schedule -1
Details of waste stream as
indicated in column 3 of Schedule -1
Solid/Semi solid/liquid oily Tarry
Slurry Others
Tentative Quantity
generated/ handled/
year
Waste Management
proposed Possible Source
1. 5-Industrial operations using mineral/synthetic oil as lubricant in hydraulic systems
5.1 Used Oil Liquid/Oily 500 L/Year Collection, Storage, and sold out to registered recycler
From Lube Oil for Equipment’s, pumps, Vehicles other machineries
2. 5-Industrial operations using mineral/synthetic oil as lubricant in hydraulic systems
5.2 Wastes/ Residue containing Oil /Oil Soaked rags/Cotton Waste
Solid/Others 0.5 MT/year
Collection, Storage and Transport to APPCB/CPCB approved/authorized waste handler
From Workshops and maintenance of equipment, pumps, conveyors, minor spill clean ups, etc.,
3. 21-Production and / or Industrial use of paints, Pigments, Lacquers, varnishes, plastic and Inks.
21.1 Waste and Residues
Solid & Slurry
100 Kg/year
Collection, Storage and Transport to APPCB/CPCB approved/authorized waste handler.
From industrial structures paintings.
4. 33-Disposal of barrels /containers using used for handling hazardous waste/chemicals
33.3 Discarded Containers/barrels/liners/gunny Bags contaminated with hazardous waste/chemicals
Solid 500 Nos./Year
Collection, Storage and Transport to APPCB/CPCB approved/authorized waste handler
Waste from Water and Wastewater treatment chemicals
5. E Waste such as Wiring/Electrical, CRT, LCD, Fluorescent Lamps, Incandescent Lamp, Batteries, remains of electronic components/products manufacturing etc.,
Solid LS Collection, Storage and Transport to authorized Recyclers.
Industrial Use and manufacturing of f E Waste Components
Annexure-P
Vehicle parking and
management

Environmental Appraisal Questionnaire (EAQ) for Greenfield Electronic Manufacturing Cluster
Page P-1
Annexure P Vehicle Parking and Management P.1 Internal Roads
Following are considered during the planning stage of Internal Roads:
The design philosophy for road pavement and bridges / structures is based on IRC prescribed for design, execution, maintenance and safety during construction and service with latest additions and amendments
The project site is located in plain terrain (cross slope of ground – 0 to 5%). The design speed of the proposed internal road & external road is considered as 40 km
per hour & 50 km per hour respectively for the aspect of safety consideration. The proposed internal road network plan is designed as per IRC 86-1983: Geometric
design standards for urban roads in plain. Since IRC standards do not specify standards for median widths, raised or sunk median, shyness strips etc., these aspects are proposed as per 6/4 lane manual and MoRTH circulars.
The intersections are designed in accordance with IRC: SP: 41-1994, ‘Guidelines for the Design of At-grade Intersections in Rural and Urban Areas’. The minimum turning radius of 20m is considered at each intersection for more usage of long vehicle type in the site.
Essential Road Furniture’s (Traffic Control Devices, Road Delineators, Road Studs, Roadside Safety Barriers, Pedestrian Guardrails and Facilities, Access Control)
IRC: 37 – 2012, “Tentative Guidelines for the Design of Flexible Pavements”
Based on the master plan, total length of internal roads is estimated as 10.233 km, length of external road is estimated as 2.8 km. The road cross-sections are developed based on the RoW provided for various categories of roads as per master plan. The cross sections also include foot path cum utility corridor such as storm water, drinking water, sewage water, recycled water and power and telecom network. The following shows the cross sectional elements for each RoW considered in the master plan.
Table P-1: Typical Cross Section Elements Cross Sectional Elements
45m RoW 30m RoW 18m RoW 45m RoW (External road-4 lane)
45m RoW (External road-2 lane)
Length of TCS (m) 3370 4907 1956 2800 2800
Carriageway (m) 9 7.0 7 7 7.5
Median (m) 2.0 - - 2 -
Cycle track(m) 2 1.5 1.5 - -
Earthen Shoulder(m) - - - 1.5 1.5
Footpath cum utility corridor (m)
11.5 10 4 - -
Typical cross section of the road showing the cross sectional elements in each RoW are shown in Figure P-2.
P.1.1 Internal traffic assessment
P.1.1.1 Trip Generation
The trips generated from EMC is the sum of the trips generated from processing area and non-processing area. The traffic generations from various industries inside the proposed development are estimated using appropriate trip generation rates. Commercial and passenger traffic was estimated separately and the final traffic is presented in terms of passenger car units per day (PCUs/day) as presented below:
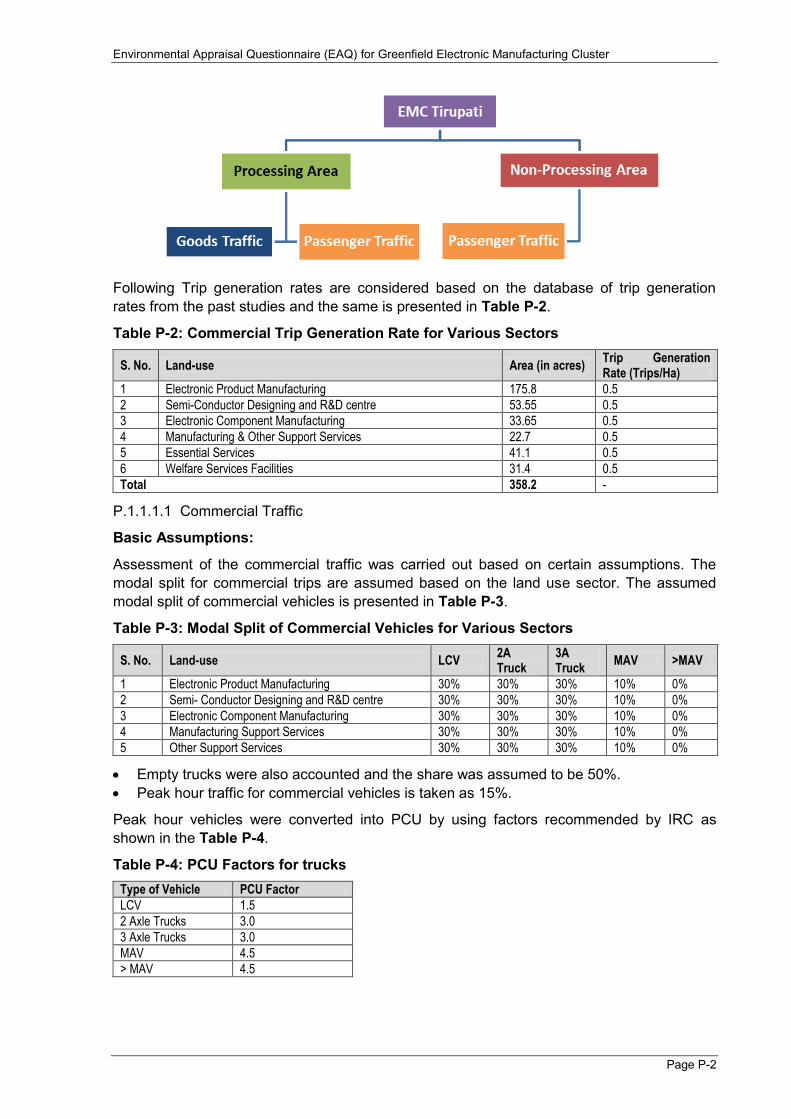
Environmental Appraisal Questionnaire (EAQ) for Greenfield Electronic Manufacturing Cluster
Page P-2
Following Trip generation rates are considered based on the database of trip generation rates from the past studies and the same is presented in Table P-2.
Table P-2: Commercial Trip Generation Rate for Various Sectors
S. No. Land-use Area (in acres) Trip Generation Rate (Trips/Ha)
1 Electronic Product Manufacturing 175.8 0.5
2 Semi-Conductor Designing and R&D centre 53.55 0.5
3 Electronic Component Manufacturing 33.65 0.5
4 Manufacturing & Other Support Services 22.7 0.5
5 Essential Services 41.1 0.5
6 Welfare Services Facilities 31.4 0.5
Total 358.2 -
P.1.1.1.1 Commercial Traffic
Basic Assumptions:
Assessment of the commercial traffic was carried out based on certain assumptions. The modal split for commercial trips are assumed based on the land use sector. The assumed modal split of commercial vehicles is presented in Table P-3.
Table P-3: Modal Split of Commercial Vehicles for Various Sectors
S. No. Land-use LCV 2A Truck
3A Truck
MAV >MAV
1 Electronic Product Manufacturing 30% 30% 30% 10% 0%
2 Semi- Conductor Designing and R&D centre 30% 30% 30% 10% 0%
3 Electronic Component Manufacturing 30% 30% 30% 10% 0%
4 Manufacturing Support Services 30% 30% 30% 10% 0%
5 Other Support Services 30% 30% 30% 10% 0%
Empty trucks were also accounted and the share was assumed to be 50%. Peak hour traffic for commercial vehicles is taken as 15%.
Peak hour vehicles were converted into PCU by using factors recommended by IRC as shown in the Table P-4.
Table P-4: PCU Factors for trucks Type of Vehicle PCU Factor
LCV 1.5
2 Axle Trucks 3.0
3 Axle Trucks 3.0
MAV 4.5
> MAV 4.5

Environmental Appraisal Questionnaire (EAQ) for Greenfield Electronic Manufacturing Cluster
Page P-3
Estimated Commercial Trips per Day
For the purpose of traffic analysis, full development is considered so that final lane configuration and circulation requirements can be assessed. Based on the trip generation rate and modal split, the total goods traffic generated for each sector is estimated from the area of proposed development. Also, 50% of the trucks are assumed to ply into and out of EMC empty. The estimated commercial vehicle trips from EMC Tirupati by external network are given in the Table P-5.
Table P-5: Estimated Commercial Vehicle Trips per Day (in terms of PCUs) Sectors Loaded Truck PCUs + Empty Truck PCUs Total Truck
PCUs/day LCV 2 Axle 3 Axle MAV
Electronic Product Manufacturing 24 48 48 24 144
Semi-Conductor Designing and R&D 7 15 15 7 44
Electronic Component Manufacturing 5 9 9 5 28
Manufacturing Support Services 3 6 6 3 18
Total 39 78 78 39 234
P.1.1.1.2 Passenger Traffic
Basic Assumptions in Processing Area and Non-processing Area
The direct employment in processing area was provided as 28,500. The sector wise employment considered for the passenger trip generation is as presented in Table P-6.
Table P-6: Sector-wise Direct Employment in Processing Area S. No. Sectors Total Direct Employment
1 Electronic Product Manufacturing 12306
2 Semi-Conductor Designing and R&D centre 2694
3 Electronic Component Manufacturing 8200
4 Manufacturing and Other Support Services 2800
5 Essential Services 1250
6 Welfare Services Facilities 1250
Total number of direct employment 28500
The total number of trips made by the employees of various sector includes to and fro movement which leads to twice the total number of employees (i.e. 57000 trips).
In the total direct employment, 30% of people are assumed to stay in Non-Processing area and the remaining 70% will stay outside EMC.
Also a trip rate of 0.5 trips per day is assumed for the trips made by the family members of the employees living inside EMC who are assumed to contribute 30% of the total direct employees.
For passenger vehicles, considering the total working hours on a three shift basis, the general shift was assumed with peak hour traffic of 40%. Also 50% of the family members are assumed to travel during the peak hour.
Assessment of the passenger trips involves the following steps. PCU factor and occupancy ratio considered for each passenger vehicle is as presented in Table P-7.
Table P-7: Assumed Modal Split of Passenger Vehicles Type of Mode
From Outside EMC (70%)
From Non Processing Area (30%)
Family Members inside EMC
PCU factor
Occupancy
Walk 0% 40% 40% 0 0.0
Cycle 5% 25% 25% 0.5 1.0
TW 25% 30% 30% 0.75 1.5

Environmental Appraisal Questionnaire (EAQ) for Greenfield Electronic Manufacturing Cluster
Page P-4
Type of Mode
From Outside EMC (70%)
From Non Processing Area (30%)
Family Members inside EMC
PCU factor
Occupancy
Car 10% 5% 5% 1 2.0
Bus 60% 0% 0% 3 40
With the assumed modal spilt, the number of employees arriving in each sector of processing area and non-processing area is estimated mode-wise and the number of passenger vehicles generated is also arrived.
The modal split assumed for the people who carries out internal work trip within EMC i.e., from non-processing area to processing area as well as trips made by family members plying out of EMC is also presented in Table P-7.
Special chartered buses can be proposed for employees inside the non-processing area as well as those coming from far off places to ply in and out of the processing area. 10% of the same has been assumed for working out the total passenger traffic inside EMC.
Along with the employees stay facilities planned within the project site, its allied infrastructures like, primary health centre, nursery/crèche, local shopping centre, restaurant etc., are also provided within the EMC non-processing area towards the entrance/exit area.
Estimated Passenger Trips per day for Processing Area
The estimated passenger trips attracted to processing area is sum of passengers generated outside EMC, passengers generated from non-processing area and the trips made by the family members (educational trips or personal trips) living inside EMC area.
Based on the number of employment and modal split, the total passenger traffic generated / attracted in each sector is estimated.
Employees from far off places (outside EMC) and employees from non-processing area are separately estimated. At the entry/exit location, only the employees residing outside EMC and those family members plying out of EMC from the non-processing zones will be taken into account for checking lane adequacy.
P.1.1.1.3 Total Generated Traffic
The total generated traffic and peak hour traffic in processing area including the goods and passenger traffic is presented in Table P-8.
Table P-8: Total generated traffic
S No.
Sectors
Traffic (PCU/day) Peak hour Traffic (PCU/hr)
Goods traffic
Passenger Traffic Goods traffic
Passenger Traffic
Outside EMC
NPA Outside EMC
NPA
1 Electronic Product Manufacturing 144 3552 3022 22 1421 1209
2 Semi-Conductor Designing and R&D
44 680 578 7 272 231
3 Electronic Component Manufacturing
28 2313 1968 4 925 787
4 Manufacturing Support Services 19 790 672 3 316 269
5 Essential Services - 353 300 - 141 120
6 Welfare Service Facilities - 353 300 - 141 120
Total 235 8041 6840 36 3216 2736

Environmental Appraisal Questionnaire (EAQ) for Greenfield Electronic Manufacturing Cluster
Page P-5
P.1.1.2 Trip Distribution and Lane adequacy
There is only one primary entry / exit provided for the whole of EMC area through which the total goods traffic and the passenger traffic from outside EMC will enter / exit the area. In order to calculate lane adequacy, traffic per day is calculated for further analysis.
The passenger traffic generated from non-processing area will enter / exit the processing area through the same road network provided for those coming from outside of EMC.
The estimated combined total traffic generated, includes total truck trips generated during peak flow, total passenger trips generated by work force from inside and outside of EMC as well as the passenger trips generated by the family members of the employees residing inside the EMC. The estimated peak hour traffic is distributed in the internal road network, to check the lane requirements.
Peak hour traffic for goods vehicle was assumed to be 15%, passenger vehicles as 40% and family trips were assumed to be 50%. The network adequacy of internal roads is checked with a maximum capacity of 1200 PCU/lane/hr.
The total internal road network has been divided into 28 sections as shown in Figure P-1 and the lane requirement for the same was checked at each section.
Figure P-1: Sections – Internal Road Network
The section wise lane requirements for the expected peak hour traffic generated for the future are given in Table P-9.
Table P-9: Check for Lane Adequacy
Sec No.
Details Peak hour traffic (PCU/hr)
No. of lanes required (both directions)
Lane Proposed
Remarks
1 Entire Area (Entry/Exit) 4419 1 4 Adequate
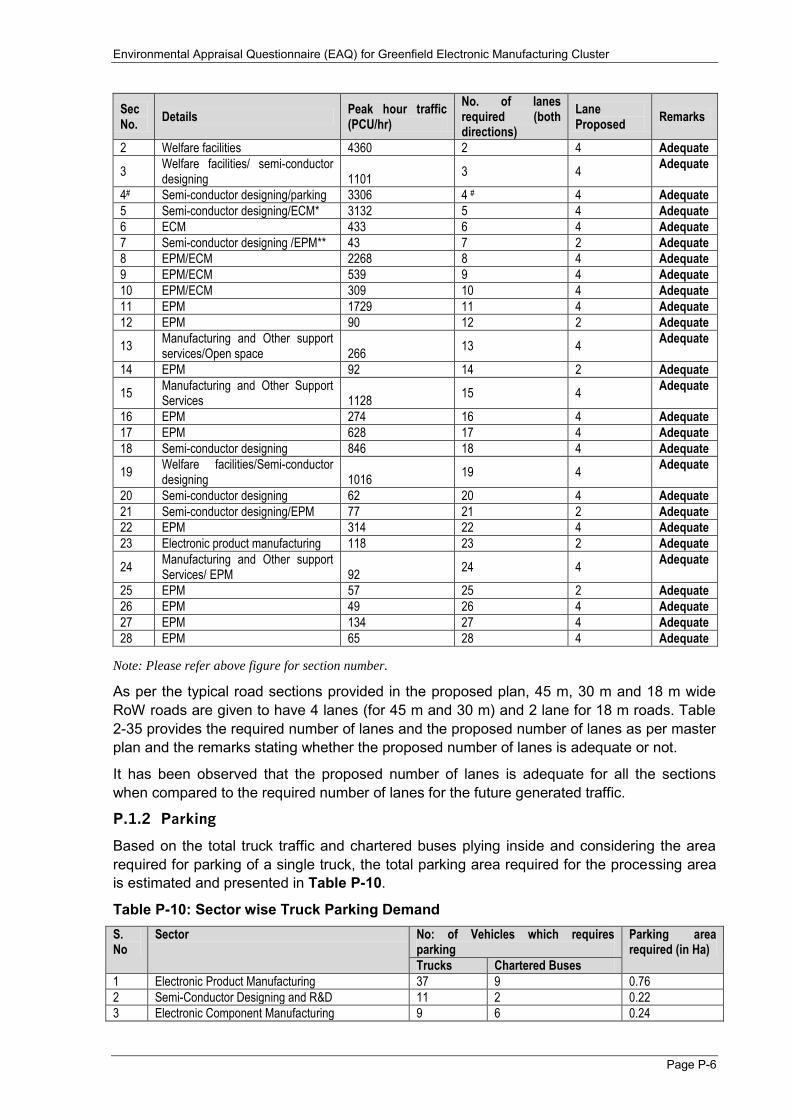
Environmental Appraisal Questionnaire (EAQ) for Greenfield Electronic Manufacturing Cluster
Page P-6
Sec No.
Details Peak hour traffic (PCU/hr)
No. of lanes required (both directions)
Lane Proposed
Remarks
2 Welfare facilities 4360 2 4 Adequate
3 Welfare facilities/ semi-conductor designing 1101
3 4 Adequate
4# Semi-conductor designing/parking 3306 4 # 4 Adequate
5 Semi-conductor designing/ECM* 3132 5 4 Adequate
6 ECM 433 6 4 Adequate
7 Semi-conductor designing /EPM** 43 7 2 Adequate
8 EPM/ECM 2268 8 4 Adequate
9 EPM/ECM 539 9 4 Adequate
10 EPM/ECM 309 10 4 Adequate
11 EPM 1729 11 4 Adequate
12 EPM 90 12 2 Adequate
13 Manufacturing and Other support services/Open space 266
13 4 Adequate
14 EPM 92 14 2 Adequate
15 Manufacturing and Other Support Services 1128
15 4 Adequate
16 EPM 274 16 4 Adequate
17 EPM 628 17 4 Adequate
18 Semi-conductor designing 846 18 4 Adequate
19 Welfare facilities/Semi-conductor designing 1016
19 4 Adequate
20 Semi-conductor designing 62 20 4 Adequate
21 Semi-conductor designing/EPM 77 21 2 Adequate
22 EPM 314 22 4 Adequate
23 Electronic product manufacturing 118 23 2 Adequate
24 Manufacturing and Other support Services/ EPM 92
24 4 Adequate
25 EPM 57 25 2 Adequate
26 EPM 49 26 4 Adequate
27 EPM 134 27 4 Adequate
28 EPM 65 28 4 Adequate
Note: Please refer above figure for section number.
As per the typical road sections provided in the proposed plan, 45 m, 30 m and 18 m wide RoW roads are given to have 4 lanes (for 45 m and 30 m) and 2 lane for 18 m roads. Table 2-35 provides the required number of lanes and the proposed number of lanes as per master plan and the remarks stating whether the proposed number of lanes is adequate or not.
It has been observed that the proposed number of lanes is adequate for all the sections when compared to the required number of lanes for the future generated traffic.
P.1.2 Parking
Based on the total truck traffic and chartered buses plying inside and considering the area required for parking of a single truck, the total parking area required for the processing area is estimated and presented in Table P-10.
Table P-10: Sector wise Truck Parking Demand S. No
Sector No: of Vehicles which requires parking
Parking area required (in Ha)
Trucks Chartered Buses
1 Electronic Product Manufacturing 37 9 0.76
2 Semi-Conductor Designing and R&D 11 2 0.22
3 Electronic Component Manufacturing 9 6 0.24

Environmental Appraisal Questionnaire (EAQ) for Greenfield Electronic Manufacturing Cluster
Page P-7
S. No
Sector No: of Vehicles which requires parking
Parking area required (in Ha)
Trucks Chartered Buses
4 Manufacturing Support Services 5 2 0.11
5 Essential Services - 1 0.01
6 Welfare Service Facilities - 1 0.01
Total 63 21 1.38
In the master plan, parking space is provided near the entry/exit of the EMC area for vehicles plying inside and coming out especially trucks and chartered buses.
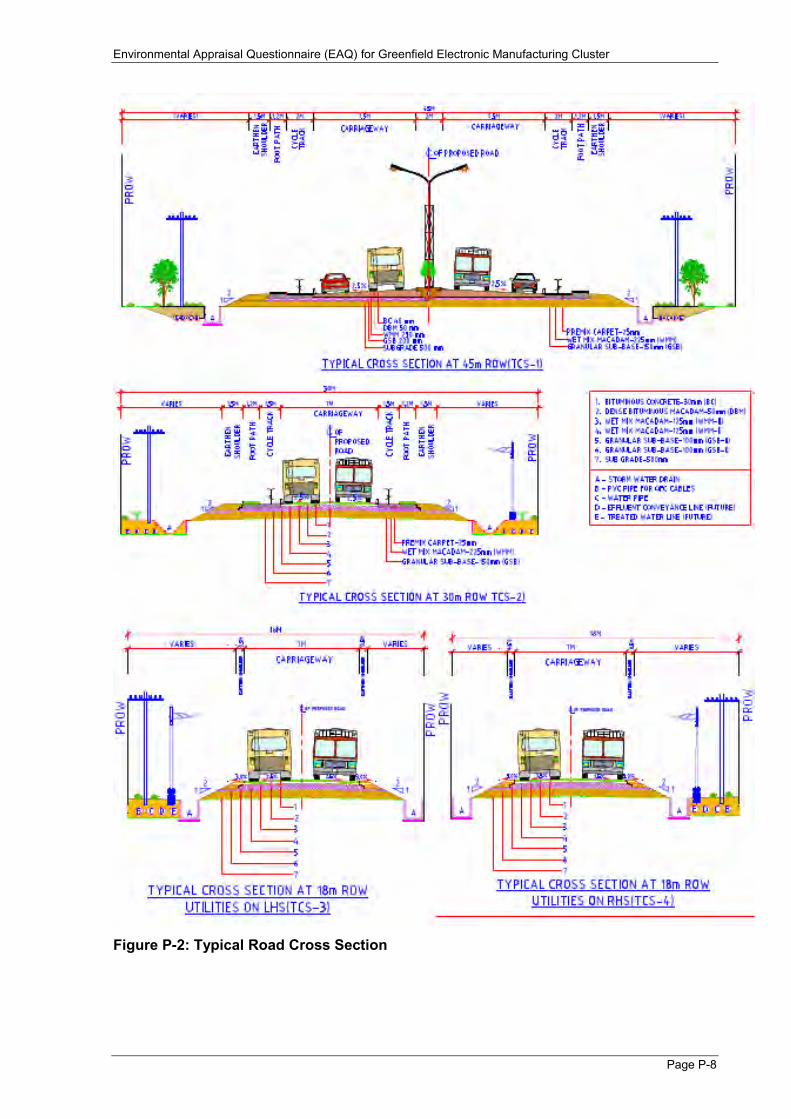
Environmental Appraisal Questionnaire (EAQ) for Greenfield Electronic Manufacturing Cluster
Page P-8
Figure P-2: Typical Road Cross Section

L&T INFRASTRUCTURE ENGINEERING LIMITED
6-3-1192/1/1, 5th Floor, Block No.3,
White House, Kundan Bagh, Begumpet, Hyderabad – 500 016
Ph: 91 -040 – 40354444 ; Fax: 91-040-40354430