greece: short-term uncertainty, long-term potential · 2015-06-10 · greece: short-term...
TRANSCRIPT

Greece: Short-term uncertainty,
long-term potential
June 2015
Bloomberg Page: <PBGR>
Ilias Lekkos [email protected] Irini Staggel [email protected] Anastasia Aggelopoulou [email protected] Dimitris Gavalas [email protected] Piraeus Bank 4 Amerikis Street, 105 64, Athens, Greece Tel: (+30) 210 328 8187, Fax: (+30) 210 328 8605
2
Clearly the momentum that the Greek economy developed between mid - 2012 and Q3 - 2014
is lost. Starting from a 2% GDP forecast for 2015 we had already downgraded our estimates to
0.8% and currently we expect a flat GDP growth with the risks squarely to the downside.
Yet, all is not lost. Defying negative expectations and doomsday scenarios we show that sectors
such as tourism, manufacturing and retail sales are still supporting economic activity.
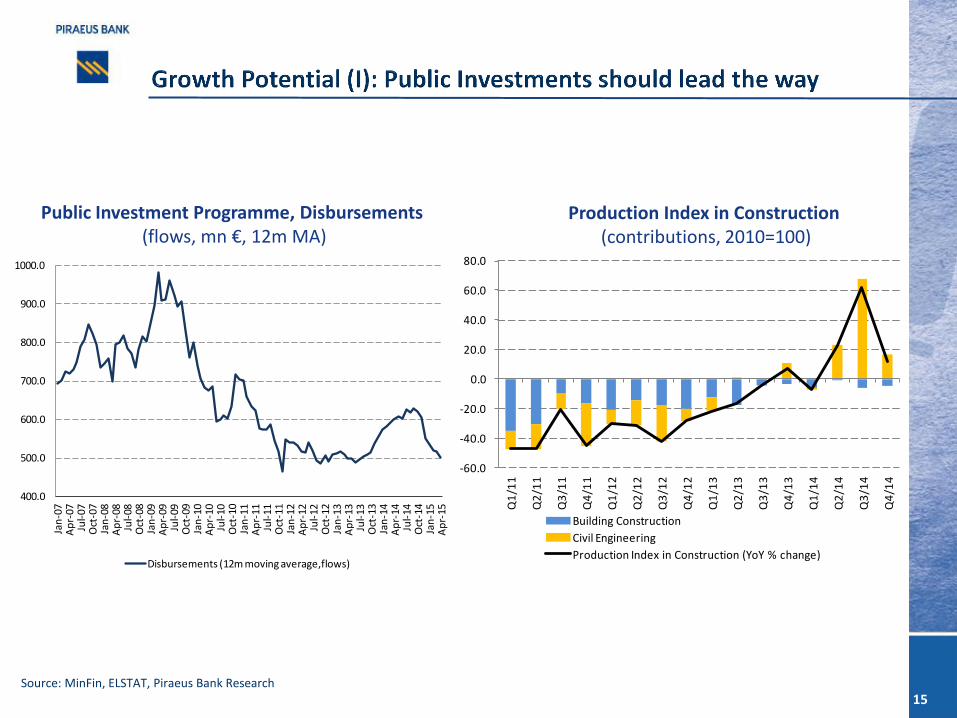
But if we are serious about restarting the Greek economy, we should start thinking hard about
securing the extra funding which would revitalize the Public Investment Programme, identifying
new export oriented and dynamic economic sectors that have the potential to attract new
investment and finally making a serious commitment to attracting foreign investment through
the Privatizations Programme.
3
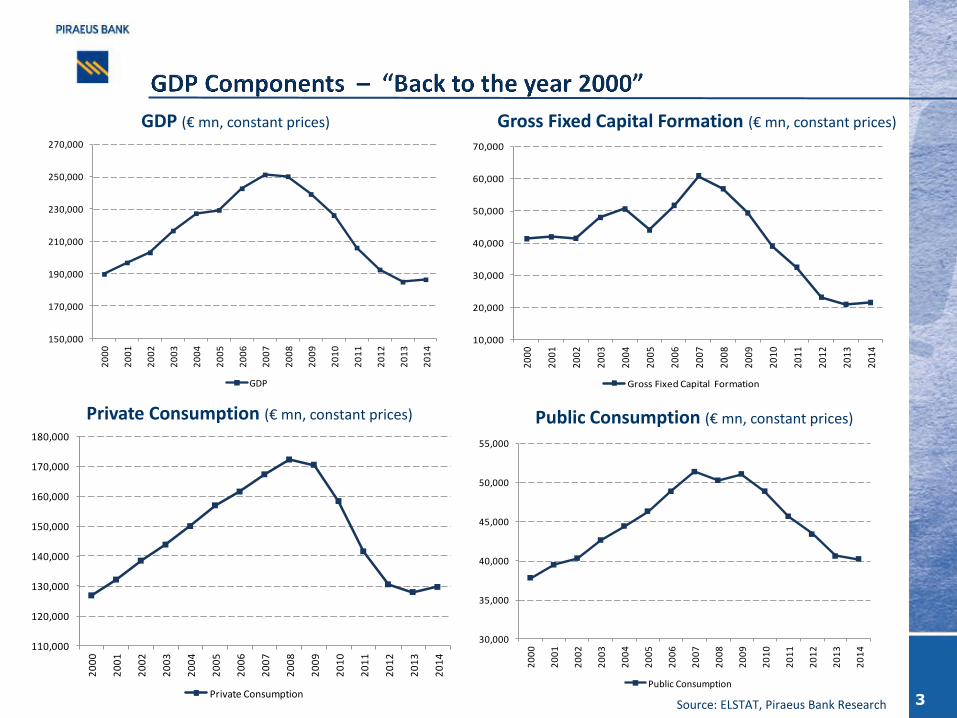
GDP (€ mn, constant prices) Gross Fixed Capital Formation (€ mn, constant prices)
Private Consumption (€ mn, constant prices) Public Consumption (€ mn, constant prices)
150,000
170,000
190,000
210,000
230,000
250,000
270,000
20
00
20
01
20
02
20
03
20
04
20
05
20
06
20
07
20
08
20
09
20
10
20
11
20
12
20
13
20
14
GDP
10,000
20,000
30,000
40,000
50,000
60,000
70,000
20
00
20
01
20
02
20
03
20
04
20
05
20
06
20
07
20
08
20
09
20
10
20
11
20
12
20
13
20
14
Gross Fixed Capital Formation
110,000
120,000
130,000
140,000
150,000
160,000
170,000
180,000
20
00
20
01
20
02
20
03
20
04
20
05
20
06
20
07
20
08
20
09
20
10
20
11
20
12
20
13
20
14
Private Consumption
30,000
35,000
40,000
45,000
50,000
55,000
20
00
20
01
20
02
20
03
20
04
20
05
20
06
20
07
20
08
20
09
20
10
20
11
20
12
20
13
20
14
Public Consumption
Source: ELSTAT, Piraeus Bank Research
4
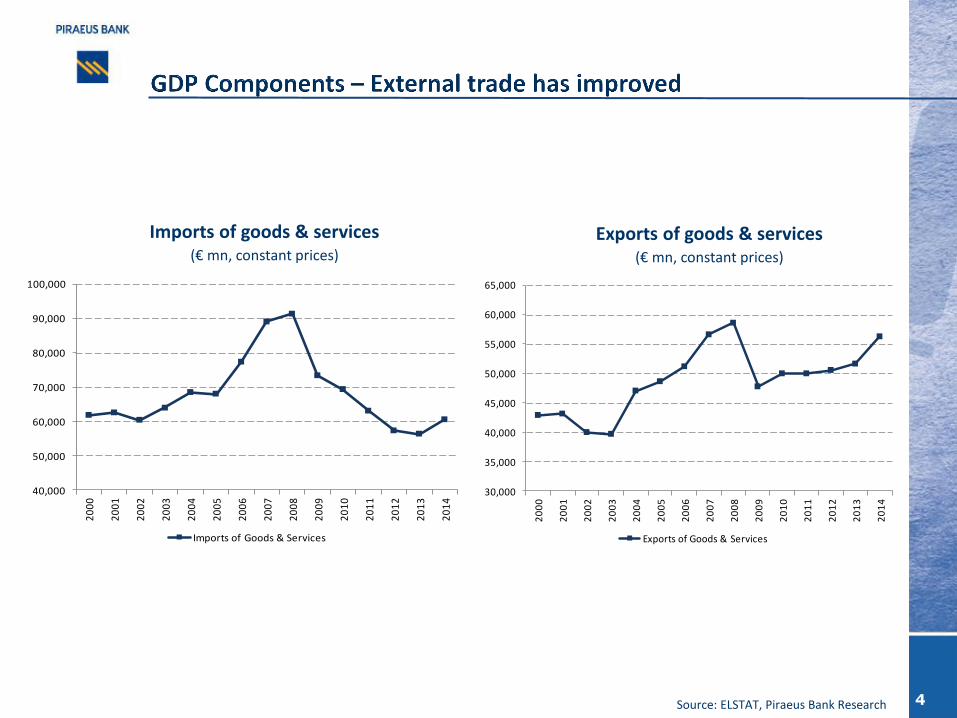
Imports of goods & services (€ mn, constant prices)
Source: ELSTAT, Piraeus Bank Research
Exports of goods & services (€ mn, constant prices)
30,000
35,000
40,000
45,000
50,000
55,000
60,000
65,000
20
00
20
01
20
02
20
03
20
04
20
05
20
06
20
07
20
08
20
09
20
10
20
11
20
12
20
13
20
14
Exports of Goods & Services
40,000
50,000
60,000
70,000
80,000
90,000
100,000
20
00
20
01
20
02
20
03
20
04
20
05
20
06
20
07
20
08
20
09
20
10
20
11
20
12
20
13
20
14
Imports of Goods & Services
Source: DG ECFIN, ELSTAT, Bank of Greece, Teiresias, Bloomberg, Minfin, Piraeus Bank Research
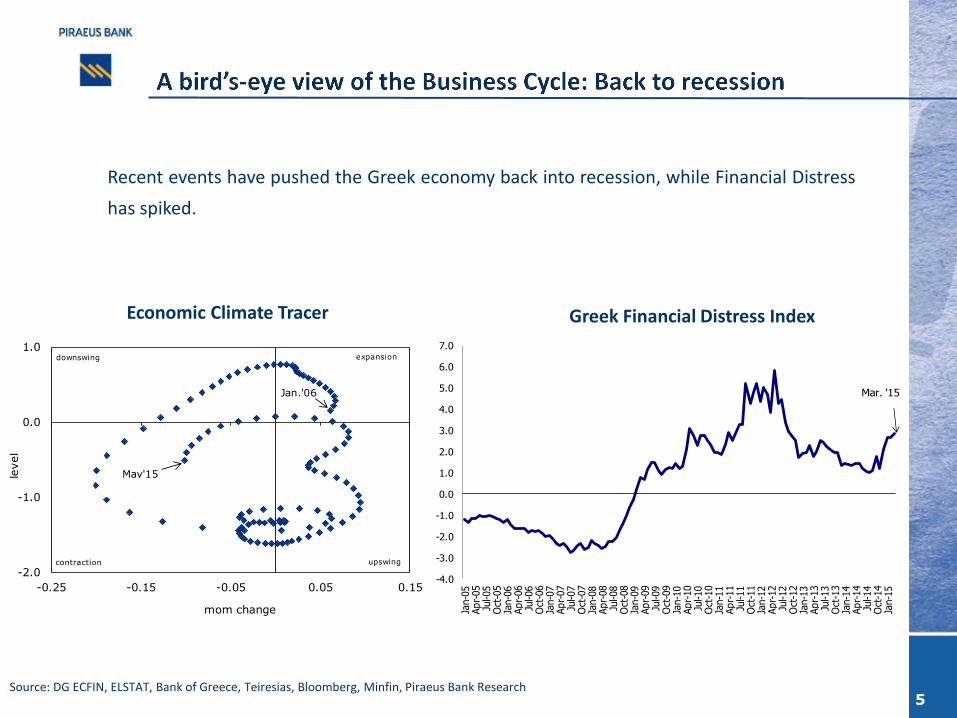
Economic Climate Tracer
Recent events have pushed the Greek economy back into recession, while Financial Distress
has spiked.
5
Greek Financial Distress Index
-4.0
-3.0
-2.0
-1.0
0.0
1.0
2.0
3.0
4.0
5.0
6.0
7.0
Jan-0
5Apr-
05
Jul-05
Oct
-05
Jan-0
6Apr-
06
Jul-06
Oct
-06
Jan-0
7Apr-
07
Jul-07
Oct
-07
Jan-0
8Apr-
08
Jul-08
Oct
-08
Jan-0
9Apr-
09
Jul-09
Oct
-09
Jan-1
0Apr-
10
Jul-10
Oct
-10
Jan-1
1Apr-
11
Jul-11
Oct
-11
Jan-1
2Apr-
12
Jul-12
Oct
-12
Jan-1
3Apr-
13
Jul-13
Oct
-13
Jan-1
4Apr-
14
Jul-14
Oct
-14
Jan-1
5
Mar. '15
-2.0
-1.0
0.0
1.0
-0.25 -0.15 -0.05 0.05 0.15
level
mom change
downswing expansion
contraction upswing
May'15
Jan.'06
Source: EL.STAT., Piraeus Bank Research 6
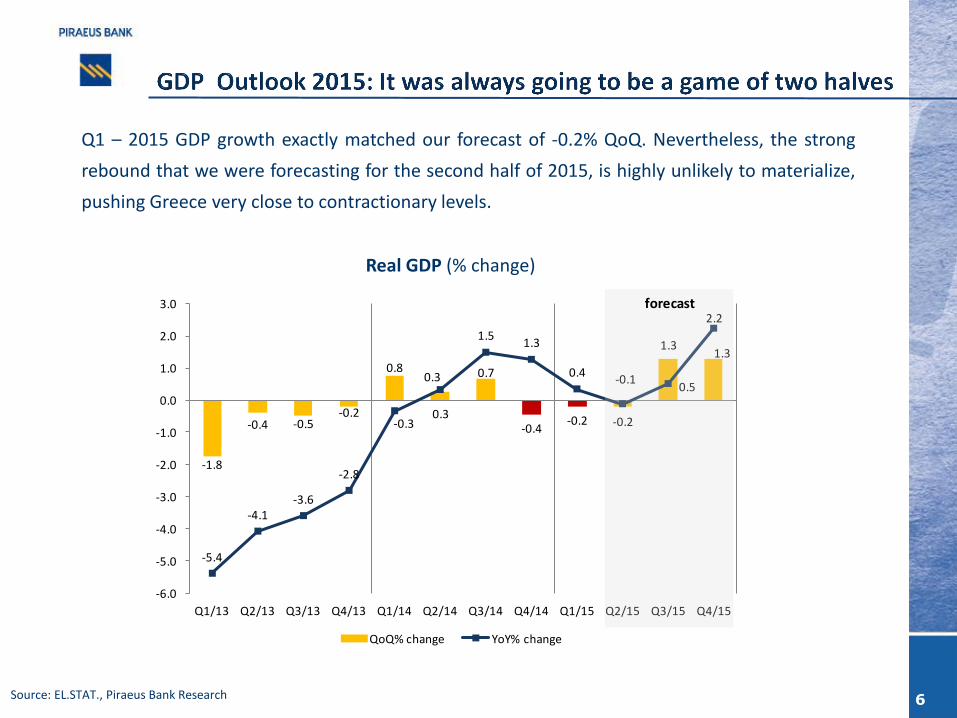
Real GDP (% change)
Q1 – 2015 GDP growth exactly matched our forecast of -0.2% QoQ. Nevertheless, the strong
rebound that we were forecasting for the second half of 2015, is highly unlikely to materialize,
pushing Greece very close to contractionary levels.
-1.8
-0.4 -0.5-0.2
0.8
0.3
0.7
-0.4-0.2 -0.2
1.31.3
-5.4
-4.1-3.6
-2.8
-0.3
0.3
1.51.3
0.4-0.1
0.5
2.2
-6.0
-5.0
-4.0
-3.0
-2.0
-1.0
0.0
1.0
2.0
3.0
Q1/13 Q2/13 Q3/13 Q4/13 Q1/14 Q2/14 Q3/14 Q4/14 Q1/15 Q2/15 Q3/15 Q4/15
QoQ% change YoY% change
forecast
Source: DG ECFIN, EL.STAT., Eurostat, Piraeus Bank Research 7
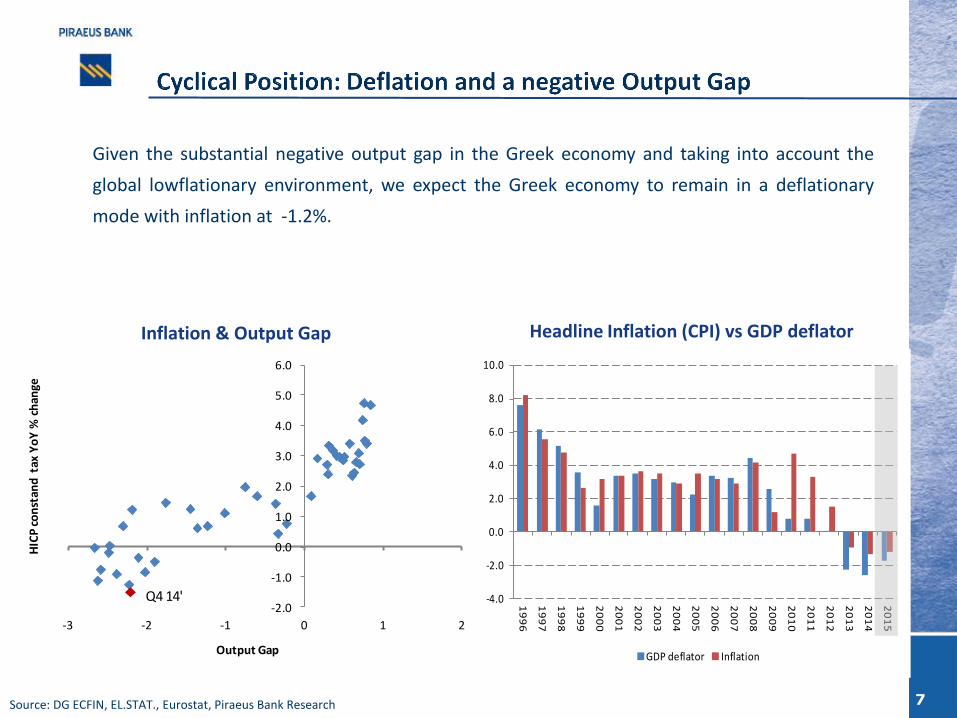
Inflation & Output Gap Headline Inflation (CPI) vs GDP deflator
Given the substantial negative output gap in the Greek economy and taking into account the
global lowflationary environment, we expect the Greek economy to remain in a deflationary
mode with inflation at -1.2%.
-4.0
-2.0
0.0
2.0
4.0
6.0
8.0
10.0
19
96
19
97
19
98
19
99
20
00
20
01
20
02
20
03
20
04
20
05
20
06
20
07
20
08
20
09
20
10
20
11
20
12
20
13
20
14
20
15
GDP deflator Inflation
-2.0
-1.0
0.0
1.0
2.0
3.0
4.0
5.0
6.0
-3 -2 -1 0 1 2
HIC
P c
on
stan
d t
ax Y
oY
%ch
ange
Output Gap
Q4 14'
Source: European Commission DG ECFIN, EL.STAT., Piraeus Bank Research
8
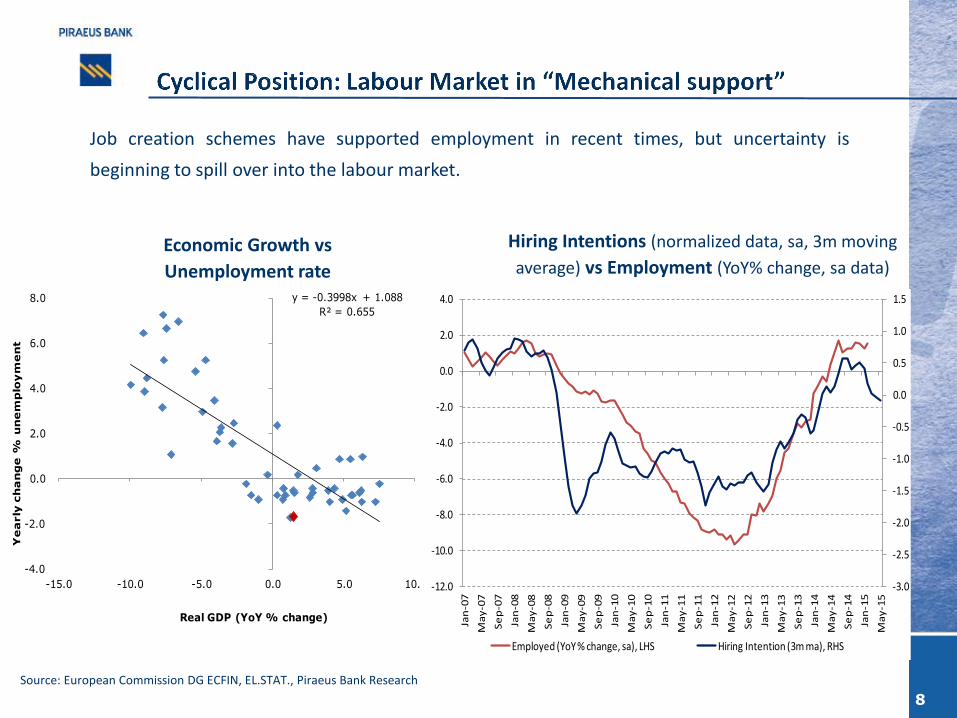
Economic Growth vs
Unemployment rate
Hiring Intentions (normalized data, sa, 3m moving
average) vs Employment (YoY% change, sa data)
Job creation schemes have supported employment in recent times, but uncertainty is
beginning to spill over into the labour market.
y = -0.3998x + 1.088
R² = 0.655
-4.0
-2.0
0.0
2.0
4.0
6.0
8.0
-15.0 -10.0 -5.0 0.0 5.0 10.0
Ye
arly
ch
an
ge
% u
ne
mp
loy
me
nt
Real GDP (YoY % change)
-3.0
-2.5
-2.0
-1.5
-1.0
-0.5
0.0
0.5
1.0
1.5
-12.0
-10.0
-8.0
-6.0
-4.0
-2.0
0.0
2.0
4.0
Jan
-07
Ma
y-0
7
Se
p-0
7
Jan
-08
Ma
y-0
8
Se
p-0
8
Jan
-09
Ma
y-0
9
Se
p-0
9
Jan
-10
Ma
y-1
0
Se
p-1
0
Jan
-11
Ma
y-1
1
Se
p-1
1
Jan
-12
Ma
y-1
2
Se
p-1
2
Jan
-13
Ma
y-1
3
Se
p-1
3
Jan
-14
Ma
y-1
4
Se
p-1
4
Jan
-15
Ma
y-1
5
Εmployed (YoY % change, sa), LHS Hiring Intention (3m ma), RHS
Source: EL.STAT., Eurostat, BoG, Piraeus Bank Research
9
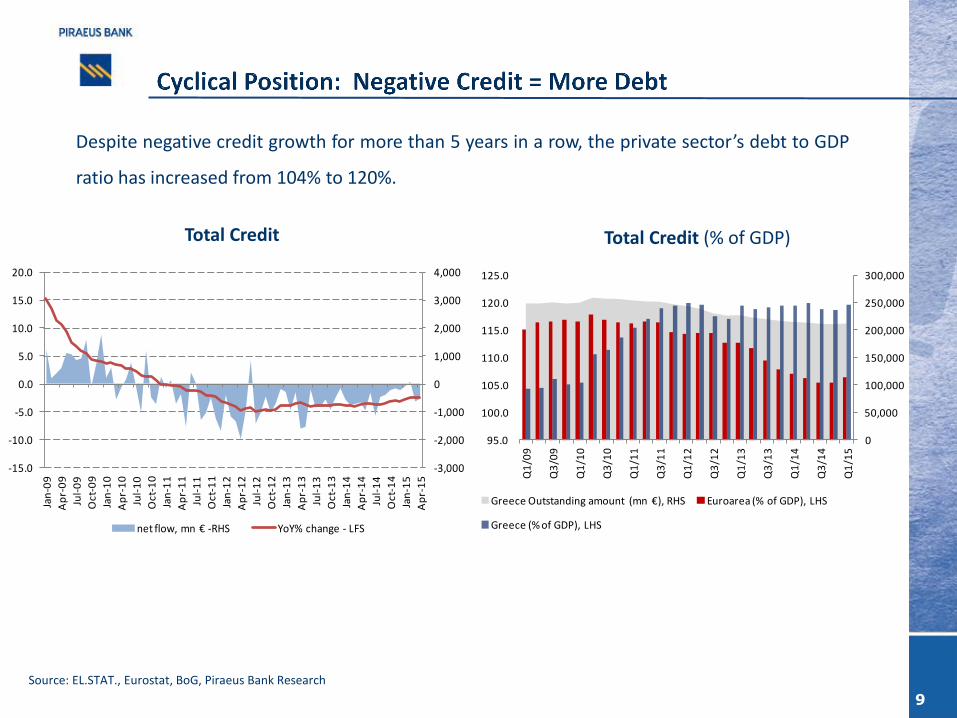
Total Credit Total Credit (% of GDP)
0
50,000
100,000
150,000
200,000
250,000
300,000
95.0
100.0
105.0
110.0
115.0
120.0
125.0
Q1
/09
Q3
/09
Q1
/10
Q3
/10
Q1
/11
Q3
/11
Q1
/12
Q3
/12
Q1
/13
Q3
/13
Q1
/14
Q3
/14
Q1
/15
Greece Outstanding amount (mn €), RHS Euroarea (% of GDP), LHS
Greece (% of GDP), LHS
-3,000
-2,000
-1,000
0
1,000
2,000
3,000
4,000
-15.0
-10.0
-5.0
0.0
5.0
10.0
15.0
20.0
Jan
-09
Ap
r-0
9
Jul-
09
Oct
-09
Jan
-10
Ap
r-1
0
Jul-
10
Oct
-10
Jan
-11
Ap
r-1
1
Jul-
11
Oct
-11
Jan
-12
Ap
r-1
2
Jul-
12
Oct
-12
Jan
-13
Ap
r-1
3
Jul-
13
Oct
-13
Jan
-14
Ap
r-1
4
Jul-
14
Oct
-14
Jan
-15
Ap
r-1
5
net flow, mn € -RHS YoY% change - LFS
Despite negative credit growth for more than 5 years in a row, the private sector’s debt to GDP
ratio has increased from 104% to 120%.
10
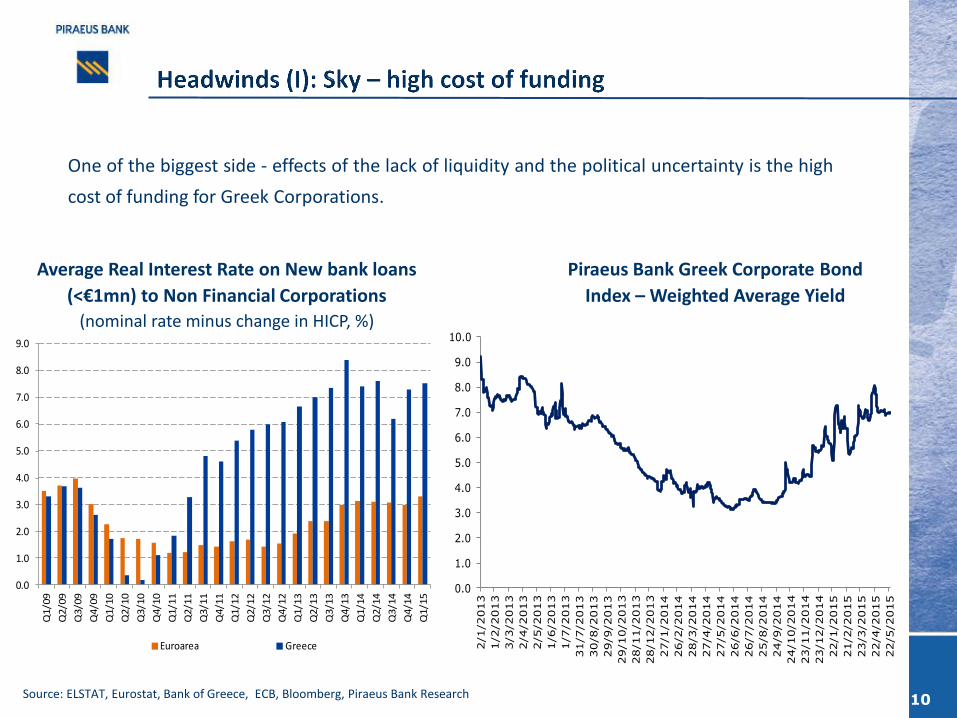
Piraeus Bank Greek Corporate Bond
Index – Weighted Average Yield
Average Real Interest Rate on New bank loans
(<€1mn) to Non Financial Corporations
(nominal rate minus change in HICP, %)
Source: ELSTAT, Eurostat, Bank of Greece, ECB, Bloomberg, Piraeus Bank Research
One of the biggest side - effects of the lack of liquidity and the political uncertainty is the high
cost of funding for Greek Corporations.
0.0
1.0
2.0
3.0
4.0
5.0
6.0
7.0
8.0
9.0
10.0
2/1/2013
1/2/2013
3/3/2013
2/4/2013
2/5/2013
1/6/2013
1/7/2013
31/7/2013
30/8/2013
29/9/2013
29/10/2013
28/11/2013
28/12/2013
27/1/2014
26/2/2014
28/3/2014
27/4/2014
27/5/2014
26/6/2014
26/7/2014
25/8/2014
24/9/2014
24/10/2014
23/11/2014
23/12/2014
22/1/2015
21/2/2015
23/3/2015
22/4/2015
22/5/2015
0.0
1.0
2.0
3.0
4.0
5.0
6.0
7.0
8.0
9.0
Q1
/09
Q2
/09
Q3
/09
Q4
/09
Q1
/10
Q2
/10
Q3
/10
Q4
/10
Q1
/11
Q2
/11
Q3
/11
Q4
/11
Q1
/12
Q2
/12
Q3
/12
Q4
/12
Q1
/13
Q2
/13
Q3
/13
Q4
/13
Q1
/14
Q2
/14
Q3
/14
Q4
/14
Q1
/15
Euroarea Greece
11
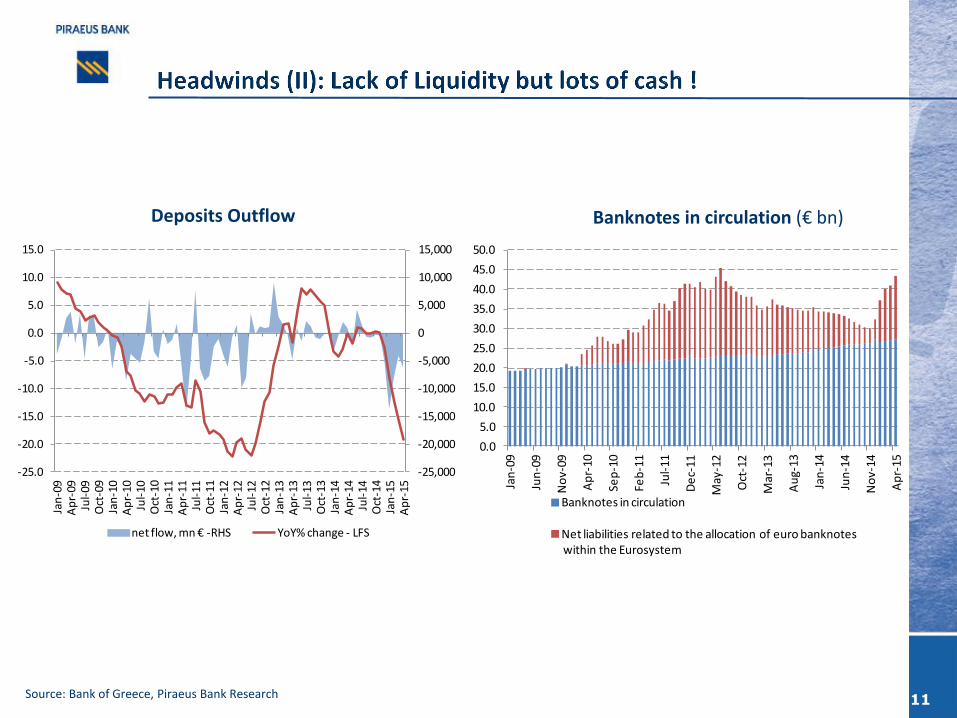
Banknotes in circulation (€ bn)
Source: Bank of Greece, Piraeus Bank Research
Deposits Outflow
-25,000
-20,000
-15,000
-10,000
-5,000
0
5,000
10,000
15,000
-25.0
-20.0
-15.0
-10.0
-5.0
0.0
5.0
10.0
15.0
Jan
-09
Ap
r-09
Jul-
09O
ct-0
9Ja
n-1
0A
pr-
10Ju
l-10
Oct
-10
Jan
-11
Ap
r-11
Jul-
11O
ct-1
1Ja
n-1
2A
pr-
12Ju
l-12
Oct
-12
Jan
-13
Ap
r-13
Jul-
13O
ct-1
3Ja
n-1
4A
pr-
14Ju
l-14
Oct
-14
Jan
-15
Ap
r-15
net flow, mn € -RHS YoY% change - LFS
0.0
5.0
10.0
15.0
20.0
25.0
30.0
35.0
40.0
45.0
50.0
Jan
-09
Jun
-09
No
v-09
Ap
r-10
Sep
-10
Feb
-11
Jul-
11
De
c-11
May
-12
Oct
-12
Mar
-13
Au
g-13
Jan
-14
Jun
-14
No
v-14
Ap
r-15
Banknotes in circulation
Net liabilities related to the allocation of euro banknoteswithin the Eurosystem
Source: ELSTAT, Piraeus Bank Research 12
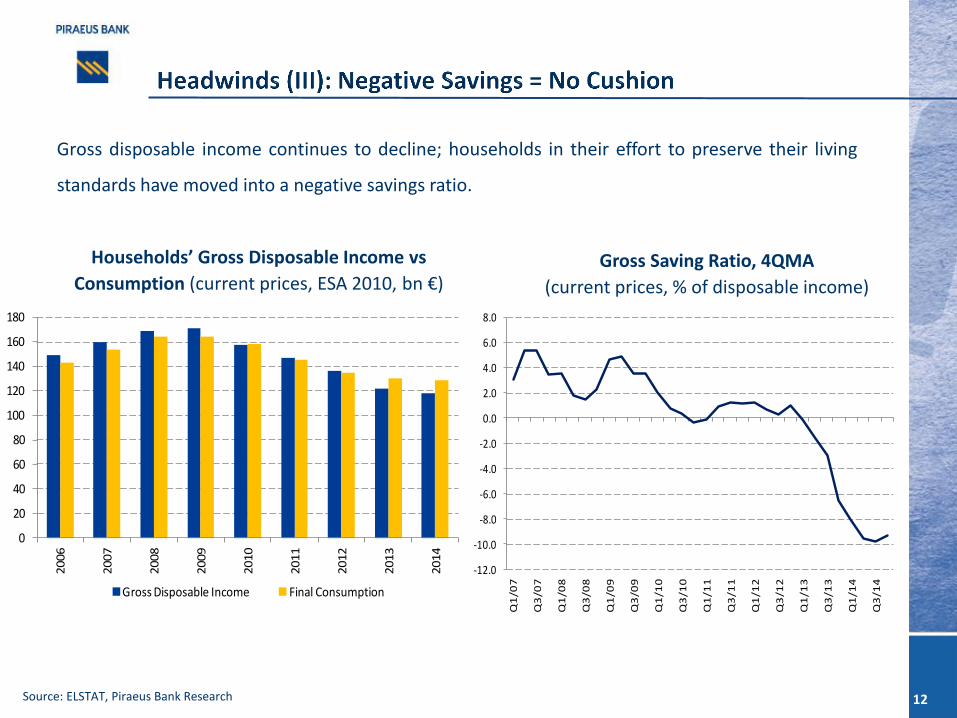
Households’ Gross Disposable Income vs
Consumption (current prices, ESA 2010, bn €) Gross Saving Ratio, 4QMA
(current prices, % of disposable income)
Gross disposable income continues to decline; households in their effort to preserve their living
standards have moved into a negative savings ratio.
-12.0
-10.0
-8.0
-6.0
-4.0
-2.0
0.0
2.0
4.0
6.0
8.0
Q1
/07
Q3
/07
Q1
/08
Q3
/08
Q1
/09
Q3
/09
Q1
/10
Q3
/10
Q1
/11
Q3
/11
Q1
/12
Q3
/12
Q1
/13
Q3
/13
Q1
/14
Q3
/14
0
20
40
60
80
100
120
140
160
180
20
06
20
07
20
08
20
09
20
10
20
11
20
12
20
13
20
14
Gross Disposable Income Final Consumption

Source: Bank of Greece, Eurostat Piraeus Bank Research 13
Travel Balance (cumulative, mn €)
Industrial Production Index in Manufacturing (ΥοΥ % change, sa data)
-2000
0
2000
4000
6000
8000
10000
12000
Jan
.
Jan
.-Fe
b.
Jan
.-M
ar.
Jan
.-A
pr.
Jan
.-M
ay
Jan
.-Ju
n.
Jan
.-Ju
l.
Jan
.-A
ug.
Jan
.-Se
p.
Jan
.-O
ct.
Jan
.-N
ov.
Jan
.-D
ec.
2012 2013 2014 2015
-20.0
-15.0
-10.0
-5.0
0.0
5.0
10.0
Jan
-11
Ma
r-1
1
Ma
y-1
1
Jul-
11
Se
p-1
1
No
v-1
1
Jan
-12
Ma
r-1
2
Ma
y-1
2
Jul-
12
Se
p-1
2
No
v-1
2
Jan
-13
Ma
r-1
3
Ma
y-1
3
Jul-
13
Se
p-1
3
No
v-1
3
Jan
-14
Ma
r-1
4
Ma
y-1
4
Jul-
14
Se
p-1
4
No
v-1
4
Jan
-15
Ma
r-1
5
Q1 15': +5.5% ΥοΥ
14
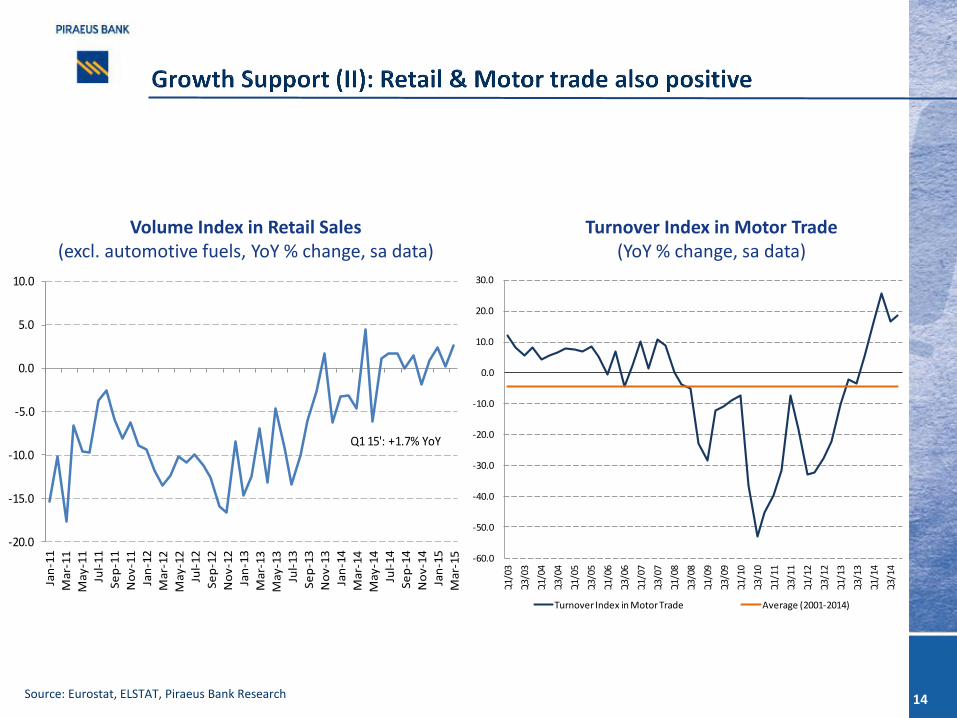
Turnover Index in Motor Trade (ΥοΥ % change, sa data)
Volume Index in Retail Sales (excl. automotive fuels, ΥοΥ % change, sa data)
-20.0
-15.0
-10.0
-5.0
0.0
5.0
10.0
Jan
-11
Mar
-11
May
-11
Jul-
11
Sep
-11
No
v-11
Jan
-12
Mar
-12
May
-12
Jul-
12
Sep
-12
No
v-12
Jan
-13
Mar
-13
May
-13
Jul-
13
Sep
-13
No
v-13
Jan
-14
Mar
-14
May
-14
Jul-
14
Sep
-14
No
v-14
Jan
-15
Mar
-15
Q1 15': +1.7% ΥοΥ
Source: Eurostat, ELSTAT, Piraeus Bank Research
-60.0
-50.0
-40.0
-30.0
-20.0
-10.0
0.0
10.0
20.0
30.0
Q1/
03
Q3/
03
Q1/
04
Q3/
04
Q1/
05
Q3/
05
Q1/
06
Q3/
06
Q1/
07
Q3/
07
Q1/
08
Q3/
08
Q1/
09
Q3/
09
Q1/
10
Q3/
10
Q1/
11
Q3/
11
Q1/
12
Q3/
12
Q1/
13
Q3/
13
Q1/
14
Q3/
14
Turnover Index in Motor Trade Average (2001-2014)
Source: MinFin, ELSTAT, Piraeus Bank Research
15
Public Investment Programme, Disbursements (flows, mn €, 12m MA)
Production Index in Construction (contributions, 2010=100)
-60.0
-40.0
-20.0
0.0
20.0
40.0
60.0
80.0
Q1
/11
Q2
/11
Q3
/11
Q4
/11
Q1
/12
Q2
/12
Q3
/12
Q4
/12
Q1
/13
Q2
/13
Q3
/13
Q4
/13
Q1
/14
Q2
/14
Q3
/14
Q4
/14
Building Construction
Civil Engineering
Production Index in Construction (YoY % change)
400.0
500.0
600.0
700.0
800.0
900.0
1000.0
Jan
-07
Ap
r-07
Jul-
07O
ct-0
7Ja
n-0
8A
pr-
08Ju
l-08
Oct
-08
Jan
-09
Ap
r-09
Jul-
09O
ct-0
9Ja
n-1
0A
pr-
10Ju
l-10
Oct
-10
Jan
-11
Ap
r-11
Jul-
11O
ct-1
1Ja
n-1
2A
pr-
12Ju
l-12
Oct
-12
Jan
-13
Ap
r-13
Jul-
13O
ct-1
3Ja
n-1
4A
pr-
14Ju
l-14
Oct
-14
Jan
-15
Ap
r-15
Disbursements (12m moving average,flows)

Source: ELSTAT, Piraeus Bank Research 16
Gross Fixed Capital Formation, Residential
(current prices, ESA 2010)
Residential Investment is still suffering in the aftermath of the recession and from an uncertain
tax environment. The significant decline in the fixed capital formation and the continuing high
level of capital consumption are driving the net capital formation into negative territory.
Fixed Capital Formation in Non Financial
Corporations (current prices, €mn, ESA 2010)
-3000
-2000
-1000
0
1000
2000
3000
4000
5000
6000
Q1
/07
Q3
/07
Q1
/08
Q3
/08
Q1
/09
Q3
/09
Q1
/10
Q3
/10
Q1
/11
Q3
/11
Q1
/12
Q3
/12
Q1
/13
Q3
/13
Q1
/14
Q3
/14
GFCF Net Fixed Capital Formation
-60.0
-40.0
-20.0
0.0
20.0
40.0
60.0
1996
1997
1998
1999
2000
2001
2002
2003
2004
2005
2006
2007
2008
2009
2010
2011
2012
2013
2014
Residential (% of total) Residential (YoY% change)
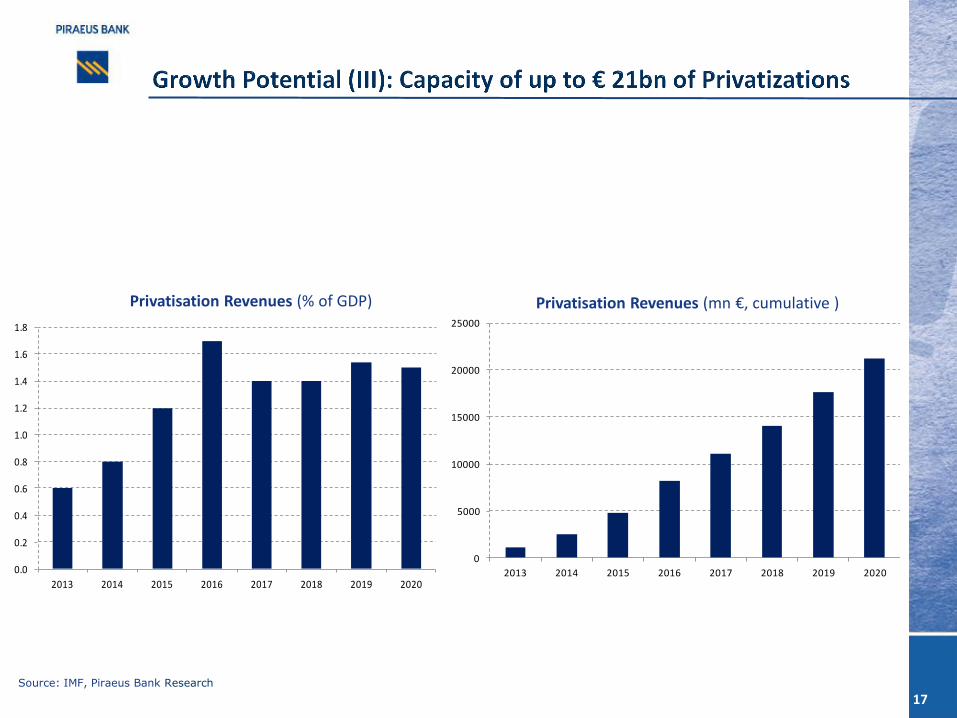
Source: IMF, Piraeus Bank Research
Privatisation Revenues (% of GDP)
17
Privatisation Revenues (mn €, cumulative )
0.0
0.2
0.4
0.6
0.8
1.0
1.2
1.4
1.6
1.8
2013 2014 2015 2016 2017 2018 2019 2020
0
5000
10000
15000
20000
25000
2013 2014 2015 2016 2017 2018 2019 2020

Disclaimer: This note constitute an investment advertisement, is intended solely for information purposes and it cannot in any way be considered investment
advice, offer or recommendation to enter into any transaction. The information included in this note may not be construed as suitable investment for the holder,
nor may it be considered as an instrument to accomplish specific investment goals or relevant financial needs of the holder and may neither be reckoned as a
substitute to relevant contractual agreements between the Bank and the holder. Before entering into any transaction each individual investor should evaluate the
information contained in this note and not base his/her decision solely on the information provided. This note cannot be considered investment research and
consequently it was not compiled by Piraeus Bank according to the requirements of the law that are intended to ensure independence in the sector of investment
research. Information comprised in this note is based on publically available sources that are considered to be reliable. Piraeus Bank cannot be held accountable
for the accuracy or completeness of the information contained in this note. Views and estimates brought forward in this note represent domestic and international
market trends on the date indicated in the note and they are subject to alteration without previous warning. Piraeus Bank may also include in this note investment
research done by third parties. This information is not modified in any way, consequently the Bank cannot be held accountable for the content. The Piraeus Bank
Group is and organization with a considerable domestic and international presence, and provides a great variety of investment services. In cases where conflicts
of interest issues should arise while Piraeus Bank or the rest of the companies of the group provide investment services in relation to the information provided in
this note, Piraeus Bank and the companies of the Group should be underlined that (the list is not exhaustive): a) No restrictions apply in dealing for own account,
or with regards to trading in relation to portfolios managed by Piraeus Bank or companies of its group before the publication of this note, or with regards to trading
before an initial public offer. b) It is possible that investment or additional services are provided to the issuers included in this note against a fee. c) It is possible
that Bank or any of its subsidiaries participate in the share capital of any of the issuers included in this note or may attract other interests financial or not from them.
d) The Bank or any of its subsidiaries may act a market maker or an underwriter for any of the issuers included in the note. e) Piraeus Bank may have issued
similar notes with different or incompatible content with the content of this note. It should be explicitly noted that: a) Figures refer to past performances and past
performances do not constitute a safe indication for future performances. b) Figures constitute simulation of past performances and they are not a safe indication
of future performances. c) Any projections or other estimates are not safe indications for future performances. d) Taxation treatment of information provided in this
note may differ according to the rules that govern each individual investor. Therefore the holder should seek independent advice in relation to taxation rules that
may affect him/her. e) Piraeus Bank is not under any obligation to keep data and information provided herein updated.
18