greece public debt restructuring strategies & evaluation of the
TRANSCRIPT

Page 0
Greece
Public debt restructuring strategies &
evaluation of the agreed framework for debt relief
Dr. Platon Monokroussos Group Chief Economist Eurobank Ergasias S.A.
June 2016
Page 1
Foreword (*)
The study presented herein has been motivated by the recent (May 2016) publication of the IMF’s updated DSA and the agreement on the debt relief framework for Greece reached at the Eurogroup of May 24, 2016. It provides a detailed analysis of Greece’s future borrowing needs and gross public debt ratio based on the macroeconomic assumptions and the OSI modalities presented in the aforementioned publication. Furthermore, it compares these estimates with the estimates derived from a number of alternative scenarios, assuming different sets of macroeconomic conditions and fiscal policy targets. We believe that the analysis provides a useful framework for evaluating alternative strategies to make Greek public debt sustainable under the new definition of sustainability.
(*) see important disclaimer at the end of this document

Page 2
Background item I Agreement on debt relief for Greece reached at the Eurogroup of May 24, 2016
The Eurogroup elaborated further on the general guidelines for debt relief agreed on May 9. In more detail, an agreement was reached on a package of measures that will be subject to the pre-defined conditionality of the ESM programme and be phased in progressively so as to ensure that Greek public debt remains sustainable under the new definition of sustainability i.e., annual government gross financing needs < 15% of GDP during the post-programme period for the medium-term and < 20% of GDP thereafter.
One of the most important components of the May 24 Eurogroup agreement is that a decision to provide more substantial debt relief has been postponed for after the completion of the current programme (mid 2018) and upon the full implementation of the underlying conditionality. Arguably, this is because the funding commitments of the present programme are deemed to be adequate to cover Greece’s borrowing needs over the entire programme horizon (August 2015- August 2018).
An analysis of the debt relief framework agreed at the May 24th Eurogroup can be found in the Appendix
Page 3
Background item II IMF’s debt sustainability analysis for Greece (May 2016) – highlights
Some of the most important findings/implications of the Fund’s updated debt sustainability analysis are as follows: Under a no-policy-change scenario, Greece’s general government gross borrowing requirement is projected to
increase from c. 20% of GDP in 2017 to c. 60% of GDP in 2060, rendering the debt ratio highly unsustainable in the medium- & long-term (projected debt to GDP ratio at c. 250% at the end of the forecasting horizon).
As explained by the IMF staff, this unsustainable trajectory is due to a) downward revisions in the medium- and
long-term projections for GDP growth and the primary balance relative to their previous DSA (June 2015) and b) the fact that after the termination of the present programme, Greece will need to re-access market financing and thus, roll over maturing debt at interest rates that are projected to be much higher than the current (concessional) ones paid on official loans.
In order to address the issue of sustainability, the IMF presented an indicative debt relief package for Greece (OSI)
that includes significant extensions of official loan maturities, extended grace periods for interest and amortization payments and the fixing of interest rates on (old and new) EU loans through long-term ESM borrowing from financial markets. According to the IMF estimates, such a package would be adequate to meet the new definition of debt sustainability (gross funding needs projected to be no high than 15% of GDP until 2040, before converging gradually to c. 20% of GDP by 2060).
In addition to the above, the IMF emphasizes the need to bring forward significant debt relief for Greece (i.e., in a
gradual/conditional manner and before the expiration of the current programme) so as to facilitate a swift restoration of investor confidence towards the country.
In the analysis included in this report we present the (stock and cash-flow) implications of an OSI package that bears significant similarities with that proposed by the IMF as well as the potential impact of a range of alternative scenarios.

Page 4
Part 1
Greek public debt: DSA & restructuring strategies
Key findings & policy implications
Page 5
DSA & restructuring strategies
No debt relief scenarios
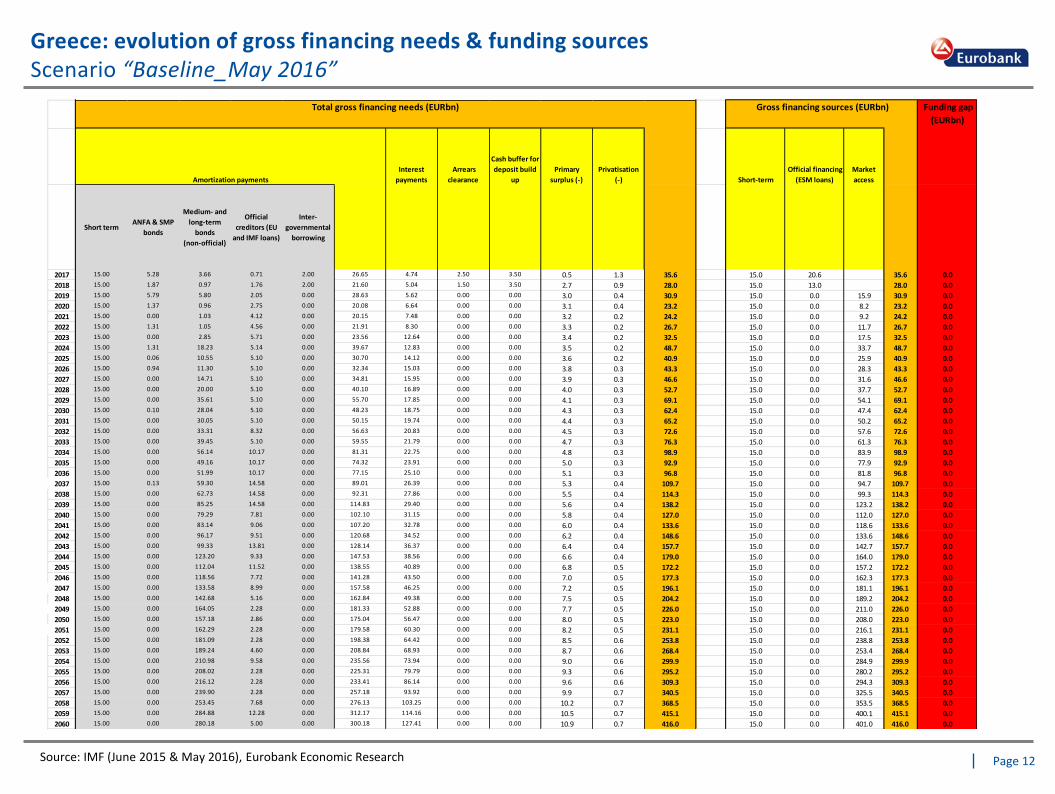
Based on the macroeconomic assumptions of the latest IMF DSA (May 2016) and assuming a debt relief package that bears significant similarities with that presented in the aforementioned analysis, we project an unsustainable trajectory for future public finances (general government gross borrowing needs approach 60% of GDP and debt ratio hits c. 250% of GDP in 2060). For purely demonstrative purposes, we consider this scenario as baseline.
Under a more benign macro scenario assuming a general government primary surplus of c. 2.0% of GDP (vs. 1.5%
of GDP in the baseline) and somewhat higher medium- & long-term real GDP growth (c. 1.5% vs. 1.2% assumed in the baseline) the gross funding need reaches c. 44% of GDP in 2060, but surpasses the 20% of GDP sustainability threshold from 2028 onwards.
On the other hand, a more downbeat macro outlook than that assumed in the baseline (steady-state real GDP
growth of only 1% and a lower primary balance of 1% of GDP) instigates a further significant deterioration of fiscal dynamics, with the gross funding need reaching levels above 70% by 2060.
It goes without saying that the aforementioned projections are highly sensitive to underlying assumptions for the
evolution of the macro economy, the primary fiscal balance and the prevailing market rates for refinancing Greek debt after the current programme expires.
It is important to note that under a scenario that assumes a) slightly higher real GDP growth at steady-state (1.5%
vs. 1.2% in the baseline); b) a primary surplus of 3.5% of GDP from 2018 onwards; and c) c. €50bn in privatization revenue in 2016-2060 (vs. c. €20bn in the baseline), the gross funding need remains mostly below 20% of GDP over the entire projection horizon, lessening the need for substantial debt relief down the road.

Page 6
DSA & restructuring strategies
Debt relief strategies
Assuming a debt relief strategy (OSI) with modalities that bear significant similarities with the debt relief package presented in the IMF’s May 2016 DSA, we find that fiscal accounts remain sustainable throughout the projection horizon.
Under the aforementioned scenario, gross funding needs peak near the 20%-of-GDP threshold in 2060, remaining well below that level for most of the projection horizon. Furthermore, the debt ratio reached c. 100%-of-GDP in 2060 (vs. 250% in the baseline) and the relief package generates savings of more than 40% of GDP in NPV terms.
Notably, the scenario described above does not involve outright debt forgiveness (i.e., notional haircuts), but
hypothesizes a significant lengthening of EU loan maturities, extended grace periods of interest and amortizations payments and the fixing of interest rates on EFSF/ESM loans to 1.5% until 2040 and 3.8% afterwards.
Under an even more favorable OSI package that a) fixes the interest rate on all EFSF/ESM loans to 1.0% until 2040
and to 3.0% afterwards; and b) cuts the interest on GLF loans by 50bps, the gross funding need remains well below 20% of GDP throughout the entire projection horizon, with a peak near 17% materializing no earlier than in 2060.

Page 7
DSA & restructuring strategies
Concluding remarks & policy implications
The analysis presented in this study argues strongly in favor of substantial debt relief for Greece from the official sector,
with characteristics and modalities that are in broad agreement with the framework decided at the May 24 Eurogroup.
This would be necessary to address gradually increasing funding challenges in the years after the expiration of the present programme due to the need to refinance a rising volume of expiring public debt at market interest rates significantly higher than the current (concessional) ones applied on official loans.
The main aim of such debt relief would be to postpone interest and amortization payments on official loans for a extended
period of time, lengthen loan maturities and fixing interest rates so as to provide the necessary fiscal space for the economy to grow, allow substantial savings in NPV terms and hedge the risk of unforeseen spikes in Euribor & EFSF/ESM funding rates in outer years.
Even more importantly, our analysis demonstrates (in broad agreement with the IMF’s May DSA) that a debt re-profiling
package involving no notional haircuts could be structured in such a way so as to ensure debt sustainability (under the revised, cash-flow related definition) even under scenarios that assume a substantial relaxation of the present primary fiscal targets.
As we have repeatedly noted in our earlier studies on the subject, a quick resumption of domestic growth and compliance
with programme targets would be instrumental in improving debt dynamics and facilitating the provision of a substantial debt relief package from the official sector.
Finally, the front loading of substantial debt relief (based on e.g. certain programme milestones) could engineer a quicker stabilization of investor confidence towards Greece than would otherwise be the case.

Page 8
Part 2
Greek public debt: DSA & restructuring strategies
Analysis based on the IMF’s macro projections (June 2015 & May 2016) &
a number of additional assumptions made by Eurobank Economic Research (*)
(*) important note: Some of the estimates presented in this report may deviate from these presented in the IMF’s May 2016 DSA analysis on Greece due to differences in some underlying assumptions
Page 9
Greece: DSA scenarios key assumptions
Source: IMF (June 2015 & May 2016), Eurobank Economic Research
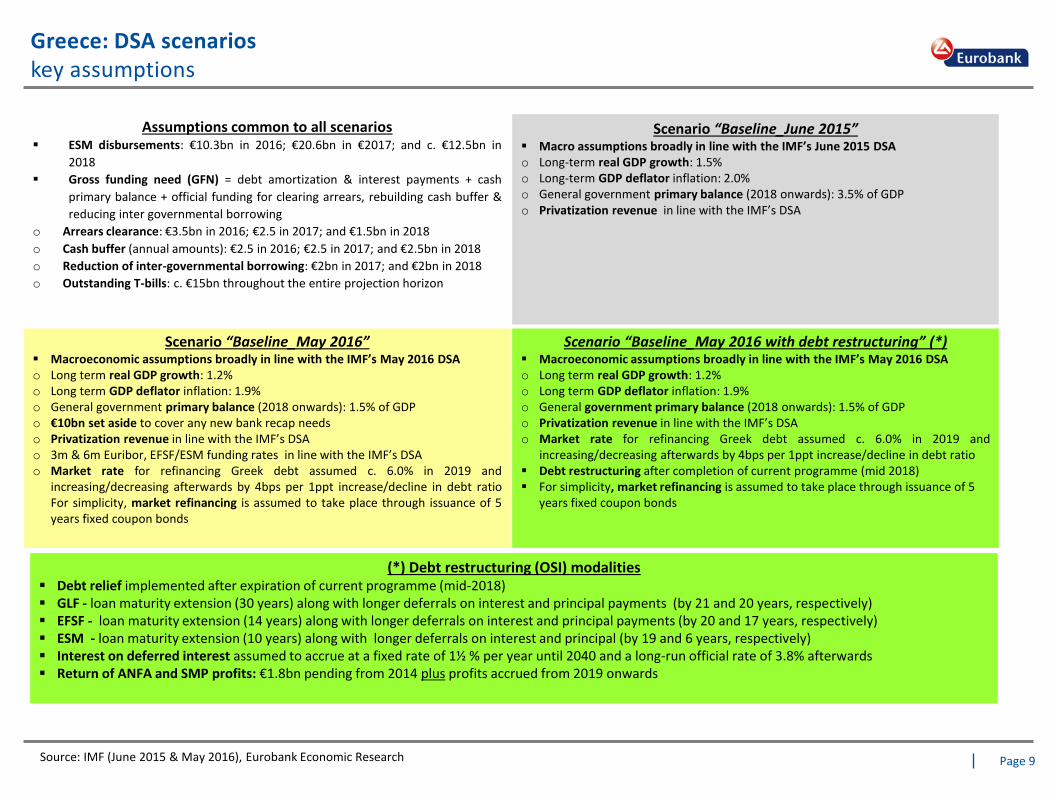
Assumptions common to all scenarios ESM disbursements: €10.3bn in 2016; €20.6bn in €2017; and c. €12.5bn in
2018
Gross funding need (GFN) = debt amortization & interest payments + cash
primary balance + official funding for clearing arrears, rebuilding cash buffer &
reducing inter governmental borrowing
o Arrears clearance: €3.5bn in 2016; €2.5 in 2017; and €1.5bn in 2018
o Cash buffer (annual amounts): €2.5 in 2016; €2.5 in 2017; and €2.5bn in 2018
o Reduction of inter-governmental borrowing: €2bn in 2017; and €2bn in 2018
o Outstanding T-bills: c. €15bn throughout the entire projection horizon
Scenario “Baseline_June 2015” Macro assumptions broadly in line with the IMF’s June 2015 DSA o Long-term real GDP growth: 1.5% o Long-term GDP deflator inflation: 2.0% o General government primary balance (2018 onwards): 3.5% of GDP o Privatization revenue in line with the IMF’s DSA
Scenario “Baseline_May 2016” Macroeconomic assumptions broadly in line with the IMF’s May 2016 DSA o Long term real GDP growth: 1.2% o Long term GDP deflator inflation: 1.9% o General government primary balance (2018 onwards): 1.5% of GDP o €10bn set aside to cover any new bank recap needs o Privatization revenue in line with the IMF’s DSA o 3m & 6m Euribor, EFSF/ESM funding rates in line with the IMF’s DSA o Market rate for refinancing Greek debt assumed c. 6.0% in 2019 and
increasing/decreasing afterwards by 4bps per 1ppt increase/decline in debt ratio For simplicity, market refinancing is assumed to take place through issuance of 5 years fixed coupon bonds
Scenario “Baseline_May 2016 with debt restructuring” (*) Macroeconomic assumptions broadly in line with the IMF’s May 2016 DSA o Long term real GDP growth: 1.2% o Long term GDP deflator inflation: 1.9% o General government primary balance (2018 onwards): 1.5% of GDP o Privatization revenue in line with the IMF’s DSA o Market rate for refinancing Greek debt assumed c. 6.0% in 2019 and
increasing/decreasing afterwards by 4bps per 1ppt increase/decline in debt ratio Debt restructuring after completion of current programme (mid 2018) For simplicity, market refinancing is assumed to take place through issuance of 5
years fixed coupon bonds
(*) Debt restructuring (OSI) modalities Debt relief implemented after expiration of current programme (mid-2018) GLF - loan maturity extension (30 years) along with longer deferrals on interest and principal payments (by 21 and 20 years, respectively) EFSF - loan maturity extension (14 years) along with longer deferrals on interest and principal payments (by 20 and 17 years, respectively) ESM - loan maturity extension (10 years) along with longer deferrals on interest and principal (by 19 and 6 years, respectively) Interest on deferred interest assumed to accrue at a fixed rate of 1½ % per year until 2040 and a long-run official rate of 3.8% afterwards Return of ANFA and SMP profits: €1.8bn pending from 2014 plus profits accrued from 2019 onwards

Page 10
Greece: evolution of general government gross funding needs
Source: IMF (June 2015 & May 2016), Eurobank Economic Research
General government gross funding needs (GFN) as % of GDP

Page 11
Greece: evolution of general government debt to GDP ratio
Source: IMF (June 2015 & May 2016), Eurobank Economic Research
General government gross public debt (% GDP)
Page 12
Greece: evolution of gross financing needs & funding sources Scenario “Baseline_May 2016”
Source: IMF (June 2015 & May 2016), Eurobank Economic Research
Funding gap
(EURbn)
Interest
payments
Arrears
clearance
Cash buffer for
deposit build
up
Primary
surplus (-)
Privatisation
(-) Short-term
Official financing
(ESM loans)
Market
access
Short term ANFA & SMP
bonds
Medium- and
long-term
bonds
(non-official)
Official
creditors (EU
and IMF loans)
Inter-
governmental
borrowing
2017 15.00 5.28 3.66 0.71 2.00 26.65 4.74 2.50 3.50 0.5 1.3 35.6 15.0 20.6 35.6 0.0
2018 15.00 1.87 0.97 1.76 2.00 21.60 5.04 1.50 3.50 2.7 0.9 28.0 15.0 13.0 28.0 0.0
2019 15.00 5.79 5.80 2.05 0.00 28.63 5.62 0.00 0.00 3.0 0.4 30.9 15.0 0.0 15.9 30.9 0.0
2020 15.00 1.37 0.96 2.75 0.00 20.08 6.64 0.00 0.00 3.1 0.4 23.2 15.0 0.0 8.2 23.2 0.0
2021 15.00 0.00 1.03 4.12 0.00 20.15 7.48 0.00 0.00 3.2 0.2 24.2 15.0 0.0 9.2 24.2 0.0
2022 15.00 1.31 1.05 4.56 0.00 21.91 8.30 0.00 0.00 3.3 0.2 26.7 15.0 0.0 11.7 26.7 0.0
2023 15.00 0.00 2.85 5.71 0.00 23.56 12.64 0.00 0.00 3.4 0.2 32.5 15.0 0.0 17.5 32.5 0.0
2024 15.00 1.31 18.23 5.14 0.00 39.67 12.83 0.00 0.00 3.5 0.2 48.7 15.0 0.0 33.7 48.7 0.0
2025 15.00 0.06 10.55 5.10 0.00 30.70 14.12 0.00 0.00 3.6 0.2 40.9 15.0 0.0 25.9 40.9 0.0
2026 15.00 0.94 11.30 5.10 0.00 32.34 15.03 0.00 0.00 3.8 0.3 43.3 15.0 0.0 28.3 43.3 0.0
2027 15.00 0.00 14.71 5.10 0.00 34.81 15.95 0.00 0.00 3.9 0.3 46.6 15.0 0.0 31.6 46.6 0.0
2028 15.00 0.00 20.00 5.10 0.00 40.10 16.89 0.00 0.00 4.0 0.3 52.7 15.0 0.0 37.7 52.7 0.0
2029 15.00 0.00 35.61 5.10 0.00 55.70 17.85 0.00 0.00 4.1 0.3 69.1 15.0 0.0 54.1 69.1 0.0
2030 15.00 0.10 28.04 5.10 0.00 48.23 18.75 0.00 0.00 4.3 0.3 62.4 15.0 0.0 47.4 62.4 0.0
2031 15.00 0.00 30.05 5.10 0.00 50.15 19.74 0.00 0.00 4.4 0.3 65.2 15.0 0.0 50.2 65.2 0.0
2032 15.00 0.00 33.31 8.32 0.00 56.63 20.83 0.00 0.00 4.5 0.3 72.6 15.0 0.0 57.6 72.6 0.0
2033 15.00 0.00 39.45 5.10 0.00 59.55 21.79 0.00 0.00 4.7 0.3 76.3 15.0 0.0 61.3 76.3 0.0
2034 15.00 0.00 56.14 10.17 0.00 81.31 22.75 0.00 0.00 4.8 0.3 98.9 15.0 0.0 83.9 98.9 0.0
2035 15.00 0.00 49.16 10.17 0.00 74.32 23.91 0.00 0.00 5.0 0.3 92.9 15.0 0.0 77.9 92.9 0.0
2036 15.00 0.00 51.99 10.17 0.00 77.15 25.10 0.00 0.00 5.1 0.3 96.8 15.0 0.0 81.8 96.8 0.0
2037 15.00 0.13 59.30 14.58 0.00 89.01 26.39 0.00 0.00 5.3 0.4 109.7 15.0 0.0 94.7 109.7 0.0
2038 15.00 0.00 62.73 14.58 0.00 92.31 27.86 0.00 0.00 5.5 0.4 114.3 15.0 0.0 99.3 114.3 0.0
2039 15.00 0.00 85.25 14.58 0.00 114.83 29.40 0.00 0.00 5.6 0.4 138.2 15.0 0.0 123.2 138.2 0.0
2040 15.00 0.00 79.29 7.81 0.00 102.10 31.15 0.00 0.00 5.8 0.4 127.0 15.0 0.0 112.0 127.0 0.0
2041 15.00 0.00 83.14 9.06 0.00 107.20 32.78 0.00 0.00 6.0 0.4 133.6 15.0 0.0 118.6 133.6 0.0
2042 15.00 0.00 96.17 9.51 0.00 120.68 34.52 0.00 0.00 6.2 0.4 148.6 15.0 0.0 133.6 148.6 0.0
2043 15.00 0.00 99.33 13.81 0.00 128.14 36.37 0.00 0.00 6.4 0.4 157.7 15.0 0.0 142.7 157.7 0.0
2044 15.00 0.00 123.20 9.33 0.00 147.53 38.56 0.00 0.00 6.6 0.4 179.0 15.0 0.0 164.0 179.0 0.0
2045 15.00 0.00 112.04 11.52 0.00 138.55 40.89 0.00 0.00 6.8 0.5 172.2 15.0 0.0 157.2 172.2 0.0
2046 15.00 0.00 118.56 7.72 0.00 141.28 43.50 0.00 0.00 7.0 0.5 177.3 15.0 0.0 162.3 177.3 0.0
2047 15.00 0.00 133.58 8.99 0.00 157.58 46.25 0.00 0.00 7.2 0.5 196.1 15.0 0.0 181.1 196.1 0.0
2048 15.00 0.00 142.68 5.16 0.00 162.84 49.38 0.00 0.00 7.5 0.5 204.2 15.0 0.0 189.2 204.2 0.0
2049 15.00 0.00 164.05 2.28 0.00 181.33 52.88 0.00 0.00 7.7 0.5 226.0 15.0 0.0 211.0 226.0 0.0
2050 15.00 0.00 157.18 2.86 0.00 175.04 56.47 0.00 0.00 8.0 0.5 223.0 15.0 0.0 208.0 223.0 0.0
2051 15.00 0.00 162.29 2.28 0.00 179.58 60.30 0.00 0.00 8.2 0.5 231.1 15.0 0.0 216.1 231.1 0.0
2052 15.00 0.00 181.09 2.28 0.00 198.38 64.42 0.00 0.00 8.5 0.6 253.8 15.0 0.0 238.8 253.8 0.0
2053 15.00 0.00 189.24 4.60 0.00 208.84 68.93 0.00 0.00 8.7 0.6 268.4 15.0 0.0 253.4 268.4 0.0
2054 15.00 0.00 210.98 9.58 0.00 235.56 73.94 0.00 0.00 9.0 0.6 299.9 15.0 0.0 284.9 299.9 0.0
2055 15.00 0.00 208.02 2.28 0.00 225.31 79.79 0.00 0.00 9.3 0.6 295.2 15.0 0.0 280.2 295.2 0.0
2056 15.00 0.00 216.12 2.28 0.00 233.41 86.14 0.00 0.00 9.6 0.6 309.3 15.0 0.0 294.3 309.3 0.0
2057 15.00 0.00 239.90 2.28 0.00 257.18 93.92 0.00 0.00 9.9 0.7 340.5 15.0 0.0 325.5 340.5 0.0
2058 15.00 0.00 253.45 7.68 0.00 276.13 103.25 0.00 0.00 10.2 0.7 368.5 15.0 0.0 353.5 368.5 0.0
2059 15.00 0.00 284.88 12.28 0.00 312.17 114.16 0.00 0.00 10.5 0.7 415.1 15.0 0.0 400.1 415.1 0.0
2060 15.00 0.00 280.18 5.00 0.00 300.18 127.41 0.00 0.00 10.9 0.7 416.0 15.0 0.0 401.0 416.0 0.0
Amortization payments
Gross financing sources (EURbn) Total gross financing needs (EURbn)

Page 13
Greece: evolution of gross financing needs & funding sources Scenario “Baseline_May 2016 with debt restructuring”
Source: IMF (June 2015 & May 2016), Eurobank Economic Research
Interest
payments
Arrears
clearance
Cash buffer for
deposit build up
Primary
surplus (-)
Privatisation
(-)
Return of ANFA &
SMP profits (-) Short-term
Official financing
(ESM loans) Market access
Short term ANFA & SMP
bonds
Medium- and
long-term bonds
(non-official)
Official creditors
(EU and IMF
loans)
Inter-
governmental
borrowing
2017 15.00 5.28 3.66 0.71 2.00 26.65 4.55 2.50 3.50 0.5 0.91 35.78 15.0 20.8 35.8 0.0
2018 15.00 1.87 0.97 1.76 2.00 21.60 4.73 1.50 3.50 2.6 0.90 27.83 15.0 12.8 27.8 0.0
2019 15.00 5.79 5.80 2.05 0.00 28.63 3.26 0.00 0.00 3.0 0.40 1.80 26.71 15.0 0.0 11.7 26.7 0.0
2020 15.00 1.37 0.96 2.05 0.00 19.37 3.40 0.00 0.00 3.1 0.41 0.55 18.71 15.0 0.0 3.7 18.7 0.0
2021 15.00 0.00 1.03 2.05 0.00 18.08 3.65 0.00 0.00 3.2 0.21 0.00 18.30 15.0 0.0 3.3 18.3 0.0
2022 15.00 1.31 1.05 1.91 0.00 19.26 3.84 0.00 0.00 3.3 0.22 0.52 19.04 15.0 0.0 4.0 19.0 0.0
2023 15.00 0.00 2.85 1.34 0.00 19.19 5.39 0.00 0.00 3.4 0.23 0.00 20.92 15.0 0.0 5.9 20.9 0.0
2024 15.00 1.31 14.07 0.28 0.00 30.66 4.06 0.00 0.00 3.5 0.24 0.52 30.42 15.0 0.0 15.4 30.4 0.0
2025 15.00 0.06 6.05 0.00 0.00 21.11 3.98 0.00 0.00 3.6 0.24 0.02 21.17 15.0 0.0 6.2 21.2 0.0
2026 15.00 0.94 5.40 0.00 0.00 21.34 3.98 0.00 0.00 3.8 0.25 0.37 20.93 15.0 0.0 5.9 20.9 0.0
2027 15.00 0.00 7.09 0.00 0.00 22.09 3.96 0.00 0.00 3.9 0.26 0.00 21.90 15.0 0.0 6.9 21.9 0.0
2028 15.00 0.00 8.38 0.00 0.00 23.38 3.95 0.00 0.00 4.0 0.27 0.00 23.05 15.0 0.0 8.1 23.1 0.0
2029 15.00 0.00 17.29 0.00 0.00 32.29 3.92 0.00 0.00 4.1 0.28 0.00 31.80 15.0 0.0 16.8 31.8 0.0
2030 15.00 0.10 8.28 0.00 0.00 23.38 3.83 0.00 0.00 4.3 0.28 0.04 22.62 15.0 0.0 7.6 22.6 0.0
2031 15.00 0.00 7.63 0.00 0.00 22.63 3.79 0.00 0.00 4.4 0.29 0.00 21.73 15.0 0.0 6.7 21.7 0.0
2032 15.00 0.00 8.60 0.00 0.00 23.60 3.75 0.00 0.00 4.5 0.30 0.00 22.51 15.0 0.0 7.5 22.5 0.0
2033 15.00 0.00 9.79 0.00 0.00 24.79 3.70 0.00 0.00 4.7 0.31 0.00 23.50 15.0 0.0 8.5 23.5 0.0
2034 15.00 0.00 18.80 0.00 0.00 33.80 3.65 0.00 0.00 4.8 0.32 0.00 32.30 15.0 0.0 17.3 32.3 0.0
2035 15.00 0.00 9.35 0.00 0.00 24.35 3.60 0.00 0.00 5.0 0.33 0.00 22.62 15.0 0.0 7.6 22.6 0.0
2036 15.00 0.00 8.53 0.00 0.00 23.53 3.53 0.00 0.00 5.1 0.34 0.00 21.57 15.0 0.0 6.6 21.6 0.0
2037 15.00 0.13 9.19 0.00 0.00 24.33 3.45 0.00 0.00 5.3 0.35 0.05 22.06 15.0 0.0 7.1 22.1 0.0
2038 15.00 0.00 9.89 0.00 0.00 24.89 3.36 0.00 0.00 5.5 0.37 0.00 22.41 15.0 0.0 7.4 22.4 0.0
2039 15.00 0.00 18.64 2.57 0.00 36.21 4.69 0.00 0.00 5.6 0.38 0.00 34.87 15.0 0.0 19.9 34.9 0.0
2040 15.00 0.00 9.00 3.50 0.00 27.50 8.35 0.00 0.00 5.8 0.39 0.00 29.64 15.0 0.0 14.6 29.6 0.0
2041 15.00 0.00 7.94 21.65 0.00 44.59 14.84 0.00 0.00 6.0 0.40 0.00 53.01 15.0 0.0 38.0 53.0 0.0
2042 15.00 0.00 8.50 7.90 0.00 31.40 15.85 0.00 0.00 6.2 0.41 0.00 40.64 15.0 0.0 25.6 40.6 0.0
2043 15.00 0.00 7.41 7.90 0.00 30.31 16.37 0.00 0.00 6.4 0.43 0.00 39.86 15.0 0.0 24.9 39.9 0.0
2044 15.00 0.00 19.87 7.90 0.00 42.78 16.90 0.00 0.00 6.6 0.44 0.00 52.64 15.0 0.0 37.6 52.6 0.0
2045 15.00 0.00 14.64 7.90 0.00 37.54 17.45 0.00 0.00 6.8 0.45 0.00 47.72 15.0 0.0 32.7 47.7 0.0
2046 15.00 0.00 38.01 7.90 0.00 60.92 18.01 0.00 0.00 7.0 0.47 0.00 71.43 15.0 0.0 56.4 71.4 0.0
2047 15.00 0.00 25.64 7.90 0.00 48.54 18.58 0.00 0.00 7.2 0.48 0.00 59.39 15.0 0.0 44.4 59.4 0.0
2048 15.00 0.00 24.86 7.90 0.00 47.77 19.17 0.00 0.00 7.5 0.50 0.00 58.96 15.0 0.0 44.0 59.0 0.0
2049 15.00 0.00 37.64 10.54 0.00 63.18 19.77 0.00 0.00 7.7 0.51 0.00 74.72 15.0 0.0 59.7 74.7 0.0
2050 15.00 0.00 32.72 16.15 0.00 63.88 20.40 0.00 0.00 8.0 0.53 0.00 75.80 15.0 0.0 60.8 75.8 0.0
2051 15.00 0.00 56.43 16.15 0.00 87.58 21.10 0.00 0.00 8.2 0.55 0.00 99.93 15.0 0.0 84.9 99.9 0.0
2052 15.00 0.00 44.39 16.15 0.00 75.55 21.81 0.00 0.00 8.5 0.56 0.00 88.32 15.0 0.0 73.3 88.3 0.0
2053 15.00 0.00 43.96 10.54 0.00 69.50 22.55 0.00 0.00 8.7 0.58 0.00 82.73 15.0 0.0 67.7 82.7 0.0
2054 15.00 0.00 59.72 11.97 0.00 86.70 23.26 0.00 0.00 9.0 0.60 0.00 100.34 15.0 0.0 85.3 100.3 0.0
2055 15.00 0.00 60.80 26.61 0.00 102.40 24.00 0.00 0.00 9.3 0.62 0.00 116.48 15.0 0.0 101.5 116.5 0.0
2056 15.00 0.00 84.93 25.39 0.00 125.32 24.87 0.00 0.00 9.6 0.64 0.00 139.95 15.0 0.0 125.0 140.0 0.0
2057 15.00 0.00 74.46 9.75 0.00 99.21 25.74 0.00 0.00 9.9 0.66 0.00 114.40 15.0 0.0 99.4 114.4 0.0
2058 15.00 0.00 67.73 16.51 0.00 99.23 26.55 0.00 0.00 10.2 0.68 0.00 114.89 15.0 0.0 99.9 114.9 0.0
2059 15.00 0.00 85.34 7.74 0.00 108.08 27.41 0.00 0.00 10.5 0.70 0.00 124.25 15.0 0.0 109.3 124.3 0.0
2060 15.00 0.00 101.48 7.74 0.00 124.22 28.24 0.00 0.00 10.9 0.72 0.00 140.88 15.0 0.0 125.9 140.9 0.0
Funding
gap (EUR
bn)
Total gross financing needs (EURbn)
Amortization payments
Gross financing sources EUR bn)

Page 14
Greece: amortization & interest payments (% GDP) Assuming market access is re-established post-2018 to cover projected funding gaps
Source: IMF (June 2015 & May 2016), Eurobank Economic Research
Scenario “Baseline_May 2016” Scenario “Baseline_May 2016 with debt restructuring”

Page 15
Greece: cash flow & stock relief due to debt re-profiling (% of GDP)
Source: IMF (June 2015 & May 2016), Eurobank Economic Research
Cash flow relief Time evolution of NPV savings as % of GDP (*)
from t0 = 2017 to T = 2060 “Baseline_May 2016” Vs. “Baseline_May 2016 with debt
restructuring”
(*) Discount rate for NPV calculation assumed at 3%
Stock relief Decline of debt to GDP ratio due to debt re-profiling
“Baseline_May 2016” Vs. “Baseline_May 2016 with debt restructuring”
Acknowledgement: The Author would like to thank Christos Pnevmatikatos, Head International ALM & Trading of Eurobank, for his assistance in deriving the NPV calculations

Page 16
Part 3
Greek public debt: DSA & restructuring strategies
Other scenarios
Page 17
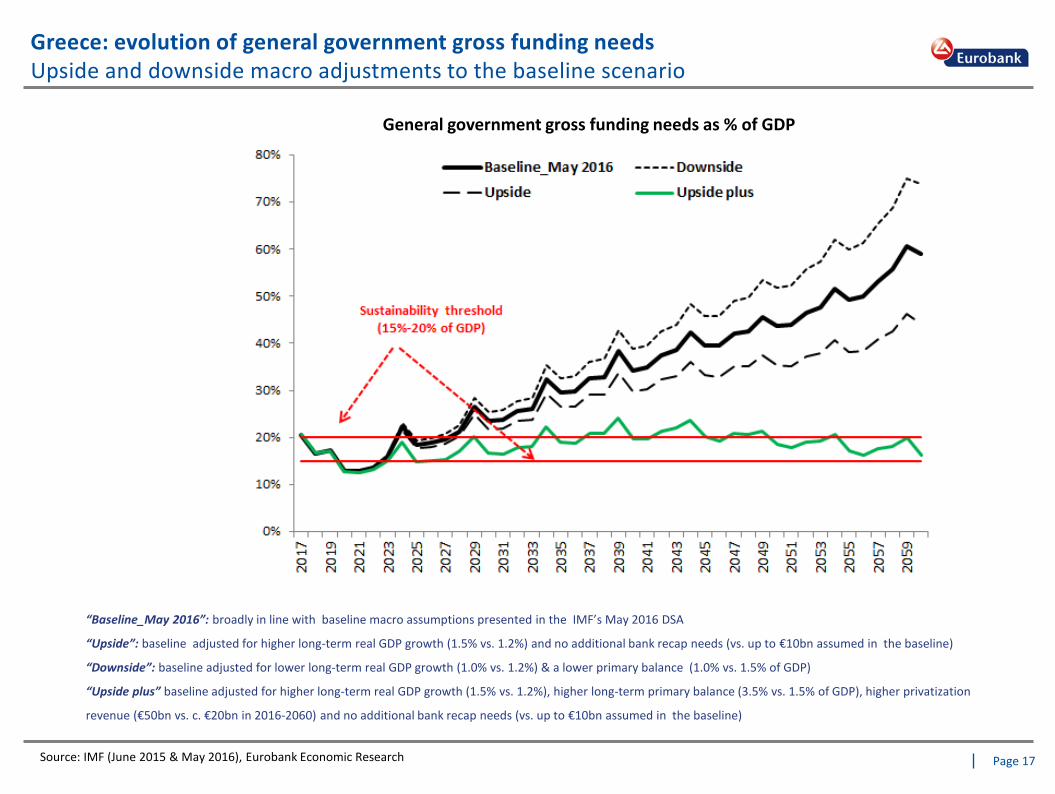
Greece: evolution of general government gross funding needs Upside and downside macro adjustments to the baseline scenario
Source: IMF (June 2015 & May 2016), Eurobank Economic Research
General government gross funding needs as % of GDP
“Baseline_May 2016”: broadly in line with baseline macro assumptions presented in the IMF’s May 2016 DSA
“Upside”: baseline adjusted for higher long-term real GDP growth (1.5% vs. 1.2%) and no additional bank recap needs (vs. up to €10bn assumed in the baseline)
“Downside”: baseline adjusted for lower long-term real GDP growth (1.0% vs. 1.2%) & a lower primary balance (1.0% vs. 1.5% of GDP)
“Upside plus” baseline adjusted for higher long-term real GDP growth (1.5% vs. 1.2%), higher long-term primary balance (3.5% vs. 1.5% of GDP), higher privatization
revenue (€50bn vs. c. €20bn in 2016-2060) and no additional bank recap needs (vs. up to €10bn assumed in the baseline)

Page 18
Greece: evolution of general government gross funding needs Upside and downside macro adjustments to the debt restructuring scenario
Source: IMF (June 2015 & May 2016), Eurobank Economic Research
General government gross funding needs as % of GDP
“Baseline_May 2016 with debt restructuring”: based on the macroeconomic assumptions & proposed OSI modalities presented in the IMF’s May 2016 DSA
“Upside”: baseline debt relief scenario adjusted for somewhat higher long-term real GDP growth (1.5% vs. 1.2%) and no additional bank recap needs (vs. up to €10bn
assumed in the baseline)
“Downside”: baseline debt relief scenario adjusted for lower long-term real GDP growth (1.0% vs. 1.2%) & a lower primary balance (1.0% vs. 1.5% of GDP)

Page 19
Greece: evolution of general government gross funding needs Other scenarios
Source: IMF (June 2015 & May 2016), Eurobank Economic Research
General government gross funding needs as % of GDP
“Baseline_May 2016”: broadly in line with baseline macro assumptions presented in the IMF’s May 2016 DSA
“Baseline_May 2016 with debt restructuring”: based on the macroeconomic assumptions & proposed OSI modalities presented in the IMF’s May 2016 DSA
“Baseline_May 2016 with debt restructuring plus: restructuring scenario assuming fixing of interest rates on official loans at 1% until 2040 and 3% afterwards (vs.
1.5% and 3.8% assumed in the IMF’s May 2016 DSA proposal)
Page 20
Appendix

Page 21
Debt relief measures for Greece agreed at the Eurogroup of May 24, 2016
Page 22
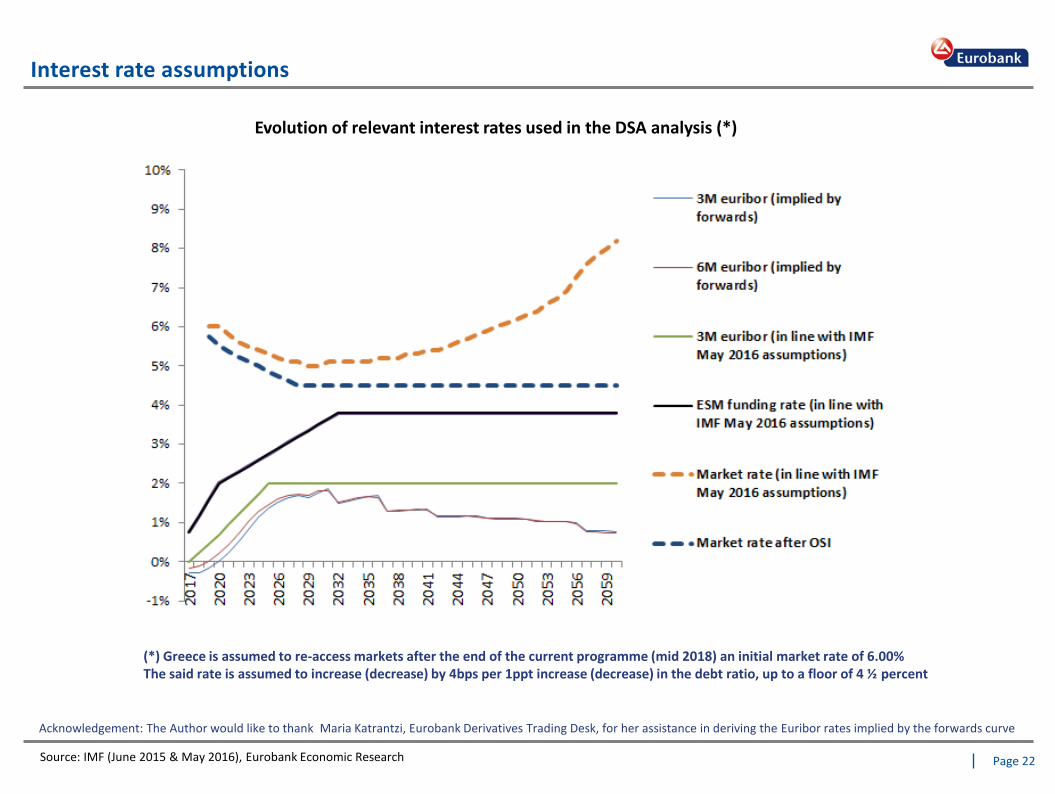
Interest rate assumptions
Source: IMF (June 2015 & May 2016), Eurobank Economic Research
Evolution of relevant interest rates used in the DSA analysis (*)
(*) Greece is assumed to re-access markets after the end of the current programme (mid 2018) an initial market rate of 6.00% The said rate is assumed to increase (decrease) by 4bps per 1ppt increase (decrease) in the debt ratio, up to a floor of 4 ½ percent
Acknowledgement: The Author would like to thank Maria Katrantzi, Eurobank Derivatives Trading Desk, for her assistance in deriving the Euribor rates implied by the forwards curve

Page 23
23
This document has been issued by Eurobank Ergasias S.A. (Eurobank) and may not be reproduced in any manner. The information provided has been obtained from sources believed to be reliable but has not been verified by Eurobank and the opinions expressed are exclusively of their author. This information does not constitute an investment advice or any other advice or an offer to buy or sell or a solicitation of an offer to buy or sell or an offer or a solicitation to execute transactions on the financial instruments mentioned. The investments discussed may be unsuitable for investors, depending on their specific investment objectives, their needs, their investment experience and financial position. No representation or warranty (express or implied) is made as to the accuracy, completeness, correctness, timeliness or fairness of the information or opinions, all of which are subject to change without notice. No responsibility or liability, whatsoever or howsoever arising, is accepted in relation to the contents thereof by Eurobank or any of its directors, officers and employees.
Disclaimer