greater philadelphia 2014 select greater philadelphia
TRANSCRIPT
Greater Philadelphia 2014
Select Greater Philadelphia
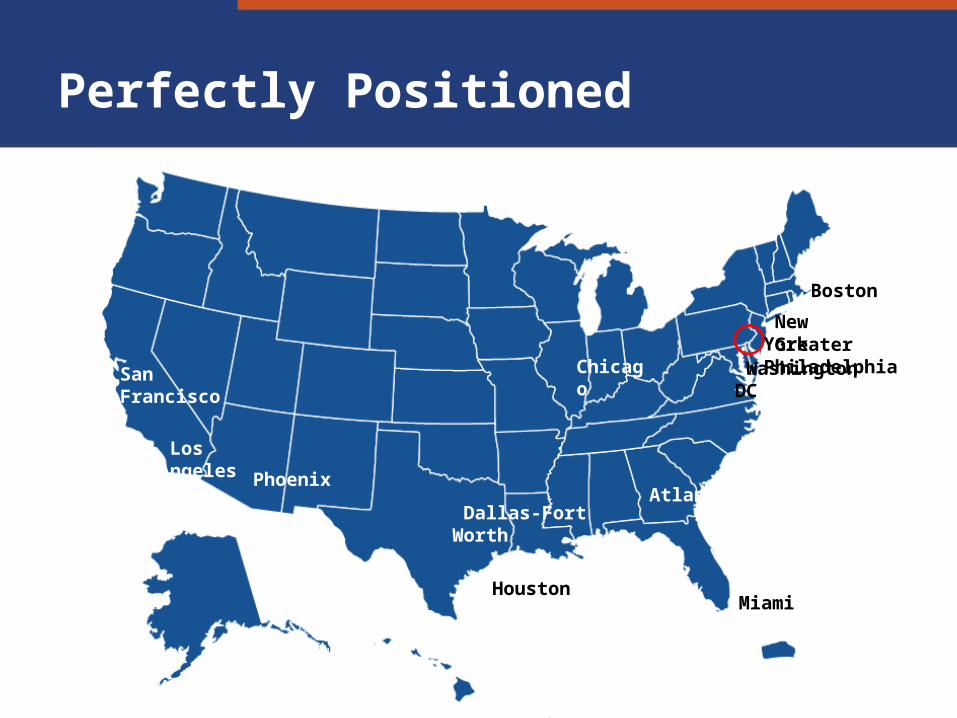
Perfectly Positioned
New York
San Francisco
Los Angeles
Greater Philadelphia
Boston
Washington DC Chicago
Atlanta
Dallas-Fort Worth
Houston
Miami
Phoenix
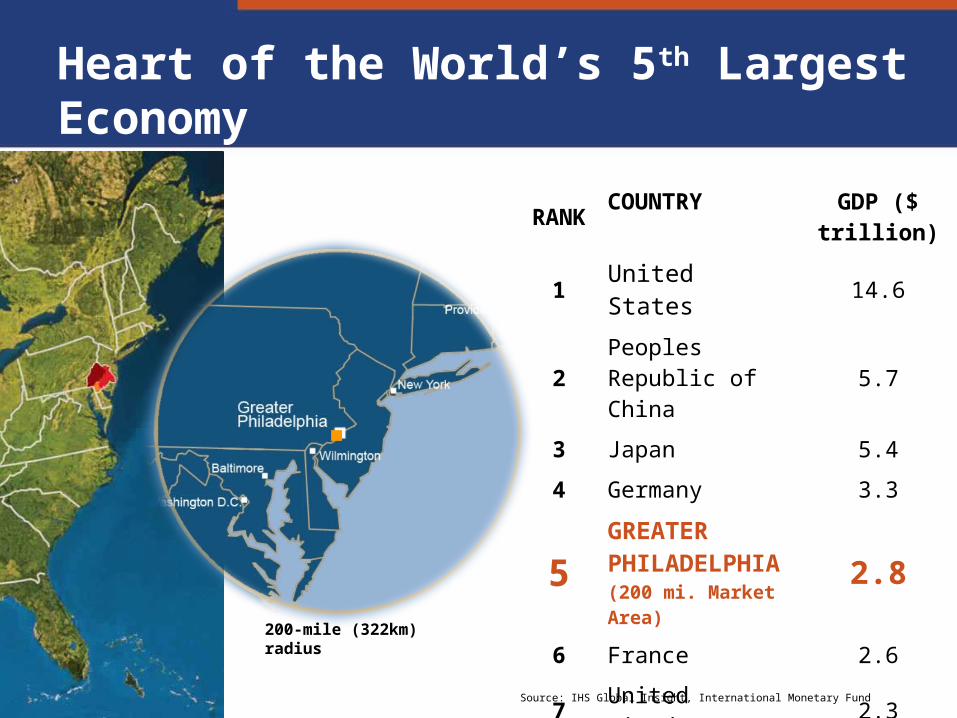
Heart of the World’s 5th Largest Economy
RANK COUNTRY GDP ($ trillion)
1 United States 14.6
2 Peoples Republic of China 5.7
3 Japan 5.4
4 Germany 3.3
5GREATER PHILADELPHIA(200 mi. Market Area)
2.8
6 France 2.6
7 United Kingdom 2.3
8 Italy 2.0
9 Brazil 2.0
10 Canada 1.6
Source: IHS Global Insight, International Monetary Fund
200-mile (322km) radius
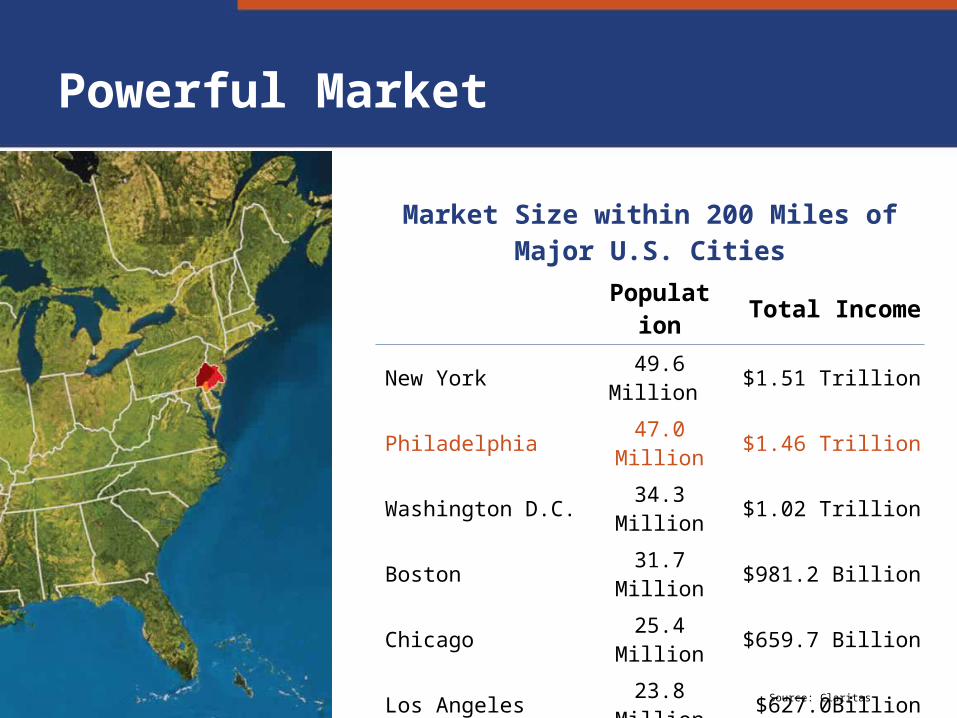
Powerful Market
Market Size within 200 Miles of Major U.S. Cities Population Total IncomeNew York 49.6 Million $1.51 TrillionPhiladelphia 47.0 Million $1.46 TrillionWashington D.C. 34.3 Million $1.02 TrillionBoston 31.7 Million $981.2 BillionChicago 25.4 Million $659.7 BillionLos Angeles 23.8 Million $627.0BillionDetroit 21.7 Million $535.0 BillionAtlanta 18.8 Million $441.5 BillionSan Francisco 14.8 Million $456.6BillionDallas-Fort Worth 14.6 Million $352.0 BillionHouston 13.9 Million $323.2 BillionMiami 10.3 Million $282.1 Billion
Source: Claritas
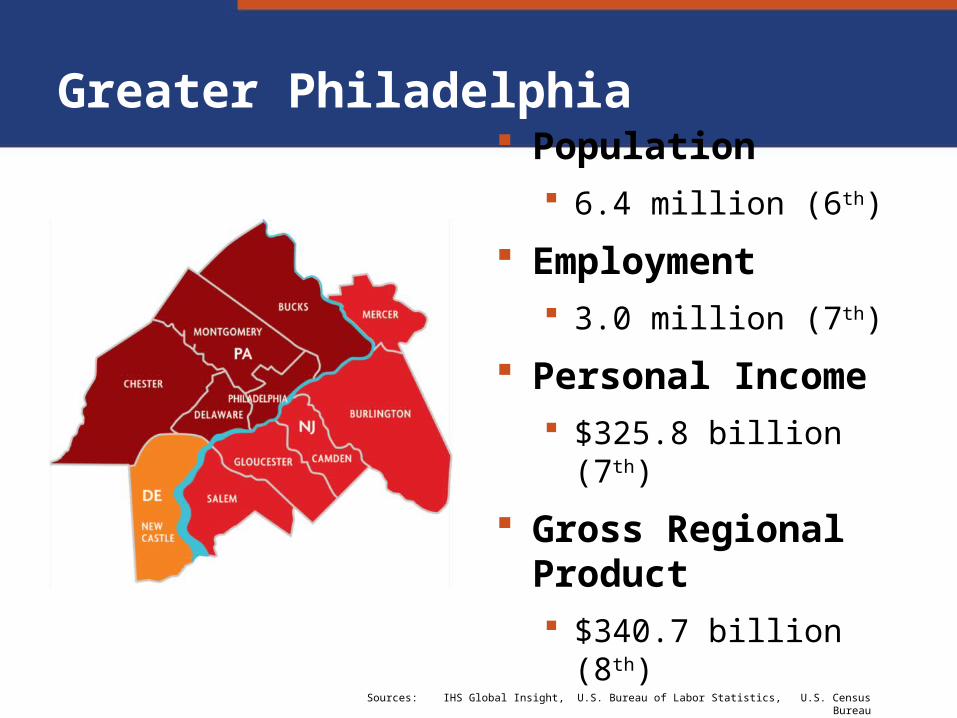
Greater Philadelphia
Sources: IHS Global Insight, U.S. Bureau of Labor Statistics, U.S. Census Bureau
Population 6.4 million (6th)
Employment 3.0 million (7th)
Personal Income $325.8 billion (7th)
Gross Regional Product $340.7 billion (8th)
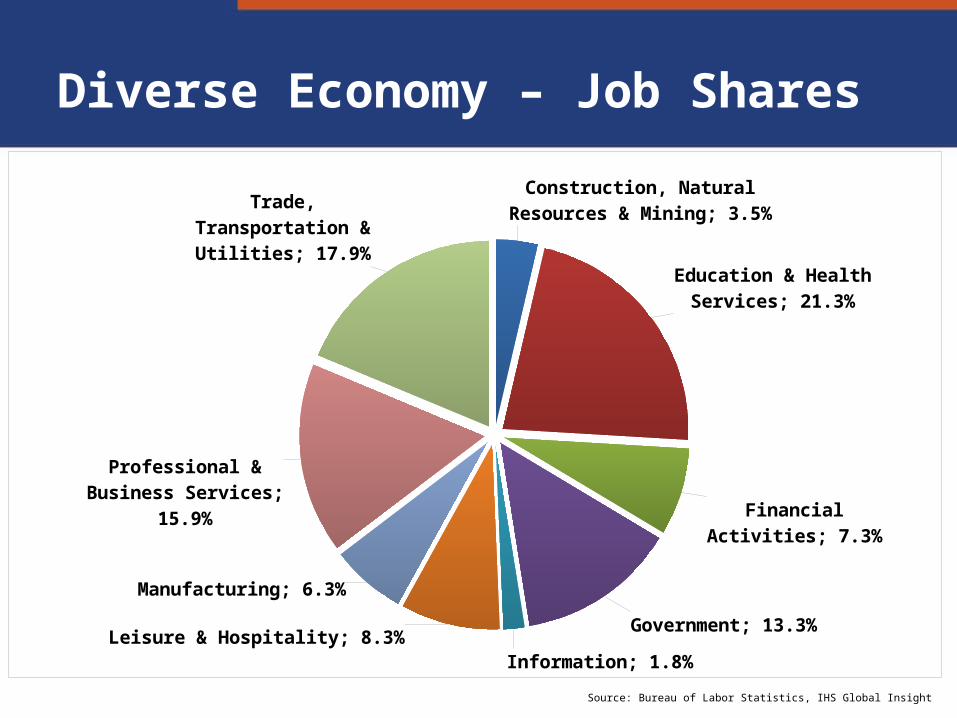
Diverse Economy – Job Shares
Source: Bureau of Labor Statistics, IHS Global Insight
Construction, Natural Resources & Mining; 3.5%
Education & Health Services; 21.3%
Financial Activities; 7.3%
Government; 13.3%
Information; 1.8%Leisure & Hospitality; 8.3%
Manufacturing; 6.3%
Professional & Business Services; 15.9%
Trade, Transportation & Utili-ties; 17.9%
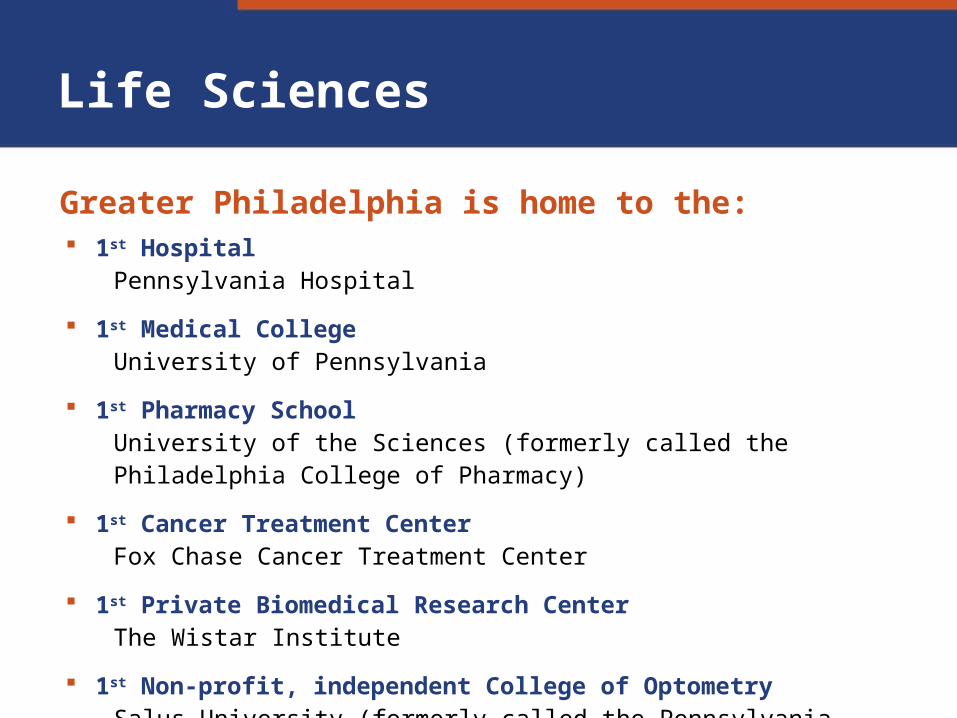
Life Sciences
Greater Philadelphia is home to the:
1st HospitalPennsylvania Hospital
1st Medical CollegeUniversity of Pennsylvania
1st Pharmacy SchoolUniversity of the Sciences (formerly called the Philadelphia College of Pharmacy)
1st Cancer Treatment CenterFox Chase Cancer Treatment Center
1st Private Biomedical Research CenterThe Wistar Institute
1st Non-profit, independent College of OptometrySalus University (formerly called the Pennsylvania College of Optometry)
Sources: Pennsylvania BIO and Select Greater Philadelphia
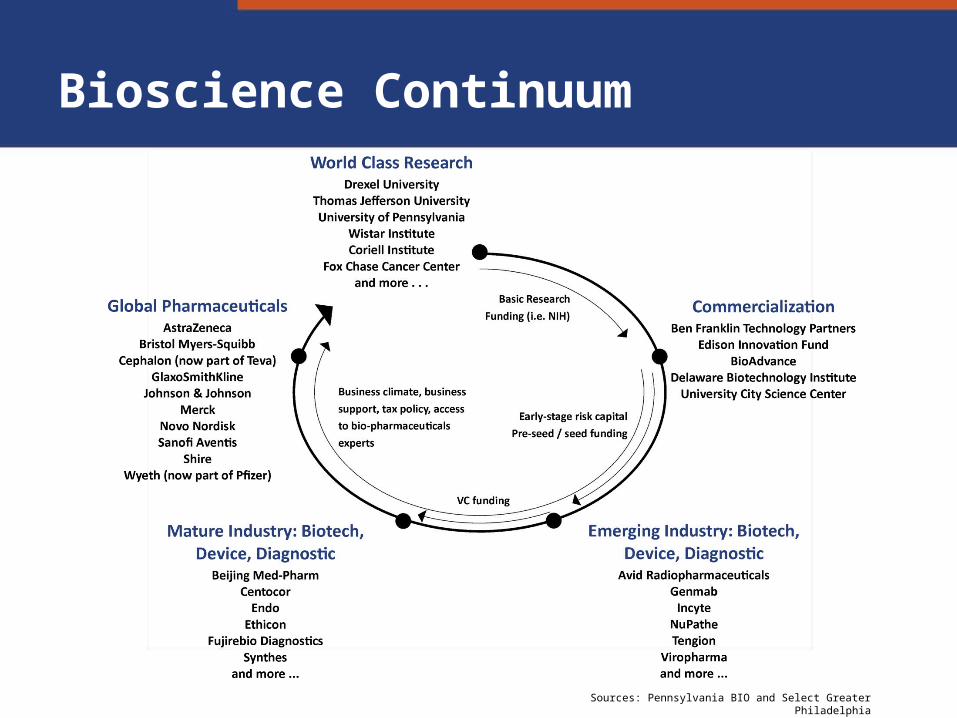
Bioscience Continuum
At the Cutting Edge
Top 5 for Research & Development across academia and industry
$10.5 billion annually in research and development
Top 5 in patent award rate per resident
Sources: U.S. Patent & Trademark Office, Deloitte, City of Philadelphia, Select Greater Philadelphia
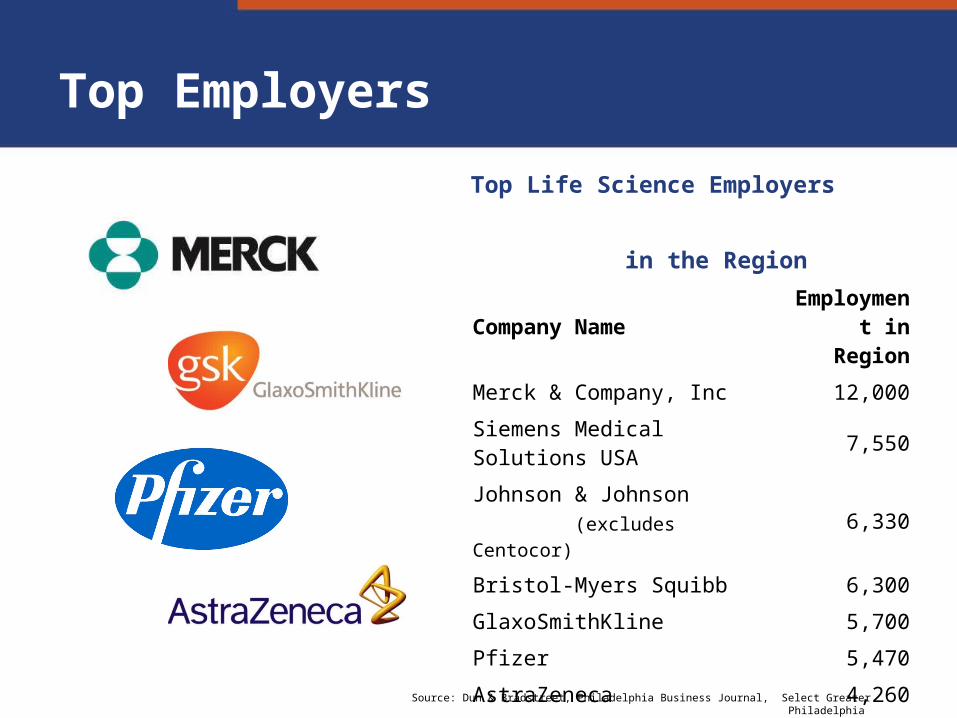
Top Employers
Top Life Science Employers in the Region
Company Name Employment in Region
Merck & Company, Inc 12,000Siemens Medical Solutions USA 7,550Johnson & Johnson (excludes Centocor) 6,330
Bristol-Myers Squibb 6,300GlaxoSmithKline 5,700Pfizer 5,470AstraZeneca 4,260Novo Nordisk 3,200Centocor/Janssen 3,000Teva/Cephalon 2,200Endo Pharmaceuticals 1,200
Source: Dun & Bradstreet, Philadelphia Business Journal, Select Greater Philadelphia
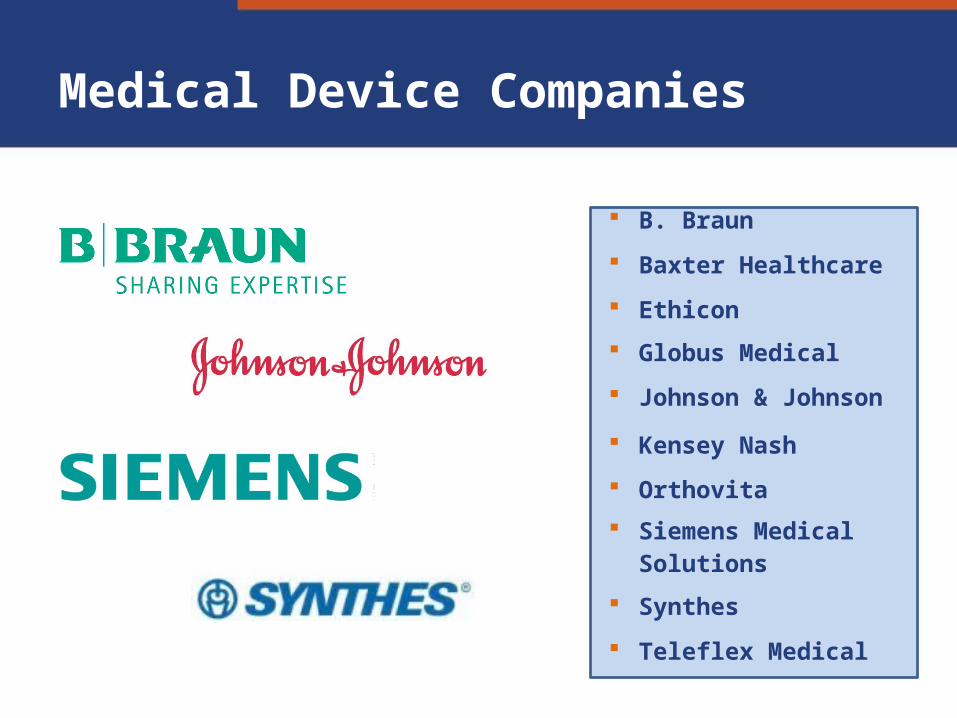
Medical Device Companies
B. Braun
Baxter Healthcare
Ethicon
Globus Medical
Johnson & Johnson
Kensey Nash
Orthovita
Siemens Medical Solutions
Synthes
Teleflex Medical
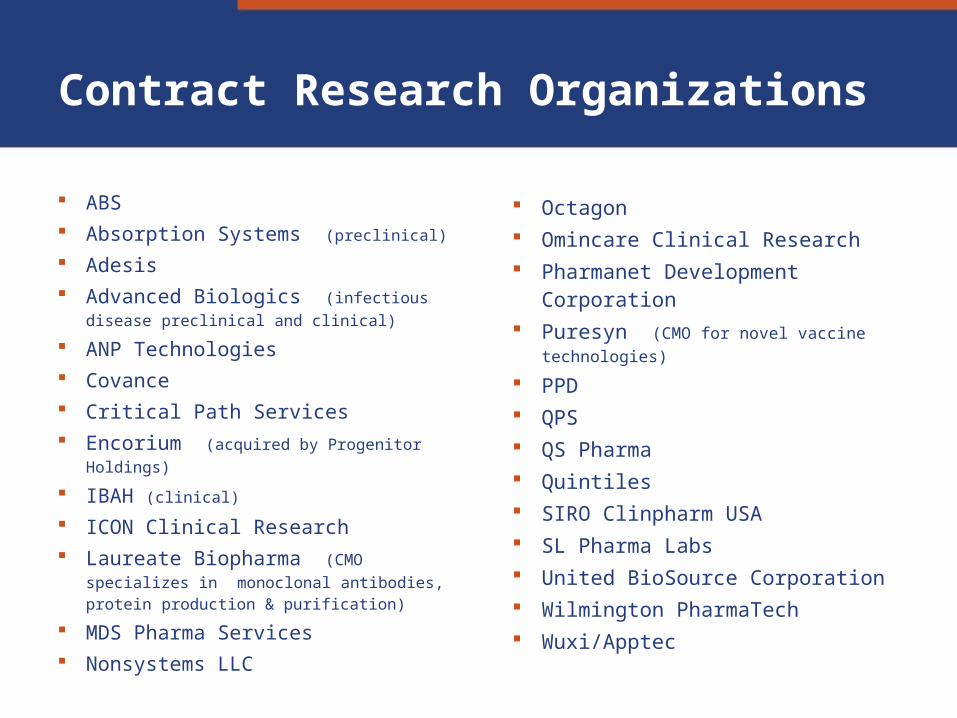
ABS Absorption Systems (preclinical)
Adesis Advanced Biologics (infectious disease
preclinical and clinical) ANP Technologies Covance Critical Path Services Encorium (acquired by Progenitor Holdings)
IBAH (clinical)
ICON Clinical Research Laureate Biopharma (CMO specializes in
monoclonal antibodies, protein production & purification)
MDS Pharma Services Nonsystems LLC
Octagon Omincare Clinical Research Pharmanet Development Corporation Puresyn (CMO for novel vaccine
technologies) PPD QPS QS Pharma Quintiles SIRO Clinpharm USA SL Pharma Labs United BioSource Corporation Wilmington PharmaTech Wuxi/Apptec
Contract Research Organizations
Source: IHS Global Insight
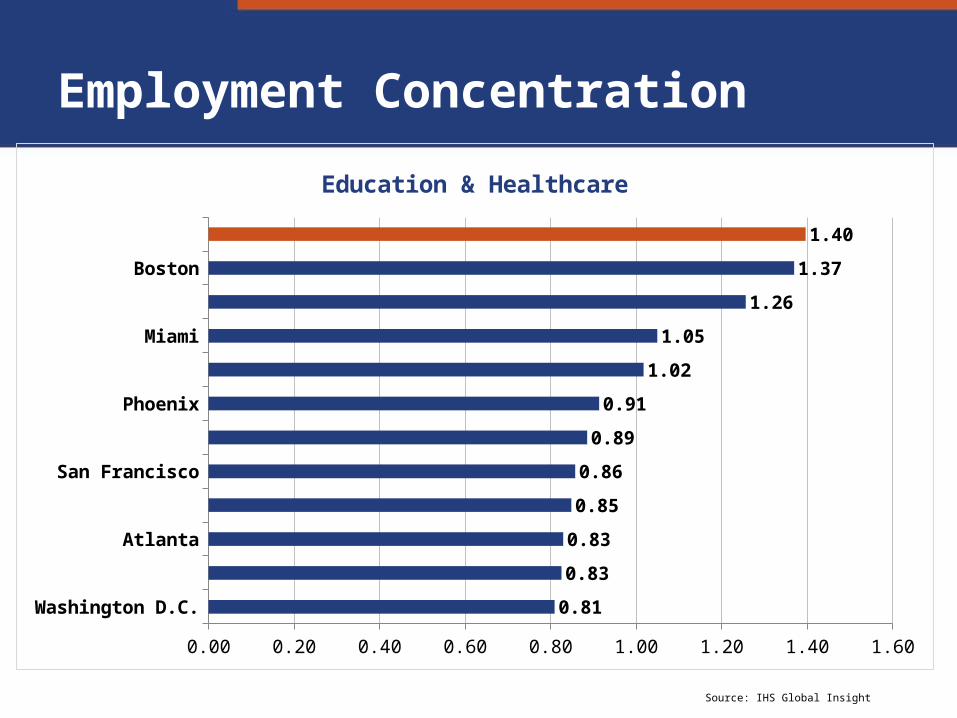
Washington D.C.
Houston
Atlanta
Dallas
San Francisco
Los Angeles
Phoenix
Chicago
Miami
New York
Boston
Greater Philadelphia
0.00 0.20 0.40 0.60 0.80 1.00 1.20 1.40 1.60
0.81
0.83
0.83
0.85
0.86
0.89
0.91
1.02
1.05
1.26
1.37
1.40
Education & Healthcare
Employment Concentration
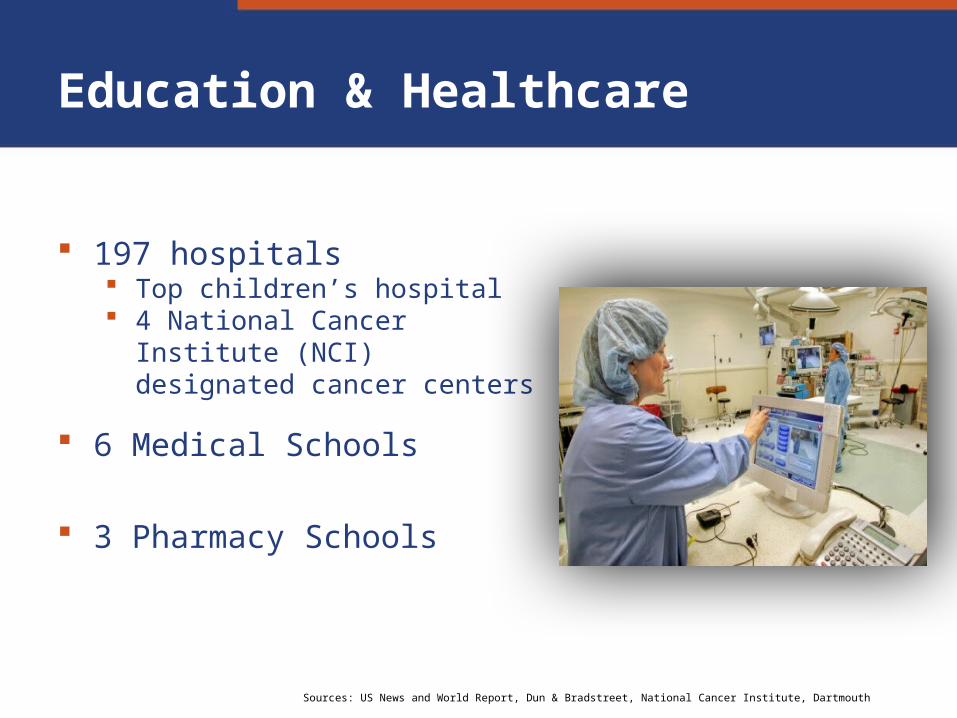
Education & Healthcare
197 hospitals Top children’s hospital 4 National Cancer Institute (NCI)
designated cancer centers
6 Medical Schools
3 Pharmacy Schools
Sources: US News and World Report, Dun & Bradstreet, National Cancer Institute, Dartmouth
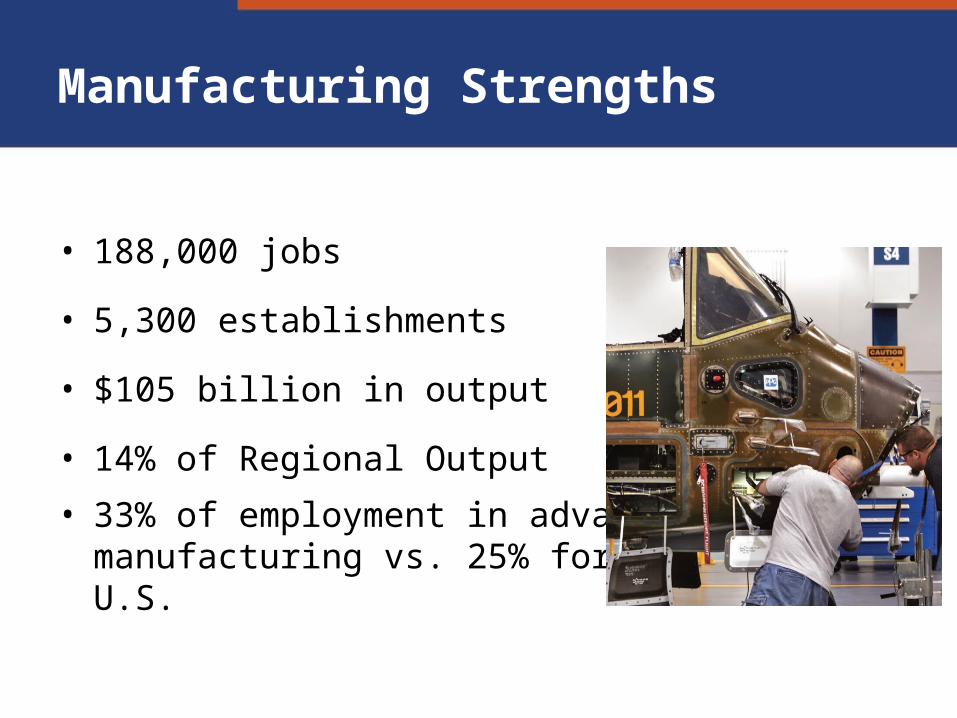
Manufacturing Strengths
• 188,000 jobs
• 5,300 establishments
• $105 billion in output
• 14% of Regional Output
• 33% of employment in advanced manufacturing vs. 25% for U.S.

Top Manufacturers by Sector
Chemical/Petroleum
• Arkema Inc.• BASF• Braskem America• Dow• DuPont• FMC Corporation• Philadelphia Energy
Solutions• W.L. Gore
Defense/Transportation
• AugustaWestland• Boeing• Lockheed Martin
Food
• Bimbo Bakeries• Campbell Soup • Flowers Foods
Pharmaceutical
• Bristol Myers Squibb• GlaxoSmithKline• Johnson & Johnson• Merck & Company• Novo Nordisk• Pfizer
Other
• Aker Philadelphia Shipyard, Inc.
• Gamesa• K’Nex
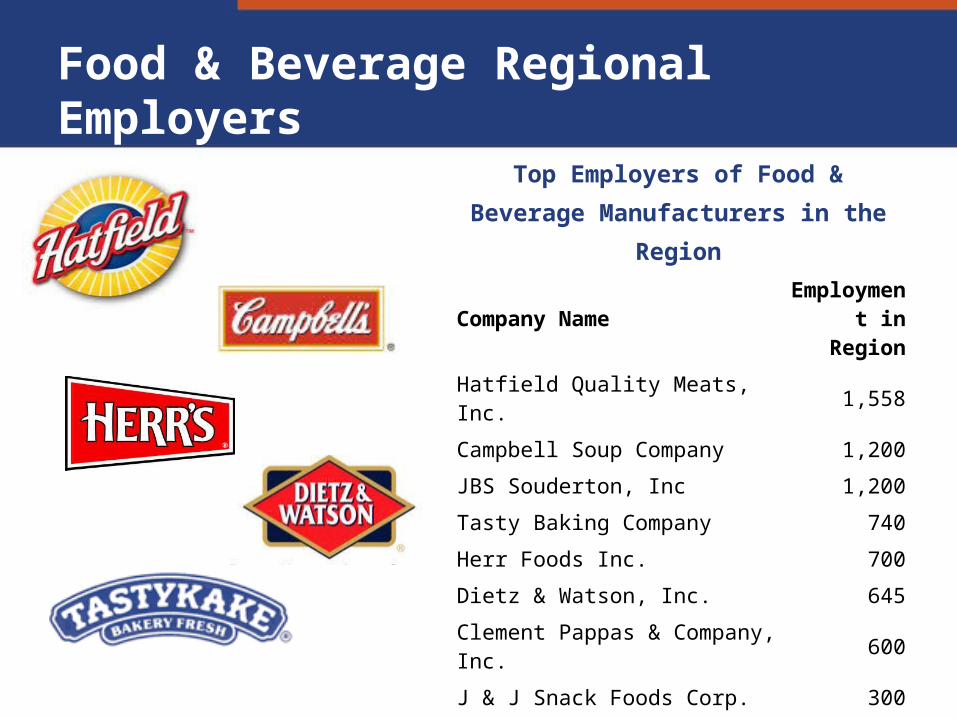
Food & Beverage Regional EmployersTop Employers of Food & Beverage
Manufacturers in the Region
Company Name Employment in Region
Hatfield Quality Meats, Inc. 1,558Campbell Soup Company 1,200JBS Souderton, Inc 1,200Tasty Baking Company 740Herr Foods Inc. 700Dietz & Watson, Inc. 645Clement Pappas & Company, Inc. 600J & J Snack Foods Corp. 300Amoroso’s Baking Co. 300Frankford Candy LLC 300PEPSI-COLA & National Brand Beverages Ltd (Inc.) 300
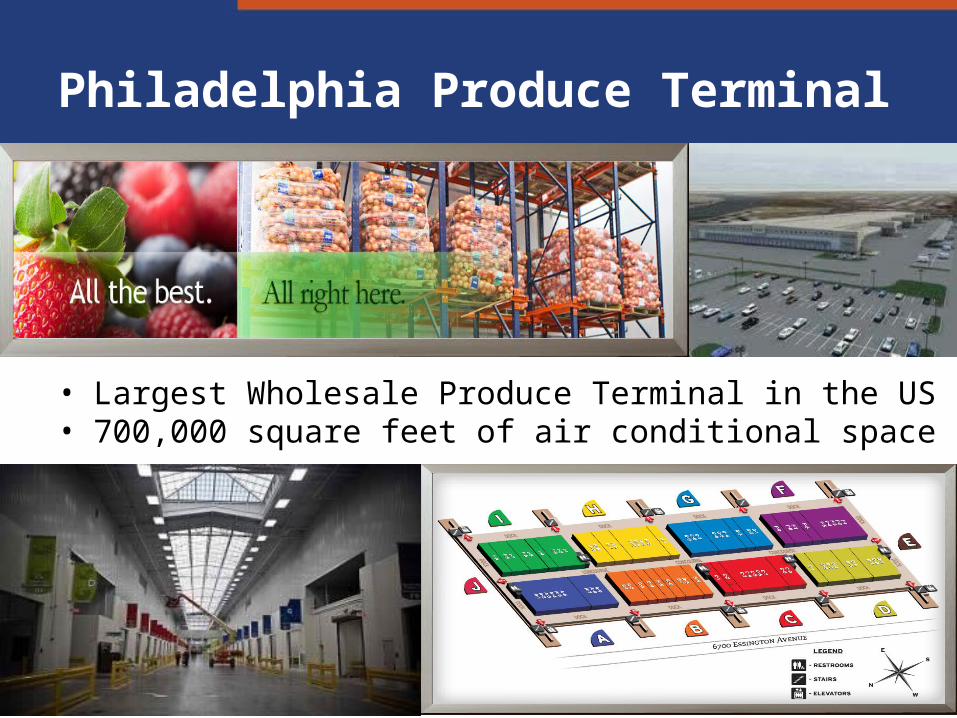
Philadelphia Produce Terminal
• Largest Wholesale Produce Terminal in the US• 700,000 square feet of air conditional space
Higher Ed Support for the Food & Beverage Industry
Rutgers
Provides business and technology expertise to food and agribusiness
Over 1200 companies assisted since 2000
St. Joseph’s University Center for Food Marketing
USDA Designated a national center for food marketing
Houses one of the world’s largest academic food marketing libraries
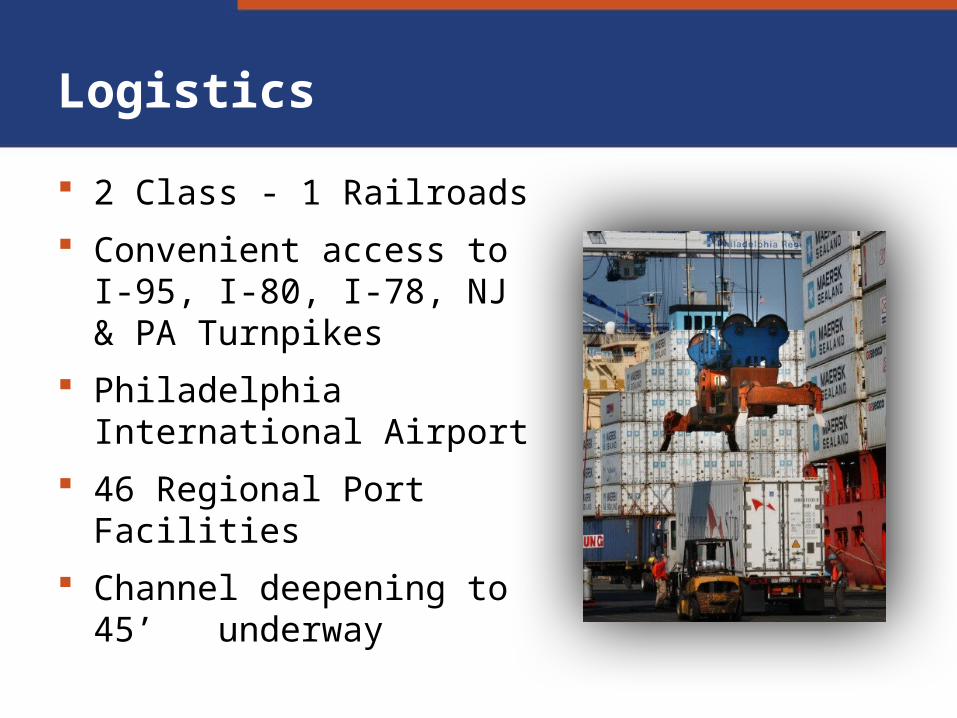
Logistics
2 Class - 1 Railroads Convenient access to I-95, I-80,
I-78, NJ & PA Turnpikes Philadelphia International
Airport 46 Regional Port Facilities Channel deepening to 45’
underway
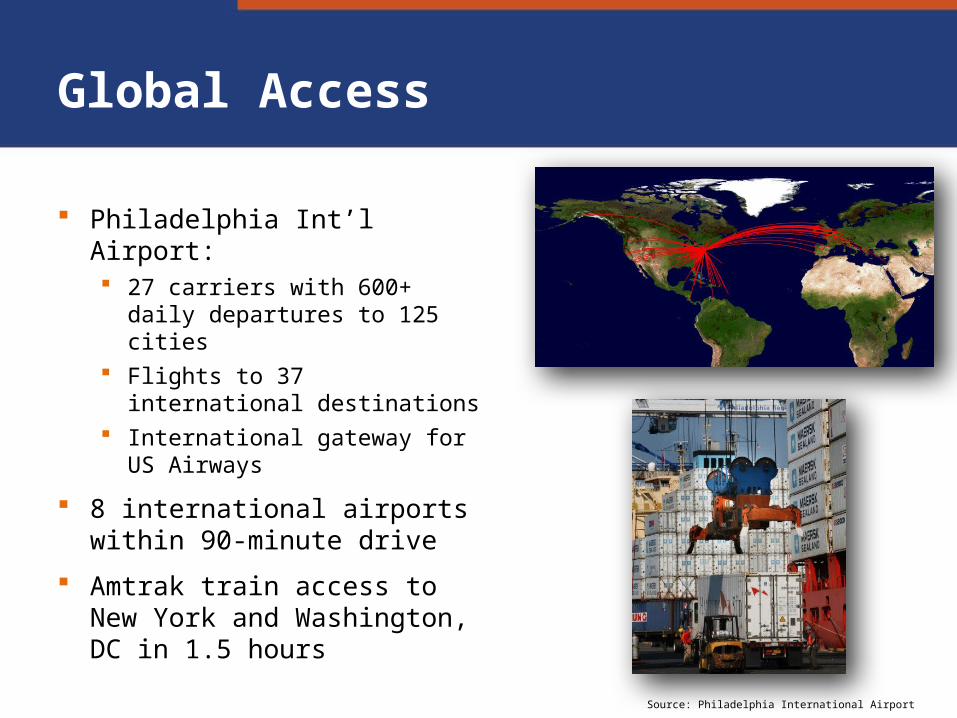
Global Access
Philadelphia Int’l Airport: 27 carriers with 600+ daily
departures to 125 cities Flights to 37 international
destinations International gateway for US
Airways
8 international airports within 90-minute drive
Amtrak train access to New York and Washington, DC in 1.5 hours
Source: Philadelphia International Airport
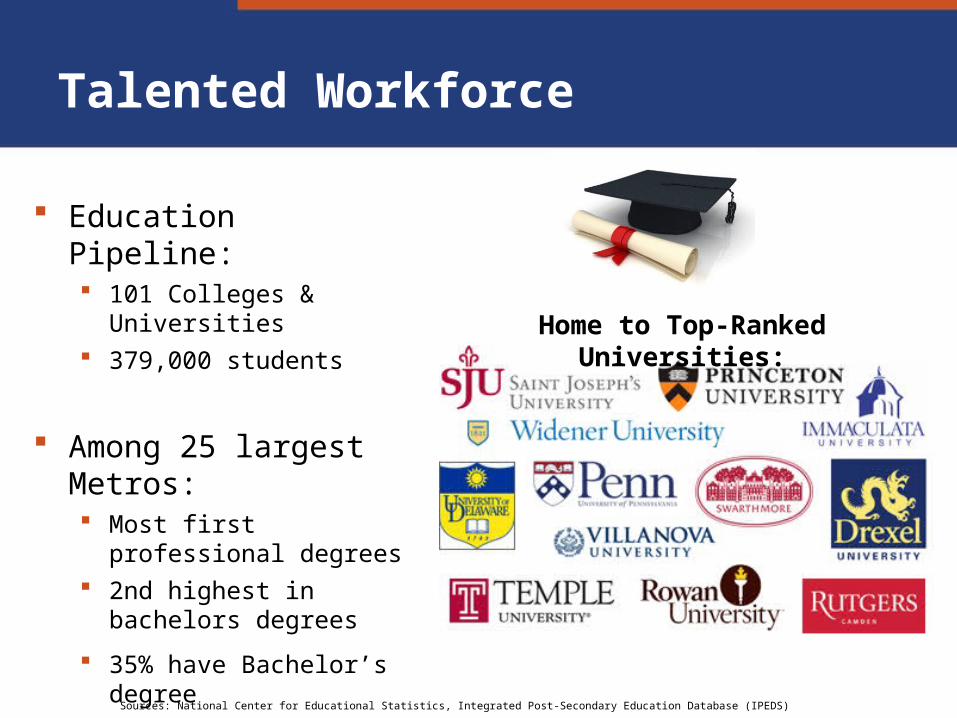
Talented Workforce
Education Pipeline: 101 Colleges & Universities 379,000 students
Among 25 largest Metros: Most first professional
degrees 2nd highest in bachelors
degrees
35% have Bachelor’s degree
Sources: National Center for Educational Statistics, Integrated Post-Secondary Education Database (IPEDS)
Home to Top-Ranked Universities:
Abundant supply of skilled trades workers
• Numerous certificate and on-site learning programs for high-demand trades
• Key advanced manufacturing occupations include:
– Aircraft structure, rigging and systems assemblers,– Chemists & chemical equipment operators– Engineers– Medical appliance technicians– Packaging and filling machine operators– Welders
Sources: Philadelphia Business Journal, Pennsylvania Department of Community & Economic Development, Dun & Bradstreet, Select Greater Philadelphia, Delaware Economic Development Office, World Trade Center of
Greater Philadelphia, U.S. Census Bureau, American Community Survey
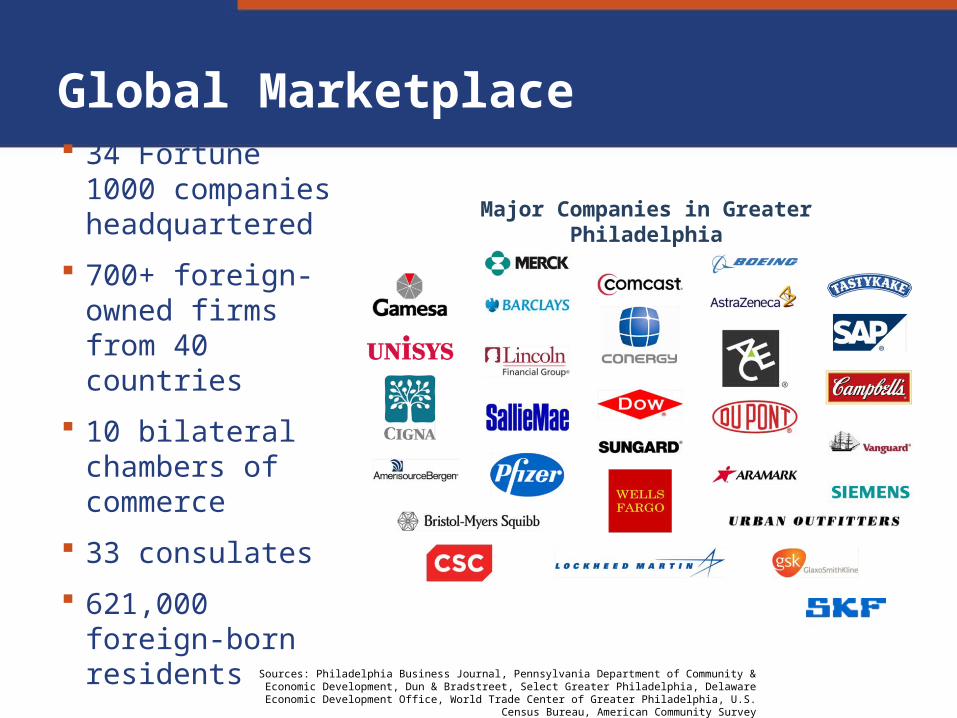
Global Marketplace
34 Fortune 1000 companies headquartered
700+ foreign-owned firms from 40 countries
10 bilateral chambers of commerce
33 consulates
621,000 foreign-born residents
Major Companies in Greater Philadelphia
Sources: Philadelphia Business Journal, Pennsylvania Department of Community & Economic Development, Dun & Bradstreet, Select Greater Philadelphia, Delaware Economic Development Office, World Trade Center of Greater Philadelphia, U.S. Census Bureau, American Community Survey
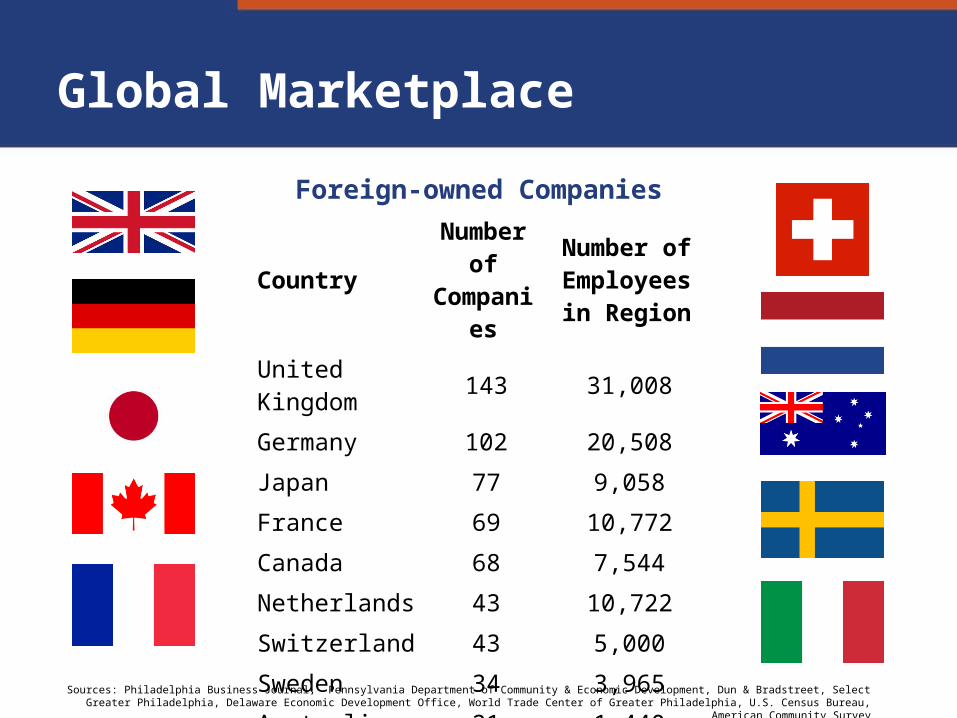
Foreign-owned Companies
Country Number of Companies
Number of Employees in
Region
United Kingdom 143 31,008Germany 102 20,508Japan 77 9,058France 69 10,772Canada 68 7,544Netherlands 43 10,722Switzerland 43 5,000Sweden 34 3,965Australia 21 1,440Italy 21 845
Global Marketplace
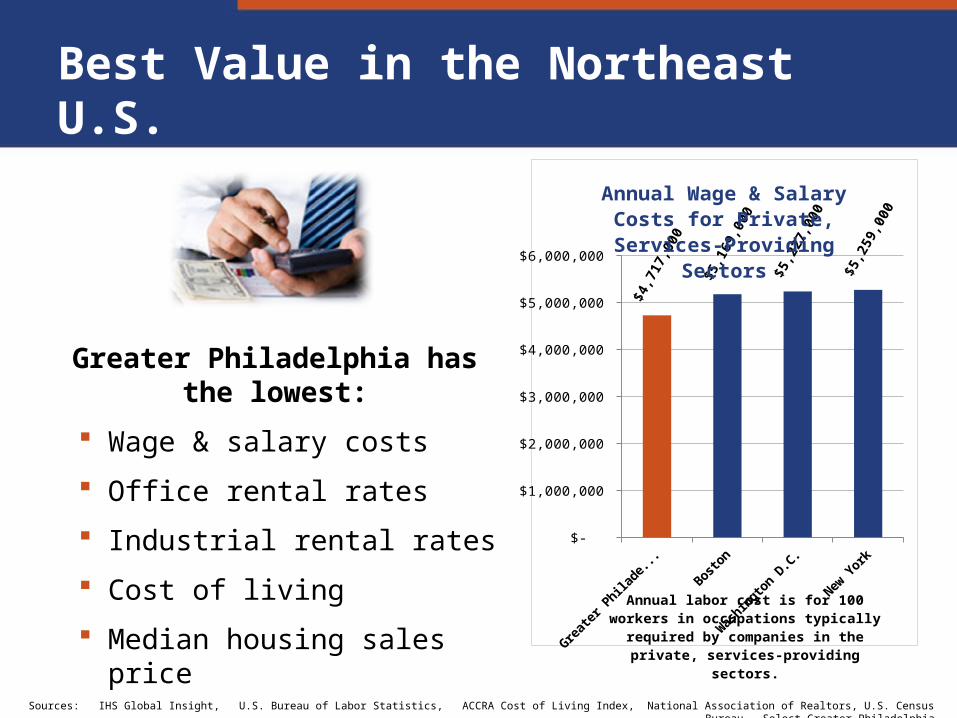
Best Value in the Northeast U.S.
Greater Philadelphia has the lowest:
Wage & salary costs
Office rental rates
Industrial rental rates
Cost of living
Median housing sales price
Greater Phila
delphia
Boston
Wash
ington D.C.
New York $-
$1,000,000
$2,000,000
$3,000,000
$4,000,000
$5,000,000
$6,000,000
$4,
717,
000
$5,
169,
000
$5,
227,
000
$5,
259,
000
Annual Wage & Salary Costs for Private, Services-Providing Sectors
Annual labor cost is for 100 workers in occupations typically required by companies in the private,
services-providing sectors.
Sources: IHS Global Insight, U.S. Bureau of Labor Statistics, ACCRA Cost of Living Index, National Association of Realtors, U.S. Census Bureau, Select Greater Philadelphia
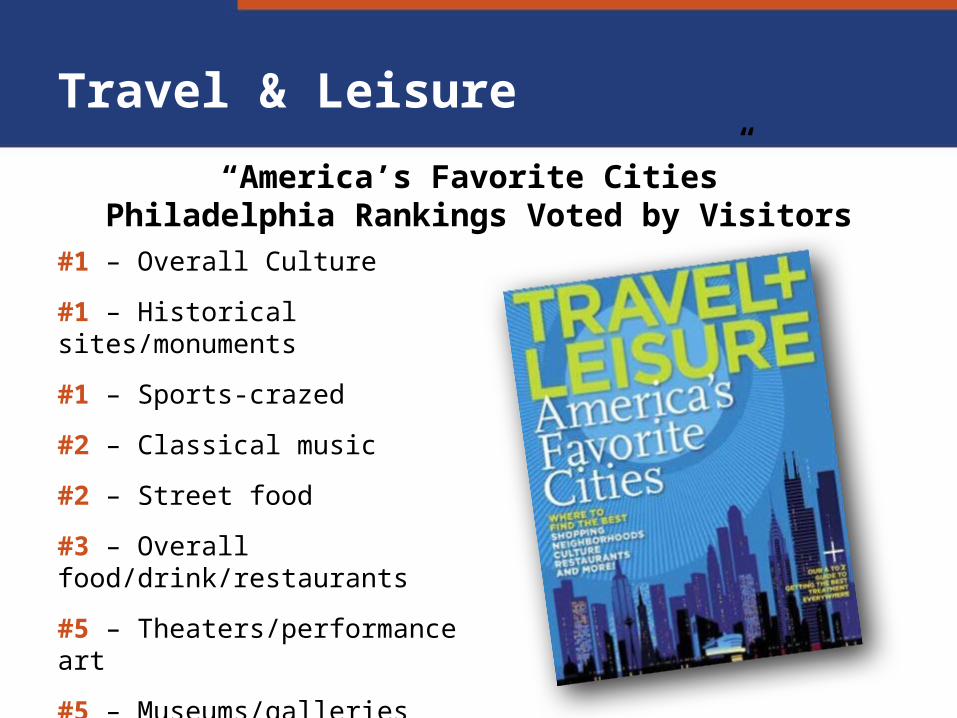
Travel & Leisure
#1 – Overall Culture
#1 – Historical sites/monuments
#1 – Sports-crazed
#2 – Classical music
#2 – Street food
#3 – Overall food/drink/restaurants
#5 – Theaters/performance art
#5 – Museums/galleries
#5 – Overall shopping
“America’s Favorite Cities”Philadelphia Rankings Voted by Visitors

Thank You!
Jeanne R. NevelosVice President, Business Development
Select Greater Philadelphia
Selectgreaterphila.com