graph theoretic analyses:
DESCRIPTION
Large-Scale Organization of Semantic Networks Mark Steyvers Josh Tenenbaum Stanford University. Graph theoretic analyses:. Collaboration network of film actors, scientists Watts & Strogatz (1998); Newman (2001) Neural network of worm: C. elegans Watts & Strogatz (1998) WWW - PowerPoint PPT PresentationTRANSCRIPT

Large-Scale Organization of
Semantic Networks
Mark Steyvers Josh Tenenbaum
Stanford University

Graph theoretic analyses:
• Collaboration network of film actors, scientistsWatts & Strogatz (1998); Newman (2001)
• Neural network of worm: C. elegansWatts & Strogatz (1998)
• WWWBarabasi & Albert (1999)

• Link structure of semantic networks:Small-world & scale free
• What produces such link structures?Semantic growth
• Relation to age-of-acquisition effects
• Behavioral effects of link structure
Overview

Word AssociationNelson et al. (1999)
nwords = 5,000+

Roget’s Thesaurus
Categories1,000
Word forms29,000+

WordnetGeorge Miller
Word forms122,000+
Word senses99,000+

1. Short path lengths L = average length of 3.04 10.6 5.6
shortest path between two nodes
One class of Small World Networks:Word
Association RogetWordNet
3 x number of triangles
number of connected triples of vertices
C=0 C=1
2. Local clustering C = .186 .029 .875
3. Power-law = exponent in power-law
degree distribution distribution
3.03 10.61 5.43
.004 .000 .613
- - -
Random
Graphs
n = number of nodes 5018 200,000+ 30,000+

Power law tail kkP )(
kekP )( Exponential tail
e.g., random graphs (Erdös-Réyni) orWatts & Strogatz (1998) model
Exponential: Power law:
HUBS

WORD ASSOCIATION
101 102
P( k
)
10-6
10-5
10-4
10-3
10-2
10-1
100WORDNET
100 101 10210-6
10-5
10-4
10-3
10-2
10-1
100
ROGET'STHESAURUS
100 10110-3
10-2
10-1
100
kkk
=3.01 =3.19=3.11

Zipf’s (1949) “Law of Meaning”
Word frequency rank
#mea
ning
s Slope in rank plota=.466
Slope in distribution plot = 3.15
Adamic (2000):=1+1/a

• Link structure of semantic networks:Small-world & scale free
• What produces such link structures?Semantic growth
• Relation to age-of-acquisition effects
• Behavioral effects of link structure
Overview

• H.A. Simon (1955). Power laws in distributions:– Scientists by number of papers published
– Cities by population
– Income by size
-> “rich get richer” growth-like stochastic process
• Barabasi et al. (1999). Power laws in WWW– in-degree & out-degree
-> growth processes

Proposal:
Power-law degree distributions in semantic networks are
signature of semantic growth
• within individual; lexical development
• across speakers; language evolution
Disclaimer: We will not describe in detail any specific psychological mechanism
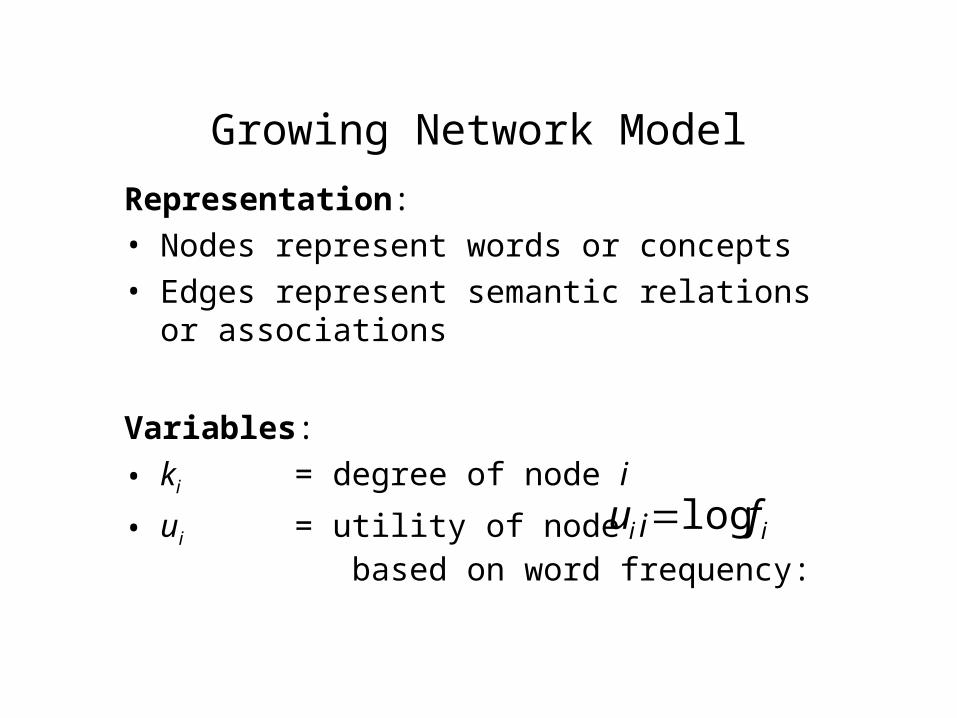
Growing Network Model
Representation:
• Nodes represent words or concepts
• Edges represent semantic relations or associations
Variables:
• ki = degree of node i
• ui = utility of node i based on word frequency: ii fu log

Start with small fully connected network with M nodes
A new node is inserted:
1) Choose a local neighborhood i(a neighborhood i of a node is formed by node i and its neighbors)
2) Make M connections into neighborhood
repeat n times until network is large enough

3
26
32
53
3
2
4
new node
ii kkiP )(Preferentially choose large neighborhoods:1
new node
Preferentially make M connections
to nodes with high utility:
2.1
3.4.6
.22.3
2.1
1.5
jj uujP )(2


WordAssociation
n 5018 5018
<k> 22 22
Path Length L 3.04 2.84 (.04)
Clustering C .186 .185 (.007)coefficient
Power-Law coefficient
Growing Network Model
GROWING NETWORK MODEL
101 102 10310-5
10-4
10-3
10-2
10-1
100
k
Barabasi & Albert (1999) Model
5018
22
2.85
.020
2.83

Power-laws in non-growing semantic representations?

k
100 101 102 103
10-3
10-2
10-1
100
LSA
<k> = 206<k> = 16.7<k> = 1.47
P( k
)
LSA: Latent Semantic Analysise.g., Landauer & Dumais (1997)
• Analyzed co-occurrence statistics in a large corpus• Placed 60,000+ words in 300-dimensional space• Good semantic neighbors
volcano
Hawaii
ache
relax
soothe
lava
Convert LSA space to graph by variable thresholding on similarity measure

Tversky & Hutchinson (1986)•Low dimensional geometric models are not suitable for representing conceptual similarity relations; upper bound on the number of points that can share the nearest neighbor

Ferrer & Solé (submitted):
Connect two words if they co-occur within a small contextual windowSlide window over large corpus
k
10-1 100 101 102 103 10410-7
10-6
10-5
10-4
10-3
10-2
10-1
100
101
102SLIDING WINDOW
w = 2w = 3w = 4
No good semantic neighborhoods
volcano -> was -> head -> ache(word association: volcano->hawaii->relax->soothe->ache)
or
tick -> tock -> made -> wonderful -> universe(word association: tick -> dog -> master -> universe)
2

• Link structure of semantic networks:Small-world & scale free
• What produces such link structures?Semantic growth
• Relation to age-of-acquisition effects
• Behavioral effects of link structure
Overview

Age of acquisition (AoA) effects
•Naming and lexical decision tasksCarroll & White (1973); Brysbaert et al. (2000)
•Locus of AoA effects?Brown & Watson (1987); Lambon Ralph et al. (1998)
•AoA is really cumulative frequency effect?Lewis, Gerhand & Ellis (1999)
•Need framework to understand AoA effects.

MODEL
0 800 1600 5000
k
0
50
100
150
200
250Word Frequency
0 ... 1515 ... 100100...
Time of Acquisition
5018
t=1…15
t=16…50
t=51...150
Prediction of model: early acquired nodes have more connections.Do words acquired early in life have more connections?

WORD ASSOCIATION
150 250 350 450 550 6500
2
4
6
8
10
12
14
16
150 250 350 450 550 6500
1
2
3
4
5
6
7
WORDNET
ROGET'S THESAURUS
Age of Acquisition Rating
150 250 350 450 550 650
k
0
20
40
60
80
100
0 ... 1515 ... 100
100 .....Word Frequency
1
2
3
4
Age of Acquisition (months)
k
10
15
20
25
30
35
40
12 ... 52 52 .. 132
12 ... 52 52 .. 132
12 ... 52 52 .. 132
2
3
4
5
6
7
8
< 10> 10
Word Frequency
k
MODEL
0 800 1600 5000
k
0
50
100
150
200
250Word Frequency
0 ... 1515 ... 100100...
Time of Acquisition
5018

Language Evolution
Words acquired early in English language are words with high degree
(work in progress)

• Link structure of semantic networks:Small-world & scale free
• What produces such link structures?Semantic growth
• Relation to age-of-acquisition effects
• Behavioral effects of link structure
Overview

Behavioral effects of structural variables
centralityDegree-centrality
Authority (Eigenvector-centrality)
Proposal:
In cognitive system, search is biased toward facts, concepts or words with high centrality
Naming and lexical decision latencies

Lexical Decision Naming Lexical Decision
R n R nLog( k ) - Word Association -.330 466 -.463 1676Log( k ) - Wordnet -.298 790 -.464 2665Log( k ) - Roget -.164 647 -.253 2343Log( word frequency ) -.333 713 -.511 2625AoA (rating) .378 199 .551 566AoA (picture naming) .258 44 .346 137
Note: R=correlation; n=number of observations

Lexical Decision Naming Lexical Decision
R n R nLog( k ) - Word Association -.330 466 -.463 1676Log( k ) - Wordnet -.298 790 -.464 2665Log( k ) - Roget -.164 647 -.253 2343Log( word frequency ) -.333 713 -.511 2625AoA (rating) .378 199 .551 566AoA (picture naming) .258 44 .346 137
After partialing out log( word frequency )
Log( k ) - Word Association -.194 433 -.258 1634Log( k ) - Wordnet -.171 706 -.274 2503Log( k ) - Roget -.110 602 -.136 2243AoA (rating) .337 196 .450 546AoA (picture naming) .208 39 .239 131
After partialing out AoA (picture naming)
Log( k ) - Word Association -.270 37 -.385 130Log( k ) - Wordnet -.243 41 -.403 134Log( k ) - Roget -.134 34 -.197 128Log( word frequency ) -.297 39 -.456 131
After partialing out log( word frequency ) & AoA (picture naming)
Log( k ) - Word Association -.148 36 -.208 129Log( k ) - Wordnet -.132 38 -.254 130Log( k ) - Roget -.091 33 -.107 127
Note: R=correlation; n=number of observations

Semantic DementiaHodges & Patterson (1995)
ConclusionConclusion
Link structure of semantic networks:
a) shows non-trivial patterns
b) shows signature of growth processes• “rich get richer” • respecting local neighborhoods
c) is relevant for search strategiescentral words might be searched first.
Paper will be available at www-psych.stanford.edu/~msteyver
But…
Early acquired words become more central in your model but maybe
Words that are more central are acquired earlier

Earliest year of quotation (in OED)vs.
k (connectivity)
High k Intermediate k Low k
Year k Year k Year k
food 1000 324 disease 1330 31 resistance 1417 0money 1290 302 ghost 900 31 cobbler 1362 0water 897 276 leader 1300 31 phase 1812 0car 1382 259 speak 825 31 hull 1000 0good 805 255 low 1150 31 padding 1674 0bad 1297 229 beauty 1275 31 trench 1386 0work 897 196 plan 1678 31 maggot 1398 0house 1000 185 pool 897 31 earnestness 1670 0school 1000 183 pants 1840 31 barracuda 1678 0love 825 181 finger 950 31 toil 1292 0man 825 171 reason 1125 31 renounce 1380 0paper 1300 163 action 1393 31 calorie 1821 0
card 1401 31 topping 1504 0president 1375 31 ointment 1290 0
repentance 1303 0juggler 1175 0provision 1430 0recliner 1669 0poach 1390 0
average 1043 1246 1455