grain transportation report ocean - ams.usda.gov · 7.02.2019 · mmt, up 61 percent from last year...
TRANSCRIPT
A weekly publication of the Agricultural Marketing Service www.ams.usda.gov/GTR
February 7, 2019
Contents
Article/ Calendar
Grain
Transportation Indicators
Rail
Barge
Truck
Exports
Ocean
Brazil
Mexico
Grain Truck/Ocean Rate Advisory
Datasets
Specialists
Subscription Information
--------------
The next release is
February 14, 2019
Preferred citation: U.S. Dept. of Agriculture, Agricultural Marketing Service. Grain Transportation Report. February 7, 2019. Web: http://dx.doi.org/10.9752/TS056.02-07-2019
Grain Transportation Report
WEEKLY HIGHLIGHTS
Total Grain Inspections Up Slightly
For the week ending January 31, total inspections of grain (corn, wheat, and soybeans), for export from all major U.S. export regions,
reached 2.38 million metric tons (mmt), which is up 2 percent from the previous week, down 18 percent from last year, and 9 percent
below the 3-year average. Wheat inspections increased 20 percent from week-to-week, as shipments to Asia and Latin America increased.
Inspections of soybeans increased 3 percent from the previous week, but corn inspections dropped 7 percent. Pacific Northwest (PNW)
grain inspections decreased 9 percent from the previous week, while Mississippi Gulf inspections increased 4 percent. Inspections of grain
during the last four weeks are 4 percent below last year and 2 percent below the 3-year average.
Grain Barge Tonnages Drop in 2018
In 2018, total annual grain barge shipments along the locking portions of the Mississippi, Arkansas, and Ohio rivers were 37.98 million
tons, 7 percent lower than last year and 5 percent lower than the 3-year average. Total soybean movements in 2018 were 1.67 million
tons, 24 percent lower than 2017 and 18 percent lower than the 3-year average; mainly due to reduced sales to China. Total wheat
movements in 2018 were 12.82 million tons, 20 percent lower than last year and 22 percent lower than the 3-year average. On the other
hand, the total corn movements were 22.24 million tons, 5 percent higher than last year and 6 percent higher than the 3-year average. .
Diesel Fuel Prices Level after Three Months of Consistent Decline
After more than a 3-month steady decline, during the past two weeks U.S. average on-highway diesel fuel prices leveled out near $2.966
per gallon. Prices increased only 0.1 cents during the week ending February 4, but were 12 cents below the same week last year.
According to the Energy Information Administration’s (EIA)latest Short-Term Energy Outlook, crude oil prices also fell in November
and December after October averages reached the highest level since October 2014. EIA said, “The price decline in late 2018 largely
reflected rising oil inventories as a result of record levels of crude oil production from the United States, Russia, and Saudi Arabia. Prices
also fell as a result of uncertainties about global economic indicators and future oil demand growth.”
BNSF Reports Almost $3 Billion in Customer Investments Last Year
Last week, BNSF Railway (BNSF) announced that its customers invested nearly $3 billion in 2018 to create or expand their facilities.
According to the press release, it is “the eighth consecutive year that BNSF customers and local economic development organizations
have invested more than $1 billion in a calendar year.” Among the customers highlighted, Dakota Plains opened a new $40 million grain
terminal in Napa Junction, SD, capable of handling 110-car trains. It is one of the largest grain facilities in southeastern South Dakota.
Snapshots by Sector
Rail
U.S. Class I railroads originated 21,435 grain carloads for the week ending January 26, down 6 percent from the previous week, 5
percent from last year, and 3 percent from the 3-year average.
Average February shuttle secondary railcar bids/offers per car were $230 above tariff for the week ending January 31, up $328 from last
week, and up $164 from last year. Average non-shuttle secondary railcar bids/offers per car were $50 below tariff, down $142 from last
week, and down $69 from last year.
Barge
For the week ending February 2, barge grain movements totaled 355,301 tons, 22 percent lower than the previous week and down 47
percent from the same period last year.
For the week ending February 2, 220 grain barges moved down river, 51 barges less than the previous week. There were 865 grain
barges unloaded in New Orleans, 5 percent higher than the previous week.
Ocean
For the week ending January 31, 34 ocean-going grain vessels were loaded in the Gulf, 15 percent less than the same period last year.
Fifty-two vessels are expected to be loaded within the next 10 days, 16 percent less than the same period last year.
For the week ending January 31, the ocean freight rate for shipping bulk grain, from the Gulf to Japan, was $39.00 per metric ton, 5
percent less than the previous week. The cost of shipping, from the PNW to Japan, was $22.00 per metric ton, 4 percent less than the
previous week.
Contact Us
February 7, 2019
Grain Transportation Report 2
Feature Article/Calendar
Fourth Quarter Grain Inspections Below Last Year
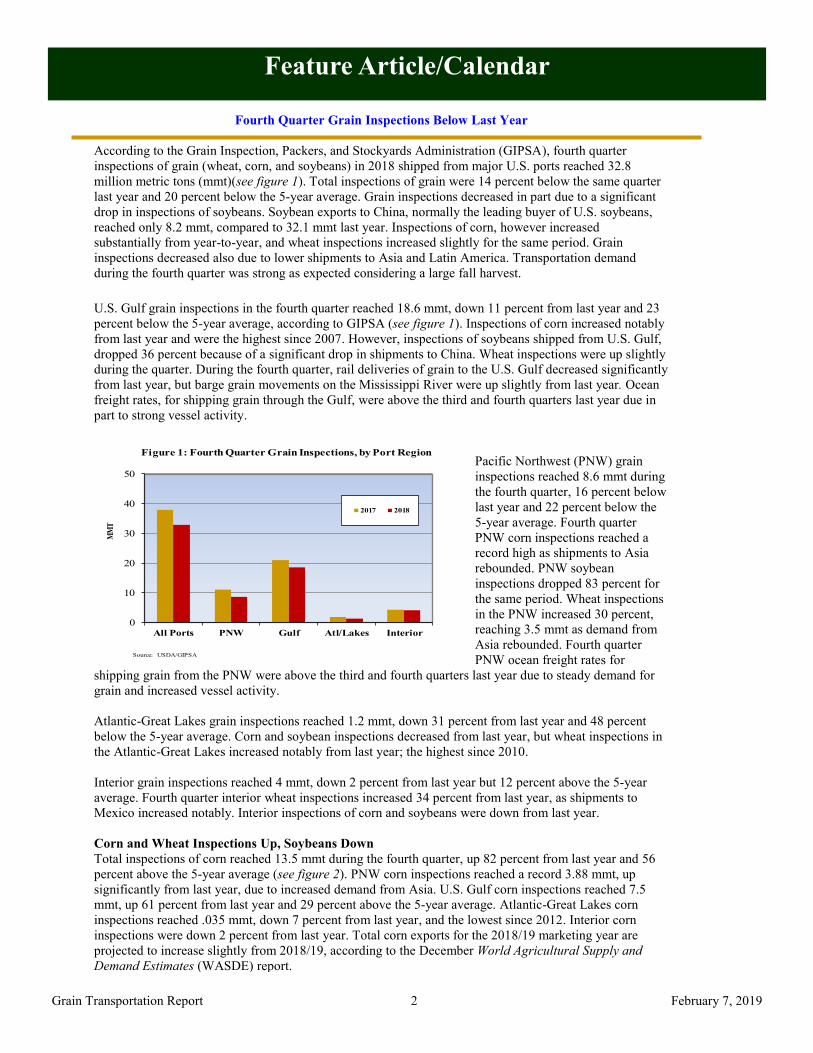
According to the Grain Inspection, Packers, and Stockyards Administration (GIPSA), fourth quarter
inspections of grain (wheat, corn, and soybeans) in 2018 shipped from major U.S. ports reached 32.8
million metric tons (mmt)(see figure 1). Total inspections of grain were 14 percent below the same quarter
last year and 20 percent below the 5-year average. Grain inspections decreased in part due to a significant
drop in inspections of soybeans. Soybean exports to China, normally the leading buyer of U.S. soybeans,
reached only 8.2 mmt, compared to 32.1 mmt last year. Inspections of corn, however increased
substantially from year-to-year, and wheat inspections increased slightly for the same period. Grain
inspections decreased also due to lower shipments to Asia and Latin America. Transportation demand
during the fourth quarter was strong as expected considering a large fall harvest.
U.S. Gulf grain inspections in the fourth quarter reached 18.6 mmt, down 11 percent from last year and 23
percent below the 5-year average, according to GIPSA (see figure 1). Inspections of corn increased notably
from last year and were the highest since 2007. However, inspections of soybeans shipped from U.S. Gulf,
dropped 36 percent because of a significant drop in shipments to China. Wheat inspections were up slightly
during the quarter. During the fourth quarter, rail deliveries of grain to the U.S. Gulf decreased significantly
from last year, but barge grain movements on the Mississippi River were up slightly from last year. Ocean
freight rates, for shipping grain through the Gulf, were above the third and fourth quarters last year due in
part to strong vessel activity.
Pacific Northwest (PNW) grain
inspections reached 8.6 mmt during
the fourth quarter, 16 percent below
last year and 22 percent below the
5-year average. Fourth quarter
PNW corn inspections reached a
record high as shipments to Asia
rebounded. PNW soybean
inspections dropped 83 percent for
the same period. Wheat inspections
in the PNW increased 30 percent,
reaching 3.5 mmt as demand from
Asia rebounded. Fourth quarter
PNW ocean freight rates for
shipping grain from the PNW were above the third and fourth quarters last year due to steady demand for
grain and increased vessel activity.
Atlantic-Great Lakes grain inspections reached 1.2 mmt, down 31 percent from last year and 48 percent
below the 5-year average. Corn and soybean inspections decreased from last year, but wheat inspections in
the Atlantic-Great Lakes increased notably from last year; the highest since 2010.
Interior grain inspections reached 4 mmt, down 2 percent from last year but 12 percent above the 5-year
average. Fourth quarter interior wheat inspections increased 34 percent from last year, as shipments to
Mexico increased notably. Interior inspections of corn and soybeans were down from last year.
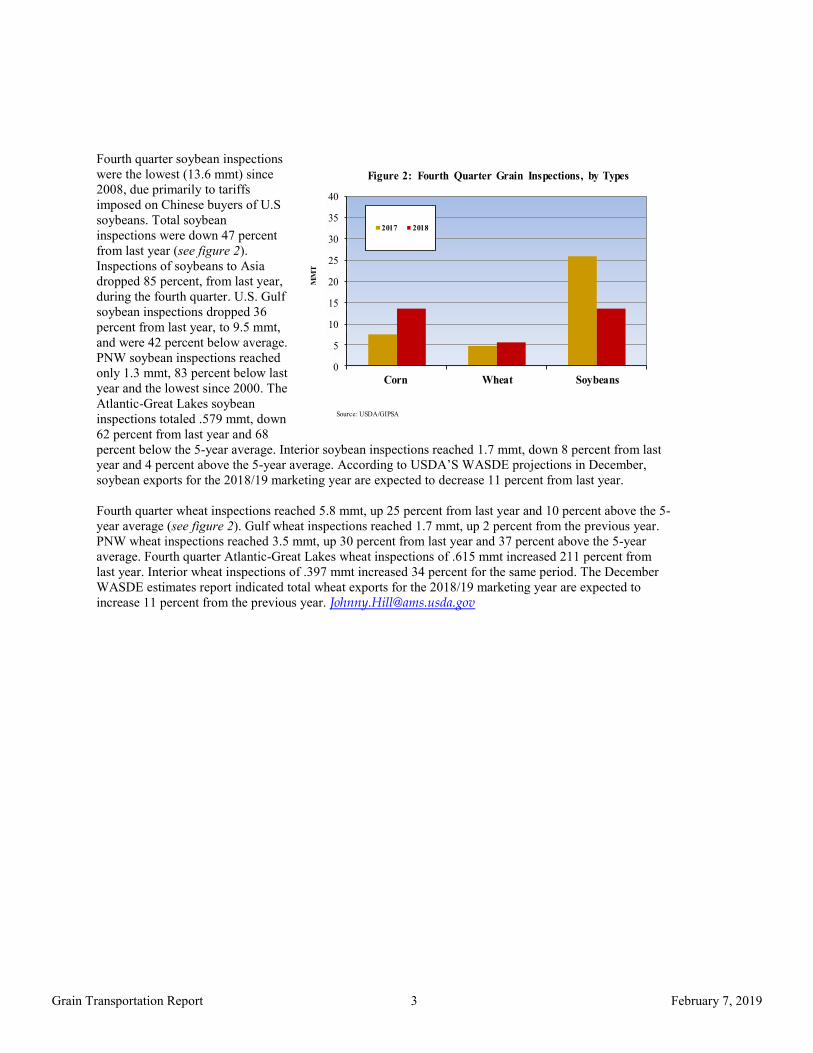
Corn and Wheat Inspections Up, Soybeans Down
Total inspections of corn reached 13.5 mmt during the fourth quarter, up 82 percent from last year and 56
percent above the 5-year average (see figure 2). PNW corn inspections reached a record 3.88 mmt, up
significantly from last year, due to increased demand from Asia. U.S. Gulf corn inspections reached 7.5
mmt, up 61 percent from last year and 29 percent above the 5-year average. Atlantic-Great Lakes corn
inspections reached .035 mmt, down 7 percent from last year, and the lowest since 2012. Interior corn
inspections were down 2 percent from last year. Total corn exports for the 2018/19 marketing year are
projected to increase slightly from 2018/19, according to the December World Agricultural Supply and
Demand Estimates (WASDE) report.
0
10
20
30
40
50
All Ports PNW Gulf Atl/Lakes Interior
MM
T
Figure 1: Fourth Quarter Grain Inspections, by Port Region
2017 2018
Source: USDA/GIPSA
February 7, 2019
Grain Transportation Report 3
Fourth quarter soybean inspections
were the lowest (13.6 mmt) since
2008, due primarily to tariffs
imposed on Chinese buyers of U.S
soybeans. Total soybean
inspections were down 47 percent
from last year (see figure 2).
Inspections of soybeans to Asia
dropped 85 percent, from last year,
during the fourth quarter. U.S. Gulf
soybean inspections dropped 36
percent from last year, to 9.5 mmt,
and were 42 percent below average.
PNW soybean inspections reached
only 1.3 mmt, 83 percent below last
year and the lowest since 2000. The
Atlantic-Great Lakes soybean
inspections totaled .579 mmt, down
62 percent from last year and 68
percent below the 5-year average. Interior soybean inspections reached 1.7 mmt, down 8 percent from last
year and 4 percent above the 5-year average. According to USDA’S WASDE projections in December,
soybean exports for the 2018/19 marketing year are expected to decrease 11 percent from last year.
Fourth quarter wheat inspections reached 5.8 mmt, up 25 percent from last year and 10 percent above the 5-
year average (see figure 2). Gulf wheat inspections reached 1.7 mmt, up 2 percent from the previous year.
PNW wheat inspections reached 3.5 mmt, up 30 percent from last year and 37 percent above the 5-year
average. Fourth quarter Atlantic-Great Lakes wheat inspections of .615 mmt increased 211 percent from
last year. Interior wheat inspections of .397 mmt increased 34 percent for the same period. The December
WASDE estimates report indicated total wheat exports for the 2018/19 marketing year are expected to
increase 11 percent from the previous year. [email protected]
0
5
10
15
20
25
30
35
40
Corn Wheat Soybeans
MM
T
Figure 2: Fourth Quarter Grain Inspections, by Types
2017 2018
Source: USDA/GIPSA
February 7, 2019
Grain Transportation Report 4
Grain Transportation Indicators
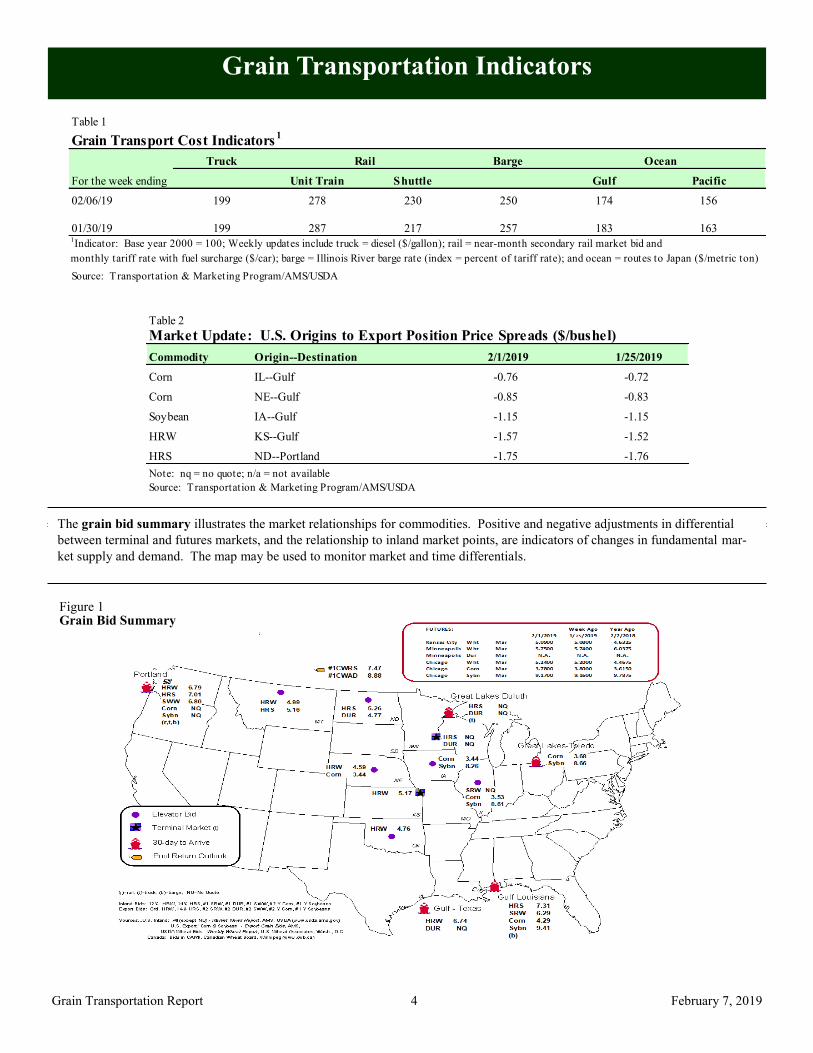
The grain bid summary illustrates the market relationships for commodities. Positive and negative adjustments in differential
between terminal and futures markets, and the relationship to inland market points, are indicators of changes in fundamental mar-
ket supply and demand. The map may be used to monitor market and time differentials.
Table 1
Grain Transport Cost Indicators1
Truck Barge Ocean
For the week ending Unit Train Shuttle Gulf Pacific
02/06/19 199 278 230 250 174 1560 % - 155% - 3 % - 5% - 4 %
01/30/19 199 287 217 257 183 163
Source: Transportation & Marketing Program/AMS/USDA
Rail
1Indicator: Base year 2000 = 100; Weekly updates include truck = diesel ($/gallon); rail = near-month secondary rail market bid and
monthly tariff rate with fuel surcharge ($/car); barge = Illinois River barge rate (index = percent of tariff rate); and ocean = routes to Japan ($/metric ton)
Table 2
Market Update: U.S. Origins to Export Position Price Spreads ($/bushel)
Commodity Origin--Destination 2/1/2019 1/25/2019
Corn IL--Gulf -0.76 -0.72
Corn NE--Gulf -0.85 -0.83
Soybean IA--Gulf -1.15 -1.15
HRW KS--Gulf -1.57 -1.52
HRS ND--Portland -1.75 -1.76
Note: nq = no quote; n/a = not available
Source: Transportation & Marketing Program/AMS/USDA
Figure 1 Grain Bid Summary
February 7, 2019
Grain Transportation Report 5
Rail Transportation
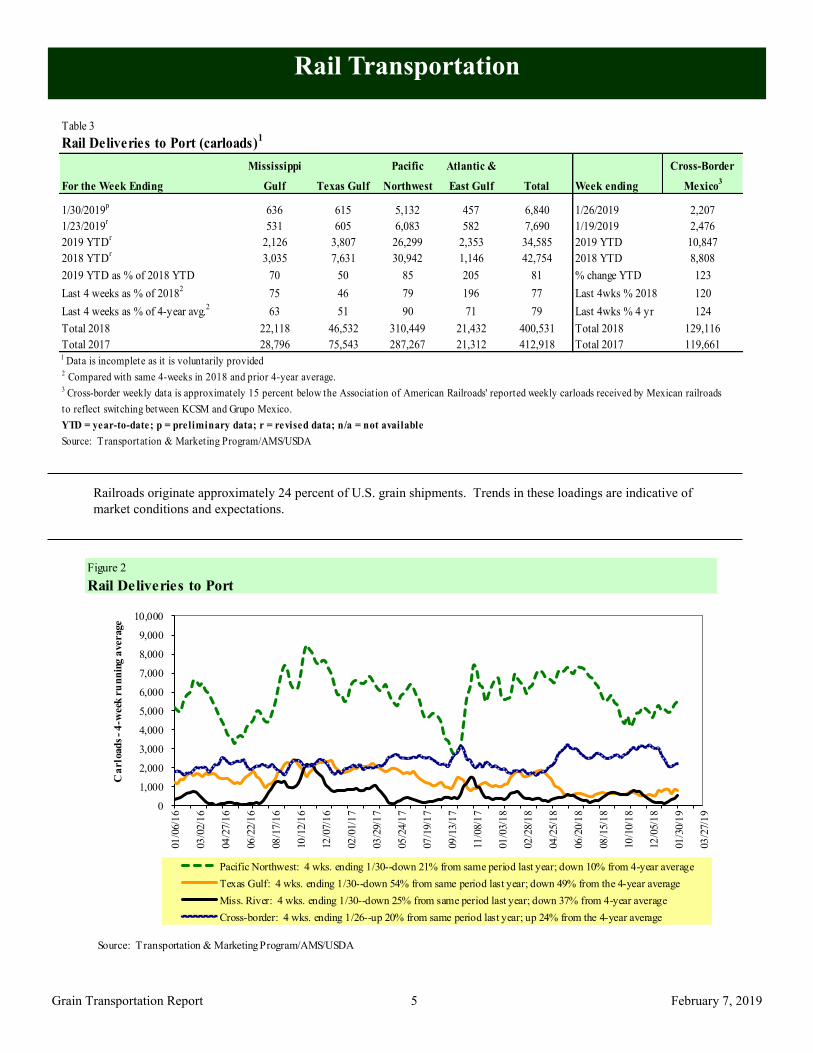
Railroads originate approximately 24 percent of U.S. grain shipments. Trends in these loadings are indicative of
market conditions and expectations.
Table 3
Rail Deliveries to Port (carloads)1
Mississippi Pacific Atlantic & Cross-Border
For the Week Ending Gulf Texas Gulf Northwest East Gulf Total Week ending Mexico3
1/30/2019p
636 615 5,132 457 6,840 1/26/2019 2,207
1/23/2019r
531 605 6,083 582 7,690 1/19/2019 2,476
2019 YTDr
2,126 3,807 26,299 2,353 34,585 2019 YTD 10,847
2018 YTDr
3,035 7,631 30,942 1,146 42,754 2018 YTD 8,808
2019 YTD as % of 2018 YTD 70 50 85 205 81 % change YTD 123
Last 4 weeks as % of 20182
75 46 79 196 77 Last 4wks % 2018 120
Last 4 weeks as % of 4-year avg.2
63 51 90 71 79 Last 4wks % 4 yr 124
Total 2018 22,118 46,532 310,449 21,432 400,531 Total 2018 129,116
Total 2017 28,796 75,543 287,267 21,312 412,918 Total 2017 119,6611 Data is incomplete as it is voluntarily provided2 Compared with same 4-weeks in 2018 and prior 4-year average.
3 Cross-border weekly data is approximately 15 percent below the Association of American Railroads' reported weekly carloads received by Mexican railroads
to reflect switching between KCSM and Grupo Mexico.
YTD = year-to-date; p = preliminary data; r = revised data; n/a = not available
Source: Transportation & Marketing Program/AMS/USDA
Figure 2
Rail Deliveries to Port
0
1,000
2,000
3,000
4,000
5,000
6,000
7,000
8,000
9,000
10,000
01/0
6/1
6
03/0
2/1
6
04/2
7/1
6
06/2
2/1
6
08/1
7/1
6
10/1
2/1
6
12/0
7/1
6
02/0
1/1
7
03/2
9/1
7
05/2
4/1
7
07/1
9/1
7
09/1
3/1
7
11/0
8/1
7
01/0
3/1
8
02/2
8/1
8
04/2
5/1
8
06/2
0/1
8
08/1
5/1
8
10/1
0/1
8
12/0
5/1
8
01/3
0/1
9
03/2
7/1
9
Ca
rlo
ad
s -
4-w
eek
ru
nn
ing
average
Pacific Northwest: 4 wks. ending 1/30--down 21% from same period last year; down 10% from 4-year average
Texas Gulf: 4 wks. ending 1/30--down 54% from same period last year; down 49% from the 4-year average
Miss. River: 4 wks. ending 1/30--down 25% from same period last year; down 37% from 4-year average
Cross-border: 4 wks. ending 1/26--up 20% from same period last year; up 24% from the 4-year average
Source: Transportation & Marketing Program/AMS/USDA
February 7, 2019
Grain Transportation Report 6
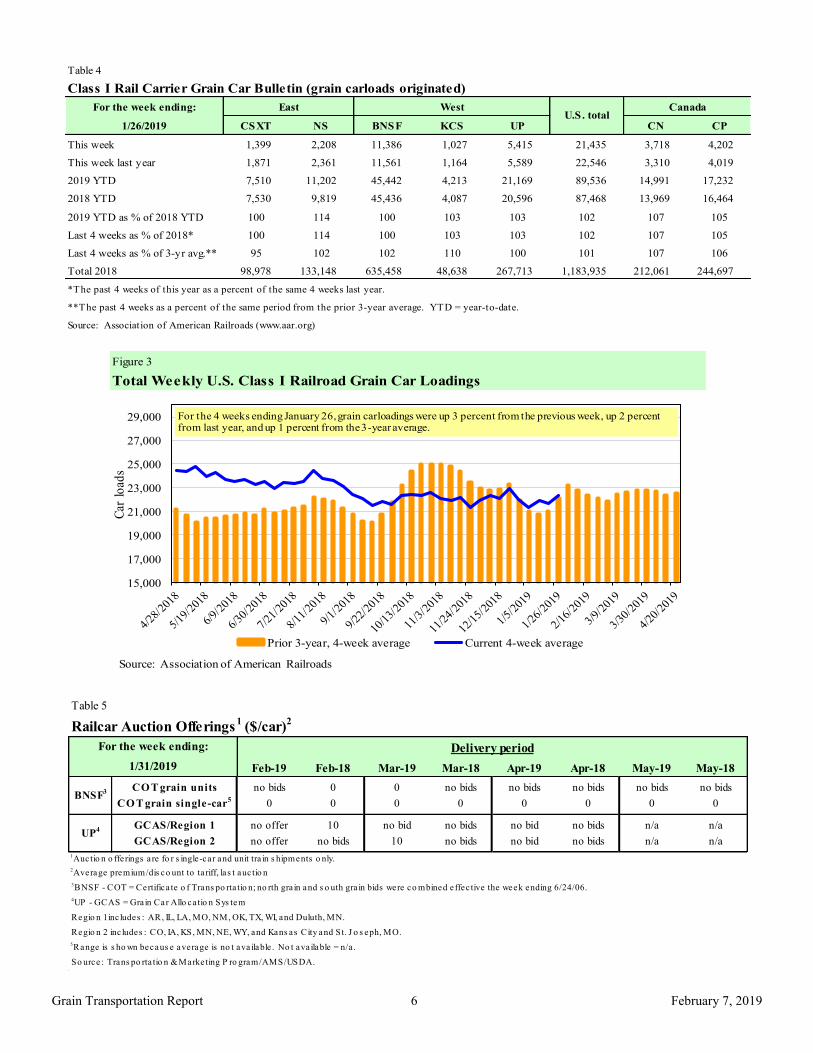
Table 5
Railcar Auction Offerings1
($/car)2
Feb-19 Feb-18 Mar-19 Mar-18 Apr-19 Apr-18 May-19 May-18
CO T grain units no bids 0 0 no bids no bids no bids no bids no bids
CO T grain single-car5 0 0 0 0 0 0 0 0
GCAS/Region 1 no offer 10 no bid no bids no bid no bids n/a n/a
GCAS/Region 2 no offer no bids 10 no bids no bid no bids n/a n/a
1Auctio n o fferings a re fo r s ingle-car and unit tra in s hipments o nly.2Average premium/dis co unt to ta riff, las t auc tio n
3BNSF - COT = Certifica te o f Trans po rta tio n; no rth gra in and s o uth gra in bids were co mbined effec tive the week ending 6/24/06.
4UP - GCAS = Grain Car Allo ca tio n Sys tem
Regio n 1 inc ludes : AR, IL, LA, MO, NM, OK, TX, WI, and Duluth, MN.
Regio n 2 inc ludes : CO, IA, KS, MN, NE, WY, and Kans as City and St. J o s eph, MO.
5Range is s ho wn becaus e average is no t ava ilable . No t ava ilable = n/a .
So urce : Trans po rta tio n & Marketing P ro gram/AMS/USDA.
UP4
Delivery period
BNSF3
For the week ending:
1/31/2019
Figure 3
Total Weekly U.S. Class I Railroad Grain Car Loadings
15,000
17,000
19,000
21,000
23,000
25,000
27,000
29,000
Car
lo
ads
Prior 3-year, 4-week average Current 4-week average
For the 4 weeks ending January 26, grain carloadings were up 3 percent from the previous week, up 2 percent from last year, and up 1 percent from the 3-year average.
Source: Association of American Railroads
Table 4
Class I Rail Carrier Grain Car Bulletin (grain carloads originated)
For the week ending:
1/26/2019 CSXT NS BNSF KCS UP CN CP
This week 1,399 2,208 11,386 1,027 5,415 21,435 3,718 4,202
This week last year 1,871 2,361 11,561 1,164 5,589 22,546 3,310 4,019
2019 YTD 7,510 11,202 45,442 4,213 21,169 89,536 14,991 17,232
2018 YTD 7,530 9,819 45,436 4,087 20,596 87,468 13,969 16,464
2019 YTD as % of 2018 YTD 100 114 100 103 103 102 107 105
Last 4 weeks as % of 2018* 100 114 100 103 103 102 107 105
Last 4 weeks as % of 3-yr avg.** 95 102 102 110 100 101 107 106
Total 2018 98,978 133,148 635,458 48,638 267,713 1,183,935 212,061 244,697
*The past 4 weeks of this year as a percent of the same 4 weeks last year.
**The past 4 weeks as a percent of the same period from the prior 3-year average. YTD = year-to-date.
Source: Association of American Railroads (www.aar.org)
East WestU.S. total
Canada
February 7, 2019
Grain Transportation Report 7
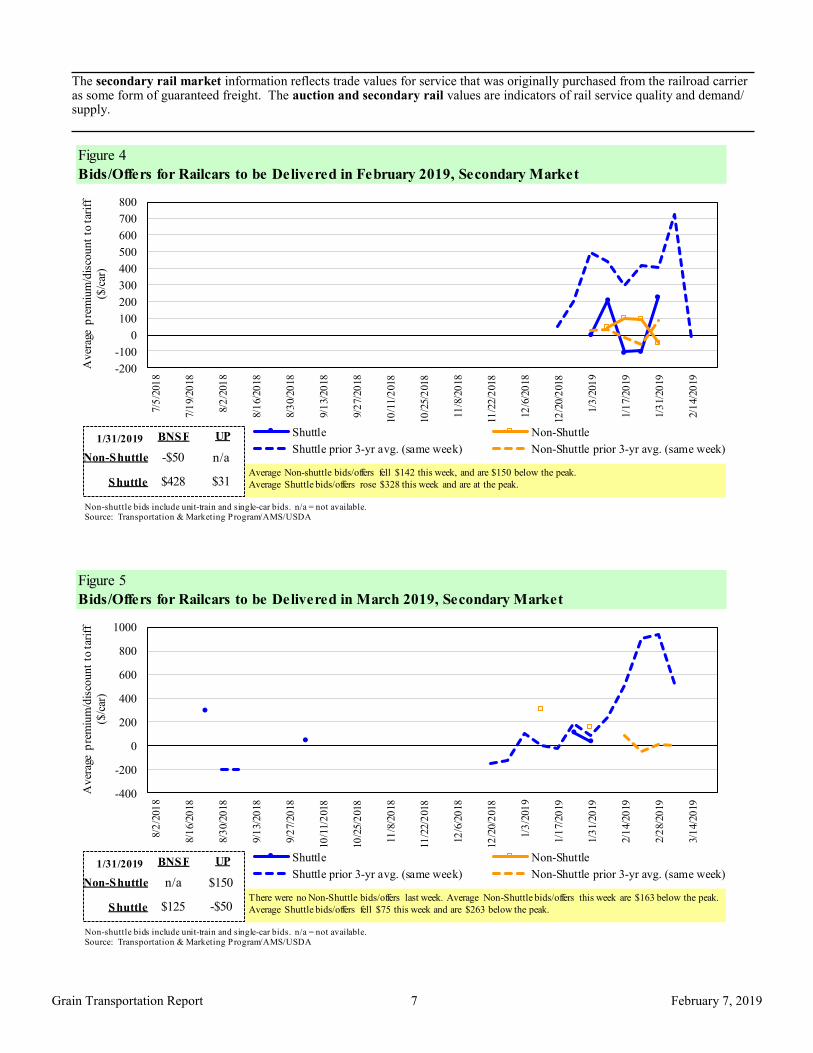
The secondary rail market information reflects trade values for service that was originally purchased from the railroad carrier as some form of guaranteed freight. The auction and secondary rail values are indicators of rail service quality and demand/supply.
Figure 4
Bids/Offers for Railcars to be Delivered in February 2019, Secondary Market
-200
-100
0
100
200
300
400
500
600
700
800
7/5
/201
8
7/1
9/20
18
8/2
/201
8
8/1
6/20
18
8/3
0/20
18
9/1
3/20
18
9/2
7/20
18
10/1
1/2
018
10/2
5/2
018
11/8
/20
18
11/2
2/2
018
12/6
/20
18
12/2
0/2
018
1/3
/201
9
1/1
7/20
19
1/3
1/20
19
2/1
4/20
19
Aver
age
pre
miu
m/d
isco
unt
to t
arif
f
($/c
ar)
Shuttle Non-Shuttle
Shuttle prior 3-yr avg. (same week) Non-Shuttle prior 3-yr avg. (same week)1/31/2019
Non-shuttle bids include unit-train and single-car bids. n/a = not available.Source: Transportation & Marketing Program/AMS/USDA
-$50
UPBNSF
$428
n/a
$31Shuttle
Non-Shuttle
Average Non-shuttle bids/offers fell $142 this week, and are $150 below the peak.
Average Shuttle bids/offers rose $328 this week and are at the peak.
Figure 5
Bids/Offers for Railcars to be Delivered in March 2019, Secondary Market
-400
-200
0
200
400
600
800
1000
8/2
/201
8
8/1
6/20
18
8/3
0/20
18
9/1
3/20
18
9/2
7/20
18
10/1
1/2
018
10/2
5/2
018
11/8
/20
18
11/2
2/2
018
12/6
/20
18
12/2
0/2
018
1/3
/201
9
1/1
7/20
19
1/3
1/20
19
2/1
4/20
19
2/2
8/20
19
3/1
4/20
19
Av
erag
e p
rem
ium
/dis
cou
nt
to tar
iff
($/c
ar)
Shuttle Non-Shuttle
Shuttle prior 3-yr avg. (same week) Non-Shuttle prior 3-yr avg. (same week)1/31/2019
Non-shuttle bids include unit-train and single-car bids. n/a = not available.Source: Transportation & Marketing Program/AMS/USDA
n/a
UPBNSF
$125
$150
-$50Shuttle
Non-Shuttle
There were no Non-Shuttle bids/offers last week. Average Non-Shuttle bids/offers this week are $163 below the peak.
Average Shuttle bids/offers fell $75 this week and are $263 below the peak.
February 7, 2019
Grain Transportation Report 8
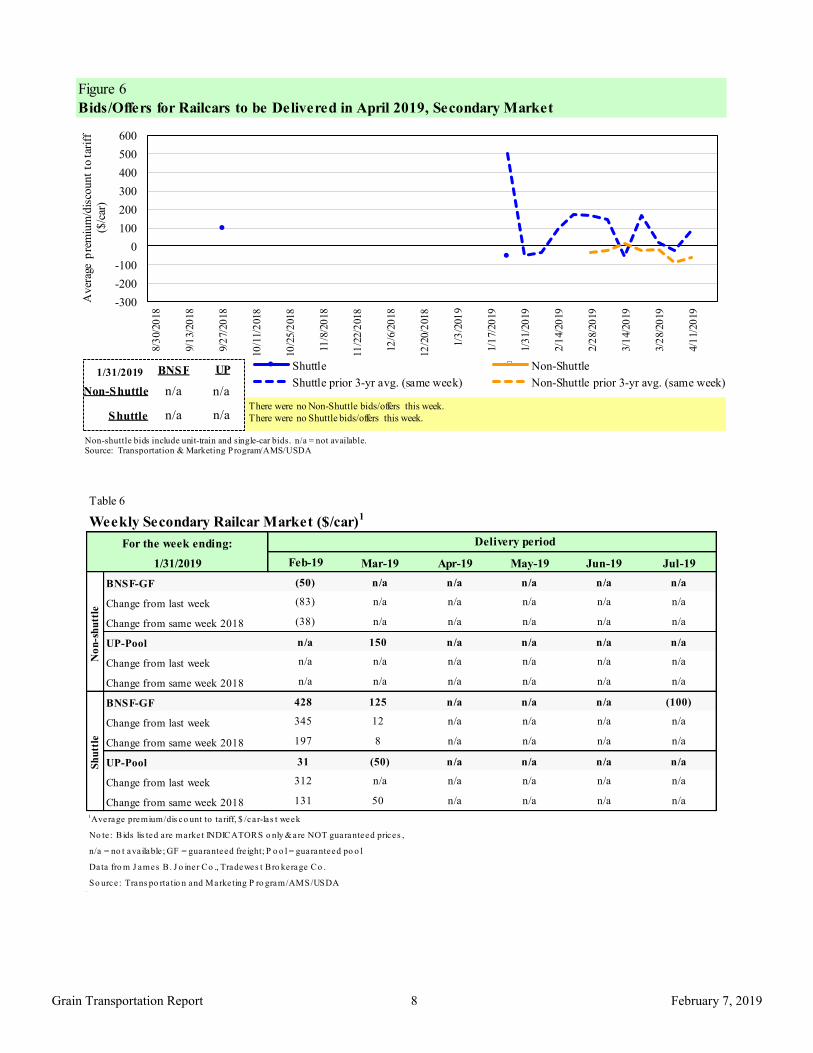
Figure 6
Bids/Offers for Railcars to be Delivered in April 2019, Secondary Market
-300
-200
-100
0
100
200
300
400
500
600
8/3
0/20
18
9/1
3/20
18
9/2
7/20
18
10/1
1/2
018
10/2
5/2
018
11/8
/20
18
11/2
2/2
018
12/6
/20
18
12/2
0/2
018
1/3
/201
9
1/1
7/20
19
1/3
1/20
19
2/1
4/20
19
2/2
8/20
19
3/1
4/20
19
3/2
8/20
19
4/1
1/20
19
Av
erag
e p
rem
ium
/dis
cou
nt
to tar
iff
($/c
ar)
Shuttle Non-Shuttle
Shuttle prior 3-yr avg. (same week) Non-Shuttle prior 3-yr avg. (same week)1/31/2019
Non-shuttle bids include unit-train and single-car bids. n/a = not available.Source: Transportation & Marketing Program/AMS/USDA
n/a
UPBNSF
n/a
n/a
n/aShuttle
Non-Shuttle
There were no Non-Shuttle bids/offers this week.
There were no Shuttle bids/offers this week.
Table 6
Weekly Secondary Railcar Market ($/car)1
Feb-19 Mar-19 Apr-19 May-19 Jun-19 Jul-19
BNSF-GF (50) n/a n/a n/a n/a n/a
Change from last week (83) n/a n/a n/a n/a n/a
Change from same week 2018 (38) n/a n/a n/a n/a n/a
UP-Pool n/a 150 n/a n/a n/a n/a
Change from last week n/a n/a n/a n/a n/a n/a
Change from same week 2018 n/a n/a n/a n/a n/a n/a
BNSF-GF 428 125 n/a n/a n/a (100)
Change from last week 345 12 n/a n/a n/a n/a
Change from same week 2018 197 8 n/a n/a n/a n/a
UP-Pool 31 (50) n/a n/a n/a n/a
Change from last week 312 n/a n/a n/a n/a n/a
Change from same week 2018 131 50 n/a n/a n/a n/a
1Average premium/dis co unt to ta riff, $ /car-las t week
No te : Bids lis ted are market INDICATORS o nly & are NOT guaranteed prices ,
n/a = no t ava ilable ; GF = guaranteed fre ight; P o o l = guaranteed po o l
Data fro m J ames B. J o iner Co ., Tradewes t Bro kerage Co .
So urce : Trans po rta tio n and Marketing P ro gram/AMS/USDA
No
n-s
hu
ttle
For the week ending:
1/31/2019
Sh
utt
le
Delivery period
February 7, 2019
Grain Transportation Report 9
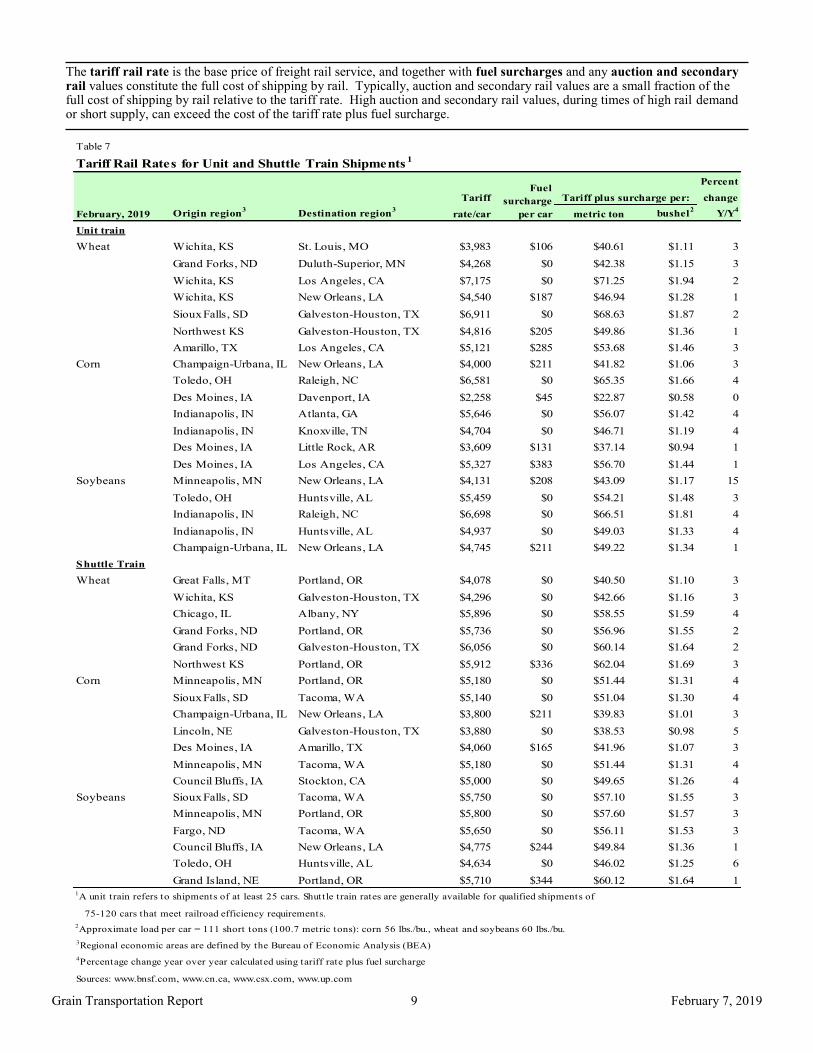
The tariff rail rate is the base price of freight rail service, and together with fuel surcharges and any auction and secondary rail values constitute the full cost of shipping by rail. Typically, auction and secondary rail values are a small fraction of the full cost of shipping by rail relative to the tariff rate. High auction and secondary rail values, during times of high rail demand or short supply, can exceed the cost of the tariff rate plus fuel surcharge.
Table 7
Tariff Rail Rates for Unit and Shuttle Train Shipments1
Percent
Tariff change
February, 2019 Origin region3
Destination region3
rate/car metric ton bushel2
Y/Y4
Unit train
Wheat Wichita, KS St. Louis, MO $3,983 $106 $40.61 $1.11 3
Grand Forks, ND Duluth-Superior, MN $4,268 $0 $42.38 $1.15 3
Wichita, KS Los Angeles, CA $7,175 $0 $71.25 $1.94 2
Wichita, KS New Orleans, LA $4,540 $187 $46.94 $1.28 1
Sioux Falls, SD Galveston-Houston, TX $6,911 $0 $68.63 $1.87 2
Northwest KS Galveston-Houston, TX $4,816 $205 $49.86 $1.36 1
Amarillo, TX Los Angeles, CA $5,121 $285 $53.68 $1.46 3
Corn Champaign-Urbana, IL New Orleans, LA $4,000 $211 $41.82 $1.06 3
Toledo, OH Raleigh, NC $6,581 $0 $65.35 $1.66 4
Des Moines, IA Davenport, IA $2,258 $45 $22.87 $0.58 0
Indianapolis, IN Atlanta, GA $5,646 $0 $56.07 $1.42 4
Indianapolis, IN Knoxville, TN $4,704 $0 $46.71 $1.19 4
Des Moines, IA Little Rock, AR $3,609 $131 $37.14 $0.94 1
Des Moines, IA Los Angeles, CA $5,327 $383 $56.70 $1.44 1
Soybeans Minneapolis, MN New Orleans, LA $4,131 $208 $43.09 $1.17 15
Toledo, OH Huntsville, AL $5,459 $0 $54.21 $1.48 3
Indianapolis, IN Raleigh, NC $6,698 $0 $66.51 $1.81 4
Indianapolis, IN Huntsville, AL $4,937 $0 $49.03 $1.33 4
Champaign-Urbana, IL New Orleans, LA $4,745 $211 $49.22 $1.34 1
Shuttle Train
Wheat Great Falls, MT Portland, OR $4,078 $0 $40.50 $1.10 3
Wichita, KS Galveston-Houston, TX $4,296 $0 $42.66 $1.16 3
Chicago, IL Albany, NY $5,896 $0 $58.55 $1.59 4
Grand Forks, ND Portland, OR $5,736 $0 $56.96 $1.55 2
Grand Forks, ND Galveston-Houston, TX $6,056 $0 $60.14 $1.64 2
Northwest KS Portland, OR $5,912 $336 $62.04 $1.69 3
Corn Minneapolis, MN Portland, OR $5,180 $0 $51.44 $1.31 4
Sioux Falls, SD Tacoma, WA $5,140 $0 $51.04 $1.30 4
Champaign-Urbana, IL New Orleans, LA $3,800 $211 $39.83 $1.01 3
Lincoln, NE Galveston-Houston, TX $3,880 $0 $38.53 $0.98 5
Des Moines, IA Amarillo, TX $4,060 $165 $41.96 $1.07 3
Minneapolis, MN Tacoma, WA $5,180 $0 $51.44 $1.31 4
Council Bluffs, IA Stockton, CA $5,000 $0 $49.65 $1.26 4
Soybeans Sioux Falls, SD Tacoma, WA $5,750 $0 $57.10 $1.55 3
Minneapolis, MN Portland, OR $5,800 $0 $57.60 $1.57 3
Fargo, ND Tacoma, WA $5,650 $0 $56.11 $1.53 3
Council Bluffs, IA New Orleans, LA $4,775 $244 $49.84 $1.36 1
Toledo, OH Huntsville, AL $4,634 $0 $46.02 $1.25 6
Grand Island, NE Portland, OR $5,710 $344 $60.12 $1.64 11A unit train refers to shipments of at least 25 cars. Shuttle train rates are generally available for qualified shipments of
75-120 cars that meet railroad efficiency requirements.
2Approximate load per car = 111 short tons (100.7 metric tons): corn 56 lbs./bu., wheat and soybeans 60 lbs./bu.
3Regional economic areas are defined by the Bureau of Economic Analysis (BEA)
4Percentage change year over year calculated using tariff rate plus fuel surcharge
Sources: www.bnsf.com, www.cn.ca, www.csx.com, www.up.com
Tariff plus surcharge per:Fuel
surcharge
per car
February 7, 2019
Grain Transportation Report 10
Figure 7
Railroad Fuel Surcharges, North American Weighted Average1
$0.00
$0.10
$0.20
$0.30
$0.40
$0.50
$0.60
$0.70
Dollar
s p
er r
ailc
ar m
ile
3-Year Monthly Average
Fuel Surcharge* ($/mile/railcar)
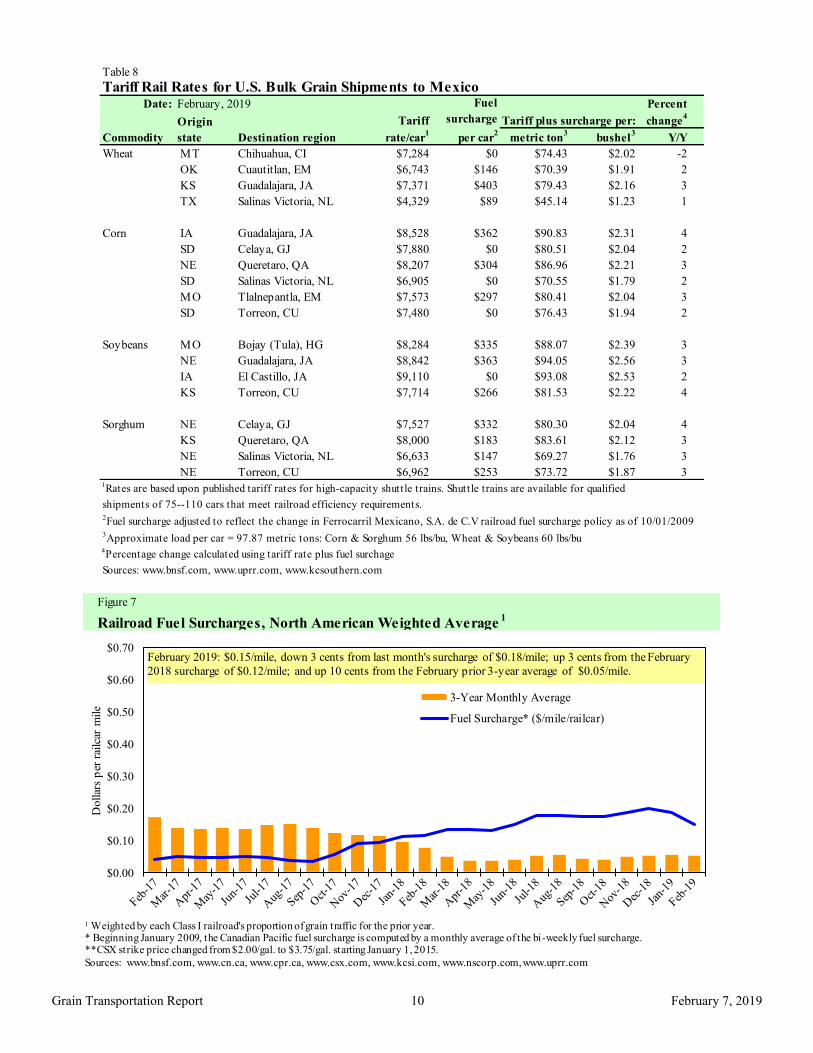
February 2019: $0.15/mile, down 3 cents from last month's surcharge of $0.18/mile; up 3 cents from the February
2018 surcharge of $0.12/mile; and up 10 cents from the February prior 3-year average of $0.05/mile.
1 Weighted by each Class I railroad's proportion of grain traffic for the prior year. * Beginning January 2009, the Canadian Pacific fuel surcharge is computed by a monthly average of the bi-weekly fuel surcharge.**CSX strike price changed from $2.00/gal. to $3.75/gal. starting January 1, 2015.
Sources: www.bnsf.com, www.cn.ca, www.cpr.ca, www.csx.com, www.kcsi.com, www.nscorp.com, www.uprr.com
Table 8
Tariff Rail Rates for U.S. Bulk Grain Shipments to MexicoDate: Percent
Tariff change4
Commodity Destination region rate/car1
metric ton3 bushel
3Y/Y
Wheat MT Chihuahua, CI $7,284 $0 $74.43 $2.02 -2
OK Cuautitlan, EM $6,743 $146 $70.39 $1.91 2
KS Guadalajara, JA $7,371 $403 $79.43 $2.16 3
TX Salinas Victoria, NL $4,329 $89 $45.14 $1.23 1
Corn IA Guadalajara, JA $8,528 $362 $90.83 $2.31 4
SD Celaya, GJ $7,880 $0 $80.51 $2.04 2
NE Queretaro, QA $8,207 $304 $86.96 $2.21 3
SD Salinas Victoria, NL $6,905 $0 $70.55 $1.79 2
MO Tlalnepantla, EM $7,573 $297 $80.41 $2.04 3
SD Torreon, CU $7,480 $0 $76.43 $1.94 2
Soybeans MO Bojay (Tula), HG $8,284 $335 $88.07 $2.39 3
NE Guadalajara, JA $8,842 $363 $94.05 $2.56 3
IA El Castillo, JA $9,110 $0 $93.08 $2.53 2
KS Torreon, CU $7,714 $266 $81.53 $2.22 4
Sorghum NE Celaya, GJ $7,527 $332 $80.30 $2.04 4
KS Queretaro, QA $8,000 $183 $83.61 $2.12 3
NE Salinas Victoria, NL $6,633 $147 $69.27 $1.76 3
NE Torreon, CU $6,962 $253 $73.72 $1.87 31Rates are based upon published tariff rates for high-capacity shuttle trains. Shuttle trains are available for qualified
shipments of 75--110 cars that meet railroad efficiency requirements.2Fuel surcharge adjusted to reflect the change in Ferrocarril Mexicano, S.A. de C.V railroad fuel surcharge policy as of 10/01/20093Approximate load per car = 97.87 metric tons: Corn & Sorghum 56 lbs/bu, Wheat & Soybeans 60 lbs/bu4Percentage change calculated using tariff rate plus fuel surchage
Sources: www.bnsf.com, www.uprr.com, www.kcsouthern.com
Fuel
surcharge
per car2
Tariff plus surcharge per:Origin
state
February, 2019
February 7, 2019
Grain Transportation Report 11
Barge Transportation
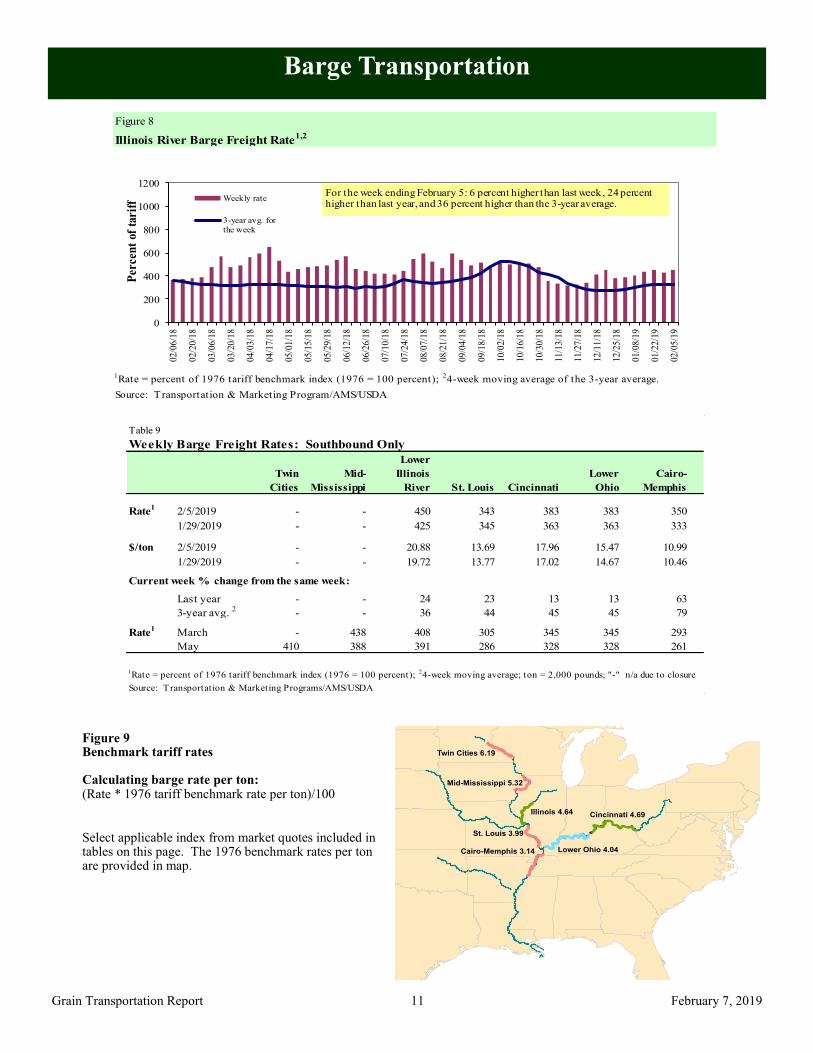
Figure 9 Benchmark tariff rates Calculating barge rate per ton: (Rate * 1976 tariff benchmark rate per ton)/100
Select applicable index from market quotes included in tables on this page. The 1976 benchmark rates per ton are provided in map.
Twin Cities 6.19
Mid-Mississippi 5.32
St. Louis 3.99
Cairo-Memphis 3.14
Illinois 4.64 Cincinnati 4.69
Lower Ohio 4.04
Figure 8
Illinois River Barge Freight Rate1,2
1Rate = percent of 1976 tariff benchmark index (1976 = 100 percent); 24-week moving average of the 3-year average.
Source: Transportation & Marketing Program/AMS/USDA
0
200
400
600
800
1000
120002/0
6/1
8
02/2
0/1
8
03/0
6/1
8
03/2
0/1
8
04/0
3/1
8
04/1
7/1
8
05/0
1/1
8
05/1
5/1
8
05/2
9/1
8
06/1
2/1
8
06/2
6/1
8
07/1
0/1
8
07/2
4/1
8
08/0
7/1
8
08/2
1/1
8
09/0
4/1
8
09/1
8/1
8
10/0
2/1
8
10/1
6/1
8
10/3
0/1
8
11/1
3/1
8
11/2
7/1
8
12/1
1/1
8
12/2
5/1
8
01/0
8/1
9
01/2
2/1
9
02/0
5/1
9
Per
cen
t of
tar
iff Weekly rate
3-year avg. for
the week
For the week ending February 5: 6 percent higher than last week , 24 percent higher than last year, and 36 percent higher than the 3-year average.
Table 9
Weekly Barge Freight Rates: Southbound Only
Twin
Cities
Mid-
Mississippi
Lower
Illinois
River St. Louis Cincinnati
Lower
Ohio
Cairo-
Memphis
Rate1
2/5/2019 - - 450 343 383 383 350
1/29/2019 - - 425 345 363 363 333
$/ton 2/5/2019 - - 20.88 13.69 17.96 15.47 10.99
1/29/2019 - - 19.72 13.77 17.02 14.67 10.46
Current week % change from the same week:
Last year - - 24 23 13 13 63
3-year avg. 2
- - 36 44 45 45 79-2 6 6
Rate1
March - 438 408 305 345 345 293
May 410 388 391 286 328 328 261
Source: Transportation & Marketing Programs/AMS/USDA
1Rate = percent of 1976 tariff benchmark index (1976 = 100 percent); 24-week moving average; ton = 2,000 pounds; "-" n/a due to closure
February 7, 2019
Grain Transportation Report 12
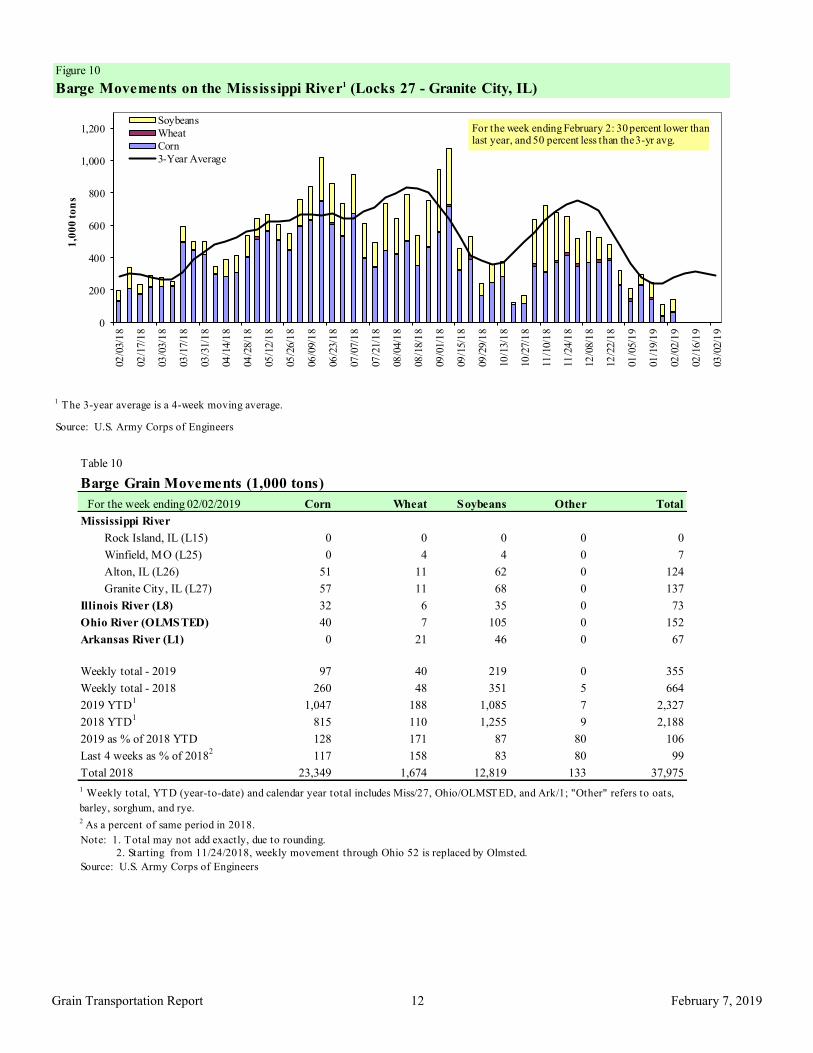
Figure 10
Barge Movements on the Mississippi River1 (Locks 27 - Granite City, IL)
1 The 3-year average is a 4-week moving average.
Source: U.S. Army Corps of Engineers
0
200
400
600
800
1,000
1,20002
/03/1
8
02
/17/1
8
03
/03/1
8
03
/17/1
8
03
/31/1
8
04
/14/1
8
04
/28/1
8
05
/12/1
8
05
/26/1
8
06
/09/1
8
06
/23/1
8
07
/07/1
8
07
/21/1
8
08
/04/1
8
08
/18/1
8
09
/01/1
8
09
/15/1
8
09
/29/1
8
10
/13/1
8
10
/27/1
8
11
/10/1
8
11
/24/1
8
12
/08/1
8
12
/22/1
8
01
/05/1
9
01
/19/1
9
02
/02/1
9
02
/16/1
9
03
/02/1
9
1,0
00
to
ns
Soybeans
Wheat
Corn
3-Year Average
For the week ending February 2: 30 percent lower thanlast year, and 50 percent less than the3-yr avg.
Table 10
Barge Grain Movements (1,000 tons)
For the week ending 02/02/2019 Corn Wheat Soybeans Other Total
Mississippi River
Rock Island, IL (L15) 0 0 0 0 0
Winfield, MO (L25) 0 4 4 0 7
Alton, IL (L26) 51 11 62 0 124
Granite City, IL (L27) 57 11 68 0 137
Illinois River (L8) 32 6 35 0 73
Ohio River (OLMSTED) 40 7 105 0 152
Arkansas River (L1) 0 21 46 0 67
Weekly total - 2019 97 40 219 0 355
Weekly total - 2018 260 48 351 5 664
2019 YTD1
1,047 188 1,085 7 2,327
2018 YTD1
815 110 1,255 9 2,188
2019 as % of 2018 YTD 128 171 87 80 106
Last 4 weeks as % of 20182
117 158 83 80 99
Total 2018 23,349 1,674 12,819 133 37,975
2 As a percent of same period in 2018.
2. Starting from 11/24/2018, weekly movement through Ohio 52 is replaced by Olmsted.
Source: U.S. Army Corps of Engineers
Note: 1. Total may not add exactly, due to rounding.
1 Weekly total, YTD (year-to-date) and calendar year total includes Miss/27, Ohio/OLMSTED, and Ark/1; "Other" refers to oats,
barley, sorghum, and rye.
February 7, 2019
Grain Transportation Report 13
Figure 12
Grain Barges for Export in New Orleans Region
Source: U.S. Army Corps of Engineers and GIPSA
0
200
400
600
800
1000
1200
1400
10
/14
/17
10
/28
/17
11
/11
/17
11
/25
/17
12
/9/1
7
12
/23
/17
1/6
/18
1/2
0/1
8
2/3
/18
2/1
7/1
8
3/3
/18
3/1
7/1
8
3/3
1/1
8
4/1
4/1
8
4/2
8/1
8
5/1
2/1
8
5/2
6/1
8
6/9
/18
6/2
3/1
8
7/7
/18
7/2
1/1
8
8/4
/18
8/1
8/1
8
9/1
/18
9/1
5/1
8
9/2
9/1
8
10
/13
/18
10
/27
/18
11
/10
/18
11
/24
/18
12
/8/1
8
12
/22
/18
1/5
/19
1/1
9/1
9
2/2
/19
Downbound Grain Barges Locks 27, 1, and Olmsted
Grain Barges Unloaded in New Orleans
Nu
mb
er o
f b
arges
For the week ending February 2: 220 grain barges moved down river, 51 barges less than last week; 865 grain barges were unloaded in New Orleans, 5 percent higher than the previous week.
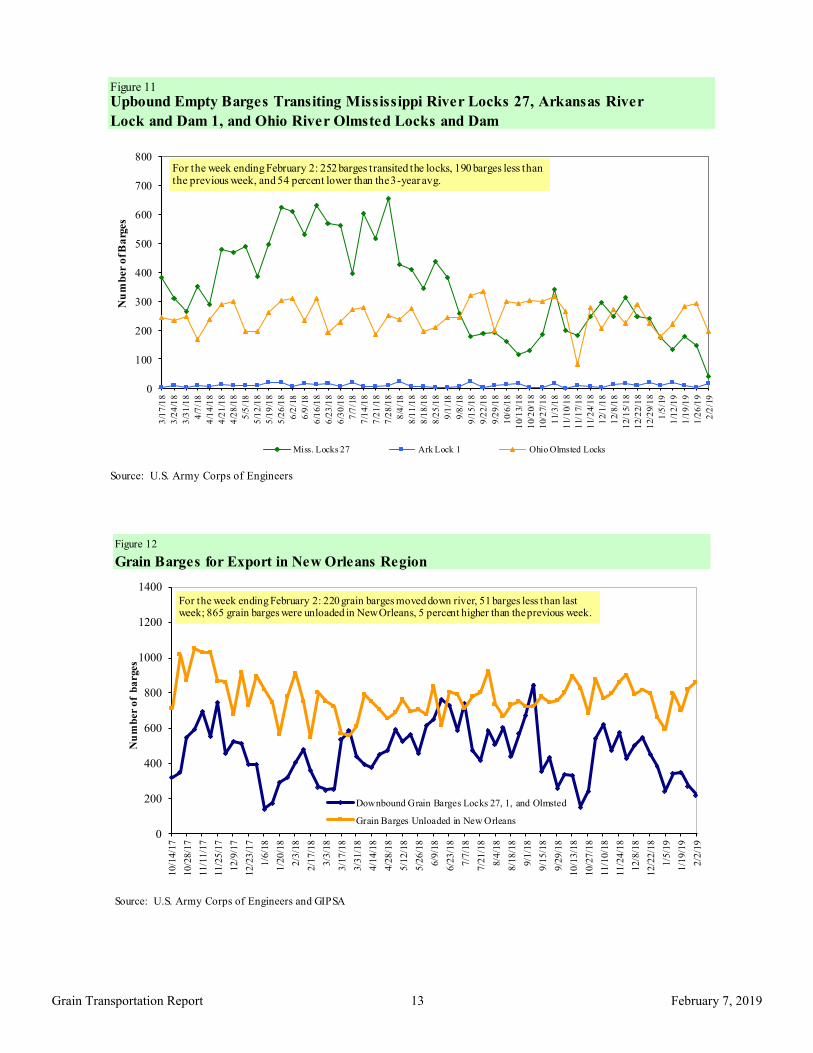
Figure 11
Source: U.S. Army Corps of Engineers
Upbound Empty Barges Transiting Mississippi River Locks 27, Arkansas River
Lock and Dam 1, and Ohio River Olmsted Locks and Dam
0
100
200
300
400
500
600
700
8003
/17
/18
3/2
4/1
8
3/3
1/1
8
4/7
/18
4/1
4/1
8
4/2
1/1
8
4/2
8/1
8
5/5
/18
5/1
2/1
8
5/1
9/1
8
5/2
6/1
8
6/2
/18
6/9
/18
6/1
6/1
8
6/2
3/1
8
6/3
0/1
8
7/7
/18
7/1
4/1
8
7/2
1/1
8
7/2
8/1
8
8/4
/18
8/1
1/1
8
8/1
8/1
8
8/2
5/1
8
9/1
/18
9/8
/18
9/1
5/1
8
9/2
2/1
8
9/2
9/1
8
10/
6/1
8
10/
13/
18
10/
20/
18
10/
27/
18
11/
3/1
8
11/
10/
18
11/
17/
18
11/
24/
18
12/
1/1
8
12/
8/1
8
12/
15/
18
12/
22/
18
12/
29/
18
1/5
/19
1/1
2/1
9
1/1
9/1
9
1/2
6/1
9
2/2
/19
Nu
mb
er o
f B
arg
es
Miss. Locks 27 Ark Lock 1 Ohio Olmsted Locks
For the week ending February 2: 252 barges transited the locks, 190 barges less than the previous week, and 54 percent lower than the 3-year avg.
February 7, 2019
Grain Transportation Report 14
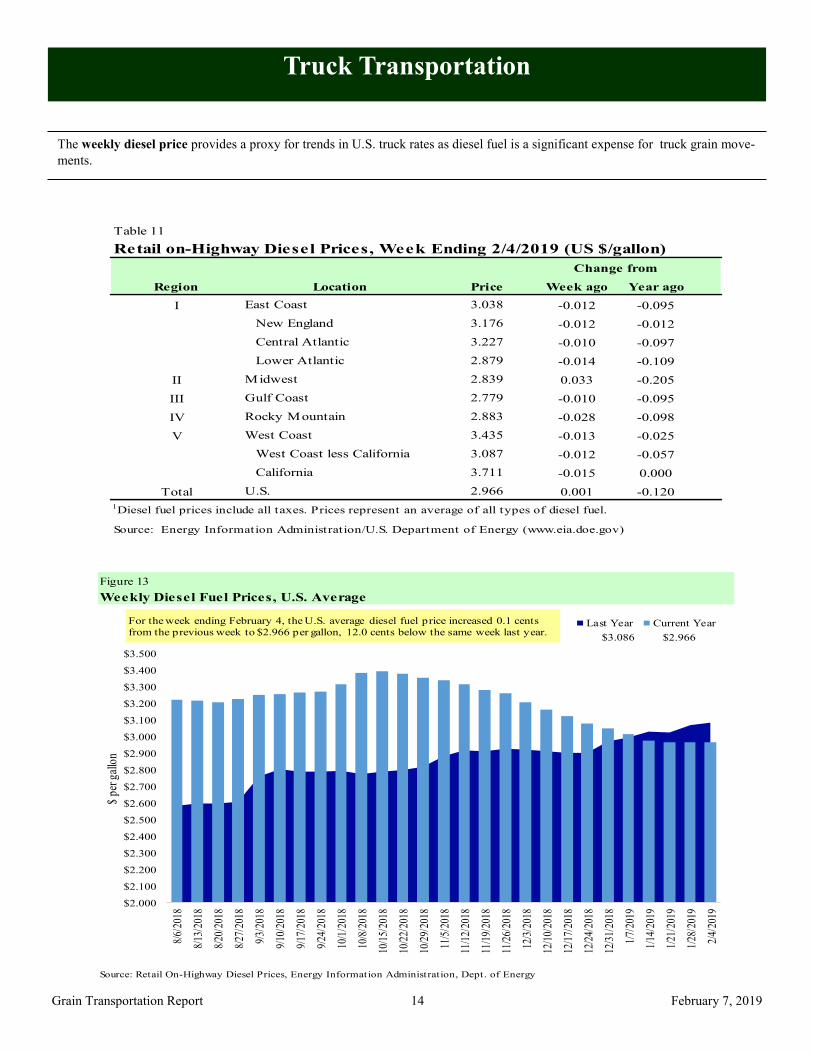
The weekly diesel price provides a proxy for trends in U.S. truck rates as diesel fuel is a significant expense for truck grain move-
ments.
Truck Transportation
Table 11
Change from
Region Location Price Week ago Year ago
I East Coast 3.038 -0.012 -0.095
New England 3.176 -0.012 -0.012
Central Atlantic 3.227 -0.010 -0.097
Lower Atlantic 2.879 -0.014 -0.109
II Midwest 2.839 0.033 -0.205
III Gulf Coast 2.779 -0.010 -0.095
IV Rocky Mountain 2.883 -0.028 -0.098
V West Coast 3.435 -0.013 -0.025
West Coast less California 3.087 -0.012 -0.057
California 3.711 -0.015 0.000
Total U.S. 2.966 0.001 -0.120
1Diesel fuel prices include all taxes. Prices represent an average of all types of diesel fuel.
Source: Energy Information Administration/U.S. Department of Energy (www.eia.doe.gov)
Retail on-Highway Diesel Prices, Week Ending 2/4/2019 (US $/gallon)
Figure 13
Weekly Diesel Fuel Prices, U.S. Average
Source: Retail On-Highway Diesel Prices, Energy Information Administration, Dept. of Energy
$2.966$3.086
$2.000
$2.100
$2.200
$2.300
$2.400
$2.500
$2.600
$2.700
$2.800
$2.900
$3.000
$3.100
$3.200
$3.300
$3.400
$3.500
8/6/
2018
8/13
/201
8
8/20
/201
8
8/27
/201
8
9/3/
2018
9/10
/201
8
9/17
/201
8
9/24
/201
8
10/1
/201
8
10/8
/201
8
10/1
5/20
18
10/2
2/20
18
10/2
9/20
18
11/5
/201
8
11/1
2/20
18
11/1
9/20
18
11/2
6/20
18
12/3
/201
8
12/1
0/20
18
12/1
7/20
18
12/2
4/20
18
12/3
1/20
18
1/7/
2019
1/14
/201
9
1/21
/201
9
1/28
/201
9
2/4/
2019
$ pe
r gal
lon
Last Year Current YearFor the week ending February 4, the U.S. average diesel fuel price increased 0.1 cents
from the previous week to $2.966 per gallon, 12.0 cents below the same week last year.
February 7, 2019
Grain Transportation Report 15
Grain Exports
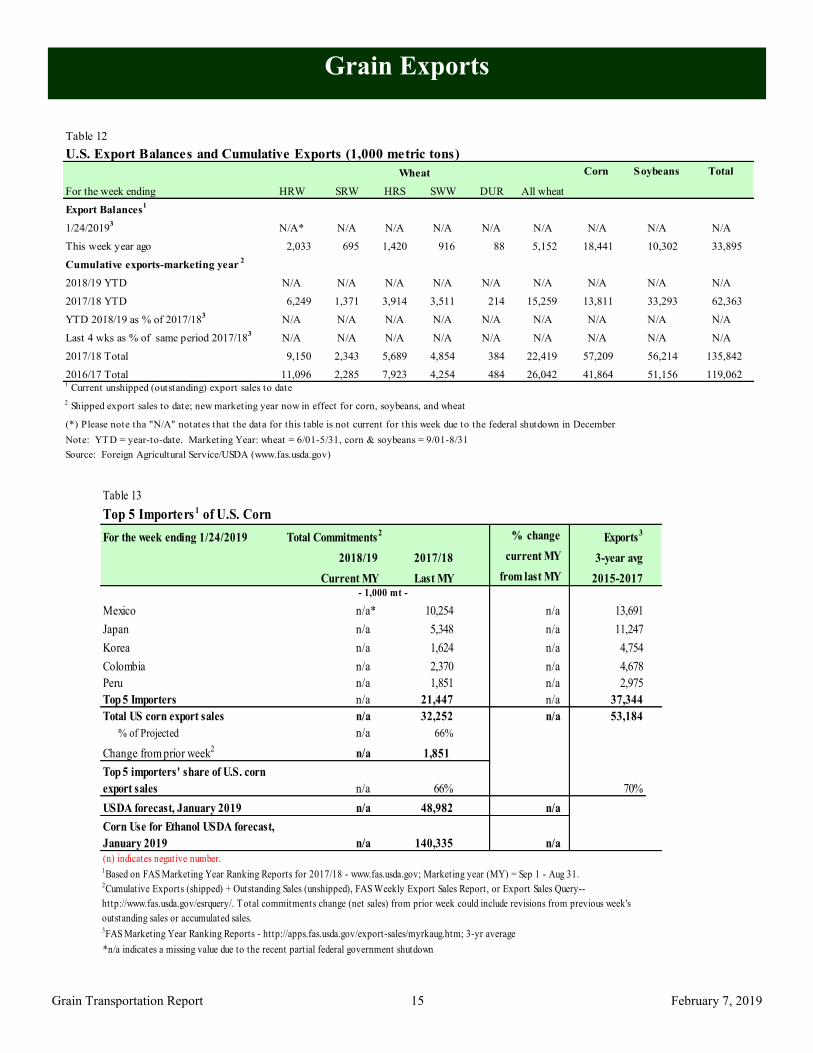
Table 12
U.S. Export Balances and Cumulative Exports (1,000 metric tons)
Wheat Corn Soybeans Total
For the week ending HRW SRW HRS SWW DUR All wheat
Export Balances1
1/24/20193
N/A* N/A N/A N/A N/A N/A N/A N/A N/A
This week year ago 2,033 695 1,420 916 88 5,152 18,441 10,302 33,895
Cumulative exports-marketing year 2
2018/19 YTD N/A N/A N/A N/A N/A N/A N/A N/A N/A
2017/18 YTD 6,249 1,371 3,914 3,511 214 15,259 13,811 33,293 62,363
YTD 2018/19 as % of 2017/183
N/A N/A N/A N/A N/A N/A N/A N/A N/A
Last 4 wks as % of same period 2017/183
N/A N/A N/A N/A N/A N/A N/A N/A N/A
2017/18 Total 9,150 2,343 5,689 4,854 384 22,419 57,209 56,214 135,842
2016/17 Total 11,096 2,285 7,923 4,254 484 26,042 41,864 51,156 119,0621 Current unshipped (outstanding) export sales to date
2 Shipped export sales to date; new marketing year now in effect for corn, soybeans, and wheat
(*) Please note tha "N/A" notates that the data for this table is not current for this week due to the federal shutdown in December
Note: YTD = year-to-date. Marketing Year: wheat = 6/01-5/31, corn & soybeans = 9/01-8/31
Source: Foreign Agricultural Service/USDA (www.fas.usda.gov)
Table 13
Top 5 Importers 1 of U.S. Corn
For the week ending 1/24/2019 % change Exports3
2018/19 2017/18 current MY 3-year avg
Current MY Last MY from last MY 2015-2017
Mexico n/a* 10,254 n/a 13,691
Japan n/a 5,348 n/a 11,247
Korea n/a 1,624 n/a 4,754
Colombia n/a 2,370 n/a 4,678
Peru n/a 1,851 n/a 2,975
Top 5 Importers n/a 21,447 n/a 37,344
Total US corn export sales n/a 32,252 n/a 53,184
% of Projected n/a 66%
Change from prior week2
n/a 1,851
Top 5 importers' share of U.S. corn
export sales n/a 66% 70%
USDA forecast, January 2019 n/a 48,982 n/a
Corn Use for Ethanol USDA forecast,
January 2019 n/a 140,335 n/a
1Based on FAS Marketing Year Ranking Reports for 2017/18 - www.fas.usda.gov; Marketing year (MY) = Sep 1 - Aug 31.
*n/a indicates a missing value due to the recent partial federal government shutdown
Total Commitments2
- 1,000 mt -
3FAS Marketing Year Ranking Reports - http://apps.fas.usda.gov/export-sales/myrkaug.htm; 3-yr average
2Cumulative Exports (shipped) + Outstanding Sales (unshipped), FAS Weekly Export Sales Report, or Export Sales Query--
http://www.fas.usda.gov/esrquery/. Total commitments change (net sales) from prior week could include revisions from previous week's
outstanding sales or accumulated sales.
(n) indicates negative number.
February 7, 2019
Grain Transportation Report 16
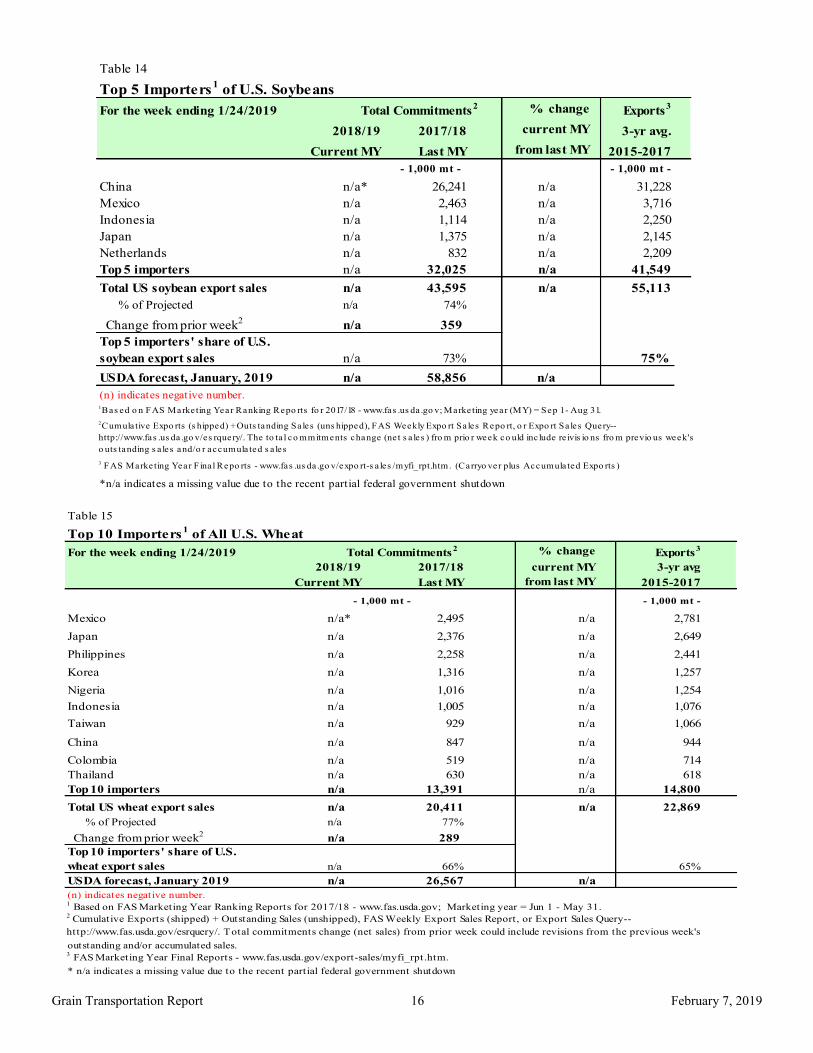
Table 14
Top 5 Importers1 of U.S. Soybeans
For the week ending 1/24/2019 % change
Exports3
2018/19 2017/18 current MY 3-yr avg.
Current MY Last MY from last MY 2015-2017
- 1,000 mt - - 1,000 mt -
China n/a* 26,241 n/a 31,228
Mexico n/a 2,463 n/a 3,716
Indonesia n/a 1,114 n/a 2,250
Japan n/a 1,375 n/a 2,145
Netherlands n/a 832 n/a 2,209
Top 5 importers n/a 32,025 n/a 41,549
Total US soybean export sales n/a 43,595 n/a 55,113
% of Projected n/a 74%
Change from prior week2
n/a 359
Top 5 importers' share of U.S.
soybean export sales n/a 73% 75%
USDA forecast, January, 2019 n/a 58,856 n/a
1Bas ed o n FAS Marketing Year Ranking Repo rts fo r 2017/18 - www.fas .us da .go v; Marketing year (MY) = Sep 1 - Aug 31.
*n/a indicates a missing value due to the recent partial federal government shutdown
3 FAS Marketing Year Fina l Repo rts - www.fas .us da .go v/expo rt-s a les /myfi_rpt.htm. (Carryo ver plus Accumula ted Expo rts )
(n) indicates negative number.
2Cumula tive Expo rts (s hipped) + Outs tanding Sales (uns hipped), FAS Weekly Expo rt Sa les Repo rt, o r Expo rt Sa les Query--
http://www.fas .us da .go v/es rquery/. The to ta l co mmitments change (ne t s a les ) fro m prio r week co uld inc lude re ivis io ns fro m previo us week's
o uts tanding s a les and/o r accumula ted s a les
Total Commitments2
Table 15
Top 10 Importers1 of All U.S. Wheat
For the week ending 1/24/2019 % change Exports3
2018/19 2017/18 current MY 3-yr avg
Current MY Last MY from last MY 2015-2017
- 1,000 mt -
Mexico n/a* 2,495 n/a 2,781
Japan n/a 2,376 n/a 2,649
Philippines n/a 2,258 n/a 2,441
Korea n/a 1,316 n/a 1,257
Nigeria n/a 1,016 n/a 1,254
Indonesia n/a 1,005 n/a 1,076
Taiwan n/a 929 n/a 1,066
China n/a 847 n/a 944
Colombia n/a 519 n/a 714
Thailand n/a 630 n/a 618
Top 10 importers n/a 13,391 n/a 14,800
Total US wheat export sales n/a 20,411 n/a 22,869
% of Projected n/a 77%
Change from prior week2
n/a 289
Top 10 importers' share of U.S.
wheat export sales n/a 66% 65%
USDA forecast, January 2019 n/a 26,567 n/a
1 Based on FAS Marketing Year Ranking Reports for 2017/18 - www.fas.usda.gov; Marketing year = Jun 1 - May 31.
outstanding and/or accumulated sales.
Total Commitments2
3 FAS Marketing Year Final Reports - www.fas.usda.gov/export-sales/myfi_rpt.htm.
(n) indicates negative number.
2 Cumulative Exports (shipped) + Outstanding Sales (unshipped), FAS Weekly Export Sales Report, or Export Sales Query--
http://www.fas.usda.gov/esrquery/. Total commitments change (net sales) from prior week could include revisions from the previous week's
- 1,000 mt -
* n/a indicates a missing value due to the recent partial federal government shutdown
February 7, 2019
Grain Transportation Report 17
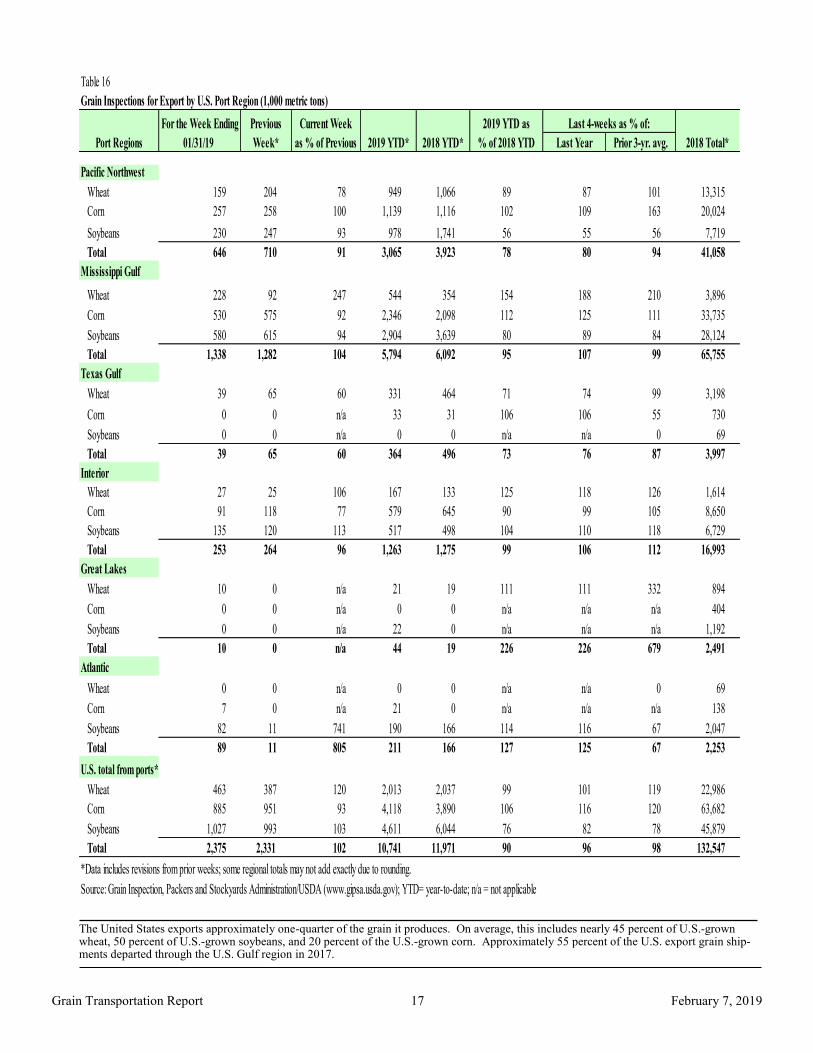
The United States exports approximately one-quarter of the grain it produces. On average, this includes nearly 45 percent of U.S.-grown wheat, 50 percent of U.S.-grown soybeans, and 20 percent of the U.S.-grown corn. Approximately 55 percent of the U.S. export grain ship-ments departed through the U.S. Gulf region in 2017.
Table 16
Grain Inspections for Export by U.S. Port Region (1,000 metric tons)
For the Week Ending Previous Current Week 2019 YTD as
01/31/19 Week* as % of Previous 2018 YTD* % of 2018 YTD Last Year Prior 3-yr. avg.
Pacific Northwest
Wheat 159 204 78 949 1,066 89 87 101 13,315
Corn 257 258 100 1,139 1,116 102 109 163 20,024
Soybeans 230 247 93 978 1,741 56 55 56 7,719
Total 646 710 91 3,065 3,923 78 80 94 41,058
Mississippi Gulf
Wheat 228 92 247 544 354 154 188 210 3,896
Corn 530 575 92 2,346 2,098 112 125 111 33,735
Soybeans 580 615 94 2,904 3,639 80 89 84 28,124
Total 1,338 1,282 104 5,794 6,092 95 107 99 65,755
Texas Gulf
Wheat 39 65 60 331 464 71 74 99 3,198
Corn 0 0 n/a 33 31 106 106 55 730
Soybeans 0 0 n/a 0 0 n/a n/a 0 69
Total 39 65 60 364 496 73 76 87 3,997
Interior
Wheat 27 25 106 167 133 125 118 126 1,614
Corn 91 118 77 579 645 90 99 105 8,650
Soybeans 135 120 113 517 498 104 110 118 6,729
Total 253 264 96 1,263 1,275 99 106 112 16,993
Great Lakes
Wheat 10 0 n/a 21 19 111 111 332 894
Corn 0 0 n/a 0 0 n/a n/a n/a 404
Soybeans 0 0 n/a 22 0 n/a n/a n/a 1,192
Total 10 0 n/a 44 19 226 226 679 2,491
Atlantic
Wheat 0 0 n/a 0 0 n/a n/a 0 69
Corn 7 0 n/a 21 0 n/a n/a n/a 138
Soybeans 82 11 741 190 166 114 116 67 2,047
Total 89 11 805 211 166 127 125 67 2,253
U.S. total from ports*
Wheat 463 387 120 2,013 2,037 99 101 119 22,986
Corn 885 951 93 4,118 3,890 106 116 120 63,682
Soybeans 1,027 993 103 4,611 6,044 76 82 78 45,879
Total 2,375 2,331 102 10,741 11,971 90 96 98 132,547
*Data includes revisions from prior weeks; some regional totals may not add exactly due to rounding.
Source: Grain Inspection, Packers and Stockyards Administration/USDA (www.gipsa.usda.gov); YTD= year-to-date; n/a = not applicable
Last 4-weeks as % of:
Port Regions 2018 Total*2019 YTD*
February 7, 2019
Grain Transportation Report 18
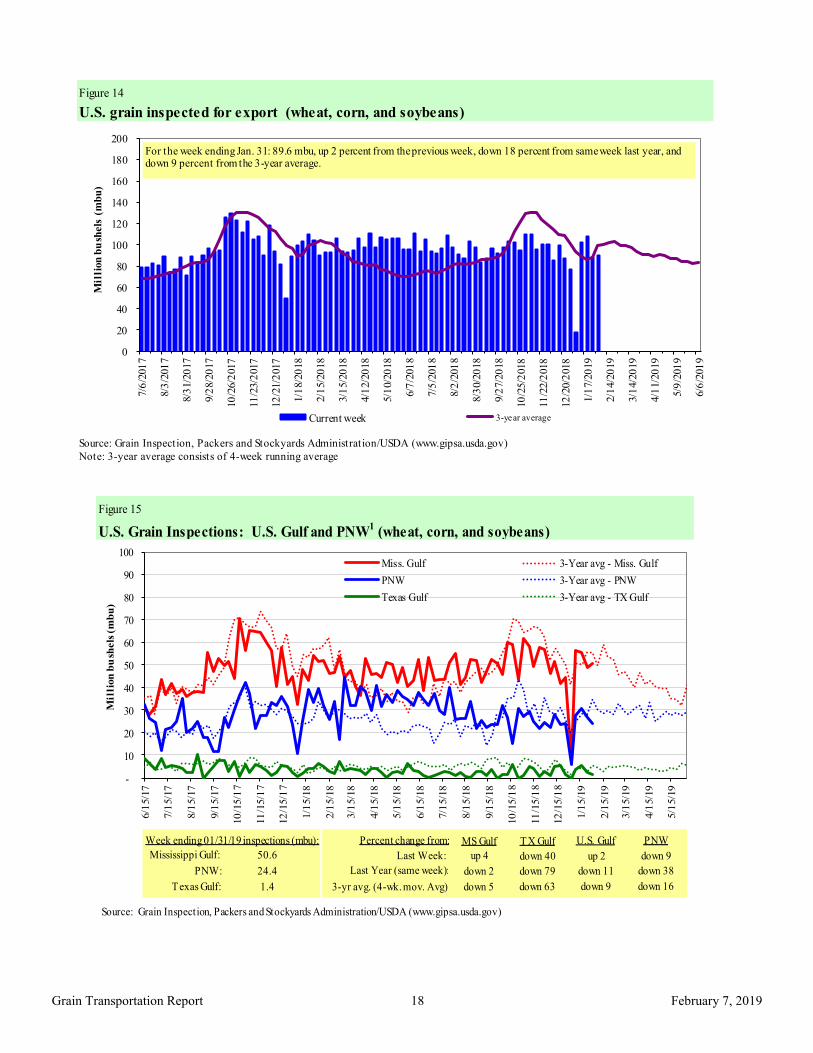
Figure 14
U.S. grain inspected for export (wheat, corn, and soybeans)
Source: Grain Inspection, Packers and Stockyards Administration/USDA (www.gipsa.usda.gov)
Note: 3-year average consists of 4-week running average
0
20
40
60
80
100
120
140
160
180
2007/6
/201
7
8/3
/201
7
8/3
1/2
017
9/2
8/2
017
10
/26/2
017
11
/23/2
017
12
/21/2
017
1/1
8/2
018
2/1
5/2
018
3/1
5/2
018
4/1
2/2
018
5/1
0/2
018
6/7
/201
8
7/5
/201
8
8/2
/201
8
8/3
0/2
018
9/2
7/2
018
10
/25/2
018
11
/22/2
018
12
/20/2
018
1/1
7/2
019
2/1
4/2
019
3/1
4/2
019
4/1
1/2
019
5/9
/201
9
6/6
/201
9
Mil
lion
bu
shels
(m
bu
)
Current week 3-year average
For the week ending Jan. 31: 89.6 mbu, up 2 percent from the previous week, down 18 percent from same week last year, and down 9 percent from the 3-year average.
Figure 15
U.S. Grain Inspections: U.S. Gulf and PNW1 (wheat, corn, and soybeans)
-
10
20
30
40
50
60
70
80
90
100
6/1
5/1
7
7/1
5/1
7
8/1
5/1
7
9/1
5/1
7
10
/15/1
7
11
/15/1
7
12
/15/1
7
1/1
5/1
8
2/1
5/1
8
3/1
5/1
8
4/1
5/1
8
5/1
5/1
8
6/1
5/1
8
7/1
5/1
8
8/1
5/1
8
9/1
5/1
8
10
/15/1
8
11
/15/1
8
12
/15/1
8
1/1
5/1
9
2/1
5/1
9
3/1
5/1
9
4/1
5/1
9
5/1
5/1
9
Mil
lion
bu
shels
(m
bu
)
Miss. Gulf 3-Year avg - Miss. Gulf
PNW 3-Year avg - PNW
Texas Gulf 3-Year avg - TX Gulf
Source: Grain Inspection, Packers and Stockyards Administration/USDA (www.gipsa.usda.gov)
Last Week:
Last Year (same week):
3-yr avg. (4-wk. mov. Avg):
MS Gulf TX Gulf U.S. Gulf PNW
up 4
down 2
down 5
down 40
down 79
down 63
up 2
down 11
down 9
down 9
down 38
down 16
Percent change from:Week ending 01/31/19 inspections (mbu):
Mississippi Gulf:
PNW:
Texas Gulf:
50.6
24.4
1.4
February 7, 2019
Grain Transportation Report 19
Ocean Transportation
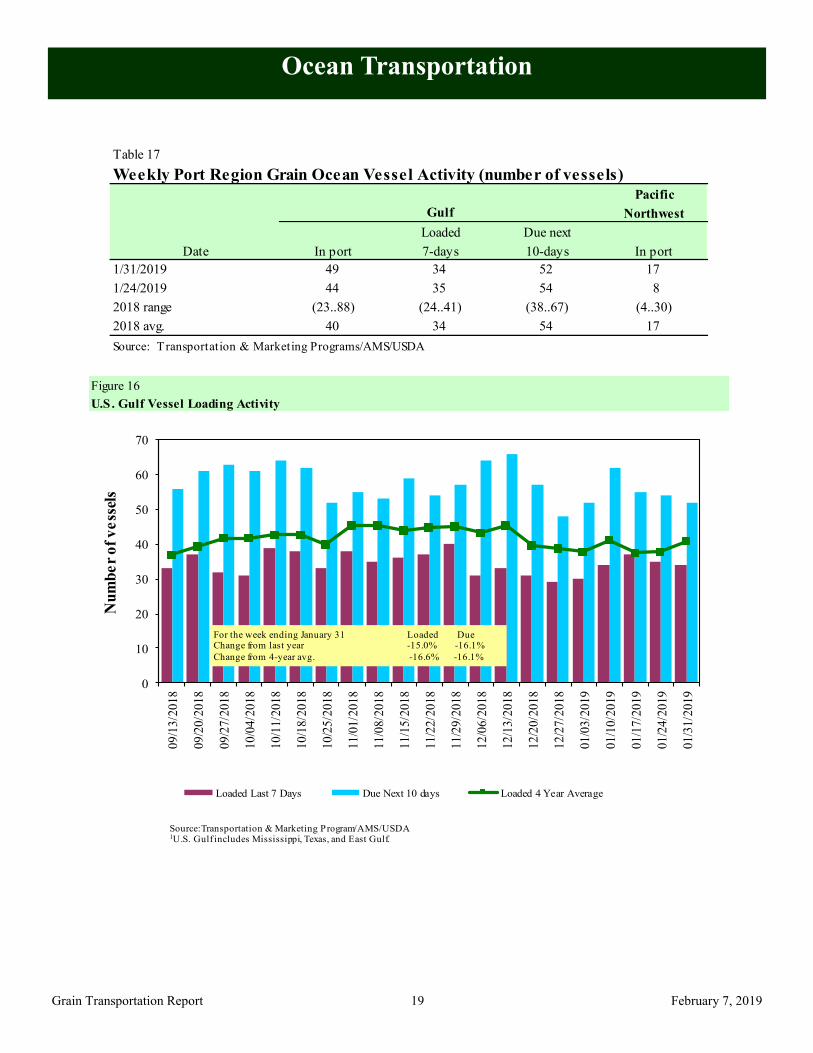
Table 17
Weekly Port Region Grain Ocean Vessel Activity (number of vessels)
Pacific
Gulf Northwest
Loaded Due next
Date In port 7-days 10-days In port
1/31/2019 49 34 52 17
1/24/2019 44 35 54 8
2018 range (23..88) (24..41) (38..67) (4..30)
2018 avg. 40 34 54 17
Source: Transportation & Marketing Programs/AMS/USDA
Figure 16
U.S. Gulf Vessel Loading Activity
0
10
20
30
40
50
60
70
09/1
3/2
018
09/2
0/2
018
09/2
7/2
018
10/0
4/2
018
10/1
1/2
018
10/1
8/2
018
10/2
5/2
018
11
/01
/20
18
11
/08
/20
18
11
/15
/20
18
11
/22
/20
18
11
/29
/20
18
12
/06
/20
18
12/1
3/2
018
12/2
0/2
018
12/2
7/2
018
01/0
3/2
019
01/1
0/2
019
01/1
7/2
019
01/2
4/2
019
01/3
1/2
019
Nu
mb
er
of
ve
ssel
s
Loaded Last 7 Days Due Next 10 days Loaded 4 Year Average
Source:Transportation & Marketing Program/AMS/USDA1U.S. Gulf includes Mississippi, Texas, and East Gulf.
For the week ending January 31 Loaded Due Change from last year -15.0% -16.1%
Change from 4-year avg. -16.6% -16.1%
February 7, 2019
Grain Transportation Report 20
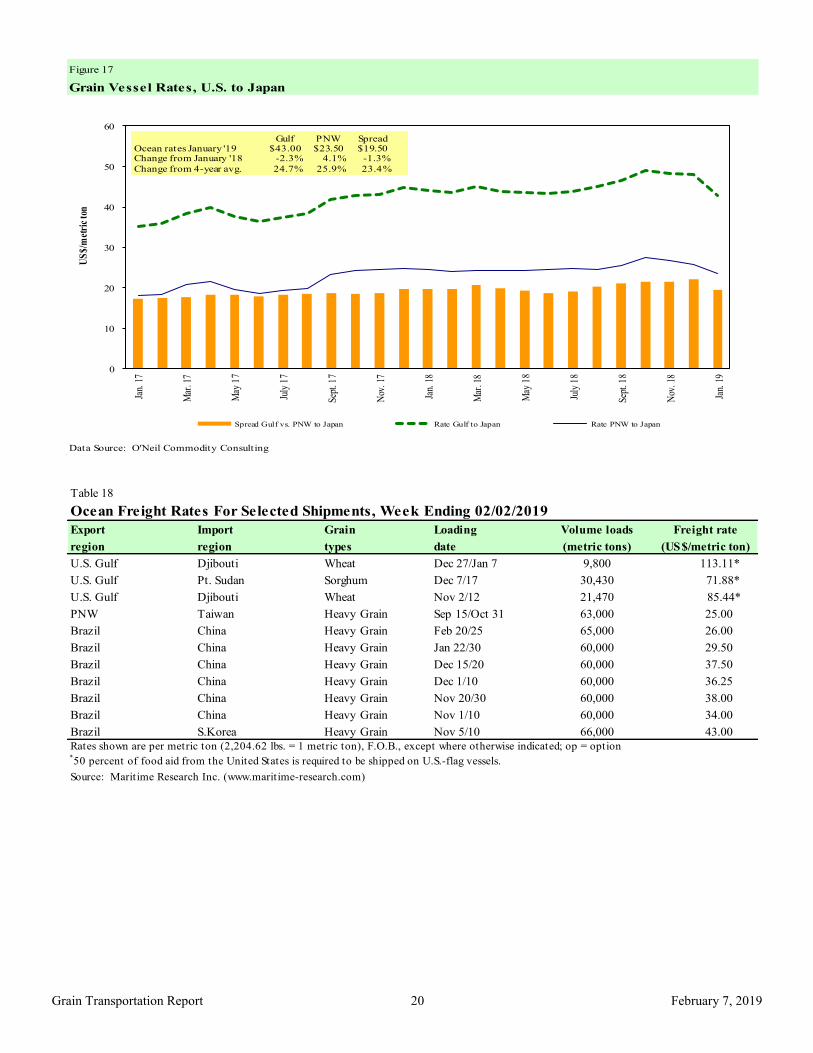
Figure 17
Grain Vessel Rates, U.S. to Japan
Data Source: O'Neil Commodity Consulting
0
10
20
30
40
50
60
Jan.
17
Mar
. 17
May
17
July
17
Sept
. 17
Nov
. 17
Jan.
18
Mar
. 18
May
18
July
18
Sept
. 18
Nov
. 18
Jan.
19
US
$/m
etri
c to
n
Spread Gulf vs. PNW to Japan Rate Gulf to Japan Rate PNW to Japan
Gulf PNW Spread Ocean rates January '19 $43.00 $23.50 $19.50 Change from January '18 -2.3% 4.1% -1.3%
Change from 4-year avg. 24.7% 25.9% 23.4%
Table 18
Ocean Freight Rates For Selected Shipments, Week Ending 02/02/2019
Export Import Grain Loading Volume loads Freight rate
region region types date (metric tons) (US$/metric ton)
U.S. Gulf Djibouti Wheat Dec 27/Jan 7 9,800 113.11*
U.S. Gulf Pt. Sudan Sorghum Dec 7/17 30,430 71.88*
U.S. Gulf Djibouti Wheat Nov 2/12 21,470 85.44*
PNW Taiwan Heavy Grain Sep 15/Oct 31 63,000 25.00
Brazil China Heavy Grain Feb 20/25 65,000 26.00
Brazil China Heavy Grain Jan 22/30 60,000 29.50
Brazil China Heavy Grain Dec 15/20 60,000 37.50
Brazil China Heavy Grain Dec 1/10 60,000 36.25
Brazil China Heavy Grain Nov 20/30 60,000 38.00
Brazil China Heavy Grain Nov 1/10 60,000 34.00
Brazil S.Korea Heavy Grain Nov 5/10 66,000 43.00
Rates shown are per metric ton (2,204.62 lbs. = 1 metric ton), F.O.B., except where otherwise indicated; op = option *50 percent of food aid from the United States is required to be shipped on U.S.-flag vessels.
Source: Maritime Research Inc. (www.maritime-research.com)
February 7, 2019
Grain Transportation Report 21
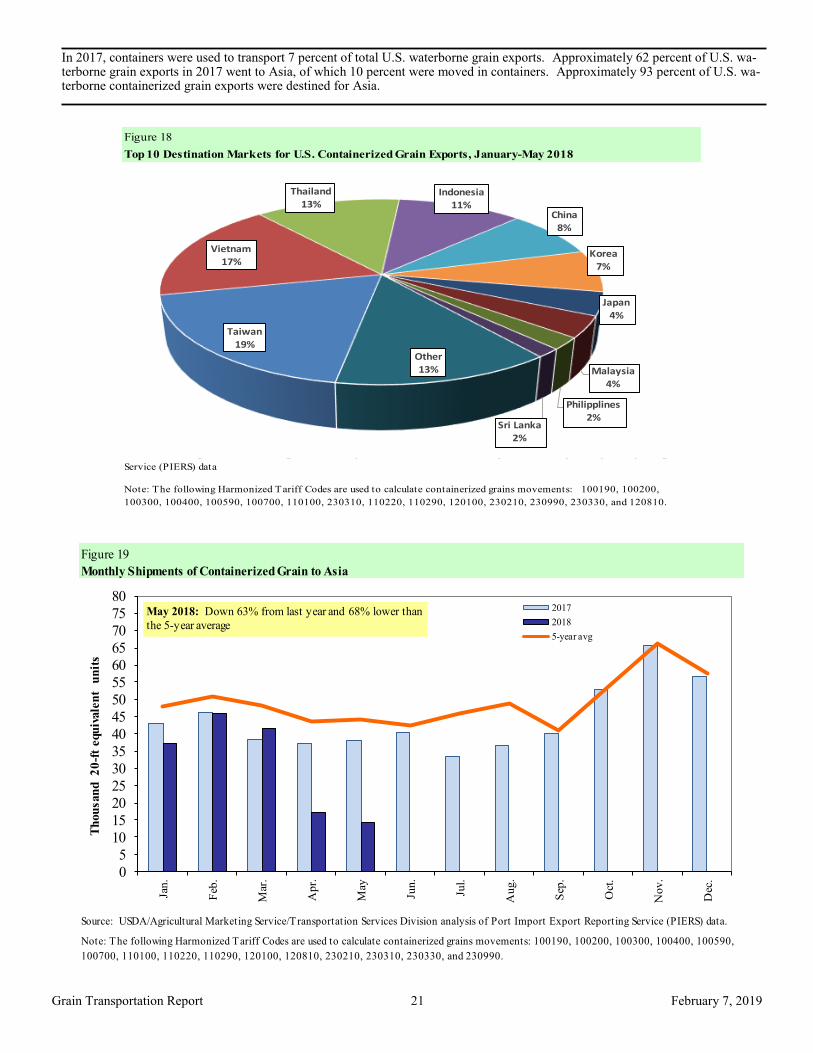
In 2017, containers were used to transport 7 percent of total U.S. waterborne grain exports. Approximately 62 percent of U.S. wa-terborne grain exports in 2017 went to Asia, of which 10 percent were moved in containers. Approximately 93 percent of U.S. wa-terborne containerized grain exports were destined for Asia.
Figure 18
Top 10 Destination Markets for U.S. Containerized Grain Exports, January-May 2018
Source: USDA/Agricultural Marketing Service/Transportation Services Division analysis of Port Import Export Reporting
Service (PIERS) data
Note: The following Harmonized Tariff Codes are used to calculate containerized grains movements: 100190, 100200,
100300, 100400, 100590, 100700, 110100, 230310, 110220, 110290, 120100, 230210, 230990, 230330, and 120810.
Taiwan19%
Vietnam
17%
Thailand13%
Indonesia11%
China8%
Korea7%
Japan4%
Malaysia4%
Philipplines2%
Sri Lanka2%
Other13%
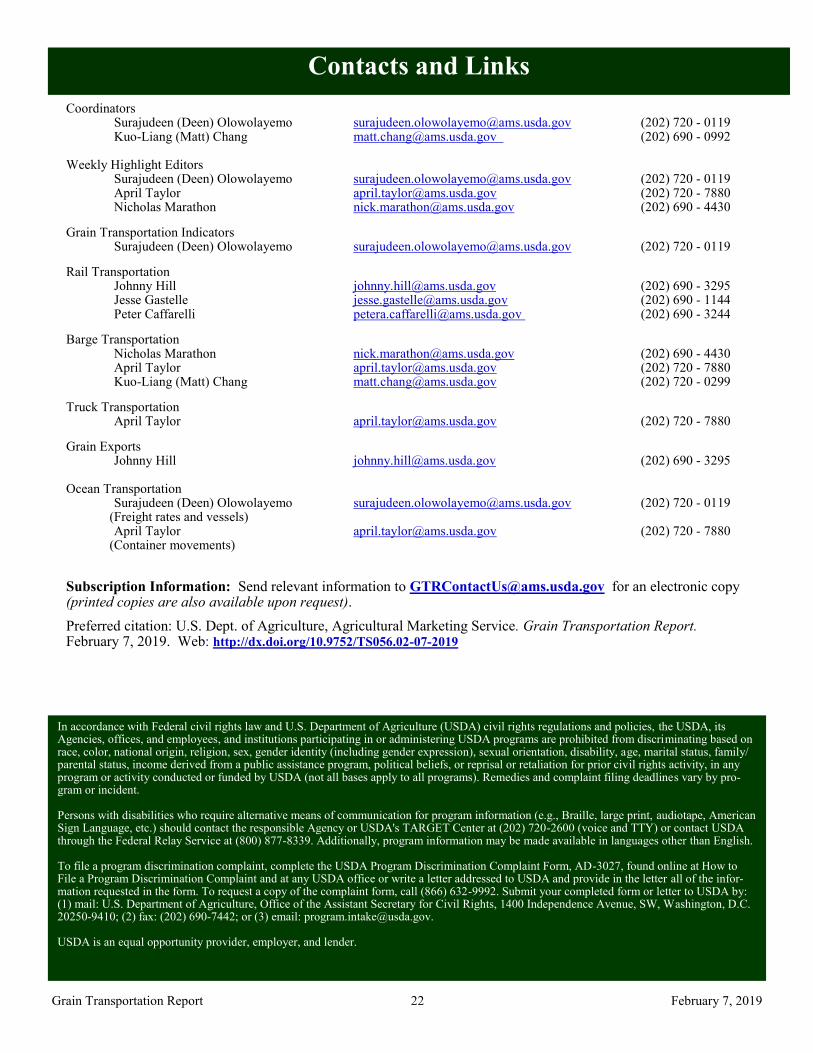
Figure 19
Monthly Shipments of Containerized Grain to Asia
Source: USDA/Agricultural Marketing Service/Transportation Services Division analysis of Port Import Export Reporting Service (PIERS) data.
Note: The following Harmonized Tariff Codes are used to calculate containerized grains movements: 100190, 100200, 100300, 100400, 100590,
100700, 110100, 110220, 110290, 120100, 120810, 230210, 230310, 230330, and 230990.
0
5
10
15
20
25
30
35
40
45
50
55
60
65
70
75
80
Jan.
Feb
.
Mar
.
Ap
r.
May
Jun
.
Jul.
Aug.
Sep
.
Oct
.
No
v.
Dec
.
Th
ou
san
d
20
-ft
equ
ivale
nt
un
its
2017
2018
5-year avg
May 2018: Down 63% from last year and 68% lower than
the 5-year average
February 7, 2019
Grain Transportation Report 22
Coordinators Surajudeen (Deen) Olowolayemo [email protected] (202) 720 - 0119 Kuo-Liang (Matt) Chang [email protected] (202) 690 - 0992 Weekly Highlight Editors Surajudeen (Deen) Olowolayemo [email protected] (202) 720 - 0119 April Taylor [email protected] (202) 720 - 7880 Nicholas Marathon [email protected] (202) 690 - 4430
Grain Transportation Indicators Surajudeen (Deen) Olowolayemo [email protected] (202) 720 - 0119
Rail Transportation Johnny Hill [email protected] (202) 690 - 3295 Jesse Gastelle [email protected] (202) 690 - 1144 Peter Caffarelli [email protected] (202) 690 - 3244
Barge Transportation Nicholas Marathon [email protected] (202) 690 - 4430 April Taylor [email protected] (202) 720 - 7880 Kuo-Liang (Matt) Chang [email protected] (202) 720 - 0299
Truck Transportation April Taylor [email protected] (202) 720 - 7880
Grain Exports Johnny Hill [email protected] (202) 690 - 3295 Ocean Transportation Surajudeen (Deen) Olowolayemo [email protected] (202) 720 - 0119 (Freight rates and vessels) April Taylor [email protected] (202) 720 - 7880 (Container movements)
Subscription Information: Send relevant information to [email protected] for an electronic copy (printed copies are also available upon request).
Preferred citation: U.S. Dept. of Agriculture, Agricultural Marketing Service. Grain Transportation Report. February 7, 2019. Web: http://dx.doi.org/10.9752/TS056.02-07-2019
Contacts and Links
In accordance with Federal civil rights law and U.S. Department of Agriculture (USDA) civil rights regulations and policies, the USDA, its Agencies, offices, and employees, and institutions participating in or administering USDA programs are prohibited from discriminating based on race, color, national origin, religion, sex, gender identity (including gender expression), sexual orientation, disability, age, marital status, family/parental status, income derived from a public assistance program, political beliefs, or reprisal or retaliation for prior civil rights activity, in any program or activity conducted or funded by USDA (not all bases apply to all programs). Remedies and complaint filing deadlines vary by pro-gram or incident. Persons with disabilities who require alternative means of communication for program information (e.g., Braille, large print, audiotape, American Sign Language, etc.) should contact the responsible Agency or USDA's TARGET Center at (202) 720-2600 (voice and TTY) or contact USDA through the Federal Relay Service at (800) 877-8339. Additionally, program information may be made available in languages other than English. To file a program discrimination complaint, complete the USDA Program Discrimination Complaint Form, AD-3027, found online at How to File a Program Discrimination Complaint and at any USDA office or write a letter addressed to USDA and provide in the letter all of the infor-mation requested in the form. To request a copy of the complaint form, call (866) 632-9992. Submit your completed form or letter to USDA by: (1) mail: U.S. Department of Agriculture, Office of the Assistant Secretary for Civil Rights, 1400 Independence Avenue, SW, Washington, D.C. 20250-9410; (2) fax: (202) 690-7442; or (3) email: [email protected]. USDA is an equal opportunity provider, employer, and lender.