grain boundary segregation and grain growth inhibition in silicon iron: the effect of boron and...
TRANSCRIPT
Grain Boundary Segregation and Grain Growth Inhibition in Silicon Iron" The Effect of Boron and N itrogen
R. GRANT ROWE
The d e g r e e of g ra in growth inhibi t ion in i ron-3 .1 pct s i l i con a l loys with s m a l l addi t ions of boron , n i t rogen and sul fur has been o b s e r v e d to c o r r e l a t e s t r o n g l y with the d e g r e e of n i t rogen s e g r e g a t i o n to the g ra in b o u n d a r i e s . Gra in growth was s een to i n c r e a s e mono- ton ica l ly with d e c r e a s i n g n i t rogen s e g r e g a t i o n at 950~ the t e m p e r a t u r e at which s ign i f ican t g ra in growth was f i r s t o b s e r v e d to occur . Boron a f fec ted the r e t en t ion of n i t rogen in the ma- t e r i a l at high t e m p e r a t u r e s and in th is way had an i nd i r ec t effect on g ra in growth inhibi t ion. Sulfur ac ted to enhance the e f f ec t i venes s of n i t rogen as a g ra in growth inh ib i to r . It is sug- ges t ed that n i t rogen , even at v e r y low gra in boundary concen t ra t ions a f fec t s g ra in boundary m i g r a t i o n by poisoning s i t e s at the g ra in bounda r i e s which a r e p a r t i c u l a r l y ef f ic ient in a t - t ach ing a toms to the growing g r a i n s u r f a c e .
IRON-3 pct s i l i con t r a n s f o r m e r s t e e l is p r o c e s s e d to develop a v e r y s t r o n g (110)[001] shee t t ex tu re which o p t i m i z e s the magne t i c p e r m e a b i l i t y of the m a t e r i a l along" the ro l l i ng d i r ec t i on of the shee t . Th i s t ex tu re is p roduced by s e c o n d a r y r e c r y s t a l l i z a t i o n whose d r i v ing fo rce is the s u r f a c e t ens ion imba lance be tween a l a rge g ra in and s m a l l e r s u r r o u n d i n g m a t r i x g r a i n s . 1-~ F o r s e c o n d a r y r e c r y s t a l l i z a t i o n to occur , some g r a i n s mus t grow to a s ize much l a r g e r than the p r i m a r y r e - c r y s t a l l i z e d g ra in m a t r i x while n o r m a l g ra in growth of the m a t r i x g r a i n is s u p p r e s s e d . In an ef for t to u l t i - m a t e l y develop an unde r s t and ing of the p r o c e s s of s e c o n d a r y r e c r y s t a l l i z a t i o n in s i l i con s t ee l , one a s p e c t of th is p r o b l e m , name ly the inhibi t ion of n o r m a l g ra in growth in b o r o n - s i l i c o n s t ee l , 6-8 wi l l be a d d r e s s e d .
In convent ional i r on -3 pct s i l i con a l l oys , n o r m a l g ra in growth is inhibi ted by a d i s t r i bu t i on of second phase p r e c i p i t a t e p a r t i c l e s , p r i n c i p a l l y MnS. z,9 Higher p e r m e a b i l i t y s i l i con i ron p roduc t s have been deve loped r ecen t l y , however , which r e ly upon a much h e a v i e r cold reduc t ion than convent ional s i l i con i ron and r e - qu i r e much g r e a t e r inhibi t ion of n o r m a l g r a i n growth 7,8,1~ than a d i s t r i b u t i o n of MnS p a r t i c l e s can p rov ide . One a p p r o a c h to p rov id ing this i n c r e a s e d g ra in growth in- hibi t ion has been to supp lement the ac t ion of the MnS p r e c i p i t a t e p a r t i c l e s with add i t iona l and more t h e r m a l l y s t ab le p r e c i p i t a t e s such as A1N. 16 Grenob le and F i e d - lerT, 8 have deve loped an a l t e r n a t i v e so lu t ion which de- pends upon the addi t ion of s m a l l quant i t i es of boron, su l fur , and n i t rogen to the s t e e l . T h e i r r e s u l t s sugges t that g ra in growth inhibi t ion in t he i r s t e e l is r e l a t e d to the p r e s e n c e of so lu te su l fur and n i t rogen in e x c e s s of that combined as second phase p a r t i c l e s . Grenoble has shown that the addi t ion of e x c e s s Mn to fo rm add i - t iona l MnS p a r t i c l e s , for example , is equiva lent to the r e m o v a l of su l fur f rom the s t e e l and was shown to r e - duce the g ra in growth inhibi t ion of the a l loy . 11 L ike - wise , he found that g r a i n growth was un re l a t ed to the quant i ty of BN ca l cu la t ed to ex i s t in the m a t r i x but
R. GRANT ROWE is Manager, Properties Branch, General Electri Corporate Research and Development, Schenectady, NY 12301.
This paper is based on a presentation made at a symposium on "Recovery, Recrystallization and Grain Growth in Materials" held at the Chicago meeting of The Metallurgical Society of AIME, October 1977, under the sponsorship of the Physical Metallurgy Committee.
METALLURGICAL TRANSACTIONS A
r a t h e r was r e l a t e d to the amount of f r ee n i t rogen in so lu t ion . The addi t ion of s m a l l amounts of boron to the a l loy were found to be e s s e n t i a l for the deve lop - ment of the h ighes t p e r m e a b i l i t y s t e e l , however . Fiedler12,13 d e m o n s t r a t e d that m a x i m u m g r a i n growth inhibi t ion is a t t a ined with the addi t ion of a l l t h r e e of the e l e m e n t s boron, n i t rogen , and su l fur to o the rwise high pu r i t y s i l i c on i r on a l l o y s . In his e x p e r i m e n t s , s e c o n d a r y r e c r y s t a l l i z a t i o n o c c u r r e d only in the a l loys with op t imum addi t ions of t he se e l e m e n t s . E l i m i n a t i o n of any one of these e l e m e n t s was shown to lead to c o a r s e n i n g of the p r i m a r y g ra in s t r u c t u r e and the sup- p r e s s i o n of s e c o n d a r y r e c r y s t a l l i z a t i o n .
The r e s u l t s of Grenob le and F i e d i e r both sugges t that inhibi t ion of n o r m a l g ra in growth by a so lu te r e l a t e d m e c h a n i s m mus t be c o n s i d e r e d . Solute inhibi t ion of g r a i n growth has been d e m o n s t r a t e d in many s y s t e m s where second phase p a r t i c l e s do not deve lop , and it is thought that s e g r e g a t i o n of a so lu te a t m o s p h e r e e i t h e r to or away f rom g ra in b o u n d a r i e s is the b a s i s for th is inhibi t ion of bounda ry migration.14-17 A number of mode l s have been p r o p o s e d to account for th is p r o c e s s and mos t show that the m a x i m u m inhibi t ing ac t ion of a so lu te a t m o s p h e r e app l i e s to m i g r a t i o n under a r e l a - t i ve ly low g ra in growth d r i v ing force.17-2~ B r e a k a w a y f rom the so lu te a t m o s p h e r e o c c u r s at a point where the d r i v ing fo rce for g ra in boundary m i g r a t i o n exceeds the f o r c e with which the so lu te a t m o s p h e r e is bound to the g ra in boundary . At th is point , the so lu te a t m o s p h e r e is p r e d i c t e d to be much l e s s e f fec t ive in r e t a r d i n g g ra in bounda ry m i g r a t i o n and a s h a r p i n c r e a s e in g r a i n boundary ve loc i ty is p r e d i c t e d . 19,2~ The e x p e r i m e n t a l o b s e r v a t i o n of mul t ip le s t a g e s of g ra in growth in di lute a l loys has been a t t r i bu t e d to th is ef fec t . 14,16
The s t rong effect of s m a l l a l loy add i t ions o b s e r v e d by Grenob le and F i e d l e r sugges t that in addi t ion to s i m p l e s o l u t e - g r a i n boundary e f fec t s , the combina t ion of i n t e r ac t i ng s e g r e g a n t s may have an even more d r a - ma t i c impac t on g r a i n boundary mig ra t i on . F u r t h e r - m o r e , s ince s e c o n d a r y r e c r y s t a l l i z a t i o n o c c u r s only fo r o r i e n t a t i ons v e r y c lose to (110)[001] in s i l i con i ron , t h e r e may ex i s t s p e c i a l g ra in bounda r i e s which have unique s e g r e g a t i o n c h a r a c t e r i s t i c s which lead to the f o r m a t i o n of the c r i t i c a l s e c o n d a r y nuclei.19, 21-26
To a d d r e s s these ques t ions , high s p a t i a l r e s o l u t i o n
ISSN 0360-2133/79/0813-0997500.75/0 �9 1979 AMERICAN SOCIETY FOR METALS AND VOLUME 10A, AUGUST 1979 997
THE METALLURGICAL SOCIETY OF AIME
scanning Auge r m i c r o s c o p y has been used to examine gra in boundary seg rega t ion dur ing gra in growth of i ron-3 pct s i l i con a l loys inhibited with s m a l l addi t ions of boron, n i t rogen and su l fur . In p e r f o r m i n g the analy- ses , p a r t i c u l a r emphas i s was p laced on the examina - t ion of g ra in to g ra in d i f f e r ences in s eg rega t ion . Grain to gra in ana lys i s of s eg rega t ion was c r i t i c a l f r o m two ma jo r s tandpoints . The f i r s t was the ques t ion of whether the deve lopment of s econda ry r e c r y s t a l l i z a - tion nuclei is r e l a t ed to the ex i s t ence of nonuniform s e g r e g a t i o n . ~rhe second is the ques t ion of the ex i s t - ence and ef fec t of the b reakaway of a mig ra t i ng gra in boundary f r o m a solute a t m o s p h e r e on g ra in growth. The obse rva t ion of solute b reakaway would be d i r ec t l y obse rvab le by m e a s u r e m e n t of s eg rega t i on at gra in boundar ies with high and low dr iv ing f o r c e s for migra t ion .
EXPERIMENTAL METHOD
Two series of alloys containing iron-3.1 pct silicon with various dopants of boron, nitrogen, and sulfur were examined in this study. Both series contained additions of boron, nitrogen and sulfur to an otherwise pure iron- 3.1 pct silicon alloy which were representative of a spectrum of alloys exhibiting very strong to weak grain growth inhibition.
The first series, alloys 1 through 9, were made available by H. Fiedler after his study of their grain growth behavior. 27 The alloys were vacuum melted, hot ro l l ed f r o m 1250~ given a 950~ heat t r e a t m e n t f o r 3 rain and cold ro l l ed to a sheet th ickness of 0.3
Table I. Compositions of Cold Rolled Strip
Alloy B N, S, M~a, C, Si, Number wppm wppm w p p m w p p m Wt/Pct Wt/Pct
1 < 1 5 2 0 40 0.04 3.1 2 <1 9 110 30 0.04 3.1 3 <8 5 100 20 0.04 3.1 4 9 98 80 40 0.04 3.1 5 1 51 30 20 0.04 3.1 6 <1 53, 100 30 0.04 3.1 7 5 4 30 20 0.04 3.1 8 70 70 20 30 0.04 3.1 9 6 150 90 20 0.04 3.1
Table II. Results of Ladle Analysis
Alloy ldentifi- B, N, S, Mn, C, Si, cation wppm wppm w p p m wppm Wt Pct Wt Pct
A 30 41 110 20 0.034 3.25 B 30 53 90 20 0.035 3.25 C 32 78 100 2(1 0.033 3.25 D 34 138 90 20 0.028 3.25
mm. The amount of cold reduc t ion was 87 pct . The a l loys were chemica l ly ana lyzed a f te r cold ro l l ing and the r e su l t s , as communica ted by F i e d l e r , a r e tabulated in Table I. D e c a r b u r i z a t i o n and p r i m a r y r e c r y s t a l l i z a - tion was then p e r f o r m e d in hydrogen with a dewpoint of 21~ at 800~ for 4 min. Fol lowing the d e c a r b u r i z a - tion anneal , the a l loys were abraded with an a lumina a b r a s i v e to r e m o v e any su r face oxide, cleaned, and given a second iden t ica l deca rbu r i za t i on anneal . The a l loys given this double anneal wil l be r e f e r r e d to as doubly deca rbu r i zed , while the usual t r e a t m e n t is a s ingle d e c a r b u r i z a t i o n anneal .
The a l loys were p laced in quar tz capsu les , baked at 300~ under vacuum, backf i l led with 180 t o r r high pur i ty a rgon and sea led off. Al l s am p le s for heat t r e a t - ment to the s a m e t e m p e r a t u r e were p laced in the same capsule with loose molybdenum wire wrapped around each s t r ip to s epa ra t e the s p e c i m e n s and provide a means of p r e f e r e n t i a l l y ge t t e r i ng any r e a c t i v e gases r e m a i n i n g in the capsu les . Af t e r a heat t r e a t m e n t of one hour at t e m p e r a t u r e , the s p e c i m e n s were rap id ly quenched, b reak ing the capsules under wa te r . Grain s i ze s were m e a s u r e d by the in te rcep t method on me ta l - lographic sec t ions n o r m a l to the ro i l ing d i r ec t ion of the shee t .
The second al loy s e r i e s , des igna ted A through D, was made ava i lab le by H. E. Grenoble . The a l loys , with h igher boron content, a l so contained su l fur and va ry ing amounts of n i t rogen with compos i t ions r e p r e - sent ing both the case of e x c e s s (not combined as BN) boron and the case of e x c e s s n i t rogen . The p r o c e s s i n g of these a l loys was ident ica l to that of the f i r s t a l loy s e r i e s . The chemica l composi t ions as d e t e r m i n e d by ladle chemica l ana lyses a r e tabulated in Table II. A f t e r double deca rbu r i za t i on , a l loys A through D were an- nealed in f lowing he l ium f r o m 800 to 925~ at a heat ing
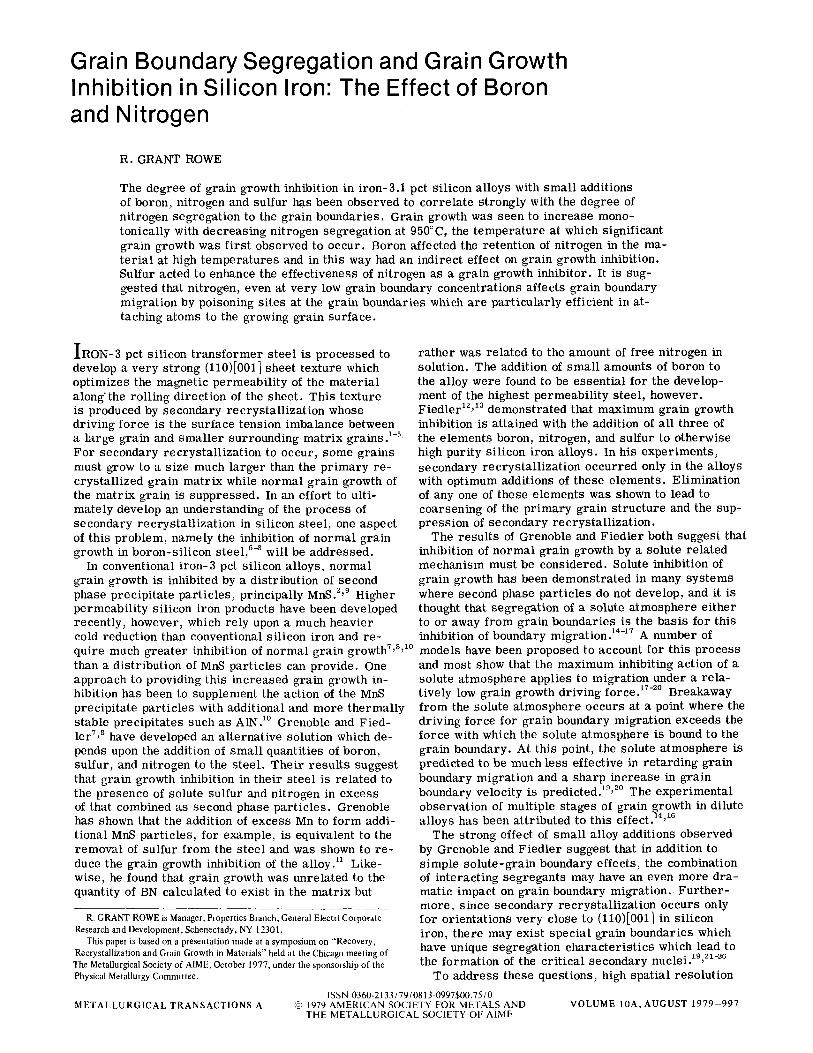
(a) (b) (c) Fig. 1-Comparison of the resolution of secondary electron micrographs obtained in the scanning Auger microscope system with a high resolution image from a conventional scanning electron microscope. (a) High resolution SEM image, (b) 590 Auger system: best image, (c) 590 Auger sys- tem: analyzing beam.
998-VOLUME 10A, AUGUST 1979 METALLURGICAL TRANSACTIONS A
r a t e of 30~ Once a t t a in ing a t e m p e r a t u r e of 925~ the s a m p l e s we re quenched by fus ing a suppor t w i r e which d ropped the s p e c i m e n s d i r e c t l y f rom the hot zone of the furnace into a wa te r bath .
To f ac i l i t a t e r a p i d quenching, the heat t r e a t m e n t was p e r f o r m e d in an i n v e r t e d tube which r e l i e d upon the d i s p l a c e m e n t of a i r by f lowing he l i um e n t e r i n g f r o m the top of the fu rnace . A v e r y s l igh t oxide on the s p e c i m e n s a f t e r heat t r e a t m e n t ind ica ted that the a t m o s p h e r e for t he se s p e c i m e n s may have been v e r y s l i gh t ly ox id iz ing . Oxygen a n a l y s e s of the gas in the hot zone of the fu r - nace was not p e r f o r m e d but a n a l y s e s of the dewpoint of f lowing hydrogen gas in the s a m e s y s t e m ind ica ted a w a t e r v a p o r dewpoint of 233 K which sugges t ed that the oxygen v a p o r p r e s s u r e in the fu rnace du r ing he l ium annea l ing was on the o r d e r of 10 P a .
A f t e r hea t t r e a t m e n t , s p e c i m e n s we re p l aced in the scann ing A u g e r m i c r o p r o b e , evacua ted , baked at 100~ fo r 8 h and f r a c t u r e d in s i t u fo r a n a l y s i s . The amb ien t vacuum in the s y s t e m was t y p i c a l l y l e s s than 1.3 x 10 -8 P a and con tamina t ion of the f r e s h l y f r a c t u r e d s u r f a c e a s mon i to r ed by A u g e r a n a l y s i s of c leavage f r a c t u r e f a c e t s was m i n i m a l . The only s ign i f i can t contaminant bui ldup dur ing the s e v e r a l hour a n a l y s i s of a f r a c t u r e s u r f a c e was oxygen. The s p a t i a l r e s o l u t i o n of the scann ing A u g e r m i c r o p r o b e used in th is s tudy was a p p r o x i m a t e l y 2000A for imag ing and t yp i ca l l y 1 to 2 ~t du r ing A u g e r a n a l y s e s with a 5 kV inc ident b e a m vo l tage .28
F i g u r e 1 shows s e c o n d a r y e l e c t r o n m i c r o g r a p h s taken in the scann ing A u g e r m i c r o s c o p e under condi- t ions of both imag ing and ana lyz ing e l e c t r o n b e a m s . T h e s e m i c r o g r a p h s a r e c o m p a r e d to an image of the s a m e r eg ion with a h igher r e s o l u t i o n convent ional SEM. The ab i l i t y to r e s o l v e ind iv idua l g ra in b o u n d a r i e s may c l e a r l y be s een . The to ta l s e c o n d a r y e l e c t r o n cu r - ren t a s wel l a s the to ta l A u g e r e l e c t r o n e m i s s i o n cu r - r en t f rom each g r a i n boundary face t was d i f fe ren t due to the r e l a t i v e o r i en t a t i on of the g r a i n boundary s u r f a c e with r e s p e c t to the inc ident e l e c t r o n b e a m . To com- pensa t e for th is and o the r r e l a t e d e f fec t s affect ing s e m i -
quant i t a t ive A u g e r a n a l y s i s , 29-s3 the A u g e r s p e c t r a taken f rom ind iv idua l g r a i n bounda ry f ace t s were n o r - m a l i z e d by tak ing the r a t i o of the peak to peak height of the f i r s t d e r i v a t i v e A u g e r peak of each e l e m e n t to the peak to peak height of the i r on 651 vol t Auger t r a n - s i t ion.*
*The ratio of the peak to peak magnitude of a differentiated Auger peak to the peak to peak height of that of the iron 651 volt Auger transition will be re- ferred to as the Auger ratio of a particular element.
EXPERIMENTAL RESULTS
When cooled to liquid nitrogen temperature, silicon iron alloys fracture in a completely brittle manner. Specimens given a conventional single decarburization anneal fractured by transgranular cleavage predomi- nantly along (001) with few i n t e r g r a n u l a r f r a c t u r e r e - g ions . A f t e r the second d e c a r b u r i z a t i o n t r e a t m e n t in which the ca rbon was t y p i c a l l y r e d u c e d to be tween 20 to 25 wppm, the a l loys f r a c t u r e d by p r e d o m i n a n t l y i n t e r g r a n u l a r f r a c t u r e . F r a c t u r e s u r f a c e a n a l y s i s with high magn i f i ca t ion SEM and TEM could de tec t no ev i - dence of m i c r o d u c t i l i t y at the g ra in b o u n d a r i e s of t he se i n t e r g r a n u l a r f r a c t u r e s u r f a c e s .
The effect of ca rbon in s u p p r e s s i n g i n t e r g r a n u l a r f r a c t u r e has been p r e v i o u s l y r e p o r t e d fo r high pur i ty i ron alloys.34-36 P i c h a r d e t al examined high pu r i t y i ron doped with su l fu r f ami ly e l e m e n t s and showed that ca rbon r e d u c e s the s t r o n g e m b r i t t l i n g ef fect on these e l e m e n t s . F u r t h e r m o r e , they showed that ca rbon had l i t t le effect on the d e g r e e of g ra in boundary s e g r e g a - t ion of s e l e n i u m and t e l l u r i u m .
Chemica l a n a l y s i s of the doubly d e c a r b u r i z e d s a m - p le s for carbon, su l fur and n i t rogen ind ica t ed a r e d u c - t ion in both su l fu r and n i t rogen a long with d e c a r b u r i - za t ion . The loss of n i t rogen f rom the s a m p l e s a f t e r the double d e c a r b u r i z a t i o n t r e a t m e n t is s ign i f i can t . T a b l e s IIIa, b, and c l i s t the c h e m i c a l a n a l y s i s r e s u l t s f r o m carbon, n i t rogen , and su l fur r e s p e c t i v e l y for both the doubly d e c a r b u r i z e d s p e c i m e n s and for s a m p l e s
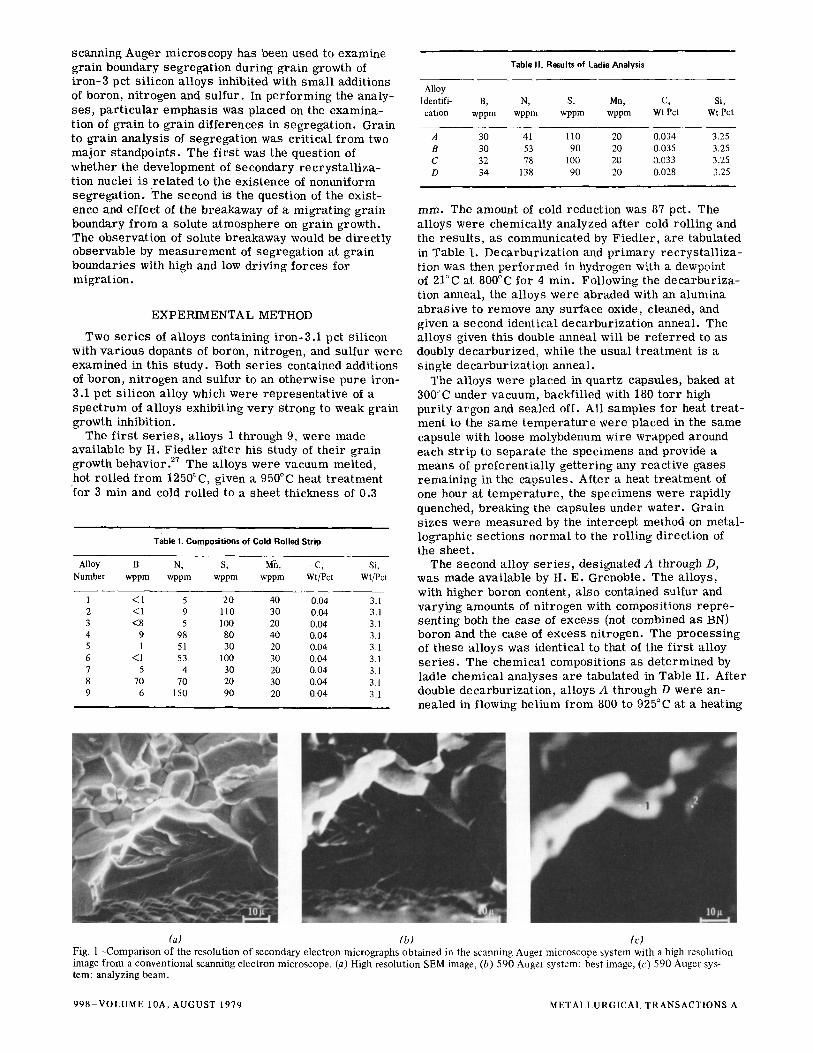
Fig. 2-The grain to grain variation of sulfur and nitrogen Auger ratios within a region of uniform primary matrix grains. Left, S/Fe Auger ratio; right N/Fe Auger ratio.
METALLURGICAL TRANSACTIONS A VOLUME 10A, AUGUST 1979-999
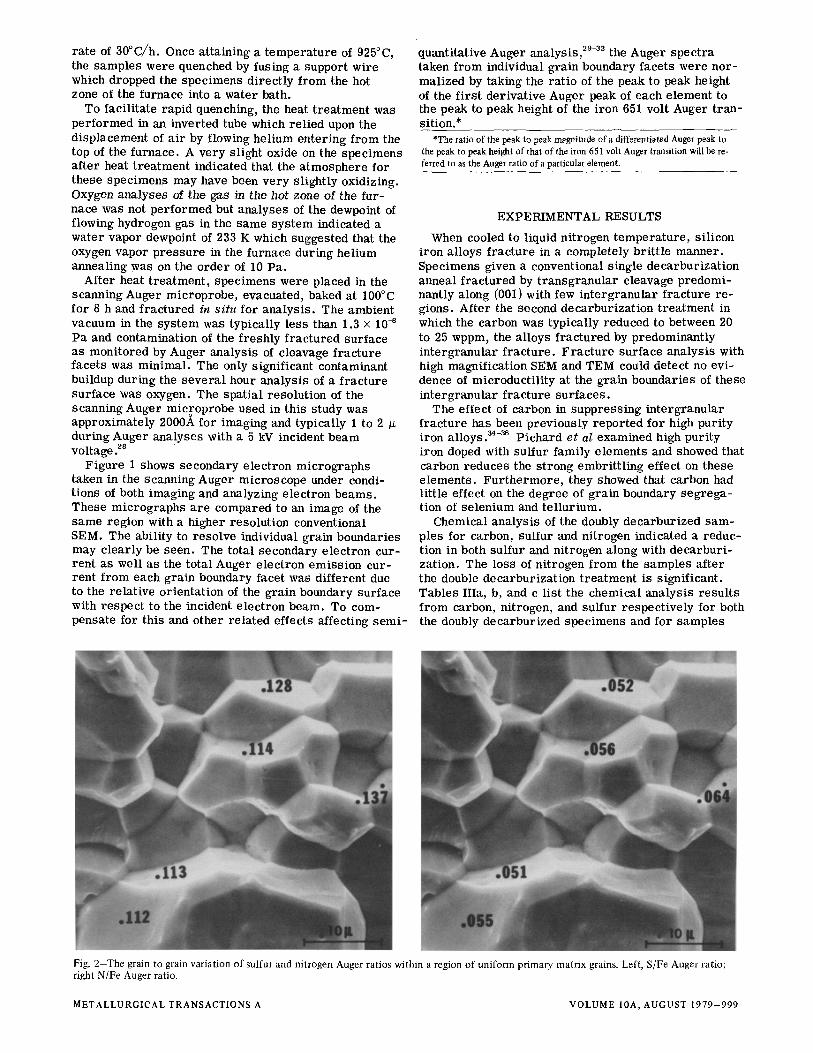
Table III a. Bulk Carbon Analysis*, wppm
Alloy Single Double Number CW Decarb Dec~rb
1 420 43 2 430 53 22 3 430 128 4 430 49 24 5 400 60 6 400 46 24 7 440 66 8 420 65 9 400 44 22
*Surface abraded before analy~s.
Table III b. Bulk Ni~ogen Analysis*, wppm
Alloy Double 800~ 950~ 1025~ Number CW Dec~b (1 tl) (1 h) (1 h)
1 7 15 10 2 8 6 10 12 3 6 13 8 4 98 61 36 38 34 5 54 12 14 12 6 56 18 19 18 13 7 7 15 8 67 30 31 29 9 149 91 73 67
*Surface abraded before analysis
Table III c. Bulk Sulfur Analysis*, wppm
Alloy Double 800~ 950~ 1025~ Number CW Decarb (1 h) (1 h) (1 h)
1 20 16 t8 2 110 92 99 85 3 100 90 94 75 4 80 66 79 68 5 30 26 24 1l 6 100 102 99 104 7 30 17 22 18 8 20 3 22 18 9 90 87
25 85 81 62 13 98
23 65
*Surface abraded before analyses.
given g ra in growth annea ls f rom 800 to 1025~ As can be seen, the loss of sul fur is not s igni f icant at any t e m p e r a t u r e . Ni t rogen is lost at a l l annea l ing t e m - p e r a t u r e s for a l l a l loys . The r e s idua l n i t rogen re - ta ined in the a l loys is ve ry nea r ly the same throughout the range of t e m p e r a t u r e s f rom 800 to 1025~
Gra in to Gra in Di f fe rences in Segregat ion
Examina t ion of the r e l a t ionsh ip between i n t e r g r a n u l a r segrega t ion and g ra in growth depends, in par t , upon the d i s t r ibu t ion of segrega t ion f rom one g ra in boundary to another . This was examined for the a l loys in this study in the course of Auger ana lyses of the gra in boundary su r f aces s ince a l l of the Auger spec t r a were taken f rom reg ions within individual g ra in boundary facets . The va r i a t ion f rom g ra in to gra in within a ma t r ix of un i form sized p r i m a r y r e c r y s t a l l i z a t i o n g ra ins was not large at 875~ The es t ima ted s tandard deviat ion of the peak to
peak Auger ra t io for m e a s u r e m e n t of a n u m b e r of ma t r ix gra in boundary facets was typical ly on the o r d e r of 10 to 20 pct. F u r t h e r m o r e , it appeared that ana iys i s of different g ra in boundary su r faces f rom the same gra in gave much less sca t t e r than the ana lys i s of g ra in boundary facets f rom dif ferent g ra ins . Ana lys i s of dif- fe ren t points on a curved gra in boundary sur face gave the same Auger ra t io va lues in spite of the fact that the angular re la t ionsh ip between the inc ident beam and the gra in boundary sur face va r i ed . This suggested two things. F i r s t , that the use of the peak height ra t io method was effective at least to f i r s t o rder , in com- pensa t ing for the angular va r i a t ion of the gra in bound- a ry facets . The second was that, with few except ions segrega t ion was constant a c r o s s a given gra in bound- a ry facet . F igu re 2 shows a mic rog raph of an in t e r - g r anu l a r f r ac tu re region of re la t ive ly un i fo rm gra in s ize for an al loy heat t r ea ted to 875~ This pai r of mic rographs por t ray a r ep re sen t a t i ve por t ion of the f r ac tu re sur face of al loy 6 heat t r ea ted at 875~ On the mic rographs a re supe r imposed Auger peak to peak ra t ios for sul fur and n i t rogen . In this region, the v a r i a - t ion f rom gra in to gra in is typical of what has been found for most spec imens at 875~ Most a l loys exhib- ited l i t t le va r i a t i on in average gra in s ize or s ize d is - t r ibu t ion f rom the in i t ia l un i form p r i m a r y r e c r y s t a l - l izat ion s t r u c t u r e .
The p rocess of secondary r e c r y s t a l l i z a t i o n is not suf- f ic ient ly well unders tood to explain why ce r ta in c ry s t a l - lographic or ien ta t ions develop into nuc le i for uns table gra in growth. In i ron-3 pet s i l icon a l loys given second- a ry r e c r y s t a l l i z a t i o n annea l s , the secondary g ra ins which consume the ma t r ix a re ve ry close to (110)[001] in or ien ta t ion . Af ter the f inal anneal , it can be es t i - mated that on the o rder of one g ra in in 106 has been success fu l . Because of this , it may be s u r m i s e d that the (110)[001] g ra ins have a unique cha rac te r that pe r - mi t s g ra in growth to occur in spite of s t rong inhibi t ion of g ra in boundary migra t ion . This may occur by these gra ins having a higher d r iv ing force for boundary mi- gra t ion which might r e su l t f rom a spec ia l o r ien ta t ion re la t ionsh ip with the su r round ing g ra ins . A number of hypotheses on the development of (110)[001] texture in s i l i con iron a re based on the idea of a favorable d r iv ing force due to a spec ia l env i ronmen t for some (110)[001] g ra ins . 22-e6 The other poss ib i l i ty is that there is a lower degree of inhibi t ion of g ra in boundary migra t ion for these g ra ins due to a spec ia l cha rac t e r of g ra in boundar ies a ssoc ia ted with the u l t imate secondary nu- clei . Di f fe rences in gra in boundary segrega t ion at these g ra ins could account for this kind of behavior . Since it is not poss ib le to individual ly examine every g ra in boundary on many f r ac tu r e su r f aces in o rder to find the one which may be unique, spec ia l a t tent ion was given to ana lys i s of those gra in boundary facets which were assoc ia ted with g ra ins which had a la rge n u m b e r of s ides . The r e su l t was that there was no observa t ion of unique segrega t ion behav ior a ssoc ia ted with the boundar i e s of these " s e c o n d a r y n u c l e u s " g ra ins . This observa t ion was typical of a l l such boundar ies examined in this study. Since the g ra in boundary face ts of second- a r y g ra ins a l l in te r face with p r i m a r y ma t r ix g ra ins , this may not be s u r p r i s i n g . On the other hand, the ab- sence of d i f fe rences in segrega t ion among the sample of secondary nucleus type gra ins observed in this study does not prec lude the i r ex is tence due to the ve ry large
1000-VOLUME 10A, AUGUST 1979 METALLURGICAL TRANSACTIONS A
number of gram boundary facets which would have to be examined individually to es tab l i sh this .
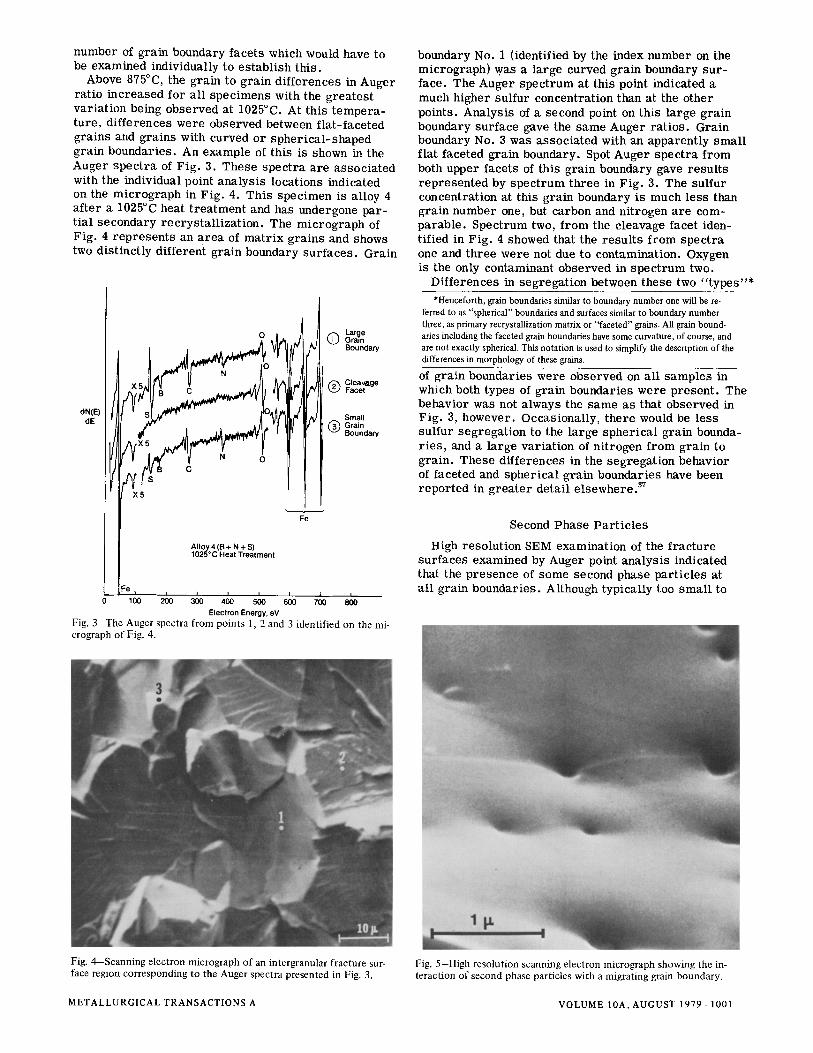
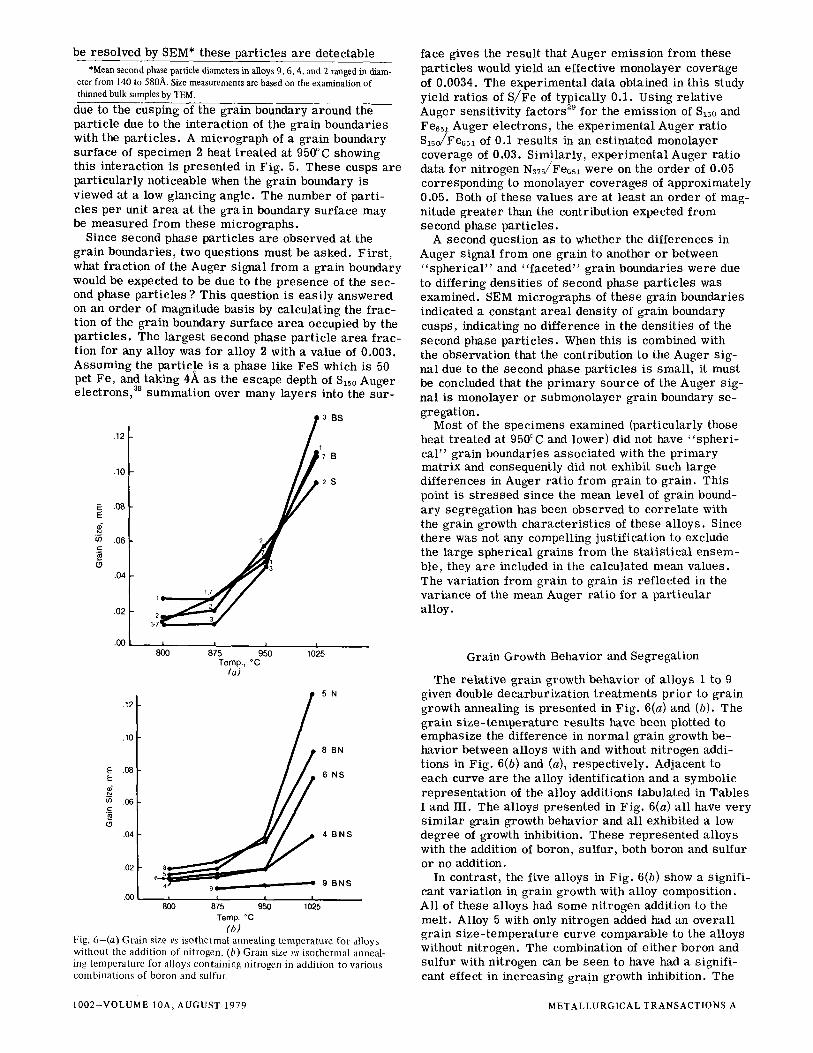
Above 875~ the grain to grain di f ferences in Auger ra t io increased for a l l specimens with the g rea tes t var ia t ion being observed at 1025~ At this t empera - ture, differences were observed between f la t - faceted grains and grains with curved or spher ica l - shaped gram boundaries . An example of this is shown m the Auger spec t r a of Fig . 3. These spec t ra a re assoc ia ted with the individual point analys is locations indicated on the micrograph in Fig . 4. This specimen is alloy 4 af ter a 1025~ heat t rea tment and has undergone par - t ia l secondary r ec rys t a l l i za t ion . The micrograph of Fig. 4 r ep resen t s an a r ea of mat r ix grains and shows two dis t inct ly different grain boundary sur faces . Grain
dN(E) dE
I Alloy 4 (B + N + S) 1025"C Heat Treatment
Fe loo 2~o 3;0 ' ' 400 500
Electron Energy, eV
ii 600 i I 700 8OO
Large Gram Boundary
(•) Clea~tge Facet
Small Grain Boundary
Fig. 3 The Auger spectra from points 1, 2 and 3 identified on the mi- crograph of Fig. 4.
boundary No. 1 (identified by the index number on the micrograph) was a large curved gram boundary su r - face. The Auger spect rum at this point indicated a much higher sulfur concentration than at the other points. Analys is of a second point on this large grain boundary surface gave the same Auger ra t ios . Grain boundary No. 3 was assoc ia ted with an apparent ly smal l flat faceted grain boundary. Spot Auger spec t ra f rom both upper facets of this grain boundary gave resu l t s r ep resen ted by spec t rum three m Fig. 3. The sulfur concentration at this g ram boundary is much less than grain number one, but carbon and nitrogen are com- parab le . Spectrum two, from the cleavage facet iden- tified in Fig . 4 showed that the resu l t s from spec t ra one and three were not due to contamination. Oxygen is the only contaminant observed in spec t rum two.
Differences m segregat ion between these two " t y p e s " *
*Henceforth, grain boundaries similar to boundary number one will be re- ferred to as "spherical" boundaries and surfaces similar to boundary number three, as primary recrystallization matrix or "faceted" grains. All grain bound- aries including the faceted grain boundaries have some curvature, of course, and are not exactly spherical. This notation is used to simplify the description of the differences in morphology of these grains.
of grain boundaries were observed on a l l samples m which both types of grain boundaries were presen t . The behavior was not always the same as that observed m Fig. 3, however. Occasional ly, there would be less sulfur segregat ion to the large spher ica l gram bounda- r i e s , and a large var ia t ion of ni trogen from gram to grain. These dif ferences in the segregat ion behavior of faceted and spher ica l gram boundaries have been repor ted in g rea te r detai l e l sewhere . 3v
Second Phase P a r t i c l e s
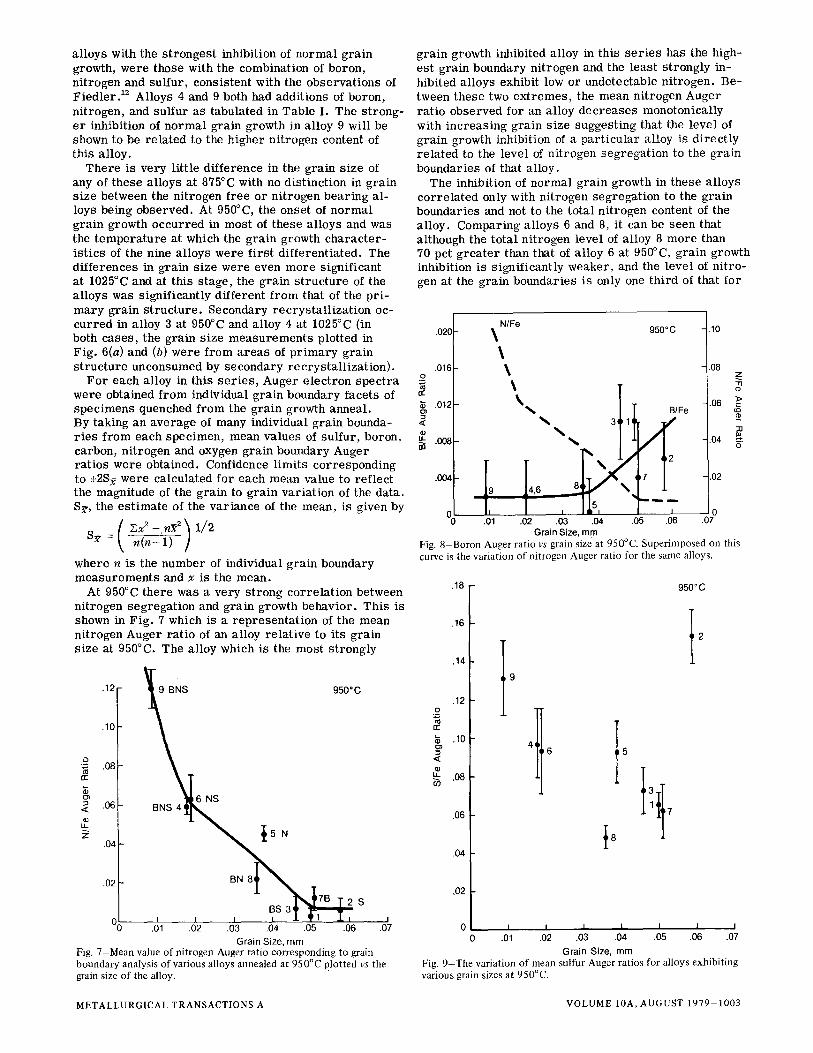
High resolut ion SEM examination of the f rac ture sur faces examined by Auger point analys is indicated that the presence of some second phase pa r t i c l es at a t l g ram boundar ies . Although typica l ly too sma l l to
Fig. 4-Scanning electron micrograph of an intergranular fracture sur- face region corresponding to the Auger spectra presented in Fig. 3.
Fig. 5-High resolution scanning electron micrograph showing the in- teraction of second phase particles with a migrating grain boundary.
METALLURGICAL TRANSACTIONS A VOLUME 10A, AUGUST 1979-1001
be resolved by SEM* these particles are detectable *Mean second phase particle diameters in alloys 9, 6, 4, and 2 ranged in diam-
eter from 140 to 580A. Size measurements are based on the examination of thinned bulk samples by TEM.
due to the cusping of the grain boundary around the particle due to the interaction of the grain boundaries with the particles. A micrograph of a grain boundary surface of specimen 2 heat treated at 950~ showing this interaction is presented in Fig. 5. These cusps are particularly noticeable when the grain boundary is viewed at a low glancing angle. The number of parti- cles per unit area at the gra in boundary surface may be measured from these micrographs.
Since second phase particles are observed at the grain boundaries, two questions must be asked. First , what fraction of the Auger signal from a grain boundary would be expected to be due to the presence of the sec- ond phase particles ? This question is easily answered on an order of magnitude basis by calculating the frac- tion of the grain boundary surface area occupied by the part icles. The largest second phase particle area f rac- tion for any alloy was for alloy 2 with a value of 0.003. Assuming the partic!e is a phase like FeS which is 50 pet Fe, and taking 4A as the escape depth of 815o Auger electrons, as summation over many layers into the sur-
.12 f /13 BS 7B
.10 2S
E .08
.04
1,7
3-7
i I I I 800 875 950 1025
Temp., ~ Ca)
.10 8 BN
08 / / / i D a �9 1 _ 6 NS
.06 p
~ .04 ] 4BNS
"02 1 6 ~ 9 BNS
oo/ 800 8,'5 950 1 ~5
Temp. ~ (b)
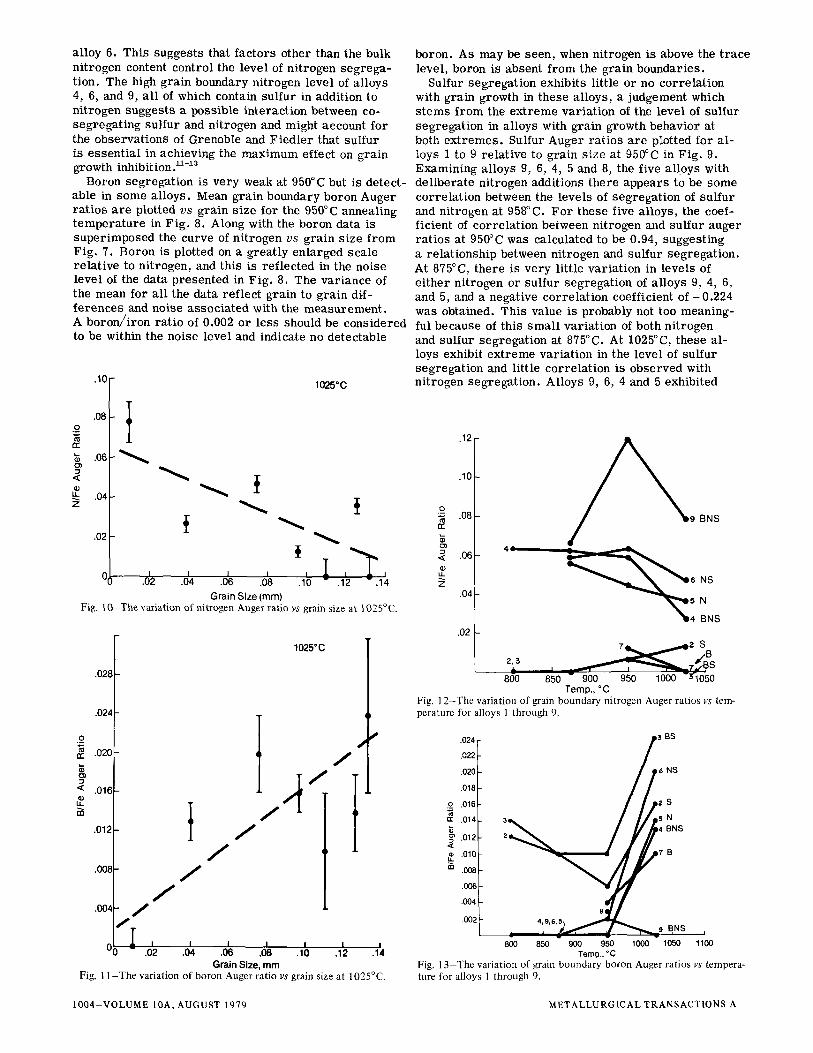
Fig. 6 - ( a ) Grain size vs isothermal annealing temperature for alloys without the addition of nitrogen. (b) Grain size vs isothermal anneal- ing temperature for alloys containing nitrogen in addition to various combinations of boron and sulfur.
face gives the result that Auger emission from these particles would yield an effective monolayer coverage of 0.0034. The experimental data obtained in this study yield ratios of S/Fe of typically 0.1. Using relative Auger sensitivity factors 29 for the emission of $1~o and Fe6~l Auger electrons, the experimental Auger ratio S15JFe651 of 0.1 results in an estimated monolayer coverage of 0.03. Similarly, experimental Auger ratio data for nitrogen N3~5/Fe651 were on the order of 0.05 corresponding to monolayer coverages of approximately 0.05. Both of these values are at least an order of mag- nitude greater than the contribution expected from second phase particles.
A second question as to whether the differences in Auger signal from one grain to another or between " spher i ca l " and "face ted" grain boundaries were due to differing densities of second phase particles was examined. SEM micrographs of these grain boundaries indicated a constant areal density of grain boundary cusps, indicating no difference in the densities of the second phase particles. When this is combined with the observation that the contribution to the Auger sig- nal due to the second phase particles is small, it must be concluded that the pr imary source of the Auger sig- nal is monolayer or submonolayer grain boundary se- gregation.
Most of the specimens examined (particularly those heat treated at 950~ and lower) did not have "spher i - cal" grain boundaries associated with the pr imary matrix and consequently did not exhibit such large differences in Auger ratio from grain to grain. This point is s t ressed since the mean level of grain bound- ary segregation has been observed to correlate with the grain growth character is t ics of these alloys. Since there was not any compelling justification to exclude the large spherical grains from the statistical ensem- ble, they are included in the calculated mean values. The variation from grain to grain is reflected in the variance of the mean Auger ratio for a particular alloy.
Grain Growth Behavior and Segregation
The relative grain growth behavior of alloys 1 to 9 given double decarburization treatments prior to grain growth annealing is presented in Fig. 6(a) and (b). The grain s ize- temperature results have been plotted to emphasize the difference in normal grain growth be- havior between alloys with and without nitrogen addi- tions in Fig. 6(b) and (a), respectively. Adjacent to each curve are the alloy identification and a symbolic representation of the alloy additions tabulated in Tables I and HI. The alloys presented in Fig. 6(a) all have very similar grain growth behavior and all exhibited a low degree of growth inhibition. These represented alloys with the addition of boron, sulfur, both boron and sulfur or no addition.
In contrast, the five alloys in Fig. 6(b) show a signifi- cant variation in grain growth with alloy composition. All of these alloys had some nitrogen addition to the melt. Alloy 5 with only nitrogen added had an overall grain s ize- temperature curve comparable to the alloys without nitrogen. The combination of either boron and sulfur with nitrogen can be seen to have had a signifi- cant effect in increasing grain growth inhibition. The
IO02-VOLUME 10A, AUGUST 1979 METALLURGICAL TRANSACTIONS A
al loys with the s t ronges t inhibition of normal gra in growth, were those with the combination of boron, nitrogen and sulfur, consistent with the observat ions of F i ed l e r . 12 Alloys 4 and 9 both had additions of boron, nitrogen, and sulfur as tabulated in Table I. The s t rong- e r inhibition of normal grain growth in al loy 9 will be shown to be re la ted to the higher ni t rogen content of this al loy.
There is very l i t t le difference in the grain s ize of any of these al loys at 875~ with no dis t inct ion in grain s ize between the nitrogen free or ni trogen bear ing al- loys being observed. At 950~ the onset of normal grain growth occur red in most of these al loys and was the t empera tu re at which the grain growth cha rac t e r - i s t i cs of the nine al loys were f i r s t different iated. The differences in grain s ize were even more significant at 1025~ and at this stage, the grain s t ruc ture of the a l loys was signif icantly different from that of the p r i - mary grain s t ruc ture . Secondary r ec rys t a l l i za t ion oc- cur red in alloy 3 at 950~ and al loy 4 at 1025~ (in both cases , the grain s ize measurements plotted in Fig . 6(a) and (b) were from a r e a s of p r ima ry grain s t ruc ture unconsumed by secondary rec rys ta l l i za t ion) .
Fo r each alloy in this s e r i e s , Auger e lec t ron spec t ra were obtained f rom individual grain boundary facets of specimens quenched from the grain growth anneal. By taking an average of many individual grain bounda- r i e s f rom each specimen, mean values of sulfur, boron, carbon, nitrogen and oxygen grain boundary Auger ra t ios were obtained. Confidence l imits corresponding to +2S-~x were calculated for each mean value to ref lect the magnitude of the grain to grain var ia t ion of the data. St , the es t imate of the var iance of the mean, is given by
S~ = n (n - 1)
where n is the number of individual grain boundary measurements and x is the mean.
At 950~ there was a very s t rong corre la t ion between nitrogen segregat ion and grain growth behavior . This is shown in Fig . 7 which is a represen ta t ion of the mean nitrogen Auger ra t io of an alloy re la t ive to its grain s ize at 950~ The al loy which is the most s t rongly
.12 950oc
.10
0 ~= .08 n." $ ~
.~ .06 BNS 4
#_
.04
.02
1 Bs~S I I I I L ..L Tl .LI I
00 .01 .02 .03 .04 .05 .06 .07
Grain Size, mm Fig. 7 - M e a n value of nitrogen Auger ratio corresponding to grain boundary analysis of various alloys annealed at 95 0~ plotted vs the grain size of the alloy.
grain growth inhibited alloy in this s e r i e s has the high- est grain boundary nitrogen and the least s t rongly in- hibited al loys exhibit low or undetectable ni trogen. Be- tween these two ex t remes , the mean nitrogen Auger ra t io observed for an alloy dec rea se s monotonically with increas ing gra in s ize suggesting that the level of gra in growth inhibition of a pa r t i cu la r alloy is d i rec t ly re la ted to the level of ni trogen segregat ion to the grain boundaries of that al loy.
The inhibition of normal grain growth in these al loys cor re la ted only with nitrogen segregat ion to the grain boundaries and not to the total ni trogen content of the al loy. Comparing al loys 6 and 8, it can be seen that although the total ni trogen level of alloy 8 more than 70 pet g rea te r than that of al loy 6 at 950~ grain growth inhibition is s ignif icantly weaker, and the level of n i t ro- gen at the grain boundaries is only one third of that for
.020
.016 o
.012
~.00a
.0O4
0 0
N/Fe \
\
\
3
4,6 8
1, 1 , .01 .02 .03 .04
Grain Size, mm
950~ .10
O8 z
.06 B/Fe e~
04 o
.02
0 .05 .06 .07
Fig. 8 Boron Auger ratio vs grain size at 950~ Superimposed on this curve is the variation of nitrogen Auger ratio for the same alloys.
.18 950~
o
rr
<
.16
.14
.12
.10
.08
.06
.04
,02
t9
~8
t 2
0 I I I I I .01 .02 .03 .04 .05 .06 .07
Grain Size, mm Fig. 9 - T h e variation of mean sulfur Auger ratios for alloys exhibiting various grain sizes at 950~
METALLURGICAL TRANSACTIONS A VOLUME 10A, AUGUST 1979 1003
al loy 6. This suggests that fac tors other than the bulk ni trogen content control the level of ni trogen segrega- tion. The high grain boundary nitrogen level of al loys 4, 6, and 9, a l l of which contain sulfur in addition to nitrogen suggests a poss ible in teract ion between co- segregat ing sulfur and nitrogen and might account for the observat ions of Grenoble and F i e d l e r that sulfur is e s sen t i a l in achieving the maximum effect on grain growth inhibition. ~-~a
Boron segregat ion is very weak at 950~ but is detect - able in some a l loys . Mean grain boundary boron Auger ra t ios a re plotted v s grain s ize for the 950~ annealing t empera tu re in Fig . 8. Along with the boron data is super imposed the curve of ni trogen v s grain s ize f rom Fig. 7. Boron is plotted on a great ly enlarged scale re la t ive to nitrogen, and this is ref lec ted in the noise level of the data presented in Fig . 8. The var iance of the mean for a l l the data ref lec t grain to gra in dif- fe rences and noise assoc ia ted with the measurement . A boron / i ron ra t io of 0.002 or less should be considered to be within the noise level and indicate no detectable
O
rr"
o~ LL
z
,10
.08
.06
.04
,02
1025"C
I I I I I I .02 .04 .06 .08 .10 - .1 .1~,
Grain Size (mm) Fig. 10 The variation of nitrogen Auger ratio vs grain size at 1025~
.9
== .<
LL
.028
.024
.020
.016
.012
.008
1025"C
/ /
/
J /
/ .004 /
/ 1 - , , , 0 - .0=2 .& .06 .08 .10 .12 .14
Grain Size, mm Fig. 11-The variation of boron Auger ratio vs grain size at 1025~
boron. As may be seen, when nitrogen is above the t race level, boron is absent from the grain boundaries .
Sulfur segregat ion exhibits l i t t le or no corre la t ion with grain growth in these al loys, a judgement which s tems from the ex t reme var ia t ion of the level of sulfur segregat ion in al loys with grain growth behavior at both ex t r emes . Sulfur Auger ra t ios a r e plotted for a l - loys 1 to 9 re la t ive to grain size at 950~ in Fig . 9. Examining al loys 9, 6, 4, 5 and 8, the five al!oys with de l ibera te ni trogen additions there appears to be some corre la t ion between the levels of segregat ion of sulfur and nitrogen at 958~ F o r these five al loys, the coef- ficient of cor re la t ion between nitrogen and sulfur auger ra t ios at 950~ was calculated to be 0.94, suggesting a re la t ionship between nitrogen and sulfur segregat ion. At 875~ there is very l i t t le var ia t ion in levels of e i ther ni trogen or sulfur segregat ion of al loys 9, 4, 6, and 5, and a negative cor re la t ion coefficient o f - 0 . 2 2 4 was obtained. This value is probably not too meaning- ful because of this smal l var ia t ion of both nitrogen and sulfur segregat ion at 875~ At 1025~ these a l - loys exhibit ex t reme var ia t ion in the level of sulfur segregat ion and li t t le cor re la t ion is observed with nitrogen segregat ion . Alloys 9, 6, 4 and 5 exhibited
0
<
z
.12
.10
.08
.06
.04
.02
4 ~ f•9 BNS
BNS
2,3 i ~ ~ - I " ~ " ~ ~ r-/Bs
800 850 - 900 950 1000-3-1050 Temp., ~
Fig. 12-The variation of grain boundary nitrogen Auger ratios vs tem- perature for alloys 1 through 9.
.024 / 5 BS
,022
,020 / ~ 6 NS
/ / ,018
9 .016 l i p 2 S
//4 ,014 5 N
.002 4 9,s �9 , N$ =
w w . 800 850 900 950 1000 1050 1100
Temp,, * C Fig. 13 The variation of grain boundary boron Auger ratios vs tempera- ture for alloys 1 through 9.
1004-VOLUME 10A, AUGUST 1979 METALLURGICAL TRANSACTIONS A
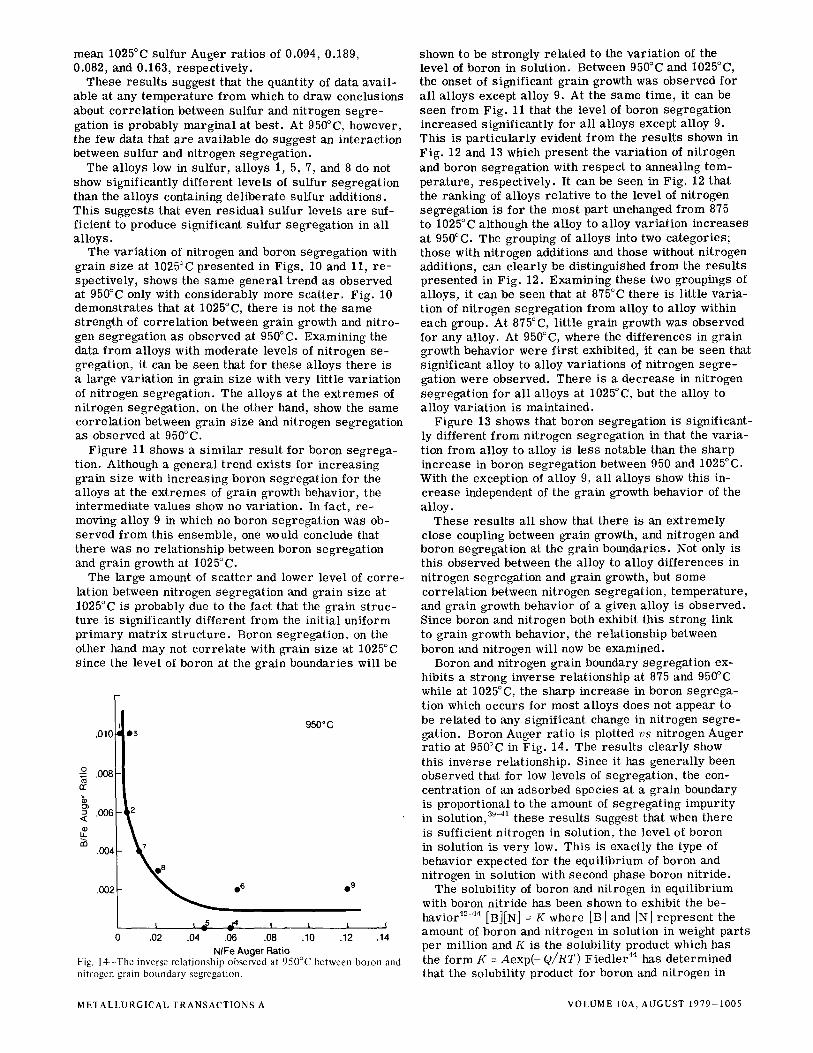
mean 1025~ sulfur Auger ra t ios of 0.094, 0.189, 0.082, and 0.163, respec t ive ly .
These resu l t s suggest that the quantity of data avai l - able at any t empera tu re from which to draw conclusions about cor re la t ion between sulfur and nitrogen seg re - gation is probably margina l at bes t . At 950~ however, the few data that a re avai lable do suggest an interact ion between sulfur and nitrogen segregat ion.
The al loys low in sulfur, a l loys 1, 5, 7, and 8 do not show significantly different levels of sulfur segregat ion than the al loys containing de l ibera te sulfur addit ions. This suggests that even res idua l sulfur levels a re suf- ficient to produce significant sulfur segregat ion in a l l a l loys .
The var ia t ion of nitrogen and boron segregat ion with grain s ize at 1025~ presented in Figs . 10 and 11, r e - spect ively, shows the same genera l t rend as observed at 950~ only with considerably more sca t t e r . F ig . 10 demonst ra tes that at 1025~ there is not the same strength of cor re la t ion between grain growth and ni tro- gen segregat ion as observed at 950~ Examining the data f rom al loys with moderate levels of ni trogen se- gregation, it can be seen that for these al loys there is a large var ia t ion in grain size with very litt le var ia t ion of nitrogen segregat ion. The al loys at the ex t r emes of ni trogen segregat ion, on the other hand, show the same corre la t ion between grain size and nitrogen segregat ion as observed at 950~
Figure 11 shows a s i m i l a r resul t for boron segrega- tion. Although a genera l t rend exis ts for increas ing grain s ize with increas ing boron segregat ion for the al loys at the ex t remes of grain growth behavior, the in termedia te values show no var ia t ion. In fact, r e - moving al loy 9 in which no boron segregat ion was ob- se rved from this ensemble, one would conclude that there was no re la t ionship between boron segregat ion and grain growth at 1025~
The large amount of sca t t e r and lower level of co r r e - lation between nitrogen segregat ion and grain s ize at 1025~ is probably due to the fact that the grain s t ruc - ture is significantly different from the ini t ia l uniform p r i m a r y mat r ix s t ruc ture . Boron segregat ion, on the other hand may not cor re la te with grain s ize at 1025~ since the level of boron at the grain boundaries will be
.o_
rr"
.010 os
.008~]
950 ~ C
,~ .006
~. 2 7
.004
.002 �9 6 �9 9
I , = 5 . f f , , I , .02 .04 .06 .08 .10 .12 .14
NIFe Auger Ratio Fig. 14-The inverse relationship observed at 950~ between boron and nitrogen grain boundary segregation.
shown to be s t rongly re la ted to the var ia t ion of the level of boron in solution. Between 950~ and 1025~ the onset of significant grain growth was observed for a l l a l loys except alloy 9. At the same t ime, it can be seen f rom Fig. 11 that the level of boron segregat ion increased signif icantly for a l l a l loys except alloy 9. This is pa r t i cu la r ly evident from the resu l t s shown in Fig . 12 and 13 which present the var ia t ion of nitrogen and boron segregat ion with respec t to annealing tem- pera ture , r espec t ive ly . It can be seen in Fig. 12 that the ranking of al loys re la t ive to the level of nitrogen segregat ion is for the most par t unchanged f rom 875 to 1025~ although the alloy to alloy var ia t ion inc reases at 950~ The grouping of al loys into two categories ; those with nitrogen additions and those without ni trogen additions, can c lear ly be dist inguished f rom the resu l t s presented in F ig . 12. Examining these two groupings of a l loys , it can be seen that at 875~ there is l i t t le va r i a - tion of nitrogen segregat ion from al loy to alloy within each group. At 875~ l i t t l e grain growth was observed for any alloy. At 950~ where the dif ferences in grain growth behavior were f i r s t exhibited, it can be seen that significant alloy to alloy var ia t ions of ni trogen s eg re - gation were observed. There is a dec rease in nitrogen segregat ion for a l l a l loys at 1025~ but the alloy to al loy var ia t ion is maintained.
Figure 13 shows that boron segregat ion is s ignif icant- ly different f rom nitrogen segregat ion in that the v a r i a - tion from alloy to alloy is less notable than the sharp inc rease in boron segregat ion between 950 and 1025~ With the exception of alloy 9, a l l a l loys show this in- c rease independent of the grain growth behavior of the al loy.
These resu l t s a l l show that there is an ex t remely close coupling between grain growth, and nitrogen and boron segregat ion at the grain boundar ies . Not only is this observed between the alloy to al loy differences in nitrogen segregat ion and grain growth, but some cor re la t ion between nitrogen segregat ion, t empera tu re , and gra in growth behavior of a given al loy is observed. Since boron and nitrogen both exhibit this s t rong link to grain growth behavior, the re la t ionship between boron and nitrogen will now be examined.
Boron and nitrogen grain boundary segregat ion ex- hibits a s trong inverse re la t ionship at 875 and 950~ while at 1025~ the sharp increase in boron seg rega - tion which occurs for most al loys does not appear to be re la ted to any significant change in nitrogen seg re - gation. Boron Auger ra t io is plotted vs nitrogen Auger ra t io at 950~ in Fig . 14. The resu l t s c lear ly show this inverse re la t ionship . Since it has genera l ly been observed that for low levels of segregat ion, the con- centrat ion of an adsorbed species at a grain boundary is propor t ional to the amount of segregat ing impuri ty in solution, a9-4. these resu l t s suggest that when there is sufficient ni trogen in solution, the level of boron in solution is ve ry low. This is exactly the type of behavior expected for the equi l ibr ium of boron and nitrogen in solution with second phase boron ni t r ide .
The solubil i ty of boron and nitrogen in equi l ibr ium with boron ni t r ide has been shown to exhibit the be- havior 42-44 [B][N] = K where [B] and IN] r ep resen t the amount of boron and nitrogen in solution in weight par t s per mill ion and K is the solubil i ty product which has the form K = Aexp(- Q/RT) Fi e d l e r 44 has de termined that the solubil i ty product for boron and nitrogen in
METALLURGICAL TRANSACTIONS A VOLUME 10A, AUGUST 1979-1005
i ron -3 .1 pe t s i l i con a l loys obeys the r e l a t i onsh ip :
-19,560+ l o g [B][N] - 1 15.75
for the t e m p e r a t u r e range 1200 to 1300~ A s s u m i n g that th is r e l a t i o n s h i p can be e x t r a p o l a t e d to lower t e m - p e r a t u r e s , the quant i ty of boron in so lu t ion would be d e t e r m i n e d by the amount of n i t rogen in so lu t ion and the so lub i l i t y p roduc t .
In the s e r i e s of a l l oys s tud ied here , a l l (except a l loys 3 and 7 with bo ron but no n i t rogen addi t ions) have a s ign i f i can t e x c e s s of n i t rogen ove r the leve l r e q u i r e d to ach ieve a s t o i c h i o m e t r i c BN r a t i o . Th i s means that the l eve l of n i t rogen in so lu t ion wi l l not be s t r o n g l y dependent upon the fo rma t ion or d i s so lu t ion of BN, while boron in so lu t ion wil l d i r e c t l y depend upon this e q u i l i b r i u m . F o r a constant to ta l n i t rogen leve l , a s o b s e r v e d in these s tudied , the quant i ty of boron in so lu t ion wi l l be d i r e c t l y p r o p o r t i o n a l to KBN , the so lu- b i l i t y p roduc t for BN. This sugges t s that boron s e g r e - gat ion would be v e r y high if t h e r e were an e x c e s s of bo ron ove r n i t rogen . A l l o y s A through D, conta ining 30 wppm boron , 100 wppm su l fur and v a r i o u s n i t rogen l eve l s were s tud ied for the pu rpose of examin ing a l loys
.06 ?
.05 / / /
oron/Fe j ' .03 ~ ~/~ //" Nitrogen/Fe
~ .02 / .01 ~ SpS
/ / �9
0 ' C ' - - - I I 0 20 40 60 80 100 120 140
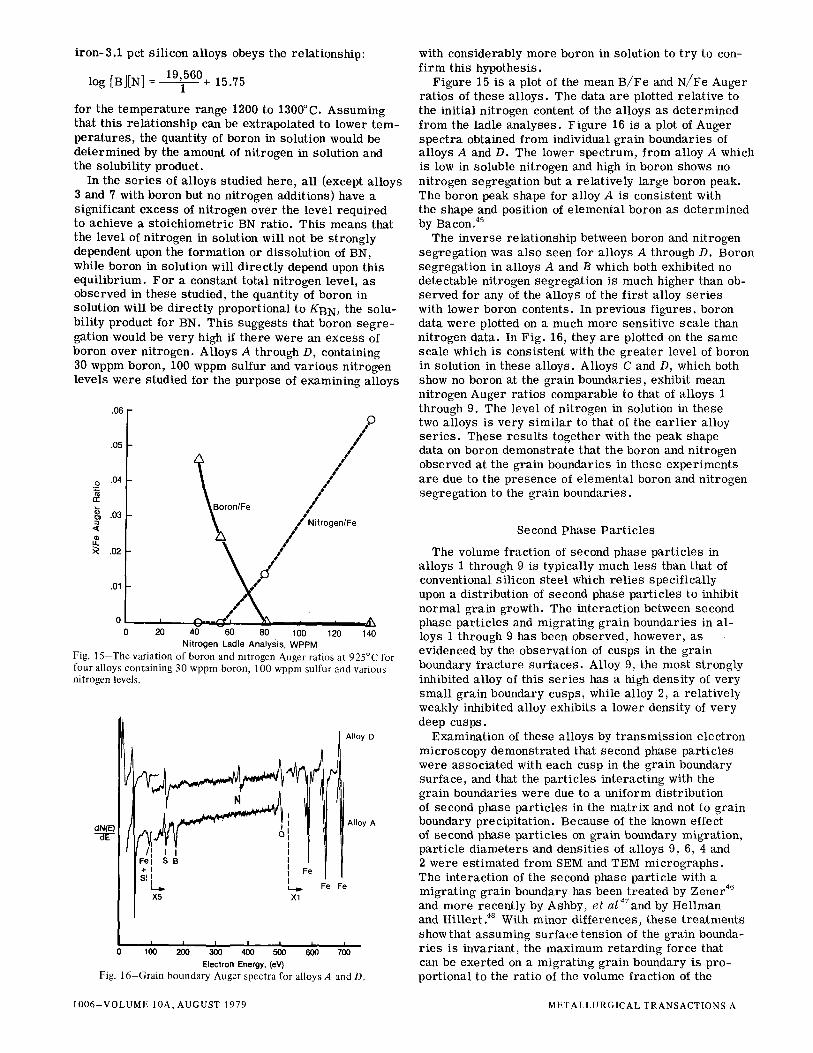
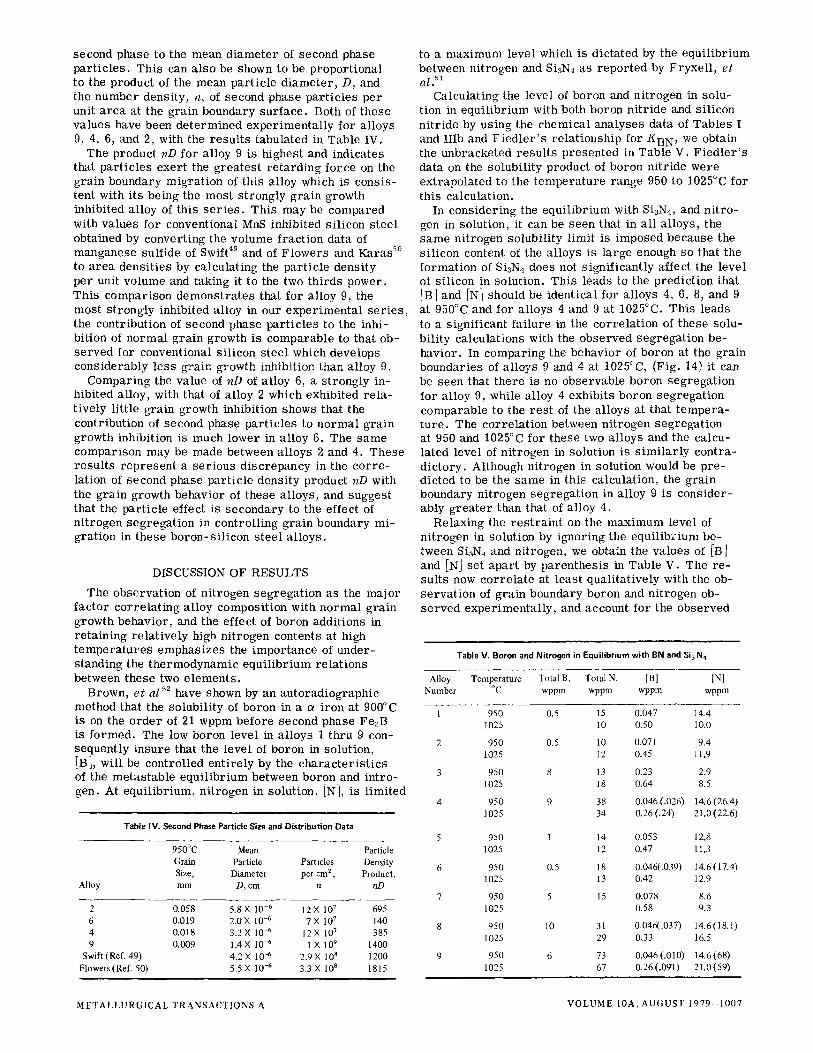
Nitrogen Ladle Analysis, WPPM Fig. 15-The variation of boron and nitrogen Auger ratios at 925~ for four alloys containing 30 wppm boron, 100 wppm sulfur and various nitrogen levels.
I~ I~ Alloy D
!, II 'IFe'i i I I;i FoI
I L_~ ~_~ Fe Fe I • Xt
I I I I I I I 0 100 200 300 40o 50o 600 7oo
Electron Energy, (eV) Fig. 16 Grain boundary Auger spectra for alloys A and D.
with c o n s i d e r a b l y more boron in so lu t ion to t r y to con- f i r m th is hypo thes i s .
F i g u r e 15 is a plot of the mean B / F e and N / F e A u g e r r a t i o s of t he se a l l o y s . The da ta a r e p lot ted r e l a t i v e to the i n i t i a l n i t rogen content of the a l l oys a s d e t e r m i n e d f rom the lad le a n a l y s e s . F i g u r e 16 is a plot of A u g e r s p e c t r a obta ined f rom ind iv idua l g ra in b o u n d a r i e s of a l l oys A and D. The lower s p e c t r u m , f rom a l loy A which is low in so lub le n i t rogen and high in boron shows no n i t rogen s e g r e g a t i o n but a r e l a t i v e l y l a rge boron peak . The bo ron peak shape for a l loy A is cons i s t en t with the shape and pos i t ion of e l e m e n t a l boron as d e t e r m i n e d by B a c o n J ~
The i n v e r s e r e l a t i o n s h i p be tween boron and n i t rogen s e g r e g a t i o n was a l so seen for a l l oys A through D. Boron s e g r e g a t i o n in a l l oys A and B which both exh ib i ted no de t ec t ab l e n i t rogen s e g r e g a t i o n is much h igher than ob- s e r v e d for any of the a l l oys of the f i r s t a l loy s e r i e s with lower boron contents . In p r ev ious f i gu re s , bo ron da ta we re p lot ted on a much m o r e s ens i t i ve s c a l e than n i t rogen da ta . In F i g . 16, they a r e p lot ted on the s a m e sca l e which is cons i s t en t with the g r e a t e r l eve l of boron in solut ion in t hese a l l oys . A l loys C and D, which both show no boron at the g ra in b o u n d a r i e s , exhib i t mean n i t rogen A u g e r r a t i o s c o m p a r a b l e to that of a l loys I through 9. The l eve l of n i t rogen in solut ion in these two a l loys is v e r y s i m i l a r to that of the e a r l i e r a l loy s e r i e s . These r e s u l t s t oge the r with the peak shape da ta on boron d e m o n s t r a t e that the boron and n i t rogen o b s e r v e d at the g ra in bounda r i e s in these e x p e r i m e n t s a r e due to the p r e s e n c e of e l e m e n t a l boron and n i t rogen s e g r e g a t i o n to the g ra in b o u n d a r i e s .
Second P h a s e P a r t i c l e s
The volume f r ac t i on of second phase p a r t i c l e s in a l loys 1 th rough 9 is t y p i c a l l y much l e s s than that of convent ional s i l i con s t e e l which r e l i e s s p e c i f i c a l l y upon a d i s t r i bu t i on of second phase p a r t i c l e s to inhibi t n o r m a l g ra in growth. The in t e r ac t ion be tween second phase p a r t i c l e s and m i g r a t i n g g r a i n bounda r i e s in a l - loys 1 th rough 9 has been obse rved , however , as ev idenced by the o b s e r v a t i o n of cusps in the g ra in bounda ry f r a c t u r e s u r f a c e s . Al loy 9, the mos t s t r o n g l y inhibi ted a l loy of th is s e r i e s has a high dens i ty of v e r y s m a l l g r a in bounda ry cusps , while a l loy 2, a r e l a t i v e l y weakly inhibi ted a l loy exhib i t s a lower dens i ty of v e r y deep cusps .
Examina t i on of these a l loys by t r a n s m i s s i o n e l e c t r o n m i c r o s c o p y d e m o n s t r a t e d that second phase p a r t i c l e s were a s s o c i a t e d with each cusp in the g ra in boundary su r f ace , and that the p a r t i c l e s i n t e r a c t i n g with the g ra in b o u n d a r i e s were due to a un i fo rm d i s t r i bu t i on of second phase p a r t i c l e s in the m a t r i x and not to g r a i n bounda ry p r e c i p i t a t i o n . B e c a u s e of the known effect of second phase p a r t i c l e s on g r a i n boundary mig ra t i on , p a r t i c l e d i a m e t e r s and d e n s i t i e s of a l l oys 9, 6, 4 and 2 were e s t i m a t e d f rom SEM and TEM m i c r o g r a p h s . The i n t e r ac t i on of the second phase p a r t i c l e with a m i g r a t i n g g ra in boundary has been t r e a t e d by Z e n e r 46 and m o r e r e c e n t l y by Ashby, e t a/~Tand by He l lman and H i l l e r t Y With minor d i f f e r e n c e s , these t r e a t m e n t s show that a s s u m i n g su r f a c e t ens ion of the g ra in bounda- r i e s is i nva r i an t , the m a x i m u m r e t a r d i n g f o r c e that can be e x e r t e d on a m i g r a t i n g g r a i n bounda ry is p r o - p o r t i o n a l to the r a t i o of the vo lume f r ac t i on of the
1006-VOLUME 10A, AUGUST 1979 METALLURGICAL TRANSACTIONS A
second phase to the mean d i ame te r of second phase pa r t i c l e s . This can a lso be shown to be p ropor t iona l to the product of the mean par t ic ie d i ame te r , D, and the n u m b e r densi ty, n, of second phase pa r t i c l e s per unit a r ea at the gra in boundary sur face . Both of these va lues have been de t e rmined expe r imen ta l ly for a l loys 9, 4, 6, and 2, with the r e su l t s tabulated in Table IV.
The product nD for al loy 9 is highest and indicates that pa r t i c l e s exer t the g rea tes t r e t a rd ing force on the g ra in boundary migra t ion of this al loy which is cons is - tent with its being the most s t rongly g ra in growth inhibi ted al loy of this s e r i e s . This may be compared with values for convent ional MnS inhibi ted s i l i con s tee l obtained by conver t ing the volume f rac t ion data of manganese sulfide of Swif09 and of F lowers and Karas ~~ to a r ea dens i t i es by calculat ing the par t ic le dens i ty per unit volume and taking it to the two th i rds power. This compar i son demons t r a t e s that for al loy 9, the most s t rongly inhibited alloy in our expe r imen ta l s e r i e s , the cont r ibut ion of second phase pa r t i c l e s to the inhi- bi t ion ot no rma l g ra in growth is comparable to that ob- se rved for conventional s i l i con s tee l which develops cons iderab ly less g ra in growth inhibi t ion than al loy 9.
Compar ing the value of nD of al loy 6, a s t rongly in- hibited alloy, with that of al loy 2 which exhibited r e l a - t ively l i t t le gra in growth inhibi t ion shows that the contr ibut ion of second phase pa r t i c l e s to n o r m a l gra in growth inhibi t ion is much lower in al loy 6. The same compar i son may be made between al loys 2 and 4. These r e su l t s r e p r e s e n t a se r ious d i s c r epancy in the co r r e - lat ion of second phase par t ic le dens i ty product nD with the g ra in growth behavior of these a l loys , and suggest that the pa r t i c le effect is secondary to the effect of n i t rogen segrega t ion in cont ro l l ing gra in boundary mi- gra t ion in these b o r o n - s i l i c o n s tee l a l loys .
DISCUSSION OF RESULTS
The observa t ion of n i t rogen segrega t ion as the major fac tor co r r e l a t i ng al loy composi t ion with n o r m a l gra in growth behavior , and the effect of boron addit ions in r e t a in ing r e l a t ive ly high n i t rogen contents at high t e m p e r a t u r e s emphas izes the impor tance of under - s tanding the t he rmodynamic equ i l i b r ium re la t ions between these two e l emen t s .
Brown, e t al ~2 have shown by an au torad iographic method that the so lubi l i ty of boron in a a i ron at 900~ is on the o rde r of 21 wppm before second phase FeeB is formed. The low boron level in a l loys 1 thru 9 con- sequent ly in su re that the level of boron in solut ion, [B], wil l be control led en t i re ly by the c h a r a c t e r i s t i c s of the metas tab le equ i l i b r ium between boron and in t ro- gen. At equ i l ib r ium, n i t rogen in solut ion, [N], is l imi ted
Table IV. Second Phase Particle Size and Distribution Data
950~ Mean Particle Grain Particle Particles Density Size, Diameter per cm 2 , Product,
Alloy mm D, cm n nD
2 0.058 5.8X 10 -6 12X 107 695 6 0o019 2.0 X 10 -6 7 N 107 140 4 0.018 3.2 X 10 -6 12 • l0 T 385 9 0.009 1.4 X 10 -6 1 X 10⁹ 1400
Swift (Ref. 49) 4.2X 10 -6 2.9X I08 1200 Flowers (Ref. 50) 5.5 X 10 -6 3.3 X 10 a 1815
to a max imum level which is dictated by the equ i l i b r ium between n i t rogen and SiaN4 as repor ted by F ryxe l l , e t
al.~l Calcula t ing the level of boron and n i t rogen in solu-
tion in equ i l i b r ium with both boron n i t r ide and s i l icon n i t r ide by us ing the chemica l ana lyses data of Tab les I and IIIb and F i e d l e r ' s r e la t ionsh ip for KBN, we obtain the unbracketed r e su l t s p resen ted in Table V. F i e d l e r ' s data on the solubi l i ty product of boron n i t r ide were extrapola ted to the t e m p e r a t u r e range 950 to 1025~ for this calcula t ion.
In cons ider ing the equ i l i b r ium with S%N4, and n i t ro - gen in solut ion, it can be seen that in a l l a l loys, the same n i t rogen so lubi l i ty l imi t is imposed because the s i l icon content of the al loys is large enough so that the fo rmat ion of Si3N4 does not s igni f icant ly affect the level of s i l icon in solut ion. This leads to the predic t ion that [B] and [N] should be ident ica l for al loys 4, 6, 8, and 9 at 950~ and for al loys 4 and 9 at 1025~ This leads to a s ignif icant fa i lure in the cor re la t ion of these solu- bi l i ty ca lcula t ions with the observed segrega t ion be- havior . In compar ing the behavior of boron at the gra in boundar ies of a l loys 9 and 4 at 1025~ (Fig. 14) it can be seen that there is no observable boron segrega t ion for al loy 9, while alloy 4 exhibi ts boron segrega t ion comparable to the r e s t of the al loys at that t e m p e r a - tu re . The co r re l a t ion between n i t rogen segrega t ion at 950 and 1025~ for these two al loys and the calcu- lated level of n i t rogen in solut ion is s i m i l a r l y cont ra - d ic tory . Although n i t rogen in solut ion would be pre- dicted to be the same in this calculat ion, the gra in boundary n i t rogen segrega t ion in alloy 9 is cons ide r - ably g rea t e r than that of al loy 4.
Relaxing the r e s t r a i n t on the max imum level of n i t rogen in solut ion by ignor ing the equ i l ib r ium be- tween Si3N4 and ni t rogen, we obtain the va lues of [BJ and [N] set apar t by pa ren thes i s in Table V. The re - sui ts now co r r e l a t e at least qual i ta t ive ly with the ob- s e rva t ion of g ra in boundary boron and n i t rogen ob- se rved exper imen ta l ly , and account for the observed
Table V. Boron and Nitrogen in Equilibrium with BN and Si3N4
Alloy Temperature Total B, Total N, [B] [N] Number ~ wppm wppm wppm wppm
1 950 0.5 15 0.047 14.4 1025 10 0.50 10.0
2 950 0.5 10 0.071 9.4 1025 12 0.45 11,9
3 950 8 13 0.23 2.9 1025 18 0.64 8.5
4 950 9 38 0.046(.026) 14.6(26.4) 1025 34 0.26(.24) 21.0(22.6)
5 950 1 14 0.053 12,8 1025 12 0.47 11,3
6 950 0.5 18 0.046(.039) 14.6(17.4) 1025 13 0.42 12.9
7 950 5 15 0.078 8.6 1025 0.58 9.3
8 950 10 31 0.046(.037) 14.6(18.1) 1025 29 0,33 16.5
9 950 6 73 0.046(.010) 14.6(68) 1025 67 0.26(.091) 21.0(59)
METALLURGICAL TRANSACTIONS A VOLUME 10A,AUGUST 1979-1007
behavior of n i t rogen and boron segrega t ion throughout the en t i re t e m p e r a t u r e range of study. The d i f fe rences in n i t rogen segrega t ion between al loys 4, 5, 6, and 9 can now be accounted for and the fact f l a t al loy 9 exhi- bi ted no boron segrega t ion at 1025~ while al l other a l loys demons t r a t ed a s igni f icant i nc r ea se is now en- t i r e ly cons is ten t with the calculated solubi l i ty of boron. Th i s leads to the conclusion that BN controls the level of n i t rogen and boron in solut ion and consequent ly boron and n i t rogen segrega t ion in these a l loys . It a lso demon- s t r a t e s that the inve r se re la t ionsh ip observed at 875 and 950~ between boron and n i t rogen is due to the bulk t he rmodynamic behavior of boron and n i t rogen and not to a repu ls ive in t e rac t ion between these e l emen t s at the gra in bounda r i e s .
Using the b racke ted solubi l i ty r e su l t s p resen ted in Fig . 5, it is poss ib le to calculate the change in volume f rac t ion of BN f rom 950 to 1025~ to see if d i sso lu t ion of BN is r e spons ib l e for the d r ama t i c i nc r ea se of gra in s ize in this t e m p e r a t u r e range . The r e su l t s indicate that there is less than 4 pct reduct ion in the volume f rac t ion of BN between 950 and 1025~ us ing both the b racke ted and unbracketed va lues . This suggests that the loss of inhibi t ion due to the d i sso lu t ion of second phase BN pa r t i c l e s is not l ikely. The fa i lure of al loy 9 to undergo gra in growth at 1025~ e l imina t e s the poss i - b i l i t y that the d issolu t ion of Si3N4 (if it in fact ex is t s in these al loys) could produce a s i m i l a r effect.
The fact that it was n e c e s s a r y to ignore the condition of equ i l i b r ium between n i t rogen and Si3N4 to obtain ag r eemen t with the segrega t ion r e su l t s suggests two poss ib le s c e n a r i o s . The f i r s t is that Si3N4 equ i l ib r ium cannot be a t ta ined due to the inabi l i ty of the sys t em to nucleate SiaN4 at the t e m p e r a t u r e s at which it becomes t he rmodynamica l l y s table . The other is that the solu- b i l i ty product data a re not accura te af ter ex t rapola t ion or that the use of equ i l i b r ium the rmodynamics is not appl icable to the case of this study.
Examin ing the solubi l i ty data of boron, it can be seen that there is roughly an o rde r of magnitude in- c rease in the ava i lab i l i ty of boron in solut ion between 950 and 1025~ This is cons is ten t with the sharp in- c rease in boron at the gra in boundar ies observed at 1025~ It a lso suggests that a level of boron of a few tenths par t per mi l l ion is suff icient to produce a gra in boundary concent ra t ion of approx imate ly 3 at. pct. This r e p r e s e n t s an en r i chmen t factor for g ra in boundary segrega t ion of boron of approx imate ly 1.5 • 104 at 1025~ An es t ima te of the en r i chmen t factor for n i t ro - gen is difficult to obtain. Although we have obtained e s t ima te s of the amount of n i t rogen in solut ion based on the va r i a t ion of boron segrega t ion with al loy con- tent and with t e m p e r a t u r e , it is difficult to account for the high levels of n i t rogen r equ i r ed in solut ion to cor- re la te with gra in boundary segrega t ion levels . At equ i l ib r ium, n i t rogen in solut ion should be on the o rder of 1 wppm for these a l loys under the condit ions of the
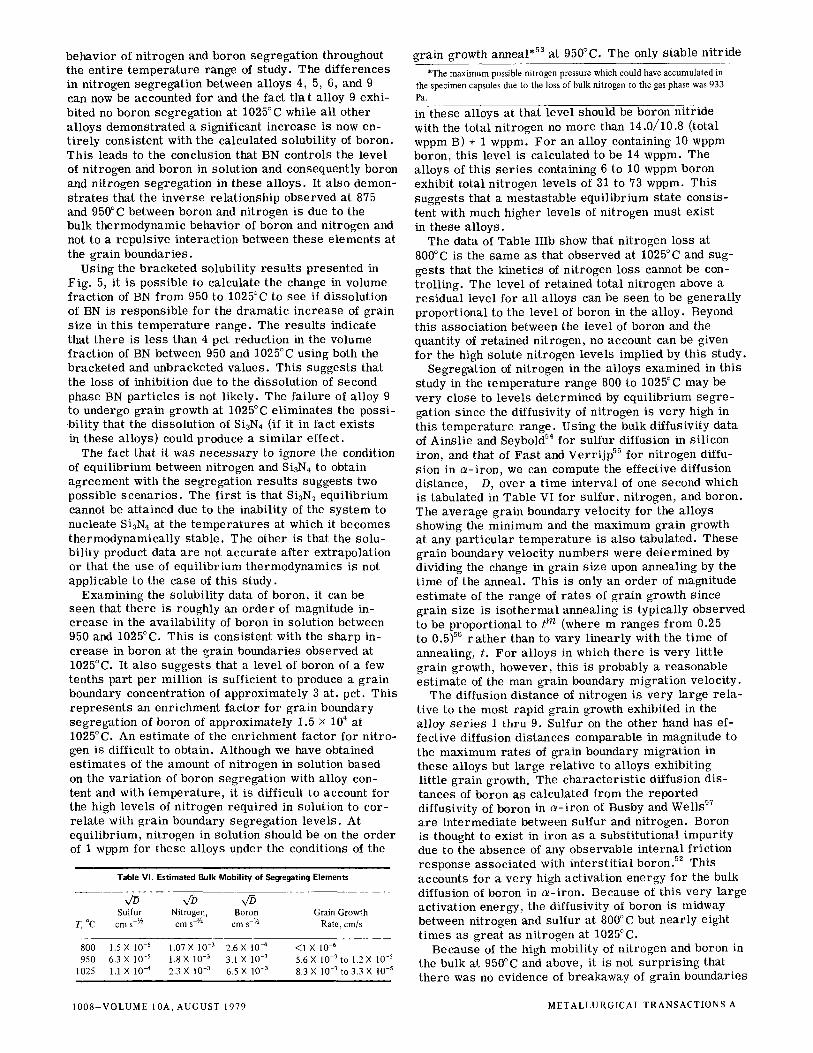
Table VI. Estimated Bulk Mobility of Segregating Elements
Sulfur Nitrogen, Boron Grain Growth T, ~ cm s JA cm s -'A cm s -�89 Rate, cm/s
800 1.5 X 10 -s 1.07 X 10 -3 2.6 X 10⁻⁴ <1 X 10 -6 950 6.3 X 10 -s 1.8 X 10 -3 3.1 X 10 -3 5.6 X 10 -7 to 1.2 • 10 -s
1025 1.1 • 10 -4 2.3 X 10 -3 6.5 X 10 -3 8.3 • 10 -~ to 3.3 X 10 -s
g ra in growth annea l .53 at 950~ The only s table n i t r ide
*The maximum possible nitrogen pressure which could have accumulated in the specimen capsules due to the loss of bulk nitrogen to the gas phase was 933 Pa. in these al loys at that level should be boron n i t r ide with the total n i t rogen no more than 14.0/10.8 (total wppm B) + 1 wppm. F o r an al loy containing 10 wppm boron, this level is calculated to be 14 wppm. The a l loys of this s e r i e s containing 6 to 10 wppm boron exhibit total n i t rogen levels of 31 to 73 wppm. This suggests that a mes ta s t ab le equ i l i b r ium state cons i s - tent with much higher levels of n i t rogen must exist in these a l loys .
The data of Table IIIb show that n i t rogen loss at 800~ is the same as that observed at 1025~ and sug- gests that the k inet ics of n i t rogen loss cannot be con- t ro l l ing . The level of re ta ined total n i t rogen above a r e s idua l level for a l l a l loys can be seen to be genera l ly p ropor t iona l to the level of boron in the al loy. Beyond this assoc ia t ion between the level of boron and the quant i ty of re ta ined ni t rogen, no account can be given for the high solute n i t rogen levels impl ied by this study.
Segregat ion of n i t rogen in the al loys examined in this study in the t e m p e r a t u r e range 800 to 1025~ may be ve ry close to levels de t e rmined by equ i l i b r ium seg re - gation s ince the diffusivi ty of n i t rogen is ve ry high in this t e m p e r a t u r e range . Us ing the bulk diffusivi ty data of Ains l i e and Seybold 54 for su l fur diffusion in s i l i con iron, and that of F a s t and V e r r i j p 5s for n i t rogen diffu- s ion in c~-iron, we can compute the effective diffusion d is tance , D, over a t ime in t e rva l of one second which is tabula ted in Table VI for sul fur , n i t rogen , and boron. The average g ra in boundary veloci ty for the al loys showing the m i n i m u m and the ma x i mum gra in growth at any p a r t i c u l a r t e m p e r a t u r e is a lso tabulated. These gra in boundary veloci ty n u m b e r s were de t e rmined by dividing the change in gra in s ize upon annea l ing by the t ime of the annea l . This is only an o rder of magnitude es t ima te of the range of r a t e s of g ra in growth s ince g ra in size is i s o t h e r m a l annea l ing is typica l ly observed to be p ropor t iona l to t rn (where m ranges f rom 0.25 to 0.5) s6 r a t h e r than to vary l i nea r ly with the t ime of anneal ing , t. F o r a l loys in which there is ve ry l i t t le g ra in growth, however, this is probably a r easonab le e s t ima te of the man gra in boundary mig ra t ion veloci ty .
The diffusion d is tance of n i t rogen is very large r e l a - t ive to the most rapid g ra in growth exhibited in the al loy s e r i e s 1 thru 9. Sulfur on the other hand has ef- fect ive diffusion d i s tances comparable in magnitude to the ma x i mum ra tes of g ra in boundary mig ra t ion in these al loys but large re la t ive to a l loys exhibi t ing l i t t le g ra in growth. The c h a r a c t e r i s t i c diffusion dis- tances of boron as calcula ted f rom the repor ted diffusivi ty of boron in s - i r o n of Busby and Wel ls 57 a re in t e rmed ia t e between sulfur and n i t rogen . Boron is thought to exist in i ron as a subs t i tu t iona l impur i ty due to the absence of any observab le i n t e r n a l f r ic t ion response assoc ia ted with i n t e r s t i t i a l boron. 52 This accounts for a ve ry high ac t iva t ion energy for the bulk diffusion of boron in ol- i ron. Because of this ve ry large ac t iva t ion energy, the diffusivi ty of boron is midway between n i t rogen and su l fur at 800~ but nea r ly eight t imes as great as n i t rogen at 1025~
Because of the high mobi l i ty of n i t rogen and boron in the bulk at 950~ and above, it is not s u r p r i s i n g that there was no evidence of b reakaway of gra in boundar ies
1008-VOLUME 10A, AUGUST 1979 METALLURGICAL TRANSACTIONSA
f r o m the so lu te s e g r e g a t e d at the g r a i n b o u n d a r i e s . Sulfur , al though much l e s s mobi le than boron and n i t r o - gen did not exhibi t th is behav io r e i t h e r . The v a r i a t i o n f rom one g r a i n bounda ry to the next was g r e a t e r for su l fur than for n i t rogen which may be accounted for by cons ide r ing that the r e l a t i v e m i g r a t i o n r a t e s of so lu te su l fur and g ra in boundary s u r f a c e s a r e c o m p a r a b l e . The l a rge s p h e r i c a l g ra in boundary in F ig . 4 would be expec ted to have a lower d r i v ing fo rce and hence p o s s i - b ly a lower g ra in bounda ry ve loc i ty than the s m a l l f ace ted g ra in boundary . Th is could account for the ob- s e r v a t i o n of h igher su l fur at l a rge s p h e r i c a l g ra in boundary s u r f a c e s r e l a t i v e to the s m a l l f ace ted g ra in s u r f a c e s while no d i f f e rence in the n i t rogen s e g r e - gat ion of the two g ra in bounda r i e s was o b s e r v e d . The o b s e r v a t i o n of v e r y low su l fu r on some s p h e r i c a l g ra in bounda ry s u r f a c e s with c u r v a t u r e c o m p a r a b l e to that of the l a rge g ra in boundary in F ig . 4 a p p e a r s to con t r ad ic t th is hypo thes i s , however . A l so n i t rogen s e g r e g a t i o n may not be comple t e ly independent of g ra in boundary m i g r a t i o n ve loc i ty a s sugges t ed by the r e s u l t s p r e s e n t e d in F ig . 12. The four a l loys conta ining n i t r o - gen and examined f r o m 875 to 1025~ a l l showed l i t t le v a r i a t i o n in s e g r e g a t i o n at 875~ where l i t t le o r no g r a i n growth o c c u r r e d and s ign i f i can t d i f f e r e n c e s at 950~ and above where g ra in growth was in mos t c a s e s ex t ens ive . In con t ra s t , su l fur s e g r e g a t i o n which would be expec ted to be even more s ens i t i ve showed no ev idence of any s y s t e m a t i c effect of g ra in bounda ry m i g r a t i o n throughout the t e m p e r a t u r e r ange of 800 to 1025~
Solute Gra in Growth Inhibi t ion
If we cons ide r n i t rogen s e g r e g a t i o n to be the m a j o r f ac to r in con t ro l l ing g ra in boundary m i g r a t i o n in these a l l oys , let us examine the r e l a t i v e mob i l i t i e s of n i t r o - gen and g ra in boundary s u r f a c e s at 950~ The da ta for g ra in growth r a t e t abu la ted in Tab le VI r e p r e s e n t the m a x i m u m and m i n i m u m g r a i n growth r a t e s ob- s e r v e d for a l l a l loys at any given t e m p e r a t u r e . A s - suming that the number r e p r e s e n t i n g the m a x i m u m gra in bounda ry ve loc i t y is f r om an a l loy in which g ra in growth inhib i t ion is absen t , the min imum g ra in boundary ve loc i ty is deduced to be f rom gra in b o u n d a r i e s whose mig ra t i on is inhibi ted by the s e g r e g a t i o n of n i t rogen . At 950~ the c h a r a c t e r i s t i c bulk di f fus ion d i s t ance of n i t rogen is at l eas t t h r e e o r d e r s of magni tude g r e a t e r than the mean g r a i n boundary m i g r a t i o n r a t e of a s t r o n g - ly inhibi ted a l loy . Combining this with the low concen- t r a t i on of n i t rogen at the g ra in boundar i e s* the view of
*Alloy 9, the alloy exhibiting the greatest degree of nitrogen segregation was estimated to have a nitrogen grain boundary concentration of 16 at. pct at 1025~ At this temperature, the alloy was still very strongly grain growth in- hibited. The atomic concentration was estimated using relative Auger sensitivity factors. 29
a n i t rogen a t m o s p h e r e be ing d r a g g e d by and r e s t r a i n i n g the mig ra t i on of a g r a i n bounda ry is i n a p p r o p r i a t e . The Cahn ~9 and L/icke-St / iwe 2~ mode l s of g ra in growth inhi- b i t ion p r e d i c t that the g r e a t e r the bulk d i f fus iv i ty of the a d s o r b i n g s p e c i e s at the g ra in bounda ry r e l a t i v e to the g ra in boundary ve loc i ty , the lower the r e s t r a i n i n g fo rce e x e r t e d by a so lu te a t m o s p h e r e on the g ra in boundary and a r e cons i s t en t with th is view. The a t o m i s t i c mode l of L/icke and St/iwe ~8 sugges t ing that a f lux of i m p u r i t i e s th rough the g ra in boundary zone impedes the mig ra t i on
ve loc i t y does not account for the s e g r e g a t i o n of n i t rogen to the g ra in b o u n d a r i e s be ing r e l a t i v e l y independent of g r a i n boundary mig ra t i on r a t e s .
What would a p p e a r to be more a p p r o p r i a t e is a mode l in which the p r e s e n c e of s e g r e g a t i n g i m p u r i t i e s impede the t r a n s f e r of a t o m s a c r o s s the boundary f rom one c r y s t a l to the o the r . A model of th is s o r t would account for s e g r e g a t i o n - i n d u c e d g r a i n growth inhibi t ion inde- pendent of the r e l a t i v e mob i l i t i e s of so lu te s p e c i e s and g ra in b o u n d a r i e s p rov id ing the mob i l i t y of the solute is suf f ic ient to ma in ta in the l eve l of s e g r e g a t i o n at the g ra in boundary . O r i a n i ~9 has p r o p o s e d a model a long these l ines in which so lu te a t o m s " c a p t u r e d " by an advanc ing g r a i n boundary impede the t r a n s f e r of a t o m s a c r o s s the boundary and mus t be e i t h e r cove red by m a t r i x a t o m s o r d e s o r b e d f rom the boundary to p e r m i t m i g r a t i o n . Nakanish i , e t al 6~ have p r o p o s e d a s i m i l a r m e c h a n i s m by which s e g r e g a n t s at the g r a i n bounda- r i e s impede the t r a n s f e r of a t o m s a c r o s s the boundary and r educe the mig ra t i on r a t e of the g ra in boundary .
The au thor p r o p o s e s that the mode l s advanced by O r i a n i and Nakan i sh i , e t al a r e a p p r o p r i a t e to expla in the r e s u l t s obta ined in th is s tudy. Occupat ion of a f r a c - t ion of s i t e s at the g ra in boundary by i m p u r i t y a t o m s may reduce the e f f ic iency of these s i t e s in t r a n s f e r r i n g a t o m s f rom the g ra in be ing consumed to the growing g ra in . The low concen t ra t ion of n i t rogen at the g ra in b o u n d a r i e s o b s e r v e d in th is s tudy sugges t s , however , that a l a rge number of g ra in bounda ry s i t e s need not be occupied to p roduce s ign i f i can t r e t a r d a t i o n of the g r a i n growth p r o c e s s . Th is l eads us to conclude that the p r i m a r y impedance of a t o m s a c r o s s the boundary can- not be accounted for by c o n s i d e r i n g only the f r a c t i o n a l cove rage of the n i t rogen at the g ra in b o u n d a r i e s s ince a s m a l l f r a c t i o n a l c o v e r a g e can c omple t e ly inhibi t g ra in boundary m i g r a t i o n . Th is would be cons i s t en t with the ex i s t ence of " a c t i v e " s i t e s at the g ra in bounda- r i e s which a r e p a r t i c u l a r l y e f fec t ive in t r a n s f e r r i n g a t o m s f rom one g r a i n to ano the r . Such s i t e s could be equiva lent to (but m o r e complex than) loca t ions such as kink s i t e s on f r ee s u r f a c e s , which have been shown to be heav i ly involved in the growth of c r y s t a l s f rom the v a p o r and l iquid p h a s e s . 61-63 If i m p u r i t y a d s o r p t i o n we re to occur at such " a c t i v e " s i t e s the p r o c e s s of a tom t r a n s f e r f rom the g r a i n be ing consumed to the growing g r a i n could be s ign i f i can t ly r e t a r d e d .
An equa l ly p o s s i b l e and n e a r l y equ iva len t exp lana- t ion is that the s t r u c t u r e of the g ra in boundary may be a f fec ted by i m p u r i t y s e g r e g a t i o n and in th is manne r the e f f ic iency of t r a n s f e r of a t o m s f r o m one g ra in to the next a f fec ted . A change in g r a i n bounda ry s t r u c - tu re would be cons i s t en t with the o b s e r v a t i o n of changes in the s u r f a c e t ens ion of g r a i n bounda r i e s in the p r e - sence of s e g r e g a t e d impur i t ies .6~ 6~ In a r e c e n t r ev iew pape r , S impson , W i n e g a r d and Aus t 16 sugges t ed that the o b s e r v a t i o n of mul t ip le s t a g e s of g ra in growth behav io r in some a l loy s y s t e m s may be due to such a t r a n s i t i o n in g ra in bounda ry s t r u c t u r e .
E i t h e r the a d s o r p t i o n of i m p u r i t i e s at " a c t i v e " s i t e s o r a change in g r a i n bounda ry s t r u c t u r e a f fec t ing the d i s t r i bu t ion of ac t ive s i t e s for the t r a n s f e r of m a t r i x a t o m s a c r o s s a g r a i n bounda ry would be cons i s t en t with the o b s e r v a t i o n of g r a i n growth inhibi t ion at v e r y low l eve l s of so lu te s e g r e g a t i o n .
In addi t ion to the c o r r e l a t i o n be tween n o r m a l g r a i n growth inhib i t ion and the l eve l of n i t rogen s e g r e g a -
METALLURGICAL TRANSACTIONS A VOLUME 10A, AUGUST 1979-1009
l ion observed in this study, it has been seen that an i nc r ea se in the level of boron in solut ion between 950 and 1025~ coincides with s ignif icant g ra in growth in a l l a l loys . It has been seen that this is assoc ia ted with the appearance of both n i t rogen and sulfur at the g ra in boundar i e s . If an act ive s i te were blocked by the ad- sorpt ion of a n i t rogen atom, the appearance of boron at the gra in boundary in concen t ra t ions comparable to that of n i t rogen could r e su l t in the fo rmat ion of a c lose- ly assoc ia ted B-N pa i r which could have a s igni f i - cantly weaker in te rac t ion with the act ive s i tes and in this m a n n e r have an effect on the flux of ma t r ix a toms a c r o s s the boundary . Marchut and MeMahon 31 have observed a very s t rong co - segrega t ion of boron and n i t rogen in f ree sur face segrega t ion of s i m i l a r s i l i con- i ron al loys which r e in fo rce s the poss ib i l i ty of an assoc ia t ion of boron and n i t rogen at g ra in boundar i e s .
Although second phase par t i c le inhibi t ion of g ra in boundary motion does not co r re l a t e with g ra in growth behavior as well as n i t rogen segrega t ion does, there must be some contr ibut ion due to second phase par t i - c les as evidenced by the s t rong cusping of the bounda- r i e s a round the pa r t i c l e s . The mean d i ame te r of the second phase pa r t i c l e s tabulated in Table IV can be seen to be p ropor t iona l to the gra in s ize of the al loy. Since there is a d i rec t r e la t ionsh ip between sma l l g ra in size and a high degree of n i t rogen segregat ion , a p a r a l l e l between sma l l pa r t i c le s ize and n i t rogen segrega t ion may be drawn. This obse rva t ion suggests that the d i s t r ibu t ion of second phase pa r t i c l e s in an al loy is re la ted to the p re sence of n i t rogen in solut ion dur ing the p rec ip i ta t ion of the pa r t i c l e s . Segregat ion to the in te r faces of large second phase pa r t i c l e s has a l ready been repor ted by a n u m b e r of inves t iga to rs inc luding the author.86, 67 Also, there has r ecen t ly been an observa t ion of the effect of oxygen on the s ize d i s - t r ibu t ion of Si:aN4 pa r t i c l e s in high n i t rogen s i l icon i ron a l loys . Rober t s e t al have repor ted a d i r ec t co r re l a t ion between the pa r t i a l p r e s s u r e of oxygen dur ing n i t r id ing and the u l t imate s ize of Si3N4 particles.68 This gives fu r the r support to the idea that n i t rogen segrega t ion may inf luence the s ize d i s t r ibu t ion of second phase pa r t i c l e s in these al loys and ind i rec t ly affect the re la t ive g ra in growth behavior of al loys of d i f ferent composi t ions . The fa i lu re of the pa r t i c l e dens i ty products to co r re l a t e with gra in growth m i n i m i z e s the impor t ance of this cont r i - but ion but the behavior of g ra in growth re la t ive to the d i s t r ibu t ion of pa r t i c l e s in these a l loys s t i l l war - r an t s fu r the r study.
CONCLUSIONS
1) The segrega t ion of n i t rogen to gra in boundar ies is the s t ronges t factor r e l a t ing composi t iona l va r i a b l e s to g ra in growth behavior in b o r o n - s i l i c o n s tee l .
2) Boron segrega t ion to the gra in boundar i e s appears at the same t e m p e r a t u r e as the onset of la rge scale gra in growth in a l l al loys and is cont ro l led by the level of solute boron in equ i l i b r ium with boron n i t r ide . The ma jo r funct ion of boron addi t ions in r e s t r a i n i n g g ra in growth is to r e t a i n n i t rogen in the s tee l to t e m p e r a - t u r e s at which g ra in growth occu r s .
3) The effect of su l fur segrega t ion is to add to or enhance the effect of n i t rogen in inhibi t ing g ra in bound- a ry mig ra t ion . Sulfur was shown to be much less ef-
fect ive than n i t rogen in r e s t r a i n i n g gra in boundary migra t ion .
4) It was suggested but not conclus ively shown that su l fur may act to enhance the degree of g ra in boundary segrega t ion of n i t rogen . Alloys with comparab le n i t ro - gen addit ions showed g rea t e r n i t rogen segrega t ion at 950~ with sulfur addi t ions .
5) The low level of n i t rogen segrega t ion and high mobi l i ty of n i t rogen in the ma t r ix suggests that a mechan i sm of " p o i s o n i n g " act ive s i tes for t r a n s f e r of ma t r ix a toms ac ros s a gra in boundary may explain the gra in growth behavior observed in this study.
6) Second phase pa r t i c l e s although p re sen t in a l l a l loys do not supply the major component of n o r m a l gra in growth inhibi t ion but may supplement the effect of n i t rogen segrega t ion .
ACKNOWLEDGMENTS
This study had as its basis in foundation, the prior work of Drs. H. E. Grenoble and H. C. Fiedler in dis- cover ing the effect of boron, n i t rogen , and su l fur on gra in growth and secondary r e c r y s t a l l i z a t i o n in s i l icon i ron a l loys . In pa r t i cu l a r , the i r s tudies of the effect of va r ious combinat ions of boron n i t rogen and sulfur on n o r m a l gra in growth inhibi t ion and secondary r e - c rys t a l l i za t ion provided not only the insp i ra t ion but samples of the al loys examined in this s tudy. I would p a r t i c u l a r l y like to thank Dr . F i e d l e r for making his extens ive supply of a l loys of d i f ferent composi t ions and heat t r e a t m e n t s f ree ly avai lable for study, and for his s igni f icant contr ibut ion to the development of my unders tand ing of the p roces s ing of i r on -3 pct s i l icon a l loys . I would also like to thank Drs . C. L. Br ian t and F . Bacon, and P r o f e s s o r C. J . McMahon for the i r ava i l - ab i l i ty for many s t imula t ing d i s cus s ions . I would also like to thank Dr . Br ian t for c r i t i ca l ly rev iewing the manusc r ip t and Mrs . Mary Dean for her cheerful and eff icient support in p r epa r ing the m a n u s c r i p t s . Mr . D. N. Wemple a s s i s t ed throughout this study in pro- viding invaluable and capable l abora to ry support . Chemical ana lyses were pe r fo rmed by Mr . R. Hi rs t of Gene ra l E l ec t r i c Co., P i t t s f ie ld , Mass . and by the Chemical Ana lys i s Labora tory , Gene ra l E l e c t r i c Ma te r i a l s and P r o c e s s e s Labora tory , Schenectady, N.Y.
REFERENCES
1. J. E. Burke: Trans. AIME, 1949, vol. 185, p. 315. 2. J. E. May and D. Turnbull: Trans. TMS-AIME, 1958, vol. 212, p. 769. 3. C. G. Dunn and J. L. Walter: Recrystallization, Grain Growth, and Texture,
p. 461, ASM, Metals Park, Ohio, 1966. 4. R. W. Cahn: PhysicalMetallurgy, p. 1181, North-Holland, Amsterdam, 1970. 5. P. Cotterill and P. R. Mould: Recrystallization and Grain Growth in Metals,
J. Wiley and Sons, New York, 1976. 6. Boron-silicon steel wilt refer to iron-3 pct silicon alloys with additions of
boron, nitrogen and sulfur for grain growth inhibition as described in Refs. 7 and 8.
7. H. E. Genoble: U.S. Patent No. 3,905,842, September 16, 1975. 8. H. C. Ftedler: U.S. Patent No. 3,905,843, September 16, 1975. 9. J. E. May and D. Turnbull: J. AppL Phys., 1959, vol. 30, p. 210.
10. S. Taguchi, A. Sakakura, and H. Takashima: U.S. Patent No. 3,287,183, 1966.
11. H. E. Grenoble: IEEE Trans. Magnetics, 1977, vol. 13, p. 1427. 12. H. C. Fiedler: Met. Trans. A, 1977,vol. 8A, p. 1307. 13. H. C. Fiedler: IEEE Trans. Magnetics, 1977, vol. 13, p. 1433. 14. K. T. Aust and J. W. Rutter: Recovery and Recrystallization of Metals, L.
Himmel, ed., p. 171, Interscience, New York, 1963.
1010-VOLUME 10A, AUGUST 1979 METALLURGICAL TRANSACTIONS A
15. T. Saito: Nihon Kinzoku Gakkai-Shi, 1963, vol. 27, p. 186. 16. C. J. Simpson, W. C. Winegard, and K. T. Aust: Grain Boundary Structure
and Properties, G. A. Chadwick and D. A. Smith, eds., p. 201, Academic Press, London, 1976.
17. H. Gleiter and B. Chalmers: "High Angle Grain Boundaries", Progr. Mater. ScL, vol. 16, Pergamon Press, Oxford, 1972.
18. K. Liicke and K. Detert: ActaMet., 1957, vol. 5, p. 628. 19. J. W. Cahn: Acta Met., 1962, vol. I0, p. 789. 20. K. Lficke and H. P. Stfiwe: Recovery and Recrystallization of Metals, L.
Himmel, ed., p. 171, Interscience, New York, 1963. 21. P. Gordon and R. A. Vandermeer: Recrystallization Grain Growth and
Textures, p. 205, ASM, Metals Park, Ohio, 1966. 22. J. L. Walter and E. F. Koch: Acta Met., 1963, vol. 11, p. 923. 23. H. Hu: Recovery and Recrystallization of Metals, L. Himmel, ed., p. 311,
lnterscience, New York, 1963. 24. I. L. Dillamore, P. L. Morris, C. J. E. Smith, and W. B. Hutchinson: Proc.
Roy. Soc. A, 1972, vol. 329A, p. 405. 25. E. Furubayashi: Trans. Iron Steellnst. Jpn., 1969, vol. 9, p. 222. 26. M. Shinozaki, I. Matoba, T. Kan, and T. Gotoh: Trans. Jpn. Inst. Metals,
1978, vol. 19, p. 85. 27. H. C. Fiedler: Unpublished research, General Electric Co., Corporate Re-
search and Development, Schenectady, NY, 1977. 28. Model 590 Scanning Auger Microprobe, Physical Electronics Industries, Inc.,
Eden Prairie, MN 55343. 29. Handbook of Auger Electron Spectroscopy, Physical Electronics Industries,
Inc., Eden Prairie, MN 55343, 1976. 30. F. Pons, J. LeHericy, and J. P. Langeron: Surf Sci., 1977, vol. 69, p. 565. 31. L. Marchut and C. J. McMahon, Jr.: J. Vac. Sci. TechnoL, 1978, vol. 15, p.
450. 32. J. M. Morabita and P. M. Hall: Scanning Electron Microsc., 1976, vol. 9,
p. 221. 33. E. N. Sickafus: J. Vac. Sci. Technol., 1974, vol. 11, p. 299. 34. P. Jolly and C. Goux: Comptes Rendus, 1969, vol. 268C, p. 577. 35. C. Pichard, J. Rieu, and C. Goux: Comptes Rendus, 1975, vol. 280C, p. 633. 36. C. Pichard, M. Guttmann, J. Rieu, and C. Goux: ./. DePhysique, colloque C4,
suppl. 10, p. 151, 1975. 37. R. G. Rowe and C. L. Briant: Proc. 13th Annual Conf. Microbeam Anal.
Soc., p. 71A, June, 1978. 38. D. R. Penn: J. Electron Spectrosc. Rel. Phenom., 1976, vol. 9, p. 29. 39. D. McLean: Grain Boundaries in Metals, Oxford University Press, London,
1957.
40. M. P. Seah and D. Hondros: Proc. Roy. Soc. London, 1973, vol. A335, p. 191.
41. M. Guttmann: Surf ScL, 1975, vol. 53, p. 213. 42. R. W. Fountain and J. Chipman: Trans. TMS-AIME, 1962, vol. 224, p. 599. 43. T. Matsuoka: Trans. Iron Steellnst. Jpn., 1967, vol. 7, p. 19. 44. H. C. Fiedler: Met. Trans. A, 1978, vol. 9A, p. 1489. 45. F. Bacon: Unpublished research, General Electric Co., Corporate Research
and Development, Schenectady, NY, 1977. 46. C. Zener, as communicated by C. S. Smith: Trans. AIME, 1949, vol. 175,
p. 15, 47. M. F. Ashby, J. Harper, and J. Lewis: Trans. TMS-AIME, 1969, vol. 245, p.
413. 48. P. Hellman and M. Hillert: Scand. J. Metall., 1975, vol. 4, p. 211. 49. W. M. Swift: Met. Trans., 1973, vol. 4, p. 841. 50. J. W. Flowers and S. P. Karas: J. Appl. Phys., 1967, vol. 38, p. 1085. 51. R. E. Fryxell, N. Galitzine, and F. S. Gardner: 3". Iron SteelInst., 1958,
vol. 189, p. 327. 52. A. Brown, J. D. Garnish, and R. W. K. Honeycombe: Metals ScL, 1974,
vol. 8, p. 317. 53. H. C. Fiedler: Trans. TMS-AIME, 1969, vol. 245, p. 941. 54. N. G. Ainslie and A. U. Seybolt: Z Iron Steel lnst., 1960, vol. 194, p. 341. 55. J. D. Fast and M. B. Verrijp: J. Iron Steel lnst., 1954, vol. 176, p. 24. 56. H. Hu and B. B. Rath: Met. Trans., 1970, vol. 1, p. 3131. 57. P. E. Busby and C. Wells: Trans. AIME, 1954, vol. 200, p. 972. 58. K. IAicke and H. P. Stiiwe: ActaMet., 1971, vol. 19, p. 1087. 59. R. A. Oriani: Acta Met., 1959, vol. 7, p. 62. 60. W. Kossel: Nachr. Ges. Wiss. Gottingen, 1927, p. I35. 61. N. Cabrera and D. A. Vermilyea: Growth and Perfection of Crystals, R. H.
Doremus, B. W. Roberts, and D. Turnbull, eds., p. 393, J. Wiley and Sons, NY, 1958.
62. F. C. Frank: Growth and Perfection ofOTstals, R. H. Doremus, B. W. Roberts, and D. Turnbutl, eds., p. 411, J. Wiley and Sons, NY, 1958.
63. E. D. Hondros: Proc. Roy. Soc., 1965, vol. 286A, p. 479. 64. E. D. Hondros and L. E. H. Stuart: Phil. Mag., 1968, vol. 17, p. 71 I. 65. R. G. Rowe, C. L. Briant, and F. Bacon: Proc. 8th lnt. Conf. on X-Ray
Optics andMicroanalysis, 1977, in press. 66. W. C. Johnson and H. B. Smartt: Met. Trans. A, 1977, vol. 8A, p. 553. 67. W. Roberts, P. Grieveson, and K. H. Jack: Proc. Int. Symp. Metall. Chem.-
Appl. FerrousMetall., p. 384, Iron and Steel Inst., London, 1973. 68. K. Nakanishi, Y. Sakamoto, K. Tsuruoka, andM. Imai: ActaMet., 1972,
vol. 20, p. 669.
M E T A L L U R G I C A L TRANSACTIONS A VOLUME IOA, AUGUST t 9 7 9 - 1 0 1 ~