gold fields iar 2016 final 28 march · about gold fields gold fields limited is a globally...
TRANSCRIPT
A YEAR OF GROWTH
ANNUALREPORT
2016
INTEGRATED
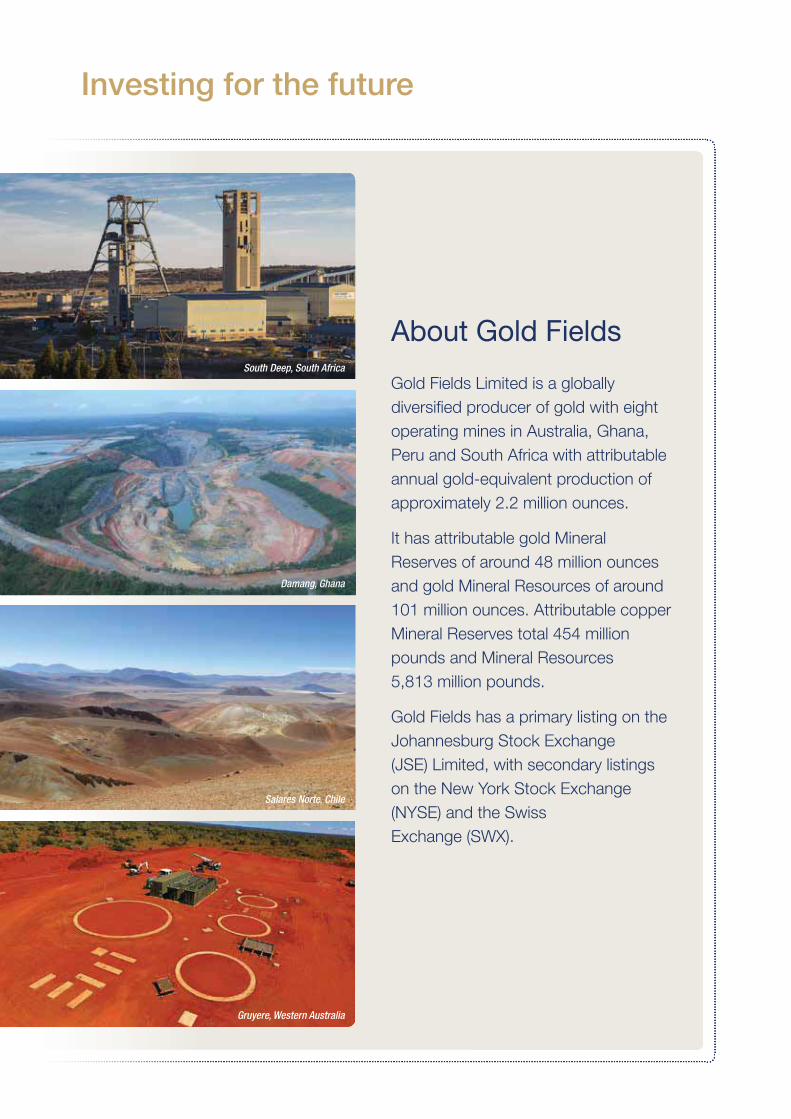
About Gold Fields
Gold Fields Limited is a globally
diversified producer of gold with eight
operating mines in Australia, Ghana,
Peru and South Africa with attributable
annual gold-equivalent production of
approximately 2.2 million ounces.
It has attributable gold Mineral
Reserves of around 48 million ounces
and gold Mineral Resources of around
101 million ounces. Attributable copper
Mineral Reserves total 454 million
pounds and Mineral Resources
5,813 million pounds.
Gold Fields has a primary listing on the
Johannesburg Stock Exchange
(JSE) Limited, with secondary listings
on the New York Stock Exchange
(NYSE) and the Swiss
Exchange (SWX).
Investing for the future
South Deep, South Africa
Damang, Ghana
Salares Norte, Chile
Gruyere, Western Australia
Contents
LEADERSHIP, GOVERNANCE AND MATERIALITYVision of the Chairperson 18
CEO Report 20
CEO Analysis 34
Summarised Governance Report 36
Risks and Materiality 41
2
FINANCIAL FOCUSIntroduction 48
Summarised Financials 49
Strategic Focus Areas 52
37
ANNEXURE – ASSURANCEFirst Party: Internal Audit Statement 122
Independent Assurance Provider’s Report on Selected Information 123
Key Sustainability Performance Data 126
Administration and Corporate Information IBC
1OUR BUSINESSAbout This Report 2
Gold Fields on a Page 4
Global Footprint 6
Our Operating Context 8
Value Creation and Distribution 10
Outcomes 12
LICENCE TO OPERATEIntroduction 86
Strategic Focus Areas 885
PEOPLEIntroduction 110
Strategic Focus Areas 111
Summarised Remuneration Report 115
6
BUSINESS OPTIMISATIONIntroduction 56
Group Regional Performance – Overview 58
Strategic Focus Areas 62
4
This report contains forward looking statements within the meaning of section 27A of the
U.S. Securities Act of 1933, as amended, or the Securities Act, and section 21E of the
U.S. Securities Exchange Act of 1934, as amended, or the Exchange Act, with respect
to Gold Fields’ financial condition, results of operations, business strategies, operating
efficiencies, competitive position, growth opportunities for existing services, plans and
objectives of management, markets for stock and other matters. Refer to the full forward
looking statements on www.goldfields.com
Forward looking statement
Cover image: Invincible open pit mine at St Ives in Australia
Our
busi
ness
The Gold Fields Integrated Annual Report 20161
About This Report
The aim of our integrated reporting approach is to enable
our stakeholders, including investors, to make a more
informed assessment of the value of Gold Fields and
its prospects. This Integrated Annual Report (IAR) is
structured around our Balanced Scorecard, which is how
we measure our performance against our strategy and
the matters we consider to be most material to the
sustainability of our Group.
The IAR also forms part of our Communication on Progress to the United Nations Global Compact. A summary of
our adherence to the Global Reporting Initiative (GRI), the 10 Principles of the United Nations Global Compact and
the 10 Principles of the International Council on Mining & Metals (ICMM) and the mandatory requirements of its
position statements are presented online.
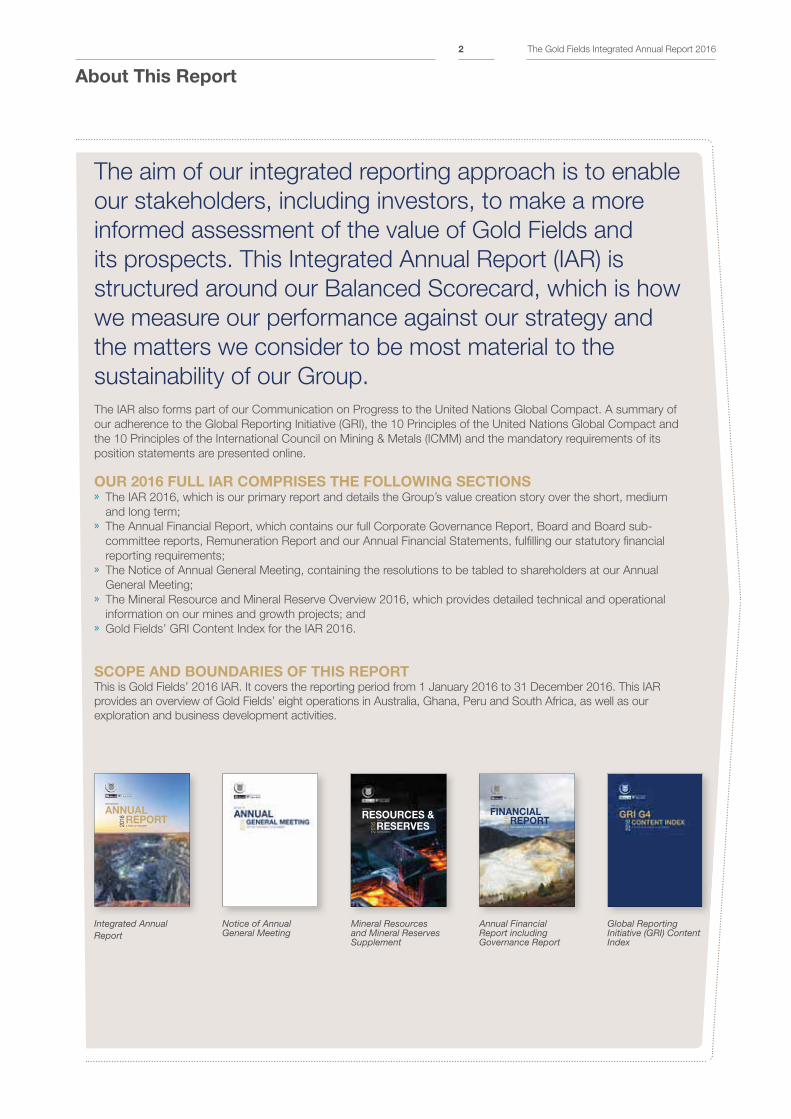
OUR 2016 FULL IAR COMPRISES THE FOLLOWING SECTIONS » The IAR 2016, which is our primary report and details the Group’s value creation story over the short, medium
and long term; » The Annual Financial Report, which contains our full Corporate Governance Report, Board and Board sub-
committee reports, Remuneration Report and our Annual Financial Statements, fulfilling our statutory financial
reporting requirements; » The Notice of Annual General Meeting, containing the resolutions to be tabled to shareholders at our Annual
General Meeting; » The Mineral Resource and Mineral Reserve Overview 2016, which provides detailed technical and operational
information on our mines and growth projects; and » Gold Fields’ GRI Content Index for the IAR 2016.
SCOPE AND BOUNDARIES OF THIS REPORTThis is Gold Fields’ 2016 IAR. It covers the reporting period from 1 January 2016 to 31 December 2016. This IAR
provides an overview of Gold Fields’ eight operations in Australia, Ghana, Peru and South Africa, as well as our
exploration and business development activities.
Integrated Annual Report
Notice of Annual General Meeting
Mineral Resources and Mineral Reserves Supplement
Annual Financial Report including Governance Report
Global Reporting Initiative (GRI) Content Index
A YEAR OF GROWTH
ANNUALREPORT
2016
INTEGRATED
SUPPLEMENT
RESOURCES &RESERVES20
16
MINERAL
MINERAL
INCLUDING GOVERNANCE REPORT
FINANCIALREPORT
2016
ANNUAL
The Gold Fields Integrated Annual Report 20162
Details on the exact location of each
operation and project can be found
on p6.
We use an integrated approach
to reporting that examines our
operational, financial and
sustainability performance. All
non-financial data for 2013 excludes
the Yilgarn South assets we acquired
that year, unless otherwise indicated.
Furthermore, all 2012 data, where
stated, covers only the continued
operations of Gold Fields, i.e. they
exclude the contributions from the
Sibanye Gold assets, which were
unbundled from Gold Fields in
February 2013. Non-financial data
for 2016 only covers our eight
operating mines and excludes
exploration activities and projects.
This report has been compiled in
accordance with the GRI’s G4
Guidelines and the International
Integrated Reporting Council
Framework. Gold Fields also
references a broad range of
additional codes, frameworks and
standards in compiling the report,
the full list of which can be found in
the Annual Financial Report. We
consider that this IAR, together with
additional documents held online,
complies with the requirements of
the GRI G4 Core Reporting
Guidelines.
Average exchange rates for 2016 of
R14.70/US$1 and US$0.75/A$1
have been used in this report. For
2017, forecast exchange rates
of R14.14/US$1 and US$0.73/A$1
have been used.
ICMM SUBJECT MATTERSGold Fields has complied with the
ICMM Sustainable Development
Framework, Principles, Position
Statements and Reporting
Requirements (see p125 for
the assurance hereof).
Our compliance with the ICMM is
addressed throughout this report
and on our website. This detail
covers: » The alignment of our sustainable
development policies against the
10 principles and mandatory
position statements » The process for identifying specific
sustainable development risks and
opportunities » The existence and implementation
of systems and approaches for
managing sustainable
development risks and
opportunities » Gold Fields’ performance across a
selection of identified material
sustainable development risks and
opportunities » Our disclosures in accordance with
the GRI G4 core option and its
related Mining and Metals
supplement can be found at
www.goldfields.com>sustainability
ASSURANCEKPMG has provided independent
reasonable assurance over selected
sustainability information in this
report, which is prepared in
accordance with the GRI G4
guidelines. As a member of the
ICMM we are committed to obtaining
assurance in line with the ICMM
Sustainable Development
Framework: Assurance Procedure.
KPMG has provided assurance over
our statement on compliance with
the ICMM Sustainable Development
Framework, Principles and Reporting
Requirements. The key sustainability
performance data for assurance by
KPMG in 2016 can be found on
p120 – 128.
BOARD APPROVALThe Gold Fields’ Board of Directors
acknowledges its responsibility to
ensure the integrity of this IAR and
has applied its collective mind
throughout the preparation of this
report. The Board believes that the
integrated report is presented in
compliance with the International
Integrated Reporting Framework.
Furthermore, the Board considers
that this IAR complies in all material
respects with the relevant statutory
requirements of the various
regulations governing disclosure and
reporting by Gold Fields and that the
annual financial statements comply in
all material respects with the South
African Companies Act No 71 of
2008, as amended, as well as with
the International Financial Reporting
Standards.
As such, the Board unanimously
approves the content of the IAR
2016, including the Annual Financial
Report 2016 and authorised its
release on 20 March 2017.
Cheryl Carolus
Chairperson of the Board
20 March 2017
@GoldFields_LTDSend us your feedbackTo ensure that we report on issues
that matter to our stakeholders please
provide any feedback and questions to:
[email protected] or visit
www.goldfields.com to download the
feedback form.www.goldfields.com
http://www.linkedin.com/
company/gold-fields-ltd-
?trk=top-nav-home
Our
busi
ness
The Gold Fields Integrated Annual Report 20163
Gold Fields on a Page
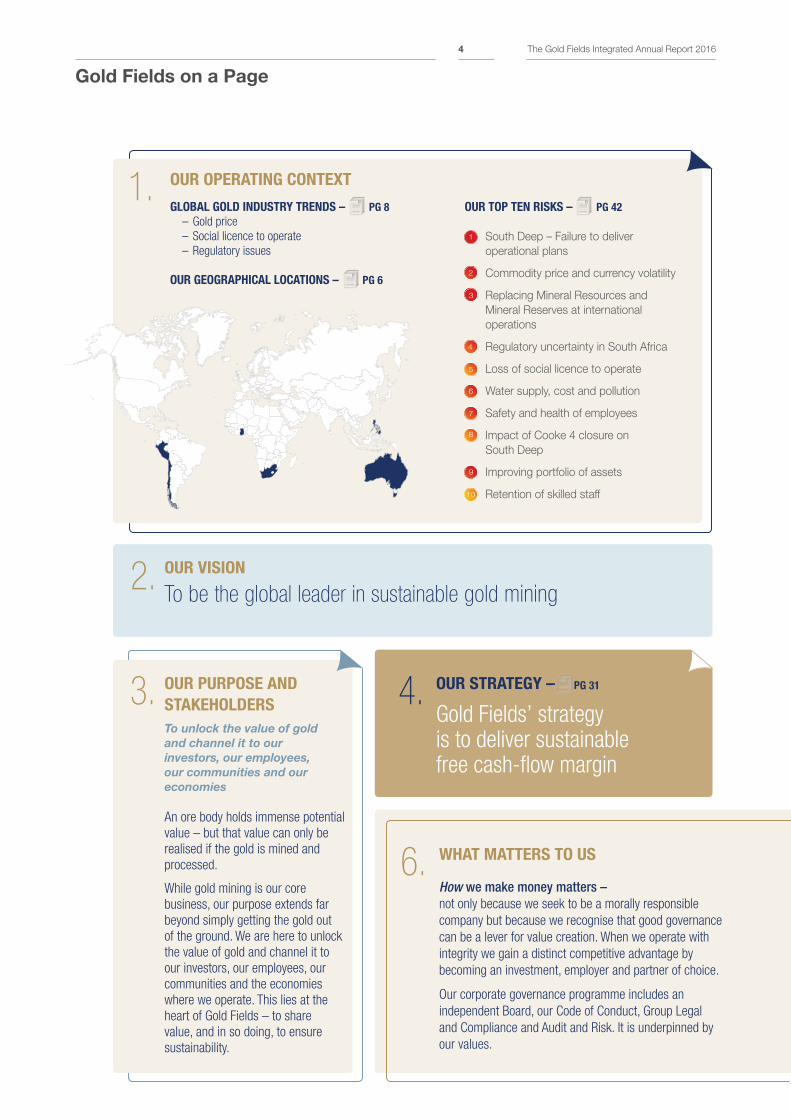
1. OUR OPERATING CONTEXT
GLOBAL GOLD INDUSTRY TRENDS – PG 8
– Gold price
– Social licence to operate
– Regulatory issues
OUR GEOGRAPHICAL LOCATIONS – PG 6
OUR TOP TEN RISKS – PG 42
South Deep – Failure to deliver
operational plans
Commodity price and currency volatility
Replacing Mineral Resources and
Mineral Reserves at international
operations
Regulatory uncertainty in South Africa
Loss of social licence to operate
Water supply, cost and pollution
Safety and health of employees
Impact of Cooke 4 closure on
South Deep
Improving portfolio of assets
Retention of skilled staff
1
2
3
4
5
6
7
8
9
10
3. OUR PURPOSE AND
STAKEHOLDERS
To unlock the value of gold
and channel it to our
investors, our employees,
our communities and our
economies
6. WHAT MATTERS TO US
How we make money matters –
not only because we seek to be a morally responsible
company but because we recognise that good governance
can be a lever for value creation. When we operate with
integrity we gain a distinct competitive advantage by
becoming an investment, employer and partner of choice.
Our corporate governance programme includes an
independent Board, our Code of Conduct, Group Legal
and Compliance and Audit and Risk. It is underpinned by
our values.
An ore body holds immense potential
value – but that value can only be
realised if the gold is mined and
processed.
While gold mining is our core
business, our purpose extends far
beyond simply getting the gold out
of the ground. We are here to unlock
the value of gold and channel it to
our investors, our employees, our
communities and the economies
where we operate. This lies at the
heart of Gold Fields – to share
value, and in so doing, to ensure
sustainability.
2. OUR VISION
To be the global leader in sustainable gold mining
4. OUR STRATEGY –
Gold Fields’ strategy is to deliver sustainable free cash-flow margin
PG 31––– PPP
The Gold Fields Integrated Annual Report 20164
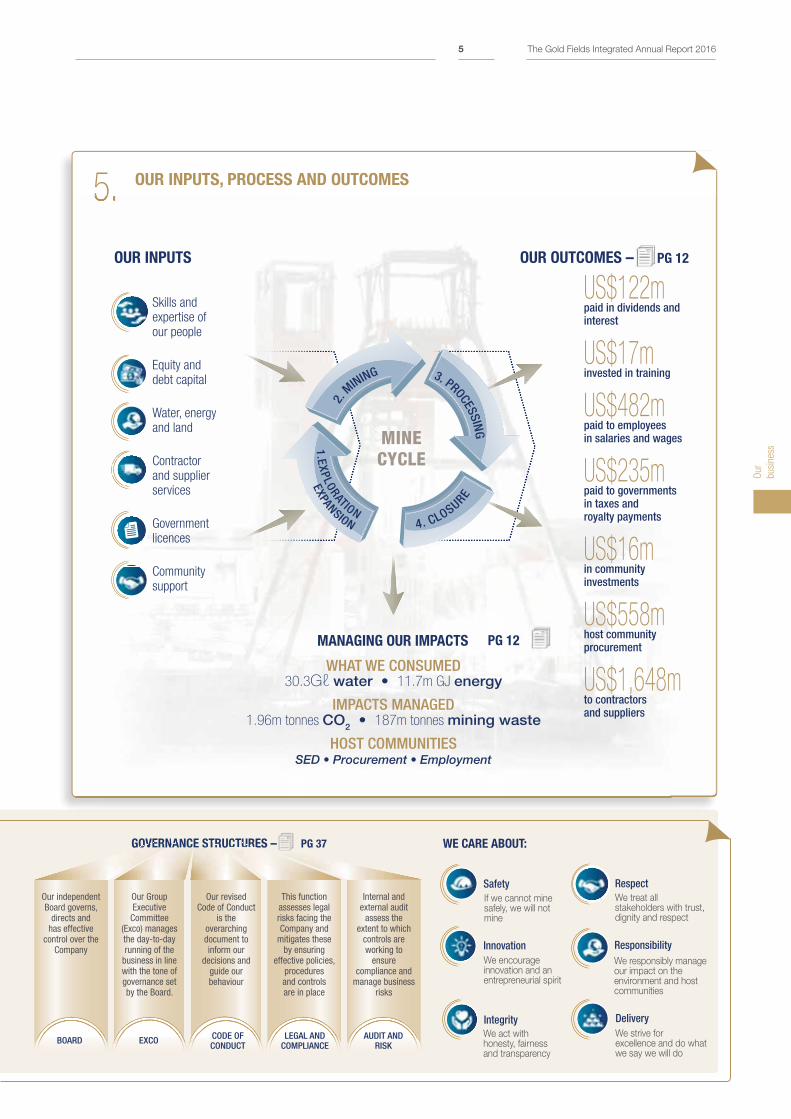
WE CARE ABOUT:
ResponsibilityWe responsibly manage our impact on the environment and host communities
InnovationWe encourage innovation and an entrepreneurial spirit
5. OUR INPUTS, PROCESS AND OUTCOMES
US$122mpaid in dividends and interest
US$17minvested in training
US$482mpaid to employees in salaries and wages
US$235mpaid to governments in taxes and royalty payments
US$16min community investments
US$558mhost community procurement
US$1,648mto contractors and suppliers
OUR OUTCOMES – PG 12
MANAGING OUR IMPACTS PG 12
WHAT WE CONSUMED30.3Gℓ water • 11.7m GJ energy
IMPACTS MANAGED1.96m tonnes CO2 • 187m tonnes mining waste
HOST COMMUNITIES SED • Procurement • Employment
OUR INPUTS
Skills and expertise of our people
• Equity and debt capital
• Water, energy and land
• Contractor and supplier services
• Government licences
• Community support
DeliveryWe strive for excellence and do what we say we will do
IntegrityWe act with honesty, fairness and transparency
RespectWe treat all stakeholders with trust, dignity and respect
SafetyIf we cannot mine safely, we will not mine
GOVERNANCE STRUCTURES – PG 37OOOGOOO EVEVEVVVERNRNRNR ANNNNNNNANANANAAAANCECCCCC RUCUCUCCUCCCTTUTUTUTUTUTURRRRRREEEEEEE SSSSSTTRTRTRTRTRTR
Our independent Board governs,
directs and has effective
control over the Company
Our revised Code of Conduct
is the overarching document to inform our
decisions and guide our behaviour
This function assesses legal risks facing the Company and
mitigates these by ensuring
effective policies, procedures and controls are in place
Internal and external audit
assess the extent to which
controls are working to
ensure compliance and
manage business risks
Our Group Executive
Committee (Exco) manages the day-to-day running of the
business in line with the tone of governance set by the Board.
EXCO CODE OF CONDUCT
LEGAL AND COMPLIANCE
AUDIT AND RISK
BOARD
EXPANSION
MINECYCLE
1 .EXPLORATION 4. CLOSURE
2. M
INING 3. PROCESSING
Our
busi
ness
The Gold Fields Integrated Annual Report 20165
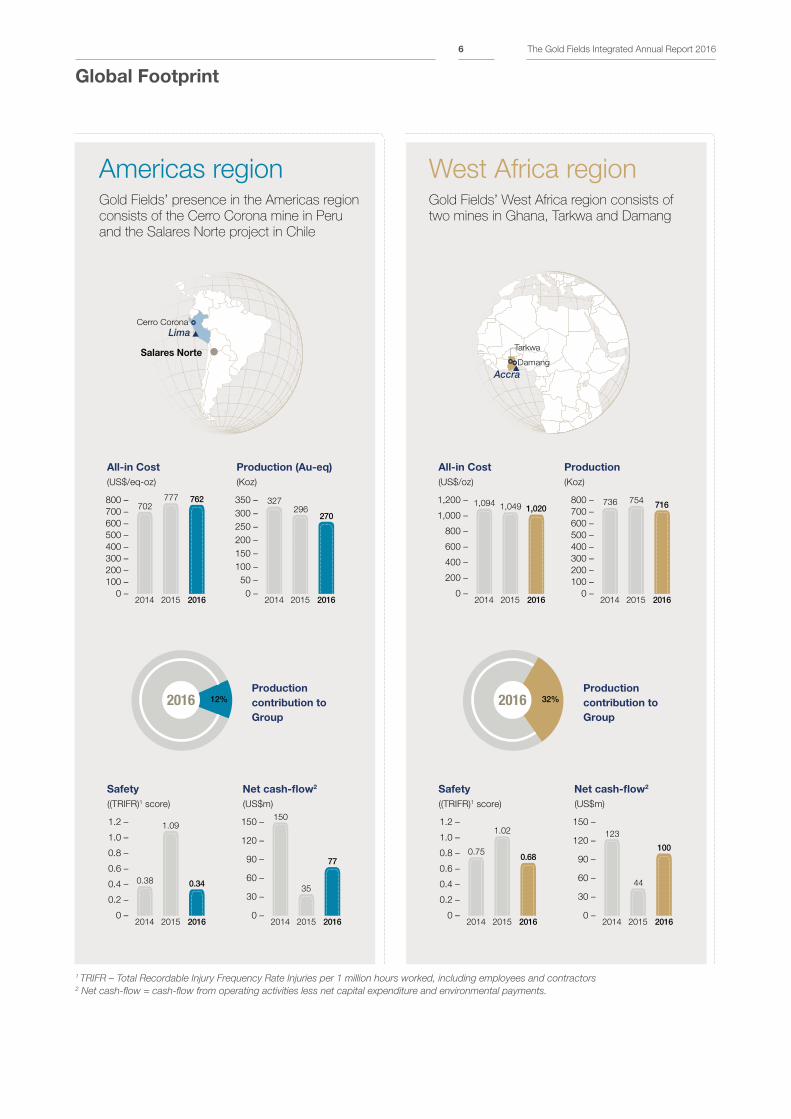
Global Footprint
1 TRIFR – Total Recordable Injury Frequency Rate Injuries per 1 million hours worked, including employees and contractors2 Net cash-flow = cash-flow from operating activities less net capital expenditure and environmental payments.
800 –
700 –
600 –
500 –
400 –
300 –
200 –
100 –
0 –20152014 2016
754736 716
Production
(Koz)
West Africa regionGold Fields’ West Africa region consists of
two mines in Ghana, Tarkwa and Damang
Salares Norte
LimaCerro Corona
Accra
Tarkwa
Damang
Production (Au-eq)
(Koz)
350 –
300 –
250 –
200 –
150 –
100 –
50 –
0 –20152014 2016
296327
270
Gold Fields’ presence in the Americas region
consists of the Cerro Corona mine in Peru
and the Salares Norte project in Chile
Americas region
All-in Cost
(US$/eq-oz)
800 –
700 –
600 –
500 –
400 –
300 –
200 –
100 –
0 –20152014 2016
777702
762
2016Production
contribution to
Group
12%
1,200 –
1,000 –
800 –
600 –
400 –
200 –
0 –20152014 2016
1,0491,0941,020
All-in Cost
(US$/oz)
2016Production
contribution to
Group
32%
Safety
((TRIFR)1 score)
1.2 –
1.0 –
0.8 –
0.6 –
0.4 –
0.2 –
0 –20152014 2016
1.09
0.38 0.34
Net cash-flow2
(US$m)
150 –
120 –
90 –
60 –
30 –
0 –20152014 2016
35
150
77
Safety
((TRIFR)1 score)
1.2 –
1.0 –
0.8 –
0.6 –
0.4 –
0.2 –
0 –
1.02
20152014 2016
0.750.68
Net cash-flow2
(US$m)
150 –
120 –
90 –
60 –
30 –
0 –20152014 2016
44
123
100
The Gold Fields Integrated Annual Report 20166

1,200 –
1,000 –
800 –
600 –
400 –
200 –
0 –20152014 2016
9881,031942
Production
(Koz)
Australia regionThe Australia region consists of four mines –
Agnew, Darlot, Granny Smith and St Ives – the
Gruyere project and the Far Southeast project
in the Philippines
South Africa regionThe South Deep mine, which is still in a
ramp-up phase, is the only operating asset
in the South Africa region
300 –
250 –
200 –
150 –
100 –
50 –
0 –
198
290
20152014 2016
201
Production
(Koz)
Key
Mines
Corporate office
Regional offices
JohannesburgSouth Deep
Projects Status
Gruyere (Australia) In development
Far Southeast (Philippines) Scoping study
Salares Norte (Chile) Pre-feasibility
Arctic Platinum project (Finland) For disposal
1,200 –
1,000 –
800 –
600 –
400 –
200 –
0 –20152014 2016
9121,015
941
All-in Cost
(US$/oz)
2016Production
contribution to
Group
43%
2,000 –
1,500 –
1,000 –
500 –
0 –
1,559
1,234
20152014 2016
1,732
All-in Cost
(US$/oz)
2016Production
contribution to
Group
13%
Safety
((TRIFR)1 score)
20 –
15 –
10 –
5 –
0 –20152014 2016
16.2717.04
9.43
Net cash-flow2
(US$m)
300 –
250 –
200 –
150 –
100 –
50 –
0 –20152014 2016
255
218
256
Net cash-flow2
(US$m)
20 –
0 –
(20) –
(40) –
(60) –
(80) –
(100) –
(120) –20152014 2016
(80)
(116)
12
Safety
((TRIFR)1 score)
5 –
4 –
3 –
2 –
1 –
0 –20152014 2016
2.91
4.65
2.42
Far Southeast
PerthSt Ives
Granny Smith
DarlotAgnew
Gruyere
Our
busi
ness
The Gold Fields Integrated Annual Report 20167
Gold demand and supply/gold price
(Moz)
200 –
150 –
100 –
50 –
0 –
– 2,000
– 1,750
– 1,500
– 1,250
– 1,0002010 2011 2012 2013 2014 2015
Demand Supply Average annual gold price (rhs)
2016
135
152146 150 146 144 139 138 143 137 140 137
147139
(US$/oz)
Total mine supply
(Moz)
150 –
100 –
50 –
0 –2010 2011 2012 2013 2014 2015 2016
92 9499 101 104 104
88
OU
R R
ISK
S
A – Failure to deliver operational and ramp-up plan
B – Geotechnical risk
C – Labour relations
D – Infrastructure management
South Deep
1
Commodity
prices and currency
volatility
2
Replacing Mineral
Resources and Mineral
Reserves at international
operations
11111111111111 22222222222222
Regulatory
uncertainty/
Mining Charter in
South Africa
3 4
Gold Fields is subject to external strategic dynamics that inform decision-
making, and influence our business performance. Analysis of three key
strategic issues – and how Gold Fields is responding to them – is set
out below.
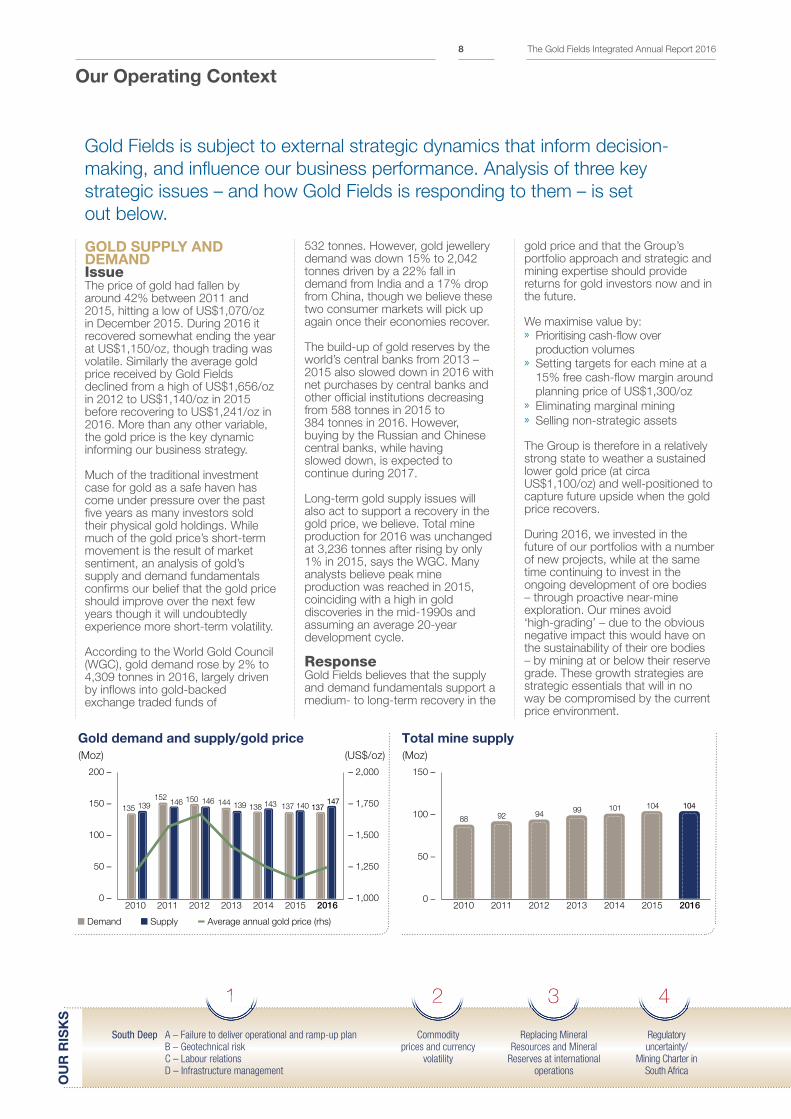
GOLD SUPPLY AND DEMANDIssueThe price of gold had fallen by around 42% between 2011 and 2015, hitting a low of US$1,070/oz in December 2015. During 2016 it recovered somewhat ending the year at US$1,150/oz, though trading was volatile. Similarly the average gold price received by Gold Fields declined from a high of US$1,656/oz in 2012 to US$1,140/oz in 2015 before recovering to US$1,241/oz in 2016. More than any other variable, the gold price is the key dynamic informing our business strategy.
Much of the traditional investment case for gold as a safe haven has come under pressure over the past five years as many investors sold their physical gold holdings. While much of the gold price’s short-term movement is the result of market sentiment, an analysis of gold’s supply and demand fundamentals confirms our belief that the gold price should improve over the next few years though it will undoubtedly experience more short-term volatility.
According to the World Gold Council (WGC), gold demand rose by 2% to 4,309 tonnes in 2016, largely driven by inflows into gold-backed exchange traded funds of
532 tonnes. However, gold jewellery demand was down 15% to 2,042 tonnes driven by a 22% fall in demand from India and a 17% drop from China, though we believe these two consumer markets will pick up again once their economies recover.
The build-up of gold reserves by the world’s central banks from 2013 – 2015 also slowed down in 2016 with net purchases by central banks and other official institutions decreasing from 588 tonnes in 2015 to 384 tonnes in 2016. However, buying by the Russian and Chinese central banks, while having slowed down, is expected to continue during 2017.
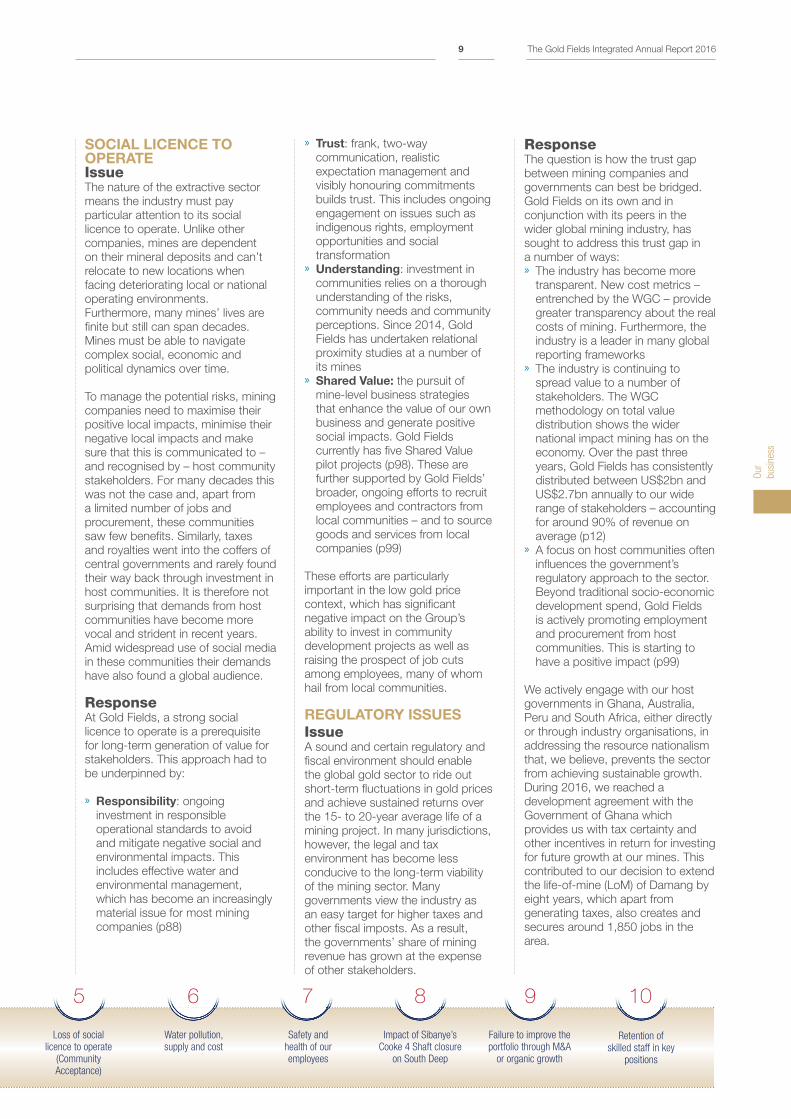
Long-term gold supply issues will also act to support a recovery in the gold price, we believe. Total mine production for 2016 was unchanged at 3,236 tonnes after rising by only 1% in 2015, says the WGC. Many analysts believe peak mine production was reached in 2015, coinciding with a high in gold discoveries in the mid-1990s and assuming an average 20-year development cycle.
ResponseGold Fields believes that the supply and demand fundamentals support a medium- to long-term recovery in the
gold price and that the Group’s portfolio approach and strategic and mining expertise should provide returns for gold investors now and in the future.
We maximise value by: » Prioritising cash-flow over
production volumes » Setting targets for each mine at a
15% free cash-flow margin around
planning price of US$1,300/oz » Eliminating marginal mining » Selling non-strategic assets
The Group is therefore in a relatively strong state to weather a sustained lower gold price (at circa US$1,100/oz) and well-positioned to capture future upside when the gold price recovers.
During 2016, we invested in the future of our portfolios with a number of new projects, while at the same time continuing to invest in the ongoing development of ore bodies – through proactive near-mine exploration. Our mines avoid ‘high-grading’ – due to the obvious negative impact this would have on the sustainability of their ore bodies – by mining at or below their reserve grade. These growth strategies are strategic essentials that will in no way be compromised by the current price environment.
Our Operating Context
The Gold Fields Integrated Annual Report 20168
Failure to improve the
portfolio through M&A
or organic growth
Retention of
skilled staff in key
positions
Loss of social
licence to operate
(Community
Acceptance)
Safety and
health of our
employees
Impact of Sibanye’s
Cooke 4 Shaft closure
on South Deep
Water pollution,
supply and cost
6 7 8 9 105
SOCIAL LICENCE TO OPERATEIssueThe nature of the extractive sector
means the industry must pay
particular attention to its social
licence to operate. Unlike other
companies, mines are dependent
on their mineral deposits and can’t
relocate to new locations when
facing deteriorating local or national
operating environments.
Furthermore, many mines’ lives are
finite but still can span decades.
Mines must be able to navigate
complex social, economic and
political dynamics over time.
To manage the potential risks, mining
companies need to maximise their
positive local impacts, minimise their
negative local impacts and make
sure that this is communicated to –
and recognised by – host community
stakeholders. For many decades this
was not the case and, apart from
a limited number of jobs and
procurement, these communities
saw few benefits. Similarly, taxes
and royalties went into the coffers of
central governments and rarely found
their way back through investment in
host communities. It is therefore not
surprising that demands from host
communities have become more
vocal and strident in recent years.
Amid widespread use of social media
in these communities their demands
have also found a global audience.
ResponseAt Gold Fields, a strong social
licence to operate is a prerequisite
for long-term generation of value for
stakeholders. This approach had to
be underpinned by:
» Responsibility: ongoing
investment in responsible
operational standards to avoid
and mitigate negative social and
environmental impacts. This
includes effective water and
environmental management,
which has become an increasingly
material issue for most mining
companies (p88)
» Trust: frank, two-way
communication, realistic
expectation management and
visibly honouring commitments
builds trust. This includes ongoing
engagement on issues such as
indigenous rights, employment
opportunities and social
transformation » Understanding: investment in
communities relies on a thorough
understanding of the risks,
community needs and community
perceptions. Since 2014, Gold
Fields has undertaken relational
proximity studies at a number of
its mines » Shared Value: the pursuit of
mine-level business strategies
that enhance the value of our own
business and generate positive
social impacts. Gold Fields
currently has five Shared Value
pilot projects (p98). These are
further supported by Gold Fields’
broader, ongoing efforts to recruit
employees and contractors from
local communities – and to source
goods and services from local
companies (p99)
These efforts are particularly
important in the low gold price
context, which has significant
negative impact on the Group’s
ability to invest in community
development projects as well as
raising the prospect of job cuts
among employees, many of whom
hail from local communities.
REGULATORY ISSUES
IssueA sound and certain regulatory and
fiscal environment should enable
the global gold sector to ride out
short-term fluctuations in gold prices
and achieve sustained returns over
the 15- to 20-year average life of a
mining project. In many jurisdictions,
however, the legal and tax
environment has become less
conducive to the long-term viability
of the mining sector. Many
governments view the industry as
an easy target for higher taxes and
other fiscal imposts. As a result,
the governments’ share of mining
revenue has grown at the expense
of other stakeholders.
ResponseThe question is how the trust gap
between mining companies and
governments can best be bridged.
Gold Fields on its own and in
conjunction with its peers in the
wider global mining industry, has
sought to address this trust gap in
a number of ways: » The industry has become more
transparent. New cost metrics –
entrenched by the WGC – provide
greater transparency about the real
costs of mining. Furthermore, the
industry is a leader in many global
reporting frameworks » The industry is continuing to
spread value to a number of
stakeholders. The WGC
methodology on total value
distribution shows the wider
national impact mining has on the
economy. Over the past three
years, Gold Fields has consistently
distributed between US$2bn and
US$2.7bn annually to our wide
range of stakeholders – accounting
for around 90% of revenue on
average (p12) » A focus on host communities often
influences the government’s
regulatory approach to the sector.
Beyond traditional socio-economic
development spend, Gold Fields
is actively promoting employment
and procurement from host
communities. This is starting to
have a positive impact (p99)
We actively engage with our host
governments in Ghana, Australia,
Peru and South Africa, either directly
or through industry organisations, in
addressing the resource nationalism
that, we believe, prevents the sector
from achieving sustainable growth.
During 2016, we reached a
development agreement with the
Government of Ghana which
provides us with tax certainty and
other incentives in return for investing
for future growth at our mines. This
contributed to our decision to extend
the life-of-mine (LoM) of Damang by
eight years, which apart from
generating taxes, also creates and
secures around 1,850 jobs in the
area.
Our
busi
ness
The Gold Fields Integrated Annual Report 20169
Value Creation and Distribution
With the three fundamentals in place our regulatory and business risks are reduced, our reputation is
enhanced and our investment, partner and employee value propositions are strengthened.
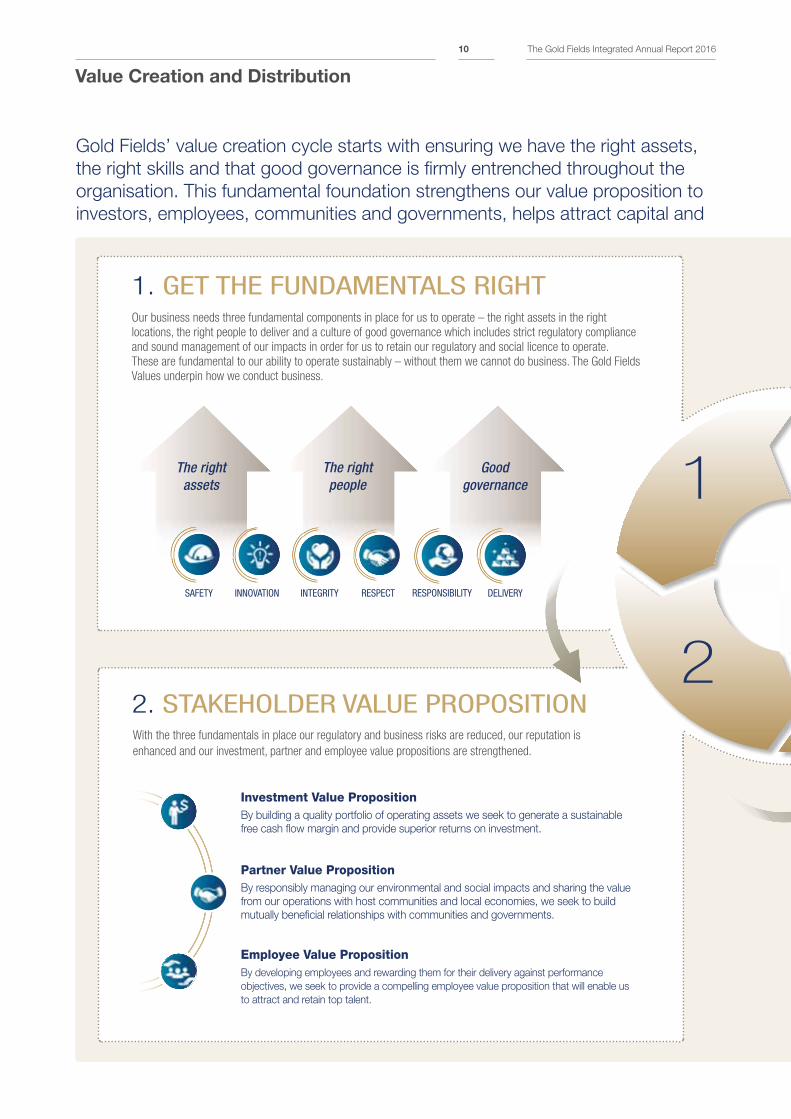
2. STAKEHOLDER VALUE PROPOSITION
Our business needs three fundamental components in place for us to operate – the right assets in the right
locations, the right people to deliver and a culture of good governance which includes strict regulatory compliance
and sound management of our impacts in order for us to retain our regulatory and social licence to operate.
These are fundamental to our ability to operate sustainably – without them we cannot do business. The Gold Fields
Values underpin how we conduct business.
1. GET THE FUNDAMENTALS RIGHT
RESPONSIBILITYSAFETY INNOVATION INTEGRITY DELIVERYRESPECT
The right assets
The rightpeople
Good governance
Gold Fields’ value creation cycle starts with ensuring we have the right assets,
the right skills and that good governance is firmly entrenched throughout the
organisation. This fundamental foundation strengthens our value proposition to
investors, employees, communities and governments, helps attract capital and
2
1
Investment Value PropositionBy building a quality portfolio of operating assets we seek to generate a sustainable
free cash flow margin and provide superior returns on investment.
Partner Value PropositionBy responsibly managing our environmental and social impacts and sharing the value
from our operations with host communities and local economies, we seek to build
mutually beneficial relationships with communities and governments.
Employee Value PropositionBy developing employees and rewarding them for their delivery against performance
objectives, we seek to provide a compelling employee value proposition that will enable us
to attract and retain top talent.
The Gold Fields Integrated Annual Report 201610
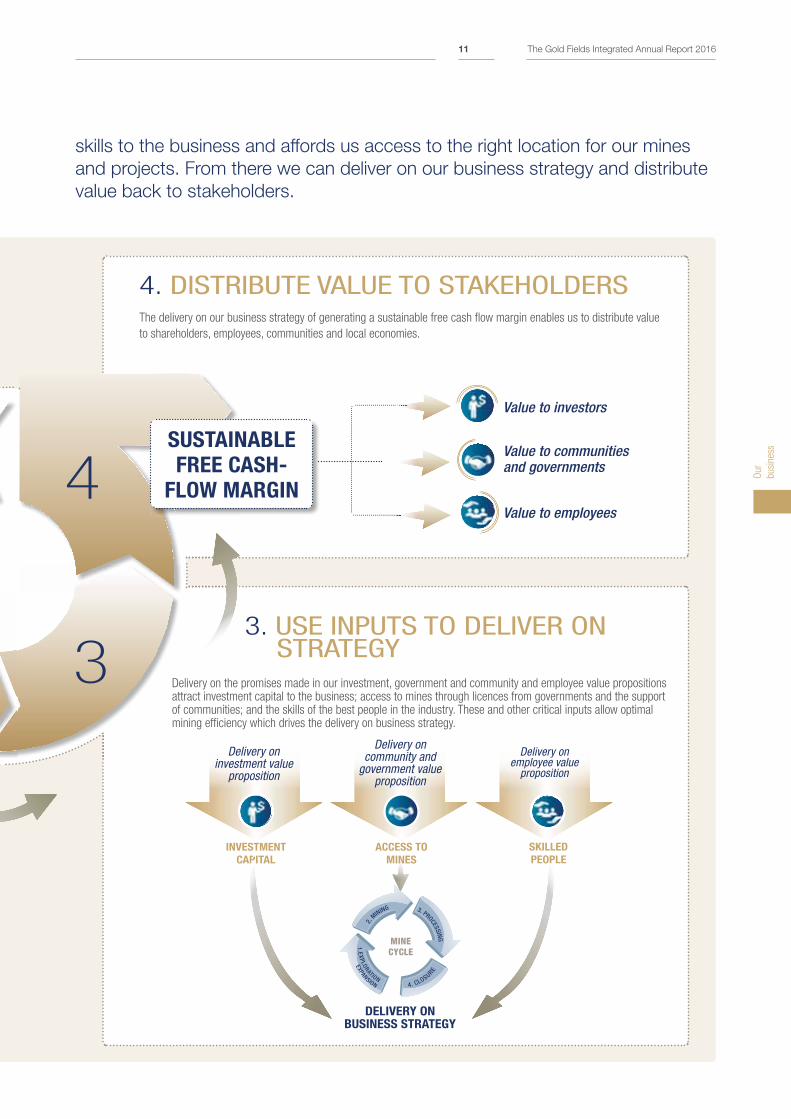
4. DISTRIBUTE VALUE TO STAKEHOLDERSThe delivery on our business strategy of generating a sustainable free cash flow margin enables us to distribute value
to shareholders, employees, communities and local economies.
skills to the business and affords us access to the right location for our mines
and projects. From there we can deliver on our business strategy and distribute
value back to stakeholders.
3
4
3. USE INPUTS TO DELIVER ON STRATEGY
Delivery on the promises made in our investment, government and community and employee value propositions attract investment capital to the business; access to mines through licences from governments and the support of communities; and the skills of the best people in the industry. These and other critical inputs allow optimal mining efficiency which drives the delivery on business strategy.
SUSTAINABLE
FREE CASH-
FLOW MARGIN
Value to investors
Value to employees
Value to communities and governments
INVESTMENT
CAPITAL
DELIVERY ON BUSINESS STRATEGY
ACCESS TO
MINESPP
Delivery on employee value
proposition
SKILLED
PEOPLE
Delivery on community and
government value proposition
Delivery on investment value
proposition
EXPANSION
MINECYCLE
1 .EXPLORATION 4. CLOSURE
2. M
INING 3. PROCESSING
Our
busi
ness
The Gold Fields Integrated Annual Report 201611
Outcomes
Results, Scorecard and Impacts
Gold Fields generates significant value for all the societies in which it
operates – some of which can be quantified and others not. The most
important means by which Gold Fields generates quantifiable value are
outlined below:
Americas 35 147 40 9 3 234
Australia 99 720 138 0.3 0 958
South Africa 2¹ 197 153 42 5 361
West Africa 94 584 104 3 2 787
Corporate 6 – 47 – 112 165
Total Gold Fields 235 1,648 482 16 122 2,5051 South Deep does not yet pay income tax as it is in a loss-making position 2 This includes spending from the South Deep Community and Education Trusts and SLP commitments.
National value distribution by region and type 2016 (US$m)
Government BusinessEmployees/contractors
Socio-Economic
Development
Capital providers
National value
distribution
Community investments: US$16.2m
Host community workforce employment: 8,567 people
Host community procurement:
US$558m
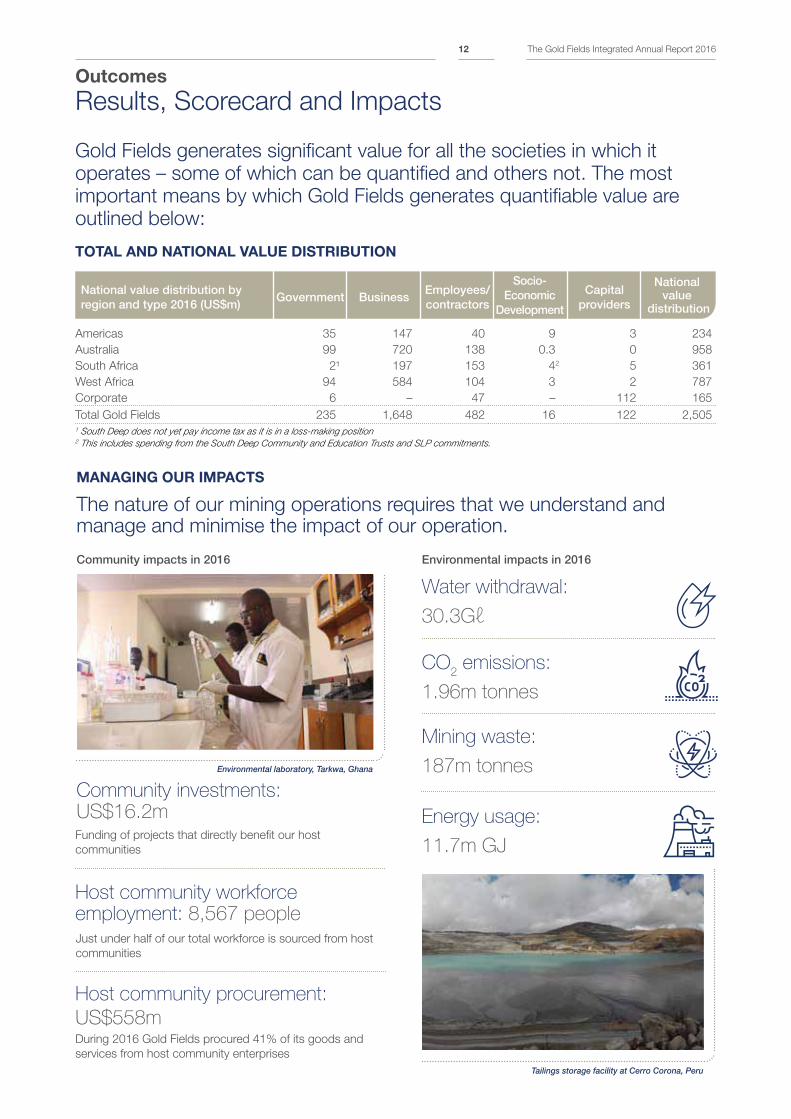
MANAGING OUR IMPACTS
The nature of our mining operations requires that we understand and manage and minimise the impact of our operation.
Community impacts in 2016
Funding of projects that directly benefit our host
communities
Just under half of our total workforce is sourced from host
communities
During 2016 Gold Fields procured 41% of its goods and
services from host community enterprises
Water withdrawal:
30.3Gℓ
CO2 emissions:
1.96m tonnes
Energy usage:
11.7m GJ
Mining waste:
187m tonnes
Environmental impacts in 2016
TOTAL AND NATIONAL VALUE DISTRIBUTION
Environmental laboratory, Tarkwa, Ghana
Tailings storage facility at Cerro Corona, Peru
The Gold Fields Integrated Annual Report 201612
Payments include
Mining royalties and
land-use payments,
taxes, duties and levies
dividends
Operational and capital
procurements
Salaries and wages,
benefits and bonus
payments (including
shares and payroll taxes)
SED spending, including
on infrastructure, health
and wellbeing, education
and training, local
environmental initiatives
and donations
Interest and dividend
payments to
shareholders
Governments provide us
with access to ore bodies
by granting mining and
other licences.
They also deliver the
infrastructure necessary
to build and maintain our
mines, including roads,
electricity and water
supply
Our supply chain
businesses provide the
equipment and services
needed to develop and
maintain our operations
The technical skills,
experience and activity
of our people drive the
day-to-day operations
of our business
Host communities are
the source of a significant
portion of our workforce
and a key component
of our social licence to
operate
Financial institutions,
shareholders and bond
holders invest with us,
thus enabling us to fund
the development,
maintenance and growth
of our operations and our
overall business
» We paid
governments
US$235m
(2015: US$196m)
in taxes and royalties,
10% of total value
distribution (2015: 8%)
» In addition, the
Ghanaian government
receives dividends
relating to its 10%
shareholding in
Gold Fields Ghana,
depending on the
Company's
performance
» We paid US$1,648m
to suppliers and
contractors,
representing 68% of
total value creation
(2015: US$1,663m/69%)
» Of the total 2016
procurement
expenditure,
US$1,360m
or 83%, was spent
on businesses based
in operating countries
(2015: US$1,268m/76%)
» Within this figure,
US$558m, or 41%,
was spent on suppliers
and contractors from
host communities
(2015: US$514m/35%)
» We paid US$482m
(2015: US$435m) to
employees in terms of
salaries, dividends and
benefits, representing
19% of total value
distribution (2015: 18%)
» We also provide
employees (where
legislated) with
additional benefits such
as retirement savings,
healthcare assistance,
life and disability
insurance, housing
assistance and
personal accident
cover
» We invested
US$16.2m (2015:
US$13.7m) in
terms of SED
investment
» Independently, the
South Deep trusts
spent R19.3m
(US$1.4m) in 2016
(2015: R24.3m/
US$1.9m)
» 48% of our workforce
is drawn from host
communities
(2015: 59%)
» See p99 for an
analysis of our host
community
employment and
procurement as
well as other benefits
and investment in
communities
» We paid US$122m
(2015: US$117m) to
the providers of debt
and equity capital,
mainly in the form of
interest and dividends
» Net debt was reduced
by a further US$214m
to US$1,166m during
2016
Government Business Employees and contractors Communities Capital providers
Why these stakeholders matter
What we contributed in 2016
CREATING SHARED VALUE
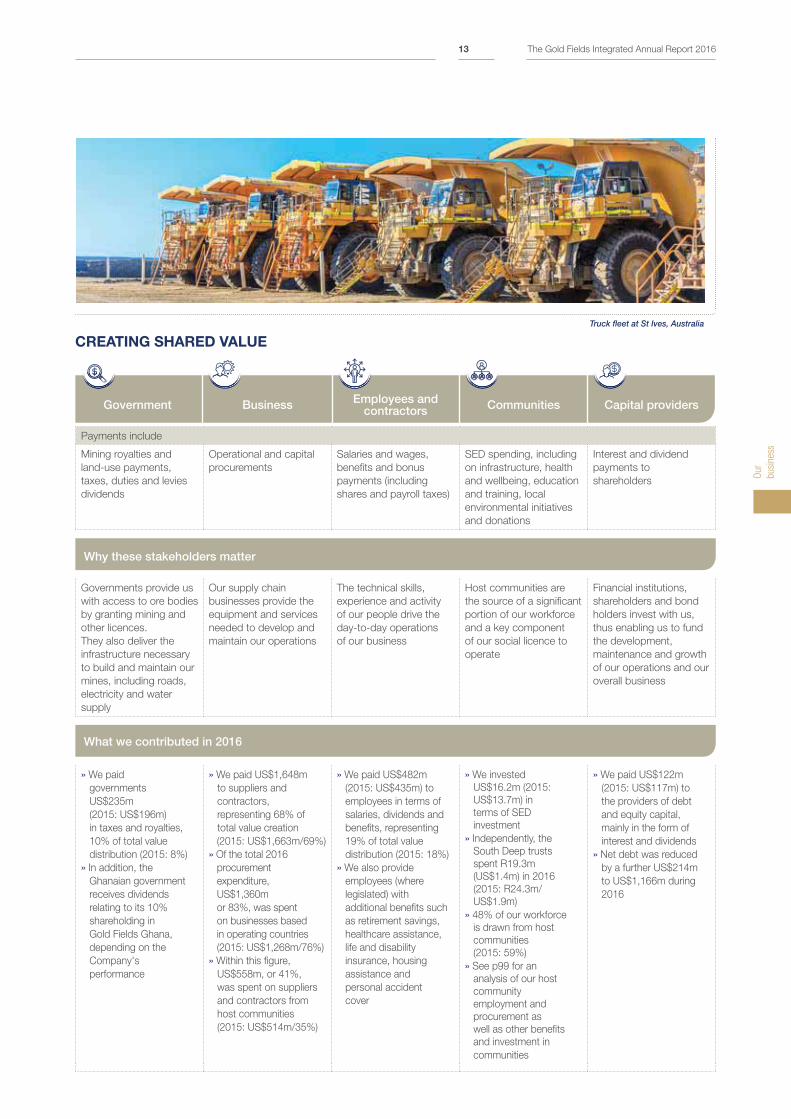
Truck fleet at St Ives, Australia
Our
busi
ness
The Gold Fields Integrated Annual Report 201613
Outcomes (continued)
Results and Impacts
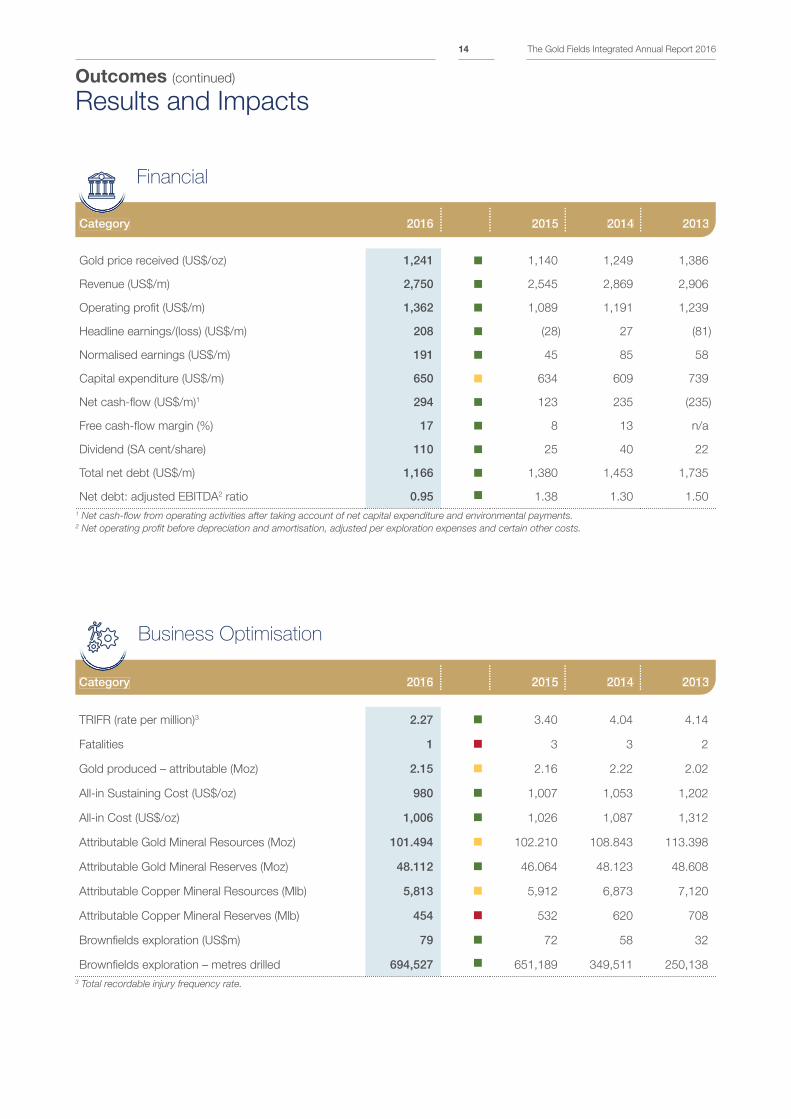
Category 2016 2015 2014 2013
TRIFR (rate per million)3 2.27 3.40 4.04 4.14
Fatalities 1 3 3 2
Gold produced – attributable (Moz) 2.15 2.16 2.22 2.02
All-in Sustaining Cost (US$/oz) 980 1,007 1,053 1,202
All-in Cost (US$/oz) 1,006 1,026 1,087 1,312
Attributable Gold Mineral Resources (Moz) 101.494 102.210 108.843 113.398
Attributable Gold Mineral Reserves (Moz) 48.112 46.064 48.123 48.608
Attributable Copper Mineral Resources (Mlb) 5,813 5,912 6,873 7,120
Attributable Copper Mineral Reserves (Mlb) 454 532 620 708
Brownfields exploration (US$m) 79 72 58 32
Brownfields exploration – metres drilled 694,527 651,189 349,511 250,138
3 Total recordable injury frequency rate.
Category 2016 2015 2014 2013
Business Optimisation
Category 2016 2015 2014 2013
Gold price received (US$/oz) 1,241 1,140 1,249 1,386
Revenue (US$/m) 2,750 2,545 2,869 2,906
Operating profit (US$/m) 1,362 1,089 1,191 1,239
Headline earnings/(loss) (US$/m) 208 (28) 27 (81)
Normalised earnings (US$/m) 191 45 85 58
Capital expenditure (US$/m) 650 634 609 739
Net cash-flow (US$/m)1 294 123 235 (235)
Free cash-flow margin (%) 17 8 13 n/a
Dividend (SA cent/share) 110 25 40 22
Total net debt (US$/m) 1,166 1,380 1,453 1,735
Net debt: adjusted EBITDA2 ratio 0.95 1.38 1.30 1.50
1 Net cash-flow from operating activities after taking account of net capital expenditure and environmental payments.2 Net operating profit before depreciation and amortisation, adjusted per exploration expenses and certain other costs.
Category 2016 2015 2014 2013
Financial
The Gold Fields Integrated Annual Report 201614
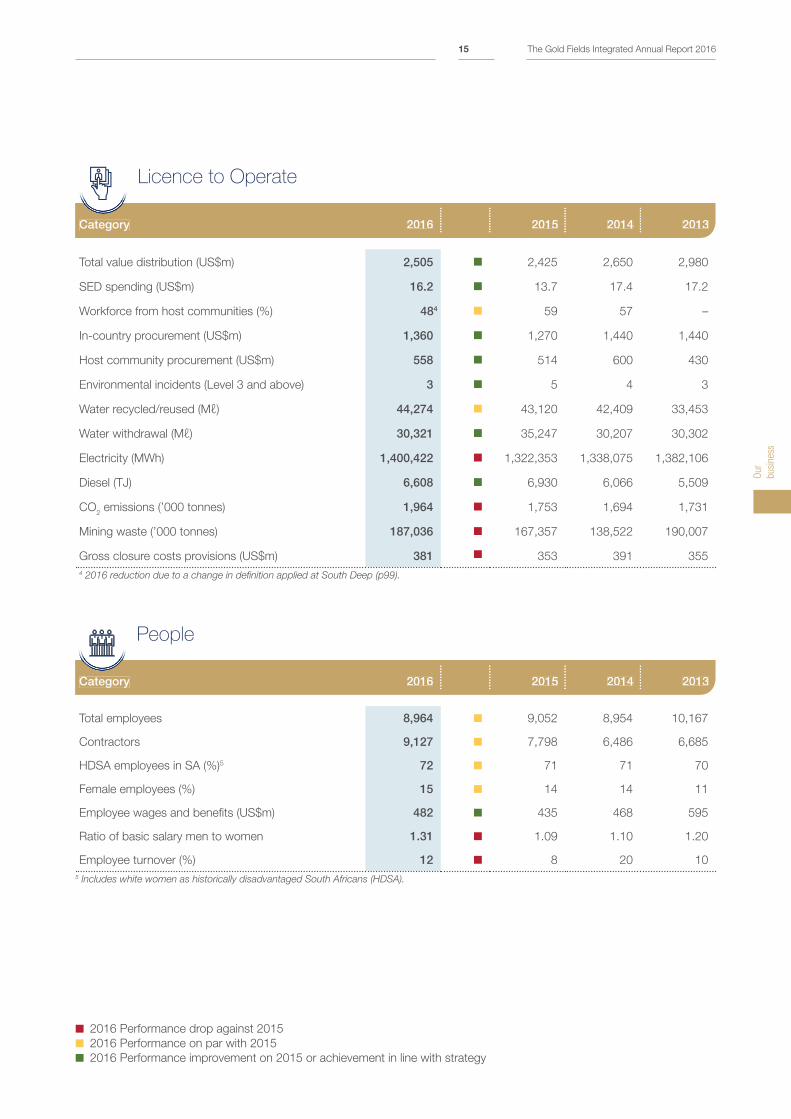
Category 2016 2015 2014 2013
Total employees 8,964 9,052 8,954 10,167
Contractors 9,127 7,798 6,486 6,685
HDSA employees in SA (%)5 72 71 71 70
Female employees (%) 15 14 14 11
Employee wages and benefits (US$m) 482 435 468 595
Ratio of basic salary men to women 1.31 1.09 1.10 1.20
Employee turnover (%) 12 8 20 10
5 Includes white women as historically disadvantaged South Africans (HDSA).
Category 2016 2015 2014 2013
People
Category 2016 2015 2014 2013
Total value distribution (US$m) 2,505 2,425 2,650 2,980
SED spending (US$m) 16.2 13.7 17.4 17.2
Workforce from host communities (%) 484 59 57 –
In-country procurement (US$m) 1,360 1,270 1,440 1,440
Host community procurement (US$m) 558 514 600 430
Environmental incidents (Level 3 and above) 3 5 4 3
Water recycled/reused (Mℓ) 44,274 43,120 42,409 33,453
Water withdrawal (Mℓ) 30,321 35,247 30,207 30,302
Electricity (MWh) 1,400,422 1,322,353 1,338,075 1,382,106
Diesel (TJ) 6,608 6,930 6,066 5,509
CO2 emissions (’000 tonnes) 1,964 1,753 1,694 1,731
Mining waste (’000 tonnes) 187,036 167,357 138,522 190,007
Gross closure costs provisions (US$m) 381 353 391 355
4 2016 reduction due to a change in definition applied at South Deep (p99).
Category 2016 2015 2014 2013
Licence to Operate
2016 Performance drop against 2015
2016 Performance on par with 2015
2016 Performance improvement on 2015 or achievement in line with strategy
Our
busi
ness
The Gold Fields Integrated Annual Report 201615
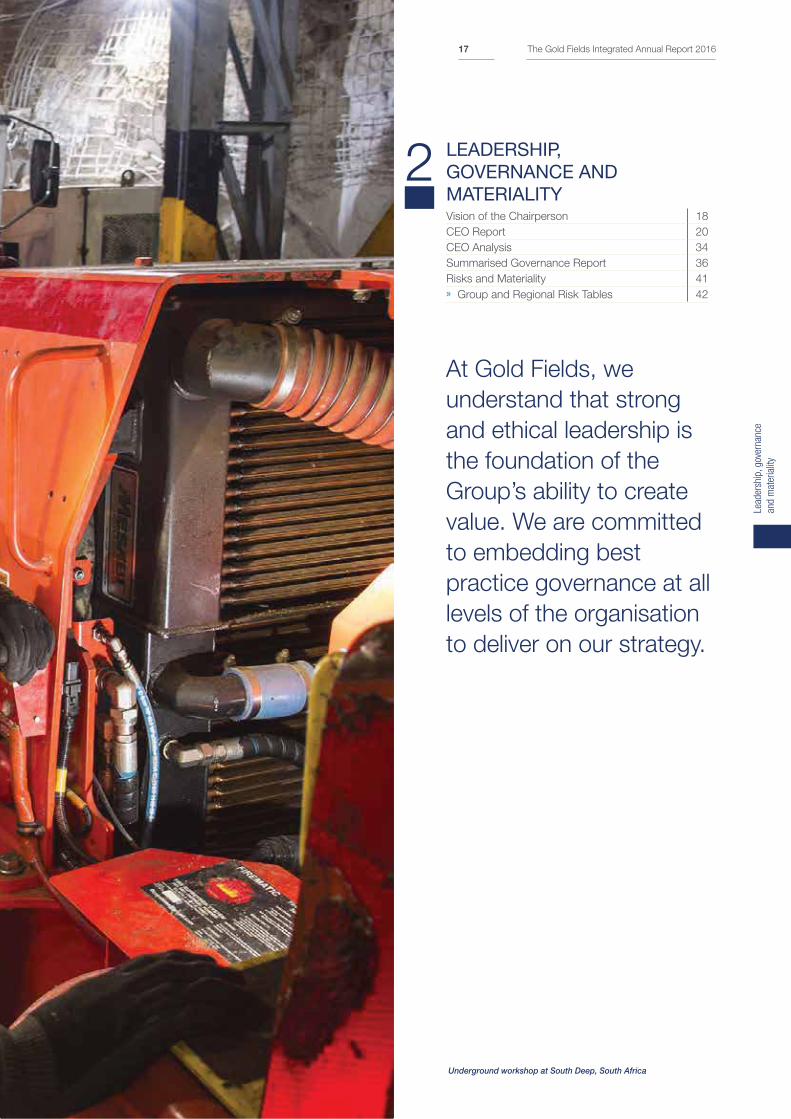
2LEADERSHIP, GOVERNANCE AND MATERIALITYVision of the Chairperson 18
CEO Report 20
CEO Analysis 34
Summarised Governance Report 36
Risks and Materiality 41
» Group and Regional Risk Tables 42
At Gold Fields, we
understand that strong
and ethical leadership is
the foundation of the
Group’s ability to create
value. We are committed
to embedding best
practice governance at all
levels of the organisation
to deliver on our strategy.
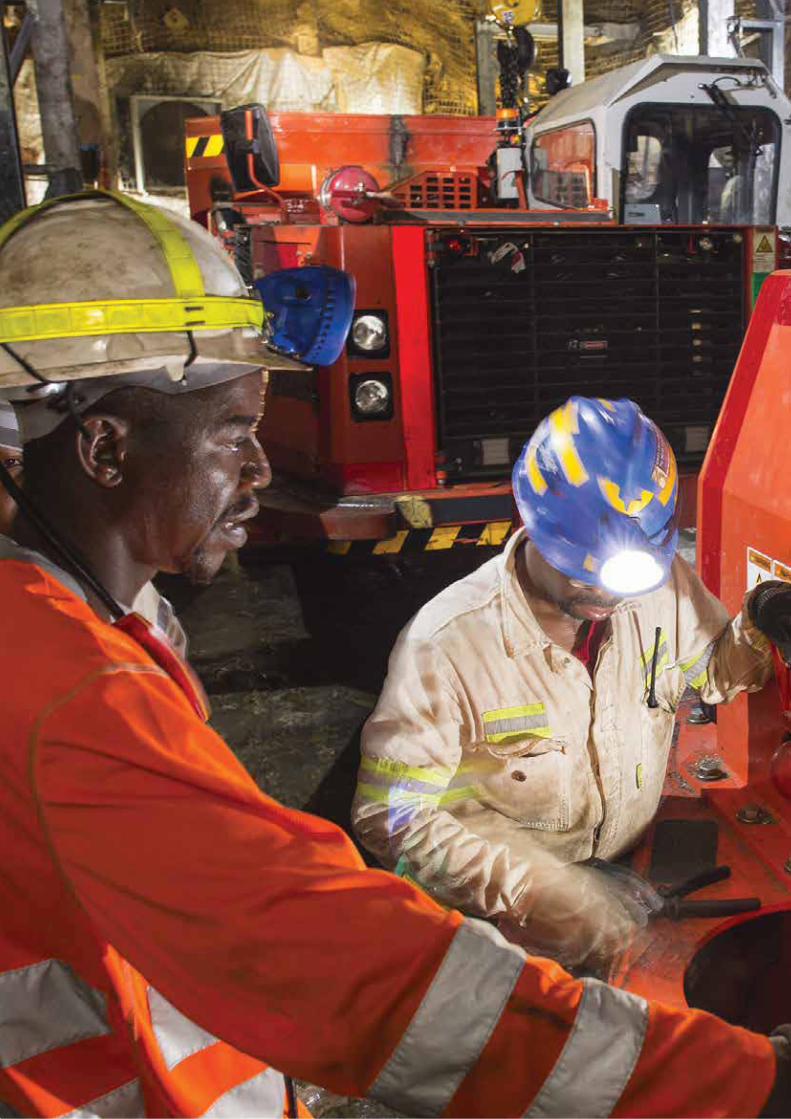
Underground workshop at South Deep, South Africa
Lead
ersh
ip, g
over
nanc
e
and
mat
eria
lity
The Gold Fields Integrated Annual Report 201617

Vision of the Chairperson
The global economic environment
faced by Gold Fields and the gold
mining industry during 2016 showed
a slight improvement with the higher
gold price and weaker currencies
boosting our operations, particularly
in South Africa and Australia.
However, the gold market remains
volatile and, while we believe in the
long-term value of gold, it is now
more important than ever that we
continue modernising all aspects
of our business to survive ever-
changing market conditions.
The safety, health and wellbeing of
employees and contractors has, and
always will be, a priority of the Board
and management. Tragically, one
fatality occurred during the year when
Vakele Thafeni, a learner miner, was
killed after a 1.5 magnitude seismic
event caused an underground rock
burst at our South Deep mine.
Subsequent to year-end we tragically
had two further fatalities at our South
Deep mine. On 1 January 2017,
Thankslord Bekwayo, a dump truck
operator, and on 16 February, Nceba
Mehlwana, a loco driver, were killed in
underground accidents. My heartfelt
condolences go out to the family,
friends and colleagues of Mr Thafeni,
Mr Bekwayo and Mr Mehlwana.
In honour of their memory, and those
who have died at our mines in
previous years, this Board will
continue to push management for
Zero Harm at all our operations.
Gold Fields remains vigilant and
continues to introduce and monitor
proactive measures to build on
progress made in our safety
performance, which showed a 33%
improvement in the Total Recordable
Injury Frequency Rate to 2.27
incidents per million hours worked
in 2016. Similarly, reducing the
exposure of our employees to
occupational and non-occupational
diseases such as noise-induced
hearing loss, silicosis, tuberculosis,
HIV/Aids and malaria remains a
priority.
The Gold Fields share price reflected
the volatility of the gold price, as gold
seems to temporarily have lost its
status as a safe haven investment
in times of global economic and
political uncertainty. Despite Britain’s
vote to exit the European Union, the
election of Donald Trump to the
White House and continued
instability in the Middle East, gold
managed a net gain of only around
US$100/oz during 2016. It has
gained some traction since but
trading remains volatile.
Gold Fields’ mines performed well
in 2016. Achieving sustainable
cash-flow is at the heart of our
strategy and we built on progress
made during the preceding years.
We generated US$294m (2015:
US$123m) of net cash-flow, which
has enabled us to deliver on our
commitments to paying dividends
and improving the balance sheet
in line with our stated targets. This
was achieved by maintaining our
production levels of just over two
million ounces per year and
continuing our efforts to bring down
the cost per ounce produced. During
2016, we reduced our All-in Costs
(AIC) to US$1,006/oz (2015:
US$1,026/oz), continuing the lower
cost trend of recent years.
We are intensifying our
engagement with communities
in particular, as they grant us
our social licence to operate
and have become pivotal
stakeholders in the longevity
of our mines
Cheryl Carolus, Chairperson
The Gold Fields Integrated Annual Report 201618
Significantly, and for the first time, we
managed to achieve cash breakeven
at South Deep, enabling Gold Fields
to announce the mine’s rebase plan
from a solid platform. South Deep
remains at the heart of our efforts to
position Gold Fields as a long-term,
sustainable value creator in the
global gold sector. With Mineral
Reserves of 34Moz at the end of
December 2016, South Deep holds
one of the largest and most lucrative
gold ore bodies in the world, and
accounts for a significant portion
of our anticipated production.
The successful implementation of the
rebase plan that the Board approved
for South Deep in February 2017 – to
achieve a steady-state production
level of around 500,000oz by 2022
at an AIC of around US$900/oz – is
essential for realising this long-term
value for the benefit of both our
shareholders and other local
stakeholders – in particular our
employees and the local Westonaria
community which hosts South Deep.
Looking beyond South Africa’s
borders, management must be
congratulated for improving the
performance and longer-term
prospects of our international
operations. The significant
investment programme in our
regions last year comprised a
number of projects, including the
recapitalisation of our Damang mine
in Ghana, entering into a joint venture
with Gold Road Resources for the
Gruyere project in Western Australia
and the successful brownfields
exploration programme at our mines
in Australia. Furthermore, we have
commenced a pre-feasibility study
at our Salares Norte project in Chile.
These programmes are aimed at
ensuring that Gold Fields remains a
sustainable and long-term generator
of free cash-flow.
Technology and innovation are
emerging as critical elements to
improve the operational performance
of our mines, and as such we
welcome the formation of a
dedicated Technology and Innovation
(T&I) division at Gold Fields and the
launch of a Group-wide T&I strategy.
This extends to all areas of the
business and I am pleased to say
that during the year we advanced the
use of renewable and low-carbon
emissions energies at our mines,
with significant security of supply and
cost benefits.
Stakeholder engagement, beyond the
regular interaction with our
shareholders and investors, is
becoming an increasingly critical
issue, and the Board devotes
considerable time to ensure that Gold
Fields’ management deals
appropriately with the challenges,
issues and concerns of the key
stakeholders in our host countries,
including governments, our workforce
and host communities. During 2016,
Gold Fields’ total value distribution to
our stakeholders – as measured by
World Gold Council standards – was
over US$2.5bn in the form of
payments to governments, capital
providers, business suppliers and
employees.
We are intensifying our engagement
with communities in particular, as they
grant us our social licence to operate
and have become pivotal
stakeholders in the longevity of our
mines. This engagement goes well
beyond regulatory compliance, and
includes a strong focus on host
community employment as well as
upskilling small businesses in our host
communities, thus enabling them to
supply goods and services to our
mines. In addition, we are
strengthening the ability of the three
South Deep community trusts as well
as foundations in Australia, Ghana
and Peru to distribute funds more
effectively to host community projects.
Australia, Ghana and Peru held
national elections during 2016, with
voters returning largely business-
friendly governments to power.
Irrespective of each government’s
principles, it is imperative that we find
ways of working together, which we
have largely managed to achieve. In
Ghana we entered into a development
agreement with the government,
which provides tax and other
concessions in return for future
investment at our operations. As a
direct consequence, we were able
to launch the reinvestment into the
Damang mine, creating and
preserving almost 1,850 jobs and
leading to significant new community
investment over the mine’s additional
eight-year LoM.
The extensive and open negotiations
with the Government of Ghana that
led to the agreement can serve as a
framework for dealing with
governments in other jurisdictions. It
would certainly assist in addressing
the impasse that remains in South
Africa, where industry and
government are struggling to find
solutions to a number of regulatory
and legal issues.
As directors of this Company, one of
our key responsibilities is to ensure
that the global corporate governance
programmes at Gold Fields are in line
with the ever-changing and more
stringent standards expected from
multi-national companies. During
2016, Gold Fields rolled out a revised
Code of Conduct which informs
ethical decision-making in the
business and in all dealings with
stakeholders.
After a comprehensive review of the
current skills composition of the
Board, and in view of the fact that a
number of directors have reached or
are reaching their retirement age, we
initiated an extensive directors’
recruitment and selection drive. Five
new directors joined us during 2016:
Alhassan Andani, Peter Bacchus,
Terence Goodlace, Steven Reid and
Yunus Suleman. Post year-end we
also announced that Carmen Letton
will join the Board on 1 May 2017. I
would like to welcome them as fellow
directors, secure in the knowledge
that their diversified and global skills
set in the areas of mining, finance
and technology will contribute
significantly to the growth of the
Company. The new directors will
over time be replacing some of the
current directors who are
approaching retirement age over the
next two years.
Kofi Ansah, Alan Hill and David
Murray, three of our long-serving and
trusted directors, stepped down
during the year and I want to pay
tribute to their hard work, dedication
and the years of experience they
provided the Company. Their
contribution was invaluable and
critical in ensuring that Gold Fields
successfully weathered the recent
stormy industry conditions. I would
also like to express my gratitude to
Gold Fields’ executive management,
led by Nick Holland, who, I believe,
have made some courageous
decisions this past year. Most
importantly, I want to thank every
employee at Gold Fields for their
hard work and dedication.
Cheryl Carolus
Chairperson
hard work and dedication
Lead
ersh
ip, g
over
nanc
e
and
mat
eria
lity
The Gold Fields Integrated Annual Report 201619

CEO Report
DEAR GOLD FIELDS
STAKEHOLDERSAs I look back on 2016, I am proud
to say that Gold Fields’ performance
exceeded my expectations for the
year. While, we were aided by the
gold price which averaged
US$1,241/oz during the year –
ahead of our planning price of
US$1,100/oz and US$100/oz higher
than the average price in 2015 – the
operational performance of the
teams at our mines was exceptional.
Despite the fact that we were
forecasting a decline in production in
2016 relative to 2015, we managed
to keep our production unchanged
– in fact, we improved our
production guidance half-way
through the year. Costs continue to
be well controlled and we managed
to absorb mining cost inflation during
the year. 2016 is the fourth
successive year in which production
and cost targets have been met. As
a result of stable production and
lower costs, Gold Fields’ eight mines
generated US$444m in cash (before
corporate charges), paid a healthy
total dividend of R1.10/share and
significantly restructured and
deleveraged the balance sheet.
Yet our share price at the end of
2016 was little changed from where
it started the year, reflecting in part
the volatility of the gold price and
the gold equities sector in general.
Our share price began the year at
R44, reached a peak at R91, and
then declined to just under R44 at
year-end.
This is obviously a source of
immense frustration for our
shareholders, and for us as
management. But my perception is
that we must continue to implement
our strategy of long-term sustainable
cash generation for the business
and, in time, I believe it will be
reflected in the share price.
It appears that some investors
believe that much of our fortunes are
linked inextricably to both the
short-term performance and outlook
for South Deep, our sole remaining
South African mine. While South
Deep is a key component of our
portfolio, I continue to stress that
Gold Fields is a global gold company
with much more than South Deep in
its portfolio. Indeed, with production
and cash-flow already heavily
weighted towards our mines in
Australia and Ghana, we are
increasing our investment in these
countries to ensure the longevity and
sustainability of our international
portfolio.
Irrespective of the view one might
have as to the relative importance of
South Deep to Gold Fields’ future
prospects, it too enjoyed its best
year under our ownership, showing a
47% improvement in production, and
achieving its targets for the first time.
This represents a good foundation
on which to build.
Being a global company, we deal
with a range of stakeholders across
the multiple jurisdictions in which
we operate and through
these engagements we generally
find solutions that are best for our
business and our stakeholders
Nick Holland, CEO
The Gold Fields Integrated Annual Report 201620
» Gold Fields recorded a solid
operational performance in 2016,
with attributable production of
2.15 million gold-equivalent
ounces, at the top end of our
updated guidance for the full year
of 2.10 – 2.15Moz and less than
1% below the 2.16Moz reported
in 2015 » Strong management across the
Group resulted in good cost
performance, with AISC of
US$980/oz being below our
guidance for the year of
US$1,000/oz – US$1,010/oz
and 3% below the AISC of
US$1,007/oz reported in 2015.
Similarly, AIC came in at
US$1,006/oz in 2016, below our
guidance of US$1,035/oz –
US$1,045/oz and 2% below the
US$1,026/oz reported in 2015. » As a result of the 9% improvement
in the average gold price received
from US$1,140/oz in 2015 to
US$1,241/oz in 2016, net
cash-flow from operating
activities – less net capital
expenditure and environmental
payments – amounted to
US$294m in 2016 compared with
US$123m in 2015 » The Group’s FCF margin for 2016
was 17% for the year. If the price
received for the year was
normalised to US$1,300/oz, then
the FCF margin would have been
19% – well above our stated target
of 15%. » Normalised earnings for 2016
totalled US$191m compared
with US$45m in 2015 » As a result of strong cash
generation during the year, net
debt was reduced by a further
US$214m to US$1,166m
(31 December 2015: US$1,380m),
decreasing the Group’s net debt to
adjusted EBITDA3 ratio from 1.38x
at the end of 2015 to 0.95x at the
end of 2016 » A final dividend of R0.60 per share
was declared. Together with the
interim dividend of R0.50 per share
for the six months ended 30 June
2016, this brings the total dividend
for the year to R1.10 per share
(2015: R0.25/share). At 32% of
normalised earnings, it is at the
upper end of the Group’s policy to
pay out between 25% – 35% of
normalised earnings as dividends » The Group’s TRIFR improved by
33% to 2.27 recordable injuries
per million hours worked (2015:
3.40/million hours), though this
strong safety performance was
overshadowed by the one fatality
we reported in 2016 (2015: three
operating fatalities) » Gold Fields generated
US$2.505bn in value measured in
terms of spending on business
suppliers and contractors,
economic development spending,
wages and salaries, taxes and
royalties as well as interest and
dividend payments to capital
providers. This was in line with the
total value creation of US$2.425bn
in 2015 » While energy consumption
increased by 4% in 2016 we also
achieved energy savings of around
US$11m amid the drop in oil
prices and greater operational
energy efficiencies. Furthermore,
with our increasing usage of
renewable and low-carbon energy
sources, we expect further energy
efficiencies and reduced carbon
emissions in the future » Water consumption was
significantly lower at 30,321Mℓ
(2015: 35,247Mℓ), though this was
in part due to a change in water
usage definitions. Nevertheless,
our operations are investing heavily
in stable water balances as well as
recycling and conservation
initiatives » Host community employment and
procurement are at the heart of our
efforts to improve the benefits of
mining for our host communities.
In 2016, 38% of total procurement
spend (2015: 35%) was in host
communities
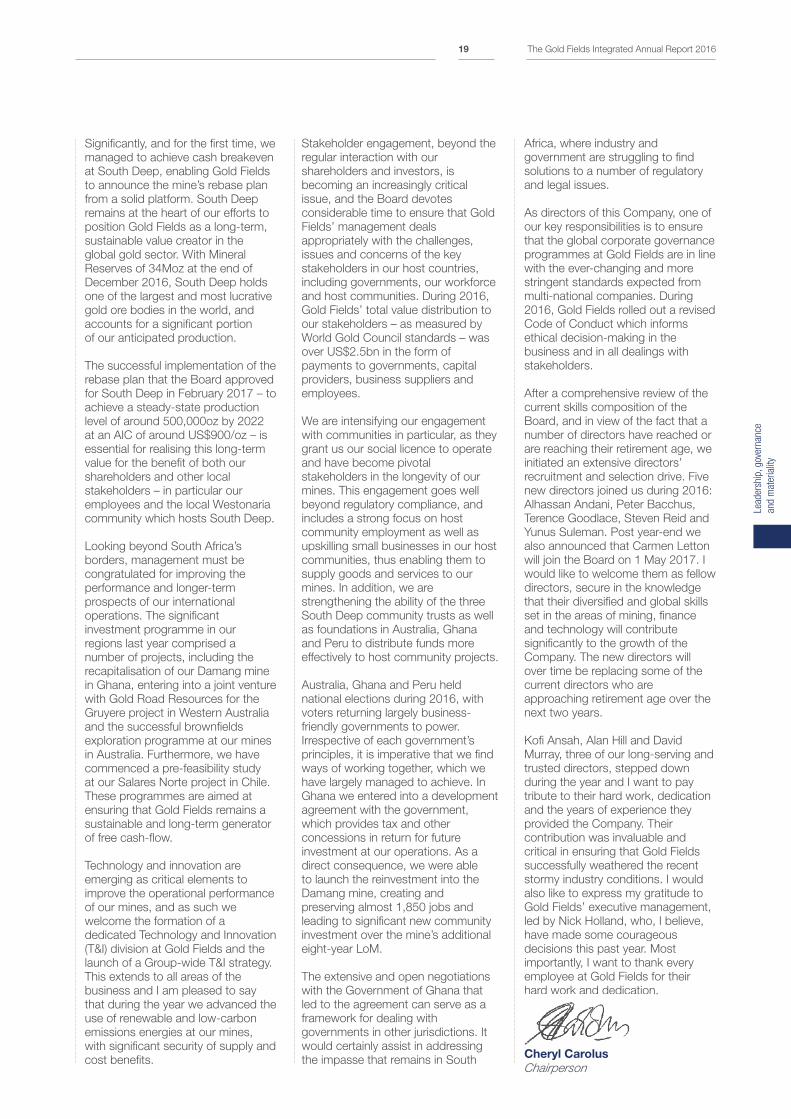
Performance Highlights 2016 vs 2015
2016 2015
Attributable production Moz 2.15 2.16
All-in Sustaining Costs (AISC) /oz 980 1,007
All-in Costs (AIC) /oz 1,006 1,026
Net cash-flow1 US$m 294 123
Free cash-flow (FCF) margin % 17 8
Net debt US$bn 1.166 1.380
Dividend declared R/share 1.10 0.25
Total Recordable Injury Frequency Rate (TRIFR) /million hours worked 2.27 3.40
Total value distribution US$bn 2.437 2.425
Energy usage2 TJ 11,697 11,240
Water usage Mℓ 30,321 35,247
CO2 emissions million tonnes 1.96 1.75
Host community procurement (% of total) % 38 35
Host community employment (% of total) % 48 59
1 Net cash-flow = cash-flow from operating activities less net capital expenditure and environmental payments.2 The sum of direct and indirect energy consumption reflects a conversion factor used by Granny Smith, Darlot and Damang power
stations. If the conversion factor is not applied total energy consumption was 12,444TJ (2015: 11,797TJ).
3 Net operating profit before depreciation and amortisation, adjusted for exploration expenses and certain other costs.
Lead
ersh
ip, g
over
nanc
e
and
mat
eria
lity
The Gold Fields Integrated Annual Report 201621
CEO Report (continued)
OVERVIEWAfter almost four years of belt-
tightening and consolidation, 2016
was the year in which Gold Fields
started strengthening and expanding
its portfolio of mines and projects to
ensure longer-term sustainable cash
generation.
Gold Fields began 2016 in much
better financial and operational
shape than when our transformation
journey started back in 2012. While
we benefited from a stronger than
planned for gold price, our 2016
successes are attributable to
remaining focused on achieving our
key strategic priorities, which were: » South Deep – finalise and
successfully implement the rebase
plan for long-term success » Cash-flow generation – improve
cash-flow and margin » Dividends – pay between 25%
and 35% of normalised earnings » Balance sheet – reduce net debt
to adjusted earnings before
interest, tax, depreciation and
amortisation (EBITDA) ratio to 1.0x
or below by the end of 2016 » Growth and expansion – through
brownfields exploration, project
development and opportunistic,
value-accretive acquisitions
I am pleased to report progress on
all these fronts since January 2016: » In February 2017, we announced
the long-term production and cost
guidelines for the South Deep mine
in South Africa after two years of
extensive rebasing work by the
management team appointed in
2015. We are now targeting
steady-state production of
approximately 500,000 ounces
by 2022 at an All-in Cost (AIC) of
US$875/oz. Of significance, South
Deep was cash-positive in 2016
for the first time, helped by the
higher Rand gold price » During 2016, we generated a net
US$294m in cash (cash-flow from
operating activities less net capital
expenditure and environmental
payments) compared with
US$123m in 2015. While our
Australian mines and South Deep
were undoubtedly aided by the
weaker Australian Dollar and South
African Rand, improved cash
generation is also attributable to
tight cost management by our
operational teams, as well as the
improved operating performance
at South Deep, which recorded a
US$92m swing in cash-flow from
an outflow of US$80m in 2015 to
an inflow of US$12m in 2016. The
17% cash-flow margin at the
average gold price received of
US$1,241/oz is well ahead of
target (15% at a gold price of
US$1,300/oz) » The total dividend for the year of
R1.10/share equates to 32% of
normalised earnings, at the upper
end of our dividend policy and
340% ahead of the total dividend
declared in 2015 » Through a combination of
improved cash-flows, debt
restructuring and equity raising we
managed to achieve a net debt to
adjusted EBITDA ratio of 0.95x at
end-2016 (even after the upfront
A$250m payment for Gruyere),
compared with 1.38x at end-2015.
We are confident of maintaining a
comfortable debt position during
2017, despite funding new
projects » A significant investment in the
future of Gold Fields positions us
to generate future profits at the
current gold price and offer
leverage to a rising gold price.
In support of this strategy we
launched some key projects during
2016, in addition to the South
Deep rebase announcement:
– In October, we announced a
US$341m investment at our
Damang mine to extend the life
of the mine by 1.6Moz and eight
years. Production will be at a low
AIC of around US$950/oz and
be cash generative in about
three years’ time
– In November, we acquired
a 50% joint venture interest in
and management control of the
Gruyere project in Western
Australia owned by Australian
exploration company Gold Road
Resources for a consideration of
A$350m. Once in production –
which is forecast for late 2018/
early 2019 and will require a
total of A$507m in capital for the
construction – Gruyere will
produce about 270,000 ounces
a year (100% basis) over a
13-year reserve life at an AIC of
less than US$805/oz
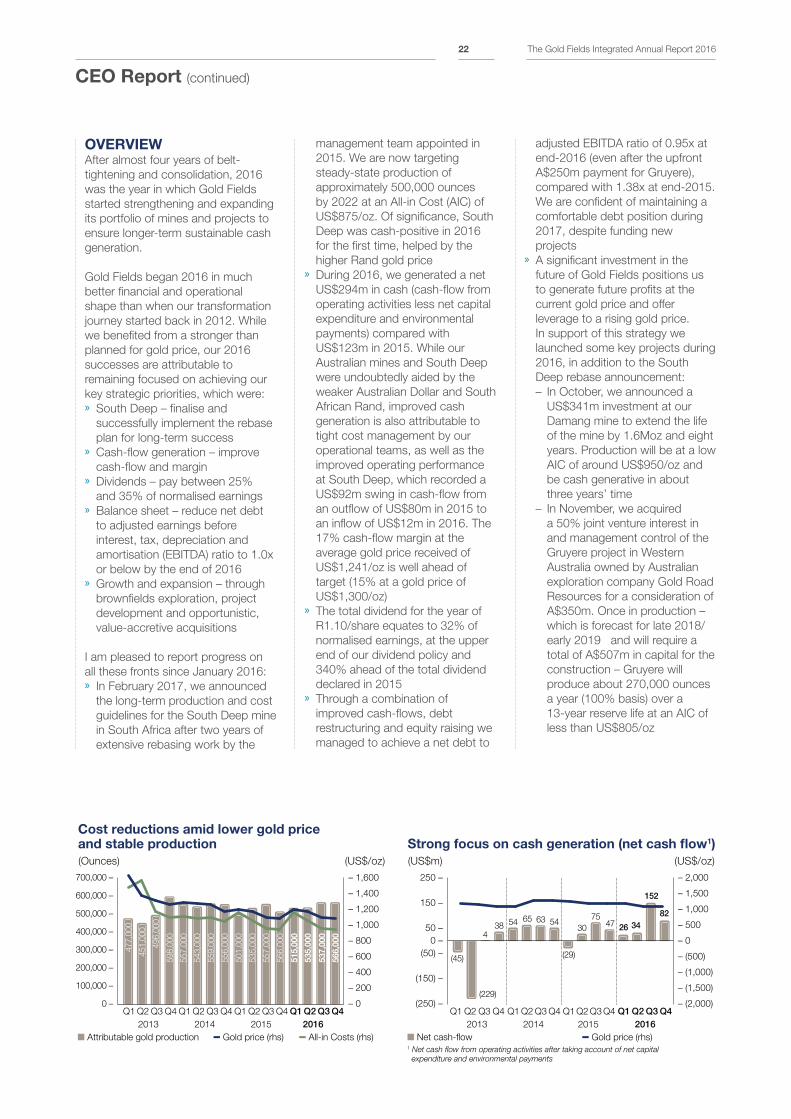
Cost reductions amid lower gold price and stable production
(Ounces) (US$/oz)
700,000 –
600,000 –
500,000 –
400,000 –
300,000 –
200,000 –
100,000 –
0 –
– 1,600
– 1,400
– 1,200
– 1,000
– 800
– 600
– 400
– 200
– 0Q1 Q2
20142013
Attributable gold production All-in Costs (rhs) Gold price (rhs)
2015 2016Q3 Q4Q1 Q2 Q3 Q4 Q1 Q2 Q3 Q4 Q1 Q2 Q3 Q4
557,0
00
496,0
00
451,0
00
598,0
00
477,0
00
543,0
00
559,0
00
556,0
00
501,0
00
535,0
00
557,0
00
566,0
00
515,0
00
535,0
00
537,0
00
566,0
00
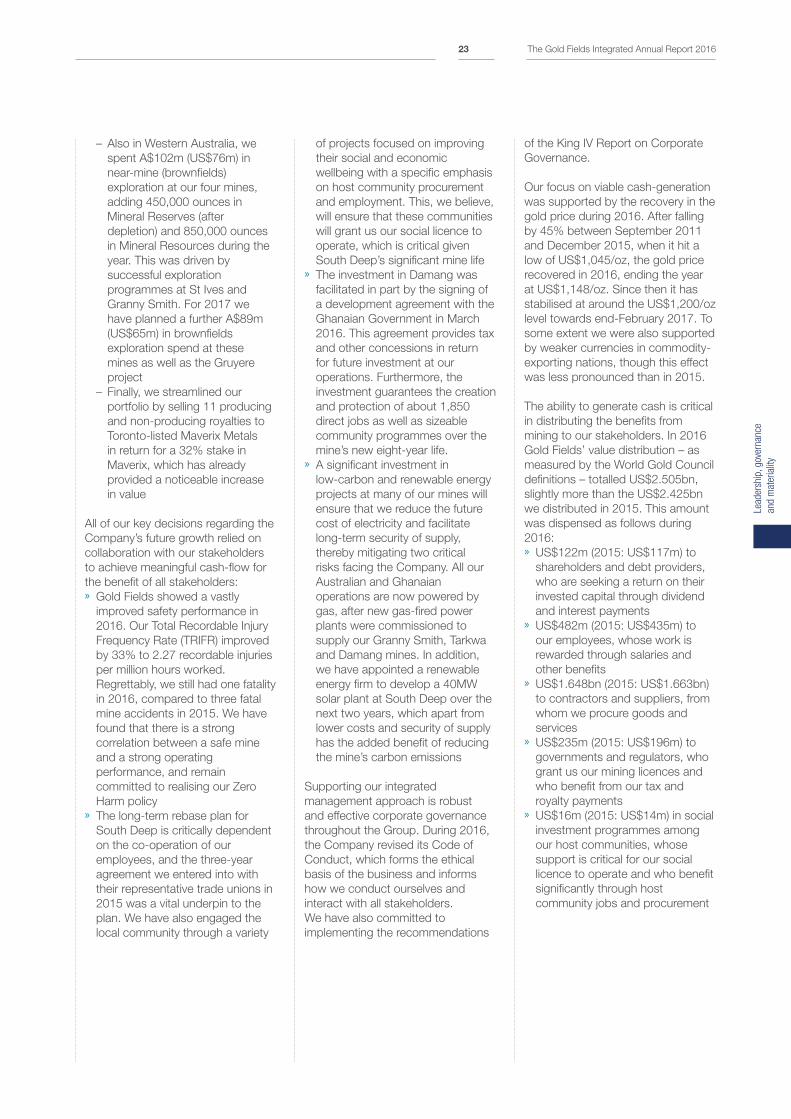
Strong focus on cash generation (net cash flow1)
(US$m)
250 –
150 –
50 –
(50) –
(150) –
(250) –
– 2,000
– 1,500
– 1,000
– 500
– 0
– (500)
– (1,000)
– (1,500)
– (2,000)Q1 Q2
20142013
Net cash-flow 1 Net cash flow from operating activities after taking account of net capital
expenditure and environmental payments
Gold price (rhs)
2015 2016Q3 Q4Q1 Q2 Q3 Q4 Q1 Q2 Q3 Q4 Q1 Q2 Q3 Q4
54384
(45)
(229)
65 63
(29)
3054
7547 26 34
152
82
(US$/oz)
0 –
The Gold Fields Integrated Annual Report 201622
– Also in Western Australia, we
spent A$102m (US$76m) in
near-mine (brownfields)
exploration at our four mines,
adding 450,000 ounces in
Mineral Reserves (after
depletion) and 850,000 ounces
in Mineral Resources during the
year. This was driven by
successful exploration
programmes at St Ives and
Granny Smith. For 2017 we
have planned a further A$89m
(US$65m) in brownfields
exploration spend at these
mines as well as the Gruyere
project
– Finally, we streamlined our
portfolio by selling 11 producing
and non-producing royalties to
Toronto-listed Maverix Metals
in return for a 32% stake in
Maverix, which has already
provided a noticeable increase
in value
All of our key decisions regarding the
Company’s future growth relied on
collaboration with our stakeholders
to achieve meaningful cash-flow for
the benefit of all stakeholders: » Gold Fields showed a vastly
improved safety performance in
2016. Our Total Recordable Injury
Frequency Rate (TRIFR) improved
by 33% to 2.27 recordable injuries
per million hours worked.
Regrettably, we still had one fatality
in 2016, compared to three fatal
mine accidents in 2015. We have
found that there is a strong
correlation between a safe mine
and a strong operating
performance, and remain
committed to realising our Zero
Harm policy » The long-term rebase plan for
South Deep is critically dependent
on the co-operation of our
employees, and the three-year
agreement we entered into with
their representative trade unions in
2015 was a vital underpin to the
plan. We have also engaged the
local community through a variety
of projects focused on improving
their social and economic
wellbeing with a specific emphasis
on host community procurement
and employment. This, we believe,
will ensure that these communities
will grant us our social licence to
operate, which is critical given
South Deep’s significant mine life » The investment in Damang was
facilitated in part by the signing of
a development agreement with the
Ghanaian Government in March
2016. This agreement provides tax
and other concessions in return
for future investment at our
operations. Furthermore, the
investment guarantees the creation
and protection of about 1,850
direct jobs as well as sizeable
community programmes over the
mine’s new eight-year life. » A significant investment in
low-carbon and renewable energy
projects at many of our mines will
ensure that we reduce the future
cost of electricity and facilitate
long-term security of supply,
thereby mitigating two critical
risks facing the Company. All our
Australian and Ghanaian
operations are now powered by
gas, after new gas-fired power
plants were commissioned to
supply our Granny Smith, Tarkwa
and Damang mines. In addition,
we have appointed a renewable
energy firm to develop a 40MW
solar plant at South Deep over the
next two years, which apart from
lower costs and security of supply
has the added benefit of reducing
the mine’s carbon emissions
Supporting our integrated
management approach is robust
and effective corporate governance
throughout the Group. During 2016,
the Company revised its Code of
Conduct, which forms the ethical
basis of the business and informs
how we conduct ourselves and
interact with all stakeholders.
We have also committed to
implementing the recommendations
of the King IV Report on Corporate
Governance.
Our focus on viable cash-generation
was supported by the recovery in the
gold price during 2016. After falling
by 45% between September 2011
and December 2015, when it hit a
low of US$1,045/oz, the gold price
recovered in 2016, ending the year
at US$1,148/oz. Since then it has
stabilised at around the US$1,200/oz
level towards end-February 2017. To
some extent we were also supported
by weaker currencies in commodity-
exporting nations, though this effect
was less pronounced than in 2015.
The ability to generate cash is critical
in distributing the benefits from
mining to our stakeholders. In 2016
Gold Fields’ value distribution – as
measured by the World Gold Council
definitions – totalled US$2.505bn,
slightly more than the US$2.425bn
we distributed in 2015. This amount
was dispensed as follows during
2016: » US$122m (2015: US$117m) to
shareholders and debt providers,
who are seeking a return on their
invested capital through dividend
and interest payments » US$482m (2015: US$435m) to
our employees, whose work is
rewarded through salaries and
other benefits » US$1.648bn (2015: US$1.663bn)
to contractors and suppliers, from
whom we procure goods and
services » US$235m (2015: US$196m) to
governments and regulators, who
grant us our mining licences and
who benefit from our tax and
royalty payments » US$16m (2015: US$14m) in social
investment programmes among
our host communities, whose
support is critical for our social
licence to operate and who benefit
significantly through host
community jobs and procurement
Lead
ersh
ip, g
over
nanc
e
and
mat
eria
lity
The Gold Fields Integrated Annual Report 201623
GROUP PERFORMANCE
SCORECARDEach year, Gold Fields adopts a
Group performance scorecard that
incorporates the strategic priorities
and seeks to instil the right culture
and behaviours amongst our
workforce, driven by the strategic
imperative of cash generation.
By integrating all of the key value
drivers into the business, the
scorecard also aims to enhance the
Group’s sustainability. The scorecard
consists of four key performance
areas and elements against which
we measure our performance. These
are: financial performance; our social
licence to operate; people; and
business optimisation. This IAR is
structured along the lines of our
2016 scorecard and a brief overview
of each area, broken down by the
respective elements, follows.
Financial PerformanceThe first key performance area of
the Group scorecard is financial
performance, as measured by
cash-flow generation and debt
reduction as well as improving
investor confidence.
Our strategy is driven by the
objective of generating a 15%
FCF margin at a gold price of
US$1,300/oz, as we believe that this
is a reasonable long-term price for
bullion. The premise is that when
the gold price trades above
US$1,300/oz, the FCF margin will
grow commensurately. Conversely,
when prices trade below
US$1,300/oz, as we have seen since
2012, the inclusion of the 15% FCF
margin at that level provides Gold
Fields with a safety cushion down
to our cash breakeven level of
approximately US$1,050/oz. The
Group’s FCF margin for 2016 was
17%, despite the fact that, at
US$1,241/oz, the actual annualised
gold price received was again below
the planning price of US$1,300/oz.
It illustrates that our strategy of
boosting margin growth is paying off.
Net Cash-Flow and Focus on CostNet cash-flow (cash-flow from
operating activities less net capital
expenditure and environmental
payments) is one of the key
measurements of Gold Fields’
turnaround strategy since 2012.
Despite the 25% decline in the
average price of gold between 2012
and 2016, Gold Fields’ ability to
generate cash has improved
substantially. During 2016 this was
aided by the higher average gold
price received as well as a
weakening of the South African Rand
and the Australian Dollar against the
US Dollar. The improved Rand gold
price also helped South Deep
breakeven for the first time. Our
cash-flow progression over the past
five years has seen us turn around a
net cash outflow of US$280m in
2012 to a net cash inflow of
US$294m in 2016.
Central to our ability to generate
FCF is a commitment to cost
management, which we have
implemented rigorously over the past
few years, though we have been
careful not to cut sustaining capital
expenditure critical to maintaining the
long-term integrity of our ore bodies.
During 2016, costs were marginally
lower than in 2015 as a result of
exchange rate benefits, lower oil
prices and successful cost controls
by our operations. Both AIC at
US$1,006/oz and AISC at
US$980/oz were below their
respective 2016 guidance ranges of
US$1,035/oz – US$1,045/oz and
US$1,000/oz – US$1,010/oz.
Cumulative reduction for AIC
between 2012 and 2016 has been
a strong 35%.
Debt ReductionOne of Gold Fields’ key strategic
objectives has been to reduce the
amount of debt on our balance
sheet. In this regard, management
set itself a target of reducing the net
debt to adjusted EBITDA ratio to
below 1.0x by the end of 2016.
Over the year the Group entered into
a number of transactions which
impacted the debt balance, including
a bond buy-back of US$148m
funded from an equity raising of
US$152m to decrease the level of
net debt. The first upfront payment
for the Gruyere transaction (A$250m)
in December 2016 had the effect of
increasing the Group’s net debt.
Despite this, the bond buy-back
and equity raising as well as the
US$294m in net cash-flow
generated during the year, helped
decrease our net debt by US$214m,
from US$1,380m at the end of
December 2015 to US$1,166m at
the end of December 2016. This
resulted in a net debt to adjusted
EBITDA ratio of 0.95x, below our
stated target of 1.0x.
Improving Investor ConfidenceOur portfolio has undergone a
fundamental change since 2013.
We spun off the Sibanye Gold assets
to shareholders, eliminated marginal
mining, stopped all projects in our
growth pipeline that did not provide
an adequate return and, in October
2013, acquired the Yilgarn South
assets in Western Australia from
Barrick Gold.
Last year we expanded our portfolio
to take advantage of the improved
gold price and our significant
cash-flow generation. In October
we announced a US$341m capital
injection to extend the life of our
Damang mine in Ghana by a further
eight years and in November
acquired a 50% stake in the Gruyere
project in Western Australia for
A$350m from Gold Road Resources.
Gruyere is expected to see first
production by late 2018/early 2019.
In February 2017 we announced that
we had begun the sales process for
the Darlot mine in Western Australia,
as it has been unable to make a
“game-changing” exploration
discovery and is not considered a
Gold Fields franchise asset.
The only operating asset in the Gold
Fields Group that still has to be
brought fully to account is our South
Deep mine. Here we achieved cash
breakeven for the first time in 2016
– the mine reported net cash inflow
of US$12m compared to an outflow
of US$80m in 2015 – and in
February 2017 announced the mine’s
long-term production and cost
CEO Report (continued)
The Gold Fields Integrated Annual Report 201624

metrics. Details of the mine’s 2016
performance and the key parameters
of its ramp-up plan can be found on
p67 – 69.
Gold Fields also remains one of the
higher dividend payers amongst its
peers. The total dividend declared
for the year of R1.10 per share
(2015: R0.25/share) is equivalent to
32% of normalised earnings, close to
the top end of our dividend policy of
paying out 25% – 35% of normalised
earnings as dividends.
We believe that Gold Fields has
established a solid base which will
maintain the confidence of our
current shareholders and attract
long-term investors seeking value
and leverage to the gold price.
Business optimisationFinancial
» Debt reduction Continue to use cash generation
to pay off net debt
» Sustainable free cash flow margin Meet production and cost
guidance
» Improved investor and analyst confidence Position share price above the
median of our peer group
» Creating and sustaining Shared Value Develop three-year procurement
and local employment plans for
South Africa, Ghana and Peru
» Improved community relations
Develop and implement
community engagement
strategies
» Mine closure and water management
Implement integrated post-
closure water management
plans
» Manage climate change risk Conduct gap analysis to further
assess operational vulnerability
to climate change
» Performance management Measure, incentivise and motivate
high performance
» Improved talent management Ensure the right people in the right
jobs at the right time and deliver
training programmes for required
skills
» Communication and engagement Improve engagement by implementing
a two-way communication platform
» Improve people management skills Develop strong people managers
» Create supportive work environment Review Employee Value
Proposition
» Growth and quality of
portfolio Grow operations’
reserve life and mineable
resources
» Energy cost management Implement 2015 energy security
plans and upgrade energy efficiency
plans
» Technology and innovation Design technology strategy with a three-year
implementation plan
» Rebase South Deep to deliver Achieve a cash neutral or cash positive position
by end-2016 and develop a framework to execute
business improvement projects
» Improved safety practices Implement and track behavioural-based safety programmes
2016
PeopleSocial licence to operate
2017» Shared Value
Implement host
community procurement
action plans
» Mine closure Regions to align closure
plans with revised guideline
» Water Review water management
practices to align to ICMM Water
Position Statement by 2018
» Tailings Externally review all TSFs against
ICMM framework
» Climate change Develop adaptation plans for operations
» Governance and compliance Complete rollout of all governance and
compliance projects
» Talent management Drive high performance
culture and attract and
retain top talent.
» Internal engagement, culture and brand Implement new employee
engagement strategy and
revise DNA
» Develop agile people managers Grow people management skills
and agility
» HR analytics and systems Ensure accurate, up-to-date people
data system
p
»I
co
act
» Mine Regio
plans w
» Water Review w
practices t
Position Sta
» Tailings Externally revi
ICMM framewo
» Climate change Develop adaptatio
» Governance and c Complete rollout of a
compliance projects
tce
nd
nt,
oyee
and
e managersment skills
stemsto-date people
» Asset portfolio quality & growth • Increase quality ounces in Australia and deliver Gruyere within
schedule • Investigate extending Cerro Corona’s life-of-mine
and start Salares Norte feasibility study • Divest non-core
assets • Deliver year one of Damang Reinvestment
» South Deep Deliver year one of Rebase Plan and implement
approved mining method and pillar design
» Technology & innovation Execute Horizon 1 programmes, complete
T&I review, and start mine of the Future
programme
» Energy cost management Implement 2017 energy
security and cost
management plans
» Sustainable free cash flow margin Meet production and cost guidance
safely and sustainably
» Capital allocation and management Establish Management Investment
Committee to monitor capital
expenditure
» Improve investor and analyst confidence Improve total shareholder
return – position share price
between median and upper
quartile of peer group and pay
dividends in line with policy.
Improve ESG investor
and analyst
confidence
Gold Fields Group 2016 and 2017 Performance Scorecard
Lead
ersh
ip, g
over
nanc
e
and
mat
eria
lity
The Gold Fields Integrated Annual Report 201625
Nceba Mehlwana, a loco driver, were
killed in underground accidents. Our
sincere condolences go out to the
relatives, friends and colleagues of
Mr Thafeni, Mr Bekwayo and
Mr Mehlwana.
While any fatality is an undoubted
setback on our journey to Zero
Harm, we are encouraged by the
progress made in terms of our overall
safety performance during 2016.
Our TRIFR showed a further 33%
improvement to 2.27 per million
hours worked from 3.40 in 2015.
The work on safety is integral to our
operational discipline and has been
accepted as the foundation for
improved performance. As such,
there is no conflict between pursuing
safety and productivity at the same
time. Behaviour-based safety
programmes are in place across
the Company and our work at
embedding these into our day-to-day
performance, along with visible
management leadership on the
ground, continues. At South Deep,
the CEO’s ‘Zero Harm’ task team
has been strengthened with the
addition of a Board director to the
team. The Group has also intensified
operation-specific health and
wellness programmes, focusing on
improving the physical and mental
health of our employees.
Quality Portfolio of AssetsDuring 2016, Gold Fields made a
conscientious effort to invest in
enhancing the quality of its existing
portfolio while at the same time
identifying value-accretive
acquisitions. This active portfolio
management approach requires an
ongoing strategic review of all
existing assets as well as potential
acquisition targets against our
strategic imperatives. Similarly,
growth at Gold Fields is not just a
matter of increasing the Group’s
Mineral Resources and Mineral
Reserves or boosting the production
profile; it is about growing cash-flow
per ounce and Mineral Reserves per
share in the medium and long term.
Business OptimisationUnderpinning the financial
performance of the business is Gold
Fields’ commitment to running its
operations safely, efficiently and cost-
effectively without undermining the
longevity of our mines. We measure
the success of business optimisation
by looking at our progress on Safety
and Health; the performance and
growth of our portfolio of mines and
projects; setting up the South Deep
project for long-term success;
running our mines energy efficiently;
and using technology and innovation
to optimise their future performance.
Gold Fields’ operating and financial
performance during 2016 showed
that our efforts in this regard are
paying off. Highlights were: » Production of 2.15 million
attributable, gold-equivalent
ounces, broadly in line with our
updated guidance for the full year
of 2.10 – 2.15Moz » Strong cost management across
the Group resulted in a good
cost performance with AISC of
US$980/oz and AIC of
US$1,006/oz in 2016, below
guidance for the year » Net cash-flow from operating
activities increased strongly to
US$294m in 2016 compared
with US$123m in 2015
Detailed Group and mine operating
performances can be found on
p56 – 61 of this report.
Safety and HealthSafety is management’s first priority
in running our operations, and it
is critical that we continuously
emphasise that our first value is “if
we cannot mine safely we will not
mine”. Nevertheless, we had one
fatality during 2016 (compared with
four fatalities in 2015, three resulting
from operational accidents and one
from crime). On 10 September,
Mr Vakele Thafeni, a learner miner,
was killed after a 1.5 magnitude
seismic event caused an
underground rock burst at South
Deep. Post year-end, on 1 January
2017, Thankslord Bekwayo, a dump
truck operator, and, on 16 February,
In this context, Gold Fields continued
to focus on improving the cash-
generation performance of its
existing operations and identifying
value-adding projects. The pillars
that support this strategy are: » Protection of the commercial
sustainability of our mines by
avoiding high-grading and
investing in ore development
on an ongoing basis » The cessation of all early
greenfields exploration activity and
a focus on brownfields (near-mine)
exploration for LoM extensions,
particularly at our Australian
operations » Production and strategic planning
based on the delivery of a 15%
FCF margin at a gold price of
US$1,300/oz » The identification of cash-
generative acquisition
opportunities that are aligned with
Gold Fields’ core competencies
To ensure that our business has
a strong future, we have made
ongoing investment in brownfields
exploration as well as the
development of our ore bodies
strategic priorities. These are among
the last activities we would cut, as
even in a sustained low gold price
environment the costs associated
with maintaining the integrity of our
ore bodies is built into our mines’
cash-flow models.
Key decisions since January 2016
that improved the quality of our
portfolio of assets included: » The reinvestment plan for Damang
which will extend the mine’s LoM
by eight years to 2024 at costs
that will lower the Company’s
average cost of production » The acquisition of 50% of the
Gruyere project in Western
Australia from Gold Road
Resources » The progression of the Salares
Norte project in Chile to pre-
feasibility study » The sale of our royalty portfolio to
Toronto-listed Maverix in return for
a 32% holding in the company » The decision to commence with
the sale of the Darlot mine in
Western Australia
CEO Report (continued)
The Gold Fields Integrated Annual Report 201626
Gold Fields believes that near-mine
exploration offers the best route to
low-cost ounce replacement that
can generate cash in the short and
medium term. In 2016, Gold Fields
raised its total near-mine exploration
expenditure by 5% to US$80m, on
top of the US$162m spent in the
preceding three years, in pursuit of
this strategy. Much of this activity
was focused on the Australia region,
where the four mines in our portfolio
spent A$102m (US$76m) in 2016, in
line with the A$91m (US$72m) spent
in 2015.
This is part of a multi-year strategy to
both replace and increase quality
reserves and resources at our
operations in Australia. In addition to
exploration drilling to extend current
ore bodies, activity focused on
developing early-stage generative
targets on the prospective leases.
Some successes from 2016
included:
» St Ives’ Invincible mine was
extended to Invincible
Underground and Invincible South
» Work at Agnew/Lawlers showed
good potential at the Waroonga
North ore body, adjacent to the
Waroonga underground operation
» Exploration at Granny Smith
indicated further mineralisation
at depth of the existing Wallaby
underground mine
To build on the work undertaken
to date, we have budgeted A$89m
(US$65m) for 2017. This includes
exploration at the Gruyere project,
which is a departure from the
brownfields approach, but which we
believe will enhance our portfolio in
Western Australia and expand our
exposure to this new and emerging
goldfield. Furthermore, we have
proven our ability to absorb new
operations into the Gold Fields
Australia portfolio by leveraging off
existing resources. Gold Fields took
over management of the Gruyere
project on 1 February 2017, and first
production is expected by late 2018/
early 2019.
Pursuing cash-generative acquisition
opportunities is an integral part of
our strategy although by necessity,
opportunistic in nature. However,
given our existing commitments,
further M&A during 2017 or 2018
appears unlikely except in countries
in which we already have a presence
and where it has synergistic benefits.
It would be modelled on our
successful US$262m acquisition of
the Yilgarn South assets from Barrick
Gold in October 2013. An acquisition
like this will be difficult to replicate in
terms of the price we paid, but the
structural benefits and subsequent
management efforts have given
us a model to replicate.
Finally, we are examining whether
a return to judicious greenfields
exploration would be a viable
proposition in view of the sharp
price escalation of mines already in
operation. This strategic
consideration is at an early stage
and includes an evaluation of
whether Gold Fields should pursue
greenfields exploration on its own or
in co-operation with junior miners.
During 2016, Gold Fields increased
attributable gold Mineral Reserves
(net of depletion) by 4% to 48.1Moz
though Mineral Resources declined
by 1% to 101.5Moz. Attributable
copper Mineral Reserves totalled
454Mlbs (2015: 532Mlbs) and
Mineral Resources 5,813Mlbs
(2015: 5,912Mlbs). Encouragingly, in
Australia, we added 450,000oz in
Mineral Reserves (after depletion)
and 850,000oz in Mineral Resources
during the year.
South DeepIn 2015 the new management team
at South Deep took a decision to
take a step back and “get the basics
right” to ensure a stronger foundation
for sustainable growth in the future.
During 2016 this rigorous approach
showed signs of success, with the
following encouraging indicators of
improvement: » The mine’s safety performance
was the best it has been since
Gold Fields bought the project in
2006, though we regrettably had
one fatal mining accident (2015:
two fatalities) » Production in 2016 at 290,400oz
was 47% higher than the
198,000oz produced in 2015 » Costs were reduced with AIC of
US$1,234/oz showing a significant
21% improvement on the
US$1,559/oz reported in 2015 » Most significantly, South Deep was
cash positive for the first time,
aided by a currency hedge and the
stronger Rand gold price of
R584,894/kg (2015: R478,263/kg)
received during the year. The mine
generated US$12m in net cash
during 2016 compared with an
outflow of US$80m in 2015 » Full implementation of the high
profile destress mining method
Key to improvements at South Deep
were strategic interventions on a
number of fronts:
People: The recruitment of identified
critical skills was completed during
2016 and most of the core mining
and engineering positions have now
been filled, a process supported by
intensified training programmes for
our existing staff. In addition, the
signing of a three-year wage deal
with trade unions in March 2015,
which will govern wages and other
working conditions until March 2018,
is expected to give South Deep a
degree of labour stability as the mine
builds up.
Fleet: As part of the fleet renewal
strategy, 58 category 1 units have
been commissioned over the past
two years. The total category 1 fleet
currently stands at 111 units. The
renewed fleet will have a positive
impact on fleet availability and
utilisation. The maintenance capacity
at South Deep improved during the
year through the implementation of
supplier maintenance contracts in
corridor 2 (approximately 35% of
total mining), as well as the
commissioning of the 93 level
workshop.
Mining method: During 2015,
South Deep management, in
collaboration with a team of leading
international and local geotechnical
experts, reviewed the destress
mining method. Following the
recommendations, we implemented
a strategic change in the design of
the destress methodology, and
converted from low-profile to
high-profile destress mining during
2016. By year-end, most of the mine
was employing this approach, which
Lead
ersh
ip, g
over
nanc
e
and
mat
eria
lity
The Gold Fields Integrated Annual Report 201627
contributed significantly to simplifying
and derisking the mining process.
Building on this work, in February
2017 the Board approved the
long-awaited rebase plan for South
Deep, which sketches the long-term
production and cost profile of the
mine. The key features of this plan,
which is detailed on p67 – 69, are: » Increasing the tonnes milled to
2,861kt by 2022 » Ramping-up production to
500,000oz by 2022 » Reducing AIC to US$875/oz by
2022 » Growth capital expenditure of
R2.3bn (US$151m) over the next
six years
Managing Energy Costs and Climate Change RisksEnergy remains a major performance
driver, accounting for 19% of Group
operating costs in 2016, having
gradually risen from 18% in 2013,
amid increasing energy demand and
supply constraints in all of our
operating regions. As part of the
Integrated Energy and Carbon
Management strategy implemented
in 2014, each of our regions has set
energy reduction targets, which have
already delivered around US$41m
in savings (against plans) between
2014 and 2016. For 2016, this
equates to energy savings of around
3% against our business plans, with
an additional benefit of 4% savings in
our CO2-equivalent emissions. Most
critically though is that the average
energy spend per ounce of gold
produced has declined by 18% to
US$130/oz between 2014 and
2016, with energy efficiency
initiatives contributing the equivalent
of US$5/oz to these savings.
At the same time, the regions have
been tasked with securing access to
future energy sources. In Ghana,
where government required our
mines to reduce their electricity
consumption by 25% – 30% over
the past few years, both Tarkwa and
Damang have signed power
purchase agreements with an
independent power producer, which
successfully commissioned new
gas-powered plants at both these
mines during 2016. The plants at
Tarkwa (3x 11MW units) and Damang
(4x 5.5MW units) will result in reliable
supply and significant electricity cost
savings for both operations. As at the
end of 2016, 100% of Damang’s and
50% of Tarkwa’s power requirements
were supplied by the new gas-
powered plants. It is expected that
the these plants will supply 100% of
Tarkwa’s power requirements from
the beginning of 2018.
With the successful commissioning
of a new gas power plant at Granny
Smith, each of our four mines in
Western Australia is now supplied
by gas and new long-term supply
agreements have been entered into
with various utilities. While lower
global diesel prices have somewhat
mitigated the current cost benefits of
a switch to gas, we believe that the
long-term price differential will favour
gas over diesel. Gas is also a cleaner
fuel with resultant environmental
benefits. Our Cerro Corona mine in
Peru also has a long-term power
agreement in place with a private
gas company.
The improved power supply
environment in South Africa ensured
that our South Deep mine was not
subject to load-curtailment
programmes during 2016. In keeping
with our commitment to renewable
energy, we solicited proposals for an
on-site 40MW photovoltaic solar
plant at the mine. In early 2017 we
reached an agreement with an
independent renewable power
company to build and operate the
solar plant for the next 20 years. The
plant will provide around 19% of the
mine’s annual power requirements at
costs that are at least on par with
Eskom tariffs.
Gold Fields remains committed to
our goal of 20% renewable energy
generation over the LoM at all new
projects and are investigating this
requirement for our Salares Norte
project in Chile.
Greater use of renewables has the
added benefit of reducing our carbon
footprint, which is one of Gold Fields’
key environmental priorities. During
2016, our total CO2 emissions
increased to 1.96 million tonnes
(2015: 1.75 million tonnes), but we
expect longer-term benefits to our
emissions arising from the energy
efficiency projects we have put in
place at our mines. During 2016
we implemented a Group climate
change policy that addresses the
risks faced by our operations as a
result of the change in climate arising
from global warming.
Technology and InnovationAn important addition to our 2016
scorecard was Technology and
Innovation (T&I). A new division was
established under EVP: Technical,
Richard Butcher, who joined us from
mining group MMG in February
2016. Richard and his team
developed a Gold Fields T&I strategy
which was completed and presented
to the Board in November. The key
features of this strategy are:
» A five-year implementation plan
commencing with a foundational
phase over the first two years,
optimising our operations by year
three and implementing new
technologies and innovation over
the full five-year period
» Tasking our regions to develop
and implement three-year
technology plans starting in 2017,
with the corporate office
consolidating and driving the
process
» Developing a platform to share
lessons learned and roll out
successful projects across the
Group
» The ultimate goal of the strategy is
to work towards the “Gold Fields
Mine of the Future”, which will be
premised on automation, an
integrated digital data platform,
remote machine operation, virtual
reality and reduced mining waste
During the foundational phase Gold
Fields has already identified
opportunities to enhance efficiencies
within our current regional portfolios:
» The key focus for the Australian
region is reducing exploration
time through real-time data
management and the use of
leading practice technologies
» In Ghana the focus will be on data
analysis to achieve end-to-end
business optimisation. A key part
CEO Report (continued)
The Gold Fields Integrated Annual Report 201628
of this programme is to complete
fleet automation studies and trials » The South Deep mine will upgrade
its underground wireless
connectivity and radio
communications systems to use
technologies such as online
maintenance and dispatch
systems and remote operating
equipment more effectively » The Cerro Corona mine will be
using upgraded operating software
and a new dispatch system that
will focus on porphyry ore blending
to reduce variation of stock feed,
thereby optimising plant recoveries » Investigating the potential for an
automated and remote-controlled
underground trial mine at one of
our Australian operations
Recent advances in digitisation,
automation and mechanisation make
it critical that we develop strategies
to implement new technologies and
partner with IT companies and
original equipment manufacturers
(OEMs) that are leaders in the field.
Licence to OperateThe success of our business is
critically dependent on relationships
with a number of key external
stakeholders that determine both
our regulatory and social licences to
operate: Governments at national,
regional and local level and, above
all, the communities that host our
mines. Over the years we have
devoted considerable resources and
energy to securing and maintaining
our relationship with these
stakeholders. Our relationship with
the governments and host
communities in the countries in
which we operate are discussed on
p94 of this report.
A number of elements are critical
in achieving sound and supportive
community relations: Extensive
engagement work, investment in
these communities, as well as
the responsible management of
environmental resources, particularly
water. These resources, if not
managed sustainably, can have an
adverse impact on the nearby
environment and create tensions
with host communities, thus
threatening our licences to operate.
At the same time, we need to ensure
that we plan for the closure of our
operations throughout the LoM,
ensuring that when we eventually
exit, we have optimised operating
costs, our environmental footprint is
mitigated and the economy of the
host community continues to thrive.
Improved Community Relations and Shared ValueThe communities in which we
operate are directly and often
exclusively dependent on the
sustainability and growth of our
mines and they seek a greater share
of the benefits of mining than they
have received to date. One of the
biggest challenges facing mining
companies is building relationships
and trust with these host
communities, without which there is
potential for operational disruption,
project delays and cancellations –
the loss of the “social licence to
operate” referred to previously.
Host community procurement and
employment are critical pillars of our
community investment strategies at
all our operations in developing
countries. At present, host
community members account for
23% of our workforce at Cerro
Corona in Peru, 13% at South Deep
in South Africa (in line with Mining
Charter definitions) and 72% at our
two Ghanaian operations. The
numbers for host community
procurement spend are 8%, 14%
and 7% respectively. Gold Fields is
proactively looking at ways to
increase local employment and
procurement opportunities over the
next few years, including engaging
with our large multi-national suppliers
to support investment in these
communities. At South Deep we
have set ourselves the target of
procuring 25%, equivalent to about
R500m a year, of goods and services
from the mine’s Westonaria host
community, creating around 500 new
jobs in the process. We are making
good progress in this regard – in
2016 host community procurement
spend rose by 85% to R356m, the
number of host community suppliers
to South Deep increased to
84 (2015: 26) and the jobs these
suppliers created has risen to 871.
Gold Fields has also invested in
communities through a range of
educational, skills development,
health and infrastructure projects
and, more recently, through Shared
Value-based projects. However, it
is evident that mining companies
need to expand and deepen their
investment in and engagement
with host communities.
Our contribution to host communities
is on a more sustainable footing as
we increasingly use a Shared Value
approach to structure our
investments in community projects,
thereby taking into account social
and economic benefits rather than
just spend.
To date, our regions have
implemented five Shared Value
projects ranging from the promotion
of mathematics and science
education among South Deep’s host
communities to multi-lateral water
management projects at Cerro
Corona and increased sourcing from
community suppliers at all our mines.
The most high-profile project is the
US$17m, three-year upgrade of the
dirt road between the Tarkwa and
Damang mines in Ghana. We are
working with government in building
the road which, when completed, will
significantly improve access for our
operations’ host communities. In
addition, the bulk of the labour
required for completing the project
is being sourced from these
communities.
Environmental ManagementResponsible environmental
management remains a vital
component of Gold Fields’ regulatory
and social licence to operate at all
our operations and projects. In
2016 we reported three Level 3
environmental incidents (2015: five),
all of which took place at our
Ghanaian operations in Q1 2016.
The two incidents at our Tarkwa
operation involved accidental
damage to fuel units and hoses that
spilt large volumes of fuel into the
environment. The incident at
Damang involved the overflow of
Lead
ersh
ip, g
over
nanc
e
and
mat
eria
lity
The Gold Fields Integrated Annual Report 201629

about 20,000 litres of tailings slurry
and supernatant water into a nearby
event pond as a result of blockages
in the tailings delivery pipeline and
heavy rainfall. In all cases, corrective
actions were implemented to prevent
future recurrence. Details can be
found on p86.
Water is a particular focus of our
environmental strategy, as it is
becoming an increasingly scarce
and expensive resource globally.
Managing the risks around current
and anticipated water security, which
includes the quantity and quality of
supply as well as associated costs,
is essential to ensure sustainable
production for existing operations
and the future viability of projects.
Water withdrawal across the Group
decreased to 30,321Mℓ (2015:
35,247Mℓ), while water withdrawal
per ounce was lower at 13.67kℓ in
2016 compared with 15.77kℓ in
2015.
The Group’s water management
guideline requires operations to
identify opportunities to enhance
water reuse, recycling and
conservation practices. In 2016,
a total of 16 initiatives were
implemented in line with these
guidelines, including the use of in-pit
tailings disposals at our St Ives and
Tarkwa mines. Many of these
initiatives deliver multiple benefits,
including cost savings, reduced
impact in water scarce areas,
improved regulatory compliance,
identification and mitigation of
water-related risks and reduction
of mine closure liabilities, thereby
enhancing Gold Fields’ social licence
to operate. These efforts will
continue into the future.
Following the Mount Polley (Canada,
August 2014) and Samarco (Brazil,
November 2015) tailings dam
disasters, the 23 mining companies
that are members of the International
Council on Mining and Metals agreed
to convene to review standards for
tailing storage facilities. The resultant
working group is chaired by Gold
Fields and, in December 2016,
announced a new position statement
that will encourage members to
further improve the management of
mine tailings throughout their global
operations. In 2017 external
consultants will conduct Gold Fields’
three-yearly review of all the
26 tailings facilities at our mines and
projects and will assess our tailings
management against the new
position statement.
The total gross mine closure liability
for Gold Fields increased from
$353m in 2015 to $381m in 2016.
We plan on further enhancing our
integrated approach to mine closure
management with a focus on
post-closure water management.
The programme is currently being
finalised and implementation is
scheduled for 2017.
PeopleThe profile of our workforce was
profoundly impacted during the initial
years of our transformation journey
(2012 – 2014), with large-scale
reductions in the number of
employees and contractors. Since
then, our human resource base has
stabilised with 8,964 employees and
9,127 contractors on our books at
the end of 2016.
With the shift towards mechanisation
and automation, we have found that
in addition to the continued
development and training of our
workforce, it is important to recruit
the appropriate skills for our mines.
At South Deep, we completed the
recruitment of necessary mining skills
during 2016 and continue to train
our workforce in underground
mechanical mining skills. During
2016, we spent over US$17m
globally on training and development
– on top of recruiting the best mining
skills to supplement our existing
talent pool.
Since the restructuring process, our
smaller, yet more skilled workforce has
ensured that Gold Fields works more
efficiently to improve productivity. The
key to this is that employees are
incentivised to deliver against clearly
defined performance targets that
directly support the achievement of
business objectives. Our remuneration
strategy is evolving to attract and
retain these skills, and our people
development approach is being
adjusted to ensure that we build a
robust internal skills pipeline that can
supply the skills that the Company
needs, now and in the future.
Our people strategy is based on
achieving the following key
objectives: » Create and sustain a high-
performance culture » Become an ‘Employer of Choice’
for the best talent in the industry » Ensure we have the right people in
the right jobs at the right time » Ensure a sufficient supply of the
right leaders » Build great people managers
Achievement of this strategy is
reflected in our Group scorecard
objectives for 2016: » Performance management » Improved people management skills » Create a conducive work
environment » Improved talent management » Communication and engagement
Of these five scorecard objectives,
we have identified ‘engagement and
communication’ as an especially
important component of people
management. Our engagement with
trade unions is critical in this respect,
particularly in Ghana and South
Africa, where a large portion of our
workforce is represented by various
unions. In March 2015 we signed a
three-year comprehensive wage deal
that recognises the mechanised
mining requirements of South Deep
as we take it to full production.
Negotiations on a new agreement –
due in 2018 – will commence in
2017. In Ghana, negotiations with the
unions have been concluded with a
10% basic salary increase for 2016
(to be backdated to 1 January 2016)
and a 6% rise for 2017 being the
main outcome of the negotiations.
We continue to invest in building
cordial relationships with unions in
both Ghana and South Africa, but the
journey from confrontation to
collaboration is an ongoing one. At
South Deep, in particular, the
priorities of the business in terms of
delivering the mine’s rebase plan are
sometimes in conflict with the views
and aspirations of the main trade
union. This potential conflict now
requires urgent resolution.
CEO Report (continued)
The Gold Fields Integrated Annual Report 201630
In Ghana, the aspirations of the
unions for continued above inflation
wage increases is undermining our
business and a new wage model is in
the process of being evolved through
dialogue with the union. Without
consensus, a restructuring of our
business is likely. Our goal remains to
develop our relationships with trade
unions further so that they do not
compromise the delivery of our
business objectives.
GROUP STRATEGY – THE
ROAD AHEAD FOR 2017
AND BEYOND 2017 will be a year of reinvestment
for Gold Fields, the benefits of which
will be realised in the years to follow.
In addition to its cash-generative
mines within the portfolio, the
Company now has development and
growth projects in each of the four
regions in which it operates.
In South Africa, we have South Deep
which is still a mine in build-up. In
Ghana the re-capitalisation of
Damang is essentially the equivalent
of developing a new mine, while our
investment in the Gruyere joint
venture will lead to the construction
of a new mine in Western Australia.
Finally, in the Americas region, we
are set to conclude a pre-feasibility
study on the Salares Norte project
in northern Chile by mid-2017.
These projects are important in
terms of their contribution to the
strategic objectives of Gold Fields,
namely to maintain and grow
cash-flow on a sustainable basis.
They are all forecast to operate at
All-in Costs (AIC) which are lower
than the current AIC of the Group
once steady-state levels of
production are realised – as such the
Group’s overall cost of production
will reduce over time and the quality
of the portfolio will improve.
At South Deep, we have announced
the rebase plan, which is anticipated
to position the mine at a steady-state
production of about 500,000 ounces
per year by 2022, at AIC (in 2017
terms) of below US$900/oz. Similarly,
the Damang project has projected
AIC, including upfront capital
development, of US$950/oz, and the
Gruyere project AIC of US$805/oz,
including upfront capital. Although
the Salares Norte pre-feasibility study
is still to be concluded, we anticipate
that AIC is likely to be lower than
these levels due to the high grades
and the likelihood that this will be an
open-pit operation.
Furthermore, we continue to invest in
brownfields exploration in Australia
with the objective of not only replacing
what we mine each year, but also with
the aim of increasing our resources
and reserves at a higher quality than
what has been mined previously. We
will continue to look for life extension
opportunities at Cerro Corona,
through economic additions to both
the tailings and waste facilities, as well
as through brownfields exploration on
Cerro Corona porphyry style systems
in the vicinity of the mine. Tarkwa has
a strong resource position, but we are
stepping up our efforts to convert
some of these to reserves and to look
for opportunities for other styles of
mineralisation across the lease. The
Kobada Hill prospect has emerged as
an interesting hydrothermal style
target with encouraging geology and
controlled mineralisation with good
continuity. In due course underground
mining could potentially offer
opportunities at Tarkwa.
These investments, we believe, will
achieve a measure of success over
the next three years thereby
maintaining and sustaining strong
cash-flows from the operations.
Amid the strong investment drive at
Gold Fields, some shareholders have
been asking whether we have
changed our strategic focus from
cash generation to a drive for
long-term production. This is not the
case and I want to stress that the
main objective underpinning Gold
Fields’ strategy remains the
generation of sustainable and
increasing cash-flow. The focus on
cash-flow is two-fold in that it entails
growing our cash-flow margin and
absolute cash-flow and then
distributing this in the form of
dividends and repaying debt.
To continue expanding margins and
distributing cash, the long-term
sustainability of the business must
be kept intact. This requires investing
to extend the life of our assets,
ensuring we maintain our regulatory
and social licences to operate,
strong corporate governance and
retaining our people, who are key to
the success of our business. It also
entails maintaining a healthy balance
sheet and not taking on too much
debt, which might lead the Company
into financial difficulties should the
macro-economic environment turn
against it.
So, the challenge facing Gold Fields’
management is to balance
distributing the cash we generate
with reinvestment into our assets to
ensure that our portfolio of mines
generates cash sustainably into the
foreseeable future.
The key financial objectives of Gold
Fields’ strategy include: » Meeting our production and cost
guidance » Generating a 15% FCF margin at a
US$1,300/oz gold price » Paying 25% – 35% of normalised
earnings as dividends » Maintaining a net debt to adjusted
EBITDA ratio of 1.0x or below if
possible » Extending the life of our Australian
portfolio through brownfields
exploration » Pursuing value-accretive
acquisitions » Successfully implementing the
South Deep rebase plan
2017 is a year where the Company is
expected to spend more than it will
bring in, but with the view to
achieving and increasing sustainable
cash-flow generation over the
medium to long term. The alternative
is to harvest the assets over five or
six years – we don’t believe that this
is in the best long-term interests of
either shareholders or other
stakeholders in the Company.
As we embark on the Company’s
reinvestment drive it is critical that
the “sins of the past” must not be
repeated in terms of poor capital
allocation. Instead, we will pursue
only those investments and capital
expenditures that have a clear
path to pay-backs and returns.
Furthermore, we need to optimally
manage our ore bodies in terms of
grade management and ongoing
sustainable capital expenditure by
planning for outcomes that optimise
the life of the ore body (and thus
optionality) and cash-flow.
Lead
ersh
ip, g
over
nanc
e
and
mat
eria
lity
The Gold Fields Integrated Annual Report 201631
I am confident that Gold Fields has
put in place the strategies that will
ensure sustained value creation in
the medium to long term and will see
the Company through the vagaries
of the gold price cycle. I also believe
that this strategy will be positively
received by investors. Management
has aligned itself with its investors
through its long-term incentive
scheme, a large portion of which
relates to the performance of the
share price. If we stay the course
on which we have embarked I am
confident that the share price will
reflect the strong operational
performance of the Company, its
strong cash-flow generation and its
significant investment in its future
profitable growth.
Gold Price OutlookThe gold price continues to defy
most analysts’ projections. Amid
Brexit and the outcome of the US
presidential election, to name just
two events that contributed to
political and economic uncertainty
in 2016, the gold price, should have
been significantly higher than it is
today, in our opinion. This has not
been the case. I would also expect
that the performance of gold in 2017
is likely to be undermined by
continued inflows into equity markets
and further US interest rate hikes.
Gold Fields is thus planning its
business for 2017 on the assumption
of a US$1,100/oz gold price.
Our longer-term outlook, however, is
more optimistic. While gold prices in
the short term will be largely dictated
by macro events, in the longer-term
supply and demand fundamentals
cannot be ignored. On the supply
side, research we have undertaken
indicates that primary gold supply is
close to a peak and likely to decline
in the years to come. This is largely
due to the cut in exploration
spending as well as the dearth of
new mines being built. This is
exacerbated by declines in grades
and increasing depth and complexity
of ore bodies being mined.
Demand in India and China, while
significantly down on its highs over the
last five years, should remain strong
given economic growth, rising
urbanisation and traditional affinity
towards gold in those countries.
Central banks continue to buy and it
appears that most of the central banks
that were looking to sell gold have
already done so.
These factors bode well for the future
of gold and we do expect to see a
higher gold price in the next five
years. And while some have
questioned the continued safe-haven
status of gold in times of political and
economic uncertainty, we believe that
the longer-term effects of the current
geopolitical turmoil will eventually
work their way through to a firmer
gold price. Investors will continue to
diversify some of their risk into gold,
both as a hedge against inflation and
currency volatility.
The message that we take out of all
of this is that we should position the
Gold Fields’ portfolio to withstand
lower gold prices, but retain the
flexibility in the portfolio to benefit
from any upside in gold through
improved margins.
Gold Mining Industry Performance and OutlookDuring the past year Gold Fields
undertook an analysis of the
performance of the top gold
producers in the industry over the
past four years. This research is
summarised on p34 – 35. On the
whole the industry has responded
well to the reduction in the gold price
since 2012 and has brought back
the focus to profitability and cash-
flow. As a consequence margins
have improved and balance sheets
have been derisked.
However, we need to be careful
before claiming victory as external
factors, like weaker exchange rates
against the US Dollar and lower oil
prices, have helped significantly. Also
there is a suspicion that sustaining
capital may have been cut, the
effects of which will be realised later.
Much the same happened in the
early 2000s after the gold price
recovered from US$250/oz.
Furthermore, many companies will
have some concerns about their
future production profiles given the
large cut-backs in both exploration
and project expenditures, and will be
looking to fill these potential gaps
over the next year or two. Mergers
and acquisitions have as a result
become more competitive and are
the reason why high premiums are
being paid for good assets in
production.
Gold companies have done as well
as they can be expected to in terms
of reducing their costs, and there is
a greater probability of costs rising
from here onwards. This could be
exacerbated if there is an overall
mining recovery and we revert back
to annual mining cost inflation of
between 8-10%, as it was a few
years back. Should that happen,
further rationalisation in the industry,
with all the concurrent job losses,
would then be inevitable. It is thus
imperative that we learn the lessons
from the past and be cautious about
expanding by taking on more debt
as we did previously. Debt has a
role, but capital allocation must be
disciplined if debt is taken on board.
The industry’s work is not yet done.
Guidance for 2017Gold Fields’ business plan for 2017
takes into account a largely
unchanged gold price and our
budgets have been built around
an anticipated average price of
US$1,100/oz (A$1,500/oz,
R500,000/kg) – the same we used
during 2016. The investment in our
business is a priority for 2017, which
includes US$20m for South Deep,
US$120m for Damang, US$112m for
Gruyere and US$64m for Salares
Norte. As a result our AIC cost
guidance for 2017 is US$1,170/oz –
US$1,190/oz compared to US$1,006/
oz in 2016. The guidance for AISC is
US$1,010/oz – US$1,030/oz
compared to US$980/oz in 2016.
Capital expenditure for the year is
forecast to rise to US$869m (2016:
US$650m).
Our production guidance for the year
is 2.10 – 2.15Moz, compared with
the 2.15Moz achieved in 2016.
Notable contributions for 2017 are: » A further rise in production at
South Deep from 290,000oz in
2016 to 315,000oz » A decline in Damang’s production
to 120,000oz from 148,000oz in
2016 » Stable production profiles at
Tarkwa and our remaining three
Australian mines » A rise in gold-equivalent
production at Cerro Corona from
270,000oz in 2016 to 290,000oz
in 2017 due to expectations of
higher copper prices
CEO Report (continued)
The Gold Fields Integrated Annual Report 201632

Stakeholder Engagement for 2017Gold Fields’ prosperity in the short
and longer term is, as I have stated
before, critically dependent on
societal acceptance. This can only
be achieved through transparent and
mutually beneficial relationships with
governments at all levels (national,
regional and local), organised labour
and host communities. Our
corporate and regional management
teams have been tasked with
intensifying stakeholder
engagements in 2017 to ensure
that we operate in a business
environment that allows us to work
profitably to the benefit of all
stakeholders.
The development agreement that
we entered into with the Ghanaian
Government in 2016 is testament to
the benefits of open and honest
dialogue with stakeholders. The new
royalty regime ensures that both
parties share the pain in a low
gold-price environment, but benefit
when the price rises above targeted
levels. It is a model we believe can
be replicated in many of the
jurisdictions in which we operate.
In South Africa, Gold Fields has
dedicated substantial human and
capital resources towards meeting
the targets of the 2010 Mining
Charter, including the Black
Economic Empowerment target
of 26% ownership, which we
exceeded. We will continue to
support the transformation of the
sector to make it truly representative
of the South African population.
True transformation will take time and
cannot happen without the financial
backing of investors, many of whom
have fled the sector over the past
few years amid poor returns on their
capital. As the South African
Government drafts critical policies
based on these engagements we
urge it to avoid additional fiscal or
regulatory burdens that will inevitably
further stifle the growth of the sector.
Directly, and through the Chamber of
Mines, we have and will be engaging
the South African Government on
three key issues that were supposed
to be addressed in 2016, but have
still not been finalised: the review of
the Mining Charter; the once-
empowered, always-empowered
principle in Black Economic
Empowerment ownership of mining
companies; and the finalisation of
amendments to the Mineral and
Petroleum Resources Development
Act. In addition, we remain
committed to extensive engagement
with communities around our South
Deep mine, both through direct
interaction but also in alliance with
other gold miners operating in the
area, particularly Sibanye Gold.
In Peru, the mining industry is
working closely with the new
business-friendly government to find
joint solutions to the social and
environmental issues that appear to
be the root causes of the distrust
towards the sector by local
communities. Engagement with
these communities and their
representative organisations is critical
for our Cerro Corona mine, but will
only yield sustainable success if it is
supported by government at
national, regional and local levels.
In Australia we expect our solid
working relationship with industry
regulators to continue.
I would like to reiterate a
commitment I have made on a
number of occasions. For the mining
sector to benefit all its stakeholders
we have to work in partnership to
grow the mining economy.
Distributing smaller slices of a
shrinking mining pie will inevitably
lead to a gradual decline in the
industry.
NOTE OF THANKSI would like to express my gratitude
to my fellow directors, led by our
Chairperson, Cheryl Carolus and
welcome the five new directors to
the Board. The Board’s experience
and guidance to the executive
management team ensured that
Gold Fields is now reaping the
rewards of its transformation
strategy, whose implementation
demanded so much of their time,
energy and wealth of experience.
The skills set of the Executive
Committee was strengthened during
2016 with the appointment of former
MMG executive Richard Butcher as
Executive Vice-President (EVP)
Technical. Richard has technical
oversight and guidance throughout
the Group and has overseen the
development of a Group-wide
integrated T&I strategy, which will be
implemented over the next few
years. There have also been some
changes among our regional EVPs.
Luis Rivera, also from MMG where
he headed the construction of the
massive Las Bambas copper mine in
Peru, replaced Ernesto Balarezo as
Americas’ EVP in October 2016 and
Stuart Mathews, our Head of
Operations in the region took over
from Richard Weston, who retired, as
Australasia’s EVP in February 2017.
I would like to express my sincere
thanks to Ernesto and Richard for
their leadership and contribution to
Gold Fields. Nico Muller, EVP for
South Africa, who has been
instrumental in the turnaround of
South Deep, will be leaving Gold
Fields in March 2017 to join Impala
Platinum as CEO. I have valued
Nico’s leadership at South Deep,
which included building a strong
team to implement the rebase plan
announced in February. We are
currently conducting a search for his
replacement.
Finally, I would like to express my
sincere gratitude to all the employees
of Gold Fields for the resilience,
commitment and long hours they put
in to ensure the operational and
sustainable financial success of the
Group. They have adapted well to
the transition from the consolidation
of the Group in the low gold price
environment to the investment phase
we are currently entering. I know
I can rely on my teams to grow the
Company in line with the values and
strategic priorities set by the Board.
The Gold Fields team rivals any of
our peers in terms of experience,
technical ability and, above all,
enthusiasm and energy. I am proud
to be leading it.
Nick Holland
CEO
Lead
ersh
ip, g
over
nanc
e
and
mat
eria
lity
The Gold Fields Integrated Annual Report 201633
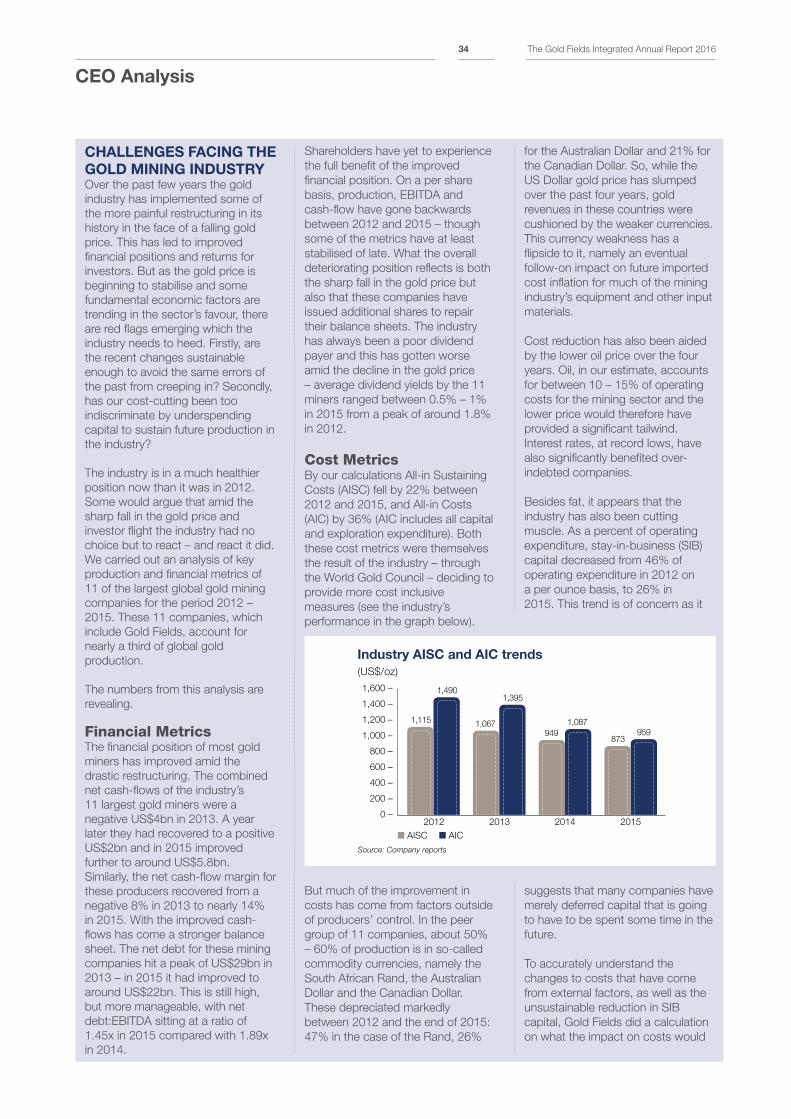
Shareholders have yet to experience
the full benefit of the improved
financial position. On a per share
basis, production, EBITDA and
cash-flow have gone backwards
between 2012 and 2015 – though
some of the metrics have at least
stabilised of late. What the overall
deteriorating position reflects is both
the sharp fall in the gold price but
also that these companies have
issued additional shares to repair
their balance sheets. The industry
has always been a poor dividend
payer and this has gotten worse
amid the decline in the gold price
– average dividend yields by the 11
miners ranged between 0.5% – 1%
in 2015 from a peak of around 1.8%
in 2012.
Cost MetricsBy our calculations All-in Sustaining
Costs (AISC) fell by 22% between
2012 and 2015, and All-in Costs
(AIC) by 36% (AIC includes all capital
and exploration expenditure). Both
these cost metrics were themselves
the result of the industry – through
the World Gold Council – deciding to
provide more cost inclusive
measures (see the industry’s
performance in the graph below).
But much of the improvement in
costs has come from factors outside
of producers’ control. In the peer
group of 11 companies, about 50%
– 60% of production is in so-called
commodity currencies, namely the
South African Rand, the Australian
Dollar and the Canadian Dollar.
These depreciated markedly
between 2012 and the end of 2015:
47% in the case of the Rand, 26%
suggests that many companies have
merely deferred capital that is going
to have to be spent some time in the
future.
To accurately understand the
changes to costs that have come
from external factors, as well as the
unsustainable reduction in SIB
capital, Gold Fields did a calculation
on what the impact on costs would
for the Australian Dollar and 21% for
the Canadian Dollar. So, while the
US Dollar gold price has slumped
over the past four years, gold
revenues in these countries were
cushioned by the weaker currencies.
This currency weakness has a
flipside to it, namely an eventual
follow-on impact on future imported
cost inflation for much of the mining
industry’s equipment and other input
materials.
Cost reduction has also been aided
by the lower oil price over the four
years. Oil, in our estimate, accounts
for between 10 – 15% of operating
costs for the mining sector and the
lower price would therefore have
provided a significant tailwind.
Interest rates, at record lows, have
also significantly benefited over-
indebted companies.
Besides fat, it appears that the
industry has also been cutting
muscle. As a percent of operating
expenditure, stay-in-business (SIB)
capital decreased from 46% of
operating expenditure in 2012 on
a per ounce basis, to 26% in
2015. This trend is of concern as it
CEO Analysis
CHALLENGES FACING THE
GOLD MINING INDUSTRYOver the past few years the gold
industry has implemented some of
the more painful restructuring in its
history in the face of a falling gold
price. This has led to improved
financial positions and returns for
investors. But as the gold price is
beginning to stabilise and some
fundamental economic factors are
trending in the sector’s favour, there
are red flags emerging which the
industry needs to heed. Firstly, are
the recent changes sustainable
enough to avoid the same errors of
the past from creeping in? Secondly,
has our cost-cutting been too
indiscriminate by underspending
capital to sustain future production in
the industry?
The industry is in a much healthier
position now than it was in 2012.
Some would argue that amid the
sharp fall in the gold price and
investor flight the industry had no
choice but to react – and react it did.
We carried out an analysis of key
production and financial metrics of
11 of the largest global gold mining
companies for the period 2012 –
2015. These 11 companies, which
include Gold Fields, account for
nearly a third of global gold
production.
The numbers from this analysis are
revealing.
Financial MetricsThe financial position of most gold
miners has improved amid the
drastic restructuring. The combined
net cash-flows of the industry’s
11 largest gold miners were a
negative US$4bn in 2013. A year
later they had recovered to a positive
US$2bn and in 2015 improved
further to around US$5.8bn.
Similarly, the net cash-flow margin for
these producers recovered from a
negative 8% in 2013 to nearly 14%
in 2015. With the improved cash-
flows has come a stronger balance
sheet. The net debt for these mining
companies hit a peak of US$29bn in
2013 – in 2015 it had improved to
around US$22bn. This is still high,
but more manageable, with net
debt:EBITDA sitting at a ratio of
1.45x in 2015 compared with 1.89x
in 2014.
Industry AISC and AIC trends
(US$/oz)
1,600 –
1,400 –
1,200 –
1,000 –
800 –
600 –
400 –
200 –
0 –2012 2013 2014 2015
AISC AIC
1,115
1,490
1,067
1,395
949
1,087
873959
Source: Company reports
The Gold Fields Integrated Annual Report 201634
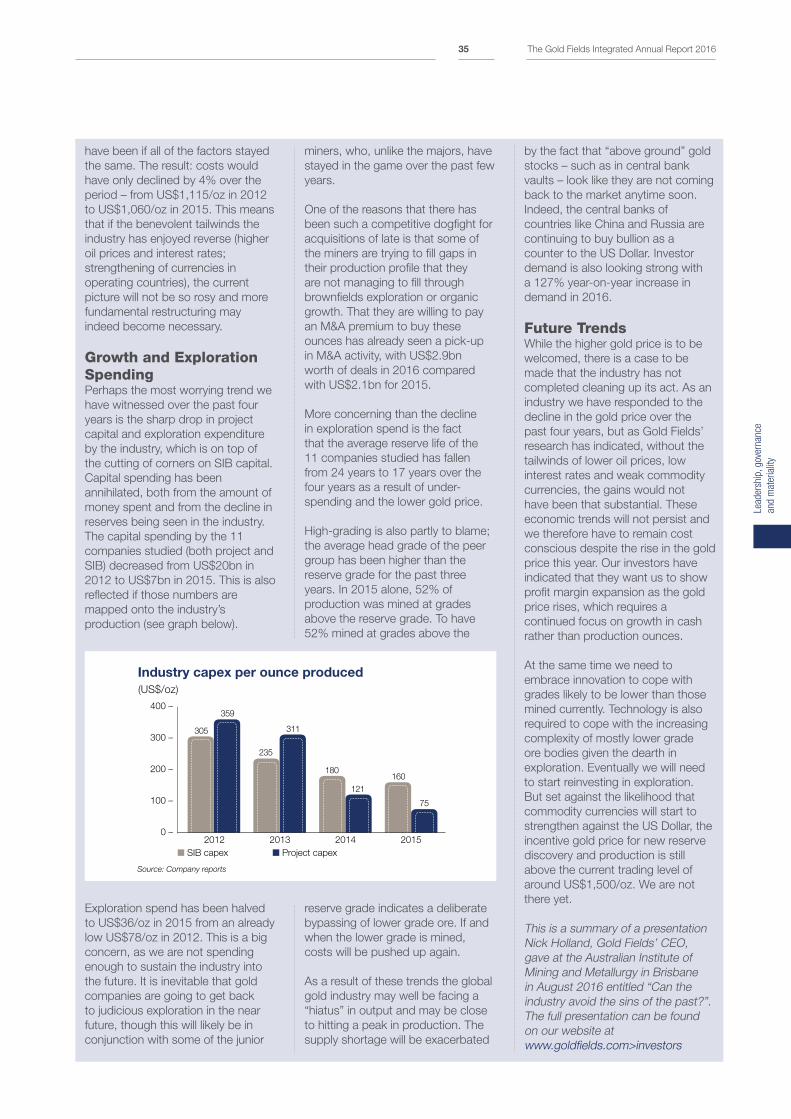
have been if all of the factors stayed
the same. The result: costs would
have only declined by 4% over the
period – from US$1,115/oz in 2012
to US$1,060/oz in 2015. This means
that if the benevolent tailwinds the
industry has enjoyed reverse (higher
oil prices and interest rates;
strengthening of currencies in
operating countries), the current
picture will not be so rosy and more
fundamental restructuring may
indeed become necessary.
Growth and Exploration SpendingPerhaps the most worrying trend we
have witnessed over the past four
years is the sharp drop in project
capital and exploration expenditure
by the industry, which is on top of
the cutting of corners on SIB capital.
Capital spending has been
annihilated, both from the amount of
money spent and from the decline in
reserves being seen in the industry.
The capital spending by the 11
companies studied (both project and
SIB) decreased from US$20bn in
2012 to US$7bn in 2015. This is also
reflected if those numbers are
mapped onto the industry’s
production (see graph below).
Industry capex per ounce produced
(US$/oz)
2012 2013 2014 2015
305
359
235
311
180
121
160
75
SIB capex Project capex
Source: Company reports
400 –
300 –
200 –
100 –
0 –
by the fact that “above ground” gold
stocks – such as in central bank
vaults – look like they are not coming
back to the market anytime soon.
Indeed, the central banks of
countries like China and Russia are
continuing to buy bullion as a
counter to the US Dollar. Investor
demand is also looking strong with
a 127% year-on-year increase in
demand in 2016.
Future TrendsWhile the higher gold price is to be
welcomed, there is a case to be
made that the industry has not
completed cleaning up its act. As an
industry we have responded to the
decline in the gold price over the
past four years, but as Gold Fields’
research has indicated, without the
tailwinds of lower oil prices, low
interest rates and weak commodity
currencies, the gains would not
have been that substantial. These
economic trends will not persist and
we therefore have to remain cost
conscious despite the rise in the gold
price this year. Our investors have
indicated that they want us to show
profit margin expansion as the gold
price rises, which requires a
continued focus on growth in cash
rather than production ounces.
At the same time we need to
embrace innovation to cope with
grades likely to be lower than those
mined currently. Technology is also
required to cope with the increasing
complexity of mostly lower grade
ore bodies given the dearth in
exploration. Eventually we will need
to start reinvesting in exploration.
But set against the likelihood that
commodity currencies will start to
strengthen against the US Dollar, the
incentive gold price for new reserve
discovery and production is still
above the current trading level of
around US$1,500/oz. We are not
there yet.
This is a summary of a presentation
Nick Holland, Gold Fields’ CEO,
gave at the Australian Institute of
Mining and Metallurgy in Brisbane
in August 2016 entitled “Can the
industry avoid the sins of the past?”.
The full presentation can be found
on our website at
www.goldfields.com>investors
Exploration spend has been halved
to US$36/oz in 2015 from an already
low US$78/oz in 2012. This is a big
concern, as we are not spending
enough to sustain the industry into
the future. It is inevitable that gold
companies are going to get back
to judicious exploration in the near
future, though this will likely be in
conjunction with some of the junior
reserve grade indicates a deliberate
bypassing of lower grade ore. If and
when the lower grade is mined,
costs will be pushed up again.
As a result of these trends the global
gold industry may well be facing a
“hiatus” in output and may be close
to hitting a peak in production. The
supply shortage will be exacerbated
miners, who, unlike the majors, have
stayed in the game over the past few
years.
One of the reasons that there has
been such a competitive dogfight for
acquisitions of late is that some of
the miners are trying to fill gaps in
their production profile that they
are not managing to fill through
brownfields exploration or organic
growth. That they are willing to pay
an M&A premium to buy these
ounces has already seen a pick-up
in M&A activity, with US$2.9bn
worth of deals in 2016 compared
with US$2.1bn for 2015.
More concerning than the decline
in exploration spend is the fact
that the average reserve life of the
11 companies studied has fallen
from 24 years to 17 years over the
four years as a result of under-
spending and the lower gold price.
High-grading is also partly to blame;
the average head grade of the peer
group has been higher than the
reserve grade for the past three
years. In 2015 alone, 52% of
production was mined at grades
above the reserve grade. To have
52% mined at grades above the
Lead
ersh
ip, g
over
nanc
e
and
mat
eria
lity
The Gold Fields Integrated Annual Report 201635
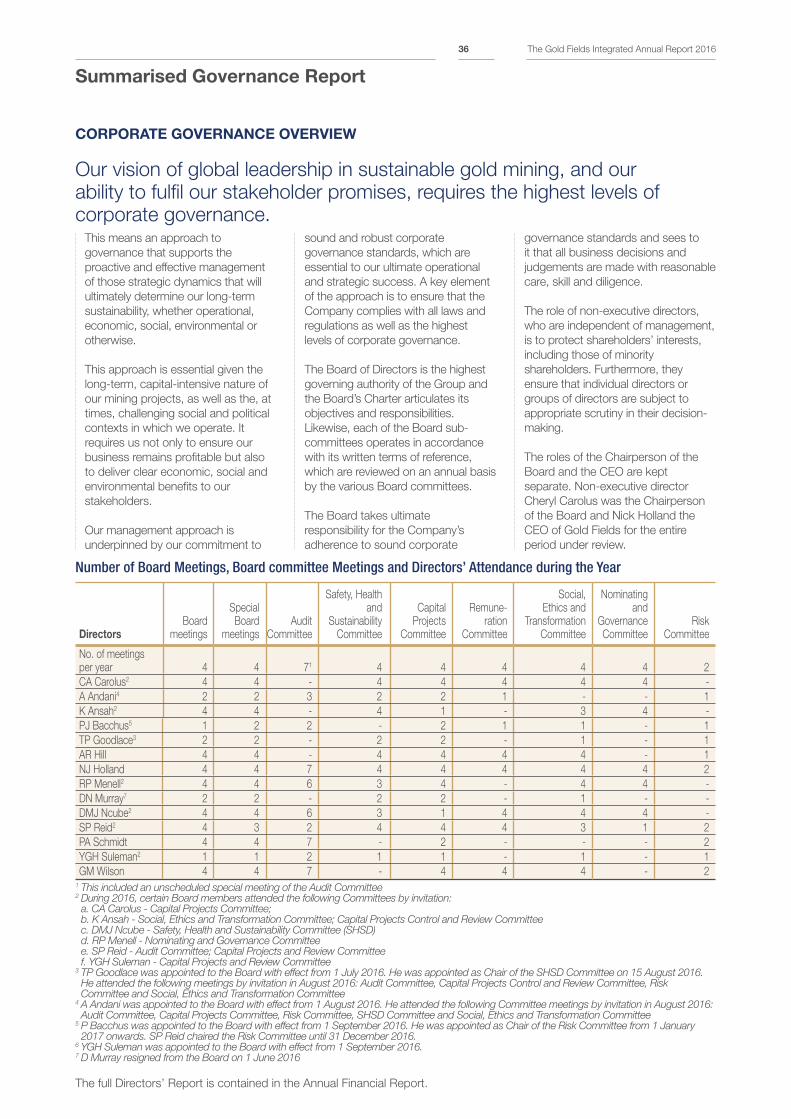
Summarised Governance Report
This means an approach to
governance that supports the
proactive and effective management
of those strategic dynamics that will
ultimately determine our long-term
sustainability, whether operational,
economic, social, environmental or
otherwise.
This approach is essential given the
long-term, capital-intensive nature of
our mining projects, as well as the, at
times, challenging social and political
contexts in which we operate. It
requires us not only to ensure our
business remains profitable but also
to deliver clear economic, social and
environmental benefits to our
stakeholders.
Our management approach is
underpinned by our commitment to
sound and robust corporate
governance standards, which are
essential to our ultimate operational
and strategic success. A key element
of the approach is to ensure that the
Company complies with all laws and
regulations as well as the highest
levels of corporate governance.
The Board of Directors is the highest
governing authority of the Group and
the Board’s Charter articulates its
objectives and responsibilities.
Likewise, each of the Board sub-
committees operates in accordance
with its written terms of reference,
which are reviewed on an annual basis
by the various Board committees.
The Board takes ultimate
responsibility for the Company’s
adherence to sound corporate
governance standards and sees to
it that all business decisions and
judgements are made with reasonable
care, skill and diligence.
The role of non-executive directors,
who are independent of management,
is to protect shareholders’ interests,
including those of minority
shareholders. Furthermore, they
ensure that individual directors or
groups of directors are subject to
appropriate scrutiny in their decision-
making.
The roles of the Chairperson of the
Board and the CEO are kept
separate. Non-executive director
Cheryl Carolus was the Chairperson
of the Board and Nick Holland the
CEO of Gold Fields for the entire
period under review.
CORPORATE GOVERNANCE OVERVIEW
Our vision of global leadership in sustainable gold mining, and our
ability to fulfil our stakeholder promises, requires the highest levels of
corporate governance.
Number of Board Meetings, Board committee Meetings and Directors’ Attendance during the Year
DirectorsBoard
meetings
Special Board
meetingsAudit
Committee
Safety, Health and
Sustainability Committee
Capital Projects
Committee
Remune-ration
Committee
Social, Ethics and
TransformationCommittee
Nominating and
Governance Committee
Risk Committee
No. of meetings per year 4 4 71 4 4 4 4 4 2
CA Carolus2 4 4 - 4 4 4 4 4 -
A Andani4 2 2 3 2 2 1 - - 1
K Ansah2 4 4 - 4 1 - 3 4 -
PJ Bacchus5 1 2 2 - 2 1 1 - 1
TP Goodlace3 2 2 - 2 2 - 1 - 1
AR Hill 4 4 - 4 4 4 4 - 1
NJ Holland 4 4 7 4 4 4 4 4 2
RP Menell2 4 4 6 3 4 - 4 4 -
DN Murray7 2 2 - 2 2 - 1 - -
DMJ Ncube2 4 4 6 3 1 4 4 4 -
SP Reid2 4 3 2 4 4 4 3 1 2
PA Schmidt 4 4 7 - 2 - - - 2
YGH Suleman2 1 1 2 1 1 - 1 - 1
GM Wilson 4 4 7 - 4 4 4 - 21 This included an unscheduled special meeting of the Audit Committee2 During 2016, certain Board members attended the following Committees by invitation: a. CA Carolus - Capital Projects Committee; b. K Ansah - Social, Ethics and Transformation Committee; Capital Projects Control and Review Committee c. DMJ Ncube - Safety, Health and Sustainability Committee (SHSD) d. RP Menell - Nominating and Governance Committee e. SP Reid - Audit Committee; Capital Projects and Review Committee f. YGH Suleman - Capital Projects and Review Committee3 TP Goodlace was appointed to the Board with effect from 1 July 2016. He was appointed as Chair of the SHSD Committee on 15 August 2016. He attended the following meetings by invitation in August 2016: Audit Committee, Capital Projects Control and Review Committee, Risk Committee and Social, Ethics and Transformation Committee
4 A Andani was appointed to the Board with effect from 1 August 2016. He attended the following Committee meetings by invitation in August 2016: Audit Committee, Capital Projects Committee, Risk Committee, SHSD Committee and Social, Ethics and Transformation Committee
5 P Bacchus was appointed to the Board with effect from 1 September 2016. He was appointed as Chair of the Risk Committee from 1 January 2017 onwards. SP Reid chaired the Risk Committee until 31 December 2016.
6 YGH Suleman was appointed to the Board with effect from 1 September 2016.7 D Murray resigned from the Board on 1 June 2016
The full Directors’ Report is contained in the Annual Financial Report.
The Gold Fields Integrated Annual Report 201636

Board and Board Sub-committees
- BOARD -Meets four times per year
Chairperson: Cheryl Carolus
The Board of Directors is the highest governing authority of the Group and takes ultimate responsibility for the
Company’s adherence to sound corporate governance standards. It sets the Company’s strategy and sees to it
that all business decisions and judgements are made with
reasonable care, skill and diligence.
NOMINATING AND GOVERNANCE COMMITTEE
Meets four times per year
Chairperson: Cheryl CarolusPrepares and recommends governance
principles applicable to the Group. Keeps abreast of best corporate governance
practices. Evaluates the effectiveness and qualifications of the Board and its
committees. Responsible for directors’ succession planning. Develops and
recommends to the Board criteria for the selection of directors and senior executives.
Members: Don Ncube and Steven Reid
REMUNERATION COMMITTEE
Meets four times per year
Chairperson: Steven ReidDetermines and monitors the
remuneration and contractual terms of the Executive, Directors and
Group Exco members, and evaluate their individual performances to ensure
fair remuneration.
Members: Cheryl Carolus, Don Ncube, Steven Reid,
Gayle Wilson, Alhassan Andani and Peter Bacchus
AUDITCOMMITTEE
Meets six times per year
Chairperson: Gayle WilsonAppoints the independent auditor and
oversees the auditing process. Ensures legal and regulatory compliance including the effective implementation of
the Code of Conduct. Ensures the integrity, accuracy
and adequacy of accounting records.
Members: Rick Menell, Don Ncube, Alhassan Andani,
Peter Bacchus and Yunus Suleman
SAFETY, HEALTH AND SUSTAINABILITY COMMITTEE
Meets four times per year
Chairperson: Terence GoodlaceCompliance with relevant laws, regulations and external standards, recommends and
reviews policy relating to safety, health and sustainable development,
monitors key indicators relating to accidents and incidents and evaluates the Group’s conformance with the principles of the
International Council on Mining and Metals and the principles of the Global Compact.
Members: Cheryl Carolus, Alhassan Andani,
Rick Menell, Steven Reid and Yunus Suleman
SOCIAL AND ETHICS COMMITTEE
Meets four times per year
Chairperson: Don NcubeNow the Social, Ethics and Transformation
Committee. Develops, implements and monitors policy regarding anti-corruption and
employment equity policies, monitors all executive actions regarding the Groups standing as a good corporate citizen,
monitors the Group’s Code of Ethics, and investigate, resolve and review any matters
which may be in violation of the Code
Members: Cheryl Carolus, Rick Menell,
Gayle Wilson, Terence Goodlace and Yunus Suleman
CAPITAL PROJECTS COMMITTEE
Meets four times per year
Chairperson: Rick MenellPlans, implements and monitors new capital expenditure projects,
evaluating on completion and reporting findings to the Board.
Members: Peter Bacchus, Terence Goodlace,
Steven Reid and Gayle Wilson
RISK COMMITTEE
Meets twice times per year
Chairperson: Peter BacchusEvaluates risk assessments and ensures effective risk management policies are in place. Reviews insurance and other risk
transfer arrangements, ensuring appropriate coverage is in place. Reviews the business
contingency planning process within the Group
Members: Alhassan Andani, Steven Reid,
Terence Goodlace, Yunus Suleman and Gayle Wilson
1
2
3
45
6
7
This reflects current membership for 1 January 2017.2016 membership is reflected on p36.
Lead
ersh
ip, g
over
nanc
e
and
mat
eria
lity
The Gold Fields Integrated Annual Report 201637
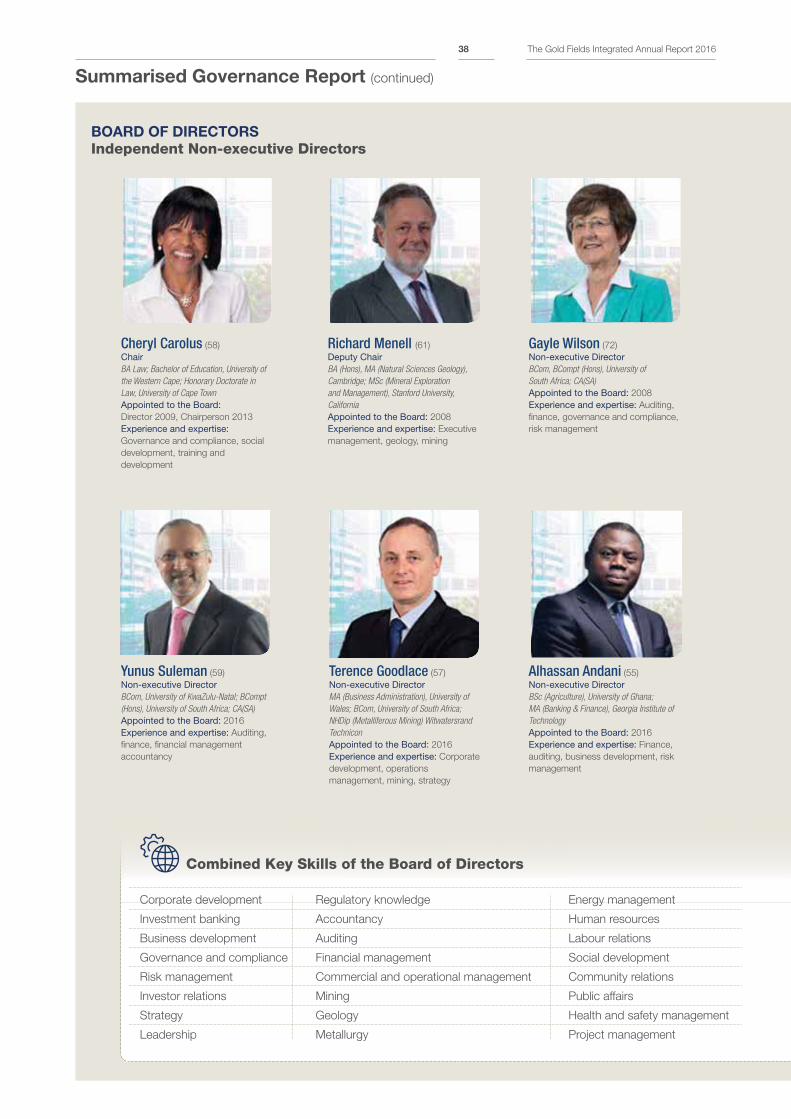
Summarised Governance Report (continued)
BOARD OF DIRECTORS
Independent Non-executive Directors
Cheryl Carolus (58)
ChairBA Law; Bachelor of Education, University of
the Western Cape; Honorary Doctorate in
Law, University of Cape Town
Appointed to the Board: Director 2009, Chairperson 2013
Experience and expertise: Governance and compliance, social
development, training and
development
Alhassan Andani (55)
Non-executive DirectorBSc (Agriculture), University of Ghana;
MA (Banking & Finance), Georgia Institute of
Technology
Appointed to the Board: 2016
Experience and expertise: Finance,
auditing, business development, risk
management
Richard Menell (61)
Deputy ChairBA (Hons), MA (Natural Sciences Geology),
Cambridge; MSc (Mineral Exploration
and Management), Stanford University,
California
Appointed to the Board: 2008
Experience and expertise: Executive
management, geology, mining
Yunus Suleman (59)
Non-executive DirectorBCom, University of KwaZulu-Natal; BCompt
(Hons), University of South Africa; CA(SA)
Appointed to the Board: 2016
Experience and expertise: Auditing,
finance, financial management
accountancy
Gayle Wilson (72)
Non-executive DirectorBCom, BCompt (Hons), University of
South Africa; CA(SA)
Appointed to the Board: 2008
Experience and expertise: Auditing,
finance, governance and compliance,
risk management
Terence Goodlace (57)
Non-executive DirectorMA (Business Administration), University of
Wales; BCom, University of South Africa;
NHDip (Metalliferous Mining) Witwatersrand
Technicon
Appointed to the Board: 2016
Experience and expertise: Corporate
development, operations
management, mining, strategy
Corporate development
Investment banking
Business development
Governance and compliance
Risk management
Investor relations
Strategy
Leadership
Combined Key Skills of the Board of Directors
Regulatory knowledge
Accountancy
Auditing
Financial management
Commercial and operational management
Mining
Geology
Metallurgy
Energy management
Human resources
Labour relations
Social development
Community relations
Public affairs
Health and safety management
Project management
The Gold Fields Integrated Annual Report 201638
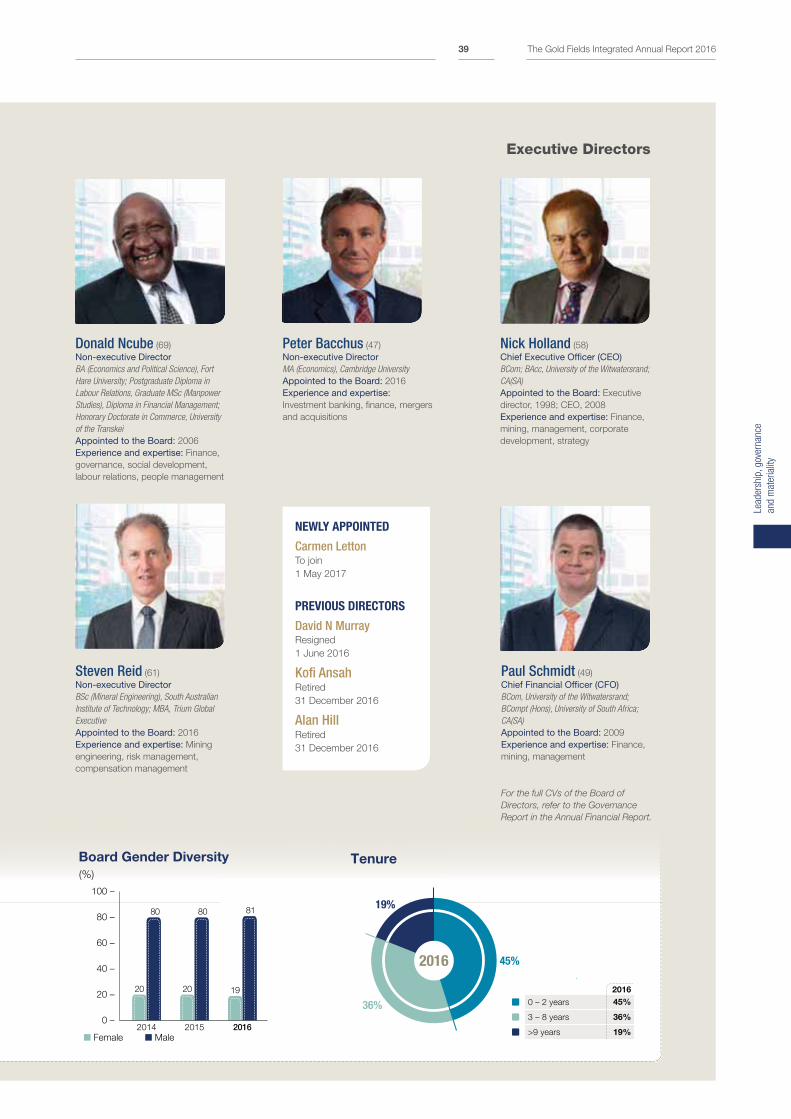
Executive Directors
Steven Reid (61)
Non-executive DirectorBSc (Mineral Engineering), South Australian
Institute of Technology; MBA, Trium Global
Executive
Appointed to the Board: 2016
Experience and expertise: Mining
engineering, risk management,
compensation management
Peter Bacchus (47)
Non-executive DirectorMA (Economics), Cambridge University
Appointed to the Board: 2016
Experience and expertise: Investment banking, finance, mergers
and acquisitions
Nick Holland (58)
Chief Executive Officer (CEO)BCom; BAcc, University of the Witwatersrand;
CA(SA)
Appointed to the Board: Executive
director, 1998; CEO, 2008
Experience and expertise: Finance,
mining, management, corporate
development, strategy
NEWLY APPOINTED
Carmen LettonTo join
1 May 2017
PREVIOUS DIRECTORS
David N MurrayResigned
1 June 2016
Kofi AnsahRetired
31 December 2016
Alan HillRetired
31 December 2016
Paul Schmidt (49)
Chief Financial Officer (CFO)BCom, University of the Witwatersrand;
BCompt (Hons), University of South Africa;
CA(SA)
Appointed to the Board: 2009
Experience and expertise: Finance,
mining, management
Donald Ncube (69)
Non-executive DirectorBA (Economics and Political Science), Fort
Hare University; Postgraduate Diploma in
Labour Relations, Graduate MSc (Manpower
Studies), Diploma in Financial Management;
Honorary Doctorate in Commerce, University
of the Transkei
Appointed to the Board: 2006
Experience and expertise: Finance,
governance, social development,
labour relations, people management
For the full CVs of the Board of
Directors, refer to the Governance
Report in the Annual Financial Report.
45%
36%
2016
19%
Tenure
Female Male
Board Gender Diversity
(%)
100 –
80 –
60 –
40 –
20 –
0 –2014 2015 2016
20
80 80 81
20 19
0 – 2 years
3 – 8 years
>9 years
2016
45%
36%
19%
Lead
ersh
ip, g
over
nanc
e
and
mat
eria
lity
The Gold Fields Integrated Annual Report 201639
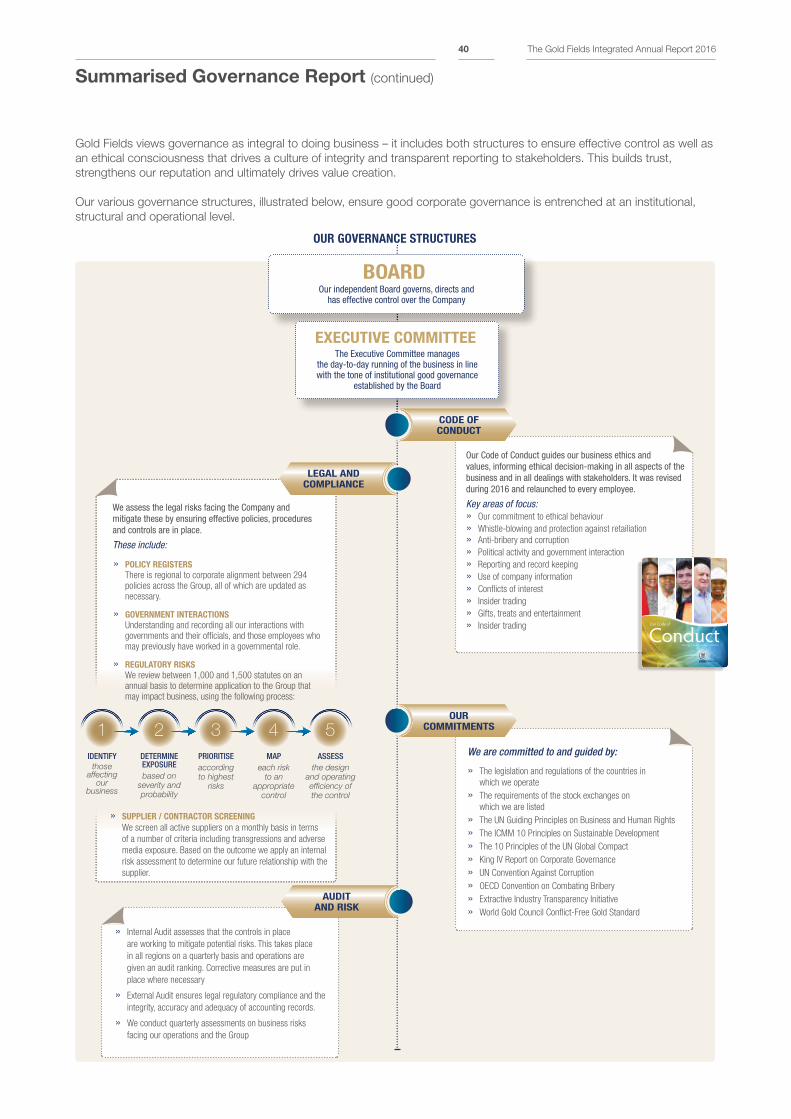
Summarised Governance Report (continued)
OUR GOVERNANCE STRUCTURES
BOARDOur independent Board governs, directs and
has effective control over the Company
» SUPPLIER / CONTRACTOR SCREENING
We screen all active suppliers on a monthly basis in terms
of a number of criteria including transgressions and adverse
media exposure. Based on the outcome we apply an internal
risk assessment to determine our future relationship with the
supplier.
» POLICY REGISTERS
There is regional to corporate alignment between 294 policies across the Group, all of which are updated as necessary.
» GOVERNMENT INTERACTIONS
Understanding and recording all our interactions with governments and their officials, and those employees who may previously have worked in a governmental role.
» REGULATORY RISKS
We review between 1,000 and 1,500 statutes on an annual basis to determine application to the Group that may impact business, using the following process:
LEGAL AND COMPLIANCE
We assess the legal risks facing the Company and mitigate these by ensuring effective policies, procedures and controls are in place.
These include:
DETERMINE EXPOSUREbased on
severity and probability
PRIORITISEaccording to highest
risks
MAPeach risk
to an appropriate
control
ASSESSthe design
and operating efficiency of the control
IDENTIFYthose
affecting our
business
1 2 3 4 5
Gold Fields views governance as integral to doing business – it includes both structures to ensure effective control as well as
an ethical consciousness that drives a culture of integrity and transparent reporting to stakeholders. This builds trust,
strengthens our reputation and ultimately drives value creation.
Our various governance structures, illustrated below, ensure good corporate governance is entrenched at an institutional,
structural and operational level.
EXECUTIVE COMMITTEEThe Executive Committee manages
the day-to-day running of the business in line with the tone of institutional good governance
established by the Board
Our Code of Conduct guides our business ethics and values, informing ethical decision-making in all aspects of the business and in all dealings with stakeholders. It was revised during 2016 and relaunched to every employee.
Key areas of focus:» Our commitment to ethical behaviour
» Whistle-blowing and protection against retailiation
» Anti-bribery and corruption
» Political activity and government interaction
» Reporting and record keeping
» Use of company information
» Conflicts of interest
» Insider trading
» Gifts, treats and entertainment
» Insider trading
CODE OF CONDUCT
We are committed to and guided by:
» The legislation and regulations of the countries in
which we operate
» The requirements of the stock exchanges on
which we are listed
» The UN Guiding Principles on Business and Human Rights
» The ICMM 10 Principles on Sustainable Development
» The 10 Principles of the UN Global Compact
» King IV Report on Corporate Governance
» UN Convention Against Corruption
» OECD Convention on Combating Bribery
» Extractive Industry Transparency Initiative
» World Gold Council Conflict-Free Gold Standard
OUR COMMITMENTS
» Internal Audit assesses that the controls in place
are working to mitigate potential risks. This takes place
in all regions on a quarterly basis and operations are
given an audit ranking. Corrective measures are put in
place where necessary
» External Audit ensures legal regulatory compliance and the
integrity, accuracy and adequacy of accounting records.
» We conduct quarterly assessments on business risks
facing our operations and the Group
AUDIT AND RISK
The Gold Fields Integrated Annual Report 201640
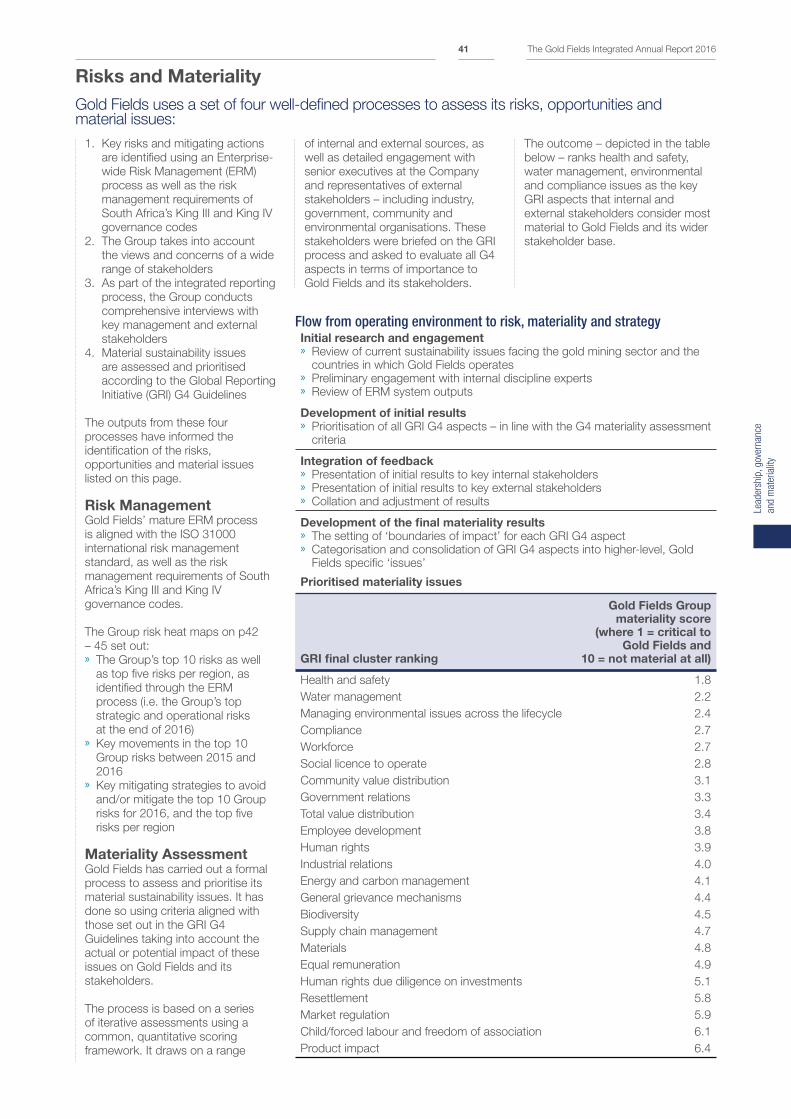
Risks and Materiality
Gold Fields uses a set of four well-defined processes to assess its risks, opportunities and material issues:
1. Key risks and mitigating actions
are identified using an Enterprise-
wide Risk Management (ERM)
process as well as the risk
management requirements of
South Africa’s King III and King IV
governance codes
2. The Group takes into account
the views and concerns of a wide
range of stakeholders
3. As part of the integrated reporting
process, the Group conducts
comprehensive interviews with
key management and external
stakeholders
4. Material sustainability issues
are assessed and prioritised
according to the Global Reporting
Initiative (GRI) G4 Guidelines
The outputs from these four
processes have informed the
identification of the risks,
opportunities and material issues
listed on this page.
Risk ManagementGold Fields’ mature ERM process
is aligned with the ISO 31000
international risk management
standard, as well as the risk
management requirements of South
Africa’s King III and King IV
governance codes.
The Group risk heat maps on p42
– 45 set out: » The Group’s top 10 risks as well
as top five risks per region, as
identified through the ERM
process (i.e. the Group’s top
strategic and operational risks
at the end of 2016) » Key movements in the top 10
Group risks between 2015 and
2016 » Key mitigating strategies to avoid
and/or mitigate the top 10 Group
risks for 2016, and the top five
risks per region
Materiality AssessmentGold Fields has carried out a formal
process to assess and prioritise its
material sustainability issues. It has
done so using criteria aligned with
those set out in the GRI G4
Guidelines taking into account the
actual or potential impact of these
issues on Gold Fields and its
stakeholders.
The process is based on a series
of iterative assessments using a
common, quantitative scoring
framework. It draws on a range
of internal and external sources, as
well as detailed engagement with
senior executives at the Company
and representatives of external
stakeholders – including industry,
government, community and
environmental organisations. These
stakeholders were briefed on the GRI
process and asked to evaluate all G4
aspects in terms of importance to
Gold Fields and its stakeholders.
The outcome – depicted in the table
below – ranks health and safety,
water management, environmental
and compliance issues as the key
GRI aspects that internal and
external stakeholders consider most
material to Gold Fields and its wider
stakeholder base.
Flow from operating environment to risk, materiality and strategyInitial research and engagement » Review of current sustainability issues facing the gold mining sector and the
countries in which Gold Fields operates » Preliminary engagement with internal discipline experts » Review of ERM system outputs
Development of initial results » Prioritisation of all GRI G4 aspects – in line with the G4 materiality assessment
criteria
Integration of feedback » Presentation of initial results to key internal stakeholders » Presentation of initial results to key external stakeholders » Collation and adjustment of results
Development of the final materiality results » The setting of ‘boundaries of impact’ for each GRI G4 aspect » Categorisation and consolidation of GRI G4 aspects into higher-level, Gold
Fields specific ‘issues’
Prioritised materiality issues
GRI final cluster ranking
Gold Fields Group materiality score
(where 1 = critical to Gold Fields and
10 = not material at all)
Health and safety 1.8
Water management 2.2
Managing environmental issues across the lifecycle 2.4
Compliance 2.7
Workforce 2.7
Social licence to operate 2.8
Community value distribution 3.1
Government relations 3.3
Total value distribution 3.4
Employee development 3.8
Human rights 3.9
Industrial relations 4.0
Energy and carbon management 4.1
General grievance mechanisms 4.4
Biodiversity 4.5
Supply chain management 4.7
Materials 4.8
Equal remuneration 4.9
Human rights due diligence on investments 5.1
Resettlement 5.8
Market regulation 5.9
Child/forced labour and freedom of association 6.1
Product impact 6.4
Lead
ersh
ip, g
over
nanc
e
and
mat
eria
lity
The Gold Fields Integrated Annual Report 201641
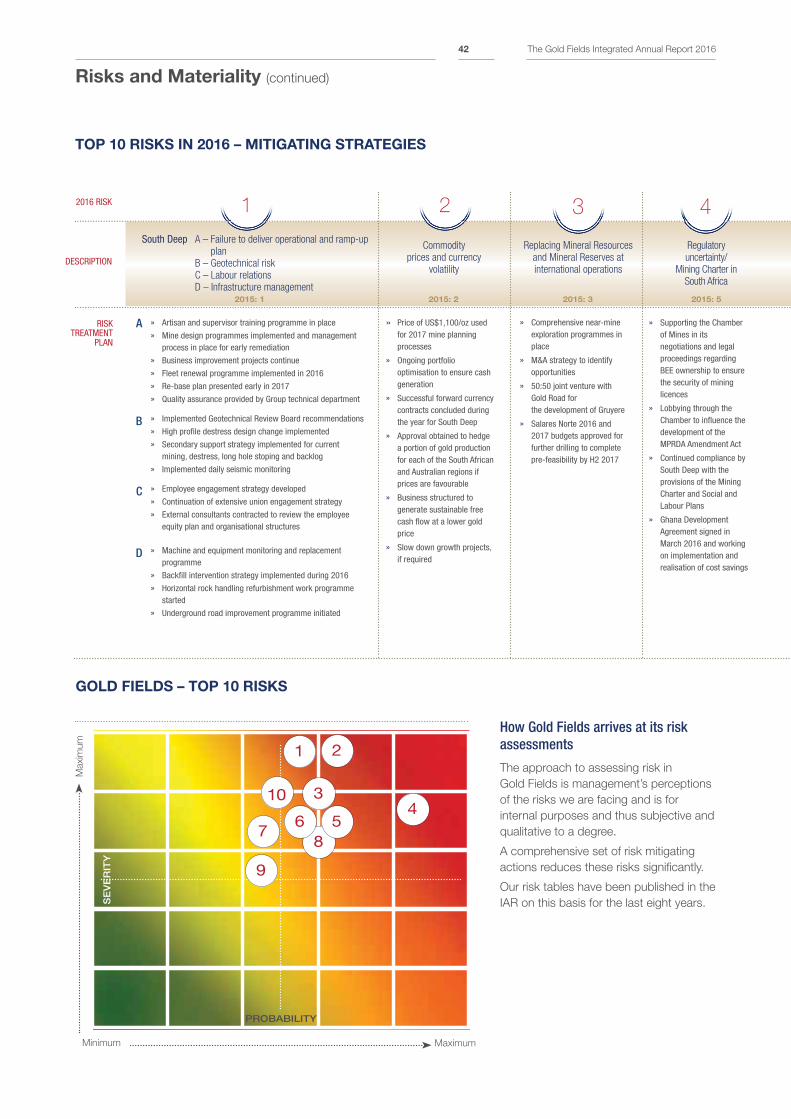
Risks and Materiality (continued)
A – Failure to deliver operational and ramp-up
plan
B – Geotechnical risk
C – Labour relations
D – Infrastructure management2015: 1
South Deep
TOP 10 RISKS IN 2016 – MITIGATING STRATEGIES
2016 RISK
DESCRIPTION
RISK TREATMENT
PLAN
1
Commodity
prices and currency
volatility
2015: 2
» Price of US$1,100/oz used for 2017 mine planning processes
» Ongoing portfolio optimisation to ensure cash generation
» Successful forward currency contracts concluded during the year for South Deep
» Approval obtained to hedge a portion of gold production for each of the South African and Australian regions if prices are favourable
» Business structured to generate sustainable free cash flow at a lower gold price
» Slow down growth projects, if required
2
Replacing Mineral Resources
and Mineral Reserves at
international operations
2015: 3
» Comprehensive near-mine exploration programmes in place
» M&A strategy to identify opportunities
» 50:50 joint venture with Gold Road for the development of Gruyere
» Salares Norte 2016 and 2017 budgets approved for further drilling to complete pre-feasibility by H2 2017
Regulatory
uncertainty/
Mining Charter in
South Africa
2015: 5
» Supporting the Chamber of Mines in its negotiations and legal proceedings regarding BEE ownership to ensure the security of mining licences
» Lobbying through the Chamber to influence the development of the MPRDA Amendment Act
» Continued compliance by South Deep with the provisions of the Mining Charter and Social and Labour Plans
» Ghana Development Agreement signed in March 2016 and working on implementation and realisation of cost savings
GOLD FIELDS – TOP 10 RISKS
How Gold Fields arrives at its risk assessments
The approach to assessing risk in
Gold Fields is management’s perceptions
of the risks we are facing and is for
internal purposes and thus subjective and
qualitative to a degree.
A comprehensive set of risk mitigating
actions reduces these risks significantly.
Our risk tables have been published in the
IAR on this basis for the last eight years.
Minimum Maximum
Maxim
um
PROBABILITY
SE
VE
RIT
Y
4
9
7
3
86 5
» Artisan and supervisor training programme in place
» Mine design programmes implemented and management process in place for early remediation
» Business improvement projects continue
» Fleet renewal programme implemented in 2016
» Re-base plan presented early in 2017
» Quality assurance provided by Group technical department
» Implemented Geotechnical Review Board recommendations
» High profile destress design change implemented
» Secondary support strategy implemented for current mining, destress, long hole stoping and backlog
» Implemented daily seismic monitoring
» Employee engagement strategy developed
» Continuation of extensive union engagement strategy
» External consultants contracted to review the employee equity plan and organisational structures
» Machine and equipment monitoring and replacement programme
» Backfill intervention strategy implemented during 2016
» Horizontal rock handling refurbishment work programme started
» Underground road improvement programme initiated
A
B
C
D
3 4
10
1 2
The Gold Fields Integrated Annual Report 201642
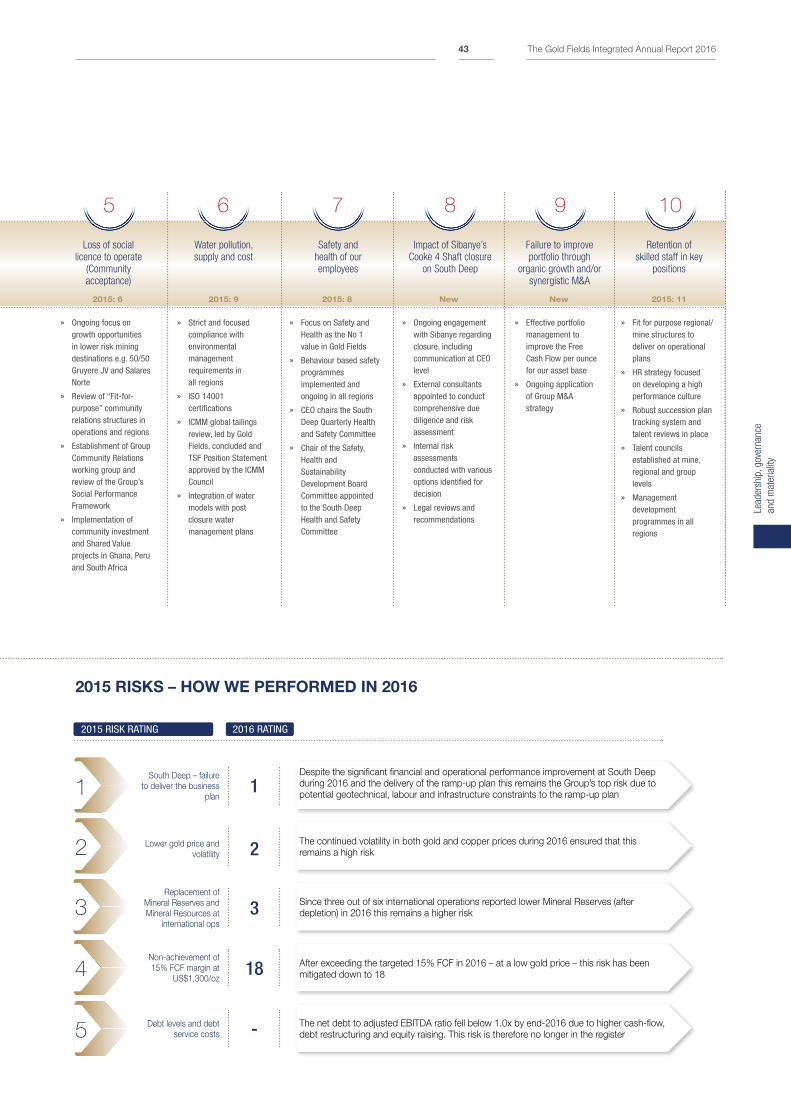
Failure to improve
portfolio through
organic growth and/or
synergistic M&A
Retention of
skilled staff in key
positions
» Effective portfolio management to improve the Free Cash Flow per ounce for our asset base
» Ongoing application of Group M&A strategy
» Fit for purpose regional/mine structures to deliver on operational plans
» HR strategy focused on developing a high performance culture
» Robust succession plan tracking system and talent reviews in place
» Talent councils established at mine, regional and group levels
» Management development programmes in all regions
Loss of social
licence to operate
(Community
acceptance)
2015: 6 New New 2015: 11
» Ongoing focus on growth opportunities in lower risk mining destinations e.g. 50/50 Gruyere JV and Salares Norte
» Review of “Fit-for-purpose” community relations structures in operations and regions
» Establishment of Group Community Relations working group and review of the Group’s Social Performance Framework
» Implementation of community investment and Shared Value projects in Ghana, Peru and South Africa
5
» Strict and focused compliance with environmental management requirements in all regions
» ISO 14001 certifications
» ICMM global tailings review, led by Gold Fields, concluded and TSF Position Statement approved by the ICMM Council
» Integration of water models with post closure water management plans
2015: 9
Water pollution,
supply and cost
6
Safety and
health of our
employees
» Focus on Safety and Health as the No 1 value in Gold Fields
» Behaviour based safety programmes implemented and ongoing in all regions
» CEO chairs the South Deep Quarterly Health and Safety Committee
» Chair of the Safety, Health and Sustainability Development Board Committee appointed to the South Deep Health and Safety Committee
2015: 8
7 8 9 10
2015 RISKS – HOW WE PERFORMED IN 2016
2015 RISK RATING 2016 RATING
2
South Deep – failure
to deliver the business
plan
Lower gold price and
volatility
Replacement of
Mineral Reserves and
Mineral Resources at
international ops
Non-achievement of
15% FCF margin at
US$1,300/oz
Debt levels and debt
service costs
Despite the significant financial and operational performance improvement at South Deep
during 2016 and the delivery of the ramp-up plan this remains the Group’s top risk due to
potential geotechnical, labour and infrastructure constraints to the ramp-up plan
The continued volatility in both gold and copper prices during 2016 ensured that this
remains a high risk
Since three out of six international operations reported lower Mineral Reserves (after
depletion) in 2016 this remains a higher risk
After exceeding the targeted 15% FCF in 2016 – at a low gold price – this risk has been
mitigated down to 18
The net debt to adjusted EBITDA ratio fell below 1.0x by end-2016 due to higher cash-flow,
debt restructuring and equity raising. This risk is therefore no longer in the register
1
3
5
4
1
2
3
18
-
Impact of Sibanye’s
Cooke 4 Shaft closure
on South Deep
» Ongoing engagement with Sibanye regarding closure, including communication at CEO level
» External consultants appointed to conduct comprehensive due diligence and risk assessment
» Internal risk assessments conducted with various options identified for decision
» Legal reviews and recommendations
Lead
ersh
ip, g
over
nanc
e
and
mat
eria
lity
The Gold Fields Integrated Annual Report 201643
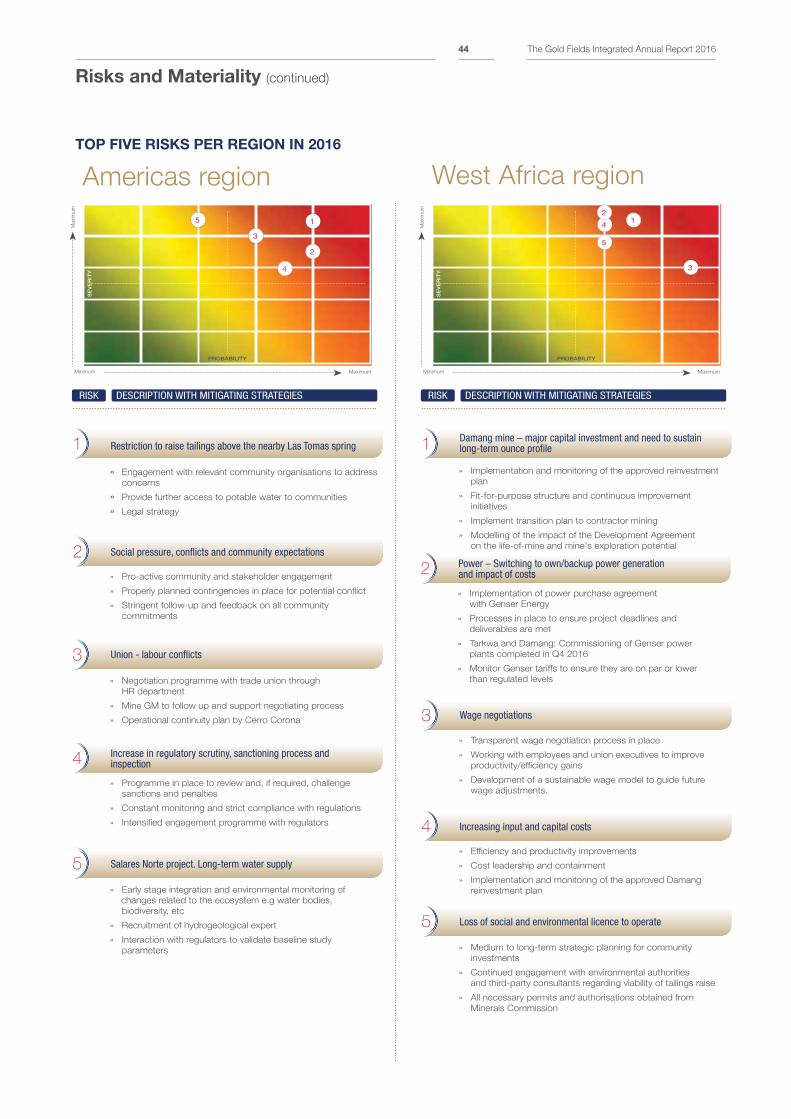
Risks and Materiality (continued)
4 Increasing input and capital costs
» Efficiency and productivity improvements
» Cost leadership and containment
» Implementation and monitoring of the approved Damang
reinvestment plan
TOP FIVE RISKS PER REGION IN 2016
West Africa regionAmericas region
Minimum Maximum
Maxim
um
PROBABILITY
SE
VE
RIT
Y
Restriction to raise tailings above the nearby Las Tomas spring
» Engagement with relevant community organisations to address
concerns
» Provide further access to potable water to communities
» Legal strategy
1
2 Social pressure, conflicts and community expectations
» Pro-active community and stakeholder engagement
» Properly planned contingencies in place for potential conflict
» Stringent follow-up and feedback on all community
commitments
3 Union - labour conflicts
» Negotiation programme with trade union through
HR department
» Mine GM to follow up and support negotiating process
» Operational continuity plan by Cerro Corona
4 Increase in regulatory scrutiny, sanctioning process and inspection
» Programme in place to review and, if required, challenge
sanctions and penalties
» Constant monitoring and strict compliance with regulations
» Intensified engagement programme with regulators
DESCRIPTION WITH MITIGATING STRATEGIESRISK
5 Salares Norte project. Long-term water supply
» Early stage integration and environmental monitoring of
changes related to the ecosystem e.g water bodies,
biodiversity, etc
» Recruitment of hydrogeological expert
» Interaction with regulators to validate baseline study
parameters
Minimum Maximum
Maxim
um
PROBABILITY
SE
VE
RIT
Y
1
3
4
5
Damang mine – major capital investment and need to sustain long-term ounce profile
» Implementation and monitoring of the approved reinvestment
plan
» Fit-for-purpose structure and continuous improvement
initiatives
» Implement transition plan to contractor mining
» Modelling of the impact of the Development Agreement
on the life-of-mine and mine's exploration potential
1
2 Power – Switching to own/backup power generation and impact of costs
» Implementation of power purchase agreement
with Genser Energy
» Processes in place to ensure project deadlines and
deliverables are met
» Tarkwa and Damang: Commissioning of Genser power
plants completed in Q4 2016
» Monitor Genser tariffs to ensure they are on par or lower
than regulated levels
3 Wage negotiations
» Transparent wage negotiation process in place
» Working with employees and union executives to improve
productivity/efficiency gains
» Development of a sustainable wage model to guide future
wage adjustments.
DESCRIPTION WITH MITIGATING STRATEGIESRISK
5 Loss of social and environmental licence to operate
» Medium to long-term strategic planning for community
investments
» Continued engagement with environmental authorities
and third-party consultants regarding viability of tailings raise
» All necessary permits and authorisations obtained from
Minerals Commission
21
2
3
4
5
The Gold Fields Integrated Annual Report 201644
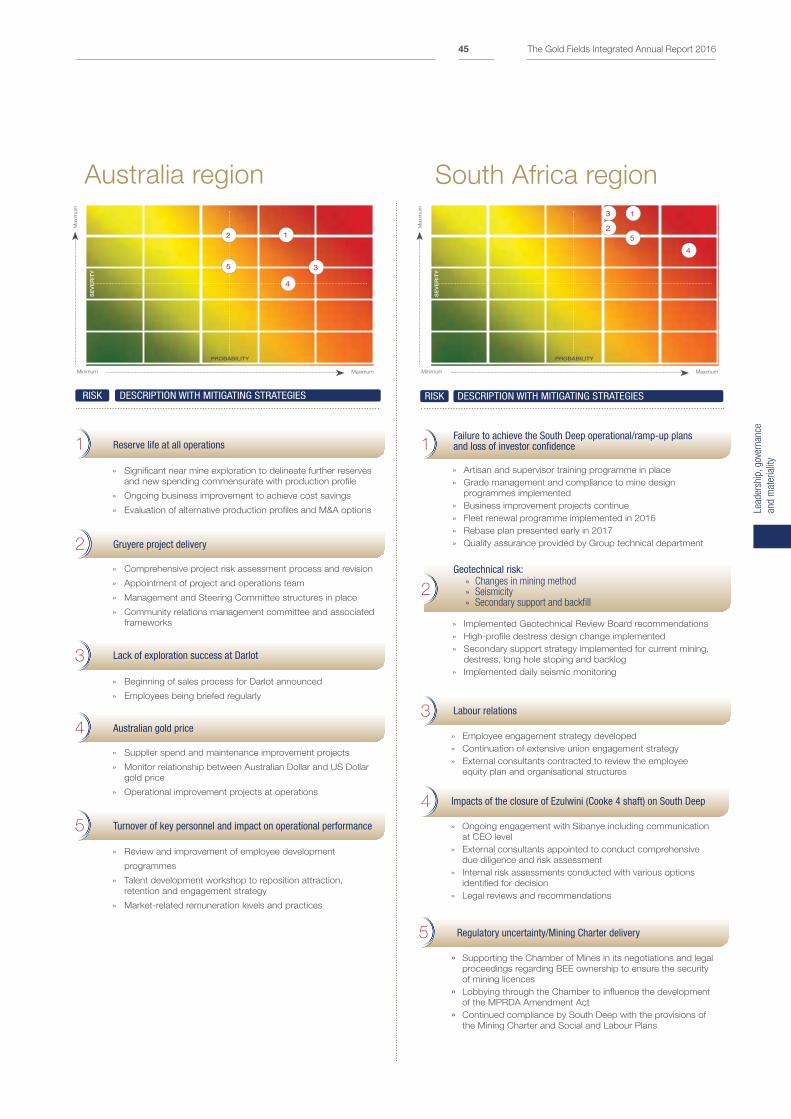
DESCRIPTION WITH MITIGATING STRATEGIESRISK
Australia region South Africa region
3
Reserve life at all operations
Lack of exploration success at Darlot
4 Australian gold price
5 Turnover of key personnel and impact on operational performance
2 Gruyere project delivery
» Significant near mine exploration to delineate further reserves
and new spending commensurate with production profile
» Ongoing business improvement to achieve cost savings
» Evaluation of alternative production profiles and M&A options
1
» Comprehensive project risk assessment process and revision
» Appointment of project and operations team
» Management and Steering Committee structures in place
» Community relations management committee and associated
frameworks
» Beginning of sales process for Darlot announced
» Employees being briefed regularly
» Supplier spend and maintenance improvement projects
» Monitor relationship between Australian Dollar and US Dollar
gold price
» Operational improvement projects at operations
» Review and improvement of employee development
programmes
» Talent development workshop to reposition attraction,
retention and engagement strategy
» Market-related remuneration levels and practices
DESCRIPTION WITH MITIGATING STRATEGIESRISK
Failure to achieve the South Deep operational/ramp-up plans and loss of investor confidence
» Artisan and supervisor training programme in place
» Grade management and compliance to mine design
programmes implemented
» Business improvement projects continue
» Fleet renewal programme implemented in 2016
» Rebase plan presented early in 2017
» Quality assurance provided by Group technical department
1
2
Geotechnical risk: » Changes in mining method » Seismicity » Secondary support and backfill
» Implemented Geotechnical Review Board recommendations
» High-profile destress design change implemented
» Secondary support strategy implemented for current mining,
destress, long hole stoping and backlog
» Implemented daily seismic monitoring
3 Labour relations
» Employee engagement strategy developed
» Continuation of extensive union engagement strategy
» External consultants contracted to review the employee
equity plan and organisational structures
4 Impacts of the closure of Ezulwini (Cooke 4 shaft) on South Deep
» Ongoing engagement with Sibanye including communication
at CEO level
» External consultants appointed to conduct comprehensive
due diligence and risk assessment
» Internal risk assessments conducted with various options
identified for decision
» Legal reviews and recommendations
5 Regulatory uncertainty/Mining Charter delivery
» Supporting the Chamber of Mines in its negotiations and legal
proceedings regarding BEE ownership to ensure the security
of mining licences
» Lobbying through the Chamber to influence the development
of the MPRDA Amendment Act
» Continued compliance by South Deep with the provisions of
the Mining Charter and Social and Labour Plans
Minimum Maximum
Maxim
um
PROBABILITY
SE
VE
RIT
Y
Minimum Maximum
Maxim
um
PROBABILITY
SE
VE
RIT
Y
13
25
4
12
3
4
5
Lead
ersh
ip, g
over
nanc
e
and
mat
eria
lity
The Gold Fields Integrated Annual Report 201645
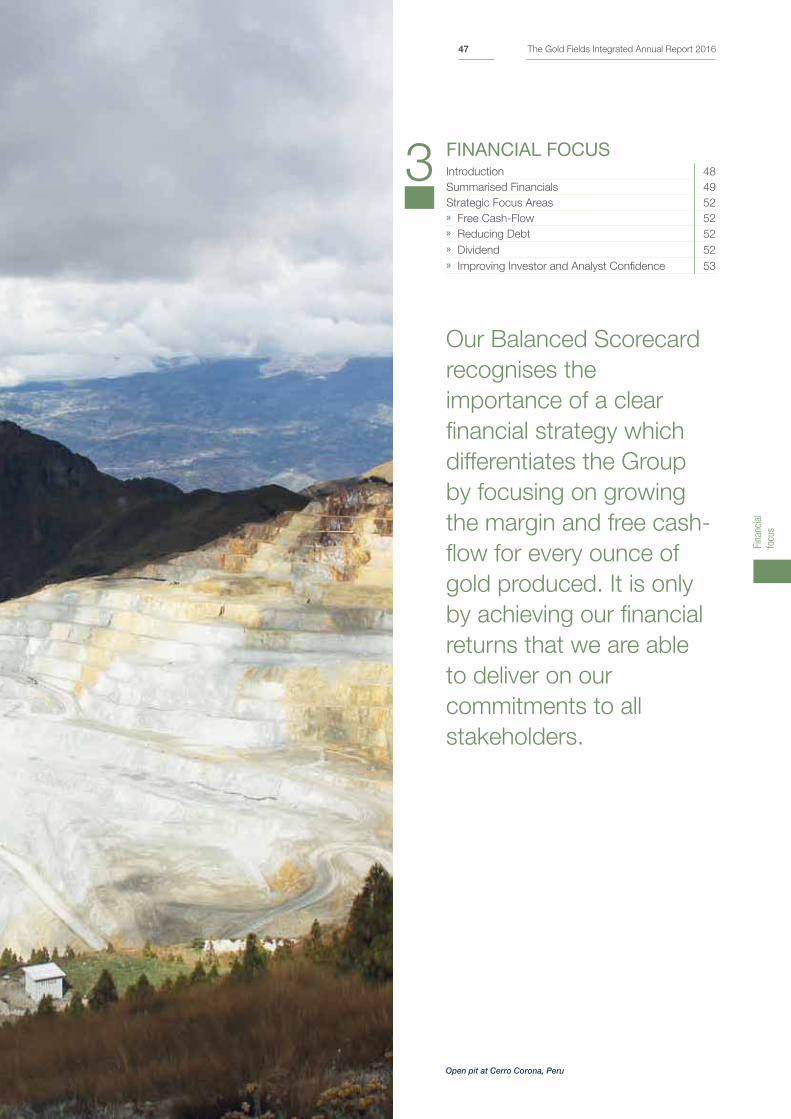
3FINANCIAL FOCUS Introduction 48
Summarised Financials 49
Strategic Focus Areas 52
» Free Cash-Flow 52
» Reducing Debt 52
» Dividend 52
» Improving Investor and Analyst Confidence 53
Our Balanced Scorecard
recognises the
importance of a clear
financial strategy which
differentiates the Group
by focusing on growing
the margin and free cash-
flow for every ounce of
gold produced. It is only
by achieving our financial
returns that we are able
to deliver on our
commitments to all
stakeholders.
Open pit at Cerro Corona, Peru
Fina
ncia
l
focu
s
The Gold Fields Integrated Annual Report 201647
Financial Focus – Introduction
The core focus of Gold Fields’
financial strategy is to grow the
margin and free cash-flow (FCF) for
every ounce of gold produced. This
has long replaced the traditional
focus on growth in production
ounces and is aimed at turning the
Group into a focused, lean and
globally diversified gold mining
company that generates significant
FCF and provides investors with
leverage to the gold price.
During 2016, our priorities for
the cash we generated were:
1. Rewarding our shareholders
with dividends
Our policy is to pay out between
25% and 35% of normalised
earnings
2. Improving our balance sheet by
paying down debt – the target
was to reduce the net debt:
adjusted EBITDA to below 1.0x
by end-2016
Our target is to further and
consistently reduce our net debt
and net debt to adjusted EBITDA
ratio
3. Pursuing value-accretive
acquisitions and funding growth:
Our preference is for the
acquisition of in-production
ounces that will contribute
positively to adjusted EBITDA and
cash-flow from the outset or
funding the development of
growth projects
Our key objective is to generate a
FCF margin of 15% at a gold price of
US$1,300/oz, which translates to an
All-in Cost (AIC) breakeven level of
approximately US$1,050/oz. The
Group’s FCF margin increased from
8% in 2015 to 17% in 2016, aided
by a pick-up in the gold price
received to US$1,241/oz during
2016 from US$1,140/oz in 2015.
Had the gold price averaged
US$1,300/oz, Gold Fields’ FCF
margin would have been 19%,
higher than our target of 15%.
Details of the Group’s production
and cost guidance are contained in
the Business Optimisation section
(p56 – 61).
Financial Highlights for Gold Fields during 2016:
20161 2015 2014
US$/A$ (average) 0.75 0.75 0.81
R/US$ (average) 14.70 12.68 11.56
Average US$ gold price received (US$/oz) 1,241 1,140 1,249
Average A$ gold price received (A$/oz) 1,675 1,541 1,404
Average Rand gold price received (R/kg) 584,894 478,263 441,981
Revenue (US$m) 2,750 2,545 2,869
AISC (US$/oz) 980 1,007 1,053
AIC (US$/oz) 1,006 1,026 1,087
Net operating costs (US$m) 1,388 1,456 1,678
Capital expenditure (US$m) 650 634 609
Net cash-flow1 (US$m) 294 123 235
FCF margin (%) 17 8 13
Net debt (US$m) 1,166 1,380 1,453
Net debt/adjusted EBITDA ratio 0.95 1.38 1.30
Normalised earnings (US$m) 191 45 85
Total dividend declared (R/share) 1.10 0.25 0.40
Dividend as a % of normalised earnings (%) 32 34 34
2016 FINANCIAL
PERFORMANCEThe 9% year-on-year pick up in the
US$ gold price enabled Gold Fields to
improve its cash reserves, reduce its
debt and strengthen its balance sheet
during 2016. The Group maintained its
policy of rewarding shareholders with
dividends, declaring 32% of
normalised earnings, or R1.10/share
(2015: R0.25/share).
Revenue increased by 8% from
US$2,545m in 2015 to US$2,750m in
2016, as a result of the higher gold
price received. Net operating costs
decreased by 5% to US$1,388m,
aided by a 16% weakening in the
Rand/US$ exchange rates and a 16%
fall in the oil price during the year.
The bulk of Gold Fields’ costs in
Australia and South Africa are incurred
in local currencies. As such, the
weakening in the South African Rand
relative to the US Dollar had a positive
impact on costs – and ultimately profits
– in this geography during 2016. A
weaker local currency, however, also
leads to inflation of imported costs. As
a result, costs of heavy equipment,
machinery and other components that
we mostly import at our South African
operation, increased during 2016 and
will continue to rise in the current year.
Our Australian operations largely buy
locally produced equipment, while our
Ghanaian mines pay for their
equipment in US Dollar terms.
The Group All-in Sustaining Costs
(AISC) of US$980/oz and AIC of
US$1,006/oz in 2016 compared with
US$1,007/oz and US$1,026/oz in
2015. Encouragingly, costs came in
below guidance (AISC: US$1,000/oz
– US$1,010/oz; AIC: US$1,035/oz –
1 Net cash-flow = cash-flow from operating activities less net capital expenditure and environmental payments.
The Gold Fields Integrated Annual Report 201648
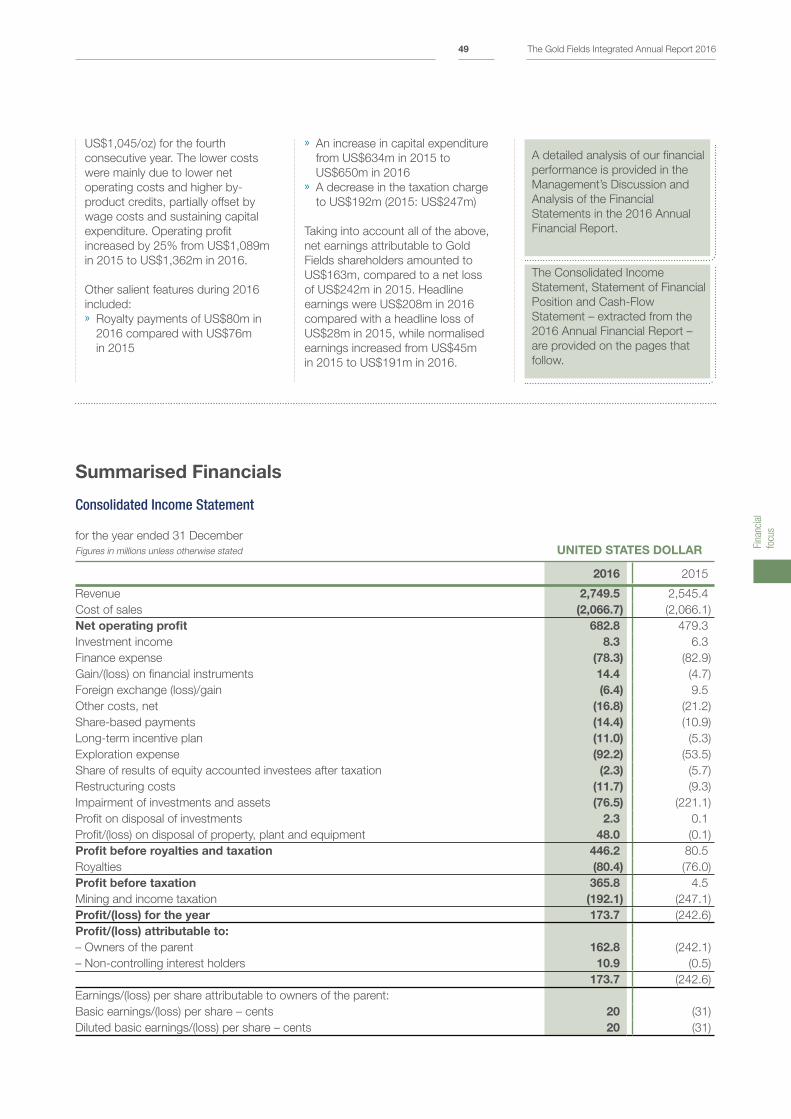
US$1,045/oz) for the fourth
consecutive year. The lower costs
were mainly due to lower net
operating costs and higher by-
product credits, partially offset by
wage costs and sustaining capital
expenditure. Operating profit
increased by 25% from US$1,089m
in 2015 to US$1,362m in 2016.
Other salient features during 2016
included: » Royalty payments of US$80m in
2016 compared with US$76m
in 2015
» An increase in capital expenditure
from US$634m in 2015 to
US$650m in 2016 » A decrease in the taxation charge
to US$192m (2015: US$247m)
Taking into account all of the above,
net earnings attributable to Gold
Fields shareholders amounted to
US$163m, compared to a net loss
of US$242m in 2015. Headline
earnings were US$208m in 2016
compared with a headline loss of
US$28m in 2015, while normalised
earnings increased from US$45m
in 2015 to US$191m in 2016.
Summarised Financials
Consolidated Income Statement
for the year ended 31 December
Figures in millions unless otherwise stated UNITED STATES DOLLAR
2016 2015
Revenue 2,749.5 2,545.4
Cost of sales (2,066.7) (2,066.1)
Net operating profit 682.8 479.3
Investment income 8.3 6.3
Finance expense (78.3) (82.9)
Gain/(loss) on financial instruments 14.4 (4.7)
Foreign exchange (loss)/gain (6.4) 9.5
Other costs, net (16.8) (21.2)
Share-based payments (14.4) (10.9)
Long-term incentive plan (11.0) (5.3)
Exploration expense (92.2) (53.5)
Share of results of equity accounted investees after taxation (2.3) (5.7)
Restructuring costs (11.7) (9.3)
Impairment of investments and assets (76.5) (221.1)
Profit on disposal of investments 2.3 0.1
Profit/(loss) on disposal of property, plant and equipment 48.0 (0.1)
Profit before royalties and taxation 446.2 80.5
Royalties (80.4) (76.0)
Profit before taxation 365.8 4.5
Mining and income taxation (192.1) (247.1)
Profit/(loss) for the year 173.7 (242.6)
Profit/(loss) attributable to:
– Owners of the parent 162.8 (242.1)
– Non-controlling interest holders 10.9 (0.5)
173.7 (242.6)
Earnings/(loss) per share attributable to owners of the parent:
Basic earnings/(loss) per share – cents 20 (31)
Diluted basic earnings/(loss) per share – cents 20 (31)
A detailed analysis of our financial
performance is provided in the
Management’s Discussion and
Analysis of the Financial
Statements in the 2016 Annual
Financial Report.
The Consolidated Income
Statement, Statement of Financial
Position and Cash-Flow
Statement – extracted from the
2016 Annual Financial Report –
are provided on the pages that
follow.
Fina
ncia
l
focu
s
The Gold Fields Integrated Annual Report 201649
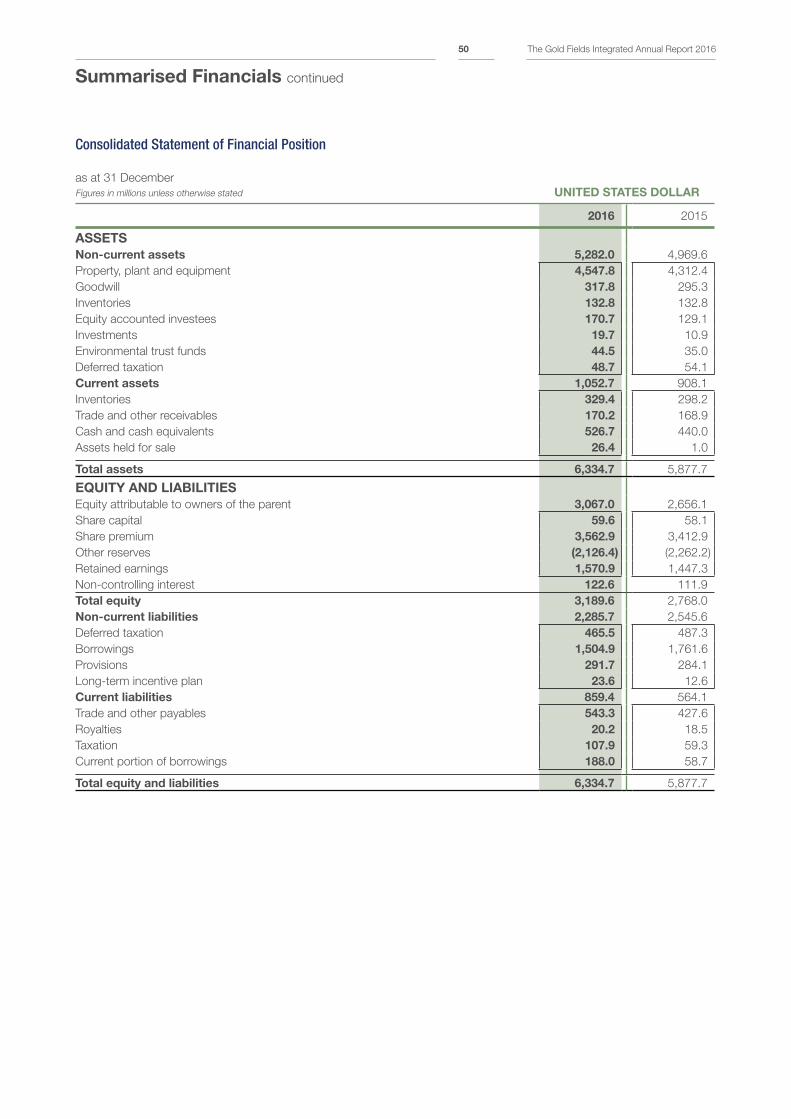
Consolidated Statement of Financial Position
as at 31 December
Figures in millions unless otherwise stated UNITED STATES DOLLAR
2016 2015
ASSETS
Non-current assets 5,282.0 4,969.6
Property, plant and equipment 4,547.8 4,312.4
Goodwill 317.8 295.3
Inventories 132.8 132.8
Equity accounted investees 170.7 129.1
Investments 19.7 10.9
Environmental trust funds 44.5 35.0
Deferred taxation 48.7 54.1
Current assets 1,052.7 908.1
Inventories 329.4 298.2
Trade and other receivables 170.2 168.9
Cash and cash equivalents 526.7 440.0
Assets held for sale 26.4 1.0
Total assets 6,334.7 5,877.7
EQUITY AND LIABILITIES
Equity attributable to owners of the parent 3,067.0 2,656.1
Share capital 59.6 58.1
Share premium 3,562.9 3,412.9
Other reserves (2,126.4) (2,262.2)
Retained earnings 1,570.9 1,447.3
Non-controlling interest 122.6 111.9
Total equity 3,189.6 2,768.0
Non-current liabilities 2,285.7 2,545.6
Deferred taxation 465.5 487.3
Borrowings 1,504.9 1,761.6
Provisions 291.7 284.1
Long-term incentive plan 23.6 12.6
Current liabilities 859.4 564.1
Trade and other payables 543.3 427.6
Royalties 20.2 18.5
Taxation 107.9 59.3
Current portion of borrowings 188.0 58.7
Total equity and liabilities 6,334.7 5,877.7
Summarised Financials continued
The Gold Fields Integrated Annual Report 201650
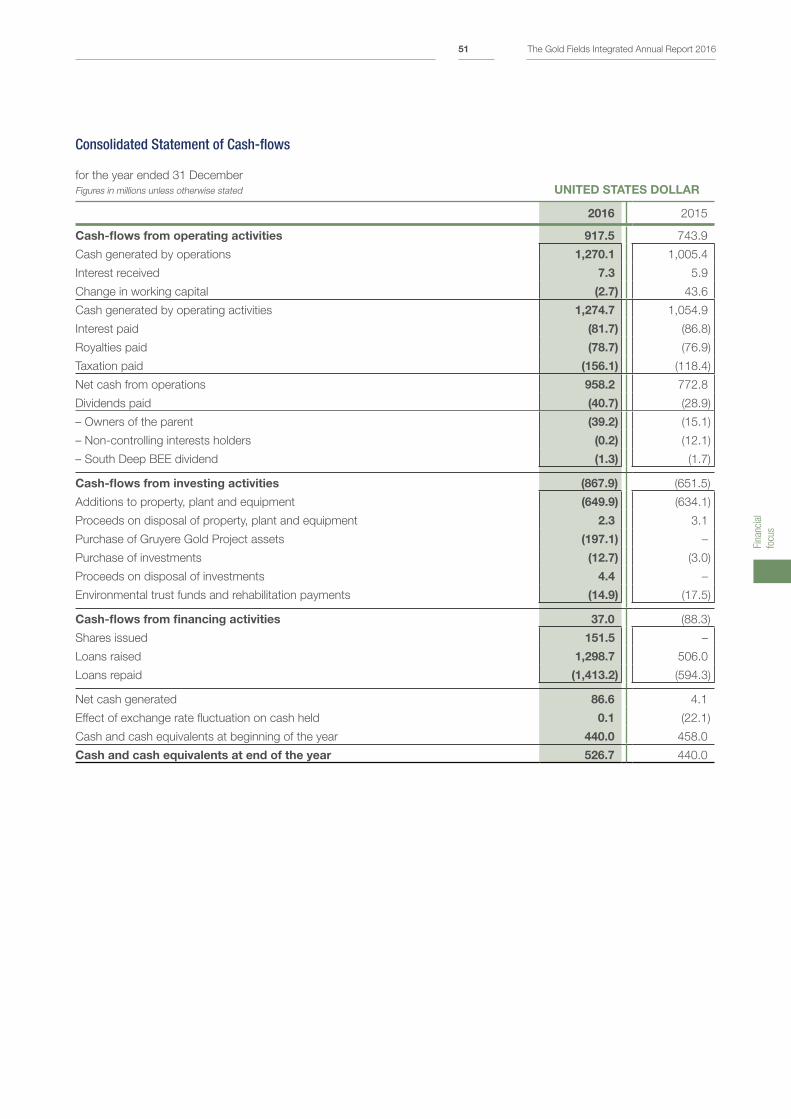
Consolidated Statement of Cash-flows
for the year ended 31 December
Figures in millions unless otherwise stated UNITED STATES DOLLAR
2016 2015
Cash-flows from operating activities 917.5 743.9
Cash generated by operations 1,270.1 1,005.4
Interest received 7.3 5.9
Change in working capital (2.7) 43.6
Cash generated by operating activities 1,274.7 1,054.9
Interest paid (81.7) (86.8)
Royalties paid (78.7) (76.9)
Taxation paid (156.1) (118.4)
Net cash from operations 958.2 772.8
Dividends paid (40.7) (28.9)
– Owners of the parent (39.2) (15.1)
– Non-controlling interests holders (0.2) (12.1)
– South Deep BEE dividend (1.3) (1.7)
Cash-flows from investing activities (867.9) (651.5)
Additions to property, plant and equipment (649.9) (634.1)
Proceeds on disposal of property, plant and equipment 2.3 3.1
Purchase of Gruyere Gold Project assets (197.1) –
Purchase of investments (12.7) (3.0)
Proceeds on disposal of investments 4.4 –
Environmental trust funds and rehabilitation payments (14.9) (17.5)
Cash-flows from financing activities 37.0 (88.3)
Shares issued 151.5 –
Loans raised 1,298.7 506.0
Loans repaid (1,413.2) (594.3)
Net cash generated 86.6 4.1
Effect of exchange rate fluctuation on cash held 0.1 (22.1)
Cash and cash equivalents at beginning of the year 440.0 458.0
Cash and cash equivalents at end of the year 526.7 440.0
Fina
ncia
l
focu
s
The Gold Fields Integrated Annual Report 201651
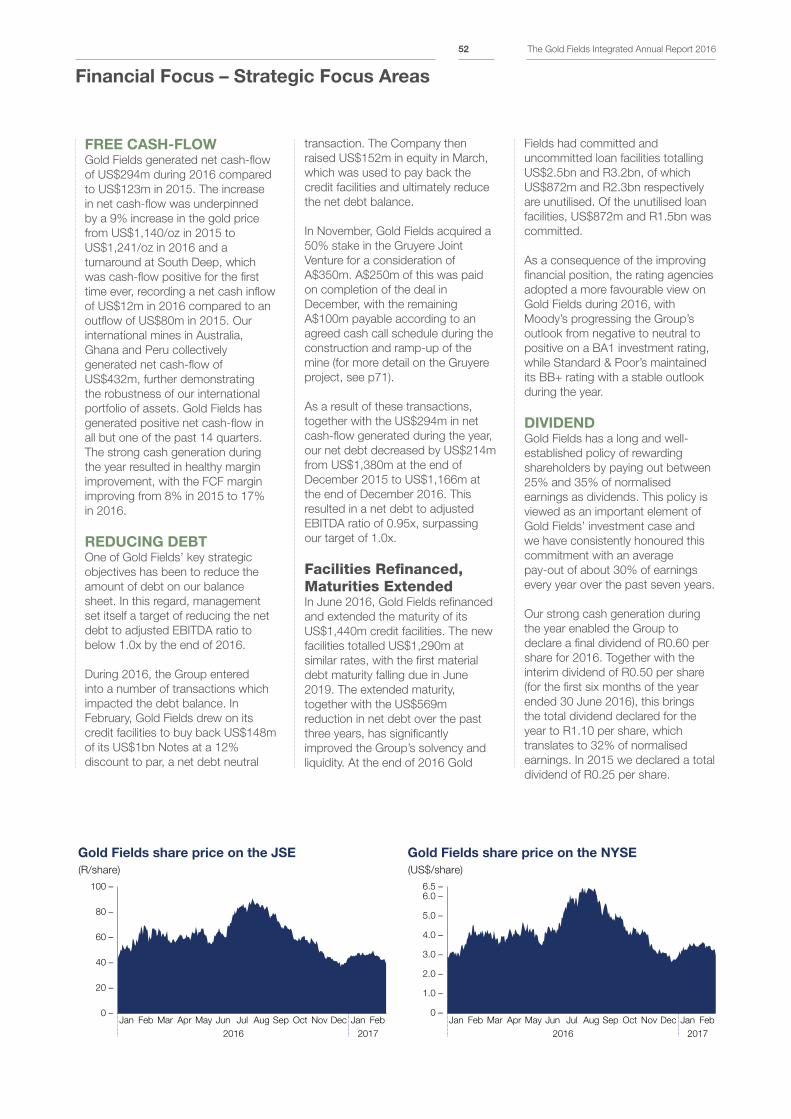
Financial Focus – Strategic Focus Areas
FREE CASH-FLOWGold Fields generated net cash-flow
of US$294m during 2016 compared
to US$123m in 2015. The increase
in net cash-flow was underpinned
by a 9% increase in the gold price
from US$1,140/oz in 2015 to
US$1,241/oz in 2016 and a
turnaround at South Deep, which
was cash-flow positive for the first
time ever, recording a net cash inflow
of US$12m in 2016 compared to an
outflow of US$80m in 2015. Our
international mines in Australia,
Ghana and Peru collectively
generated net cash-flow of
US$432m, further demonstrating
the robustness of our international
portfolio of assets. Gold Fields has
generated positive net cash-flow in
all but one of the past 14 quarters.
The strong cash generation during
the year resulted in healthy margin
improvement, with the FCF margin
improving from 8% in 2015 to 17%
in 2016.
REDUCING DEBTOne of Gold Fields’ key strategic
objectives has been to reduce the
amount of debt on our balance
sheet. In this regard, management
set itself a target of reducing the net
debt to adjusted EBITDA ratio to
below 1.0x by the end of 2016.
During 2016, the Group entered
into a number of transactions which
impacted the debt balance. In
February, Gold Fields drew on its
credit facilities to buy back US$148m
of its US$1bn Notes at a 12%
discount to par, a net debt neutral
transaction. The Company then
raised US$152m in equity in March,
which was used to pay back the
credit facilities and ultimately reduce
the net debt balance.
In November, Gold Fields acquired a
50% stake in the Gruyere Joint
Venture for a consideration of
A$350m. A$250m of this was paid
on completion of the deal in
December, with the remaining
A$100m payable according to an
agreed cash call schedule during the
construction and ramp-up of the
mine (for more detail on the Gruyere
project, see p71).
As a result of these transactions,
together with the US$294m in net
cash-flow generated during the year,
our net debt decreased by US$214m
from US$1,380m at the end of
December 2015 to US$1,166m at
the end of December 2016. This
resulted in a net debt to adjusted
EBITDA ratio of 0.95x, surpassing
our target of 1.0x.
Facilities Refinanced, Maturities ExtendedIn June 2016, Gold Fields refinanced
and extended the maturity of its
US$1,440m credit facilities. The new
facilities totalled US$1,290m at
similar rates, with the first material
debt maturity falling due in June
2019. The extended maturity,
together with the US$569m
reduction in net debt over the past
three years, has significantly
improved the Group’s solvency and
liquidity. At the end of 2016 Gold
Fields had committed and
uncommitted loan facilities totalling
US$2.5bn and R3.2bn, of which
US$872m and R2.3bn respectively
are unutilised. Of the unutilised loan
facilities, US$872m and R1.5bn was
committed.
As a consequence of the improving
financial position, the rating agencies
adopted a more favourable view on
Gold Fields during 2016, with
Moody’s progressing the Group’s
outlook from negative to neutral to
positive on a BA1 investment rating,
while Standard & Poor’s maintained
its BB+ rating with a stable outlook
during the year.
DIVIDENDGold Fields has a long and well-
established policy of rewarding
shareholders by paying out between
25% and 35% of normalised
earnings as dividends. This policy is
viewed as an important element of
Gold Fields’ investment case and
we have consistently honoured this
commitment with an average
pay-out of about 30% of earnings
every year over the past seven years.
Our strong cash generation during
the year enabled the Group to
declare a final dividend of R0.60 per
share for 2016. Together with the
interim dividend of R0.50 per share
(for the first six months of the year
ended 30 June 2016), this brings
the total dividend declared for the
year to R1.10 per share, which
translates to 32% of normalised
earnings. In 2015 we declared a total
dividend of R0.25 per share.
Gold Fields share price on the JSE
(R/share)
100 –
80 –
60 –
40 –
20 –
0 –Jan Feb Mar Apr May Jun Jul Aug Sep Oct Nov Dec Jan Feb
2016 2017
Gold Fields share price on the NYSE
(US$/share)
6.5 –6.0 –
5.0 –
4.0 –
3.0 –
2.0 –
1.0 –
0 –Jan Feb Mar Apr May Jun Jul Aug Sep Oct Nov Dec Jan Feb
2016 2017
The Gold Fields Integrated Annual Report 201652
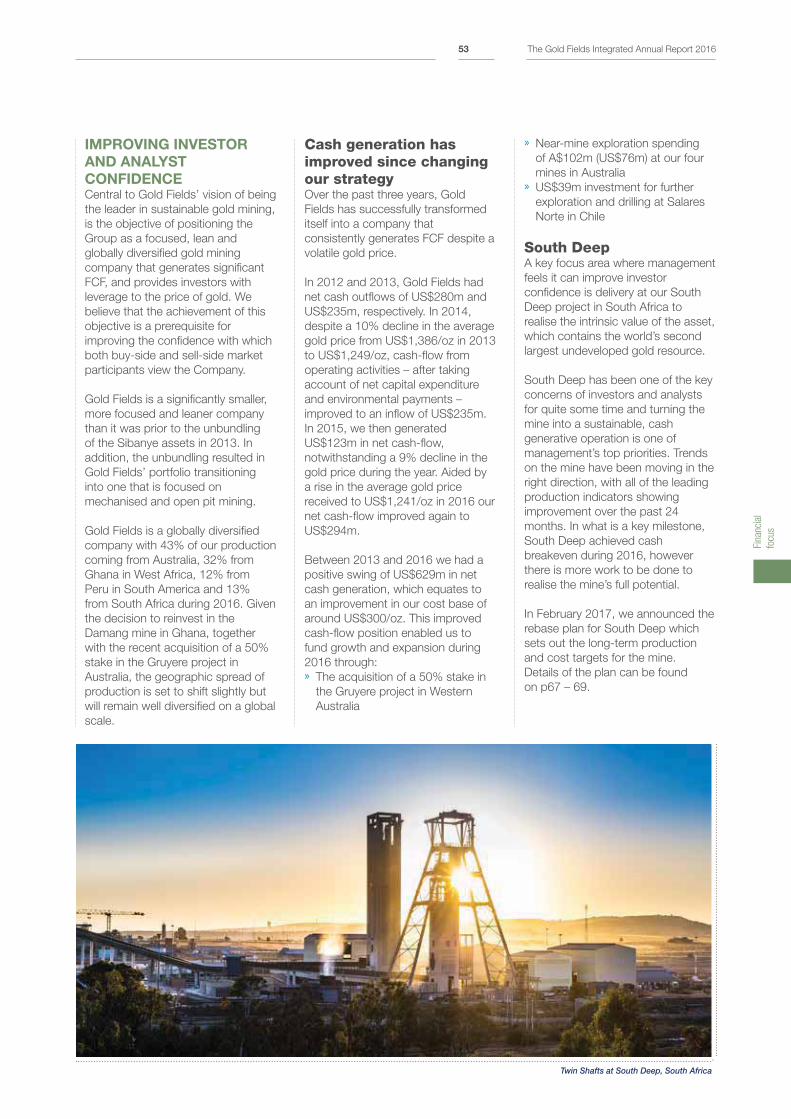
IMPROVING INVESTOR
AND ANALYST
CONFIDENCECentral to Gold Fields’ vision of being
the leader in sustainable gold mining,
is the objective of positioning the
Group as a focused, lean and
globally diversified gold mining
company that generates significant
FCF, and provides investors with
leverage to the price of gold. We
believe that the achievement of this
objective is a prerequisite for
improving the confidence with which
both buy-side and sell-side market
participants view the Company.
Gold Fields is a significantly smaller,
more focused and leaner company
than it was prior to the unbundling
of the Sibanye assets in 2013. In
addition, the unbundling resulted in
Gold Fields’ portfolio transitioning
into one that is focused on
mechanised and open pit mining.
Gold Fields is a globally diversified
company with 43% of our production
coming from Australia, 32% from
Ghana in West Africa, 12% from
Peru in South America and 13%
from South Africa during 2016. Given
the decision to reinvest in the
Damang mine in Ghana, together
with the recent acquisition of a 50%
stake in the Gruyere project in
Australia, the geographic spread of
production is set to shift slightly but
will remain well diversified on a global
scale.
Cash generation has improved since changing our strategyOver the past three years, Gold
Fields has successfully transformed
itself into a company that
consistently generates FCF despite a
volatile gold price.
In 2012 and 2013, Gold Fields had
net cash outflows of US$280m and
US$235m, respectively. In 2014,
despite a 10% decline in the average
gold price from US$1,386/oz in 2013
to US$1,249/oz, cash-flow from
operating activities – after taking
account of net capital expenditure
and environmental payments –
improved to an inflow of US$235m.
In 2015, we then generated
US$123m in net cash-flow,
notwithstanding a 9% decline in the
gold price during the year. Aided by
a rise in the average gold price
received to US$1,241/oz in 2016 our
net cash-flow improved again to
US$294m.
Between 2013 and 2016 we had a
positive swing of US$629m in net
cash generation, which equates to
an improvement in our cost base of
around US$300/oz. This improved
cash-flow position enabled us to
fund growth and expansion during
2016 through: » The acquisition of a 50% stake in
the Gruyere project in Western
Australia
» Near-mine exploration spending
of A$102m (US$76m) at our four
mines in Australia » US$39m investment for further
exploration and drilling at Salares
Norte in Chile
South DeepA key focus area where management
feels it can improve investor
confidence is delivery at our South
Deep project in South Africa to
realise the intrinsic value of the asset,
which contains the world’s second
largest undeveloped gold resource.
South Deep has been one of the key
concerns of investors and analysts
for quite some time and turning the
mine into a sustainable, cash
generative operation is one of
management’s top priorities. Trends
on the mine have been moving in the
right direction, with all of the leading
production indicators showing
improvement over the past 24
months. In what is a key milestone,
South Deep achieved cash
breakeven during 2016, however
there is more work to be done to
realise the mine’s full potential.
In February 2017, we announced the
rebase plan for South Deep which
sets out the long-term production
and cost targets for the mine.
Details of the plan can be found
on p67 – 69.
Twin Shafts at South Deep, South Africa
Fina
ncia
l
focu
s
The Gold Fields Integrated Annual Report 201653
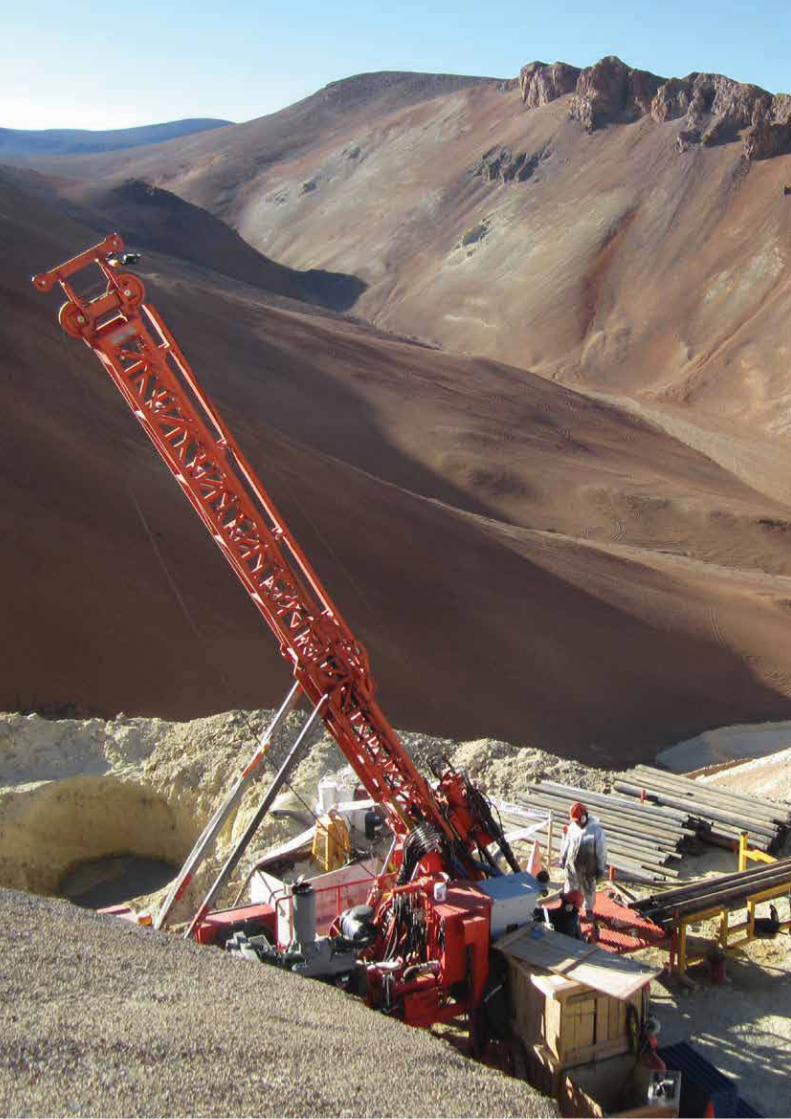
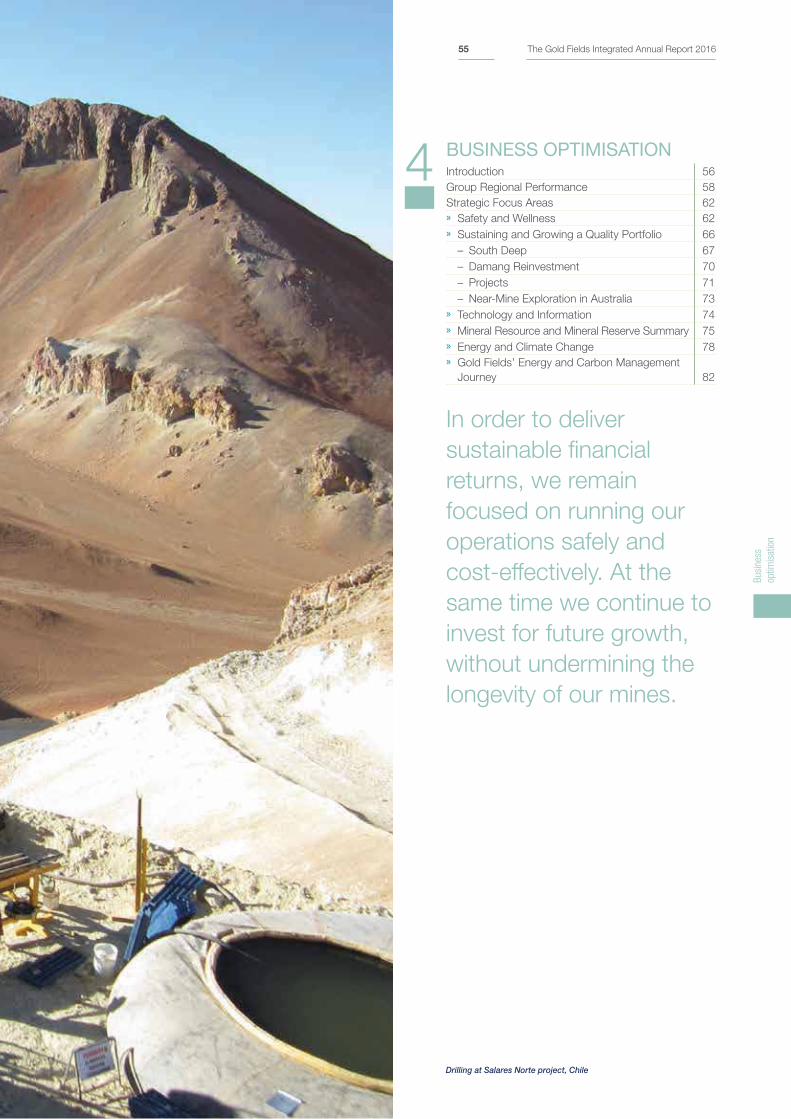
4BUSINESS OPTIMISATIONIntroduction 56
Group Regional Performance 58
Strategic Focus Areas 62
» Safety and Wellness 62
» Sustaining and Growing a Quality Portfolio 66
– South Deep 67
– Damang Reinvestment 70
– Projects 71
– Near-Mine Exploration in Australia 73
» Technology and Information 74
» Mineral Resource and Mineral Reserve Summary 75
» Energy and Climate Change 78
» Gold Fields’ Energy and Carbon Management
Journey 82
In order to deliver
sustainable financial
returns, we remain
focused on running our
operations safely and
cost-effectively. At the
same time we continue to
invest for future growth,
without undermining the
longevity of our mines.
Drilling at Salares Norte project, Chile
Bus
ines
s
optim
isat
ion
The Gold Fields Integrated Annual Report 201655
Focus on Business Optimisation – Introduction
Gold Fields has consolidated its
position as a more focused, leaner
business with a portfolio that is
characterised by modern,
mechanised underground and
open-pit mining. The production
base is geographically diversified
with eight mines in four countries.
The Group’s broader strategy is
focused on cash-generation and
capital discipline rather than ounces
for ounces’ sake. This focus has
enhanced our ability to generate free
cash-flow and provide investors
leverage to the gold price through
dividends and share price
performance.
Gold Fields continued to focus on
improving the cash-generating ability
of its existing operations during
2016. Initiatives included: » Avoiding mining marginal ounces
and optimising the exploitation of
ore bodies » Spending the necessary capital
on ore body development to
sustain and, where possible, grow
production levels » Continuing cost-efficiency
measures at all operations » Operational and strategic planning
based on the delivery of healthy
free cash-flow margins at lower
gold prices » Continued optimisation of the
South Deep mine. Significant
operational improvements have
been made over the past two
years and the project reached a
milestone by breaking even during
2016
Production and Cost Highlights
2016 2015 2014 2013 2012
Gold production – attributable (koz) 2,146 2,159 2,219 2,022 2,031
Revenue (US$m) 2,750 2,545 2,869 2,906 3,531
All-in Sustaining Cost (US$/oz) 980 1,007 1,053 1,202 1,310
All-in Cost (US$/oz) 1,006 1,026 1,087 1,312 1,537
Average gold price received (US$/oz) 1,241 1,140 1,249 1,386 1,656
Operating profit 1,362 1 089 1,191 1,239 1,879
Net operating costs 1,388 1,456 1,678 1,667 1,663
Headline earnings/(loss) 208 (28) 27 (71) 350
Normalised earnings 191 45 85 58 409
Net cash inflow/(outflow)1 294 123 235 (235) (280)
Free cash-flow margin (%) 17 8 13 n/a n/a
1 Net cash-flow = cash-flow from operating activities less net capital expenditure and environmental payments.
Group Production and Cost Performance
2017 Guidance 2016 Actual 2016 Guidance 2015 Actual
Prod
(Moz)
AIC
(US$/oz)
Prod
(Moz)
AIC
(US$/oz)
Prod
(Moz)
AIC
(US$/oz)
Prod
(Moz)
AIC
(US$/oz)
Group
2.10
– 2.15
1,170
– 1,190¹ 2.15 1,006
2.05
– 2.10
1,035
– 1,045 2.16 1,026
¹ This includes spending of US$120m on Damang; US$112m on Gruyere, US$20m on South Deep and US$64m for Salares Norte. Guidance for
AISC for 2017 is US$1,010/oz to US$1,030/oz.
While cash generation remained a
key priority, the longevity and quality
of our portfolio was addressed
during 2016 through a number of
investments: » Gold Fields spent A$102m
(US$76m) in near-mine
(brownfields) exploration activities
across the Australian portfolio,
which resulted in a 13% increase
in the region’s reserves (p73). This
excludes the reserves held by the
newly acquired 50% stake in the
Gruyere project » US$39m was spent on exploration
drilling at the Salares Norte project
in Chile (p72). » Reinvestment in the Damang mine
in Ghana to extend its life by eight
years from 2017 to 2024.
US$341m of project capital will be
incurred over the eight-year LoM
(p70) » In November, Gold Fields entered
into a joint venture with Gold Road
Resources to develop the Gruyere
project in Western Australia (p71)
The Gold Fields Integrated Annual Report 201656
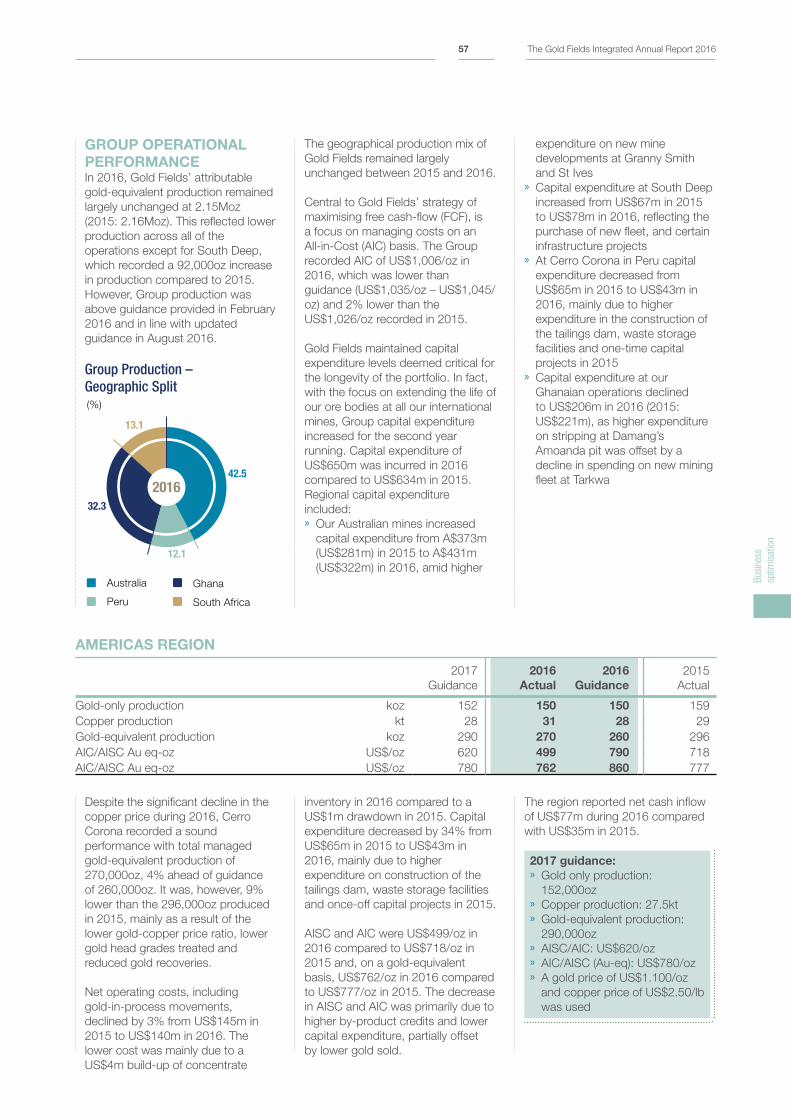
GROUP OPERATIONAL
PERFORMANCEIn 2016, Gold Fields’ attributable
gold-equivalent production remained
largely unchanged at 2.15Moz
(2015: 2.16Moz). This reflected lower
production across all of the
operations except for South Deep,
which recorded a 92,000oz increase
in production compared to 2015.
However, Group production was
above guidance provided in February
2016 and in line with updated
guidance in August 2016.
Group Production – Geographic Split
42.5
12.1
32.3
13.1
2016
Australia
Peru
Ghana
South Africa
(%)
The geographical production mix of
Gold Fields remained largely
unchanged between 2015 and 2016.
Central to Gold Fields’ strategy of
maximising free cash-flow (FCF), is
a focus on managing costs on an
All-in-Cost (AIC) basis. The Group
recorded AIC of US$1,006/oz in
2016, which was lower than
guidance (US$1,035/oz – US$1,045/
oz) and 2% lower than the
US$1,026/oz recorded in 2015.
Gold Fields maintained capital
expenditure levels deemed critical for
the longevity of the portfolio. In fact,
with the focus on extending the life of
our ore bodies at all our international
mines, Group capital expenditure
increased for the second year
running. Capital expenditure of
US$650m was incurred in 2016
compared to US$634m in 2015.
Regional capital expenditure
included: » Our Australian mines increased
capital expenditure from A$373m
(US$281m) in 2015 to A$431m
(US$322m) in 2016, amid higher
expenditure on new mine
developments at Granny Smith
and St Ives » Capital expenditure at South Deep
increased from US$67m in 2015
to US$78m in 2016, reflecting the
purchase of new fleet, and certain
infrastructure projects » At Cerro Corona in Peru capital
expenditure decreased from
US$65m in 2015 to US$43m in
2016, mainly due to higher
expenditure in the construction of
the tailings dam, waste storage
facilities and one-time capital
projects in 2015 » Capital expenditure at our
Ghanaian operations declined
to US$206m in 2016 (2015:
US$221m), as higher expenditure
on stripping at Damang’s
Amoanda pit was offset by a
decline in spending on new mining
fleet at Tarkwa
Despite the significant decline in the
copper price during 2016, Cerro
Corona recorded a sound
performance with total managed
gold-equivalent production of
270,000oz, 4% ahead of guidance
of 260,000oz. It was, however, 9%
lower than the 296,000oz produced
in 2015, mainly as a result of the
lower gold-copper price ratio, lower
gold head grades treated and
reduced gold recoveries.
Net operating costs, including
gold-in-process movements,
declined by 3% from US$145m in
2015 to US$140m in 2016. The
lower cost was mainly due to a
US$4m build-up of concentrate
inventory in 2016 compared to a
US$1m drawdown in 2015. Capital
expenditure decreased by 34% from
US$65m in 2015 to US$43m in
2016, mainly due to higher
expenditure on construction of the
tailings dam, waste storage facilities
and once-off capital projects in 2015.
AISC and AIC were US$499/oz in
2016 compared to US$718/oz in
2015 and, on a gold-equivalent
basis, US$762/oz in 2016 compared
to US$777/oz in 2015. The decrease
in AISC and AIC was primarily due to
higher by-product credits and lower
capital expenditure, partially offset
by lower gold sold.
The region reported net cash inflow
of US$77m during 2016 compared
with US$35m in 2015.
2017 guidance: » Gold only production:
152,000oz » Copper production: 27.5kt » Gold-equivalent production:
290,000oz » AISC/AIC: US$620/oz » AIC/AISC (Au-eq): US$780/oz » A gold price of US$1.100/oz
and copper price of US$2.50/lb
was used
AMERICAS REGION
2017
Guidance
2016
Actual
2016
Guidance
2015
Actual
Gold-only production koz 152 150 150 159
Copper production kt 28 31 28 29
Gold-equivalent production koz 290 270 260 296
AIC/AISC Au eq-oz US$/oz 620 499 790 718
AIC/AISC Au eq-oz US$/oz 780 762 860 777
Bus
ines
s
optim
isat
ion
The Gold Fields Integrated Annual Report 201657
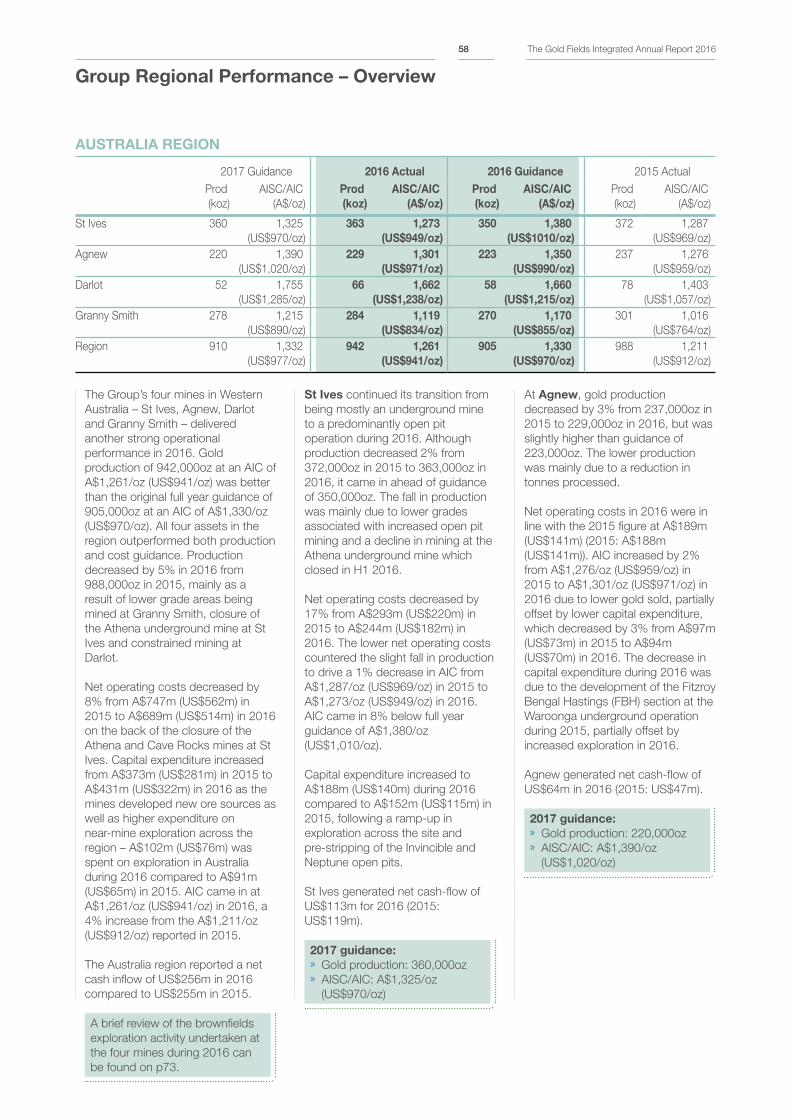
The Group’s four mines in Western
Australia – St Ives, Agnew, Darlot
and Granny Smith – delivered
another strong operational
performance in 2016. Gold
production of 942,000oz at an AIC of
A$1,261/oz (US$941/oz) was better
than the original full year guidance of
905,000oz at an AIC of A$1,330/oz
(US$970/oz). All four assets in the
region outperformed both production
and cost guidance. Production
decreased by 5% in 2016 from
988,000oz in 2015, mainly as a
result of lower grade areas being
mined at Granny Smith, closure of
the Athena underground mine at St
Ives and constrained mining at
Darlot.
Net operating costs decreased by
8% from A$747m (US$562m) in
2015 to A$689m (US$514m) in 2016
on the back of the closure of the
Athena and Cave Rocks mines at St
Ives. Capital expenditure increased
from A$373m (US$281m) in 2015 to
A$431m (US$322m) in 2016 as the
mines developed new ore sources as
well as higher expenditure on
near-mine exploration across the
region – A$102m (US$76m) was
spent on exploration in Australia
during 2016 compared to A$91m
(US$65m) in 2015. AIC came in at
A$1,261/oz (US$941/oz) in 2016, a
4% increase from the A$1,211/oz
(US$912/oz) reported in 2015.
The Australia region reported a net
cash inflow of US$256m in 2016
compared to US$255m in 2015.
A brief review of the brownfields
exploration activity undertaken at
the four mines during 2016 can
be found on p73.
AUSTRALIA REGION
2017 Guidance 2016 Actual 2016 Guidance 2015 Actual
Prod
(koz)
AISC/AIC
(A$/oz)
Prod
(koz)
AISC/AIC
(A$/oz)
Prod
(koz)
AISC/AIC
(A$/oz)
Prod
(koz)
AISC/AIC
(A$/oz)
St Ives 360 1,325
(US$970/oz)
363 1,273
(US$949/oz)
350 1,380
(US$1010/oz)
372 1,287
(US$969/oz)
Agnew 220 1,390
(US$1,020/oz)
229 1,301
(US$971/oz)
223 1,350
(US$990/oz)
237 1,276
(US$959/oz)
Darlot 52 1,755
(US$1,285/oz)
66 1,662
(US$1,238/oz)
58 1,660
(US$1,215/oz)
78 1,403
(US$1,057/oz)
Granny Smith 278 1,215
(US$890/oz)
284 1,119
(US$834/oz)
270 1,170
(US$855/oz)
301 1,016
(US$764/oz)
Region 910 1,332
(US$977/oz)
942 1,261
(US$941/oz)
905 1,330
(US$970/oz)
988 1,211
(US$912/oz)
St Ives continued its transition from
being mostly an underground mine
to a predominantly open pit
operation during 2016. Although
production decreased 2% from
372,000oz in 2015 to 363,000oz in
2016, it came in ahead of guidance
of 350,000oz. The fall in production
was mainly due to lower grades
associated with increased open pit
mining and a decline in mining at the
Athena underground mine which
closed in H1 2016.
Net operating costs decreased by
17% from A$293m (US$220m) in
2015 to A$244m (US$182m) in
2016. The lower net operating costs
countered the slight fall in production
to drive a 1% decrease in AIC from
A$1,287/oz (US$969/oz) in 2015 to
A$1,273/oz (US$949/oz) in 2016.
AIC came in 8% below full year
guidance of A$1,380/oz
(US$1,010/oz).
Capital expenditure increased to
A$188m (US$140m) during 2016
compared to A$152m (US$115m) in
2015, following a ramp-up in
exploration across the site and
pre-stripping of the Invincible and
Neptune open pits.
St Ives generated net cash-flow of
US$113m for 2016 (2015:
US$119m).
2017 guidance: » Gold production: 360,000oz » AISC/AIC: A$1,325/oz
(US$970/oz)
At Agnew, gold production
decreased by 3% from 237,000oz in
2015 to 229,000oz in 2016, but was
slightly higher than guidance of
223,000oz. The lower production
was mainly due to a reduction in
tonnes processed.
Net operating costs in 2016 were in
line with the 2015 figure at A$189m
(US$141m) (2015: A$188m
(US$141m)). AIC increased by 2%
from A$1,276/oz (US$959/oz) in
2015 to A$1,301/oz (US$971/oz) in
2016 due to lower gold sold, partially
offset by lower capital expenditure,
which decreased by 3% from A$97m
(US$73m) in 2015 to A$94m
(US$70m) in 2016. The decrease in
capital expenditure during 2016 was
due to the development of the Fitzroy
Bengal Hastings (FBH) section at the
Waroonga underground operation
during 2015, partially offset by
increased exploration in 2016.
Agnew generated net cash-flow of
US$64m in 2016 (2015: US$47m).
2017 guidance: » Gold production: 220,000oz » AISC/AIC: A$1,390/oz
(US$1,020/oz)
Group Regional Performance – Overview
The Gold Fields Integrated Annual Report 201658
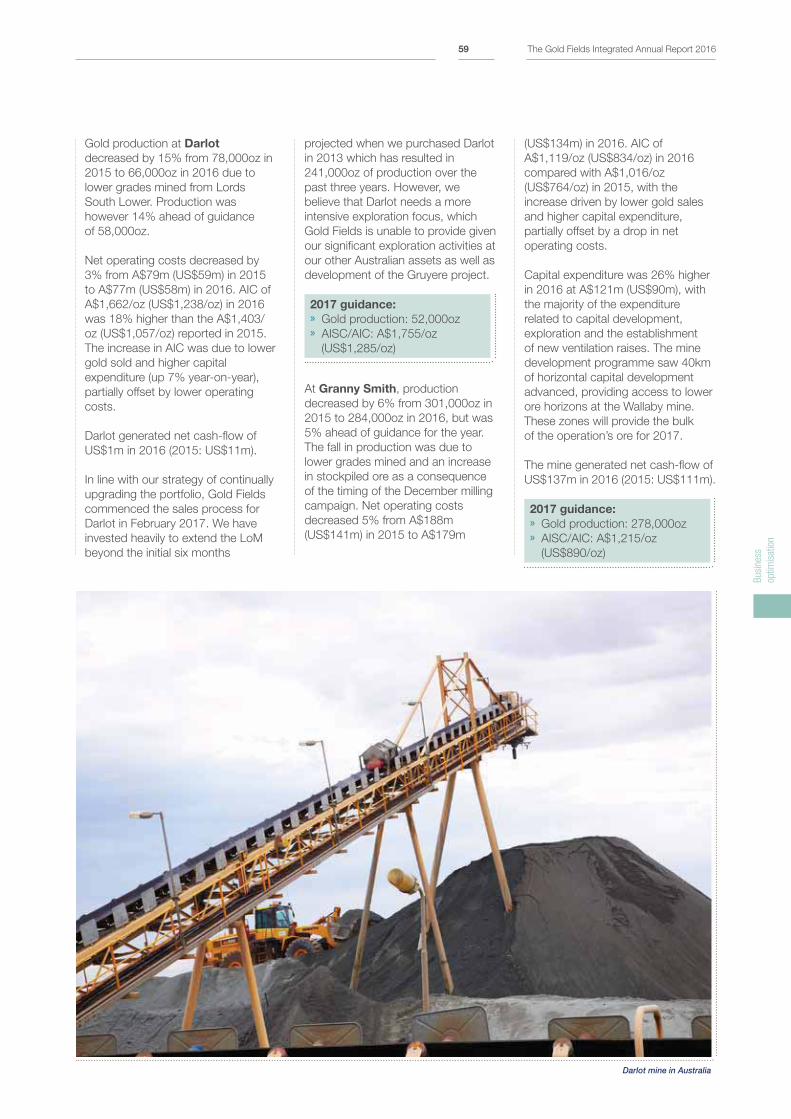
Gold production at Darlot
decreased by 15% from 78,000oz in
2015 to 66,000oz in 2016 due to
lower grades mined from Lords
South Lower. Production was
however 14% ahead of guidance
of 58,000oz.
Net operating costs decreased by
3% from A$79m (US$59m) in 2015
to A$77m (US$58m) in 2016. AIC of
A$1,662/oz (US$1,238/oz) in 2016
was 18% higher than the A$1,403/
oz (US$1,057/oz) reported in 2015.
The increase in AIC was due to lower
gold sold and higher capital
expenditure (up 7% year-on-year),
partially offset by lower operating
costs.
Darlot generated net cash-flow of
US$1m in 2016 (2015: US$11m).
In line with our strategy of continually
upgrading the portfolio, Gold Fields
commenced the sales process for
Darlot in February 2017. We have
invested heavily to extend the LoM
beyond the initial six months
projected when we purchased Darlot
in 2013 which has resulted in
241,000oz of production over the
past three years. However, we
believe that Darlot needs a more
intensive exploration focus, which
Gold Fields is unable to provide given
our significant exploration activities at
our other Australian assets as well as
development of the Gruyere project.
2017 guidance: » Gold production: 52,000oz » AISC/AIC: A$1,755/oz
(US$1,285/oz)
At Granny Smith, production
decreased by 6% from 301,000oz in
2015 to 284,000oz in 2016, but was
5% ahead of guidance for the year.
The fall in production was due to
lower grades mined and an increase
in stockpiled ore as a consequence
of the timing of the December milling
campaign. Net operating costs
decreased 5% from A$188m
(US$141m) in 2015 to A$179m
(US$134m) in 2016. AIC of
A$1,119/oz (US$834/oz) in 2016
compared with A$1,016/oz
(US$764/oz) in 2015, with the
increase driven by lower gold sales
and higher capital expenditure,
partially offset by a drop in net
operating costs.
Capital expenditure was 26% higher
in 2016 at A$121m (US$90m), with
the majority of the expenditure
related to capital development,
exploration and the establishment
of new ventilation raises. The mine
development programme saw 40km
of horizontal capital development
advanced, providing access to lower
ore horizons at the Wallaby mine.
These zones will provide the bulk
of the operation’s ore for 2017.
The mine generated net cash-flow of
US$137m in 2016 (2015: US$111m).
2017 guidance: » Gold production: 278,000oz » AISC/AIC: A$1,215/oz
(US$890/oz)
Darlot mine in Australia
Bus
ines
s
optim
isat
ion
The Gold Fields Integrated Annual Report 201659
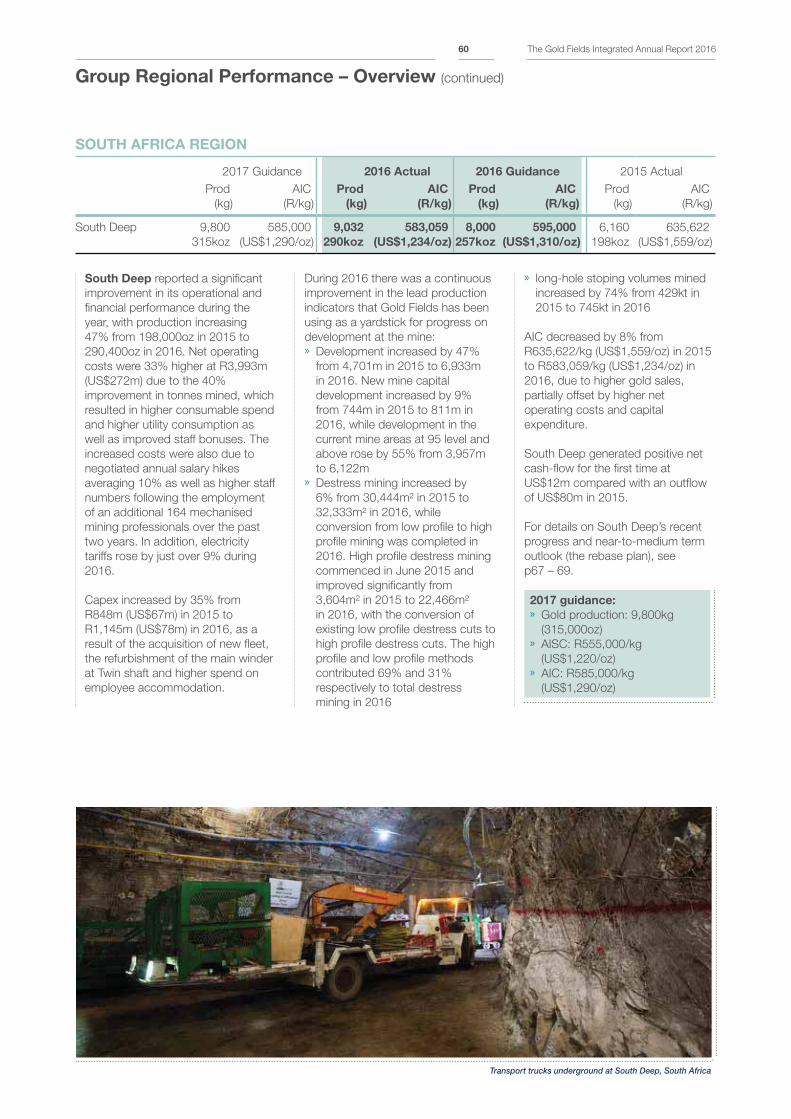
SOUTH AFRICA REGION
2017 Guidance 2016 Actual 2016 Guidance 2015 Actual
Prod
(kg)
AIC
(R/kg)
Prod
(kg)
AIC
(R/kg)
Prod
(kg)
AIC
(R/kg)
Prod
(kg)
AIC
(R/kg)
South Deep 9,800
315koz
585,000
(US$1,290/oz)
9,032
290koz
583,059
(US$1,234/oz)
8,000
257koz
595,000
(US$1,310/oz)
6,160
198koz
635,622
(US$1,559/oz)
South Deep reported a significant
improvement in its operational and
financial performance during the
year, with production increasing
47% from 198,000oz in 2015 to
290,400oz in 2016. Net operating
costs were 33% higher at R3,993m
(US$272m) due to the 40%
improvement in tonnes mined, which
resulted in higher consumable spend
and higher utility consumption as
well as improved staff bonuses. The
increased costs were also due to
negotiated annual salary hikes
averaging 10% as well as higher staff
numbers following the employment
of an additional 164 mechanised
mining professionals over the past
two years. In addition, electricity
tariffs rose by just over 9% during
2016.
Capex increased by 35% from
R848m (US$67m) in 2015 to
R1,145m (US$78m) in 2016, as a
result of the acquisition of new fleet,
the refurbishment of the main winder
at Twin shaft and higher spend on
employee accommodation.
During 2016 there was a continuous
improvement in the lead production
indicators that Gold Fields has been
using as a yardstick for progress on
development at the mine: » Development increased by 47%
from 4,701m in 2015 to 6,933m
in 2016. New mine capital
development increased by 9%
from 744m in 2015 to 811m in
2016, while development in the
current mine areas at 95 level and
above rose by 55% from 3,957m
to 6,122m » Destress mining increased by
6% from 30,444m² in 2015 to
32,333m² in 2016, while
conversion from low profile to high
profile mining was completed in
2016. High profile destress mining
commenced in June 2015 and
improved significantly from
3,604m² in 2015 to 22,466m²
in 2016, with the conversion of
existing low profile destress cuts to
high profile destress cuts. The high
profile and low profile methods
contributed 69% and 31%
respectively to total destress
mining in 2016
» long-hole stoping volumes mined
increased by 74% from 429kt in
2015 to 745kt in 2016
AIC decreased by 8% from
R635,622/kg (US$1,559/oz) in 2015
to R583,059/kg (US$1,234/oz) in
2016, due to higher gold sales,
partially offset by higher net
operating costs and capital
expenditure.
South Deep generated positive net
cash-flow for the first time at
US$12m compared with an outflow
of US$80m in 2015.
For details on South Deep’s recent
progress and near-to-medium term
outlook (the rebase plan), see
p67 – 69.
2017 guidance: » Gold production: 9,800kg
(315,000oz) » AISC: R555,000/kg
(US$1,220/oz) » AIC: R585,000/kg
(US$1,290/oz)
Group Regional Performance – Overview (continued)
Transport trucks underground at South Deep, South Africa
The Gold Fields Integrated Annual Report 201660
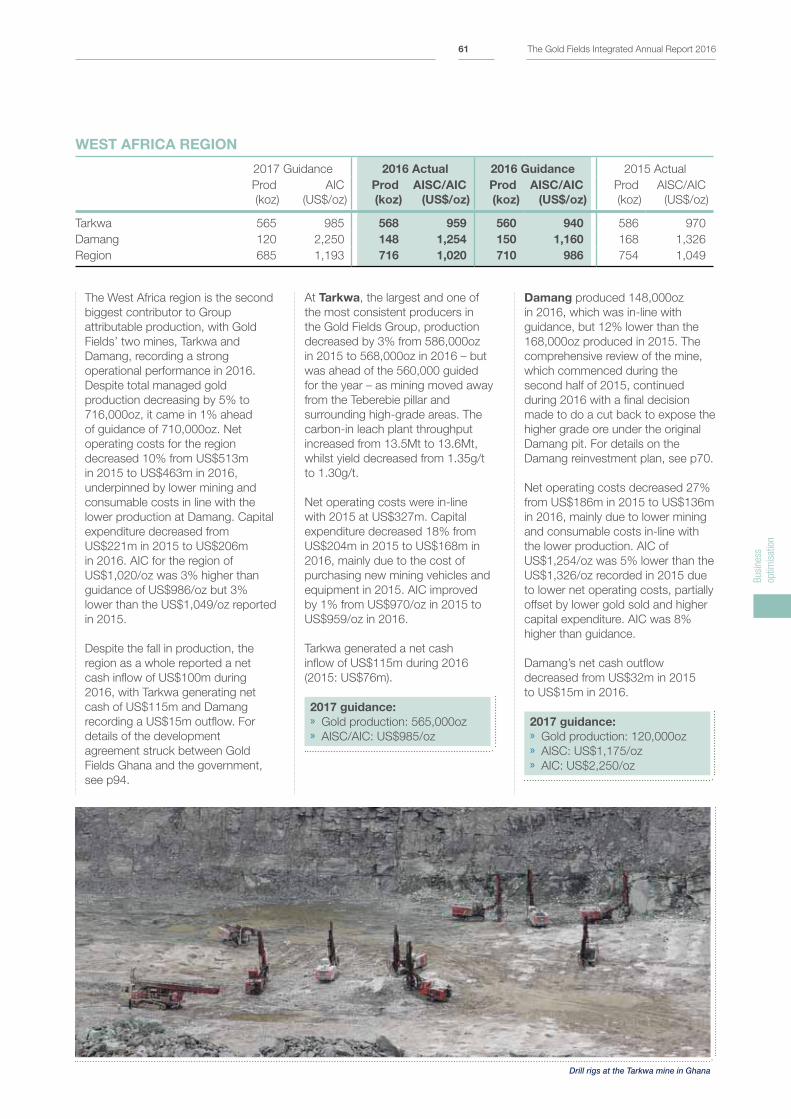
WEST AFRICA REGION
2017 Guidance 2016 Actual 2016 Guidance 2015 Actual
Prod
(koz)
AIC
(US$/oz)
Prod
(koz)
AISC/AIC
(US$/oz)
Prod
(koz)
AISC/AIC
(US$/oz)
Prod
(koz)
AISC/AIC
(US$/oz)
Tarkwa 565 985 568 959 560 940 586 970
Damang 120 2,250 148 1,254 150 1,160 168 1,326
Region 685 1,193 716 1,020 710 986 754 1,049
The West Africa region is the second
biggest contributor to Group
attributable production, with Gold
Fields’ two mines, Tarkwa and
Damang, recording a strong
operational performance in 2016.
Despite total managed gold
production decreasing by 5% to
716,000oz, it came in 1% ahead
of guidance of 710,000oz. Net
operating costs for the region
decreased 10% from US$513m
in 2015 to US$463m in 2016,
underpinned by lower mining and
consumable costs in line with the
lower production at Damang. Capital
expenditure decreased from
US$221m in 2015 to US$206m
in 2016. AIC for the region of
US$1,020/oz was 3% higher than
guidance of US$986/oz but 3%
lower than the US$1,049/oz reported
in 2015.
Despite the fall in production, the
region as a whole reported a net
cash inflow of US$100m during
2016, with Tarkwa generating net
cash of US$115m and Damang
recording a US$15m outflow. For
details of the development
agreement struck between Gold
Fields Ghana and the government,
see p94.
At Tarkwa, the largest and one of
the most consistent producers in
the Gold Fields Group, production
decreased by 3% from 586,000oz
in 2015 to 568,000oz in 2016 – but
was ahead of the 560,000 guided
for the year – as mining moved away
from the Teberebie pillar and
surrounding high-grade areas. The
carbon-in leach plant throughput
increased from 13.5Mt to 13.6Mt,
whilst yield decreased from 1.35g/t
to 1.30g/t.
Net operating costs were in-line
with 2015 at US$327m. Capital
expenditure decreased 18% from
US$204m in 2015 to US$168m in
2016, mainly due to the cost of
purchasing new mining vehicles and
equipment in 2015. AIC improved
by 1% from US$970/oz in 2015 to
US$959/oz in 2016.
Tarkwa generated a net cash
inflow of US$115m during 2016
(2015: US$76m).
2017 guidance: » Gold production: 565,000oz » AISC/AIC: US$985/oz
Damang produced 148,000oz
in 2016, which was in-line with
guidance, but 12% lower than the
168,000oz produced in 2015. The
comprehensive review of the mine,
which commenced during the
second half of 2015, continued
during 2016 with a final decision
made to do a cut back to expose the
higher grade ore under the original
Damang pit. For details on the
Damang reinvestment plan, see p70.
Net operating costs decreased 27%
from US$186m in 2015 to US$136m
in 2016, mainly due to lower mining
and consumable costs in-line with
the lower production. AIC of
US$1,254/oz was 5% lower than the
US$1,326/oz recorded in 2015 due
to lower net operating costs, partially
offset by lower gold sold and higher
capital expenditure. AIC was 8%
higher than guidance.
Damang’s net cash outflow
decreased from US$32m in 2015
to US$15m in 2016.
2017 guidance: » Gold production: 120,000oz » AISC: US$1,175/oz » AIC: US$2,250/oz
Drill rigs at the Tarkwa mine in Ghana
Bus
ines
s
optim
isat
ion
The Gold Fields Integrated Annual Report 201661
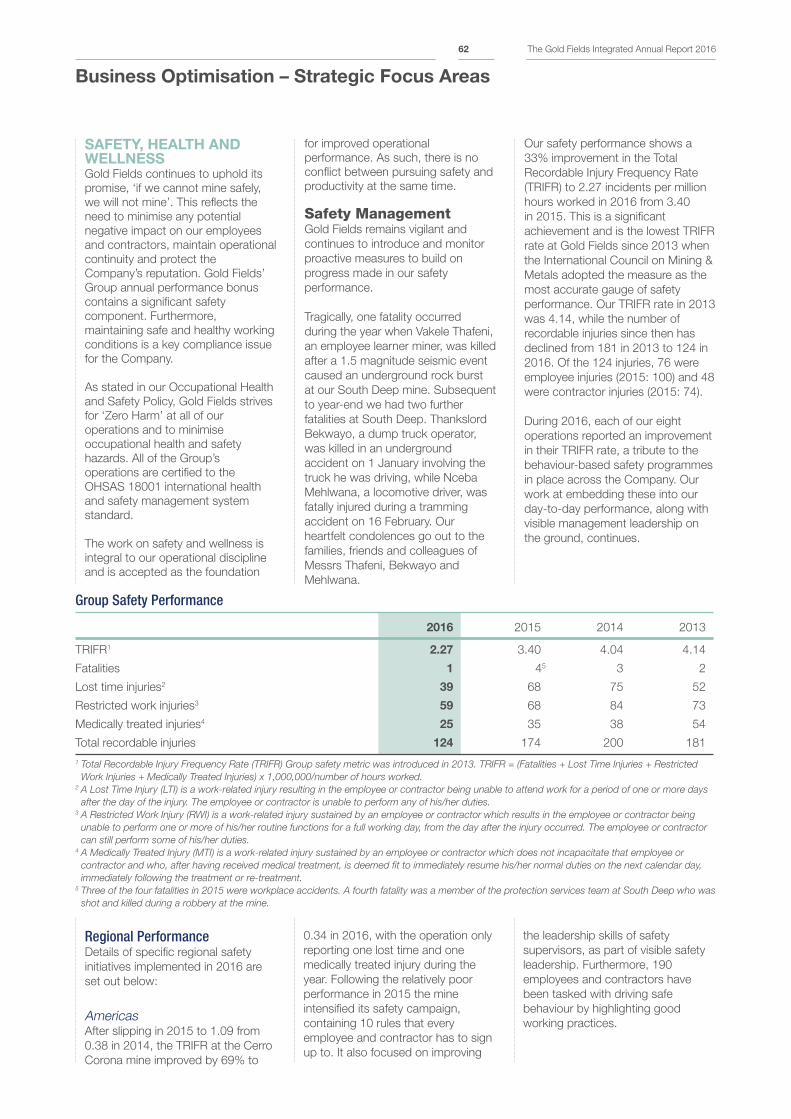
for improved operational
performance. As such, there is no
conflict between pursuing safety and
productivity at the same time.
Safety Management Gold Fields remains vigilant and
continues to introduce and monitor
proactive measures to build on
progress made in our safety
performance.
Tragically, one fatality occurred
during the year when Vakele Thafeni,
an employee learner miner, was killed
after a 1.5 magnitude seismic event
caused an underground rock burst
at our South Deep mine. Subsequent
to year-end we had two further
fatalities at South Deep. Thankslord
Bekwayo, a dump truck operator,
was killed in an underground
accident on 1 January involving the
truck he was driving, while Nceba
Mehlwana, a locomotive driver, was
fatally injured during a tramming
accident on 16 February. Our
heartfelt condolences go out to the
families, friends and colleagues of
Messrs Thafeni, Bekwayo and
Mehlwana.
Our safety performance shows a
33% improvement in the Total
Recordable Injury Frequency Rate
(TRIFR) to 2.27 incidents per million
hours worked in 2016 from 3.40
in 2015. This is a significant
achievement and is the lowest TRIFR
rate at Gold Fields since 2013 when
the International Council on Mining &
Metals adopted the measure as the
most accurate gauge of safety
performance. Our TRIFR rate in 2013
was 4.14, while the number of
recordable injuries since then has
declined from 181 in 2013 to 124 in
2016. Of the 124 injuries, 76 were
employee injuries (2015: 100) and 48
were contractor injuries (2015: 74).
During 2016, each of our eight
operations reported an improvement
in their TRIFR rate, a tribute to the
behaviour-based safety programmes
in place across the Company. Our
work at embedding these into our
day-to-day performance, along with
visible management leadership on
the ground, continues.
SAFETY, HEALTH AND WELLNESSGold Fields continues to uphold its
promise, ‘if we cannot mine safely,
we will not mine’. This reflects the
need to minimise any potential
negative impact on our employees
and contractors, maintain operational
continuity and protect the
Company’s reputation. Gold Fields’
Group annual performance bonus
contains a significant safety
component. Furthermore,
maintaining safe and healthy working
conditions is a key compliance issue
for the Company.
As stated in our Occupational Health
and Safety Policy, Gold Fields strives
for ‘Zero Harm’ at all of our
operations and to minimise
occupational health and safety
hazards. All of the Group’s
operations are certified to the
OHSAS 18001 international health
and safety management system
standard.
The work on safety and wellness is
integral to our operational discipline
and is accepted as the foundation
Group Safety Performance
2016 2015 2014 2013
TRIFR1 2.27 3.40 4.04 4.14
Fatalities 1 45 3 2
Lost time injuries2 39 68 75 52
Restricted work injuries3 59 68 84 73
Medically treated injuries4 25 35 38 54
Total recordable injuries 124 174 200 181
1 Total Recordable Injury Frequency Rate (TRIFR) Group safety metric was introduced in 2013. TRIFR = (Fatalities + Lost Time Injuries + Restricted
Work Injuries + Medically Treated Injuries) x 1,000,000/number of hours worked.2 A Lost Time Injury (LTI) is a work-related injury resulting in the employee or contractor being unable to attend work for a period of one or more days
after the day of the injury. The employee or contractor is unable to perform any of his/her duties.3 A Restricted Work Injury (RWI) is a work-related injury sustained by an employee or contractor which results in the employee or contractor being
unable to perform one or more of his/her routine functions for a full working day, from the day after the injury occurred. The employee or contractor
can still perform some of his/her duties.4 A Medically Treated Injury (MTI) is a work-related injury sustained by an employee or contractor which does not incapacitate that employee or
contractor and who, after having received medical treatment, is deemed fit to immediately resume his/her normal duties on the next calendar day,
immediately following the treatment or re-treatment.5 Three of the four fatalities in 2015 were workplace accidents. A fourth fatality was a member of the protection services team at South Deep who was
shot and killed during a robbery at the mine.
Business Optimisation – Strategic Focus Areas
Regional PerformanceDetails of specific regional safety
initiatives implemented in 2016 are
set out below:
AmericasAfter slipping in 2015 to 1.09 from
0.38 in 2014, the TRIFR at the Cerro
Corona mine improved by 69% to
0.34 in 2016, with the operation only
reporting one lost time and one
medically treated injury during the
year. Following the relatively poor
performance in 2015 the mine
intensified its safety campaign,
containing 10 rules that every
employee and contractor has to sign
up to. It also focused on improving
the leadership skills of safety
supervisors, as part of visible safety
leadership. Furthermore, 190
employees and contractors have
been tasked with driving safe
behaviour by highlighting good
working practices.
The Gold Fields Integrated Annual Report 201662

AustraliaDuring 2016, the TRIFR for Gold
Fields Australia improved by 42% to
9.43 from the 2015 rate of 16.27.
This is the lowest rate since the
acquisition of the Yilgarn South
assets in 2013, when the region’s
integrated safety strategy was first
launched. The TRIFR has been
reduced by 73% since then. Three
of the mines – St Ives, Darlot and
Granny Smith – showed
improvements ranging from 47% –
55% during 2016 and all three
recorded their lowest TRIFR rate
since 2013. Agnew’s improvement
was lower at 13% after a number
of safety-related incidents with a
contracting firm early in 2016.
Targeted interventions managed to
address its performance.
At the heart of Gold Fields Australia’s
safety efforts are two programmes:
the ongoing Visible Felt Leadership
and Vital Behaviours programmes,
both of which were introduced in
2014. Risk assessments undertaken
on all recordable injuries since 2012
indicate that the risk of incidences
that result in recordable injuries is
steadily declining with no high-risk
events having occurred since 2014.
During 2016, all mines in the region
revitalised their safety programmes
as well as safety discipline. A
particular focus has been on new
employees and contractors, where
there was evidence of a greater
risk of injury. The findings of an
anonymous survey among
employees about the safety
programmes and standards, carried
out annually over the past three
years, will feed into the region’s
safety strategy for the next three
years.
South AfricaSouth Deep’s safety performance
showed a significant improvement
with the TRIFR falling by 17% from
2.91 in 2015 to 2.42 in 2016.
However, this overall improvement
was overshadowed by the fatal
fall-of-ground accident experienced
by the mine in September 2016. In
2015 South Deep reported two
mining-related fatalities and one fatal
shooting.
As a result of the fatal accident, the
Department of Mineral Resources
(DMR) issued two Section 54
work-safety related stoppages.
A further 13 Section 54 stoppages
were issued during 2016 following
visits by the DMR due to either
perceived unsafe working conditions,
inadequate safety procedures or
untrained personnel. This brings to
15 the total number of Section 54s in
2016 (2015: 16). Gold Fields
continues to work with the DMR in
addressing safety and wellness
related issues at South Deep.
The number of total injuries reported
by the mine went up from 68 in 2015
to 75 in 2016. (The TRIFR for South
Deep is lower due to more hours
worked.) Three categories – Material
& Equipment, Fall-of- Ground and
Slip & Fall – accounting for 77% of
these injuries. Fall-of-ground
accidents had been on a steady
decline to six in 2015 but picked up
again in 2016 with 15 incidents,
including the fatal accident. We
continue our efforts to move
mineworkers away from potentially
dangerous areas and have installed
extensive secondary support
throughout the mine to limit the
impact of rock bursts.
The number of seismic events at
South Deep registering above one
on the Richter scale increased from
73 in 2015 to 101 in 2016 (of which
six were over two on the scale) as
the mine accelerated its ramp-up.
Despite the fact that the average
energy released per seismic event
has dropped, the mine has
intensified its efforts at improving
its forecasting abilities. It is working
with 12 consultancies and
institutions, including the Institute of
Mine Seismology and the Council for
Geoscience, to monitor, understand
and mitigate against seismic
underground events.
Behaviour-based incident
management and strict enforcement
of safety standards continue to be
the pillars on which the mine relies
to improve working place physical
conditions and address at risky
behaviour. In addition, 30% of
bonuses, on average, are linked to
safety-related performance. During
2016, South Deep rolled out four
programmes to improve its safety
performance, including back-to-
basics training, hazard identification
and risk assessments as well as
artisan upskilling. Testing for alcohol
and cannabis is also carried out as
part of the mine’s zero tolerance
policy, which applies to all South
Deep employees.
Beyond behaviour-based
management, South Deep has also
intensified its effort to engineer-out
safety risks, through pre-conditioning
of working areas, as well as a focus
on consumable material and
equipment. As part of this,
installation of a rail-bound proximity
detection system was completed in
Q1 2016, with which all
56 locomotives at the mine were
fitted and relevant operators and
artisans trained in its use. The
installation of fixed beacons at the
mine during the latter part of 2016
has helped to facilitate direct
communication between the
locomotives.
West AfricaBoth Tarkwa and Damang reported
better TRIFR during 2016, with
Tarkwa improving by 23% to 0.31
and Damang by 37% to 1.67. The
region reported no fatality in 2016
after recording one fatal accident
during 2015. An external health and
safety audit undertaken in Q4 2016
made no adverse finding and
reported no high-risk events at either
mine.
The mines rely on a number of
behaviour-based and safety
discipline awareness programmes to
entrench safe behaviour and during
2016 this was supported by more
frequent walkabouts by senior
management. A key part of the
safety strategy is a zero tolerance
approach to drug and alcohol use,
which is applicable to all employees
in the West Africa region. Over
130,000 sobriety tests were
conducted during 2016 and 28
employees and contractors, who
were found to be over the limit, were
discharged immediately. The zero
tolerance approach is supported by
free counselling and educational
sessions on drug and alcohol abuse.
Bus
ines
s
optim
isat
ion
The Gold Fields Integrated Annual Report 201663
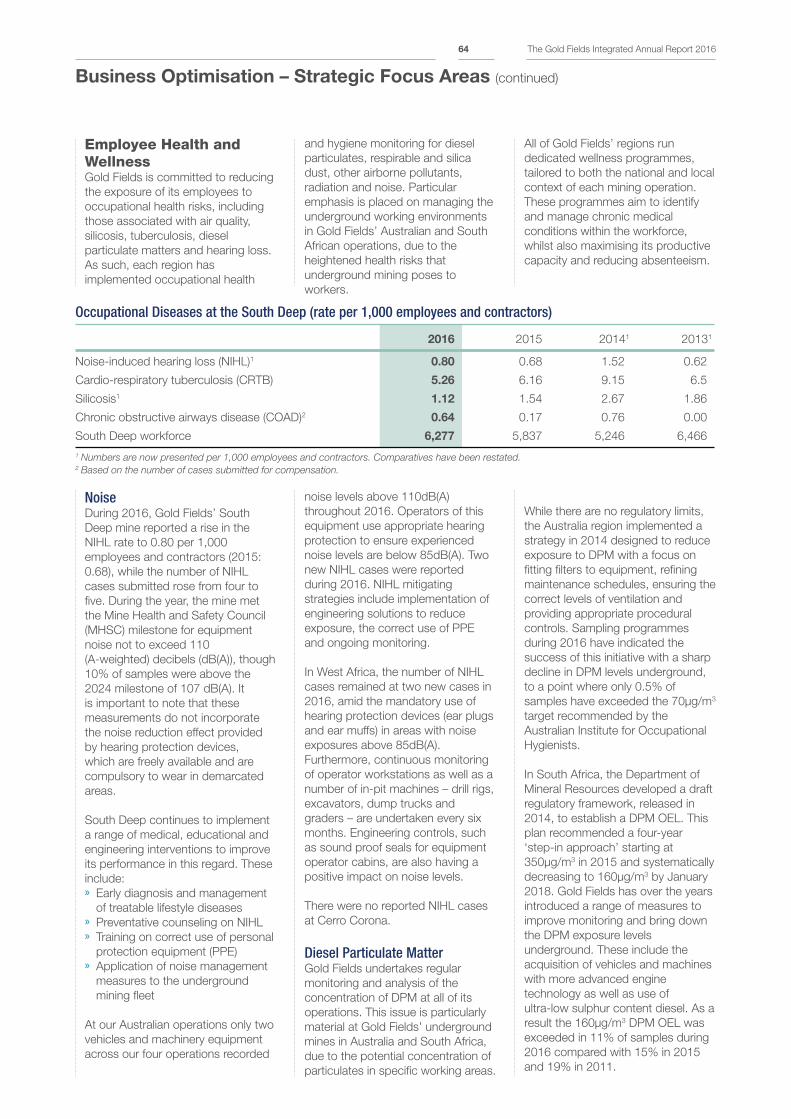
Business Optimisation – Strategic Focus Areas (continued)
Employee Health and WellnessGold Fields is committed to reducing
the exposure of its employees to
occupational health risks, including
those associated with air quality,
silicosis, tuberculosis, diesel
particulate matters and hearing loss.
As such, each region has
implemented occupational health
and hygiene monitoring for diesel
particulates, respirable and silica
dust, other airborne pollutants,
radiation and noise. Particular
emphasis is placed on managing the
underground working environments
in Gold Fields’ Australian and South
African operations, due to the
heightened health risks that
underground mining poses to
workers.
Occupational Diseases at the South Deep (rate per 1,000 employees and contractors)
2016 2015 20141 20131
Noise-induced hearing loss (NIHL)1 0.80 0.68 1.52 0.62
Cardio-respiratory tuberculosis (CRTB) 5.26 6.16 9.15 6.5
Silicosis1 1.12 1.54 2.67 1.86
Chronic obstructive airways disease (COAD)2 0.64 0.17 0.76 0.00
South Deep workforce 6,277 5,837 5,246 6,466
1 Numbers are now presented per 1,000 employees and contractors. Comparatives have been restated.2 Based on the number of cases submitted for compensation.
All of Gold Fields’ regions run
dedicated wellness programmes,
tailored to both the national and local
context of each mining operation.
These programmes aim to identify
and manage chronic medical
conditions within the workforce,
whilst also maximising its productive
capacity and reducing absenteeism.
While there are no regulatory limits,
the Australia region implemented a
strategy in 2014 designed to reduce
exposure to DPM with a focus on
fitting filters to equipment, refining
maintenance schedules, ensuring the
correct levels of ventilation and
providing appropriate procedural
controls. Sampling programmes
during 2016 have indicated the
success of this initiative with a sharp
decline in DPM levels underground,
to a point where only 0.5% of
samples have exceeded the 70μg/m3
target recommended by the
Australian Institute for Occupational
Hygienists.
In South Africa, the Department of
Mineral Resources developed a draft
regulatory framework, released in
2014, to establish a DPM OEL. This
plan recommended a four-year
‘step-in approach’ starting at
350μg/m3 in 2015 and systematically
decreasing to 160μg/m3 by January
2018. Gold Fields has over the years
introduced a range of measures to
improve monitoring and bring down
the DPM exposure levels
underground. These include the
acquisition of vehicles and machines
with more advanced engine
technology as well as use of
ultra-low sulphur content diesel. As a
result the 160μg/m3 DPM OEL was
exceeded in 11% of samples during
2016 compared with 15% in 2015
and 19% in 2011.
noise levels above 110dB(A)
throughout 2016. Operators of this
equipment use appropriate hearing
protection to ensure experienced
noise levels are below 85dB(A). Two
new NIHL cases were reported
during 2016. NIHL mitigating
strategies include implementation of
engineering solutions to reduce
exposure, the correct use of PPE
and ongoing monitoring.
In West Africa, the number of NIHL
cases remained at two new cases in
2016, amid the mandatory use of
hearing protection devices (ear plugs
and ear muffs) in areas with noise
exposures above 85dB(A).
Furthermore, continuous monitoring
of operator workstations as well as a
number of in-pit machines – drill rigs,
excavators, dump trucks and
graders – are undertaken every six
months. Engineering controls, such
as sound proof seals for equipment
operator cabins, are also having a
positive impact on noise levels.
There were no reported NIHL cases
at Cerro Corona.
Diesel Particulate MatterGold Fields undertakes regular
monitoring and analysis of the
concentration of DPM at all of its
operations. This issue is particularly
material at Gold Fields’ underground
mines in Australia and South Africa,
due to the potential concentration of
particulates in specific working areas.
NoiseDuring 2016, Gold Fields’ South
Deep mine reported a rise in the
NIHL rate to 0.80 per 1,000
employees and contractors (2015:
0.68), while the number of NIHL
cases submitted rose from four to
five. During the year, the mine met
the Mine Health and Safety Council
(MHSC) milestone for equipment
noise not to exceed 110
(A-weighted) decibels (dB(A)), though
10% of samples were above the
2024 milestone of 107 dB(A). It
is important to note that these
measurements do not incorporate
the noise reduction effect provided
by hearing protection devices,
which are freely available and are
compulsory to wear in demarcated
areas.
South Deep continues to implement
a range of medical, educational and
engineering interventions to improve
its performance in this regard. These
include: » Early diagnosis and management
of treatable lifestyle diseases » Preventative counseling on NIHL » Training on correct use of personal
protection equipment (PPE) » Application of noise management
measures to the underground
mining fleet
At our Australian operations only two
vehicles and machinery equipment
across our four operations recorded
The Gold Fields Integrated Annual Report 201664
In Ghana and Cerro Corona, the
exposure levels and concentration of
personal and area DPM samples are
insignificant.
Silicosis and TuberculosisIn 2015, the Mine Health and Safety
Council introduced new aspirational
silica dust exposure targets for South
African gold mines. These milestones
require that personal exposure levels
to silica dust be reduced from
0.1mg/m³ to <0.05mg/m³ by 2024.
South Deep is already using the 2014
level to guide its performance and in
2016 26% of the personal silica dust
samples exceeded this level. South
Deep has accelerated the
implementation of a range of improved
dust control measures to gradually
reduce these levels, including: » Real-time dust monitoring » Fitting water mist sprays at dust
sources » Dust management controls
on footwalls and internal tips » Installation of manually controlled
water blasts in all working areas
During 2016 the Silicosis rate per
1,000 employees improved by 28%
to 1.12 from 1.54 in 2015, with the
number of Silicosis cases submitted
to the relevant health authorities
falling from nine to seven. Similarly,
the CRTB rate improved by 15% in
2016 to 5.26 per 1,000 employees
(2015: 6.16) and the number of
CRTB cases submitted fell to 33
in 2016 from 36 in 2015.
In 2014 an industry working group
was formed to address issues
relating to compensation and
medical care for occupational lung
disease in the South African gold
mining industry. During the year, the
working group had extensive
engagements with a wide range of
stakeholders in 2016, including
government, organised labour, other
mining companies and legal
representatives of claimants who
have filed legal suits against
the companies.
The companies – Anglo American
South Africa, AngloGold Ashanti,
African Rainbow Minerals, Gold
Fields, Harmony and Sibanye –
believe that fairness and
sustainability are crucial elements
of any solution and are working
together with these stakeholders
to design and implement a
comprehensive solution that is both
fair to past, present and future gold
mining employees and also
sustainable for the sector. The
companies are among respondent
companies in a number of lawsuits
related to occupational lung disease,
but do not believe that they are liable
in respect of the claims brought, and
are defending these.
At our open pit operations in Ghana,
Australia and Peru, contact with
silica dust is limited due to the nature
of open pit mining and the low silica
content of the ore bodies. In 2016,
there were no new cases of Silicosis
and two CRTB cases at our
Ghanaian operations. Despite this,
regular gravimetric sampling of
respirable silica dust samples are
carried out and evaluated.
HIV/AidsHIV/Aids management is integrated
into Gold Fields’ mainstream health
services and Voluntary Counselling
and Testing (VCT) takes place during
regular employee health assessments.
This has the added benefit of directly
addressing the interaction of HIV/Aids
with related health issues such as
tuberculosis (TB) and other sexually
transmitted infections (STIs).
In South Africa an estimated 19%
of adults (aged 15 to 49) live with
HIV/Aids. Gold Fields is committed
to lowering the HIV/Aids prevalence
at South Deep, where the prevalence
rate (% of the workforce living with
HIV/Aids) was 5% in December
2016. There was an increase in the
number of employees tested positive
to 112 in 2016 from 69 in 2015.
Since 2011, 3,440 employees have
tested of which 403 tested positive. South Deep’s integrated HIV/Aids,
STI and TB strategy directly
addresses interactions between
these diseases. It has four key pillars: » Promotion: This includes regular
publicity campaigns and condom
distribution at all workplaces » Prevention: VCT is provided to
all employees, contractors, their
partners and family members on
a confidential basis. In 2016, the
mine’s VCT participation rate was
around 23%
» Treatment: Free Highly Active
Anti-Retroviral Treatment (HAART)
is provided to HIV-infected
employees through onsite, medical
doctor-staffed clinics. In 2016, 53
employees joined the HAART
programme (2015: 50). This takes
the total number of active
participants to 332 (2015: 296),
with 533 cumulatively enrolled
since the HAART programme
began in 2004. Employees’
dependants can also receive
HAART via the Company’s medical
aid schemes. We do not provide
treatment to employees from
contracting firms, which provide
their own support to their staff » Support: This includes doctor-
based primary healthcare,
psychological counselling and
social services for all employees
and contractors. South Deep also
supports a number of community-
based HIV/Aids projects.
In Ghana, where the national HIV/
Aids rate is around 1.5%, employees
and contractors have access to a
confidential VCT programme which
employees receive free of charge.
During 2016, about 45% of the
Ghana operations’ workforce
underwent the VCT programme.
Anyone testing positive is provided
with free treatment in line with the
government’s national HIV/Aids
treatment programme. By year-end
2016 Ghana had 15 employees on
HAART (2015: 19).
MalariaOur workforce in Ghana faces a high
risk of exposure to malaria and the
Company has a comprehensive
malaria strategy in place, which
incorporates education, prevention,
prophylaxis and treatment. It also
includes provision of mosquito
repellent for workers, support for
community health facilities and rapid
diagnosis and treatment.
In 2016, 505 employees (2015: 523)
tested positive for malaria after 3,181
(2015: 3,104) individuals were tested
at both of our mines. None of the
treated cases proved fatal.
Employees and dependants who live
in the mine villages have their
company housing units sprayed as
part of our Malaria Vector Control
programme. Under this programme
a total of 195 company housing units
at both mines were sprayed in 2016.
Bus
ines
s
optim
isat
ion
The Gold Fields Integrated Annual Report 201665
When looking at ‘growth’ in the Gold
Fields context, our focus is not on
growing the level of production but
rather on growing free cash-flow per
ounce and extending the average
reserve life per operation.
A key element of the Group’s
underlying strategy, which
contributes towards improving the
quality of the portfolio is value-
accretive M&A. For an asset to be
considered as an acquisition target,
it must meet the following criteria: » Quality: The asset must improve
the Group’s AIC and must
generate a FCF margin of 15%
at a US$1,300/oz gold price » Jurisdiction: It must be located
in a geography in which Gold
Fields is comfortable to operate » Life: The asset must increase our
reserve life per operation; eight
years or more of reserve life » In-production: The asset must be
in-production and cash generative » Scale: The asset must produce a
minimum of US$20m in free
cash-flow per annum
Operations that meet these criteria
are then assessed against certain
balance sheet criteria to ensure a
shortlist of assets for which the
Group has both the appetite and
capital available to pursue. Gold
Fields then undertakes a prudent
and phased investigation that may
ultimately result in acquisition. This
process includes approaching the
current owner, conducting desktop
and on-site due diligence; building
the business case, both internally
and externally and, if appropriate,
entering the final ‘deal phase’.
Gold Fields diverged slightly from its
M&A strategy during 2016 with the
investment into the Gruyere Joint
Venture – held 50% by us and 50%
by Australian mining company Gold
Road Resources – in that the
Gruyere asset is yet to be developed
and is not in production. However,
the economics of the project were
persuasive in that once in production
– which is forecast for late 2018/early
2019 – Gruyere will produce about
270,000oz (100% basis) a year over
a 13-year reserve life.
In addition, it gives Gold Fields a
foothold into an undeveloped and
highly prospective region of the
Western Australian Goldfields.
Gold Fields will maintain its
disciplined approach to any
corporate activity and will strictly
adhere to the investment criteria set
out above. We will endeavour to
grow our cash-flow margin and
enhance the quality of our portfolio
while at the same time, protecting
our balance sheet and social licence
to operate.
Investing in the FutureWith various new growth and
development projects, 2017 has
seen us entering a critical stage in
our business evolution. The focus is
now on reinvesting in the business
as well as future growth to ensure
that we can deliver sustainable free
cash-flow and improved margins for
the benefit of all stakeholders.
At the end of 2016 we announced
our joint venture with Gold Road
Resources to develop and operate
the Gruyere Gold project. In February
2017 we took over management of
the project with gold production
scheduled to start in late 2018/early
2019. Last year also saw the
decision to reinvest in Damang,
extending the LoM from 2017 to
2024. In addition, we continue to
invest in South Deep through the
ramp-up cycle.
In Chile, the Salares Norte project
has achieved the key milestone
of receiving water rights and land
access approvals and the project
is on track to progress from pre-
feasibility to feasibility status later in
2017. In addition, we will continue to
invest in brownfields exploration at
our four Australian mines and look
for growth and life extension
opportunities at Cerro Corona and
Tarkwa.
For us to grow and sustain cash-
flow, investing is necessary. While we
are planning to spend more than we
expect to generate in 2017, we are
taking the longer-term view to
growing our future cash-flow. Our
business is a long-term game, which
has to be sustainable through price
cycles and the vagaries of the
commodity markets. Importantly, we
are ensuring that we only embark on
investments with excellent potential
for pay-backs and that will, in the
long term, lower our production cost.
Business Optimisation – Strategic Focus Areas (continued)
SUSTAINING AND
GROWING A QUALITY
PORTFOLIO OF ASSETSOn an annual basis, all mines and
assets in our portfolio are subject to
the Group’s business planning
process. A scenario analysis is
conducted for each operation,
assessing how best to maximise its
cash-flow, LoM and margin. The
results of this analysis are then used
in conjunction with the Group’s
capital profile and the current
economic environment, as inputs
into our annual strategic and
operational planning.
The strength of our portfolio is
evident in the continued net cash-
flow generation of our international
assets in Australia, Ghana and
Peru, which collectively generated
US$432m during 2016. Furthermore,
our portfolio’s free cash-flow (FCF)
margin increased to 17% in 2016
from 8% in 2015.
During 2016, Gold Fields continued
to streamline its portfolio by starting
the sales process for our Darlot mine
in Australia as well as selling 11
producing and non-producing
royalties to Toronto-listed Maverix
Metals Inc. in return for a 32% stake
in the company.
However, 2016 was also the year
when – after almost three years of
consolidation – we started investing
significantly in the growth of the
business again. This strategy will be
deepened and extended in 2017
through near-mine exploration at our
Australian mines, reinvestment in
Damang, developing the Gruyere
and Salares Norte projects as well
as further ramping-up South Deep.
(Details on p67 – 69)
In 2016, Gold Fields increased
its total near-mine exploration
expenditure by 5% to US$80m
(2015: US$76m), the majority of
which – US$76m (A$102m) – was
incurred at our four Australian mines.
This budget supported a total of
753,111m of near-mine drilling
(2015: 638,766m). For 2017, we
have budgeted US$65m (A$89m) for
near-mine exploration, all of which
will be at our Australian operations.
The Gold Fields Integrated Annual Report 201666
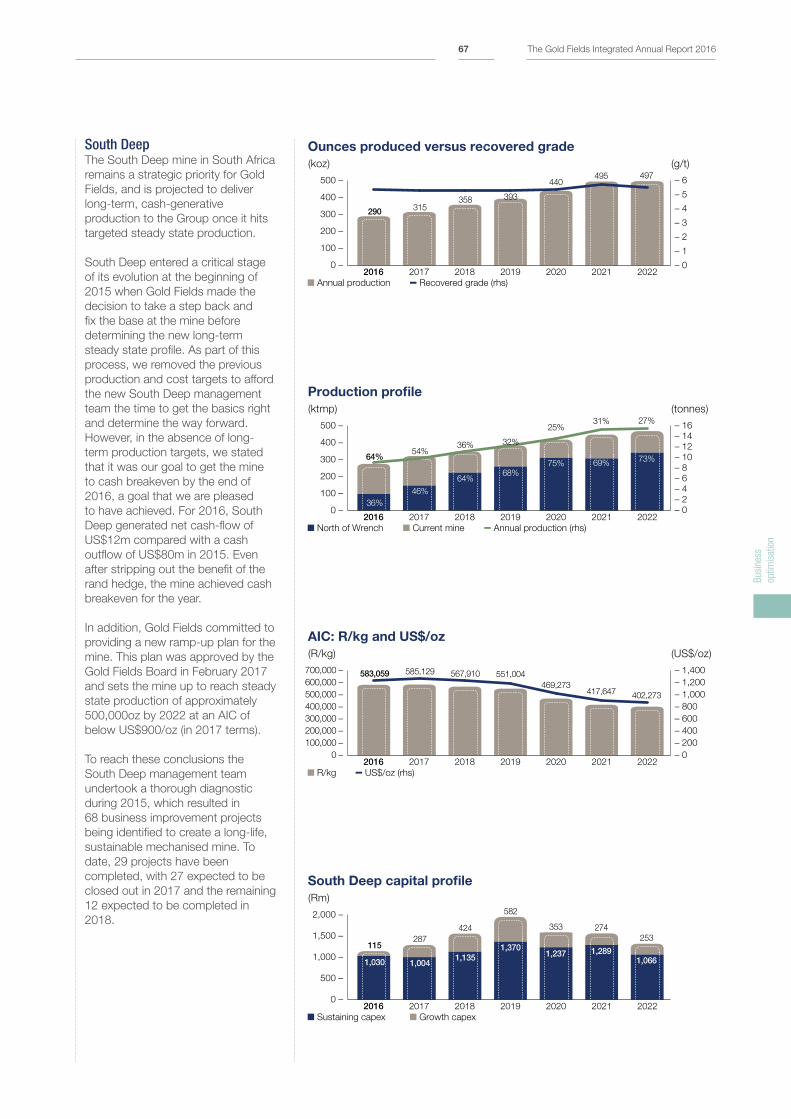
South DeepThe South Deep mine in South Africa
remains a strategic priority for Gold
Fields, and is projected to deliver
long-term, cash-generative
production to the Group once it hits
targeted steady state production.
South Deep entered a critical stage
of its evolution at the beginning of
2015 when Gold Fields made the
decision to take a step back and
fix the base at the mine before
determining the new long-term
steady state profile. As part of this
process, we removed the previous
production and cost targets to afford
the new South Deep management
team the time to get the basics right
and determine the way forward.
However, in the absence of long-
term production targets, we stated
that it was our goal to get the mine
to cash breakeven by the end of
2016, a goal that we are pleased
to have achieved. For 2016, South
Deep generated net cash-flow of
US$12m compared with a cash
outflow of US$80m in 2015. Even
after stripping out the benefit of the
rand hedge, the mine achieved cash
breakeven for the year.
In addition, Gold Fields committed to
providing a new ramp-up plan for the
mine. This plan was approved by the
Gold Fields Board in February 2017
and sets the mine up to reach steady
state production of approximately
500,000oz by 2022 at an AIC of
below US$900/oz (in 2017 terms).
To reach these conclusions the
South Deep management team
undertook a thorough diagnostic
during 2015, which resulted in
68 business improvement projects
being identified to create a long-life,
sustainable mechanised mine. To
date, 29 projects have been
completed, with 27 expected to be
closed out in 2017 and the remaining
12 expected to be completed in
2018.
Ounces produced versus recovered grade
(koz)
500 –
400 –
300 –
200 –
100 –
0 –
– 6
– 5
– 4
– 3
– 2
– 1
– 0
Annual production Recovered grade (rhs)
2017 2018 2019 2020 2021 20222016
290 315358 393
440495 497
(g/t)
Production profile
South Deep capital profile
(Rm)
2,000 –
1,500 –
1,000 –
500 –
0 –
Sustaining capex Growth capex
2017 2018 2019 2020 2021 20222016
115287
424
582
353 274
253
AIC: R/kg and US$/oz
(R/kg)
700,000 –
600,000 –
500,000 –
400,000 –
300,000 –
200,000 –
100,000 –
0 –
– 1,400
– 1,200
– 1,000
– 800
– 600
– 400
– 200
– 0
R/kg US$/oz (rhs)
2017 2018 2019 2020 2021 20222016
583,059 585,129 567,910 551,004
469,273417,647
402,273
(US$/oz)
(ktmp)
500 –
400 –
300 –
200 –
100 –
0 –
– 16
– 14
– 12
– 10
– 8
– 6
– 4
– 2
– 0
North of Wrench Current mine Annual production (rhs)
2017 2018 2019 2020 2021 20222016
64%
36%
54%
46%
36%
64%
32%
68%
25%
75%
31% 27%
69%73%
1,030 1,0041,135
1,3701,237 1,289
1,066
(tonnes)
Bus
ines
s
optim
isat
ion
The Gold Fields Integrated Annual Report 201667

past two years through extensive
trial and analysis.
– Regional Pillars: The overall
regional support design was
improved by reducing the
corridor span between regional
pillars from 240m to 180m and
by increasing the dimensions of
crush pillars in the destress cuts
from 10m x 6m to 8m x 20m.
Regional pillar width has
remained at 60m. The design
improvements resulted in lower
excavation convergence rates
and an increase in overall
rockmass stability.
– High Profile Destress: Over
the past two years South Deep
converted from a low profile
(2.2m) destress mining method
to a high profile (5.5m) layout.
This has eliminated an inefficient
and cumbersome multi-step
mining process, which included
footwall or hangwall ripping to
open excavations for long-hole
stoping equipment, and enabled
mechanised roofbolt installation.
In addition we have introduced
sequential extraction of longhole
stopes. In a significant step for
the mine, low profile was
completely phased out during
mid-2016 and all destress
development will now entail the
high profile method.
The initiatives that were implemented
over the past two years have started
to yield results during 2016, which
was a milestone year for South
Deep. (Details of our production and
lead indicator performance can be
found on p60).
Business Optimisation – Strategic Focus Areas (continued)
South Deep has faced a number of
challenges over the years which can
best be summarised into four broad
categories: People and skills; fleet
and maintenance; underground
working conditions; and mining
method. Whilst we have made good
progress on all categories over the
past two years, continued
improvement is anticipated during
the ramp-up to steady state: » People and skills: The first
priority was to establish an
experienced management team
with extensive exposure to
mechanised and deep level
mining. This objective was
successfully achieved with most of
the new management team now in
place since mid-2015. A further
168 critical skill positions requiring
experienced and skilled staff were
identified at the start of 2015. Most
of these positions were filled by the
end of 2016 with only a limited
number of appointments still
outstanding. Furthermore, the
development of mechanised
mining skills was highlighted as a
specific and critical requirement for
the future success of the mine. As
such, a mechanised mining skills
development programme focusing
on supervisors, artisans and
operators was implemented and
relevant South Deep employees
have been receiving ongoing
training. » Fleet and maintenance: South
Deep instituted a number of key
strategies to upgrade the condition
of its mechanised equipment
fleet and effectiveness of its
maintenance practices. As part
of the fleet renewal strategy,
58 category 1 units have been
commissioned since early 2015.
The total category 1 fleet currently
stands at 111. An expansive and
fully equipped underground
workshop spanning a total
footprint of 200m x 200m was
commissioned on 93 level to
provide the working conditions
necessary for maintenance
personnel to perform their tasks
more effectively. Maintenance skills
development programmes were
introduced to upskill our
engineering personnel. In addition,
outsourced OEM maintenance
contracts were concluded with
two key suppliers to effect
immediate improvements, which
will be gradually handed over to
South Deep teams. » Underground working
conditions: The new
management team identified poor
underground working conditions
as a key impediment to turning
South Deep around. A number of
business improvement projects
were initiated to remediate this
deficiency and focused on various
elements of the underground
infrastructure, including roadways,
water management, backfill and
ventilation. » Mining method: As an ultra-deep
bulk mine, geotechnical
considerations and mine design
are critical elements in
implementing the successful
extraction of the ore body. To this
end several improvements in the
overall design and mining layouts
have been implemented during the
Jumbo operator at the South Deep mine, South Africa
The Gold Fields Integrated Annual Report 201668
Five-year Outlook to Steady State
In terms of our ramp-up plan it is anticipated that South Deep will reach steady state production in 2021/2022. During
this six-year period, tonnes mined will ramp-up at a fairly steady rate from the average 135,000t/m run rate in 2016 to
230,000t/m when at steady state. A big driver of the volume growth to steady state is the increased contribution from
long-hole stoping.
The table below illustrates the key production, cost and capital metrics associated with the ramp-up project. The ramp-up
does not assume significant productivity improvements over five years, but includes the impact of opening up new areas.
Production, Cost and Capital Metrics Associated with the South Deep Ramp-Up Plan
2017 2018 2019 2020 2021 2022
Underground
Tonnes milled kt 1,885 2,268 2,483 2,687 2,766 2,861
Reef kt 1,829 2,085 2,300 2,518 2,691 2,815
Waste kt 56 182 183 168 75 46
Reef grade g/t 5.33 5.32 5.31 5.44 5.72 5.49
Gold produced kg 9,753 11,088 12,204 13,698 15,385 15,454
Gold produced koz 314 356 392 440 495 497
Surface
Tonnes milled kt 567 600 250 - - -
Grade g/t 0.08 0.08 0.08 - - -
Gold produced kg 47 48 20 - - -
Gold produced koz 2 2 1 - - -
Total production
Tonnes milled kt 2,452 2,868 2,733 2,687 2,766 2,861
Grade g/t 4.0 3.9 4.5 5.1 5.6 5.4
Gold produced kg 9,800 11,136 12,224 13,698 15,385 15,454
Gold produced koz 315 358 393 440 495 497
Capex and Costs
Sustaining capex Rm 1,004 1,135 1,370 1,237 1,289 1,066
Growth capex Rm 287 424 582 353 274 253
AIC (2017 terms) R/kg 585,129 567,910 551,004 469,273 417,647 402,273
AIC (2017 terms) US$/oz 1,280 1,240 1,195 1,020 905 875
The production ramp-up will occur
in the North of Wrench mining area,
which is a lower extension to the
current mining operations and
contains reserves of 10.7Moz. North
of Wrench expands into six corridors
with independent operating and
ventilation systems. Consequently, a
substantial increase in refrigeration
and upgrading of ventilation
infrastructure and equipment is
required in order to meet the
ramp-up profile, particularly over the
first three years of the plan.
Total project capital of R2,280m will
be spent over the next six years,
peaking at R582m in 2019. The
bulk of this capital is required for
underground infrastructure
(R1,044m) and follow-on
development (R724m), with the
remainder budgeted for electricity
(R104m), vertical development
(R88m), fleet (R66m) and drilling
(R58m). Most of these were part
of original project capital that was
deferred in 2013 (R1.2bn in 2009
money terms).
Importantly, most of the operating
expenditure is now in the cost base
of the mine, with the majority of the
key skills and fleet now in place. As
the mine ramps-up to steady state,
we anticipate the operational gearing
expected from a high fixed-cost mine
like South Deep. As a result, we
forecast steady state production AIC
of below US$900/oz (in 2017 terms).
Bus
ines
s
optim
isat
ion
The Gold Fields Integrated Annual Report 201669
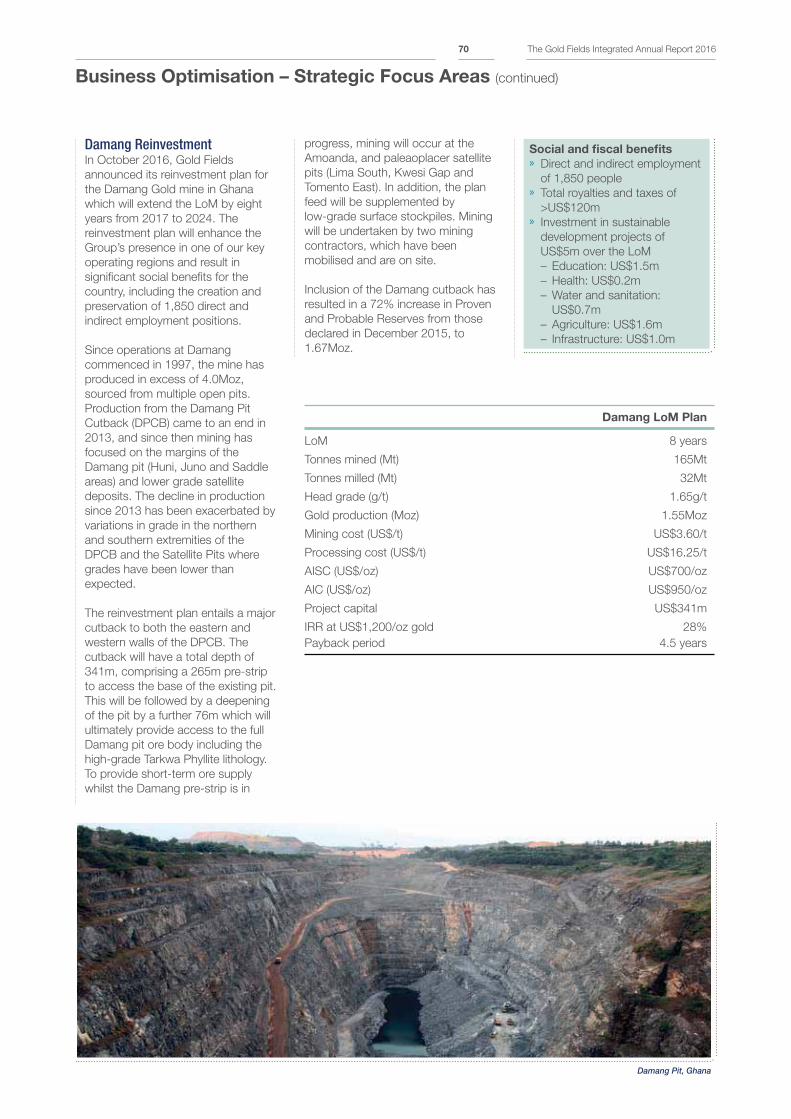
Business Optimisation – Strategic Focus Areas (continued)
Damang ReinvestmentIn October 2016, Gold Fields
announced its reinvestment plan for
the Damang Gold mine in Ghana
which will extend the LoM by eight
years from 2017 to 2024. The
reinvestment plan will enhance the
Group’s presence in one of our key
operating regions and result in
significant social benefits for the
country, including the creation and
preservation of 1,850 direct and
indirect employment positions.
Since operations at Damang
commenced in 1997, the mine has
produced in excess of 4.0Moz,
sourced from multiple open pits.
Production from the Damang Pit
Cutback (DPCB) came to an end in
2013, and since then mining has
focused on the margins of the
Damang pit (Huni, Juno and Saddle
areas) and lower grade satellite
deposits. The decline in production
since 2013 has been exacerbated by
variations in grade in the northern
and southern extremities of the
DPCB and the Satellite Pits where
grades have been lower than
expected.
The reinvestment plan entails a major
cutback to both the eastern and
western walls of the DPCB. The
cutback will have a total depth of
341m, comprising a 265m pre-strip
to access the base of the existing pit.
This will be followed by a deepening
of the pit by a further 76m which will
ultimately provide access to the full
Damang pit ore body including the
high-grade Tarkwa Phyllite lithology.
To provide short-term ore supply
whilst the Damang pre-strip is in
progress, mining will occur at the
Amoanda, and paleaoplacer satellite
pits (Lima South, Kwesi Gap and
Tomento East). In addition, the plan
feed will be supplemented by
low-grade surface stockpiles. Mining
will be undertaken by two mining
contractors, which have been
mobilised and are on site.
Inclusion of the Damang cutback has
resulted in a 72% increase in Proven
and Probable Reserves from those
declared in December 2015, to
1.67Moz.
Social and fiscal benefits » Direct and indirect employment
of 1,850 people » Total royalties and taxes of
>US$120m » Investment in sustainable
development projects of
US$5m over the LoM
– Education: US$1.5m
– Health: US$0.2m
– Water and sanitation:
US$0.7m
– Agriculture: US$1.6m
– Infrastructure: US$1.0m
Damang LoM Plan
LoM 8 years
Tonnes mined (Mt) 165Mt
Tonnes milled (Mt) 32Mt
Head grade (g/t) 1.65g/t
Gold production (Moz) 1.55Moz
Mining cost (US$/t) US$3.60/t
Processing cost (US$/t) US$16.25/t
AISC (US$/oz) US$700/oz
AIC (US$/oz) US$950/oz
Project capital US$341m
IRR at US$1,200/oz gold 28%
Payback period 4.5 years
Damang Pit, Ghana
The Gold Fields Integrated Annual Report 201670
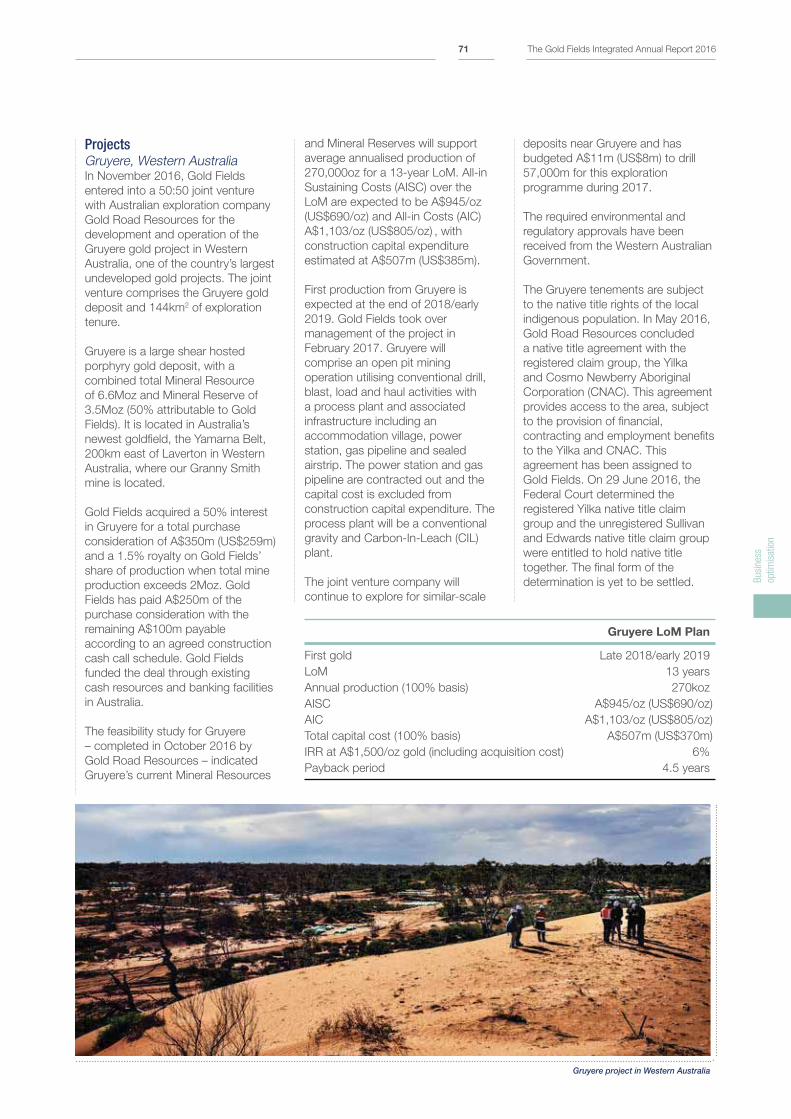
ProjectsGruyere, Western AustraliaIn November 2016, Gold Fields
entered into a 50:50 joint venture
with Australian exploration company
Gold Road Resources for the
development and operation of the
Gruyere gold project in Western
Australia, one of the country’s largest
undeveloped gold projects. The joint
venture comprises the Gruyere gold
deposit and 144km2 of exploration
tenure.
Gruyere is a large shear hosted
porphyry gold deposit, with a
combined total Mineral Resource
of 6.6Moz and Mineral Reserve of
3.5Moz (50% attributable to Gold
Fields). It is located in Australia’s
newest goldfield, the Yamarna Belt,
200km east of Laverton in Western
Australia, where our Granny Smith
mine is located.
Gold Fields acquired a 50% interest
in Gruyere for a total purchase
consideration of A$350m (US$259m)
and a 1.5% royalty on Gold Fields’
share of production when total mine
production exceeds 2Moz. Gold
Fields has paid A$250m of the
purchase consideration with the
remaining A$100m payable
according to an agreed construction
cash call schedule. Gold Fields
funded the deal through existing
cash resources and banking facilities
in Australia.
The feasibility study for Gruyere
– completed in October 2016 by
Gold Road Resources – indicated
Gruyere’s current Mineral Resources
and Mineral Reserves will support
average annualised production of
270,000oz for a 13-year LoM. All-in
Sustaining Costs (AISC) over the
LoM are expected to be A$945/oz
(US$690/oz) and All-in Costs (AIC)
A$1,103/oz (US$805/oz) , with
construction capital expenditure
estimated at A$507m (US$385m).
First production from Gruyere is
expected at the end of 2018/early
2019. Gold Fields took over
management of the project in
February 2017. Gruyere will
comprise an open pit mining
operation utilising conventional drill,
blast, load and haul activities with
a process plant and associated
infrastructure including an
accommodation village, power
station, gas pipeline and sealed
airstrip. The power station and gas
pipeline are contracted out and the
capital cost is excluded from
construction capital expenditure. The
process plant will be a conventional
gravity and Carbon-In-Leach (CIL)
plant.
The joint venture company will
continue to explore for similar-scale
deposits near Gruyere and has
budgeted A$11m (US$8m) to drill
57,000m for this exploration
programme during 2017.
The required environmental and
regulatory approvals have been
received from the Western Australian
Government.
The Gruyere tenements are subject
to the native title rights of the local
indigenous population. In May 2016,
Gold Road Resources concluded
a native title agreement with the
registered claim group, the Yilka
and Cosmo Newberry Aboriginal
Corporation (CNAC). This agreement
provides access to the area, subject
to the provision of financial,
contracting and employment benefits
to the Yilka and CNAC. This
agreement has been assigned to
Gold Fields. On 29 June 2016, the
Federal Court determined the
registered Yilka native title claim
group and the unregistered Sullivan
and Edwards native title claim group
were entitled to hold native title
together. The final form of the
determination is yet to be settled.
Gruyere LoM Plan
First gold Late 2018/early 2019
LoM 13 years
Annual production (100% basis) 270koz
AISC A$945/oz (US$690/oz)
AIC A$1,103/oz (US$805/oz)
Total capital cost (100% basis) A$507m (US$370m)
IRR at A$1,500/oz gold (including acquisition cost) 6%
Payback period 4.5 years
Gruyere project in Western Australia
Bus
ines
s
optim
isat
ion
The Gold Fields Integrated Annual Report 201671
Business Optimisation – Strategic Focus Areas (continued)
Salares Norte, ChileThe Salares Norte project is 100%
Gold Fields owned and is focused on
a gold-silver deposit in the Atacama
region of northern Chile.
Mineralisation is contained within a
high-sulphidation epithermal system,
offering high-grade oxides. The
project is located within a core
1,800ha concession area. Gold
Fields has the option to purchase
one adjoining concession that would
add a further 1,200ha to the
concession area.
The Group spent US$39m on
pre-feasibility study (PFS) work and
further drilling in 2016, following on
the US$17m spent in 2015. Almost
100km of drilling has been
completed to date. US$64m is
budgeted for further drilling and
studies in 2017 with a decision on
whether the project should progress
to feasibility status expected by
mid-2017.
In December 2016, Gold Fields
updated the project's Mineral
Resources profile, reporting a total
Mineral Resource of 25.6Mt of gold
at a grade of 4.6g/t to give 3.8Moz
– of which 52% is in the Indicated
category – and 43.8Moz of silver at
an average grade of 53g/t. This
Mineral Resource estimate
comprises the Brecha Principal area
(at PFS status) as well as the nearby
Agua Amarga deposit (Scoping
Study status). The study confirmed
that Salares Norte will be an open pit
mine, while metallurgical test work
confirmed that a hybrid Carbon-in-
Leach (CIL) process could deliver
recovery rates of around 92% for
gold.
Importantly, land easement for
30 years and water rights for the
project were both granted in
December 2016.
Salares Norte is also developing
the environmental and social baseline
to support the project schedule as
part of its Environmental Impact
Assessment (EIA). The environmental
work entails baseline research
comprising hydrogeological, flora,
fauna and biodiversity studies,
including research and
recommendations on the protection
of the endangered Short-tailed
Chinchilla in the area. Once the EIA
and baseline studies have been
concluded – expected by Q4 2017
– Salares Norte will present the
findings to the relevant Chilean
regulators.
The social baseline at Salares Norte
has also been expanded. While
there are no indigenous claims or
community presence on the
concession or the dedicated access
routes, Salares Norte has embarked
on an extensive engagement
programme with communities in
the wider vicinity of the project.
Far Southeast, PhilippinesThe Far Southeast project is a
proposed underground mine located
in northern Luzon province – 250km
north of Manila. The 900 million
tonne copper-gold porphyry ore
body has grades of approximately
0.7g/t gold and approximately 0.5%
copper. At the end of December
2012, it declared an Inferred Mineral
Resource of 19.8Moz of gold and
9,921Mlb of copper. This has not
been updated.
The project is held by Far Southeast
Gold Resources (FSGRI) in which
Gold Fields has a 40% interest, with
an option to increase its stake to
60%, and is adjacent to an existing
mining operation with established
infrastructure. Lepanto Consolidated
Mining of the Philippines holds the
remaining 60% interest and manages
the existing mining operation. Gold
Fields impaired its investment in Far
Southeast to US$129m in 2015, as
determined by an evaluation of
Lepanto’s market value on the
Philippine Stock Exchange.
For Gold Fields to obtain a further
20% interest in the project, a
Financial or Technical Assistance
Agreement (FTAA) is required from
the Philippine Government, and is
dependent on obtaining the Free,
Prior and Informed Consent (FPIC)
of the local Kankana-ey indigenous
people. A further condition is the
renewal for a further 25 years of the
existing mining tenement in which
most of the FSE deposit occurs. This
is pending resolution. The application
for a FTAA was denied by the Mines
and Geo-Sciences Bureau (MGB)
in November 2015. FSGRI filed a
motion for reconsideration with
the MGB to reinstate the FTAA
application but this motion remains
pending. The application for
Certification Precondition from the
National Commission on Indigenous
People (NCIP), which will complete
the FPIC process, is also under
consideration by the NCIP.
Amid the legal and administrative
delays, the holding costs of this
project have been reduced to
approximately US$210,000 per
month, related mainly to
environmental monitoring,
community engagement work as well
as activities to support the permitting
process. Further material
development of the project will be
dependent on on the renewal of the
Mineral Production Sharing
Agreement and Gold Fields obtaining
majority ownership of the project.
The Gold Fields Integrated Annual Report 201672
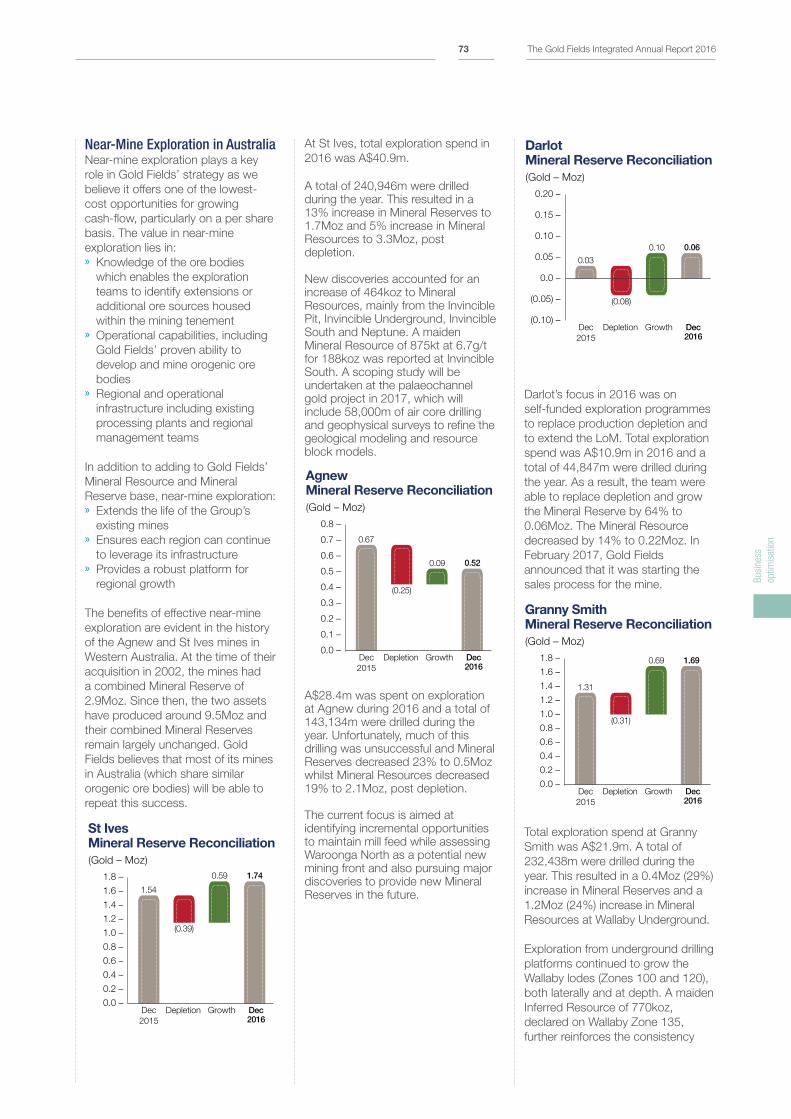
Near-Mine Exploration in AustraliaNear-mine exploration plays a key
role in Gold Fields’ strategy as we
believe it offers one of the lowest-
cost opportunities for growing
cash-flow, particularly on a per share
basis. The value in near-mine
exploration lies in: » Knowledge of the ore bodies
which enables the exploration
teams to identify extensions or
additional ore sources housed
within the mining tenement » Operational capabilities, including
Gold Fields’ proven ability to
develop and mine orogenic ore
bodies » Regional and operational
infrastructure including existing
processing plants and regional
management teams
In addition to adding to Gold Fields’
Mineral Resource and Mineral
Reserve base, near-mine exploration: » Extends the life of the Group’s
existing mines » Ensures each region can continue
to leverage its infrastructure » Provides a robust platform for
regional growth
The benefits of effective near-mine
exploration are evident in the history
of the Agnew and St Ives mines in
Western Australia. At the time of their
acquisition in 2002, the mines had
a combined Mineral Reserve of
2.9Moz. Since then, the two assets
have produced around 9.5Moz and
their combined Mineral Reserves
remain largely unchanged. Gold
Fields believes that most of its mines
in Australia (which share similar
orogenic ore bodies) will be able to
repeat this success.
(Gold – Moz)
Dec
2015
Depletion Growth Dec 2016
1.54
(0.39)
0.59 1.74
St IvesMineral Reserve Reconciliation
1.8 –
1.6 –
1.4 –
1.2 –
1.0 –
0.8 –
0.6 –
0.4 –
0.2 –
0.0 –
At St Ives, total exploration spend in
2016 was A$40.9m.
A total of 240,946m were drilled during the year. This resulted in a 13% increase in Mineral Reserves to 1.7Moz and 5% increase in Mineral Resources to 3.3Moz, post depletion.
New discoveries accounted for an increase of 464koz to Mineral Resources, mainly from the Invincible Pit, Invincible Underground, Invincible South and Neptune. A maiden Mineral Resource of 875kt at 6.7g/t for 188koz was reported at Invincible South. A scoping study will be undertaken at the palaeochannel gold project in 2017, which will include 58,000m of air core drilling and geophysical surveys to refine the geological modeling and resource block models.
(Gold – Moz)
0.8 –
0.7 –
0.6 –
0.5 –
0.4 –
0.3 –
0.2 –
0.1 –
0.0 –Dec
2015
Depletion Growth Dec 2016
77
0.67
(0.25)
0.09 0.52
AgnewMineral Reserve Reconciliation
A$28.4m was spent on exploration at Agnew during 2016 and a total of 143,134m were drilled during the year. Unfortunately, much of this drilling was unsuccessful and Mineral Reserves decreased 23% to 0.5Moz whilst Mineral Resources decreased 19% to 2.1Moz, post depletion.
The current focus is aimed at identifying incremental opportunities to maintain mill feed while assessing Waroonga North as a potential new mining front and also pursuing major discoveries to provide new Mineral Reserves in the future.
(Gold – Moz)
0.20 –
0.15 –
0.10 –
0.05 –
0.0 –
(0.05) –
(0.10) –Dec
2015
Depletion Growth Dec 2016
77
0.03
(0.08)
0.10 0.06
DarlotMineral Reserve Reconciliation
Darlot’s focus in 2016 was on
self-funded exploration programmes
to replace production depletion and
to extend the LoM. Total exploration
spend was A$10.9m in 2016 and a
total of 44,847m were drilled during
the year. As a result, the team were
able to replace depletion and grow
the Mineral Reserve by 64% to
0.06Moz. The Mineral Resource
decreased by 14% to 0.22Moz. In
February 2017, Gold Fields
announced that it was starting the
sales process for the mine.
Granny SmithMineral Reserve Reconciliation
(Gold – Moz)
1.8 –
1.6 –
1.4 –
1.2 –
1.0 –
0.8 –
0.6 –
0.4 –
0.2 –
0.0 –Dec
2015
Depletion Growth Dec 2016
1.31
(0.31)
0.69 1.69
Total exploration spend at Granny
Smith was A$21.9m. A total of
232,438m were drilled during the
year. This resulted in a 0.4Moz (29%)
increase in Mineral Reserves and a
1.2Moz (24%) increase in Mineral
Resources at Wallaby Underground.
Exploration from underground drilling
platforms continued to grow the
Wallaby lodes (Zones 100 and 120),
both laterally and at depth. A maiden
Inferred Resource of 770koz,
declared on Wallaby Zone 135,
further reinforces the consistency
Bus
ines
s
optim
isat
ion
The Gold Fields Integrated Annual Report 201673
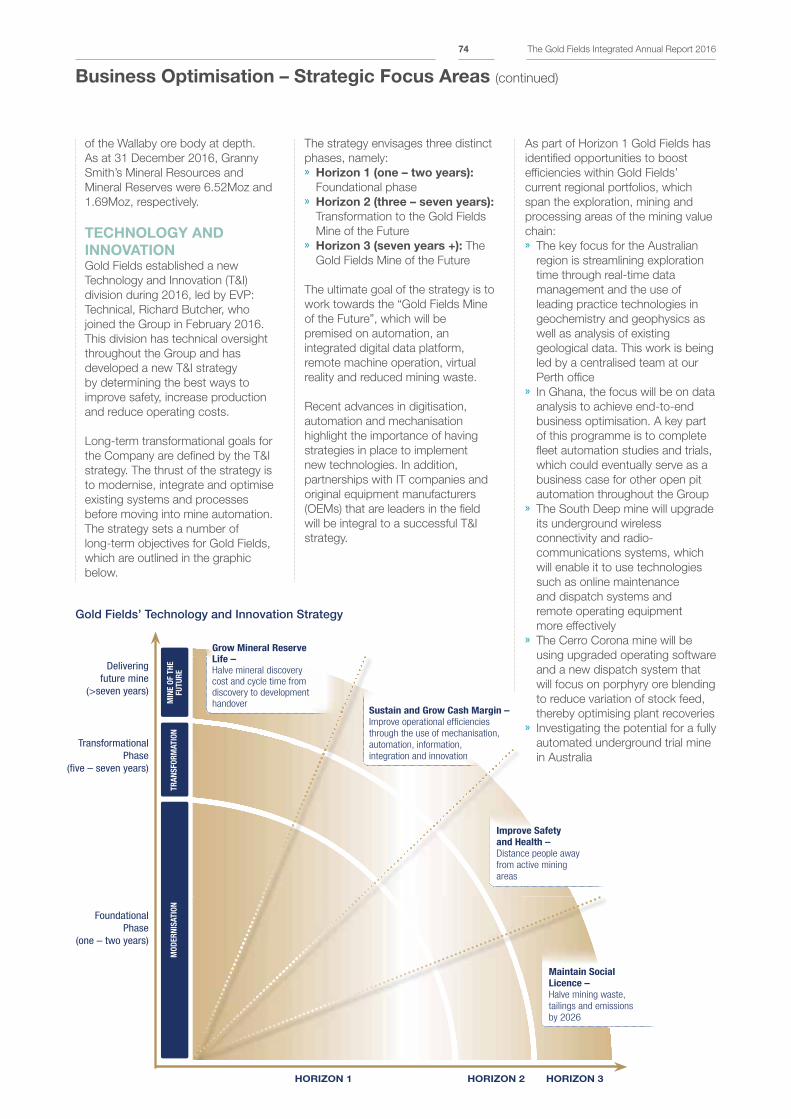
of the Wallaby ore body at depth.
As at 31 December 2016, Granny
Smith’s Mineral Resources and
Mineral Reserves were 6.52Moz and
1.69Moz, respectively.
TECHNOLOGY AND
INNOVATIONGold Fields established a new
Technology and Innovation (T&I)
division during 2016, led by EVP:
Technical, Richard Butcher, who
joined the Group in February 2016.
This division has technical oversight
throughout the Group and has
developed a new T&I strategy
by determining the best ways to
improve safety, increase production
and reduce operating costs.
Long-term transformational goals for
the Company are defined by the T&I
strategy. The thrust of the strategy is
to modernise, integrate and optimise
existing systems and processes
before moving into mine automation.
The strategy sets a number of
long-term objectives for Gold Fields,
which are outlined in the graphic
below.
The strategy envisages three distinct
phases, namely: » Horizon 1 (one – two years):
Foundational phase » Horizon 2 (three – seven years):
Transformation to the Gold Fields
Mine of the Future » Horizon 3 (seven years +): The
Gold Fields Mine of the Future
The ultimate goal of the strategy is to
work towards the “Gold Fields Mine
of the Future”, which will be
premised on automation, an
integrated digital data platform,
remote machine operation, virtual
reality and reduced mining waste.
Recent advances in digitisation,
automation and mechanisation
highlight the importance of having
strategies in place to implement
new technologies. In addition,
partnerships with IT companies and
original equipment manufacturers
(OEMs) that are leaders in the field
will be integral to a successful T&I
strategy.
Business Optimisation – Strategic Focus Areas (continued)
As part of Horizon 1 Gold Fields has
identified opportunities to boost
efficiencies within Gold Fields’
current regional portfolios, which
span the exploration, mining and
processing areas of the mining value
chain: » The key focus for the Australian
region is streamlining exploration
time through real-time data
management and the use of
leading practice technologies in
geochemistry and geophysics as
well as analysis of existing
geological data. This work is being
led by a centralised team at our
Perth office » In Ghana, the focus will be on data
analysis to achieve end-to-end
business optimisation. A key part
of this programme is to complete
fleet automation studies and trials,
which could eventually serve as a
business case for other open pit
automation throughout the Group » The South Deep mine will upgrade
its underground wireless
connectivity and radio-
communications systems, which
will enable it to use technologies
such as online maintenance
and dispatch systems and
remote operating equipment
more effectively » The Cerro Corona mine will be
using upgraded operating software
and a new dispatch system that
will focus on porphyry ore blending
to reduce variation of stock feed,
thereby optimising plant recoveries » Investigating the potential for a fully
automated underground trial mine
in Australia
Delivering future mine
(>seven years)
TransformationalPhase
(five – seven years)
FoundationalPhase
(one – two years)
HORIZON 1 HORIZON 2 HORIZON 3
MIN
E O
F T
HE
FU
TU
RE
TR
AN
SFO
RM
ATIO
NM
OD
ER
NIS
ATIO
N
Grow Mineral Reserve
Life – Halve mineral discovery
cost and cycle time from
discovery to development
handoverSustain and Grow Cash Margin – Improve operational efficiencies
through the use of mechanisation,
automation, information,
integration and innovation
Improve Safety
and Health – Distance people away
from active mining
areas
Maintain Social
Licence – Halve mining waste,
tailings and emissions
by 2026
Gold Fields’ Technology and Innovation Strategy
The Gold Fields Integrated Annual Report 201674
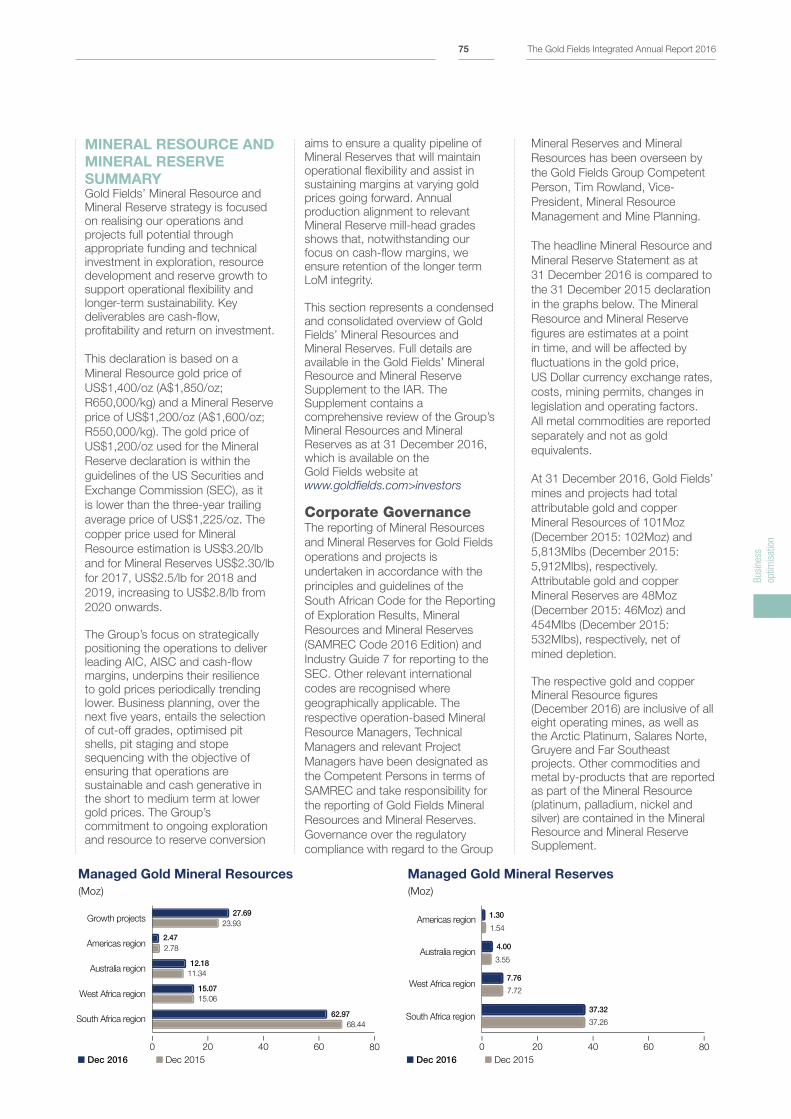
MINERAL RESOURCE AND
MINERAL RESERVE
SUMMARYGold Fields’ Mineral Resource and
Mineral Reserve strategy is focused
on realising our operations and
projects full potential through
appropriate funding and technical
investment in exploration, resource
development and reserve growth to
support operational flexibility and
longer-term sustainability. Key
deliverables are cash-flow,
profitability and return on investment.
This declaration is based on a
Mineral Resource gold price of
US$1,400/oz (A$1,850/oz;
R650,000/kg) and a Mineral Reserve
price of US$1,200/oz (A$1,600/oz;
R550,000/kg). The gold price of
US$1,200/oz used for the Mineral
Reserve declaration is within the
guidelines of the US Securities and
Exchange Commission (SEC), as it
is lower than the three-year trailing
average price of US$1,225/oz. The
copper price used for Mineral
Resource estimation is US$3.20/lb
and for Mineral Reserves US$2.30/lb
for 2017, US$2.5/lb for 2018 and
2019, increasing to US$2.8/lb from
2020 onwards.
The Group’s focus on strategically
positioning the operations to deliver
leading AIC, AISC and cash-flow
margins, underpins their resilience
to gold prices periodically trending
lower. Business planning, over the
next five years, entails the selection
of cut-off grades, optimised pit
shells, pit staging and stope
sequencing with the objective of
ensuring that operations are
sustainable and cash generative in
the short to medium term at lower
gold prices. The Group’s
commitment to ongoing exploration
and resource to reserve conversion
aims to ensure a quality pipeline of
Mineral Reserves that will maintain
operational flexibility and assist in
sustaining margins at varying gold
prices going forward. Annual
production alignment to relevant
Mineral Reserve mill-head grades
shows that, notwithstanding our
focus on cash-flow margins, we
ensure retention of the longer term
LoM integrity.
This section represents a condensed
and consolidated overview of Gold
Fields’ Mineral Resources and
Mineral Reserves. Full details are
available in the Gold Fields’ Mineral
Resource and Mineral Reserve
Supplement to the IAR. The
Supplement contains a
comprehensive review of the Group’s
Mineral Resources and Mineral
Reserves as at 31 December 2016,
which is available on the
Gold Fields website at
www.goldfields.com>investors
Corporate GovernanceThe reporting of Mineral Resources
and Mineral Reserves for Gold Fields
operations and projects is
undertaken in accordance with the
principles and guidelines of the
South African Code for the Reporting
of Exploration Results, Mineral
Resources and Mineral Reserves
(SAMREC Code 2016 Edition) and
Industry Guide 7 for reporting to the
SEC. Other relevant international
codes are recognised where
geographically applicable. The
respective operation-based Mineral
Resource Managers, Technical
Managers and relevant Project
Managers have been designated as
the Competent Persons in terms of
SAMREC and take responsibility for
the reporting of Gold Fields Mineral
Resources and Mineral Reserves.
Governance over the regulatory
compliance with regard to the Group
Mineral Reserves and Mineral
Resources has been overseen by
the Gold Fields Group Competent
Person, Tim Rowland, Vice-
President, Mineral Resource
Management and Mine Planning.
The headline Mineral Resource and
Mineral Reserve Statement as at
31 December 2016 is compared to
the 31 December 2015 declaration
in the graphs below. The Mineral
Resource and Mineral Reserve
figures are estimates at a point
in time, and will be affected by
fluctuations in the gold price,
US Dollar currency exchange rates,
costs, mining permits, changes in
legislation and operating factors.
All metal commodities are reported
separately and not as gold
equivalents.
At 31 December 2016, Gold Fields’
mines and projects had total
attributable gold and copper
Mineral Resources of 101Moz
(December 2015: 102Moz) and
5,813Mlbs (December 2015:
5,912Mlbs), respectively.
Attributable gold and copper
Mineral Reserves are 48Moz
(December 2015: 46Moz) and
454Mlbs (December 2015:
532Mlbs), respectively, net of
mined depletion.
The respective gold and copper
Mineral Resource figures
(December 2016) are inclusive of all
eight operating mines, as well as
the Arctic Platinum, Salares Norte,
Gruyere and Far Southeast
projects. Other commodities and
metal by-products that are reported
as part of the Mineral Resource
(platinum, palladium, nickel and
silver) are contained in the Mineral
Resource and Mineral Reserve
Supplement.
23.93
27.69
2.78
2.47
11.34
12.18
15.06
15.07
68.44
62.97
Managed Gold Mineral Resources
(Moz)
Growth projects
Americas region
Australia region
West Africa region
South Africa region
0 20 40 60 80
–––––
Dec 2015 Dec 2016
1.54
1.30
3.55
4.00
7.72
7.76
37.26
37.32
Managed Gold Mineral Reserves
(Moz)
Americas region
Australia region
West Africa region
South Africa region
0 20 40 60 80
Dec 2015 Dec 2016
–––––
Bus
ines
s
optim
isat
ion
The Gold Fields Integrated Annual Report 201675
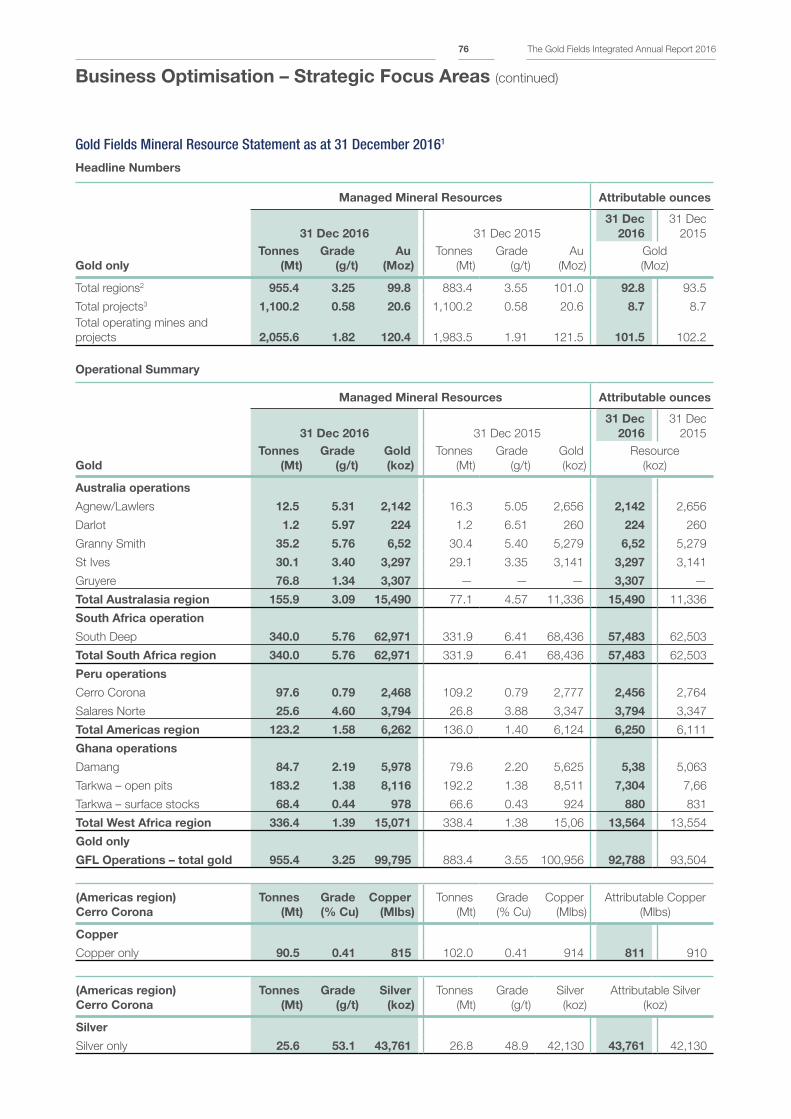
Gold Fields Mineral Resource Statement as at 31 December 20161
Headline Numbers
Managed Mineral Resources Attributable ounces
31 Dec 2016 31 Dec 2015
31 Dec
2016
31 Dec
2015
Gold only
Tonnes
(Mt)
Grade
(g/t)
Au
(Moz)
Tonnes
(Mt)
Grade
(g/t)
Au
(Moz)
Gold
(Moz)
Total regions2 955.4 3.25 99.8 883.4 3.55 101.0 92.8 93.5
Total projects3 1,100.2 0.58 20.6 1,100.2 0.58 20.6 8.7 8.7
Total operating mines and
projects 2,055.6 1.82 120.4 1,983.5 1.91 121.5 101.5 102.2
Operational Summary
Managed Mineral Resources Attributable ounces
31 Dec 2016 31 Dec 2015
31 Dec
2016
31 Dec
2015
Gold
Tonnes
(Mt)
Grade
(g/t)
Gold
(koz)
Tonnes
(Mt)
Grade
(g/t)
Gold
(koz)
Resource
(koz)
Australia operations
Agnew/Lawlers 12.5 5.31 2,142 16.3 5.05 2,656 2,142 2,656
Darlot 1.2 5.97 224 1.2 6.51 260 224 260
Granny Smith 35.2 5.76 6,52 30.4 5.40 5,279 6,52 5,279
St Ives 30.1 3.40 3,297 29.1 3.35 3,141 3,297 3,141
Gruyere 76.8 1.34 3,307 — — — 3,307 —
Total Australasia region 155.9 3.09 15,490 77.1 4.57 11,336 15,490 11,336
South Africa operation
South Deep 340.0 5.76 62,971 331.9 6.41 68,436 57,483 62,503
Total South Africa region 340.0 5.76 62,971 331.9 6.41 68,436 57,483 62,503
Peru operations
Cerro Corona 97.6 0.79 2,468 109.2 0.79 2,777 2,456 2,764
Salares Norte 25.6 4.60 3,794 26.8 3.88 3,347 3,794 3,347
Total Americas region 123.2 1.58 6,262 136.0 1.40 6,124 6,250 6,111
Ghana operations
Damang 84.7 2.19 5,978 79.6 2.20 5,625 5,38 5,063
Tarkwa – open pits 183.2 1.38 8,116 192.2 1.38 8,511 7,304 7,66
Tarkwa – surface stocks 68.4 0.44 978 66.6 0.43 924 880 831
Total West Africa region 336.4 1.39 15,071 338.4 1.38 15,06 13,564 13,554
Gold only
GFL Operations – total gold 955.4 3.25 99,795 883.4 3.55 100,956 92,788 93,504
(Americas region)
Cerro Corona
Tonnes
(Mt)
Grade
(% Cu)
Copper
(Mlbs)
Tonnes
(Mt)
Grade
(% Cu)
Copper
(Mlbs)
Attributable Copper
(Mlbs)
Copper
Copper only 90.5 0.41 815 102.0 0.41 914 811 910
(Americas region)
Cerro Corona
Tonnes
(Mt)
Grade
(g/t)
Silver
(koz)
Tonnes
(Mt)
Grade
(g/t)
Silver
(koz)
Attributable Silver
(koz)
Silver
Silver only 25.6 53.1 43,761 26.8 48.9 42,130 43,761 42,130
Business Optimisation – Strategic Focus Areas (continued)
The Gold Fields Integrated Annual Report 201676
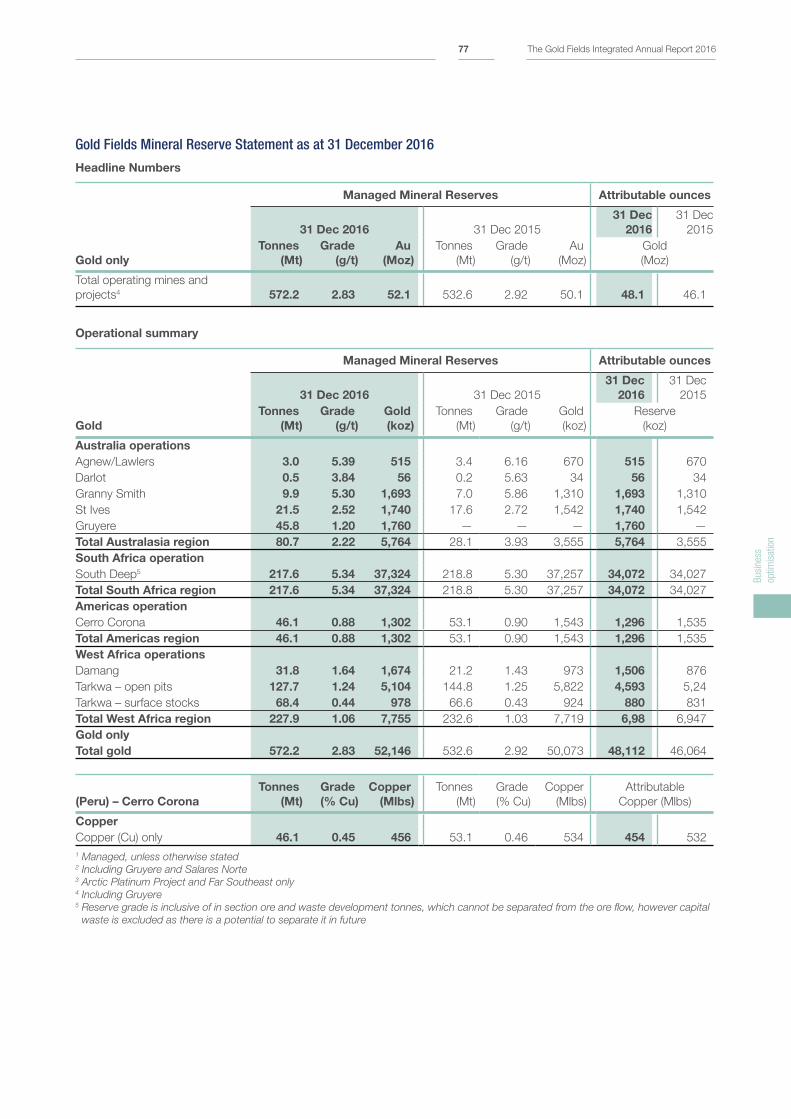
Gold Fields Mineral Reserve Statement as at 31 December 2016
Headline Numbers
Managed Mineral Reserves Attributable ounces
31 Dec 2016 31 Dec 2015
31 Dec
2016
31 Dec
2015
Gold only
Tonnes
(Mt)
Grade
(g/t)
Au
(Moz)
Tonnes
(Mt)
Grade
(g/t)
Au
(Moz)
Gold
(Moz)
Total operating mines and
projects4 572.2 2.83 52.1 532.6 2.92 50.1 48.1 46.1
Operational summary
Managed Mineral Reserves Attributable ounces
31 Dec 2016 31 Dec 2015
31 Dec
2016
31 Dec
2015
Gold
Tonnes
(Mt)
Grade
(g/t)
Gold
(koz)
Tonnes
(Mt)
Grade
(g/t)
Gold
(koz)
Reserve
(koz)
Australia operations
Agnew/Lawlers 3.0 5.39 515 3.4 6.16 670 515 670
Darlot 0.5 3.84 56 0.2 5.63 34 56 34
Granny Smith 9.9 5.30 1,693 7.0 5.86 1,310 1,693 1,310
St Ives 21.5 2.52 1,740 17.6 2.72 1,542 1,740 1,542
Gruyere 45.8 1.20 1,760 — — — 1,760 —
Total Australasia region 80.7 2.22 5,764 28.1 3.93 3,555 5,764 3,555
South Africa operation
South Deep5 217.6 5.34 37,324 218.8 5.30 37,257 34,072 34,027
Total South Africa region 217.6 5.34 37,324 218.8 5.30 37,257 34,072 34,027
Americas operation
Cerro Corona 46.1 0.88 1,302 53.1 0.90 1,543 1,296 1,535
Total Americas region 46.1 0.88 1,302 53.1 0.90 1,543 1,296 1,535
West Africa operations
Damang 31.8 1.64 1,674 21.2 1.43 973 1,506 876
Tarkwa – open pits 127.7 1.24 5,104 144.8 1.25 5,822 4,593 5,24
Tarkwa – surface stocks 68.4 0.44 978 66.6 0.43 924 880 831
Total West Africa region 227.9 1.06 7,755 232.6 1.03 7,719 6,98 6,947
Gold only
Total gold 572.2 2.83 52,146 532.6 2.92 50,073 48,112 46,064
(Peru) – Cerro Corona
Tonnes
(Mt)
Grade
(% Cu)
Copper
(Mlbs)
Tonnes
(Mt)
Grade
(% Cu)
Copper
(Mlbs)
Attributable
Copper (Mlbs)
Copper
Copper (Cu) only 46.1 0.45 456 53.1 0.46 534 454 532
1 Managed, unless otherwise stated2 Including Gruyere and Salares Norte3 Arctic Platinum Project and Far Southeast only4 Including Gruyere5 Reserve grade is inclusive of in section ore and waste development tonnes, which cannot be separated from the ore flow, however capital
waste is excluded as there is a potential to separate it in future
Bus
ines
s
optim
isat
ion
The Gold Fields Integrated Annual Report 201677
ENERGY AND CLIMATE
CHANGEMining and processing of gold is an
energy intensive process,
exacerbated by changing ore
geology, declining grades, longer
hauling distances and increasing
mine depths. The management of
energy use and adapting to the
adverse impacts of climate change
are material for virtually every country
and company across the world. As
such, sustainable energy use and
climate change mitigation and
adaptation have been identified as
one of Gold Fields’ top five
sustainability priorities until 2020.
The infographic on p82 – 83 of this
section explains Gold Fields’
integrated energy and carbon
management journey, with a
particular focus on the low-carbon,
energy efficiency and renewable
energy initiatives implemented in
2016.
With energy spend accounting for a
significant portion of Gold Fields’
operating costs (2016: 19%, 2015:
22%, 2014: 21%), energy efficiency
and cost savings initiatives are critical
components of Group-wide cost
saving initiatives.
Integrated Energy and Carbon Management Through its Integrated Energy and
Carbon Management Strategy, Gold
Fields integrates energy and carbon
management into all aspects of its
business to ensure energy security,
improved management of energy
costs, improved energy efficiencies
and sustainable reduction of its
carbon footprint. Full details of our
Group and operational energy
consumption and carbon emissions
data is contained on our website at
www.goldfields.com>sustainability
Some of the salient features of the
Group’s 2016 energy and carbon
performance were: » Group energy spend declined from
US$312m (US$139/oz) in 2015 to
US$289m (US$130/oz) in 2016 » Total energy consumption
increased by 4% to 11,696,446GJ
from 11,240,369GJ in 2015. Of
total energy consumption during
2016, 57% comprised diesel
(6,607,770GJ) and 43% electricity
(5,041,518GJ) similar to the split
in 2015 » Group electricity consumption was
1,400,422MWh, a 6% increase on
2015. This reflected higher gold
production (up by 47%) at South
Deep, increased tonnes mined
throughout the Group, the addition
of ventilation shafts at our
Australian operations and
increased dewatering due to heavy
rains at the Australian and
Ghanaian mines » Diesel consumption reduced by
4.7% from 192,518kℓ in 2015
to 183,498kℓ due to the
commissioning of the gas plant at
Granny Smith, reduced usage of
diesel power generators at
Damang, optimised mining
operations and fuel management
initiatives implemented at our
mines. Diesel consumption
increased at the Tarkwa and
St Ives mines » Diesel spending reduced by 13%
to US$129m (2015: US$149m)
amid a stagnant oil price and
reduced diesel usage at the
operations; with a 1.2% modest
decline in our electricity spend
to US$160m (2015: US$162m) » Commissioning of gas-powered
power generation technologies
at Granny Smith, Tarkwa and
Damang (p79 – 80) as part of
our ongoing switch to low-carbon,
alternate and renewable energy
sources » Continued commitment to using
20% renewable energy on all new
projects over the LoM of these
projects. Salares Norte in Chile is
currently undergoing an evaluation » Total carbon emissions increased
by 12% to 1,963,758t CO2-eq
from 1,753,163t CO2-eq emissions
in 2015. Our scope 1 emissions
rose due to higher diesel
consumption, while our scope 2
increased due to country-specific
emissions factors
In 2016, low global oil prices and a
stagnant gold price made some of
our fuel-switching energy initiatives
not economically viable. Despite the
difficult economic and tough physical
conditions of gold mining, Gold
Fields still managed to achieve some
energy savings and carbon
emissions reductions in 2016.
These included: » Energy savings of 323TJ – 3% of
our 2016 energy budget » Financial savings of US$11m from
energy initiatives – our target was
US$21m » Avoidance of carbon emissions
totalling 56,005t CO2-eq as a
result of the energy and carbon
reduction initiatives
Group energy budgets, energy
savings and carbon reduction target
estimates are determined at the
beginning of each year, against the
annual production plan. Thus,
changes in the production will
directly affect ability to reach the
target estimates.
Most critically though is that our
average energy spend per ounce
of gold produced declined by 6.3%
to US$130/oz in 2016 (2015:
US$139/oz, 2014: US$158/oz).
Energy efficiency initiatives reduced
energy spend by an equivalent
US$5/oz. This is despite the fact that
the actual energy usage per ounce of
gold produced increased by 5.0% to
5.27GJ/oz in 2016. Reflecting slightly
lower grades throughout our
operations, the tonnage mined by
Gold Fields during 2016 was up by
12%, however, mining energy
intensity improved to 0.06GJ/t mined
(2015: 0.07GJ/t).
Energy optimisation savings
initiatives take time to make an
impact – we calculate that the effect
of various energy efficiency and
business optimisation initiatives
introduced across Gold Fields over
the past five years have resulted
in cumulative energy savings of
1,098TJ between 2012 and 2016.
This has led to US$41m in
cumulative cost savings and
avoidance of 165,005t CO2-eq in
emissions.
Business Optimisation – Strategic Focus Areas (continued)
The Gold Fields Integrated Annual Report 201678

In 2016, Gold Fields updated its
Group Energy and Carbon
Management Guideline to align with
ISO 50001, the global energy
management standard. The guideline
entrenches a systematic approach
to our energy management as a
business optimisation continual
improvement programme and shifts
our focus from individual energy
efficiency initiatives.
Regional Energy and Carbon Emission PerformanceIn 2015, Gold Fields developed and
started implementation of regional
five-year energy security plans,
taking into account localised energy
supply risks and opportunities, with
a specific focus on West Africa and
South African operations. From 2017
short-term operational targets for
energy use, cost and carbon
emissions will be set against annual
energy and production plans. They
will be set in absolute GJ, energy
costs (US$) and absolute carbon
emission (tonnes CO2-eq) avoided,
based on planned and feasible
initiatives. Initiatives will still be
recognised for three years from date
of implementation. Through this
process, we are able to develop
Group medium-term (2020) energy
and carbon reduction targets.
All regions have seen a decline in
energy spending per ounce as seen
in the graph below, owing to a
number of external and internal
drivers, such exchange rates, varying
levels of increases in regional
electricity and diesel unit prices,
energy efficiency initiatives. Some
of the successful energy spend
curtailment initiatives are outlined
below.
Regional energy costs
($/oz)
250 –
200 –
150 –
100 –
50 –
0 –Australia South
America
South
Africa
West
Africa
127
165
238 216214
157
1099889
697177
2014 2015 2016
AmericasPeru electricity market has
experienced an oversupply situation
due to planned large mining projects
that have not yet been implemented
and the regulated electricity charges
continue to increase. Thus, at Cerro
Corona we renegotiated electricity
tariffs with an independent power
provider for a power purchase
agreement (PPA) extending to 2027.
Efficiency initiatives saved the mine
29,430GJ, equivalent to US$0.55m
in 2016 (2015: US$3m) and avoided
2,363t CO2-eq in carbon emissions.
A trial application of a diesel additive
product over a 25-day period saw
fuel savings of 4.8% from selected
haulage trucks. Moreover, observed
carbon monoxide and nitrogen
monoxide emission reductions
were as high as 22% and 23%,
respectively. Based on this trial’s
success, we expect to save
US$280,000 per year in fuel when
applied over Cerro Corona’s hauling
fleet. The roll out for this initiative is
planned for 2017.
A pre-feasibility study under way at
Chile’s Salares Norte mine includes
the development of a plan exploring
renewable energy supply options,
over the LoM.
AustraliaDue to their remote locations, Gold
Fields’ Australian operations have
limited, but stable, power supply. As
such, the focus for 2016 has been
to implement a fuel switch strategy,
while reassessing energy security
and monitoring energy efficiency
initiatives.
In 2016 we commissioned a 24MW
gas-powered plant at the Granny
Smith mine, our portion of the total
costs was A$4.5m (US$3.3m).
Savings of around A$5.4m
(US$3.3m) a year at current oil prices
are expected. All operations in
Australia are now powered by gas
instead of diesel.
After registering the Granny Smith
gas plant with the Australian
Emissions Reduction Fund (ERF),
we have been able to successfully
auction carbon emission credits to
the Australian Government as the
plant switches from a heavy carbon
(diesel) to a low carbon (gas) power
source. The ERF is expected to
abate 85,000t CO2-eq emissions
potentially over seven years.
Following annual energy security risk
assessments, we have developed a
load management action plan for
Agnew mine, which faces heavy
penalties should its contracted
maximum demand of electricity be
exceeded for a sustained period of
time. Mitigating actions – such as
running the cooling plant on diesel
power – are currently being
implemented, while a long-term
energy security solution is explored.
South AfricaIn response to the rolling load
shedding that South Africa
experienced in 2015 and
uncertainties regarding electricity
price increases, South Deep’s
five-year energy security plan
incorporates a range of energy
efficiency improvements and
alternative energy sources.
An essential component of the plan
is the use of solar power at the mine.
An independent power producer
was appointed in October 2016
to develop, build, own and operate
a 40MW photovoltaic (PV) plant
located at South Deep. The facility
will be made up of approximately
150,000 solar panels. The plant is
expected to generate 100GWh/year,
equivalent to 20% of the mine’s
annual 500GWh electricity
consumption, and avoiding carbon
emissions estimated at 100,000t
CO2-eq per annum. We expect the
initial PPA price to be on par with
state utility Eskom tariffs, and set to
fall below Eskom tariffs in due time.
The expected commercial operation
date of the project is Q4 2018.
Other initiatives completed at South
Deep mine in 2016 include: » Continuing to retrofit 75kW fans
with 10 energy efficient 55kW fans,
resulting in an annual saving of
2,190MWh (equivalent to
US$100,000 in cost savings) and
avoiding 2,256t CO2-eq carbon
emissions
Bus
ines
s
optim
isat
ion
The Gold Fields Integrated Annual Report 201679
Business Optimisation – Strategic Focus Areas (continued)
» Installing 22 new jet fans in the
destress mining area, which will
see an annual saving of 500MWh
(equivalent to US$30,000) and
avoiding 513t CO2-eq carbon
emissions.
Roof top solar panels installed at
Gold Fields Johannesburg‘s
corporate office in December 2015
led to significant savings in grid
electricity usage and costs during
2016. The 128kWp (peak output),
823m2 polycrystalline solar PV array
on the roof of the corporate office
provides for approximately 50% of
the building’s electrical load and
contributes to reduction of our
carbon footprint. (See p83.)
West AfricaDuring 2016, the electricity
consumption curtailment was eased
from 30% in 2015 to 25%. Supply
disruptions from the state-owned
Volta River Authority (VRA), due to
gas shortages and low dam levels,
remained an operational constraint.
Energy prices also rose due to
infrastructure levy increases. With
electricity demand in Ghana
expected to surpass generation
capacity until 2020, Tarkwa and
Damang initiated a number of
actions during 2016 as part of their
five-year energy security plans.
The most significant of these was the
construction of two Genser Power-
owned gas turbine power plants to
supply a total of 40MW of electricity
to both mines under a purchasing
power agreement. The total capacity
of the Tarkwa plant (three 11MW
units) and the Damang plant (five
5.5MW units) are beyond our current
power requirements and will ensure
a reliable supply to both operations.
They were commissioned in
December 2016 and will result in
significant electricity cost savings:
Tarkwa’s electricity supply costs are
expected to drop by about 14%, and
Damang’s costs by about 30%.
The key features of the Genser
agreement are: » It is a 20-year PPA for an initial
40MW of which 20MW is provided
from dual-fuel turbines at both
Tarkwa and Damang; an additional
20MW is planned for installation
at Tarkwa by January 2018 » The power plants will have
sufficient on-site gas storage
capacity to meet each mine’s total
load (36MW at Tarkwa and 17MW
at Damang) thereby mitigating any
gas supply disruptions » By January 2018, Genser should
be in a position to provide 100% of
the power supply needs at these
operations and surplus power
produced by Genser could be
wheeled to other consumers
Tarkwa introduced a number of other
energy efficiency initiatives during
2016: » Implementation of a dedicated
eco-driver training system at
Tarkwa, which is compulsory for
both new and current vehicle
operators. Trials during 2016
indicate that once the system is
rolled out energy savings of
72,469GJ can be achieved leading
to annual cost savings of around
US$2m » A new study on a fuel additive at
Tarkwa indicates a possible
4,881kℓ fuel saving per annum,
equating to an anticipated
13,023t CO2-eq reduction. The
estimated annual monetary saving
from the initiative is US$2.4m.
A test trial is being developed » Several process optimisation
initiatives such as reducing
tramming time and excavators
diesel use were also implemented
An energy efficiency study of the
Accra regional office showed
potential energy savings of 18,922GJ
(translating to a monetary saving
estimate of US$1.3m) through
installations of LED illumination, solar
geysers and energy efficient air
conditioners. The feasibility of rooftop
solar power to minimise grid power
dependency is also being assessed.
Climate Change and Carbon EmissionsCarbon emission reduction and
climate change mitigation and
adaptation represent a material issue
for Gold Fields due to: » The long-term risks posed by
climate change to the Group’s
operations, host communities
and to society as a whole
» A commitment to conforming to
carbon emission regulations being
introduced in a range of
jurisdictions » Rising costs associated with taxes
attached by governments to
non-renewable energy
consumption
Gold Fields’ total scope 1 – 3
CO2-eq emissions during 2016
amounted to 1,963,759t (2015:
1,753,163t), leading to a
commensurate increase in our
emissions intensity from 0.59t
CO2-eq/oz in 2015 to 0.69t CO
2-eq/
oz in 2016. Emission intensity varies
by region, ranging from 0.31t
CO2-eq/oz in Peru, which relies
mainly on gas and hydro generated
electricity, to 1.92t CO2-eq/oz in
South Africa, which relies almost
exclusively on coal generated
electricity.
Gold Fields Climate Change PolicyFollowing the climate change risk
assessments carried out in 2016, a
Group Climate Change Policy was
published, replacing the Group
Carbon Management Policy that
has been in place since 2013 and
focused mainly on addressing these
effects through energy management.
Thus, the policy advances and
communicates a balanced mitigation
and adaptation approach to
achieving our climate change
objectives. The policy contains
a set of commitments that include: » Conducting climate change
vulnerability assessments utilising
Group risk guidelines and
International Council of Mining and
Metals (ICMM) tools and guidelines » Annually reporting and disclosure
via a number of reporting
frameworks including the CDP and
the Dow Jones Sustainability Index » Mitigating the effects of climate
change by increasingly investing in
renewable energy and low-carbon
energy sources, energy efficiency
initiatives and water use
optimisation initiatives » Supporting research, development
and innovation to assist our
operations in coping with climate
change » Factoring in a regional carbon
price for both costing and as
potential revenue streams
The Gold Fields Integrated Annual Report 201680
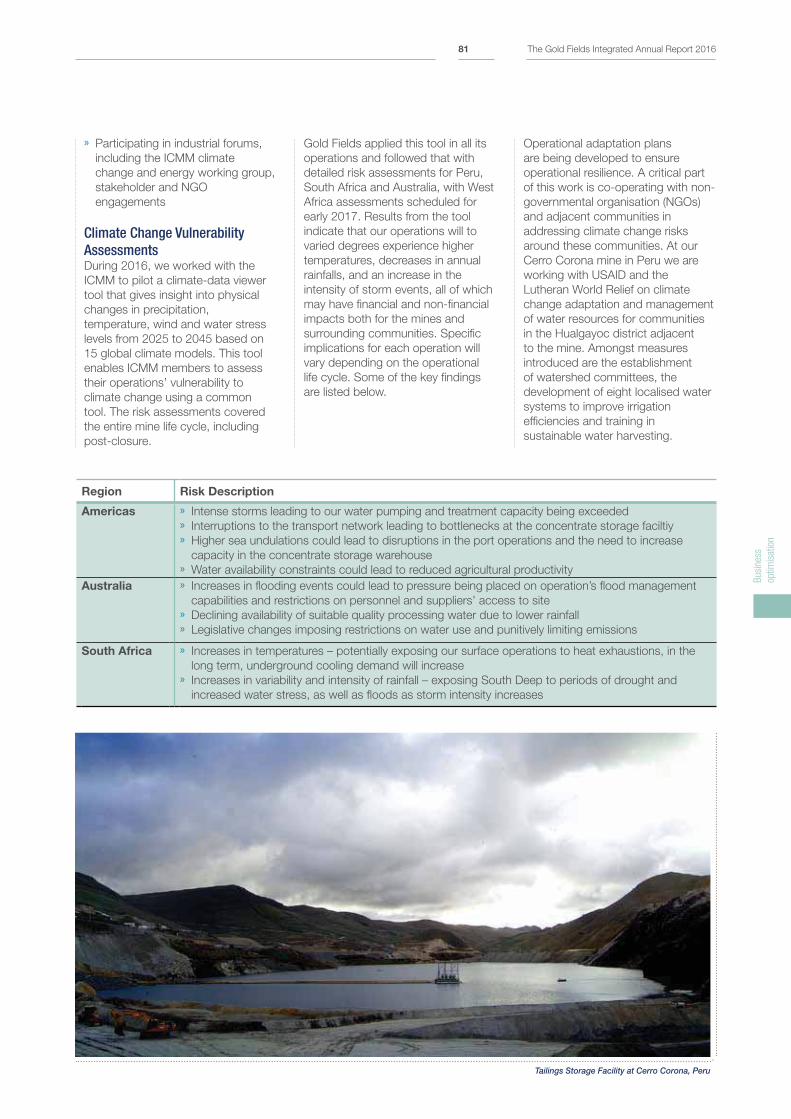
Operational adaptation plans
are being developed to ensure
operational resilience. A critical part
of this work is co-operating with non-
governmental organisation (NGOs)
and adjacent communities in
addressing climate change risks
around these communities. At our
Cerro Corona mine in Peru we are
working with USAID and the
Lutheran World Relief on climate
change adaptation and management
of water resources for communities
in the Hualgayoc district adjacent
to the mine. Amongst measures
introduced are the establishment
of watershed committees, the
development of eight localised water
systems to improve irrigation
efficiencies and training in
sustainable water harvesting.
» Participating in industrial forums,
including the ICMM climate
change and energy working group,
stakeholder and NGO
engagements
Climate Change Vulnerability AssessmentsDuring 2016, we worked with the
ICMM to pilot a climate-data viewer
tool that gives insight into physical
changes in precipitation,
temperature, wind and water stress
levels from 2025 to 2045 based on
15 global climate models. This tool
enables ICMM members to assess
their operations’ vulnerability to
climate change using a common
tool. The risk assessments covered
the entire mine life cycle, including
post-closure.
Gold Fields applied this tool in all its
operations and followed that with
detailed risk assessments for Peru,
South Africa and Australia, with West
Africa assessments scheduled for
early 2017. Results from the tool
indicate that our operations will to
varied degrees experience higher
temperatures, decreases in annual
rainfalls, and an increase in the
intensity of storm events, all of which
may have financial and non-financial
impacts both for the mines and
surrounding communities. Specific
implications for each operation will
vary depending on the operational
life cycle. Some of the key findings
are listed below.
Region Risk Description
Americas » Intense storms leading to our water pumping and treatment capacity being exceeded » Interruptions to the transport network leading to bottlenecks at the concentrate storage faciltiy » Higher sea undulations could lead to disruptions in the port operations and the need to increase
capacity in the concentrate storage warehouse » Water availability constraints could lead to reduced agricultural productivity
Australia » Increases in flooding events could lead to pressure being placed on operation’s flood management
capabilities and restrictions on personnel and suppliers’ access to site » Declining availability of suitable quality processing water due to lower rainfall » Legislative changes imposing restrictions on water use and punitively limiting emissions
South Africa » Increases in temperatures – potentially exposing our surface operations to heat exhaustions, in the
long term, underground cooling demand will increase » Increases in variability and intensity of rainfall – exposing South Deep to periods of drought and
increased water stress, as well as floods as storm intensity increases
Tailings Storage Facility at Cerro Corona, Peru
Bus
ines
s
optim
isat
ion
The Gold Fields Integrated Annual Report 201681
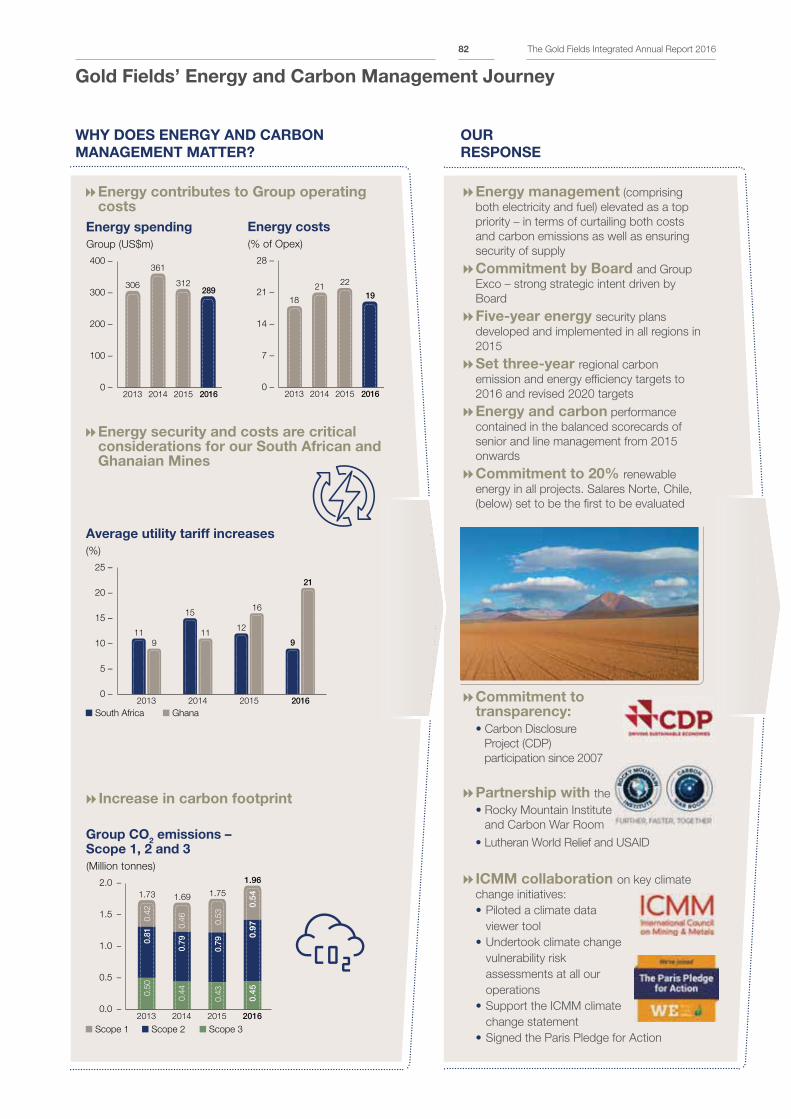
Gold Fields’ Energy and Carbon Management Journey
ICMM collaboration on key climate
change initiatives:
• Piloted a climate data
viewer tool
• Undertook climate change
vulnerability risk
assessments at all our
operations
• Support the ICMM climate
change statement
• Signed the Paris Pledge for Action
OUR
RESPONSE
WHY DOES ENERGY AND CARBON
MANAGEMENT MATTER?
Energy security and costs are critical considerations for our South African and Ghanaian Mines
Increase in carbon footprint
Energy management (comprising
both electricity and fuel) elevated as a top
priority – in terms of curtailing both costs
and carbon emissions as well as ensuring
security of supply
Commitment by Board and Group
Exco – strong strategic intent driven by
Board
Five-year energy security plans
developed and implemented in all regions in
2015
Set three-year regional carbon
emission and energy efficiency targets to
2016 and revised 2020 targets
Energy and carbon performance
contained in the balanced scorecards of
senior and line management from 2015
onwards
Commitment to 20% renewable
energy in all projects. Salares Norte, Chile,
(below) set to be the first to be evaluated
Commitment to transparency:
• Carbon Disclosure
Project (CDP)
participation since 2007
Partnership with the
• Rocky Mountain Institute
and Carbon War Room
• Lutheran World Relief and USAID
Energy contributes to Group operating costs
Energy spending
Group (US$m)
400 –
300 –
200 –
100 –
0 –2013 2014 2015 2016
306
361
312289
Energy costs
(% of Opex)
28 –
21 –
14 –
7 –
0 –2013 2014 2015 2016
18
2122
19
Average utility tariff increases
25 –
20 –
15 –
10 –
5 –
0 –2013 2014 2015 2016
11
9
15
1112
16
9
21
South Africa Ghana
(%)
Group CO2 emissions –
Scope 1, 2 and 3
(Million tonnes)
2.0 –
1.5 –
1.0 –
0.5 –
0.0 –
1.69 1.75
1.96
Scope 1 Scope 2 Scope 3
0.4
60.
790.4
4
1.73
0.4
20.
810.5
0
0.45
0.9
70.
54
0.4
30.
790.5
3
2013 2014 2015 2016
The Gold Fields Integrated Annual Report 201682
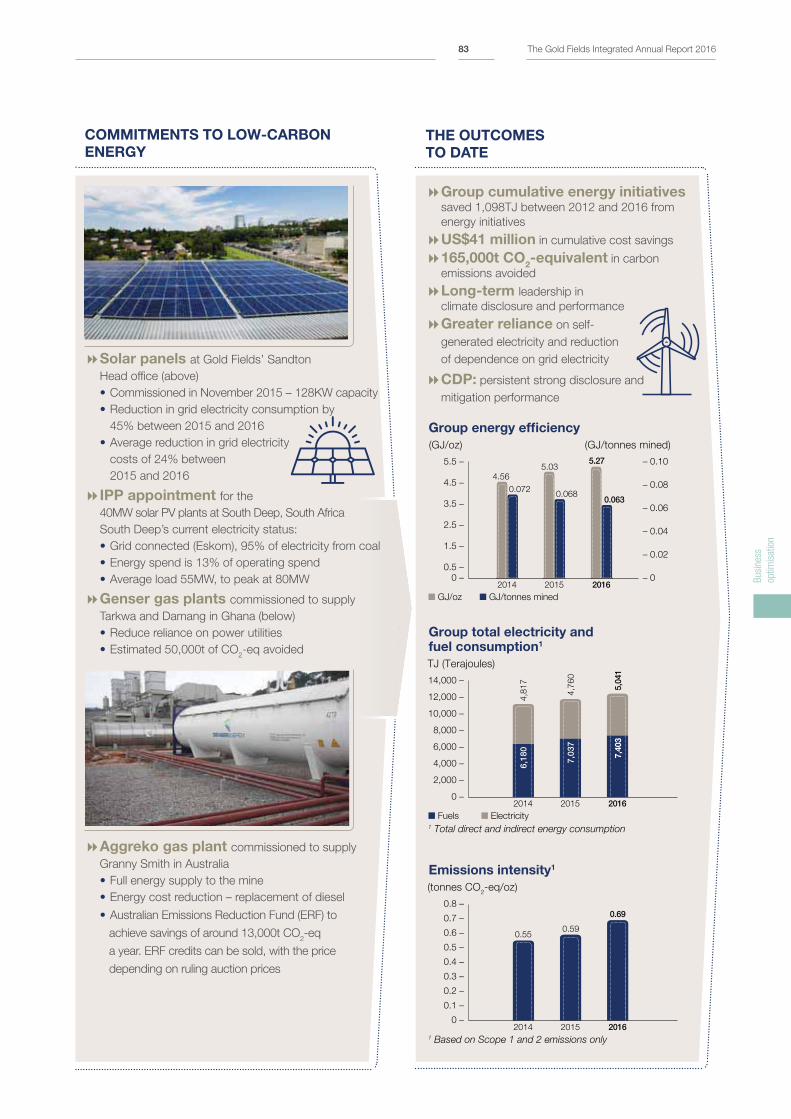
Group cumulative energy initiatives saved 1,098TJ between 2012 and 2016 from
energy initiatives
US$41 million in cumulative cost savings
165,000t CO2-equivalent in carbon
emissions avoided
Long-term leadership in
climate disclosure and performance
Greater reliance on self-
generated electricity and reduction
of dependence on grid electricity
CDP: persistent strong disclosure and
mitigation performance
COMMITMENTS TO LOW-CARBON
ENERGY
THE OUTCOMES
TO DATE
GJ/tonnes mined GJ/oz
0.0720.068
4.56
5.035.27
0.063
Group energy efficiency
(GJ/oz) (GJ/tonnes mined)
5.5 –
4.5 –
3.5 –
2.5 –
1.5 –
0.5 –
0 –2014 2015 2016
– 0.10
– 0.08
– 0.06
– 0.04
– 0.02
– 0
Group total electricity and fuel consumption1
TJ (Terajoules)
14,000 –
12,000 –
10,000 –
8,000 –
6,000 –
4,000 –
2,000 –
0 –2014 2015 2016
6,18
0
7,03
7
7,4
03
4,8
17
4,7
60
5,04
1
Fuels Electricity1 Total direct and indirect energy consumption
Emissions intensity1
(tonnes CO2-eq/oz)
0.8 –
0.7 –
0.6 –
0.5 –
0.4 –
0.3 –
0.2 –
0.1 –
0 –2014 2015 2016
0.550.59
0.69
1 Based on Scope 1 and 2 emissions only
Solar panels at Gold Fields’ Sandton
Head office (above)
• Commissioned in November 2015 – 128KW capacity
• Reduction in grid electricity consumption by
45% between 2015 and 2016
• Average reduction in grid electricity
costs of 24% between
2015 and 2016
IPP appointment for the
40MW solar PV plants at South Deep, South Africa
South Deep’s current electricity status:
• Grid connected (Eskom), 95% of electricity from coal
• Energy spend is 13% of operating spend
• Average load 55MW, to peak at 80MW
Genser gas plants commissioned to supply
Tarkwa and Damang in Ghana (below)
• Reduce reliance on power utilities
• Estimated 50,000t of CO2-eq avoided
Aggreko gas plant commissioned to supply
Granny Smith in Australia
• Full energy supply to the mine
• Energy cost reduction – replacement of diesel
• Australian Emissions Reduction Fund (ERF) to
achieve savings of around 13,000t CO2-eq
a year. ERF credits can be sold, with the price
depending on ruling auction prices
Bus
ines
s
optim
isat
ion
The Gold Fields Integrated Annual Report 201683
5LICENCE TO OPERATEIntroduction 86
Strategic Focus Areas 88
» Water 88
» Waste and Tailing 91
» Mine Closure 93
» Government Relations 94
» Mining Charter Scorecard 96
» Community Relations and
Creating Shared Value 98
The success of our
business is critically
dependent on our
relationships with a
number of key external
stakeholders that
determine both our
regulatory and social
licences to operate.
These relationships are
built on sound
environmental
stewardship, a
commitment to good
corporate citizenship and
sharing wealth with our
opportunities. As such,
maintaining our licence to
operate remains a priority
on our scorecard.
Palm oil harvesting at the Damang mine in Ghana
Lice
nce
to o
pera
te
The Gold Fields Integrated Annual Report 201685
Licence to Operate – Introduction
This section deals with the areas of
the business that impact Gold Fields’
ability to receive or renew its
regulatory licences to operate as
well as societal acceptance of our
operations – our “social licence
to operate”.
Regulatory licences are issued by
governments at all levels – national,
regional and local – and require first
and foremost good corporate
citizenship from Gold Fields in
terms of adherence to all relevant
legislation, including the payment of
taxes and other levies. These are
discussed in the government
relations section on p94 – 95.
Societal acceptance is mostly
achieved by building strong
relationships with the communities
that host our mines and with
governments at all levels. This is
not merely a compliance-based
approach but one that seeks to
ensure that we secure the long-term
support and acceptance of
governments and communities
through the sustainable development
of our mines and projects.
However, if not managed optimally,
mining has the potential to affect
both the physical environment and
our key stakeholders, particularly
communities living in close proximity
to our mines or projects.
Environmental and social impacts
can materially impact Gold Fields’
ability to receive or renew its
regulatory licences as well as societal
acceptance of our operations.
In our 2016 Group Performance
Scorecard (p25), we focused on the
following material licence to operate
issues to the business: » Environmental stewardship,
comprising energy and climate
change management (under
business optimisation, p56),
Water (p88), tailings and waste
(p91) and mine closure (p93) » Government engagement (p94),
community relations and shared
value (p98) and human rights
(p100)
We generate and share significant
value for the societies in which we
operate. Our total value distribution,
graphically depicted on p12, details
the economic value we create at
Group level as well as in our four
countries of operation. During 2016,
Gold Fields’ total value distribution to
our stakeholders – as measured by
World Gold Council standards – was
US$2.5bn, in the form of payments
to governments, capital providers,
business suppliers and employees.
ENVIRONMENTAL
STEWARDSHIP –
OVERVIEWGold Fields’ approach to
environmental management is
determined by relevant local
legislation and regulations, our
sustainable development framework,
as well as the ISO 14001
international environmental
management system standard, the
principles of the International Council
on Mining and Metals (ICMM) and
the UN Global Compact. Additional
local priorities are identified through
stakeholder consultation. Each of
the Group’s operations is certified to
ISO 14001.
Internally, Gold Fields has
implemented policy statements and
four Group-level guidelines, which
reflect our environmental priorities.
These concern energy and
carbon management, water
management, tailings management
and mine closure. A summary of
the Group guidelines can be found
on the Gold Fields website at
www.goldfields.com>sustainability.
These guidelines set out the systems
and processes necessary to ensure
the application of consistently good
environmental management
practices across the Group while
allowing a degree of adaptation
to local circumstances.
To ensure Group-wide conformance
with the guidelines, each operation
conducts self-assessments to
ascertain the levels of conformance
with the guidelines. Action plans
have been put in place to address
any gaps and these will be assessed
during 2017.
During 2016, the Group spent
US$10m on environmental
management, compared with
US$35m in 2015, as some spending
previously classified as environmental
now falls under operational
expenditure. Total gross mine closure
liabilities in 2016 were estimated at
US$381m (2015: US$353m) (p93).
Environmental IncidentsGold Fields reports environmental
incidents using a Level 1 (most
minor) to 5 (most severe) scale1.
We have not recorded any Level 4 or
5 environmental incidents in the past
six years, thereby achieving our
target of zero Level 4 and 5
incidents. During 2016, we did,
however, experience 131 Level 2
environmental incidents (2015: 67)
and three Level 3 environmental
incidents (2015: five). The details
of the Level 3 incidents – all at our
Ghanaian operations in Q1 and
requiring notification to the Ghana
Environmental Protection Agency
(EPA) – were as follows: » Tarkwa, 13 January 2016: A
truck reversed into another service
truck damaging the fuel pumping
unit, causing around 10,500 litres
of fuel to be spilled. Approximately
8,000ℓ were collected for filtration
and reuse » Tarkwa, 9 March 2016: During
working operations a rock hit an
excavator’s hydraulic hose, which
burst and spilled approximately
2,900 litres of oil, the bulk of which
was cleaned up » Damang, 27 March 2016: After
heavy rainfall and a blockage in the
tailings delivery pipeline
approximately 20,000 litres of
tailings slurry and supernatant
water spilled into a nearby event
pond, causing fish in the pond to
die. Most of the overflow slurry
was returned to the tailings dam.
To prevent a recurrence, a return
pump was installed to empty the
perimeter drain at all times.
Additionally, the base wall for the
dam perimeter was raised to
increase the dam’s capacity
1 Levels 1 and 2 involve minor incidents or non-conformances, with negligible or short-term limited impact. A Level 3 incident implies limited
non-conformance or non-compliance that results in ongoing but limited environmental impact. Level 4 and 5 incidents include major
non-conformances or non-compliances, which could result in long-term environmental harm, with operation-threatening implications
The Gold Fields Integrated Annual Report 201686
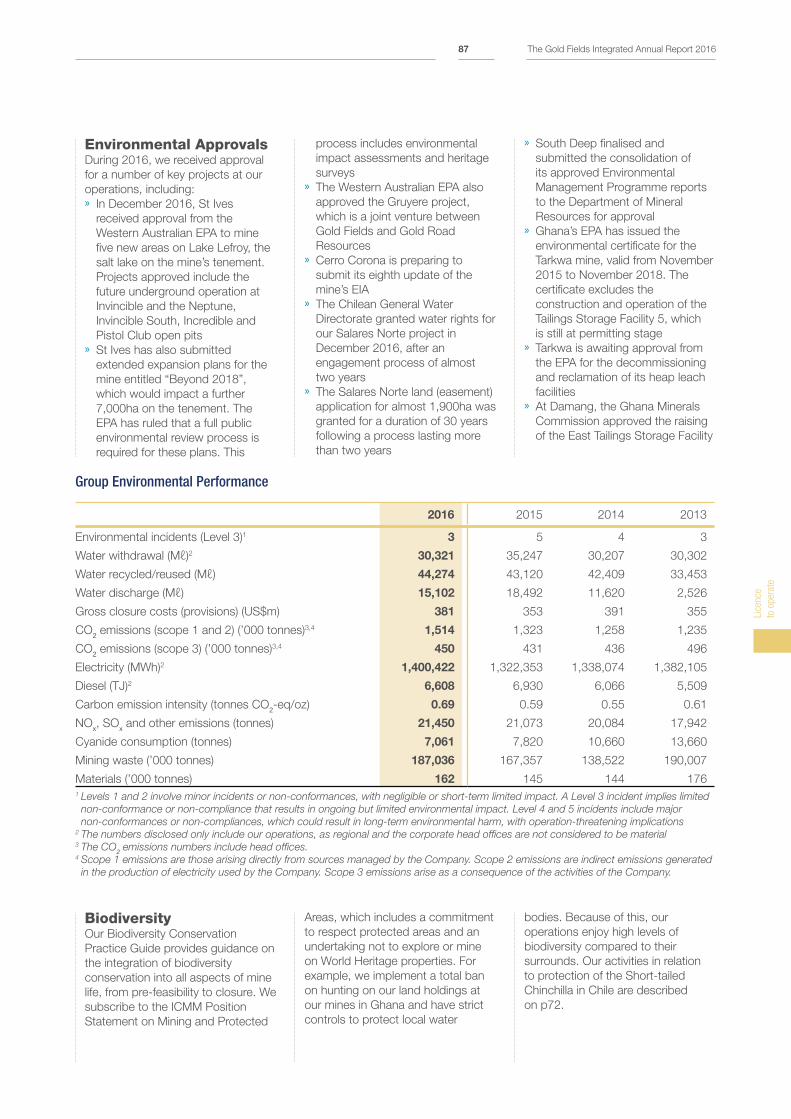
Environmental ApprovalsDuring 2016, we received approval
for a number of key projects at our
operations, including: » In December 2016, St Ives
received approval from the
Western Australian EPA to mine
five new areas on Lake Lefroy, the
salt lake on the mine’s tenement.
Projects approved include the
future underground operation at
Invincible and the Neptune,
Invincible South, Incredible and
Pistol Club open pits » St Ives has also submitted
extended expansion plans for the
mine entitled “Beyond 2018”,
which would impact a further
7,000ha on the tenement. The
EPA has ruled that a full public
environmental review process is
required for these plans. This
process includes environmental
impact assessments and heritage
surveys » The Western Australian EPA also
approved the Gruyere project,
which is a joint venture between
Gold Fields and Gold Road
Resources » Cerro Corona is preparing to
submit its eighth update of the
mine’s EIA » The Chilean General Water
Directorate granted water rights for
our Salares Norte project in
December 2016, after an
engagement process of almost
two years » The Salares Norte land (easement)
application for almost 1,900ha was
granted for a duration of 30 years
following a process lasting more
than two years
» South Deep finalised and
submitted the consolidation of
its approved Environmental
Management Programme reports
to the Department of Mineral
Resources for approval » Ghana’s EPA has issued the
environmental certificate for the
Tarkwa mine, valid from November
2015 to November 2018. The
certificate excludes the
construction and operation of the
Tailings Storage Facility 5, which
is still at permitting stage » Tarkwa is awaiting approval from
the EPA for the decommissioning
and reclamation of its heap leach
facilities » At Damang, the Ghana Minerals
Commission approved the raising
of the East Tailings Storage Facility
Group Environmental Performance
2016 2015 2014 2013
Environmental incidents (Level 3)1 3 5 4 3
Water withdrawal (Mℓ)2 30,321 35,247 30,207 30,302
Water recycled/reused (Mℓ) 44,274 43,120 42,409 33,453
Water discharge (Mℓ) 15,102 18,492 11,620 2,526
Gross closure costs (provisions) (US$m) 381 353 391 355
CO2 emissions (scope 1 and 2) (’000 tonnes)3,4 1,514 1,323 1,258 1,235
CO2 emissions (scope 3) (’000 tonnes)3,4 450 431 436 496
Electricity (MWh)2 1,400,422 1,322,353 1,338,074 1,382,105
Diesel (TJ)2 6,608 6,930 6,066 5,509
Carbon emission intensity (tonnes CO2-eq/oz) 0.69 0.59 0.55 0.61
NOx, SOx and other emissions (tonnes) 21,450 21,073 20,084 17,942
Cyanide consumption (tonnes) 7,061 7,820 10,660 13,660
Mining waste (’000 tonnes) 187,036 167,357 138,522 190,007
Materials (’000 tonnes) 162 145 144 176
1 Levels 1 and 2 involve minor incidents or non-conformances, with negligible or short-term limited impact. A Level 3 incident implies limited
non-conformance or non-compliance that results in ongoing but limited environmental impact. Level 4 and 5 incidents include major
non-conformances or non-compliances, which could result in long-term environmental harm, with operation-threatening implications2 The numbers disclosed only include our operations, as regional and the corporate head offices are not considered to be material3 The CO2 emissions numbers include head offices.4 Scope 1 emissions are those arising directly from sources managed by the Company. Scope 2 emissions are indirect emissions generated
in the production of electricity used by the Company. Scope 3 emissions arise as a consequence of the activities of the Company.
BiodiversityOur Biodiversity Conservation
Practice Guide provides guidance on
the integration of biodiversity
conservation into all aspects of mine
life, from pre-feasibility to closure. We
subscribe to the ICMM Position
Statement on Mining and Protected
Areas, which includes a commitment
to respect protected areas and an
undertaking not to explore or mine
on World Heritage properties. For
example, we implement a total ban
on hunting on our land holdings at
our mines in Ghana and have strict
controls to protect local water
bodies. Because of this, our
operations enjoy high levels of
biodiversity compared to their
surrounds. Our activities in relation
to protection of the Short-tailed
Chinchilla in Chile are described
on p72.
Lice
nce
to o
pera
te
The Gold Fields Integrated Annual Report 201687
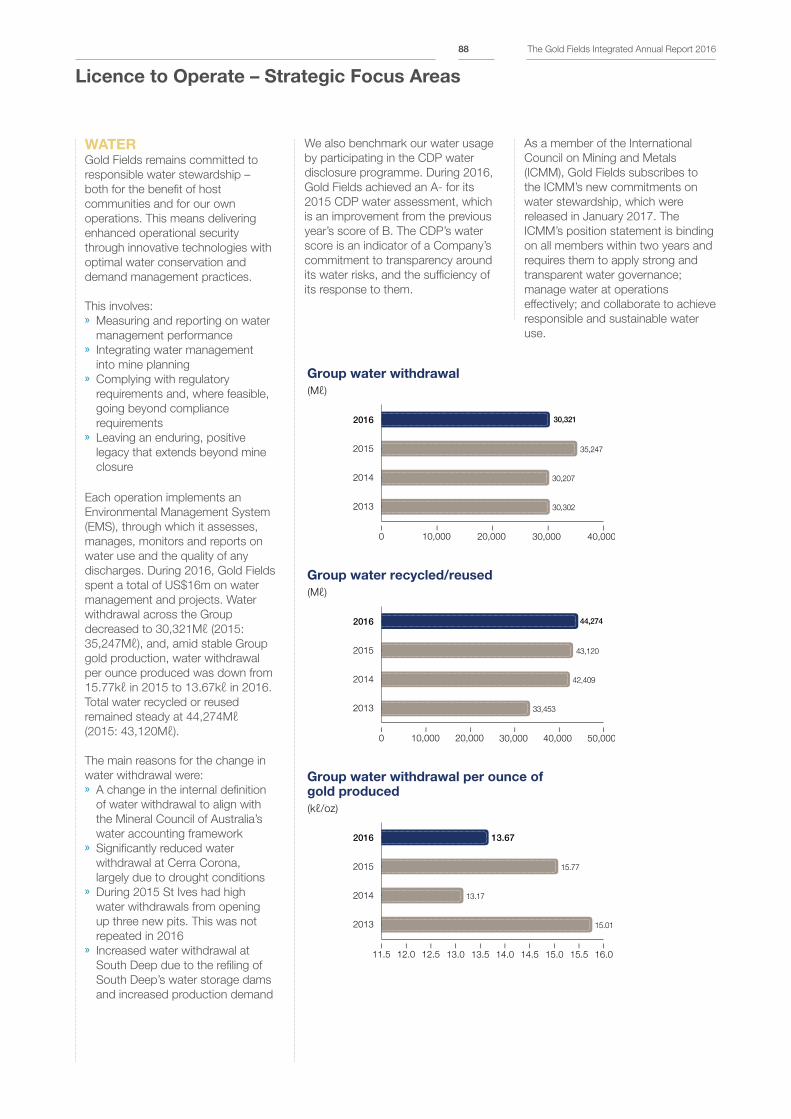
Licence to Operate – Strategic Focus Areas
WATERGold Fields remains committed to
responsible water stewardship –
both for the benefit of host
communities and for our own
operations. This means delivering
enhanced operational security
through innovative technologies with
optimal water conservation and
demand management practices.
This involves: » Measuring and reporting on water
management performance » Integrating water management
into mine planning » Complying with regulatory
requirements and, where feasible,
going beyond compliance
requirements » Leaving an enduring, positive
legacy that extends beyond mine
closure
Each operation implements an
Environmental Management System
(EMS), through which it assesses,
manages, monitors and reports on
water use and the quality of any
discharges. During 2016, Gold Fields
spent a total of US$16m on water
management and projects. Water
withdrawal across the Group
decreased to 30,321Mℓ (2015:
35,247Mℓ), and, amid stable Group
gold production, water withdrawal
per ounce produced was down from
15.77kℓ in 2015 to 13.67kℓ in 2016.
Total water recycled or reused
remained steady at 44,274Mℓ
(2015: 43,120Mℓ).
The main reasons for the change in
water withdrawal were: » A change in the internal definition
of water withdrawal to align with
the Mineral Council of Australia’s
water accounting framework » Significantly reduced water
withdrawal at Cerra Corona,
largely due to drought conditions » During 2015 St Ives had high
water withdrawals from opening
up three new pits. This was not
repeated in 2016 » Increased water withdrawal at
South Deep due to the refiling of
South Deep’s water storage dams
and increased production demand
We also benchmark our water usage
by participating in the CDP water
disclosure programme. During 2016,
Gold Fields achieved an A- for its
2015 CDP water assessment, which
is an improvement from the previous
year’s score of B. The CDP’s water
score is an indicator of a Company’s
commitment to transparency around
its water risks, and the sufficiency of
its response to them.
As a member of the International
Council on Mining and Metals
(ICMM), Gold Fields subscribes to
the ICMM’s new commitments on
water stewardship, which were
released in January 2017. The
ICMM’s position statement is binding
on all members within two years and
requires them to apply strong and
transparent water governance;
manage water at operations
effectively; and collaborate to achieve
responsible and sustainable water
use.
35,247
30,321
30,207
30,302
Group water withdrawal
(Mℓ)
2016
2014
2015
2013
0 10,000 20,000 40,00030,000
–––––
43,120
44,274
42,409
33,453
Group water recycled/reused
(Mℓ)
2016
2014
2015
2013
0 10,000 20,000 50,00040,000
––
30,000
––––
13.67
15.77
13.17
15.01
Group water withdrawal per ounce of gold produced
(kℓ/oz)
2016
2014
2015
2013
11.5 16.0
–
15.5
–
15.0
–
14.5
–
14.0
–
13.5
–
13.0
––
12.0
–
12.5
–
The Gold Fields Integrated Annual Report 201688
In the RegionsDuring 2016, predictive and dynamic
water balances were developed at
all operations, except Damang,
using hydrology software systems.
Damang will install their systems
during 2017. This enables the mines
to account for the water inputs to
and outputs from their operations
and for the flows within the system.
Post closure water management
plans were also put into place or are
currently being developed at the
mines as part of their mine closure
plans.
Americas Water Balance Water is a critical issue for
communities in Peru and a large
part of the active resistance by
communities to mining is over
perceived or actual water pollution
by mines. Cerro Corona has
proactive engagements with
community organisations and local
governments in terms of which it is a
large supplier of potable water to the
communities. During 2016 Cerro
Corona invested over US$3m in
developing and upgrading water
systems for nearby communities.
(Details of these initiatives can be
found on p106.)
Updates to Cerro Corona’s
geochemical and hydrogeological
models will be completed during
2017 and will serve as input to
the mine’s post-closure water
management plan.
Salares Norte Water rights at this project were
granted by the regulator in
December 2016. The water rights
total 114ℓ/second from nearby
underground boreholes with
sufficient supplies – the granting of
the rights is a critical step in
developing the project, which is
situated in the Atacama Desert in
northern Chile.
AustraliaWater Balance Water balances with links to
appropriate water management
plans have been developed for all
four mines in the portfolio. Granny
Smith’s water balance is the most
advanced, being both dynamic and
predictive, and the lessons learnt
have been applied to the other
operations’ water balances.
Post-closure water management is
integrated into each mine’s closure
plans. St Ives has progressed
furthest, having submitted its closure
plan to the regulator at the end of
2016. Agnew and Darlot are on track
to submit in 2017 and Granny Smith
in 2018.
Water Security Water security poses a significant
challenge for the region’s mines – all
of which are based in arid areas of
Western Australia. St Ives and
Granny Smith have water
agreements with outside providers.
St Ives’ water agreement was
renewed early in 2015. Granny
Smith’s agreement with a
neighbouring company for the
provision of potable water was
revised and signed off in late 2016.
At Agnew, a hydrological study on
the Fairyland borefield suggests that
the facility can be expanded to
provide more water than the current
design allows. This will supplement
the existing water supply at the mine.
Darlot, which Gold Fields announced
it would put up for sale in February
2017, is in the process of entering
into an agreement with the nearby
Murrin Murrin mine. Murrin Murrin is
sourcing water from the same aquifer
as Darlot, but will now be provided
with supplementary water from their
nearby Grey Mare borefield. This
supplementary water supply will
allow supply from the Darlot borefield
to be reduced and the aquifer to be
recharged.
South Africa Water Balance New water balance software
was implemented at South Deep
with links to appropriate water
management plans. Extension of the
system to underground operations is
being considered for 2017. During
2016 South Deep completed Phase
1 of its post-closure water
management plan, which assessed
risks for mines that are hydraulically
connected to South Deep, including
Sibanye Gold’s adjacent Ezulwini
mine, which has applied to the
regulator for closure permission.
Phase 2 of the plan will be initiated in
2017 and will consider any potential
legacy groundwater contamination.
Recycling and Conservation During 2016, South Africa found
itself in a drought cycle that was one
of the worst in 40 years, though
good rains have fallen in early 2017.
The implementation of water
recycling and conservation practices
is therefore critical at South Deep.
Water awareness initiatives were
introduced to encourage a reduction
in water consumption. In addition, no
water is discharged from the mine,
other than treated sewage effluent,
as required by the Department of
Water and Sanitation.
The drought meant that the three
reverse osmosis (RO) plants that
were installed at South Deep over
the past two years to treat process
water and reduce the intake of
municipal water could not be
operated for much of the year.
Currently, only one of the three
RO plants is operational. Three RO
plants have been installed
underground to supply drinking
water.
Water Security Due to the current drought
conditions, as well as an increase in
water use at South Deep, the mine
experienced water supply shortages
during 2015/2016. South Deep
submitted an application to amend
Lice
nce
to o
pera
te
The Gold Fields Integrated Annual Report 201689
Licence to Operate – Strategic Focus Areas (continued)
its 2011 Water Use Licence (WUL) in
May 2015, which is still being
reviewed by the Department of Water
and Sanitation (DWS). In 2015 South
Deep concluded a water supply
agreement with Sibanye Gold to
supply water from Sibanye’s Ezulwini
mine, via the Leeuspruit stream.
The plan to secure water to support
South Deep during production
ramp-up could also be negatively
impacted by Sibanye’s
announcement on 31 August 2016
that it will be closing the Ezulwini
(Cooke 4 Shaft) mine. South Deep is
currently assessing the implications
of the closure if such application
were granted.
Furthermore, a Sibanye Gold and
Gold Fields joint working group was
established early in 2016 to identify
and remedy potential contamination
of the Leeuspruit river caused by
decades of mining in the area.
Acid Rock DrainageSouth Deep implements a range of
measures to prevent or contain Acid
Rock Drainage (ARD) and there were
no material cases of ARD reported in
2016. Proactive measures include: » Ongoing water monitoring » Containment of any ARD
generation on the old tailings
facilities » Water-treatment solutions that
purify surplus fissure and process
water to a potable standard » Removal of the old South Shaft
waste rock dump » Revegetation of the mine’s
environmental footprint
Underground ARD generation is well
managed during the operational
phase through ongoing pumping of
underground water to surface water
treatment facilities.
Other key water management
initiatives undertaken at South Deep
during 2016 include: » Studying plume mitigation
measures at the Doornpoort
TSF and the old TSFs with
implementation scheduled
for 2017 » Maintaining vegetation of the
mine’s two historic TSFs, which
has reduced the generation of
wind-blown dust to well below the
legislated airborne dust level limits
West AfricaWater BalanceTarkwa’s water balance is being
reviewed following the closure of the
heap leach operations. We do not
expect any major issues of water
management at closure.
Tarkwa achieved a 11% reduction
in water discharged due to higher
levels of water recycling and reuse
and the improved water quality (as a
result of rain-fed rinsing) discharged
from the South heap leach facility. No
water was discharged from Damang
in 2016 in terms of our revised
definition.
Water Treatment and Monitoring Tarkwa’s North and South heap
leach facilities were closed in 2014.
A decommissioning plan was
submitted to Ghana’s Environmental
Protection Agency (EPA) and their
comments have been addressed
which included some test work.
A final plan has been submitted and
is awaiting approval. Meanwhile,
interventions, such as slope
stabilisation by planting cover grass
to reduce wash outs, have been
completed at the North heap leach.
Similar interventions will be initiated
in other areas until the
decommissioning plan is approved
by the EPA for full implementation.
Water recycled on the South heap
leach pads is now being discharged
directly to the environment after test
results showed that the water quality
met the effluent quality guidelines.
Excess water from the North heap
leach is being treated at the
refurbished North Reverse-Osmosis
(RO) plant before being discharged
and a clarifier is being installed at the
North heaps to increase the volume
of water to feed the treatment plant.
The operation of the RO plant, which
was established at the behest of the
EPA, produces concentrated brine,
which is being temporarily stored on
site in a dedicated pond. Tarkwa has
been investigating a number of
options to achieve the permanent
elimination of brine and employed
two consulting firms to carry out pilot
test work on the treatment of brine
through biological, passive, or any
other acceptable treatment option.
Trials of these treatment methods will
commence in Q1 2017. Tarkwa has
also been examining brine treatment
through plant absorption on a
20-hectare test plot of rubber trees
at the North and South heap leach
pads. Irrigation of the plantation at
the South heap leach helped in
improving the quality, making room
for discharge without treatment.
Irrigation at the North heap leach,
where brine concentrations are
higher, is continuing and is being
monitored to determine the success
of the initiative.
The Gold Fields Integrated Annual Report 201690
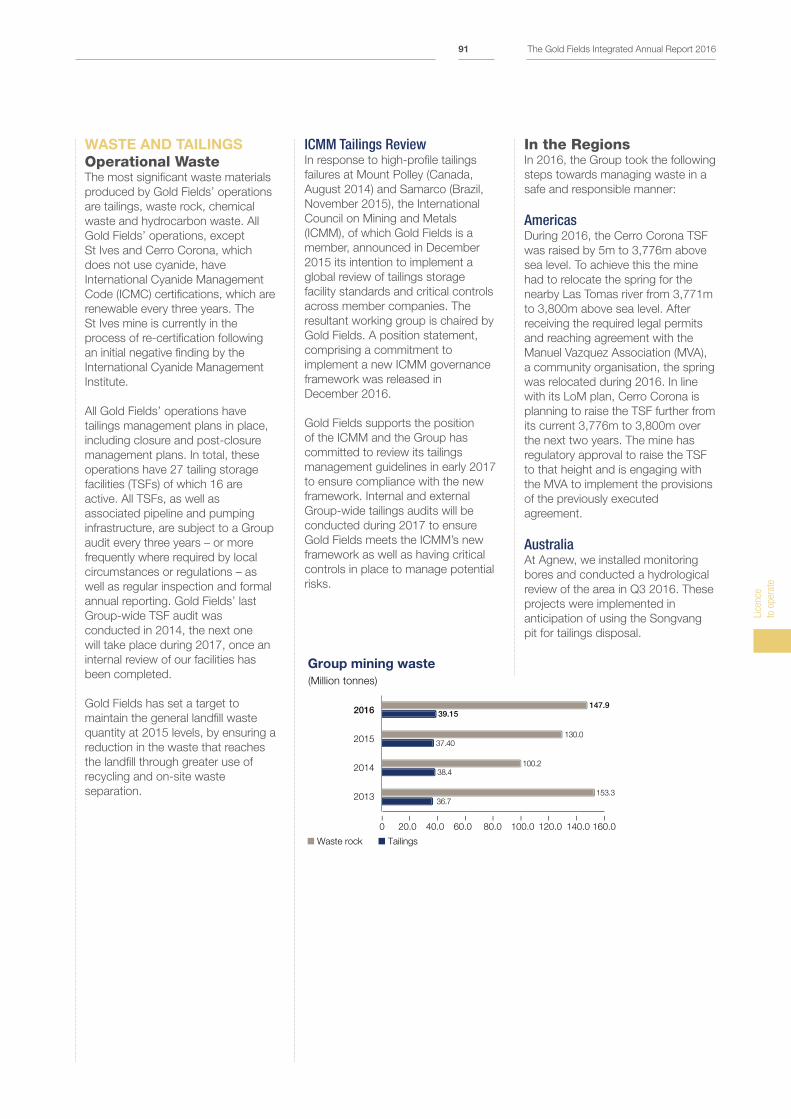
WASTE AND TAILINGS
Operational WasteThe most significant waste materials
produced by Gold Fields’ operations
are tailings, waste rock, chemical
waste and hydrocarbon waste. All
Gold Fields’ operations, except
St Ives and Cerro Corona, which
does not use cyanide, have
International Cyanide Management
Code (ICMC) certifications, which are
renewable every three years. The
St Ives mine is currently in the
process of re-certification following
an initial negative finding by the
International Cyanide Management
Institute.
All Gold Fields’ operations have
tailings management plans in place,
including closure and post-closure
management plans. In total, these
operations have 27 tailing storage
facilities (TSFs) of which 16 are
active. All TSFs, as well as
associated pipeline and pumping
infrastructure, are subject to a Group
audit every three years – or more
frequently where required by local
circumstances or regulations – as
well as regular inspection and formal
annual reporting. Gold Fields’ last
Group-wide TSF audit was
conducted in 2014, the next one
will take place during 2017, once an
internal review of our facilities has
been completed.
Gold Fields has set a target to
maintain the general landfill waste
quantity at 2015 levels, by ensuring a
reduction in the waste that reaches
the landfill through greater use of
recycling and on-site waste
separation.
ICMM Tailings ReviewIn response to high-profile tailings
failures at Mount Polley (Canada,
August 2014) and Samarco (Brazil,
November 2015), the International
Council on Mining and Metals
(ICMM), of which Gold Fields is a
member, announced in December
2015 its intention to implement a
global review of tailings storage
facility standards and critical controls
across member companies. The
resultant working group is chaired by
Gold Fields. A position statement,
comprising a commitment to
implement a new ICMM governance
framework was released in
December 2016.
Gold Fields supports the position
of the ICMM and the Group has
committed to review its tailings
management guidelines in early 2017
to ensure compliance with the new
framework. Internal and external
Group-wide tailings audits will be
conducted during 2017 to ensure
Gold Fields meets the ICMM’s new
framework as well as having critical
controls in place to manage potential
risks.
In the RegionsIn 2016, the Group took the following
steps towards managing waste in a
safe and responsible manner:
AmericasDuring 2016, the Cerro Corona TSF
was raised by 5m to 3,776m above
sea level. To achieve this the mine
had to relocate the spring for the
nearby Las Tomas river from 3,771m
to 3,800m above sea level. After
receiving the required legal permits
and reaching agreement with the
Manuel Vazquez Association (MVA),
a community organisation, the spring
was relocated during 2016. In line
with its LoM plan, Cerro Corona is
planning to raise the TSF further from
its current 3,776m to 3,800m over
the next two years. The mine has
regulatory approval to raise the TSF
to that height and is engaging with
the MVA to implement the provisions
of the previously executed
agreement.
AustraliaAt Agnew, we installed monitoring
bores and conducted a hydrological
review of the area in Q3 2016. These
projects were implemented in
anticipation of using the Songvang
pit for tailings disposal.
147.939.15
130.037.40
100.238.4
153.336.7
Group mining waste
(Million tonnes)
2016
2014
2015
2013
0 20.0
–
40.0
–
60.0
–
80.0
–
100.0
–
120.0
–
140.0
–
160.0
––
Waste rock Tailings
Lice
nce
to o
pera
te
The Gold Fields Integrated Annual Report 201691
Licence to Operate – Strategic Focus Areas (continued)
We also began preparing for the
rehabilitation of the old TSF that
serviced the Lawlers’ processing
plant. The plan was approved by
the regulators, and rehabilitation of
the facility by a contractor will
commence mid-2017 when climatic
conditions are favourable.
At Granny Smith, we continued to
experience groundwater leakage
around the tailings storage facility
as a result of waste seepage. To
address this, Gold Fields installed
additional bores to recover water.
The bores have the added
advantage of providing an important
source of water for the processing
plant.
At the St Ives mine, the Leviathan
in-pit tailings facility started receiving
tailings depositions after final
regulatory approval was granted in
2015. The facility is set to save the
mine around A$50m (US$38m) in
TSF construction and closure
liabilities over LoM.
During the year, the Far Southeast
joint venture in the Philippines
engaged independent experts to
undertake a technical audit of the
TD5A tailings storage facility, which
is owned by Lepanto Mining, our
JV partner. The audit report
concluded that the facility was well
managed and laid out further
recommendations for enhancements,
which are being implemented.
South AfricaAt South Deep, an integrated waste
management plan was initiated,
which is designed to compile a
waste inventory, develop a
management strategy and propose
viable recycling initiatives for various
waste streams. The plan will be fully
implemented during 2017. As part
of this plan the waste transfer station
at South Deep will be upgraded to
incorporate a general waste recycling
initiative that generates employment
for community members.
Reprocessing of tailings from the two
old TSFs at South Deep continued
for use in the backfill plant, though
this was slowed down amid the
water shortages experienced in
South Africa during 2016.
West AfricaAs part of the ongoing production
and long-term growth at Tarkwa and
Damang new TSF capacity is
required. The regional management
has been working on a multi-
pronged approach for a number of
TSFs. Progress at the Tarkwa TSFs
during 2016 was as follows: » TSF 2: The wall raise was
completed during 2016 and the
Minerals Commission has given
approval for the deposition of
tailings » TSF 3: The National Tailings Dam
Committee reviewed the wall raise
design document and work
commenced after approval from
the Minerals Commission. The
mine is awaiting review comments
from the EPA » TSF 5: Basin preparation for this
new TSF has been completed
and lining has started with general
work set to be completed by
mid-2017. Written approval for
the work was received from the
Minerals Commission and
payment of permit fees was
made to the EPA
The EPA is currently reviewing
Tarkwa’s final plan for the
decommissioning and reclamation
of the mine’s heap leach facilities. In
the meantime the mine has planted
cover grass on the facilities to
reduce wash outs.
The reinvestment plan at Damang
has necessitated accelerating the
construction of the Far East Tailings
Storage Facility (FETSF) as the
existing East Tailings Storage Facility
(ETSF) is approaching full capacity.
An interim 2.5m raise was started
at the ETSF during 2016 and should
be completed during Q1 2017,
providing for an additional 3.6Mt
tailings capacity. Stage 1 of the
FETSF is planned for completion
by end-2017 and will provide 20Mt
capacity. Further future lifts of the
FETSF will cater for all tailings for
the new eight year life-of-mine at
Damang.
Waste RockTotal waste volumes for the Group
increased by 14% to 148m tonnes
during 2016.
During 2016, two major projects to
enhance the waste management at
Cerro Corona were completed: the
expansion of the waste rock storage
facility and the redesign and
relocation of a topsoil stockpile
to allow for optimised usage. South
Deep completed the removal of the
old South Shaft waste rock dump in
2016.
Group-wide waste rock volumes are
set to rise in 2017 as the Damang
mine in Ghana commences its
reinvestment plan with major
cutbacks at the Damang Pit, which
involves 265m of pre-strip to a total
depth of 341m to access the base
of the existing pit.
The Gold Fields Integrated Annual Report 201692
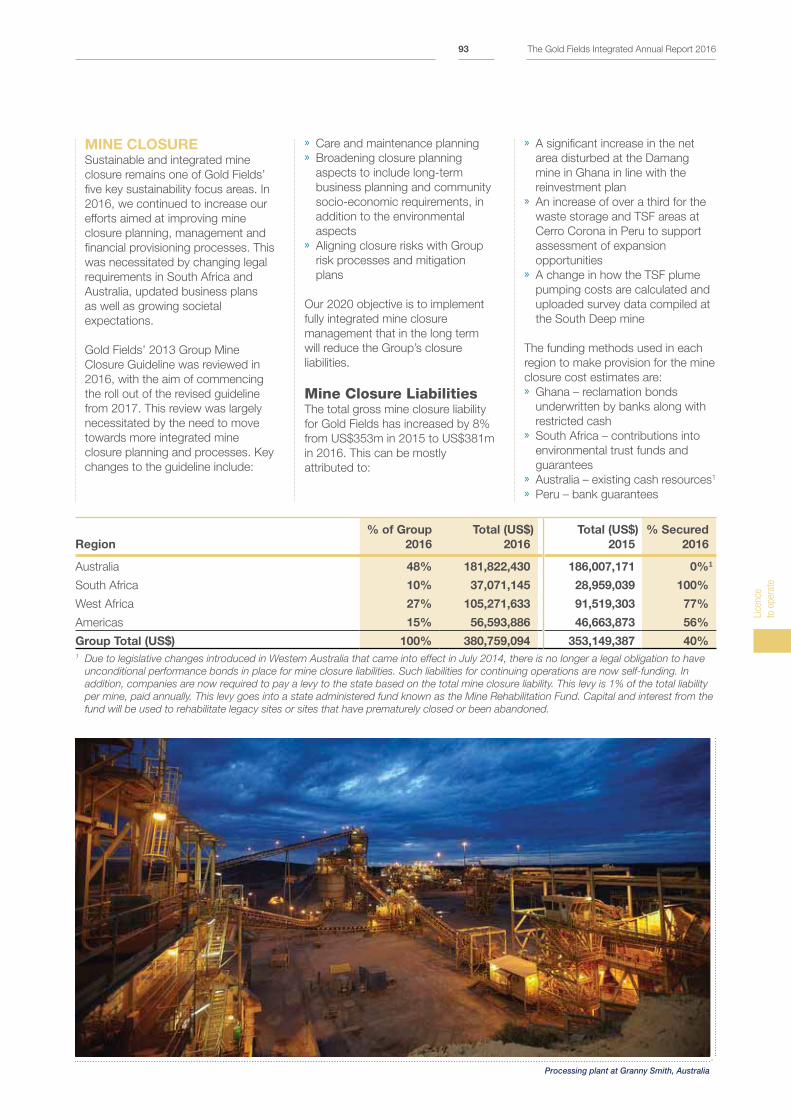
Region
% of Group
2016
Total (US$)
2016
Total (US$)
2015
% Secured
2016
Australia 48% 181,822,430 186,007,171 0%1
South Africa 10% 37,071,145 28,959,039 100%
West Africa 27% 105,271,633 91,519,303 77%
Americas 15% 56,593,886 46,663,873 56%
Group Total (US$) 100% 380,759,094 353,149,387 40%
1 Due to legislative changes introduced in Western Australia that came into effect in July 2014, there is no longer a legal obligation to have
unconditional performance bonds in place for mine closure liabilities. Such liabilities for continuing operations are now self-funding. In
addition, companies are now required to pay a levy to the state based on the total mine closure liability. This levy is 1% of the total liability
per mine, paid annually. This levy goes into a state administered fund known as the Mine Rehabilitation Fund. Capital and interest from the
fund will be used to rehabilitate legacy sites or sites that have prematurely closed or been abandoned.
MINE CLOSURESustainable and integrated mine
closure remains one of Gold Fields’
five key sustainability focus areas. In
2016, we continued to increase our
efforts aimed at improving mine
closure planning, management and
financial provisioning processes. This
was necessitated by changing legal
requirements in South Africa and
Australia, updated business plans
as well as growing societal
expectations.
Gold Fields’ 2013 Group Mine
Closure Guideline was reviewed in
2016, with the aim of commencing
the roll out of the revised guideline
from 2017. This review was largely
necessitated by the need to move
towards more integrated mine
closure planning and processes. Key
changes to the guideline include:
» Care and maintenance planning » Broadening closure planning
aspects to include long-term
business planning and community
socio-economic requirements, in
addition to the environmental
aspects » Aligning closure risks with Group
risk processes and mitigation
plans
Our 2020 objective is to implement
fully integrated mine closure
management that in the long term
will reduce the Group’s closure
liabilities.
Mine Closure LiabilitiesThe total gross mine closure liability
for Gold Fields has increased by 8%
from US$353m in 2015 to US$381m
in 2016. This can be mostly
attributed to:
» A significant increase in the net
area disturbed at the Damang
mine in Ghana in line with the
reinvestment plan » An increase of over a third for the
waste storage and TSF areas at
Cerro Corona in Peru to support
assessment of expansion
opportunities » A change in how the TSF plume
pumping costs are calculated and
uploaded survey data compiled at
the South Deep mine
The funding methods used in each
region to make provision for the mine
closure cost estimates are: » Ghana – reclamation bonds
underwritten by banks along with
restricted cash » South Africa – contributions into
environmental trust funds and
guarantees » Australia – existing cash resources1
» Peru – bank guarantees
Processing plant at Granny Smith, Australia
Lice
nce
to o
pera
te
The Gold Fields Integrated Annual Report 201693
Licence to Operate – Strategic Focus Areas (continued)
GOVERNMENT RELATIONSAs the issuers of mining licences,
developers of policy and
implementers of regulations, host
governments are among Gold Fields’
most important stakeholders.
The Gold Fields Group has
appropriate controls and procedures
in place to ensure that we comply
with relevant tax legislation in all the
jurisdictions in which we operate.
This includes compliance with
Transfer Pricing (TP) legislation and
associated TP documentation
requirements, which is governed by
our Group TP Policy. The Gold Fields
Group does not embark on
intragroup gold sales and only sells
its gold (or gold-equivalent product)
directly to independent third parties
at arm’s-length prices.
Base erosion and profit shifting refers
to tax avoidance strategies that
exploit gaps and mismatches in tax
rules to artificially shift profits to no or
low-tax locations. Gold Fields does
not artificially shift profits to these
locations.
Gold Fields does not provide
financial contributions to political
parties and lobby groups unless
explicitly approved by the Gold Fields
Board of Directors in accordance
with the Company’s Code of
Conduct. No political donations
were made in 2016.
During 2016, national elections were
held in three of the countries in which
we operate: Australia, Ghana and
Peru. In Ghana and Peru new
political parties came to power and
formed the national government. We
are committed to working with the
new governments, as we were with
the outgoing ones, in establishing
sound and transparent working
relationships that benefit the
countries and impacted
communities.
GhanaIn March 2016, Gold Fields Ghana
entered into a Development
Agreement (DA) with the Government
of Ghana for both the Tarkwa and
Damang mines. The agreement was
ratified by the country’s Parliament
on 17 March 2016.
The highlights of the agreement
include: » A reduction in the corporate tax
rate from 35.0% to 32.5%,
effective 17 March 2016 » A change in the royalty rate from
a flat 5% of revenue to a sliding
scale royalty based on the gold
price (as per table below), with
effect from 1 January 2017
Royalty
rate Gold price
3.0% US$0 – 1,299.99/oz
3.5% US$1,300 – 1,449.99/oz
4.0% US$1,450 – 2,299.99/oz
5.0% US$2,300/oz – unlimited
» The terms of the DA, effective from
17 March 2016, will be for a period
of 11 years for Tarkwa and nine
years for Damang, each renewable
for an additional five years » Tarkwa and Damang commit to
total spending of US$500m each
for the period of the agreement.
The DA could be extended by a
further five years each should
additional investments of
US$300m be made » Funding the construction of the
29km road between Tarkwa and
Damang by Gold Fields at an
estimated cost of US$17m
As a result of the DA, Gold Fields
Ghana committed to a US$341m
capital reinvestment in Damang,
which will be supported by a further
US$1,060m in operational spending
over the new eight-year LoM. This
investment has significant socio-
economic benefits for communities
around Damang. (See p70). The DA
will also lead to significant cost and
cash-flow benefits for the Tarkwa
mine, enabling it to invest in future
expansion when required.
Ghana is a key region for Gold Fields
and the DA cements our status as
one of the largest contributors to the
country’s fiscus. In 2016, Gold Fields
paid over US$86m in direct taxes,
royalties and dividends to the
Government of Ghana. This makes
Gold Fields Ghana the highest
taxpayer in Ghana in 2016, as
confirmed by the Ghana Revenue
Authority.
AustraliaIn 2016, Gold Fields joined with its
peers in Western Australia to form
the Gold Industry Group to continue
highlighting the industry’s
contribution to the Western
Australian economy and job creation.
This follows on the successful
co-operation by miners to campaign
against a review of the royalties
charged on mining in 2015. Gold
Fields plays a prominent role in the
leadership of the industry group.
PeruOur engagement with government in
Peru is largely focused at local and
regional government level as the
Province of Cajamarca, which is
home to our Cerro Corona mine,
experiences regular community
protests against mining. This requires
extensive engagement with the local
Government of Hualgayoc and the
Provincial Government.
National elections took place during
2016, with the vote returning a
business-friendly government to
power. We are engaging with the
government through the local
chamber.
South AfricaFrom a regulatory perspective, Gold
Fields’ operation in South Africa is
guided primarily by the Mineral and
Petroleum Resources Development
Act (MPRDA) of 2002. In 2013,
critical amendments to the MPRDA,
such as developmental pricing for
certain metals, were tabled by the
government in the MPRDA
Amendment Bill, but the bill was sent
back to Parliament by the country’s
presidency for further consideration
in January 2017. Amid differing
policy priorities by various
government departments and
jurisdications, the bill has still not
been ratified.
The Gold Fields Integrated Annual Report 201694
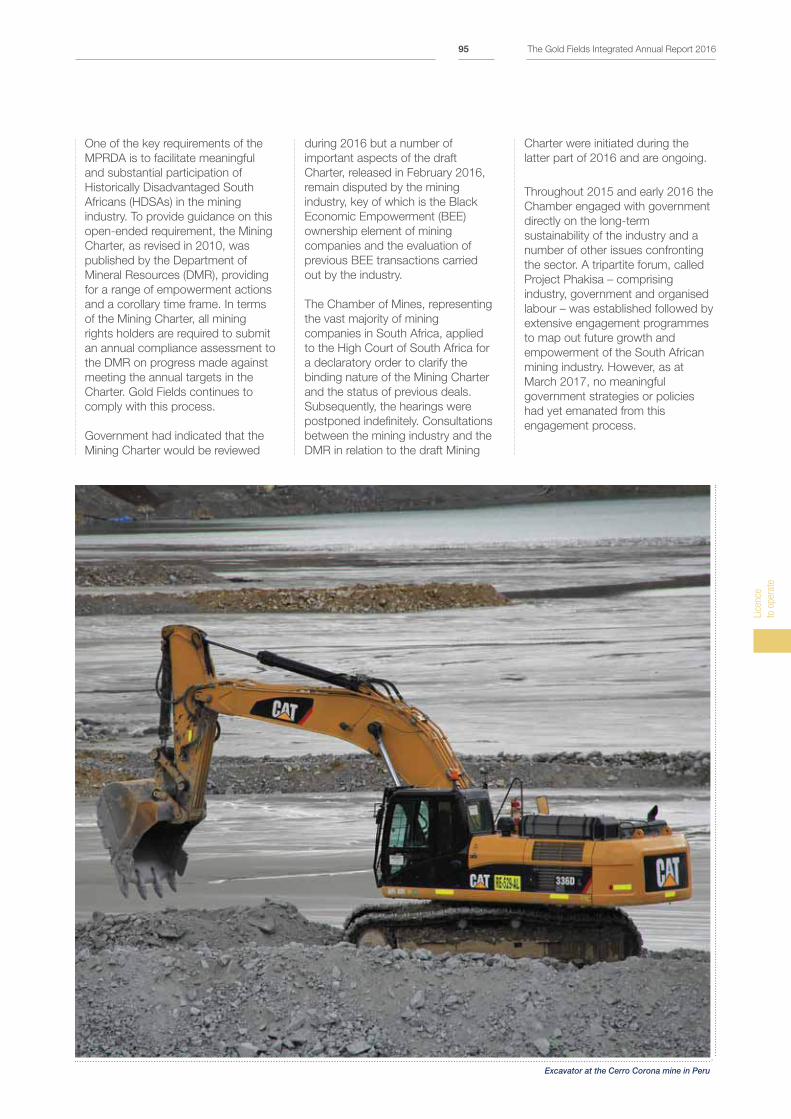
One of the key requirements of the
MPRDA is to facilitate meaningful
and substantial participation of
Historically Disadvantaged South
Africans (HDSAs) in the mining
industry. To provide guidance on this
open-ended requirement, the Mining
Charter, as revised in 2010, was
published by the Department of
Mineral Resources (DMR), providing
for a range of empowerment actions
and a corollary time frame. In terms
of the Mining Charter, all mining
rights holders are required to submit
an annual compliance assessment to
the DMR on progress made against
meeting the annual targets in the
Charter. Gold Fields continues to
comply with this process.
Government had indicated that the
Mining Charter would be reviewed
during 2016 but a number of
important aspects of the draft
Charter, released in February 2016,
remain disputed by the mining
industry, key of which is the Black
Economic Empowerment (BEE)
ownership element of mining
companies and the evaluation of
previous BEE transactions carried
out by the industry.
The Chamber of Mines, representing
the vast majority of mining
companies in South Africa, applied
to the High Court of South Africa for
a declaratory order to clarify the
binding nature of the Mining Charter
and the status of previous deals.
Subsequently, the hearings were
postponed indefinitely. Consultations
between the mining industry and the
DMR in relation to the draft Mining
Charter were initiated during the
latter part of 2016 and are ongoing.
Throughout 2015 and early 2016 the
Chamber engaged with government
directly on the long-term
sustainability of the industry and a
number of other issues confronting
the sector. A tripartite forum, called
Project Phakisa – comprising
industry, government and organised
labour – was established followed by
extensive engagement programmes
to map out future growth and
empowerment of the South African
mining industry. However, as at
March 2017, no meaningful
government strategies or policies
had yet emanated from this
engagement process.
Excavator at the Cerro Corona mine in Peru
Lice
nce
to o
pera
te
The Gold Fields Integrated Annual Report 201695
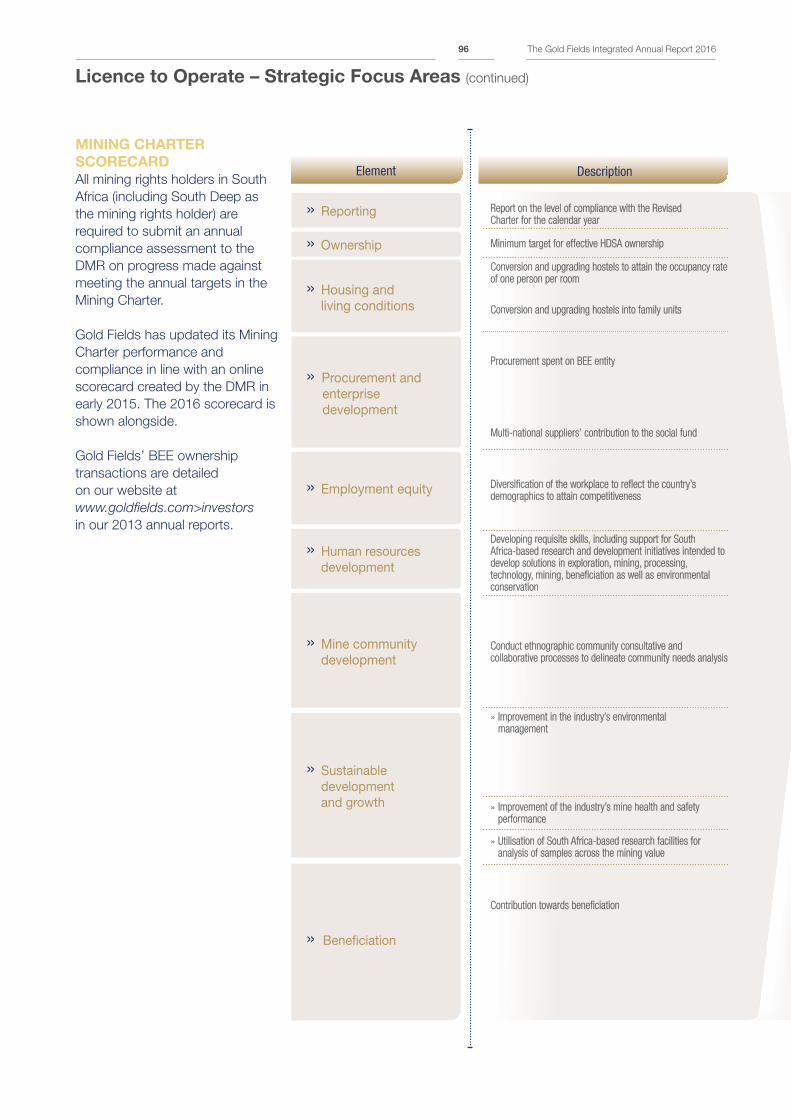
Licence to Operate – Strategic Focus Areas (continued)
MINING CHARTER
SCORECARD
All mining rights holders in South
Africa (including South Deep as
the mining rights holder) are
required to submit an annual
compliance assessment to the
DMR on progress made against
meeting the annual targets in the
Mining Charter.
Gold Fields has updated its Mining
Charter performance and
compliance in line with an online
scorecard created by the DMR in
early 2015. The 2016 scorecard is
shown alongside.
Gold Fields’ BEE ownership
transactions are detailed
on our website at
www.goldfields.com>investors
in our 2013 annual reports.
» Reporting Report on the level of compliance with the Revised Charter for the calendar year
» Ownership Minimum target for effective HDSA ownership
» Housing and living conditions
Conversion and upgrading hostels to attain the occupancy rate of one person per room
Conversion and upgrading hostels into family units
» Procurement and enterprise development
Procurement spent on BEE entity
Multi-national suppliers’ contribution to the social fund
» Employment equity Diversification of the workplace to reflect the country’s demographics to attain competitiveness
» Human resources development
Developing requisite skills, including support for South Africa-based research and development initiatives intended to develop solutions in exploration, mining, processing, technology, mining, beneficiation as well as environmental conservation
» Mine community development
Conduct ethnographic community consultative and collaborative processes to delineate community needs analysis
» Sustainable development and growth
» Improvement in the industry’s environmental management
» Improvement of the industry’s mine health and safety performance
» Utilisation of South Africa-based research facilities for analysis of samples across the mining value
» Beneficiation
Contribution towards beneficiation
Element Description
The Gold Fields Integrated Annual Report 201696
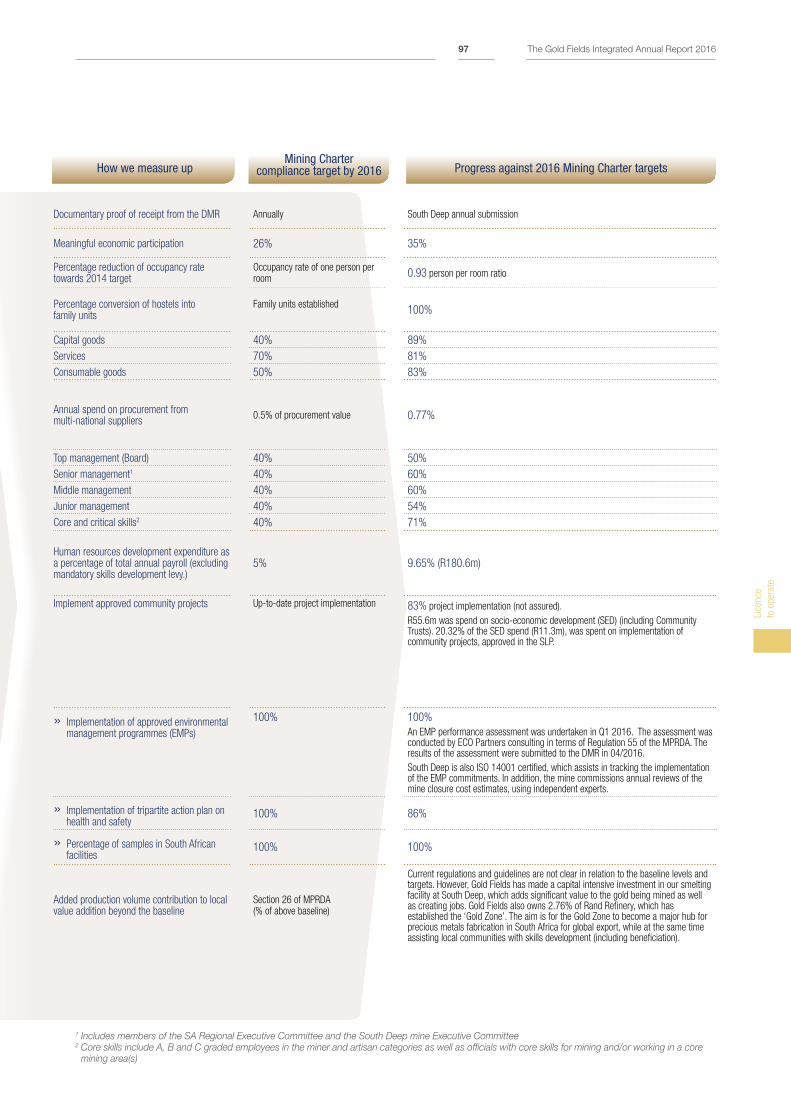
Documentary proof of receipt from the DMR Annually South Deep annual submission
Meaningful economic participation 26% 35%
Percentage reduction of occupancy rate towards 2014 target
Occupancy rate of one person per room
0.93 person per room ratio
Percentage conversion of hostels into family units
Family units established100%
Capital goods 40% 89%
Services 70% 81%
Consumable goods 50% 83%
Annual spend on procurement from multi-national suppliers
0.5% of procurement value 0.77%
Top management (Board) 40% 50%
Senior management1 40% 60%
Middle management 40% 60%
Junior management 40% 54%
Core and critical skills2 40% 71%
Human resources development expenditure as a percentage of total annual payroll (excluding mandatory skills development levy.)
5% 9.65% (R180.6m)
Implement approved community projects Up-to-date project implementation 83% project implementation (not assured).
R55.6m was spend on socio-economic development (SED) (including Community Trusts). 20.32% of the SED spend (R11.3m), was spent on implementation of community projects, approved in the SLP.
» Implementation of approved environmental management programmes (EMPs)
100% 100%
An EMP performance assessment was undertaken in Q1 2016. The assessment was conducted by ECO Partners consulting in terms of Regulation 55 of the MPRDA. The results of the assessment were submitted to the DMR in 04/2016.
South Deep is also ISO 14001 certified, which assists in tracking the implementation of the EMP commitments. In addition, the mine commissions annual reviews of the mine closure cost estimates, using independent experts.
» Implementation of tripartite action plan on health and safety
100% 86%
» Percentage of samples in South African facilities
100% 100%
Added production volume contribution to local value addition beyond the baseline
Section 26 of MPRDA (% of above baseline)
Current regulations and guidelines are not clear in relation to the baseline levels and targets. However, Gold Fields has made a capital intensive investment in our smelting facility at South Deep, which adds significant value to the gold being mined as well as creating jobs. Gold Fields also owns 2.76% of Rand Refinery, which has established the ‘Gold Zone’. The aim is for the Gold Zone to become a major hub for precious metals fabrication in South Africa for global export, while at the same time assisting local communities with skills development (including beneficiation).
1 Includes members of the SA Regional Executive Committee and the South Deep mine Executive Committee2 Core skills include A, B and C graded employees in the miner and artisan categories as well as officials with core skills for mining and/or working in a core
mining area(s)
How we measure upMining Charter
compliance target by 2016 Progress against 2016 Mining Charter targets
Lice
nce
to o
pera
te
The Gold Fields Integrated Annual Report 201697
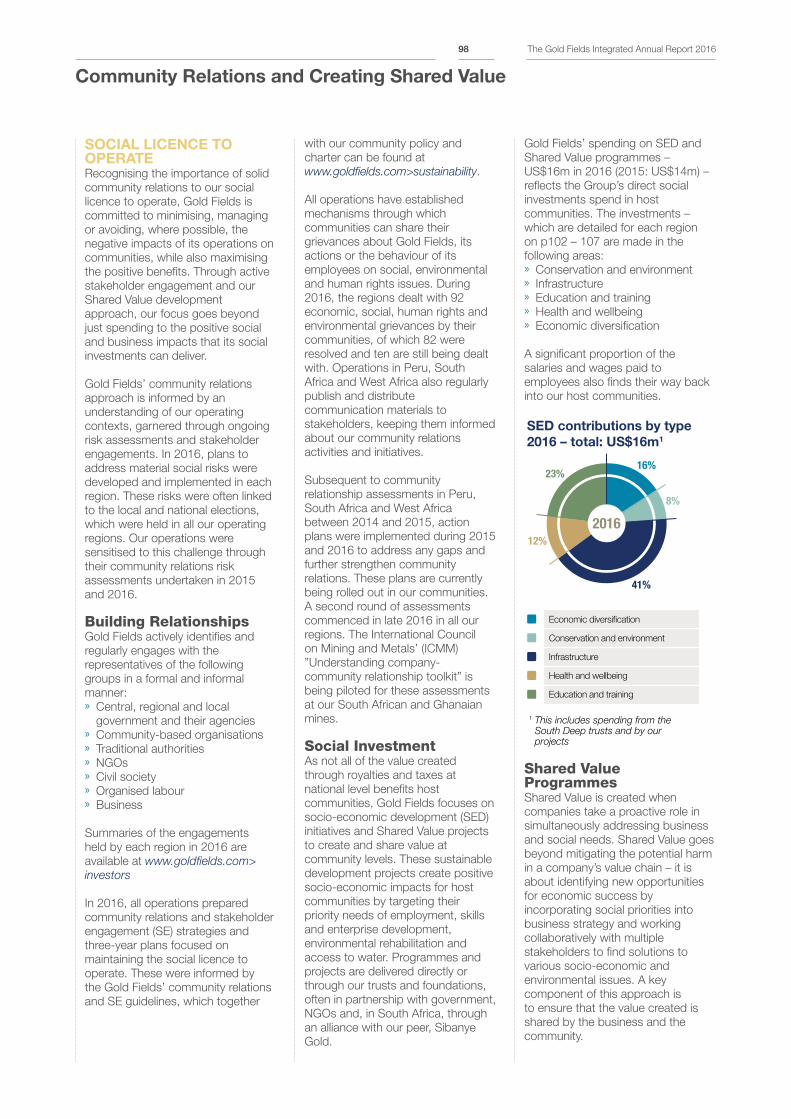
Community Relations and Creating Shared Value
SOCIAL LICENCE TO OPERATERecognising the importance of solid
community relations to our social
licence to operate, Gold Fields is
committed to minimising, managing
or avoiding, where possible, the
negative impacts of its operations on
communities, while also maximising
the positive benefits. Through active
stakeholder engagement and our
Shared Value development
approach, our focus goes beyond
just spending to the positive social
and business impacts that its social
investments can deliver.
Gold Fields’ community relations
approach is informed by an
understanding of our operating
contexts, garnered through ongoing
risk assessments and stakeholder
engagements. In 2016, plans to
address material social risks were
developed and implemented in each
region. These risks were often linked
to the local and national elections,
which were held in all our operating
regions. Our operations were
sensitised to this challenge through
their community relations risk
assessments undertaken in 2015
and 2016.
Building RelationshipsGold Fields actively identifies and
regularly engages with the
representatives of the following
groups in a formal and informal
manner: » Central, regional and local
government and their agencies » Community-based organisations » Traditional authorities » NGOs » Civil society » Organised labour » Business
Summaries of the engagements
held by each region in 2016 are
available at www.goldfields.com>
investors
In 2016, all operations prepared
community relations and stakeholder
engagement (SE) strategies and
three-year plans focused on
maintaining the social licence to
operate. These were informed by
the Gold Fields’ community relations
and SE guidelines, which together
with our community policy and
charter can be found at
www.goldfields.com>sustainability.
All operations have established
mechanisms through which
communities can share their
grievances about Gold Fields, its
actions or the behaviour of its
employees on social, environmental
and human rights issues. During
2016, the regions dealt with 92
economic, social, human rights and
environmental grievances by their
communities, of which 82 were
resolved and ten are still being dealt
with. Operations in Peru, South
Africa and West Africa also regularly
publish and distribute
communication materials to
stakeholders, keeping them informed
about our community relations
activities and initiatives.
Subsequent to community
relationship assessments in Peru,
South Africa and West Africa
between 2014 and 2015, action
plans were implemented during 2015
and 2016 to address any gaps and
further strengthen community
relations. These plans are currently
being rolled out in our communities.
A second round of assessments
commenced in late 2016 in all our
regions. The International Council
on Mining and Metals’ (ICMM)
”Understanding company-
community relationship toolkit” is
being piloted for these assessments
at our South African and Ghanaian
mines.
Social InvestmentAs not all of the value created
through royalties and taxes at
national level benefits host
communities, Gold Fields focuses on
socio-economic development (SED)
initiatives and Shared Value projects
to create and share value at
community levels. These sustainable
development projects create positive
socio-economic impacts for host
communities by targeting their
priority needs of employment, skills
and enterprise development,
environmental rehabilitation and
access to water. Programmes and
projects are delivered directly or
through our trusts and foundations,
often in partnership with government,
NGOs and, in South Africa, through
an alliance with our peer, Sibanye
Gold.
Gold Fields’ spending on SED and
Shared Value programmes –
US$16m in 2016 (2015: US$14m) –
reflects the Group’s direct social
investments spend in host
communities. The investments –
which are detailed for each region
on p102 – 107 are made in the
following areas: » Conservation and environment » Infrastructure » Education and training » Health and wellbeing » Economic diversification
A significant proportion of the
salaries and wages paid to
employees also finds their way back
into our host communities.
16%
8%
41%
12%
2016
23%
Economic diversification
Conservation and environment
Infrastructure
Health and wellbeing
Education and training
SED contributions by type
2016 – total: US$16m1
1 This includes spending from the South Deep trusts and by our projects
Shared Value ProgrammesShared Value is created when
companies take a proactive role in
simultaneously addressing business
and social needs. Shared Value goes
beyond mitigating the potential harm
in a company’s value chain – it is
about identifying new opportunities
for economic success by
incorporating social priorities into
business strategy and working
collaboratively with multiple
stakeholders to find solutions to
various socio-economic and
environmental issues. A key
component of this approach is
to ensure that the value created is
shared by the business and the
community.
The Gold Fields Integrated Annual Report 201698
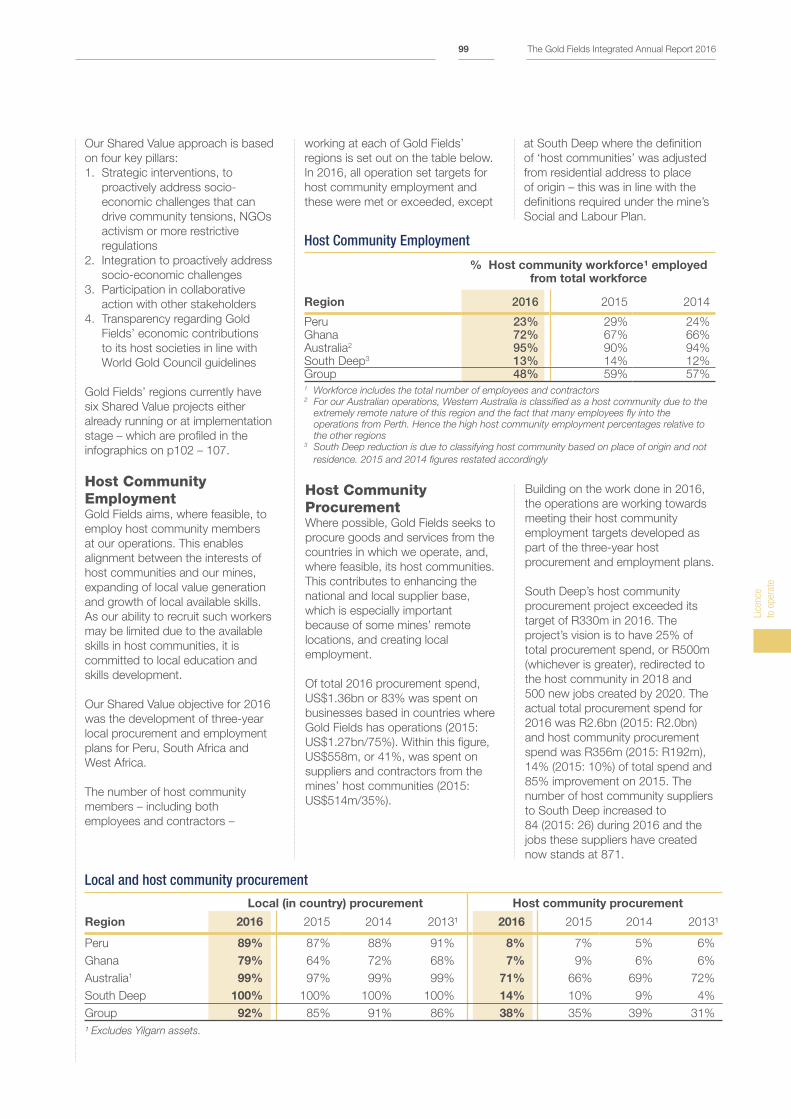
Our Shared Value approach is based
on four key pillars:
1. Strategic interventions, to
proactively address socio-
economic challenges that can
drive community tensions, NGOs
activism or more restrictive
regulations
2. Integration to proactively address
socio-economic challenges
3. Participation in collaborative
action with other stakeholders
4. Transparency regarding Gold
Fields’ economic contributions
to its host societies in line with
World Gold Council guidelines
Gold Fields’ regions currently have
six Shared Value projects either
already running or at implementation
stage – which are profiled in the
infographics on p102 – 107.
Host Community Employment Gold Fields aims, where feasible, to
employ host community members
at our operations. This enables
alignment between the interests of
host communities and our mines,
expanding of local value generation
and growth of local available skills.
As our ability to recruit such workers
may be limited due to the available
skills in host communities, it is
committed to local education and
skills development.
Our Shared Value objective for 2016
was the development of three-year
local procurement and employment
plans for Peru, South Africa and
West Africa.
The number of host community
members – including both
employees and contractors –
working at each of Gold Fields’
regions is set out on the table below.
In 2016, all operation set targets for
host community employment and
these were met or exceeded, except
at South Deep where the definition
of ‘host communities’ was adjusted
from residential address to place
of origin – this was in line with the
definitions required under the mine’s
Social and Labour Plan.
Host Community Employment
% Host community workforce¹ employed from total workforce
Region 2016 2015 2014
Peru 23% 29% 24%Ghana 72% 67% 66%Australia2 95% 90% 94%South Deep3 13% 14% 12%Group 48% 59% 57%1 Workforce includes the total number of employees and contractors2 For our Australian operations, Western Australia is classified as a host community due to the
extremely remote nature of this region and the fact that many employees fly into the
operations from Perth. Hence the high host community employment percentages relative to
the other regions3 South Deep reduction is due to classifying host community based on place of origin and not
residence. 2015 and 2014 figures restated accordingly
Host Community ProcurementWhere possible, Gold Fields seeks to
procure goods and services from the
countries in which we operate, and,
where feasible, its host communities.
This contributes to enhancing the
national and local supplier base,
which is especially important
because of some mines’ remote
locations, and creating local
employment.
Of total 2016 procurement spend,
US$1.36bn or 83% was spent on
businesses based in countries where
Gold Fields has operations (2015:
US$1.27bn/75%). Within this figure,
US$558m, or 41%, was spent on
suppliers and contractors from the
mines’ host communities (2015:
US$514m/35%).
Building on the work done in 2016,
the operations are working towards
meeting their host community
employment targets developed as
part of the three-year host
procurement and employment plans.
South Deep’s host community
procurement project exceeded its
target of R330m in 2016. The
project’s vision is to have 25% of
total procurement spend, or R500m
(whichever is greater), redirected to
the host community in 2018 and
500 new jobs created by 2020. The
actual total procurement spend for
2016 was R2.6bn (2015: R2.0bn)
and host community procurement
spend was R356m (2015: R192m),
14% (2015: 10%) of total spend and
85% improvement on 2015. The
number of host community suppliers
to South Deep increased to
84 (2015: 26) during 2016 and the
jobs these suppliers have created
now stands at 871.
Local and host community procurement
Local (in country) procurement Host community procurement
Region 2016 2015 2014 2013¹ 2016 2015 2014 2013¹
Peru 89% 87% 88% 91% 8% 7% 5% 6%
Ghana 79% 64% 72% 68% 7% 9% 6% 6%
Australia1 99% 97% 99% 99% 71% 66% 69% 72%
South Deep 100% 100% 100% 100% 14% 10% 9% 4%
Group 92% 85% 91% 86% 38% 35% 39% 31%
¹ Excludes Yilgarn assets.
Lice
nce
to o
pera
te
The Gold Fields Integrated Annual Report 201699
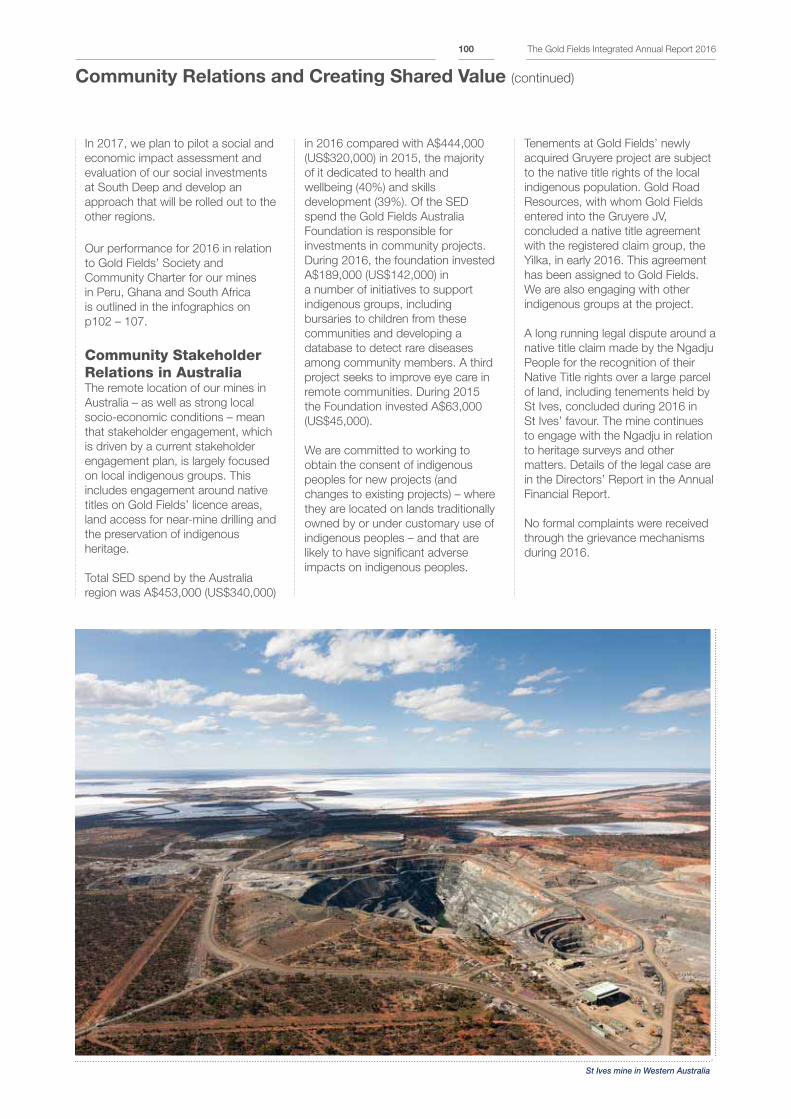
Community Relations and Creating Shared Value (continued)
In 2017, we plan to pilot a social and
economic impact assessment and
evaluation of our social investments
at South Deep and develop an
approach that will be rolled out to the
other regions.
Our performance for 2016 in relation
to Gold Fields’ Society and
Community Charter for our mines
in Peru, Ghana and South Africa
is outlined in the infographics on
p102 – 107.
Community Stakeholder Relations in AustraliaThe remote location of our mines in
Australia – as well as strong local
socio-economic conditions – mean
that stakeholder engagement, which
is driven by a current stakeholder
engagement plan, is largely focused
on local indigenous groups. This
includes engagement around native
titles on Gold Fields’ licence areas,
land access for near-mine drilling and
the preservation of indigenous
heritage.
Total SED spend by the Australia
region was A$453,000 (US$340,000)
in 2016 compared with A$444,000
(US$320,000) in 2015, the majority
of it dedicated to health and
wellbeing (40%) and skills
development (39%). Of the SED
spend the Gold Fields Australia
Foundation is responsible for
investments in community projects.
During 2016, the foundation invested
A$189,000 (US$142,000) in
a number of initiatives to support
indigenous groups, including
bursaries to children from these
communities and developing a
database to detect rare diseases
among community members. A third
project seeks to improve eye care in
remote communities. During 2015
the Foundation invested A$63,000
(US$45,000).
We are committed to working to
obtain the consent of indigenous
peoples for new projects (and
changes to existing projects) – where
they are located on lands traditionally
owned by or under customary use of
indigenous peoples – and that are
likely to have significant adverse
impacts on indigenous peoples.
Tenements at Gold Fields’ newly
acquired Gruyere project are subject
to the native title rights of the local
indigenous population. Gold Road
Resources, with whom Gold Fields
entered into the Gruyere JV,
concluded a native title agreement
with the registered claim group, the
Yilka, in early 2016. This agreement
has been assigned to Gold Fields.
We are also engaging with other
indigenous groups at the project.
A long running legal dispute around a
native title claim made by the Ngadju
People for the recognition of their
Native Title rights over a large parcel
of land, including tenements held by
St Ives, concluded during 2016 in
St Ives’ favour. The mine continues
to engage with the Ngadju in relation
to heritage surveys and other
matters. Details of the legal case are
in the Directors’ Report in the Annual
Financial Report.
No formal complaints were received
through the grievance mechanisms
during 2016.
St Ives mine in Western Australia
The Gold Fields Integrated Annual Report 2016100
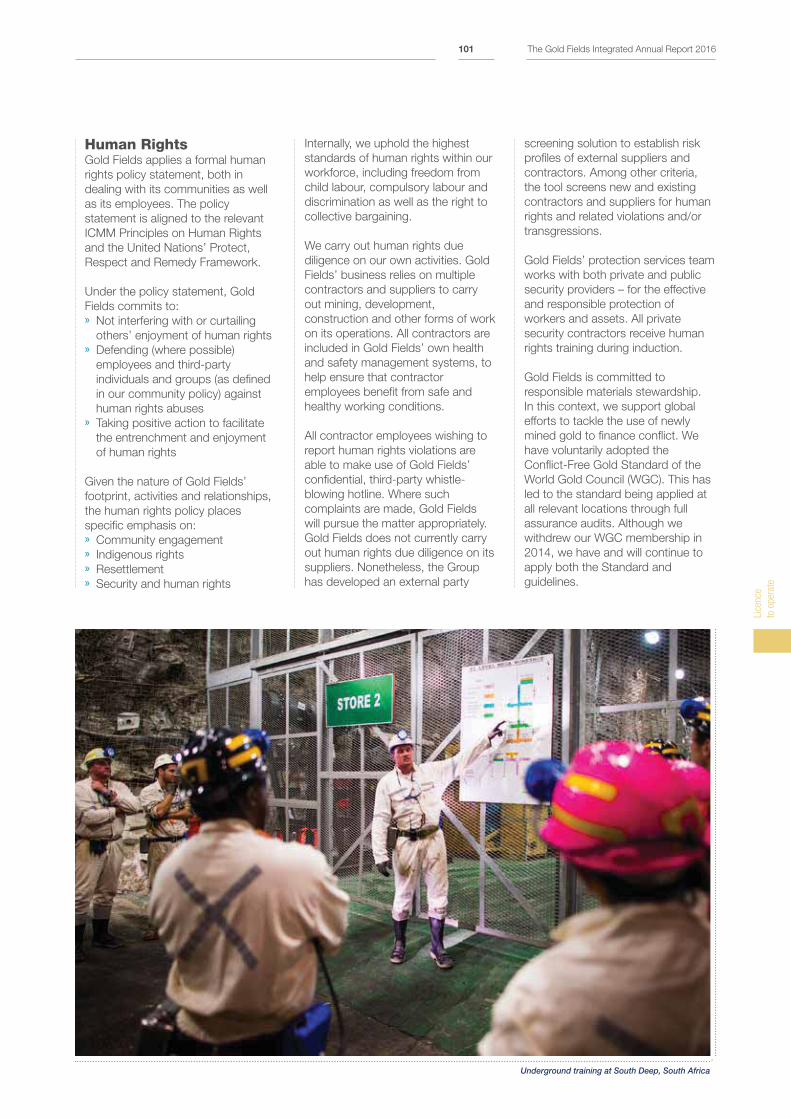
Human Rights Gold Fields applies a formal human
rights policy statement, both in
dealing with its communities as well
as its employees. The policy
statement is aligned to the relevant
ICMM Principles on Human Rights
and the United Nations’ Protect,
Respect and Remedy Framework.
Under the policy statement, Gold
Fields commits to: » Not interfering with or curtailing
others’ enjoyment of human rights » Defending (where possible)
employees and third-party
individuals and groups (as defined
in our community policy) against
human rights abuses » Taking positive action to facilitate
the entrenchment and enjoyment
of human rights
Given the nature of Gold Fields’
footprint, activities and relationships,
the human rights policy places
specific emphasis on: » Community engagement » Indigenous rights » Resettlement » Security and human rights
Internally, we uphold the highest
standards of human rights within our
workforce, including freedom from
child labour, compulsory labour and
discrimination as well as the right to
collective bargaining.
We carry out human rights due
diligence on our own activities. Gold
Fields’ business relies on multiple
contractors and suppliers to carry
out mining, development,
construction and other forms of work
on its operations. All contractors are
included in Gold Fields’ own health
and safety management systems, to
help ensure that contractor
employees benefit from safe and
healthy working conditions.
All contractor employees wishing to
report human rights violations are
able to make use of Gold Fields’
confidential, third-party whistle-
blowing hotline. Where such
complaints are made, Gold Fields
will pursue the matter appropriately.
Gold Fields does not currently carry
out human rights due diligence on its
suppliers. Nonetheless, the Group
has developed an external party
screening solution to establish risk
profiles of external suppliers and
contractors. Among other criteria,
the tool screens new and existing
contractors and suppliers for human
rights and related violations and/or
transgressions.
Gold Fields’ protection services team
works with both private and public
security providers – for the effective
and responsible protection of
workers and assets. All private
security contractors receive human
rights training during induction.
Gold Fields is committed to
responsible materials stewardship.
In this context, we support global
efforts to tackle the use of newly
mined gold to finance conflict. We
have voluntarily adopted the
Conflict-Free Gold Standard of the
World Gold Council (WGC). This has
led to the standard being applied at
all relevant locations through full
assurance audits. Although we
withdrew our WGC membership in
2014, we have and will continue to
apply both the Standard and
guidelines.
Underground training at South Deep, South Africa
Lice
nce
to o
pera
te
The Gold Fields Integrated Annual Report 2016101
Community relations in South Africa
» The South Deep mine is located near Westonaria on the West Rand of the Gauteng province. The West Rand is home to many gold mines, some of which have been operating for decades. After the 2016 local government elections Westonaria was merged with Randfontein to form the Rand West City municipality. Within the municipality there are 10 host communities that are impacted by South Deep, with a population of about 111,000 people (2011). Residents live in formal and informal settlements.
» The area has high levels of poverty – formal unemployment is at 29.5% and youth unemployment at 39%, higher than the national average. Service delivery to these communities is poor and there is a history of social unrest against local government. While local government elections passed without significant incidents, animosity exists between various community organisations, loosely aligned to political parties.
» Economic dependency on mining is high with a single employed individual in the sector supporting on average eight dependants.
» All mining rights holders in South Africa (including South Deep) are required to submit an annual compliance assessment to government on progress made against meeting the annual targets in the Social and Labour Plan (SLP) component of the Mining Charter. A new draft Charter was released for comment in 2016 and consultation between the mining industry and government are ongoing.
BUILD RELATIONSHIP AND TRUST
Project 1: Host community procurementThe South Deep Host Community Project vision is the greater of R500m or 25% of
total procurement spend redirected to the host community in 2018 and 500 new
jobs created by 2020. Host community procurement spend in 2016 was R356m.
For details of the project see p99.
Benefit to the community:Host community procurement not only creates jobs and services in our host
communities, thus contributing in our efforts to promote our ‘social licence to
operate’, but also improves the skills set of residents. This enables them to seek
alternative employment or grow their enterprises.
Benefit to Gold Fields:Host community procurement boosts the local supplier base to the mine, enabling
us to seek out more competitive services with cost benefits for the operation.
Other material value sharing and creation projects: » An agriculture programme under the Gold Alliance started in 2016, involving the use
of mine land to support community employment in agriculture. Three farms have been established in partnership with Servigraph and AfriGrow Development. Cost: R10m (US$680,000) (2016)
Impact: − Reduce unemployment, especially among youth in host communities. Currently
about 58 community members work on the farm − Diversity the local economy from mining to agriculture − Enable the productive use of disused mine land
» Thusanang Clinic, an eight-roomed prefabricated structure was constructed and equipped in Thusanang in partnership with the provincial Department of Health, the local municipality and the Thusanang Development Trust. Cost: R1.5m (US$102,000) (2016)
Impact: − Residents of Thusanang have access to healthcare − During construction, 16 temporary jobs for host community residents and three
SMMEs were empowered by contracts for construction services − Nine permanent jobs for people living in Thusanang
CONTEXT
» In 2016, South Deep completed its community relations and stakeholder engagement strategy, finalised a three-year plan and commenced implementation
» Community and government engagements are ongoing with various formal and informal meetings
» In alliance with Sibanye Gold, Gold Fields constituted a Round Table with representatives from local government and communities to promote socio-economic development in the host communities
» 12 grievances of a social nature were received of which 11 were resolved and one is outstanding
Project 2: Education and skills training Since 2014, South Deep and its community trusts have been investing in a range of education and skills development projects in the host and labour sending communities. These projects range from early childhood development (ECD) to tertiary education and are mostly undertaken in partnership with government and other non-profit organisations.
During 2016 the following investments were made:» Full bursaries were awarded to 34 students to study at
institutions of higher learning
» Scholarships were awarded for 44 pupils to attend private
schools
» Additional maths and science tuition to learners and post-
matric students
» Classes to employees and community members to obtain or upgrade their Grade
12 certification
» Partial payment of fees for pre-primary school learners
» Payment of ECD teachers’ salaries and development of an ECD centre
» Tuition, accommodation and transport fees for learners at TVET colleague
Benefit to the communityApart from the obvious benefit derived by the individual students, the broader community benefits is that an increased proportion of their youth is likely to receive tertiary education and ultimately find employment.
Benefit to Gold Fields The programme provides Gold Fields with a much-needed local skills pipeline of individuals with maths and science-related degrees.
Skills training at South Deep
CREATE AND SHARE VALUE
Community investment at South Deep is undertaken by the mine through its SLP as
well as beyond-compliance socio-economic development efforts. These are undertaken
directly by the mine, through the Gold Alliance – an alliance between Gold Fields and
Sibanye Gold – and through the mine’s community trusts – the South Deep Education
Trust, the South Deep Community Trusts and the Westonaria Community Trust.
The Gold Fields Integrated Annual Report 2016102
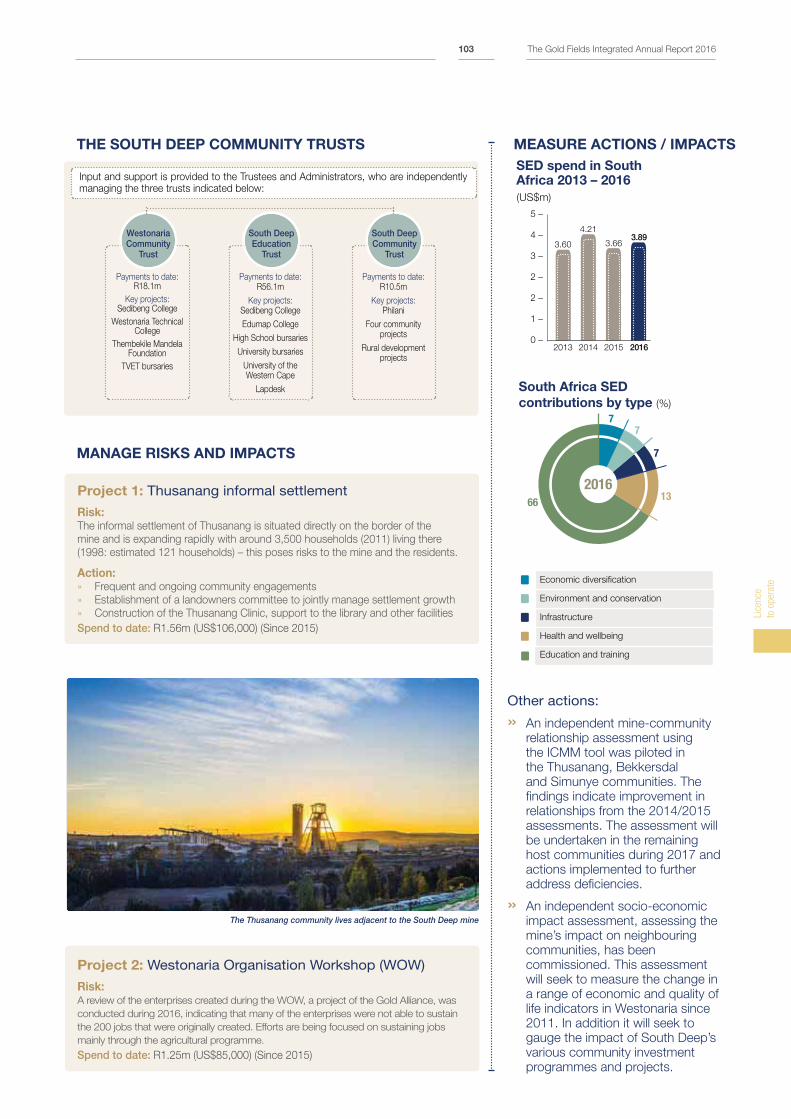
THE SOUTH DEEP COMMUNITY TRUSTS
MANAGE RISKS AND IMPACTS
Project 2: Westonaria Organisation Workshop (WOW)
Risk:A review of the enterprises created during the WOW, a project of the Gold Alliance, was
conducted during 2016, indicating that many of the enterprises were not able to sustain
the 200 jobs that were originally created. Efforts are being focused on sustaining jobs
mainly through the agricultural programme.
Spend to date: R1.25m (US$85,000) (Since 2015)
MEASURE ACTIONS / IMPACTS
Other actions:
» An independent mine-community
relationship assessment using
the ICMM tool was piloted in
the Thusanang, Bekkersdal
and Simunye communities. The
findings indicate improvement in
relationships from the 2014/2015
assessments. The assessment will
be undertaken in the remaining
host communities during 2017 and
actions implemented to further
address deficiencies.
» An independent socio-economic
impact assessment, assessing the
mine’s impact on neighbouring
communities, has been
commissioned. This assessment
will seek to measure the change in
a range of economic and quality of
life indicators in Westonaria since
2011. In addition it will seek to
gauge the impact of South Deep’s
various community investment
programmes and projects.
Project 1: Thusanang informal settlement
Risk: The informal settlement of Thusanang is situated directly on the border of the
mine and is expanding rapidly with around 3,500 households (2011) living there
(1998: estimated 121 households) – this poses risks to the mine and the residents.
Action: » Frequent and ongoing community engagements
» Establishment of a landowners committee to jointly manage settlement growth
» Construction of the Thusanang Clinic, support to the library and other facilities
Spend to date: R1.56m (US$106,000) (Since 2015)
7
66
7
7
132016
Economic diversification
Environment and conservation
Infrastructure
Health and wellbeing
Education and training
South Africa SED
contributions by type (%)
SED spend in South Africa 2013 – 2016
(US$m)
5 –
4 –
3 –
2 –
2 –
1 –
0 –2013 2014 2015 2016
3.60
4.21
3.663.89
Payments to date: R18.1m
Key projects: Sedibeng College
Westonaria Technical College
Thembekile Mandela Foundation
TVET bursaries
Westonaria Community
Trust
Payments to date: R56.1m
Key projects: Sedibeng College
Edumap College
High School bursaries
University bursaries
University of the Western Cape
Lapdesk
South Deep Education
Trust
Payments to date: R10.5m
Key projects: Philani
Four community projects
Rural development projects
South Deep Community
Trust
Input and support is provided to the Trustees and Administrators, who are independently managing the three trusts indicated below:
The Thusanang community lives adjacent to the South Deep mine
Lice
nce
to o
pera
te
The Gold Fields Integrated Annual Report 2016103
Community relations in Ghana
» In 2016, Ghana held peaceful general elections that saw the New Patriotic Party move from main opposition to become the ruling party. This is unlikely to impact Gold Fields’ operations, especially from a fiscal perspective, following the signing of the Development Agreement with the Ghana government in 2016.
» Tarkwa and Damang mines are located in the Western Region along with a few other large-scale gold mines. Mine-community tensions exist in mining areas, the worst example of which was when illegal miners (galamsey operators) invaded AngloGold Ashanti’s Obuasi concession in 2015 and 2016.
» Tarkwa is hosted by the Tarkwa town and eight host communities with approximately 50,000 inhabitants. Damang has nine primary host communities, which are home to about 15,00 people. Traditionally, these communities are under jurisdiction of the Wassa Fiase Traditional Council. Politically, Tarkwa is within the Tarkwa/Nsuaem Metropolis (local authority), while Damang is in the Prestea/Huni-Valley District (local authority).
» Both Tarkwa and Damang are peri-urban communities, with access to electricity, health facilities, and other social infrastructure, with Tarkwa being the more developed of the two. Many of the youth in Damang are engaged in agriculture, or work for the mine, either directly or through contractors. A significant number are also engaged in artisanal mining or in the informal sector.
CREATE AND SHARE VALUE
BUILD RELATIONSHIP AND TRUST
Project 1: Road rehabilitationGold Fields Ghana, in partnership with the government of
Ghana is upgrading the 29km road between Tarkwa and
Damang and paving the road surface in bitumen. The total
cost of this project is estimated at US$17m over two
years.
During 2016 the following progress was made:
» A cooperation agreement was signed between Gold Fields and Ghana Highways
Authority
» Contracts were awarded to three contractors for rehabilitation work to be carried
out simultaneously and construction commenced
» Contractors are prioritising local employment as part of their recruitment policy.
» A socio-economic baseline assessment was undertaken
Benefit to the community:During construction of the road, job opportunities will primarily go to members of our
impacted communities. The improved road infrastructure will benefit all public road users as
travel times, vehicular accidents and vehicle maintenance costs will be reduced. Roadside
communities will no longer experience dust emissions since the road will be surfaced.
Benefit to Gold Fields:Gold Fields will save on the cost of transport as the maintenance of vehicles transporting
labour, goods and materials will be reduced. Road maintenance costs will also be reduced.
The improved infrastructure will also reduce employees’ travel time by 35 minutes per journey,
could limit driver fatigue and will enable emergency services to operate more efficiently.
Other material creation projects: » Construction of a laboratory at the University of Mines and Technology in Tarkwa. Impact: − Improved academic education − A quality pipeline of future mine employees
Cost: US$55,000 (2016). This is the cost of the first phase of the project
» Scholarships and bursaries for tuition and residence for qualifying pupils and students in the mines host communities. Impact: − Improved education and literacy in host communities
Cost: US$136,000 (2016).
» Numerous health, santitation and water supply, road infrastructure projects were implemented through the GFG Foundation.
CONTEXT
» In 2016, the action plan to address gaps in the 2015 mine-community relationship assessment, was implemented. A community employment committee at each mine was established to promote host community employment and transparency.
» Formal and informal community and government engagements are ongoing regarding community development. Mine community consultative committee meetings are held quarterly.
» Gold Fields has worked with an independent consultant to prepare its community relations and stakeholder engagement strategy and three-year implementation plan.
» 64 grievances of an environmental, social and human rights nature were received by both mines through their formal grievance mechanism – 60 resolved, four outstanding.
Project 2: Youth employment in agricultureThe multi-year Youth in Horticulture Production (YouHop) programme, aimed at
generating employment and improving incomes for the youth in host communities,
was started in 2016. YouHop is a partnership between the German Development
Cooperation (GIZ) and the Gold Fields Ghana Foundation. The Youth in Organic
Horticulture Programme (YouHop) is targeting 1,000 community youth, along the
entire horticulture value chain – from training, to ICT systems, financing and green
label certification. YouHop seeks to be self-funding after three years, when the
partners exit.
Impact:» Reduce youth unemployment in Tarkwa and Damang mines’ host communities
and reduce dependency on the mines
» Improve agricultural production in the area
» Improve incomes of community youth
Cost: The two organisations are investing a combined €800,000 (US$850,000) over
a three-year period.
Road repair near Tarkwa
The Gold Fields Integrated Annual Report 2016104
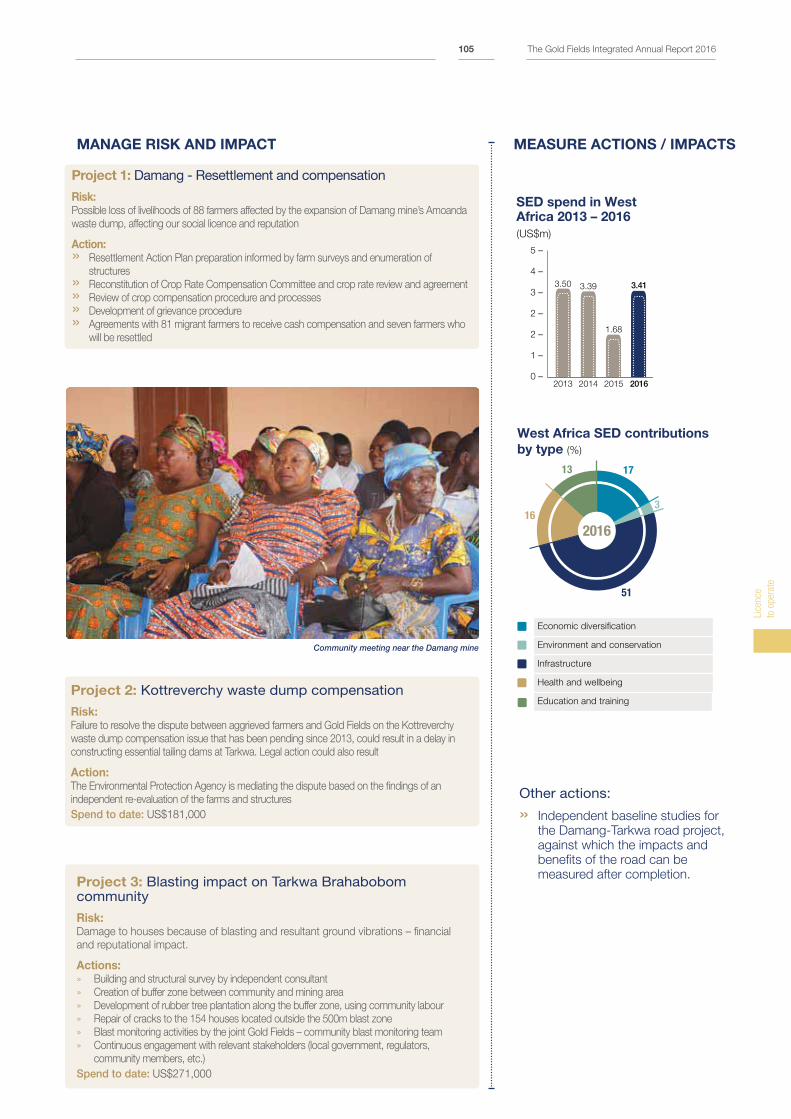
MANAGE RISK AND IMPACT
Project 2: Kottreverchy waste dump compensation
Risk:Failure to resolve the dispute between aggrieved farmers and Gold Fields on the Kottreverchy
waste dump compensation issue that has been pending since 2013, could result in a delay in
constructing essential tailing dams at Tarkwa. Legal action could also result
Action: The Environmental Protection Agency is mediating the dispute based on the findings of an
independent re-evaluation of the farms and structures
Spend to date: US$181,000
Project 3: Blasting impact on Tarkwa Brahabobom community
Risk:Damage to houses because of blasting and resultant ground vibrations – financial
and reputational impact.
Actions:» Building and structural survey by independent consultant
» Creation of buffer zone between community and mining area
» Development of rubber tree plantation along the buffer zone, using community labour
» Repair of cracks to the 154 houses located outside the 500m blast zone
» Blast monitoring activities by the joint Gold Fields – community blast monitoring team
» Continuous engagement with relevant stakeholders (local government, regulators,
community members, etc.)
Spend to date: US$271,000
MEASURE ACTIONS / IMPACTS
Other actions:
» Independent baseline studies for
the Damang-Tarkwa road project,
against which the impacts and
benefits of the road can be
measured after completion.
Project 1: Damang - Resettlement and compensation
Risk: Possible loss of livelihoods of 88 farmers affected by the expansion of Damang mine’s Amoanda
waste dump, affecting our social licence and reputation
Action: » Resettlement Action Plan preparation informed by farm surveys and enumeration of
structures
» Reconstitution of Crop Rate Compensation Committee and crop rate review and agreement
» Review of crop compensation procedure and processes
» Development of grievance procedure
» Agreements with 81 migrant farmers to receive cash compensation and seven farmers who
will be resettled
1713
3
51
16
2016
Economic diversification
Environment and conservation
Infrastructure
Health and wellbeing
Education and training
West Africa SED contributions
by type (%)
SED spend in West Africa 2013 – 2016
(US$m)
2013 2014 2015 2016
3.50 3.39
1.68
3.41
5 –
4 –
3 –
2 –
2 –
1 –
0 –
Community meeting near the Damang mine
Lice
nce
to o
pera
te
The Gold Fields Integrated Annual Report 2016105
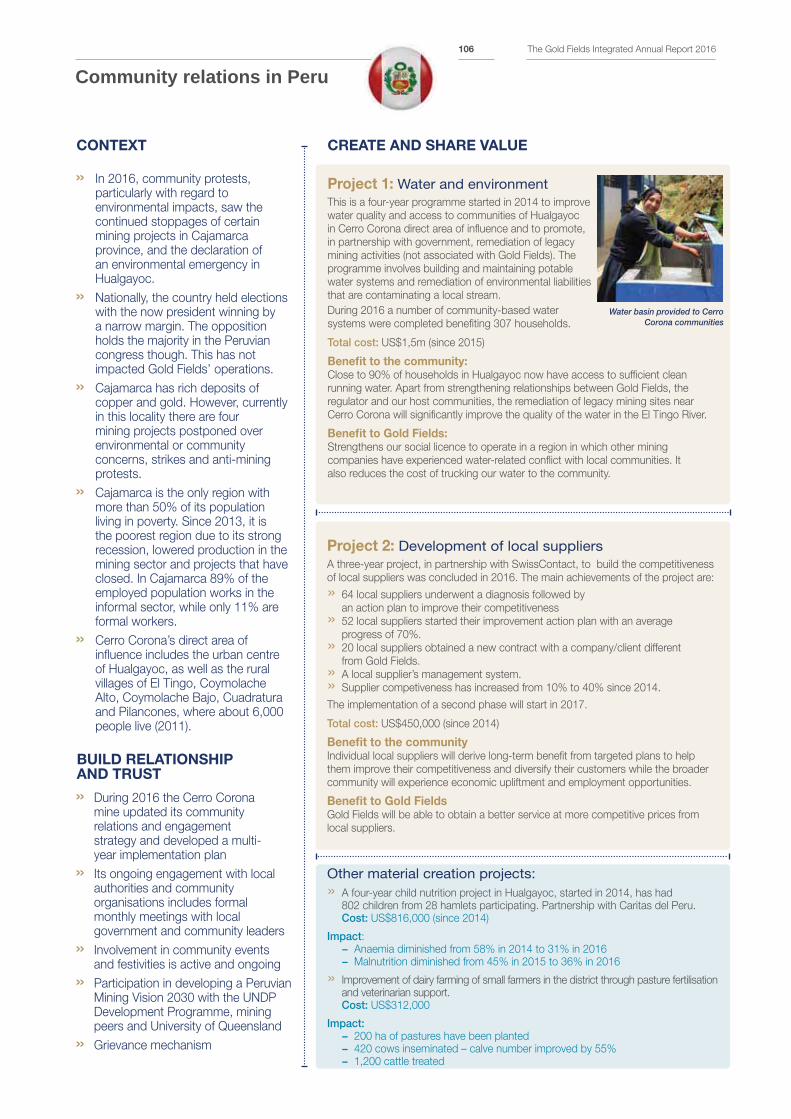
Community relations in Peru
» In 2016, community protests, particularly with regard to environmental impacts, saw the continued stoppages of certain mining projects in Cajamarca province, and the declaration of an environmental emergency in Hualgayoc.
» Nationally, the country held elections with the now president winning by a narrow margin. The opposition holds the majority in the Peruvian congress though. This has not impacted Gold Fields’ operations.
» Cajamarca has rich deposits of copper and gold. However, currently in this locality there are four mining projects postponed over environmental or community concerns, strikes and anti-mining protests.
» Cajamarca is the only region with more than 50% of its population living in poverty. Since 2013, it is the poorest region due to its strong recession, lowered production in the mining sector and projects that have closed. In Cajamarca 89% of the employed population works in the informal sector, while only 11% are formal workers.
» Cerro Corona’s direct area of influence includes the urban centre of Hualgayoc, as well as the rural villages of El Tingo, Coymolache Alto, Coymolache Bajo, Cuadratura and Pilancones, where about 6,000 people live (2011).
CREATE AND SHARE VALUE
BUILD RELATIONSHIP AND TRUST
Project 1: Water and environmentThis is a four-year programme started in 2014 to improve
water quality and access to communities of Hualgayoc
in Cerro Corona direct area of influence and to promote,
in partnership with government, remediation of legacy
mining activities (not associated with Gold Fields). The
programme involves building and maintaining potable
water systems and remediation of environmental liabilities
that are contaminating a local stream.
During 2016 a number of community-based water
systems were completed benefiting 307 households.
Total cost: US$1,5m (since 2015)
Benefit to the community:Close to 90% of households in Hualgayoc now have access to sufficient clean
running water. Apart from strengthening relationships between Gold Fields, the
regulator and our host communities, the remediation of legacy mining sites near
Cerro Corona will significantly improve the quality of the water in the El Tingo River.
Benefit to Gold Fields:Strengthens our social licence to operate in a region in which other mining
companies have experienced water-related conflict with local communities. It
also reduces the cost of trucking our water to the community.
Water basin provided to Cerro Corona communities
Other material creation projects: » A four-year child nutrition project in Hualgayoc, started in 2014, has had 802 children from 28 hamlets participating. Partnership with Caritas del Peru. Cost: US$816,000 (since 2014)
Impact: − Anaemia diminished from 58% in 2014 to 31% in 2016 − Malnutrition diminished from 45% in 2015 to 36% in 2016
» Improvement of dairy farming of small farmers in the district through pasture fertilisation and veterinarian support. Cost: US$312,000
Impact: − 200 ha of pastures have been planted − 420 cows inseminated – calve number improved by 55% − 1,200 cattle treated
CONTEXT
» During 2016 the Cerro Corona mine updated its community relations and engagement strategy and developed a multi- year implementation plan
» Its ongoing engagement with local authorities and community organisations includes formal monthly meetings with local government and community leaders
» Involvement in community events and festivities is active and ongoing
» Participation in developing a Peruvian Mining Vision 2030 with the UNDP Development Programme, mining peers and University of Queensland
» Grievance mechanism
Project 2: Development of local suppliersA three-year project, in partnership with SwissContact, to build the competitiveness
of local suppliers was concluded in 2016. The main achievements of the project are:
» 64 local suppliers underwent a diagnosis followed by
an action plan to improve their competitiveness
» 52 local suppliers started their improvement action plan with an average
progress of 70%.
» 20 local suppliers obtained a new contract with a company/client different
from Gold Fields.
» A local supplier’s management system.
» Supplier competiveness has increased from 10% to 40% since 2014.
The implementation of a second phase will start in 2017.
Total cost: US$450,000 (since 2014)
Benefit to the communityIndividual local suppliers will derive long-term benefit from targeted plans to help
them improve their competitiveness and diversify their customers while the broader
community will experience economic upliftment and employment opportunities.
Benefit to Gold Fields Gold Fields will be able to obtain a better service at more competitive prices from
local suppliers.
The Gold Fields Integrated Annual Report 2016106
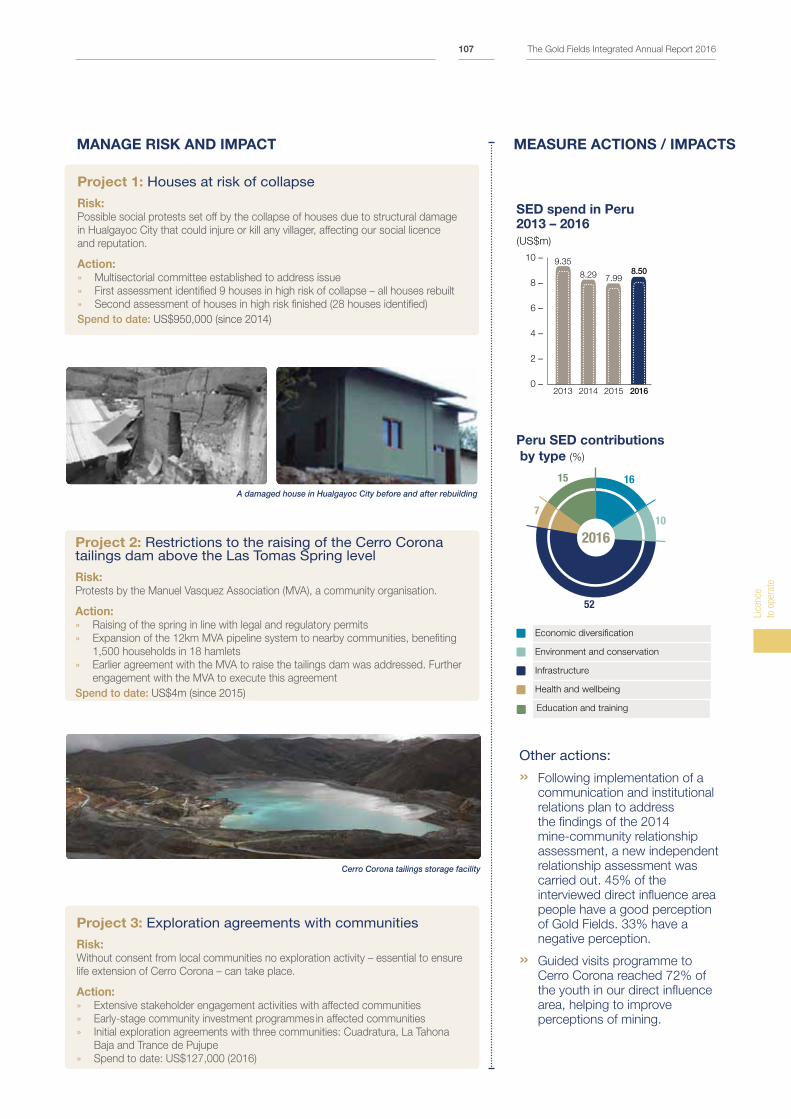
MANAGE RISK AND IMPACT
Project 2: Restrictions to the raising of the Cerro Corona tailings dam above the Las Tomas Spring level
Risk:Protests by the Manuel Vasquez Association (MVA), a community organisation.
Action: » Raising of the spring in line with legal and regulatory permits
» Expansion of the 12km MVA pipeline system to nearby communities, benefiting
1,500 households in 18 hamlets
» Earlier agreement with the MVA to raise the tailings dam was addressed. Further
engagement with the MVA to execute this agreement
Spend to date: US$4m (since 2015)
Project 3: Exploration agreements with communities
Risk: Without consent from local communities no exploration activity – essential to ensure
life extension of Cerro Corona – can take place.
Action: » Extensive stakeholder engagement activities with affected communities
» Early-stage community investment programmes in affected communities
» Initial exploration agreements with three communities: Cuadratura, La Tahona
Baja and Trance de Pujupe
» Spend to date: US$127,000 (2016)
MEASURE ACTIONS / IMPACTS
Other actions:
» Following implementation of a
communication and institutional
relations plan to address
the findings of the 2014
mine-community relationship
assessment, a new independent
relationship assessment was
carried out. 45% of the
interviewed direct influence area
people have a good perception
of Gold Fields. 33% have a
negative perception.
» Guided visits programme to
Cerro Corona reached 72% of
the youth in our direct influence
area, helping to improve
perceptions of mining.
Project 1: Houses at risk of collapse
Risk: Possible social protests set off by the collapse of houses due to structural damage
in Hualgayoc City that could injure or kill any villager, affecting our social licence
and reputation.
Action: » Multisectorial committee established to address issue
» First assessment identified 9 houses in high risk of collapse – all houses rebuilt
» Second assessment of houses in high risk finished (28 houses identified)
Spend to date: US$950,000 (since 2014)
1615
10
52
7
2016
Economic diversification
Environment and conservation
Infrastructure
Health and wellbeing
Education and training
Peru SED contributions
by type (%)
SED spend in Peru2013 – 2016
(US$m)
10 –
8 –
6 –
4 –
2 –
0 –2013 2014 2015 2016
9.35
8.29 7.998.50
Cerro Corona tailings storage facility
A damaged house in Hualgayoc City before and after rebuilding
Lice
nce
to o
pera
te
The Gold Fields Integrated Annual Report 2016107
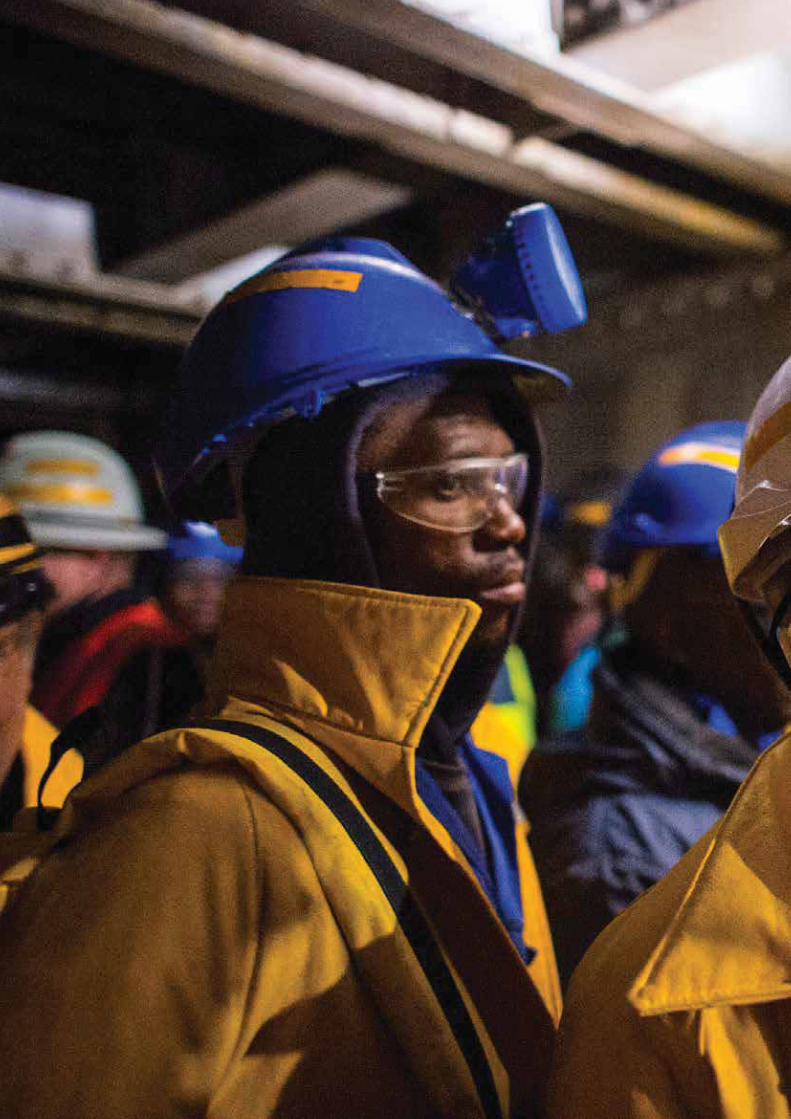
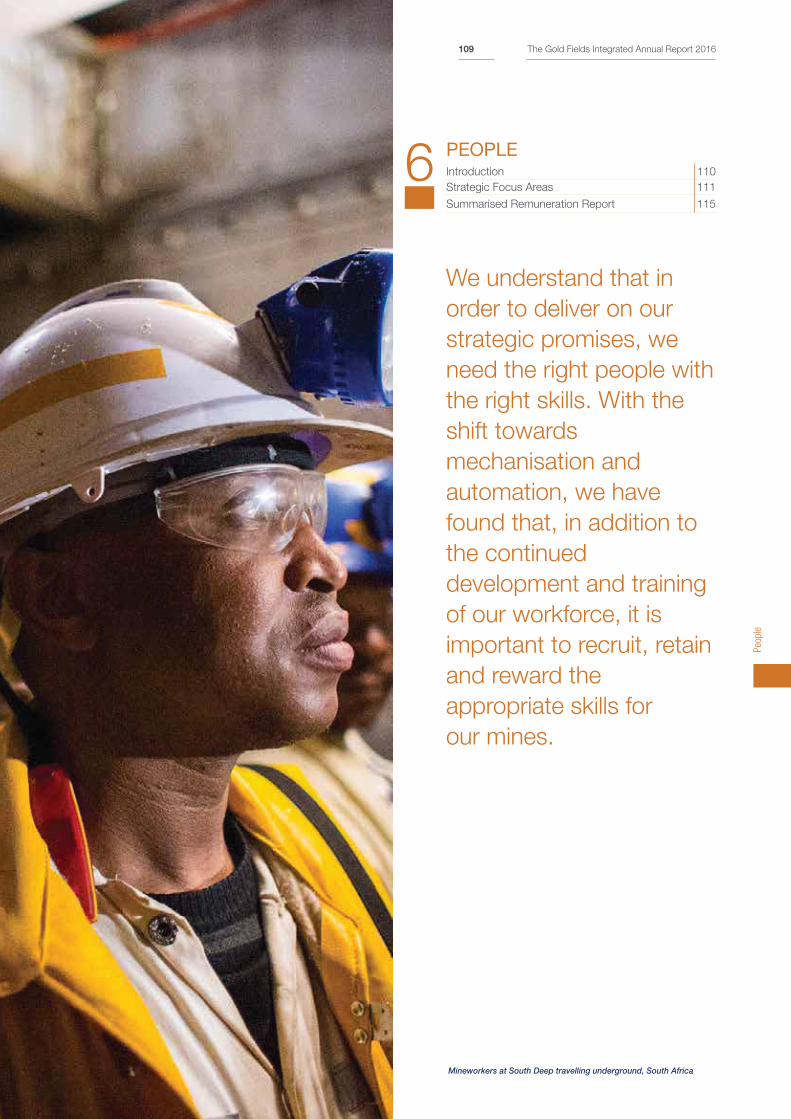
6PEOPLEIntroduction 110
Strategic Focus Areas 111
Summarised Remuneration Report 115
We understand that in
order to deliver on our
strategic promises, we
need the right people with
the right skills. With the
shift towards
mechanisation and
automation, we have
found that, in addition to
the continued
development and training
of our workforce, it is
important to recruit, retain
and reward the
appropriate skills for
our mines.
Mineworkers at South Deep travelling underground, South Africa
Peo
ple
The Gold Fields Integrated Annual Report 2016109
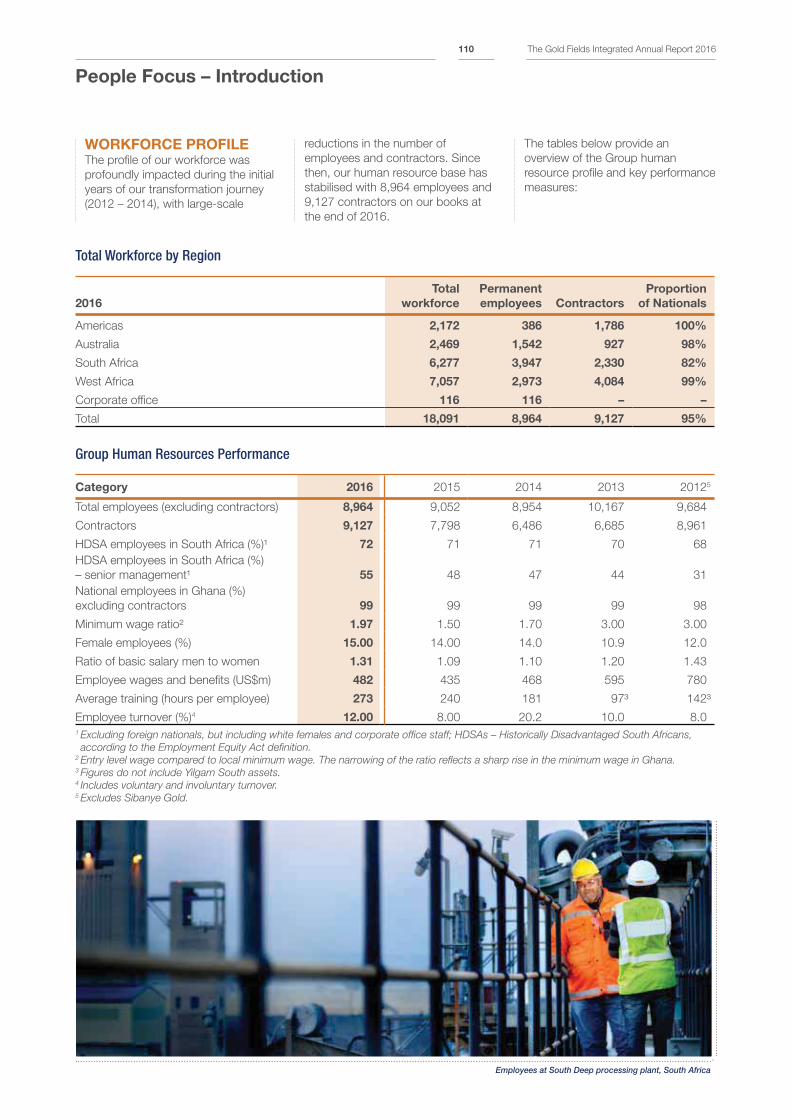
People Focus – Introduction
WORKFORCE PROFILE The profile of our workforce was
profoundly impacted during the initial
years of our transformation journey
(2012 – 2014), with large-scale
reductions in the number of
employees and contractors. Since
then, our human resource base has
stabilised with 8,964 employees and
9,127 contractors on our books at
the end of 2016.
The tables below provide an
overview of the Group human
resource profile and key performance
measures:
Total Workforce by Region
2016
Total
workforce
Permanent
employees Contractors
Proportion
of Nationals
Americas 2,172 386 1,786 100%
Australia 2,469 1,542 927 98%
South Africa 6,277 3,947 2,330 82%
West Africa 7,057 2,973 4,084 99%
Corporate office 116 116 – –
Total 18,091 8,964 9,127 95%
Group Human Resources Performance
Category 2016 2015 2014 2013 20125
Total employees (excluding contractors) 8,964 9,052 8,954 10,167 9,684
Contractors 9,127 7,798 6,486 6,685 8,961
HDSA employees in South Africa (%)¹ 72 71 71 70 68
HDSA employees in South Africa (%)
– senior management¹ 55 48 47 44 31
National employees in Ghana (%)
excluding contractors 99 99 99 99 98
Minimum wage ratio² 1.97 1.50 1.70 3.00 3.00
Female employees (%) 15.00 14.00 14.0 10.9 12.0
Ratio of basic salary men to women 1.31 1.09 1.10 1.20 1.43
Employee wages and benefits (US$m) 482 435 468 595 780
Average training (hours per employee) 273 240 181 97³ 142³
Employee turnover (%)4 12.00 8.00 20.2 10.0 8.0
1 Excluding foreign nationals, but including white females and corporate office staff; HDSAs – Historically Disadvantaged South Africans,
according to the Employment Equity Act definition.2 Entry level wage compared to local minimum wage. The narrowing of the ratio reflects a sharp rise in the minimum wage in Ghana.3 Figures do not include Yilgarn South assets.4 Includes voluntary and involuntary turnover.5 Excludes Sibanye Gold.
Employees at South Deep processing plant, South Africa
The Gold Fields Integrated Annual Report 2016110
People Focus – Strategic Focus Areas
Gold Fields’ people and the
development of a high-performance
culture are critical to achieving the
following top business objectives:
1. Deliver South Deep
2. Grow a quality portfolio of assets
and increase reserve life
3. Improve investor confidence
4. Build strong community
relationships
The Company also needs to address
the two most pressing people-
related risks – the safety and health
of employees and the retention of
skilled staff in key positions (see Gold
Fields’ top 10 risks on p42).
SUPPORTING BUSINESS
OBJECTIVES AND
MITIGATING KEY RISKSDelivering South Deep Failure to deliver South Deep is Gold
Fields’ top risk, and having the right
people in place is a critical mitigating
factor. Commencing in early 2015
South Deep recruited 164 skilled
employees, most of them from the
platinum sector, which has a similar
mechanised mining skills set. The
key core mining and engineering
positions have been filled.
During 2016, South Deep launched
a comprehensive transformation
project that will ensure the mine
develops the skills, culture and
capacity to deliver on its strategic
objectives, while simultaneously
complying with the requirements
of the Mining Charter and meeting
its Social and Labour Plan
commitments. With a strong focus
on employment equity and diversity,
the project also seeks to mitigate the
labour relations risk at the mine.
The table below outlines the key
transformation focus areas and the
initiatives undertaken during the year
to ensure delivery at South Deep:
Focus area Goal Plans and delivery to date
Employment equity Change the employee profile of management
to be more representative of national
demographics
Our employment equity project was finalised.
The project will identify, develop and mentor
high potential Historically Disadvantaged South
African employees and map their development
to potential future leadership roles.
Organisational
climate
Create a climate that embraces diversity and
the values of Gold Fields
A diversity workshop was piloted to build
cultural sensitivity and drive collaboration
between members of a diverse workforce.
People management
practices
Embed talent management, succession
planning, training and development, career
progression, mentoring and coaching policies,
practices, processes and systems
We conducted a full management talent
review which will inform the identification of
successors for key roles, with a focus on
HDSAs. A coaching framework was
developed and mentoring programmes will be
launched in 2017.
Women in mining Drive skills development among female
employees, redeploy pregnant women and
introduce more appropriate personal
protective equipment
In the year ahead we will focus on women in
mining and engineering positions at a
management level.
Local housing Deliver decent and affordable accommodation As part of the Tswelopele employee housing
project, which provides financial and other
assistance to first-time homeowners,
150 homes were allocated to employees.
Currently 790 employees live in converted
hostels, 1,127 live in mine-owned or mine-
built houses (either rented or purchased) with
the remainder living either in privately owned
housing or informal settlements. Employee
living in their own houses (registered bonds
and title deeds) receive a monthly
R3,000 housing allowance.
SLP commitments Entrench community development
programmes through local economic
development initiatives
Managed under sustainable development and
community relations. See p99 for detail.
Local procurement Provide procurement opportunities to local
community members
During the year, we continued to
deliver training programmes to build
the pipeline of requisite skills. This is
an ongoing focus as the technical
skills required for mechanised mining
remain in short supply. The training
that artisans receive through the
Mining Qualifications Authority (MQA)
focuses on conventional mining skills
and we therefore provide our artisans
with additional training in the
mechanised mining skills required at
South Deep. During the year 139
artisans and foremen were trained.
The machine operating skills of all
operators were assessed and found
to be competent, but additional
on-the-job coaching was provided
Peo
ple
The Gold Fields Integrated Annual Report 2016111
by OEMs. 58 frontline supervisors
completed a mining supervisory
upskill programme.
The leadership, management
and technical skills of all managers
were assessed, providing a
comprehensive view of the
leadership competency and skills
gaps on the mine. This will inform
targeted leadership training in the
year ahead and assist in identifying
potential future leaders.
A new South Deep employee
engagement strategy assesses the
key communication and engagement
challenges on the mine. The core
focus of the strategy is to drive
employee behaviours that will
support the achievement of the
mine’s strategic objectives. This will
rely heavily on the ability of line
management to communicate
effectively and engage with
employees.
In support of this, South Deep is
adapting the new communications
competency framework and
undertaking comprehensive
communication and engagement
training in the year ahead. A key
focus will be communication of the
South Deep rebase Plan, which was
announced in February 2017 and
sets the production and cost path
for the mine over the next five years.
Improving Investor ConfidenceTo improve investor confidence, we
need to have remuneration plans
that align rewards to shareholder
interests. During the year, Gold Fields
changed its long-term incentive plan
from the cash-based scheme,
introduced in 2014, back to a share
incentive plan. This followed
extensive engagement with
shareholders who believe that a
share-based incentive plan creates
alignment between shareholder
returns and management rewards.
The plan awards qualifying
employees conditional performance
shares on an annual basis, a
percentage of which vest after a
three-year period depending on the
extent to which the Company has
met three corporate performance
conditions: » Absolute total shareholder return » Relative total shareholder return
» Free cash-flow margin
Growing a Quality Portfolio of Assets and Extending Mineral Reserve LifeTo improve the long-term efficiency,
productivity and life of operations,
we need to have the right skills and
expertise both centrally and at our
operations. During the year, the
Group Technical Division was
established to provide technical
oversight and support to the Group
Executive Committee, and support
the regions in finalising the life-of-
mine and business plans – full detail
can be found on p74. The creation of
this division, based in Perth, is
central to Gold Fields’ focus on
advancing technology and innovation
to optimise production, safety and
cost, and drive greater business
efficiencies.
In Australia, the management
structure was amended to integrate
the Gruyere operation and its
requirement to build an operating
mine by end-2018/early-2019. The
team now includes specific expertise
in project development and
brownfields exploration, in line with
Australia’s focus on growth and
extending the LoM of our other three
operations.
The Damang reinvestment project
(p70) is a crucial step in extending
the mine’s life. The management
team has been reorganised so that
the appropriate skills are in place to
deliver on the plan’s objectives.
Furthermore, we have ensured that
our people have the skills required to
manage the performance of the
contractors deployed.
As Salares Norte in Chile prepares to
enter the pre-feasibility phase, we
have recruited people with the
necessary competence and
experience for this stage of the
project development.
Building Strong Community RelationshipsThe loss of our social licence to
operate is listed as our fifth key
business risk. One of the key
mitigating actions is to ensure
fit-for-purpose community and
stakeholder relations structures are
in place.
During 2016, the Group Sustainable
Development team’s capacity was
bolstered. Furthermore, the capacity
of the South Deep community
relations department was assessed
and strengthened, in order to
accelerate the implementation
of the five-year stakeholder and
communication engagement strategy
and three-year plan for building
social capital at the mine.
The sustainability of the existing team
structure was assessed and
structural remediation measures
identified to address any gaps.
Output-focused job profiles were
developed for every position and the
competency of all existing team
members assessed against these
profiles. Individual training plans were
developed to address any skills.
Finally, new team members were
recruited to fill vacant positions in
the new structure.
All regions offer bursaries,
scholarships, internships and
learnerships to local community
members. South Deep in particular
invests a significant proportion of its
training budget R180m (US$12m) in
these programmes. We have also
commenced an intensive programme
to recruit future employees from local
communities (for details see p99).
Safety and Health The safety and health of our
employees was identified one of our
consistent top risks.
Behaviour-based safety programmes
and occupational health interventions
are in place at all our operations
– managed by dedicated safety and
occupational health teams, and
championed at the highest levels
of leadership. See p62 – 65 for more
detail on the safety programmes and
interventions in place.
In addition, we are committed to
supporting the holistic health and
wellbeing of employees. Various
projects are in place to drive this
agenda, including: » A focus on and support for the
mental health of Fly-In, Fly-Out
employees in Australia » The provision of housing, lifestyle
disease management programmes
and financial wellness services
to employees at all our mines
People Focus – Strategic Focus Areas (continued)
The Gold Fields Integrated Annual Report 2016112
» The diagnosis, treatment and
compensation of employees at
South Deep for diseases such as
tuberculosis, silicosis and HIV/Aids » Financial wellness and malaria
diagnostic and treatment
programmes for employees in
Ghana
Retention of Skilled Staff in Key PositionsRetaining skilled staff is a key risk.
There is a renewed market demand
for mining-related skills following the
commodities upswing and Gold
Fields’ relatively flat structure offers
limited opportunities for upward
mobility. Furthermore, there is the
need for specialised skills transfer
from an expat workforce at the
Ghanaian operations.
The following mitigation strategies are in place to retain scarce skills: Competitive RemunerationGold Fields offers competitive
remuneration and a range of benefits
to employees in senior positions.
These include participation in the
annual performance bonus and the
share incentive plan. Further details
are contained in the Summarised
Remuneration Report on p115 – 119.
Gold Fields conducts regular salary
benchmarking which informs any
adjustments made during the salary
review cycle. The Company offers
competitive variable pay packages
to management employees and
production bonus schemes to
non-management employees –
these increase employees’ earning
potential, should targets be met
or exceeded.
In early 2017 Ghana signed a
two-year wage deal with its
representative trade unions for 2016
and 2017. The key outcomes of this
agreement were a 10% backdated
increase on monthly basic pay for
2016 and a 6% hike on basic pay
for 2017. About 96% of our
workforce in Ghana is represented
by trade unions.
South Deep’s three-year wage deal,
which runs from 2015 to 2017,
ensured that, depending on their
position, bargaining unit employees
received an increase in wages as
well as housing, living out, scarce
skills, retention and Fulco (full
calendar operation) allowances
during the year. With the exception
of the living out allowance, which will
largely be phased out in 2017, they
will continue to receive such benefits
in the year ahead. About 92% of our
South Deep workforce is represented
by trade unions.
Succession Planning and Individual DevelopmentThe Group’s talent review process
was evolved to more accurately
identify high-potential employees and
potential successors for key roles.
High-potential employees have
clearly defined individual
development plans that are mapped
to specific succession roles. A talent
dashboard was developed to allow
managers to comprehensively view
where skills gaps lie and to identify
potential successors for key roles.
The dashboard is housed on an
integrated system that provides
improved people data to inform
succession decisions.
The importance of coaching
and mentoring has also been
emphasised as an important
capability required by all leaders.
Managerial employees in key
positions need to transfer skills to
potential successors who have been
identified through the talent review
process. To support localisation
plans, Ghana has rolled out a full
coaching programme, whereby
expatriate employees transfer skills
and knowledge to local Ghanaian
talent. Furthermore, a Group-wide
programme was launched to
improve the coaching capability of
management employees.
Targeted Training and Development ProgrammesGold Fields invested US$17m
in training and development
programmes during the year, and
established a global e-learning
platform. Managers have individual
development plans that link specific
formal and non-formal training to
their career growth aspirations.
We provide high potential employees
with the opportunity to be involved
in short-term assignments in other
regions – an important retention and
development intervention, particularly
given the Company’s flat structure.
High-potential Ghanaian employees
also have the opportunity to go on
secondment to peer mining
companies to learn best practice.
Leadership Development We recognise the role that leaders
– and growing high-potential
employees into future leadership
roles – play in retaining staff in key
positions. Leadership development
is therefore a key focus area in our
performance scorecard (BSC).
In addition to the coaching and
diversity training programmes
mentioned above, we evolved the
management development
programme during the year to
include a greater focus on
developing better people
management skills. We have
identified the characteristics required
for leaders to drive a high-
performance culture and develop
an inclusive work environment that
embraces diversity, and training
programmes are being rolled out
to develop these competencies in
managers.
The online SuccessFactors portal
also provides managers with a
variety of toolkits to assist with
performance management, exit
interviews and recognition
programmes for top performing
employees.
Employee Engagement and CultureDuring 2016, the Group adopted
a new approach to employee
engagement, captured in a revised
employee engagement strategy. This
approach ensures all communication
and engagement focuses on driving
the behaviours necessary to deliver
on strategic business objectives.
Managers are the first and arguably
most important communication
channel to employees. A key focus
during the year was building
communications capability of line
managers. A communications
competency framework was
developed to detail the
communication competencies
required of all line managers. This
will inform a Group-wide training
programme to be rolled out in the
year ahead to build this skills set
among leadership.
Peo
ple
The Gold Fields Integrated Annual Report 2016113
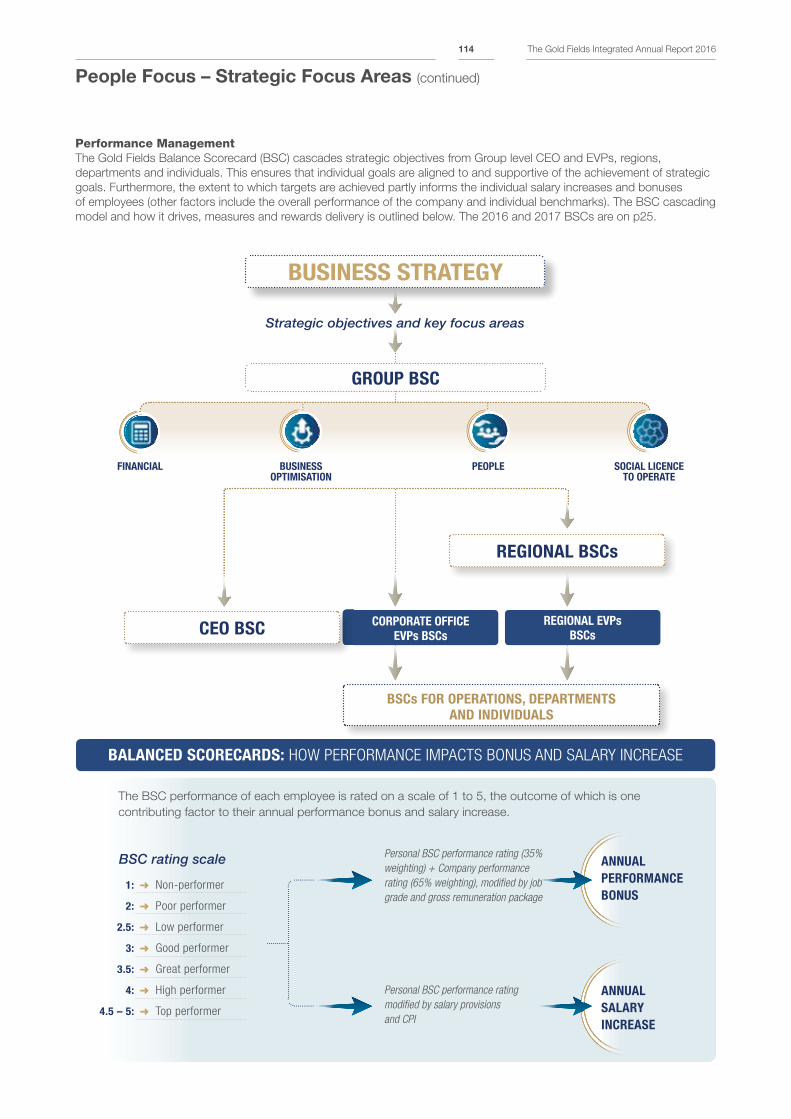
BUSINESS STRATEGY
Strategic objectives and key focus areas
BALANCED SCORECARDS: HOW PERFORMANCE IMPACTS BONUS AND SALARY INCREASE
Personal BSC performance rating
modified by salary provisions
and CPI
Personal BSC performance rating (35%
weighting) + Company performance
rating (65% weighting), modified by job
grade and gross remuneration package
ANNUAL
SALARY
INCREASE
ANNUAL
PERFORMANCE
BONUSbbb
BSC rating scale
1: Non-performer
2: Poor performer
2.5: Low performer
3: Good performer
3.5: Great performer
4: High performer
4.5 – 5: Top performer
The BSC performance of each employee is rated on a scale of 1 to 5, the outcome of which is one
contributing factor to their annual performance bonus and salary increase.
Performance ManagementThe Gold Fields Balance Scorecard (BSC) cascades strategic objectives from Group level CEO and EVPs, regions,
departments and individuals. This ensures that individual goals are aligned to and supportive of the achievement of strategic
goals. Furthermore, the extent to which targets are achieved partly informs the individual salary increases and bonuses
of employees (other factors include the overall performance of the company and individual benchmarks). The BSC cascading
model and how it drives, measures and rewards delivery is outlined below. The 2016 and 2017 BSCs are on p25.
FINANCIAL SOCIAL LICENCE TO OPERATE
PEOPLEBUSINESS OPTIMISATION
REGIONAL EVPs
BSCs
CORPORATE OFFICE
EVPs BSCsCEO BSC
REGIONAL BSCs
GROUP BSC
BSCs FOR OPERATIONS, DEPARTMENTS
AND INDIVIDUALS
E
People Focus – Strategic Focus Areas (continued)
The Gold Fields Integrated Annual Report 2016114
Summarised Remuneration Report
The fundamental principles of Gold
Fields’ remuneration policy remain
unchanged, namely that the policy
should: » Ensure that the Group’s executive
remuneration policy encourages,
reinforces and rewards the delivery
of sustainable shareholder value » Provide competitive rewards to
encourage ownership in the
GUARANTEED PAYAs a global organisation, with the
majority of our operations outside
South Africa, we expect our senior
executives to have global experience.
Our approach to remuneration
therefore takes account of the need
to be competitive throughout the
various jurisdictions in which the
Group operates.
The annual remuneration review
takes place in March of each year. All
eligible employees received a salary
increase on 1 March 2016 and the
average increase for executives
during 2016 was 6.8%. The overall
increase in labour costs fell within the
approved mandate of the
Committee.
business, as well as setting stretch
performance targets for the
delivery of reward-based variable
short-term and long-term incentive
plans for its executive directors
and senior management » Motivate and reinforce individual,
team and business performance in
the short, medium and long term
The remuneration strategy is
underpinned by sound remuneration
management and governance
principles, and comprises the
following key elements: » Guaranteed pay
In 2016, the ratio of average
executive director compensation vs
average employee compensation
was 20.2. This ratio has gradually
reduced from 25.0 in 2014 and
22.2 in 2015 as a result, among
others, of the above inflationary
wage increases received by our
employees in South Africa in terms of
the three-year wage agreement
reached in 2015.
The 2017 annual gross remuneration
packages, or GRP, payable to the
CEO, Nick Holland, and the CFO,
Paul Schmidt, as determined the
Remuneration Committee, were as
follows: » Nick Holland: R11,006,700 plus
US$397,800 » Paul Schmidt: R6,954,800 plus
US$121,400
» Benefits » Short-term incentives i.e. annual
performance bonuses » Long-term incentives
CHANGES TO THE REMUNERATION PLANDuring 2016 Gold Fields’
management received extensive
shareholder feedback on the
remuneration policy. This feedback
and our responses are outlined
below:
BENEFITSGold Fields’ also provides, where
appropriate, additional benefits as
listed below: » Executive participation in the
retirement scheme of their
respective regions. The Company
and the employee (in most
instances) provide contributions
towards retirement savings » Healthcare assistance through
either a percentage contribution,
reimbursement or through
Company-appointed healthcare
providers » Life insurance as a fixed amount or
a multiple of salary » Disability insurance for all
executives, which comprises an
SHAREHOLDER FEEDBACK GOLD FIELDS’ RESPONSE
» Shareholders have a strong preference that
executives own shares in the company they
manage and called for equity-settled long-term
incentives. » Shareholders suggested a deferral of the
vesting of a portion of the short-term incentives
into restricted shares. » Shareholders requested a long-term
performance period of five years, or a three-
year performance period with a two-year
holding period after vesting. » Shareholders requested relative returns versus
peer companies as the primary long-term
performance factor. » Shareholders asked that short-term incentives
be reformulated to give sufficient weight to
delivery on South Deep development and
mining plans. » Shareholders support clawback policies to
ensure executives do not obtain incentives
when the status of a company is compromised.
» Gold Fields obtained shareholder approval in 2016 to reinstate the
revised Gold Fields Limited 2012 Share Plan as its long-term
incentive plan (LTIP), thereby replacing the cash-based LTIP. » In 2016, Gold Fields implemented a Minimum Shareholding
Requirement (MSR) where executives are required to build and hold
a percentage of their salary in Gold Fields shares for a period of five
years. Through this policy Gold Fields executives can defer all or
part of their long-term and short-term incentives prior to vesting into
restricted shares. » Gold Fields corporate performance conditions for the three-year
performance period were amended to include relative total
shareholder return (TSR). » Gold Fields increased the weighting of the CEO’s personal
objectives related to South Deep to 40%. » Gold Fields will develop a clawback policy for implementation in
2017.
This is a summarised version of
the Remuneration Committee’s
Remuneration Report – the full
version of which can be found in
the Annual Financial Report
Peo
ple
The Gold Fields Integrated Annual Report 2016115
Summarised Remuneration Report (continued)
amount to replace partially lost
compensation during a period of
medical incapacity or disability » Group personal accident cover
SHORT-TERM INCENTIVES
(ANNUAL BONUS)Aside from Group objectives listed
on the Group performance scorecard
(p25), the CEO and CFO were also
assessed on individual and strategic
objectives. These objectives are
set every year based on key
performance areas and are approved
by the Committee. Performance
against these objectives is reviewed
by the Committee towards the end
of the year.
Reflecting on the objectives set at
the beginning of 2016 and the
decisions taken by the Company
during 2016 to meet these
objectives, is a clear indication of
the Company’s ability to focus its
business plans to achieve its
strategic objectives. The key
strategic objectives identified at the
time were to:
1. Deliver South Deep development
and operating plans
2. Optimise our portfolio by
structuring the Company to
generate at least 15% free
cash-flow margin at a
US$1,300/oz gold price
3. Adopt a dividend first policy
– paying a dividend of between
25% and 35% of normalised
earnings
4. Lower debt levels and have a net
debt:adjusted EBITDA ratio of
below 1:1
Executive directors are eligible to
earn performance bonuses of 60%
of GRP for the CFO and 65% of GRP
for the CEO for on-target
performance, which comprise both
individual and strategic performance
objectives as well as wider Group
objectives. In the case of the CEO
and CFO, 65% of the performance
bonus is based on Group objectives
and the remainder is based on
individual strategic objectives. For
the regional Executive Vice-
Presidents, bonuses are judged
against Group, regional and
operational objectives. The annual
bonus for the CFO and CEO could
increase above 60% and 65%
respectively if the stretch target is
achieved, up to a maximum bonus
cap of twice the on-target bonus
percentage.
Taking all these factors into account,
the CEO received a personal
performance score of 4.5 out of
5 and the CFO received a personal
performance score of 4.5 out of 5.
The aggregate bonus paid to
members of the executive team in
February 2017 was 89% of annual
salary. For the CEO it was 127% and
the CFO 117% of annual salary.
LONG-TERM INCENTIVESIn terms of the provisions of the 2012
Share Plan, eligible employees were
awarded performance shares on
1 March 2013 that vested on
1 March 2016.
According to the performance criteria
set by the Committee, the number of
performance shares awarded is
modified according to the Gold
Fields share price performance,
measured against seven other gold
companies, namely AngloGold
Ashanti, Goldcorp, Barrick, Harmony,
Kinross, Newmont and Newcrest.
The share price performance is
measured over the 36-month period
from 1 March 2013 to 11 February
2016.
The table below reflects the actual vesting quantum for the Group Executive Committee for the 2014 LTIP award, which was
paid on 28 February 2017 but does not reflect in the remuneration table on p119:
US$ value
of initial
LTI award
US$ value
of awards
vested on
28 February 2017
Name Designation (US$ million) (US$ million)
NJ Holland1 Chief Executive Officer 1.30 –
PA Schmidt Chief Financial Officer 0.63 0.24
R Weston EVP: Australasia 0.91 0.35
A Baku EVP: West Africa 0.79 0.30
LN Samuel EVP: People and Organisational Effectiveness 0.47 0.18
BJ Mattison EVP: Strategy Planning and Corporate Development 0.50 0.19
NA Chohan EVP: Sustainable Development 0.23 0.09
TL Harmse EVP: General Counsel 0.36 0.14
N Muller EVP: South Africa 0.06 0.02
Total 5.25 1.521 Nick Holland elected, prior to the vesting of the 2014 LTIP award and in line with the MSR Policy, to defer 100% (US$500,00) in the form of
Restricted Shares.
The Gold Fields Integrated Annual Report 2016116
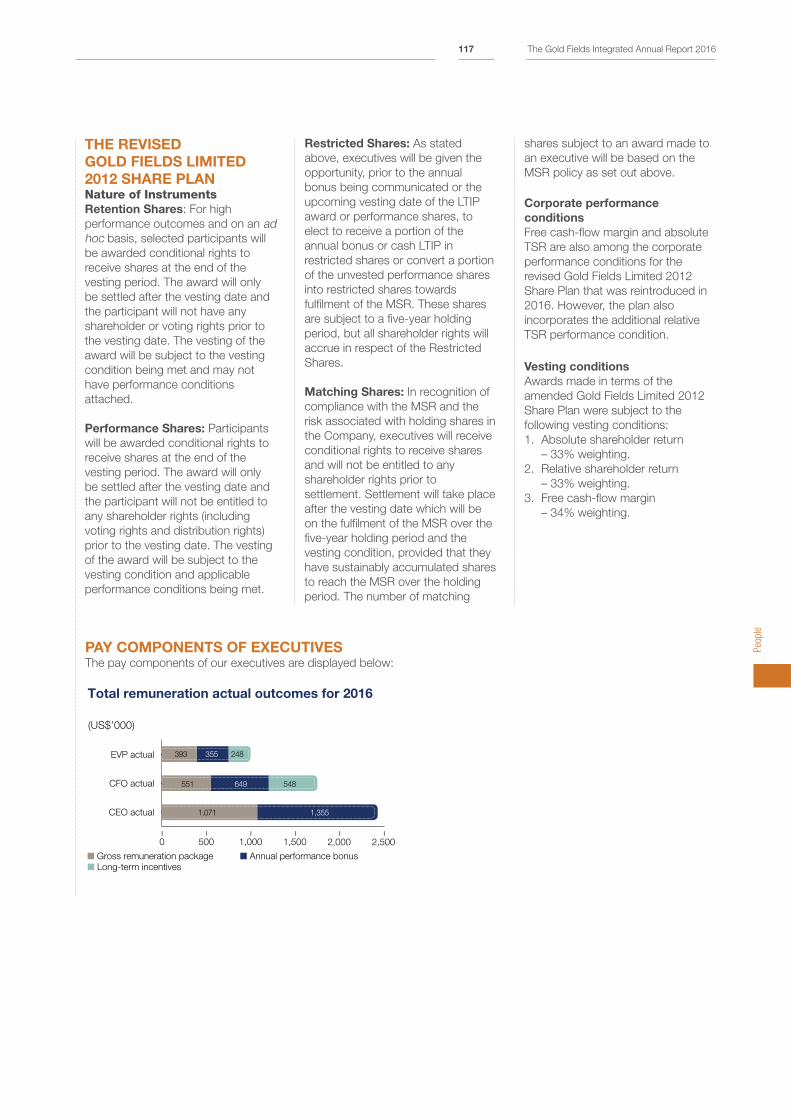
THE REVISED
GOLD FIELDS LIMITED
2012 SHARE PLANNature of InstrumentsRetention Shares: For high
performance outcomes and on an ad
hoc basis, selected participants will
be awarded conditional rights to
receive shares at the end of the
vesting period. The award will only
be settled after the vesting date and
the participant will not have any
shareholder or voting rights prior to
the vesting date. The vesting of the
award will be subject to the vesting
condition being met and may not
have performance conditions
attached.
Performance Shares: Participants
will be awarded conditional rights to
receive shares at the end of the
vesting period. The award will only
be settled after the vesting date and
the participant will not be entitled to
any shareholder rights (including
voting rights and distribution rights)
prior to the vesting date. The vesting
of the award will be subject to the
vesting condition and applicable
performance conditions being met.
Restricted Shares: As stated
above, executives will be given the
opportunity, prior to the annual
bonus being communicated or the
upcoming vesting date of the LTIP
award or performance shares, to
elect to receive a portion of the
annual bonus or cash LTIP in
restricted shares or convert a portion
of the unvested performance shares
into restricted shares towards
fulfilment of the MSR. These shares
are subject to a five-year holding
period, but all shareholder rights will
accrue in respect of the Restricted
Shares.
Matching Shares: In recognition of
compliance with the MSR and the
risk associated with holding shares in
the Company, executives will receive
conditional rights to receive shares
and will not be entitled to any
shareholder rights prior to
settlement. Settlement will take place
after the vesting date which will be
on the fulfilment of the MSR over the
five-year holding period and the
vesting condition, provided that they
have sustainably accumulated shares
to reach the MSR over the holding
period. The number of matching
shares subject to an award made to
an executive will be based on the
MSR policy as set out above.
Corporate performance
conditions
Free cash-flow margin and absolute
TSR are also among the corporate
performance conditions for the
revised Gold Fields Limited 2012
Share Plan that was reintroduced in
2016. However, the plan also
incorporates the additional relative
TSR performance condition.
Vesting conditions
Awards made in terms of the
amended Gold Fields Limited 2012
Share Plan were subject to the
following vesting conditions:
1. Absolute shareholder return
– 33% weighting.
2. Relative shareholder return
– 33% weighting.
3. Free cash-flow margin
– 34% weighting.
PAY COMPONENTS OF EXECUTIVESThe pay components of our executives are displayed below:
548551 649
248393 355
1,3551,071
Total remuneration actual outcomes for 2016
(US$’000)
EVP actual
CEO actual
CFO actual
0 500 1,500 2,5002,000
–––
1,000
–––
Gross remuneration package Annual performance bonus
Long-term incentives
Peo
ple
The Gold Fields Integrated Annual Report 2016117
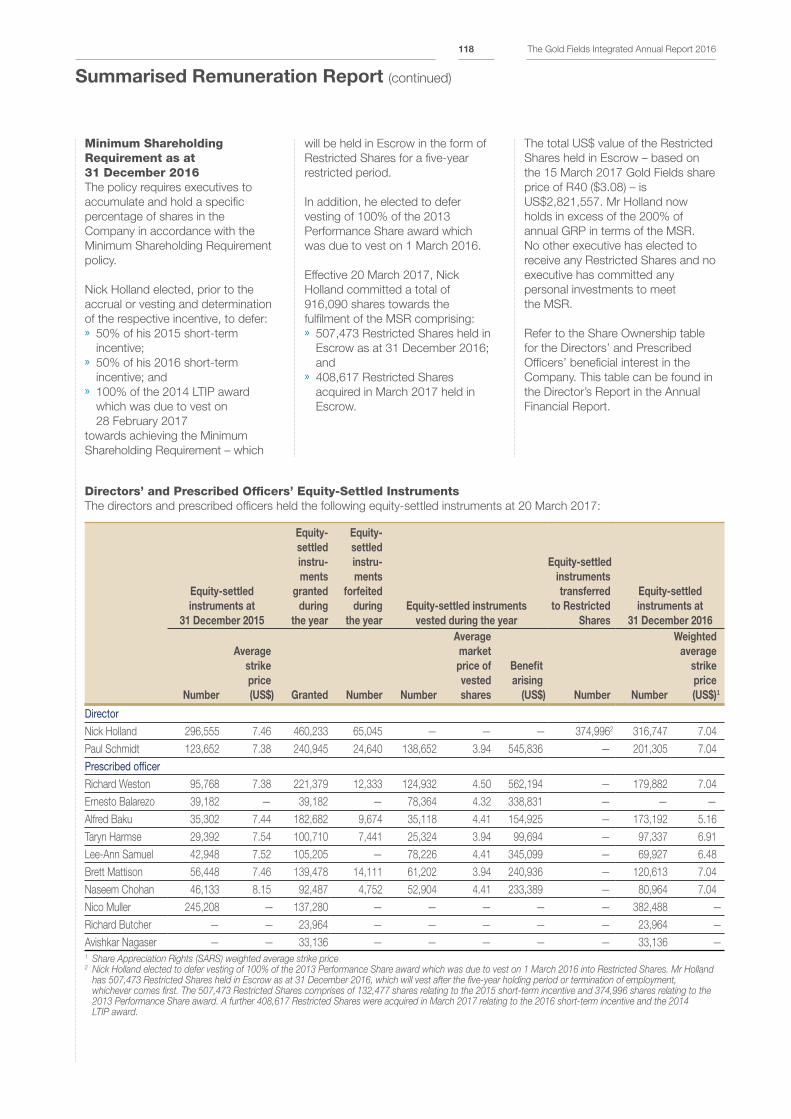
will be held in Escrow in the form of
Restricted Shares for a five-year
restricted period.
In addition, he elected to defer
vesting of 100% of the 2013
Performance Share award which
was due to vest on 1 March 2016.
Effective 20 March 2017, Nick
Holland committed a total of
916,090 shares towards the
fulfilment of the MSR comprising: » 507,473 Restricted Shares held in
Escrow as at 31 December 2016;
and » 408,617 Restricted Shares
acquired in March 2017 held in
Escrow.
Minimum Shareholding Requirement as at 31 December 2016The policy requires executives to
accumulate and hold a specific
percentage of shares in the
Company in accordance with the
Minimum Shareholding Requirement
policy.
Nick Holland elected, prior to the
accrual or vesting and determination
of the respective incentive, to defer: » 50% of his 2015 short-term
incentive; » 50% of his 2016 short-term
incentive; and » 100% of the 2014 LTIP award
which was due to vest on
28 February 2017
towards achieving the Minimum
Shareholding Requirement – which
The total US$ value of the Restricted
Shares held in Escrow – based on
the 15 March 2017 Gold Fields share
price of R40 ($3.08) – is
US$2,821,557. Mr Holland now
holds in excess of the 200% of
annual GRP in terms of the MSR.
No other executive has elected to
receive any Restricted Shares and no
executive has committed any
personal investments to meet
the MSR.
Refer to the Share Ownership table
for the Directors’ and Prescribed
Officers’ beneficial interest in the
Company. This table can be found in
the Director’s Report in the Annual
Financial Report.
Summarised Remuneration Report (continued)
Directors’ and Prescribed Officers’ Equity-Settled InstrumentsThe directors and prescribed officers held the following equity-settled instruments at 20 March 2017:
Equity-settled
instruments at
31 December 2015
Equity-
settled
instru-
ments
granted
during
the year
Equity-
settled
instru-
ments
forfeited
during
the year
Equity-settled instruments
vested during the year
Equity-settled
instruments
transferred
to Restricted
Shares
Equity-settled
instruments at
31 December 2016
Number
Average
strike
price
(US$) Granted Number Number
Average
market
price of
vested
shares
Benefit
arising
(US$) Number Number
Weighted
average
strike
price
(US$)1
Director
Nick Holland 296,555 7.46 460,233 65,045 — — — 374,9962 316,747 7.04
Paul Schmidt 123,652 7.38 240,945 24,640 138,652 3.94 545,836 — 201,305 7.04
Prescribed officer
Richard Weston 95,768 7.38 221,379 12,333 124,932 4.50 562,194 — 179,882 7.04
Ernesto Balarezo 39,182 — 39,182 — 78,364 4.32 338,831 — — —
Alfred Baku 35,302 7.44 182,682 9,674 35,118 4.41 154,925 — 173,192 5.16
Taryn Harmse 29,392 7.54 100,710 7,441 25,324 3.94 99,694 — 97,337 6.91
Lee-Ann Samuel 42,948 7.52 105,205 — 78,226 4.41 345,099 — 69,927 6.48
Brett Mattison 56,448 7.46 139,478 14,111 61,202 3.94 240,936 — 120,613 7.04
Naseem Chohan 46,133 8.15 92,487 4,752 52,904 4.41 233,389 — 80,964 7.04
Nico Muller 245,208 — 137,280 — — — — — 382,488 —
Richard Butcher — — 23,964 — — — — — 23,964 —
Avishkar Nagaser — — 33,136 — — — — — 33,136 —1 Share Appreciation Rights (SARS) weighted average strike price2 Nick Holland elected to defer vesting of 100% of the 2013 Performance Share award which was due to vest on 1 March 2016 into Restricted Shares. Mr Holland
has 507,473 Restricted Shares held in Escrow as at 31 December 2016, which will vest after the five-year holding period or termination of employment, whichever comes first. The 507,473 Restricted Shares comprises of 132,477 shares relating to the 2015 short-term incentive and 374,996 shares relating to the 2013 Performance Share award. A further 408,617 Restricted Shares were acquired in March 2017 relating to the 2016 short-term incentive and the 2014 LTIP award.
The Gold Fields Integrated Annual Report 2016118
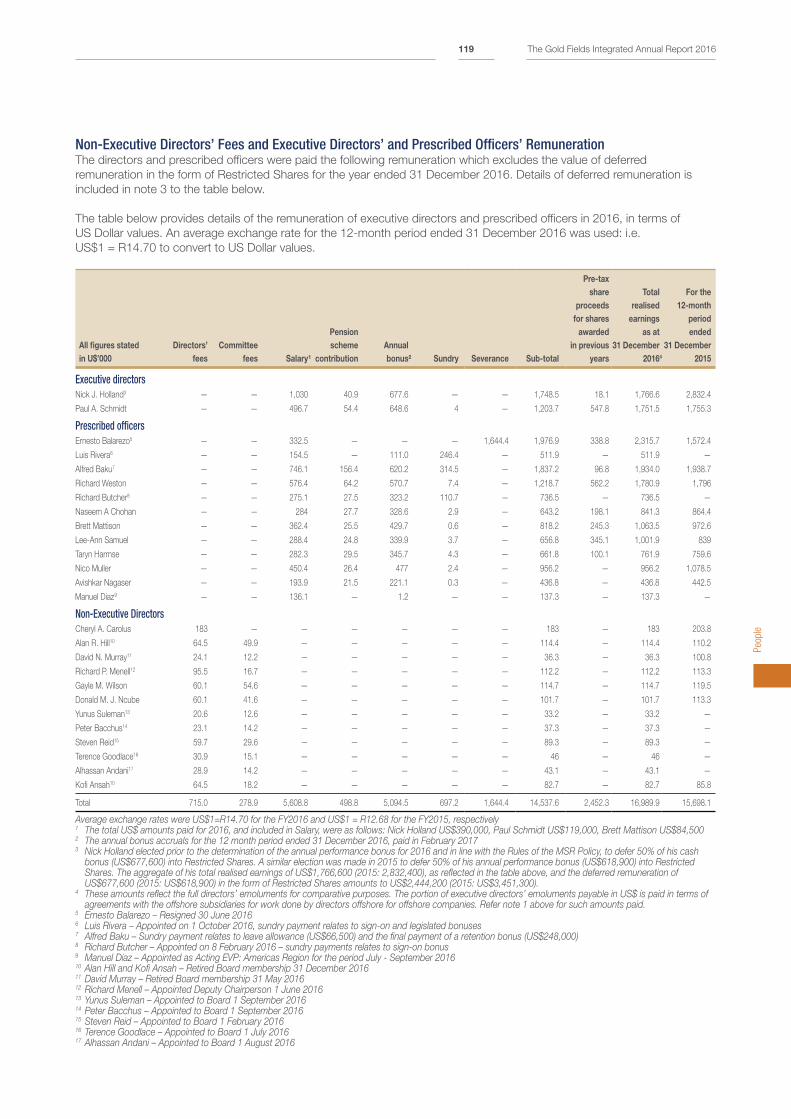
Non-Executive Directors’ Fees and Executive Directors’ and Prescribed Officers’ RemunerationThe directors and prescribed officers were paid the following remuneration which excludes the value of deferred
remuneration in the form of Restricted Shares for the year ended 31 December 2016. Details of deferred remuneration is
included in note 3 to the table below.
The table below provides details of the remuneration of executive directors and prescribed officers in 2016, in terms of
US Dollar values. An average exchange rate for the 12-month period ended 31 December 2016 was used: i.e.
US$1 = R14.70 to convert to US Dollar values.
All figures stated
in U$’000
Directors’
fees
Committee
fees Salary¹
Pension
scheme
contribution
Annual
bonus² Sundry Severance Sub-total
Pre-tax
share
proceeds
for shares
awarded
in previous
years
Total
realised
earnings
as at
31 December
20164
For the
12-month
period
ended
31 December
2015
Executive directorsNick J. Holland3 — — 1,030 40.9 677.6 — — 1,748.5 18.1 1,766.6 2,832.4
Paul A. Schmidt — — 496.7 54.4 648.6 4 — 1,203.7 547.8 1,751.5 1,755.3
Prescribed officersErnesto Balarezo5 — — 332.5 — — — 1,644.4 1,976.9 338.8 2,315.7 1,572.4
Luis Rivera6 — — 154.5 — 111.0 246.4 — 511.9 — 511.9 —
Alfred Baku7 — — 746.1 156.4 620.2 314.5 — 1,837.2 96.8 1,934.0 1,938.7
Richard Weston — — 576.4 64.2 570.7 7.4 — 1,218.7 562.2 1,780.9 1,796
Richard Butcher8 — — 275.1 27.5 323.2 110.7 — 736.5 — 736.5 —
Naseem A Chohan — — 284 27.7 328.6 2.9 — 643.2 198.1 841.3 864.4
Brett Mattison — — 362.4 25.5 429.7 0.6 — 818.2 245.3 1,063.5 972.6
Lee-Ann Samuel — — 288.4 24.8 339.9 3.7 — 656.8 345.1 1,001.9 839
Taryn Harmse — — 282.3 29.5 345.7 4.3 — 661.8 100.1 761.9 759.6
Nico Muller — — 450.4 26.4 477 2.4 — 956.2 — 956.2 1,078.5
Avishkar Nagaser — — 193.9 21.5 221.1 0.3 — 436.8 — 436.8 442.5
Manuel Diaz9 — — 136.1 — 1.2 — — 137.3 — 137.3 —
Non-Executive DirectorsCheryl A. Carolus 183 — — — — — — 183 — 183 203.8
Alan R. Hill10 64.5 49.9 — — — — — 114.4 — 114.4 110.2
David N. Murray11 24.1 12.2 — — — — — 36.3 — 36.3 100.8
Richard P. Menell12 95.5 16.7 — — — — — 112.2 — 112.2 113.3
Gayle M. Wilson 60.1 54.6 — — — — — 114.7 — 114.7 119.5
Donald M. J. Ncube 60.1 41.6 — — — — — 101.7 — 101.7 113.3
Yunus Suleman13 20.6 12.6 — — — — — 33.2 — 33.2 —
Peter Bacchus14 23.1 14.2 — — — — — 37.3 — 37.3 —
Steven Reid15 59.7 29.6 — — — — — 89.3 — 89.3 —
Terence Goodlace16 30.9 15.1 — — — — — 46 — 46 —
Alhassan Andani17 28.9 14.2 — — — — — 43.1 — 43.1 —
Kofi Ansah10 64.5 18.2 — — — — — 82.7 — 82.7 85.8
Total 715.0 278.9 5,608.8 498.8 5,094.5 697.2 1,644.4 14,537.6 2,452.3 16,989.9 15,698.1
Average exchange rates were US$1=R14.70 for the FY2016 and US$1 = R12.68 for the FY2015, respectively1 The total US$ amounts paid for 2016, and included in Salary, were as follows: Nick Holland US$390,000, Paul Schmidt US$119,000, Brett Mattison US$84,5002 The annual bonus accruals for the 12 month period ended 31 December 2016, paid in February 20173 Nick Holland elected prior to the determination of the annual performance bonus for 2016 and in line with the Rules of the MSR Policy, to defer 50% of his cash
bonus (US$677,600) into Restricted Shares. A similar election was made in 2015 to defer 50% of his annual performance bonus (US$618,900) into Restricted Shares. The aggregate of his total realised earnings of US$1,766,600 (2015: 2,832,400), as reflected in the table above, and the deferred remuneration of US$677,600 (2015: US$618,900) in the form of Restricted Shares amounts to US$2,444,200 (2015: US$3,451,300).
4 These amounts reflect the full directors’ emoluments for comparative purposes. The portion of executive directors’ emoluments payable in US$ is paid in terms of agreements with the offshore subsidiaries for work done by directors offshore for offshore companies. Refer note 1 above for such amounts paid.
5 Ernesto Balarezo – Resigned 30 June 20166 Luis Rivera – Appointed on 1 October 2016, sundry payment relates to sign-on and legislated bonuses 7 Alfred Baku – Sundry payment relates to leave allowance (US$66,500) and the final payment of a retention bonus (US$248,000)8 Richard Butcher – Appointed on 8 February 2016 – sundry payments relates to sign-on bonus9 Manuel Diaz – Appointed as Acting EVP: Americas Region for the period July - September 2016 10 Alan Hill and Kofi Ansah – Retired Board membership 31 December 201611 David Murray – Retired Board membership 31 May 2016 12 Richard Menell – Appointed Deputy Chairperson 1 June 201613 Yunus Suleman – Appointed to Board 1 September 201614 Peter Bacchus – Appointed to Board 1 September 201615 Steven Reid – Appointed to Board 1 February 201616 Terence Goodlace – Appointed to Board 1 July 201617 Alhassan Andani – Appointed to Board 1 August 2016
Peo
ple
The Gold Fields Integrated Annual Report 2016119
7ANNEXURE - ASSURANCEFirst Party: Internal Audit Statement 122
Independent Assurance Provider’s Report on
Selected Information 123
Key Sustainability Performance Data 126
Internal and external
assurance is provided
over selected
sustainability data
contained in the
Integrated Annual Report
to provide stakeholders
with comfort over the
accuracy of the
information.
Gold pour at South Deep, South Africa
Ann
exur
e –
Ass
uran
ce
The Gold Fields Integrated Annual Report 2016121
First party: Internal Audit Statement
Gold Fields Internal Audit (GFIA) is an
independent assurance provider to
the Gold Fields Audit Committee on
the effectiveness of the governance,
risk management and control
processes within Gold Fields.
The Internal Audit activities
performed during the year were
identified through a combination of
the Gold Fields Risk Management
framework, which includes the
Combined Assurance Framework
and the risk-based methodology
adopted by the Gold Fields Internal
Audit function. This risk-based audit
methodology complies with the
Institute of Internal Auditors’ (IIA)
“International Standards for the
Professional Practice of Internal
Auditing”. Furthermore, GFIA
operates a quality assurance
programme that involves performing
detailed quality review assessments
at an activity and functional level.
The risk-based annual audit plan that
has been derived from the above
approach is approved by the Audit
Committee annually. The internal
audit activities are executed by a
team of appropriate, qualified and
experienced Internal Auditors, or
through the engagement of external
practitioners on specified and agreed
terms. The Internal Audit team is
based in South Africa and services
all the Gold Fields operations
globally. The Vice President and
Group Head of Internal Audit
provides quarterly feedback to the
Audit Committee and has a
functional reporting line to the Audit
Committee.
Based on the work performed by
GFIA during the year, the Vice
President and Group Head of Internal
Audit has presented the Audit
Committee with an assessment on
the effectiveness of the Company’s
governance, risk management and
system of internal control. It is GFIA’s
opinion that the governance, risk
management and internal control
environment are effective within the
Gold Field business and provide
reasonable assurance that the
objectives of Gold Fields will be
achieved. This GFIA assessment
forms one of the basis for the Audit
Committee’s recommendation in this
regard to the Board.
Shyam Jagwanth
Vice President and Group Head of
Internal Audit
Johannesburg, South Africa
20 March 2017
The Gold Fields Integrated Annual Report 2016122
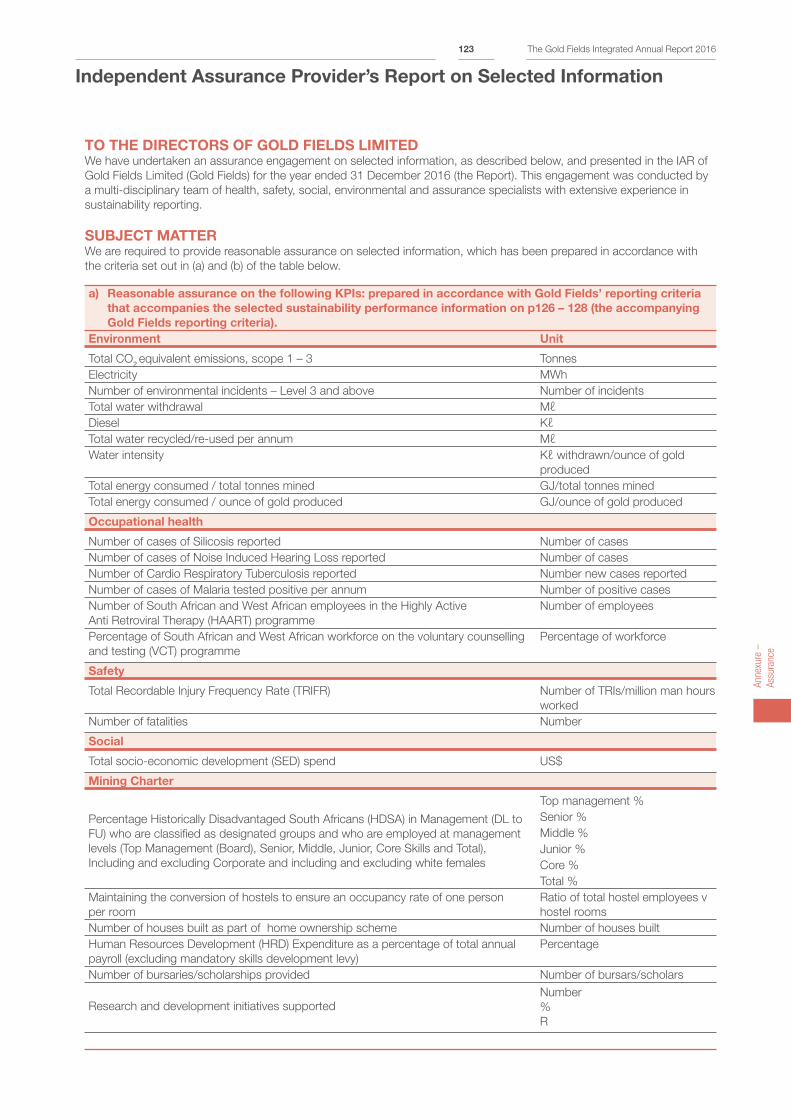
TO THE DIRECTORS OF GOLD FIELDS LIMITEDWe have undertaken an assurance engagement on selected information, as described below, and presented in the IAR of
Gold Fields Limited (Gold Fields) for the year ended 31 December 2016 (the Report). This engagement was conducted by
a multi-disciplinary team of health, safety, social, environmental and assurance specialists with extensive experience in
sustainability reporting.
SUBJECT MATTER We are required to provide reasonable assurance on selected information, which has been prepared in accordance with
the criteria set out in (a) and (b) of the table below.
a) Reasonable assurance on the following KPIs: prepared in accordance with Gold Fields’ reporting criteria
that accompanies the selected sustainability performance information on p126 – 128 (the accompanying
Gold Fields reporting criteria).
Environment Unit
Total CO2 equivalent emissions, scope 1 – 3 Tonnes
Electricity MWh
Number of environmental incidents – Level 3 and above Number of incidents
Total water withdrawal Mℓ
Diesel Kℓ
Total water recycled/re-used per annum Mℓ
Water intensity Kℓ withdrawn/ounce of gold
produced
Total energy consumed / total tonnes mined GJ/total tonnes mined
Total energy consumed / ounce of gold produced GJ/ounce of gold produced
Occupational health
Number of cases of Silicosis reported Number of cases
Number of cases of Noise Induced Hearing Loss reported Number of cases
Number of Cardio Respiratory Tuberculosis reported Number new cases reported
Number of cases of Malaria tested positive per annum Number of positive cases
Number of South African and West African employees in the Highly Active
Anti Retroviral Therapy (HAART) programme
Number of employees
Percentage of South African and West African workforce on the voluntary counselling
and testing (VCT) programme
Percentage of workforce
Safety
Total Recordable Injury Frequency Rate (TRIFR) Number of TRIs/million man hours
worked
Number of fatalities Number
Social
Total socio-economic development (SED) spend US$
Mining Charter
Percentage Historically Disadvantaged South Africans (HDSA) in Management (DL to
FU) who are classified as designated groups and who are employed at management
levels (Top Management (Board), Senior, Middle, Junior, Core Skills and Total),
Including and excluding Corporate and including and excluding white females
Top management %
Senior %
Middle %
Junior %
Core %
Total %
Maintaining the conversion of hostels to ensure an occupancy rate of one person
per room
Ratio of total hostel employees v
hostel rooms
Number of houses built as part of home ownership scheme Number of houses built
Human Resources Development (HRD) Expenditure as a percentage of total annual
payroll (excluding mandatory skills development levy)
Percentage
Number of bursaries/scholarships provided Number of bursars/scholars
Research and development initiatives supported
Number
%
R
Independent Assurance Provider’s Report on Selected Information
Ann
exur
e –
Ass
uran
ce
The Gold Fields Integrated Annual Report 2016123
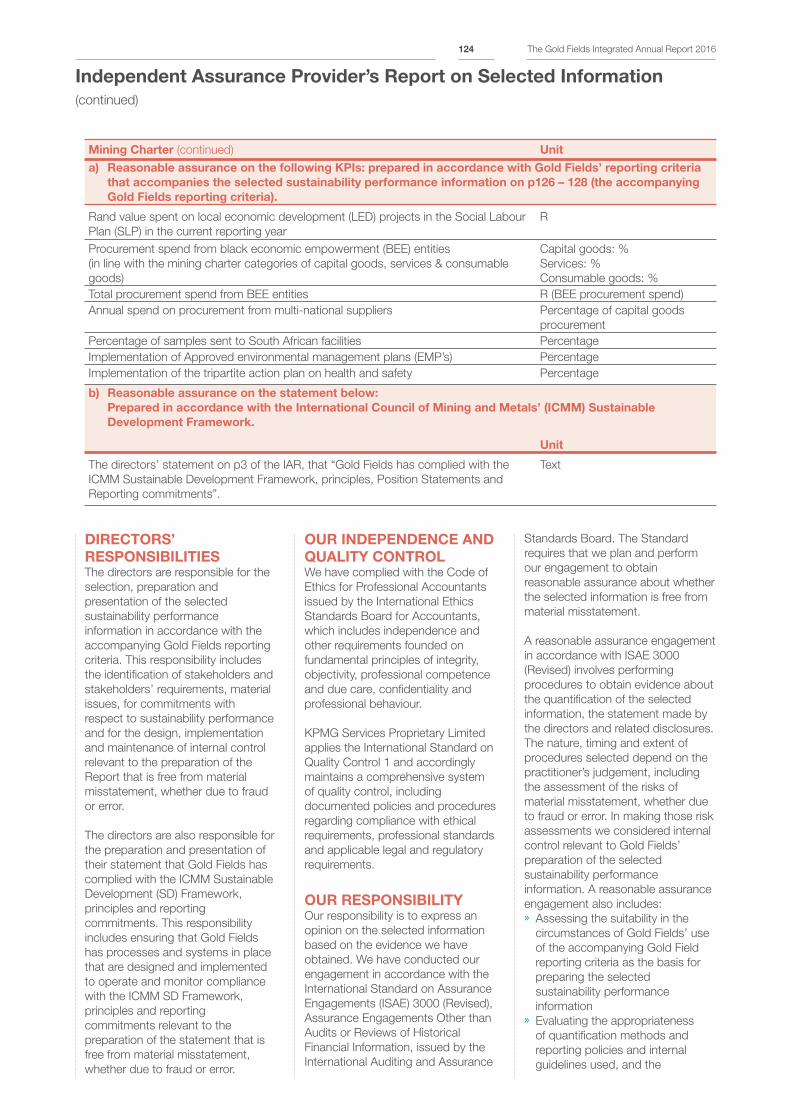
Independent Assurance Provider’s Report on Selected Information
(continued)
DIRECTORS’
RESPONSIBILITIES The directors are responsible for the
selection, preparation and
presentation of the selected
sustainability performance
information in accordance with the
accompanying Gold Fields reporting
criteria. This responsibility includes
the identification of stakeholders and
stakeholders’ requirements, material
issues, for commitments with
respect to sustainability performance
and for the design, implementation
and maintenance of internal control
relevant to the preparation of the
Report that is free from material
misstatement, whether due to fraud
or error.
The directors are also responsible for
the preparation and presentation of
their statement that Gold Fields has
complied with the ICMM Sustainable
Development (SD) Framework,
principles and reporting
commitments. This responsibility
includes ensuring that Gold Fields
has processes and systems in place
that are designed and implemented
to operate and monitor compliance
with the ICMM SD Framework,
principles and reporting
commitments relevant to the
preparation of the statement that is
free from material misstatement,
whether due to fraud or error.
OUR INDEPENDENCE AND
QUALITY CONTROLWe have complied with the Code of
Ethics for Professional Accountants
issued by the International Ethics
Standards Board for Accountants,
which includes independence and
other requirements founded on
fundamental principles of integrity,
objectivity, professional competence
and due care, confidentiality and
professional behaviour.
KPMG Services Proprietary Limited
applies the International Standard on
Quality Control 1 and accordingly
maintains a comprehensive system
of quality control, including
documented policies and procedures
regarding compliance with ethical
requirements, professional standards
and applicable legal and regulatory
requirements.
OUR RESPONSIBILITYOur responsibility is to express an
opinion on the selected information
based on the evidence we have
obtained. We have conducted our
engagement in accordance with the
International Standard on Assurance
Engagements (ISAE) 3000 (Revised),
Assurance Engagements Other than
Audits or Reviews of Historical
Financial Information, issued by the
International Auditing and Assurance
Standards Board. The Standard
requires that we plan and perform
our engagement to obtain
reasonable assurance about whether
the selected information is free from
material misstatement.
A reasonable assurance engagement
in accordance with ISAE 3000
(Revised) involves performing
procedures to obtain evidence about
the quantification of the selected
information, the statement made by
the directors and related disclosures.
The nature, timing and extent of
procedures selected depend on the
practitioner’s judgement, including
the assessment of the risks of
material misstatement, whether due
to fraud or error. In making those risk
assessments we considered internal
control relevant to Gold Fields’
preparation of the selected
sustainability performance
information. A reasonable assurance
engagement also includes: » Assessing the suitability in the
circumstances of Gold Fields’ use
of the accompanying Gold Field
reporting criteria as the basis for
preparing the selected
sustainability performance
information » Evaluating the appropriateness
of quantification methods and
reporting policies and internal
guidelines used, and the
Mining Charter (continued) Unit
a) Reasonable assurance on the following KPIs: prepared in accordance with Gold Fields’ reporting criteria
that accompanies the selected sustainability performance information on p126 – 128 (the accompanying
Gold Fields reporting criteria).
Rand value spent on local economic development (LED) projects in the Social Labour
Plan (SLP) in the current reporting year
R
Procurement spend from black economic empowerment (BEE) entities
(in line with the mining charter categories of capital goods, services & consumable
goods)
Capital goods: %
Services: %
Consumable goods: %
Total procurement spend from BEE entities R (BEE procurement spend)
Annual spend on procurement from multi-national suppliers Percentage of capital goods
procurement
Percentage of samples sent to South African facilities Percentage
Implementation of Approved environmental management plans (EMP’s) Percentage
Implementation of the tripartite action plan on health and safety Percentage
b) Reasonable assurance on the statement below:
Prepared in accordance with the International Council of Mining and Metals’ (ICMM) Sustainable
Development Framework.
Unit
The directors’ statement on p3 of the IAR, that “Gold Fields has complied with the
ICMM Sustainable Development Framework, principles, Position Statements and
Reporting commitments”.
Text
The Gold Fields Integrated Annual Report 2016124
reasonableness of estimates made
by Gold Fields » Evaluating the overall presentation
of the selected sustainability
performance information and
whether the information presented
in the Report is consistent with our
findings, overall knowledge and
experience of sustainability
management and performance at
Gold Fields.
Our work included the following
evidence-gathering procedures: » Interviewing management and
senior executives to obtain an
understanding of the internal
control environment, risk
assessment process and
information systems relevant to the
sustainability reporting process.
Inspecting documentation to
corroborate the statements of
management and senior
executives in our interviews » Testing the processes and systems
to generate, collate, aggregate,
monitor and report the selected
sustainability information » Inspecting supporting
documentation and performing
analytical procedures on a sample
basis to evaluate the data
generation and reporting
processes against the
accompanying Gold Fields
reporting criteria » Undertaking physical site visits to
Gold Fields’ South Deep, Tarkwa,
Damang and St Ives operations
and remote reviews of the Granny
Smith, Agnew/Lawlers, Darlot, and
Cerro Corona operations.
We believe that the evidence we
have obtained is sufficient and
appropriate to provide a basis for
our opinion.
OPINIONIn our opinion, » a) the selected sustainability
performance information set out
in (a) of the Subject Matter
paragraph above for the year
ended 31 December 2016 is
prepared, in all material
respects, in accordance with
the accompanying Gold Fields
reporting criteria; and » b) the directors’ statement on
p3 of the report that Gold Fields
has complied with the ICMM
sustainable Development
Framework, principles and
reporting commitments is, in all
material respects, fairly stated.
OTHER MATTERSThe maintenance and integrity
of the Gold Fields website is the
responsibility of Gold Fields’
management. Our procedures did
not involve consideration of these
matters and, accordingly we accept
no responsibility for any changes to
either the information in the Report
or our independent assurance report
that may have occurred since the
initial date of presentation on the
Gold Fields website.
RESTRICTION OF
LIABILITYOur work has been undertaken to
enable us to express an opinion on
the selected information to the
directors of Gold Fields in
accordance with the terms of our
engagement, and for no other
purpose. We do not accept or
assume liability to any other party
other than Gold Fields, for our work,
for this Report, or for the opinion we
have reached.
KPMG Services Proprietary
Limited
Per PD Naidoo Per CH Basson
Director Director
20 March 2017 20 March 2017
KPMG Crescent
85 Empire Road
Parktown
Johannesburg
2193
Ann
exur
e –
Ass
uran
ce
The Gold Fields Integrated Annual Report 2016125
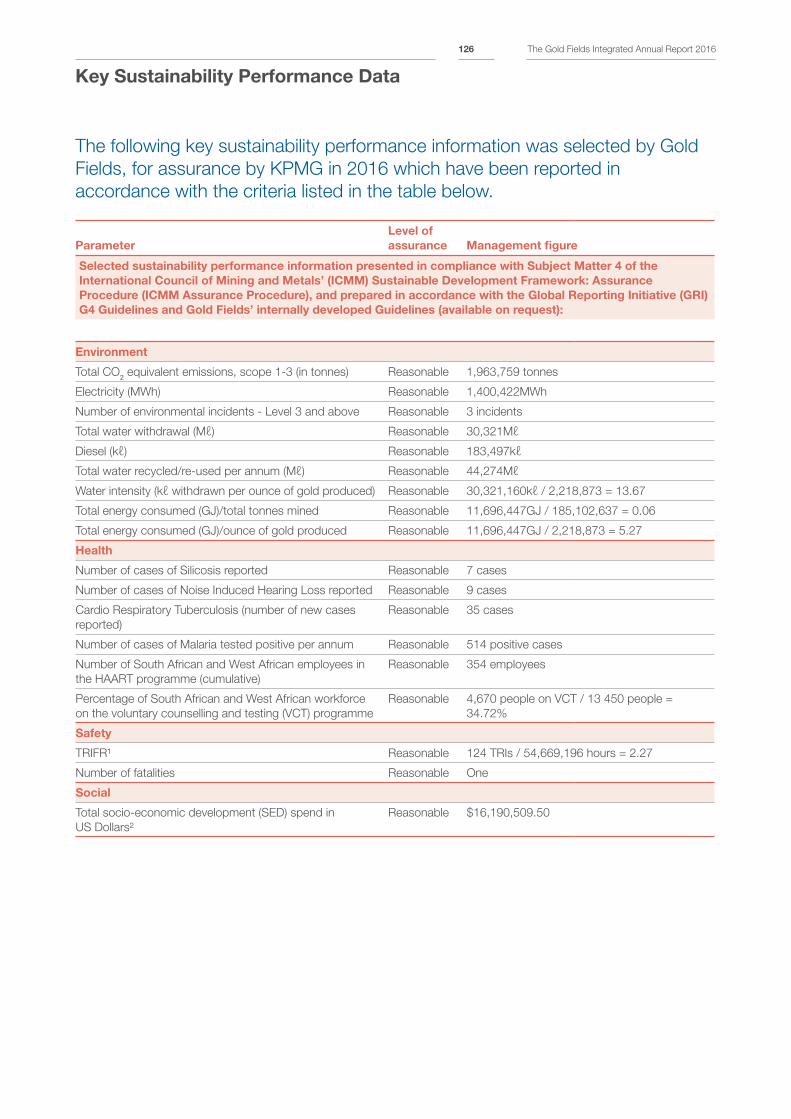
The following key sustainability performance information was selected by Gold
Fields, for assurance by KPMG in 2016 which have been reported in
accordance with the criteria listed in the table below.
Parameter
Level of
assurance Management figure
Selected sustainability performance information presented in compliance with Subject Matter 4 of the
International Council of Mining and Metals’ (ICMM) Sustainable Development Framework: Assurance
Procedure (ICMM Assurance Procedure), and prepared in accordance with the Global Reporting Initiative (GRI)
G4 Guidelines and Gold Fields’ internally developed Guidelines (available on request):
Environment
Total CO2 equivalent emissions, scope 1-3 (in tonnes) Reasonable 1,963,759 tonnes
Electricity (MWh) Reasonable 1,400,422MWh
Number of environmental incidents - Level 3 and above Reasonable 3 incidents
Total water withdrawal (Mℓ) Reasonable 30,321Mℓ
Diesel (kℓ) Reasonable 183,497kℓ
Total water recycled/re-used per annum (Mℓ) Reasonable 44,274Mℓ
Water intensity (kℓ withdrawn per ounce of gold produced) Reasonable 30,321,160kℓ / 2,218,873 = 13.67
Total energy consumed (GJ)/total tonnes mined Reasonable 11,696,447GJ / 185,102,637 = 0.06
Total energy consumed (GJ)/ounce of gold produced Reasonable 11,696,447GJ / 2,218,873 = 5.27
Health
Number of cases of Silicosis reported Reasonable 7 cases
Number of cases of Noise Induced Hearing Loss reported Reasonable 9 cases
Cardio Respiratory Tuberculosis (number of new cases
reported)
Reasonable 35 cases
Number of cases of Malaria tested positive per annum Reasonable 514 positive cases
Number of South African and West African employees in
the HAART programme (cumulative)
Reasonable 354 employees
Percentage of South African and West African workforce
on the voluntary counselling and testing (VCT) programme
Reasonable 4,670 people on VCT / 13 450 people =
34.72%
Safety
TRIFR¹ Reasonable 124 TRIs / 54,669,196 hours = 2.27
Number of fatalities Reasonable One
Social
Total socio-economic development (SED) spend in
US Dollars²
Reasonable $16,190,509.50
Key Sustainability Performance Data
The Gold Fields Integrated Annual Report 2016126
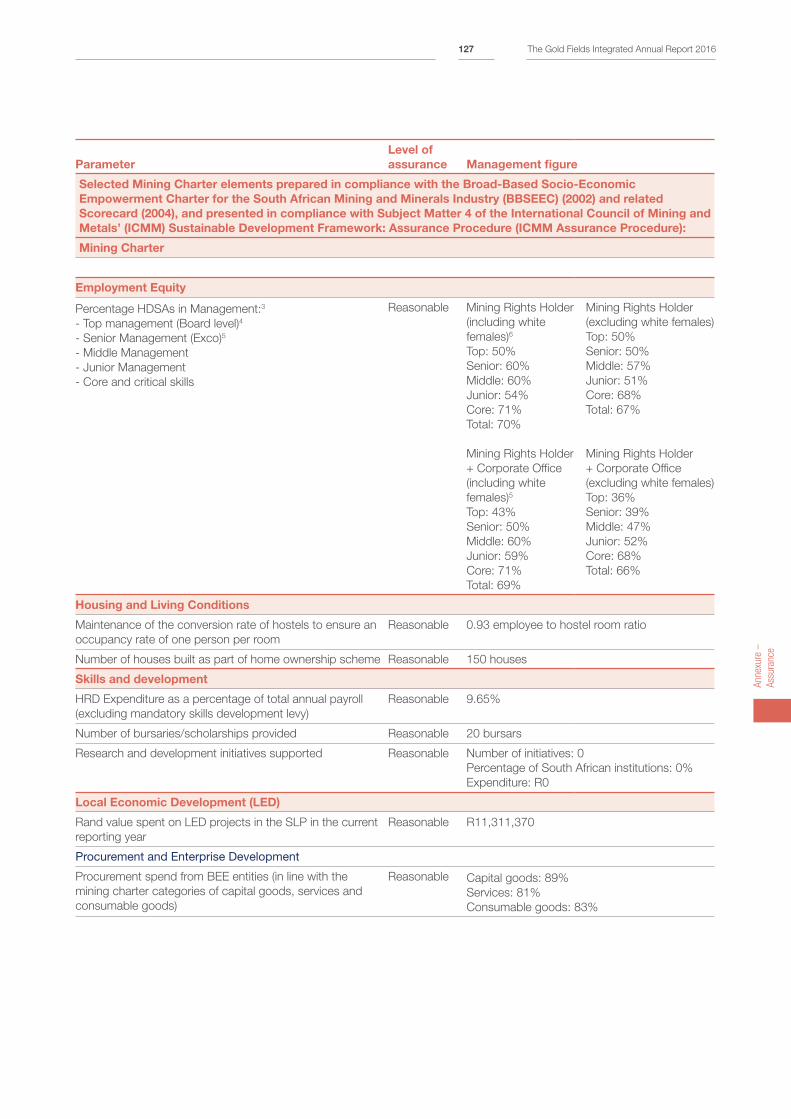
Parameter
Level of
assurance Management figure
Selected Mining Charter elements prepared in compliance with the Broad-Based Socio-Economic
Empowerment Charter for the South African Mining and Minerals Industry (BBSEEC) (2002) and related
Scorecard (2004), and presented in compliance with Subject Matter 4 of the International Council of Mining and
Metals’ (ICMM) Sustainable Development Framework: Assurance Procedure (ICMM Assurance Procedure):
Mining Charter
Employment Equity
Percentage HDSAs in Management:3
- Top management (Board level)4
- Senior Management (Exco)5
- Middle Management
- Junior Management
- Core and critical skills
Reasonable Mining Rights Holder
(including white
females)6
Top: 50%
Senior: 60%
Middle: 60%
Junior: 54%
Core: 71%
Total: 70%
Mining Rights Holder
+ Corporate Office
(including white
females)5
Top: 43%
Senior: 50%
Middle: 60%
Junior: 59%
Core: 71%
Total: 69%
Mining Rights Holder
(excluding white females)
Top: 50%
Senior: 50%
Middle: 57%
Junior: 51%
Core: 68%
Total: 67%
Mining Rights Holder
+ Corporate Office
(excluding white females)
Top: 36%
Senior: 39%
Middle: 47%
Junior: 52%
Core: 68%
Total: 66%
Housing and Living Conditions
Maintenance of the conversion rate of hostels to ensure an
occupancy rate of one person per room
Reasonable 0.93 employee to hostel room ratio
Number of houses built as part of home ownership scheme Reasonable 150 houses
Skills and development
HRD Expenditure as a percentage of total annual payroll
(excluding mandatory skills development levy)
Reasonable 9.65%
Number of bursaries/scholarships provided Reasonable 20 bursars
Research and development initiatives supported Reasonable Number of initiatives: 0
Percentage of South African institutions: 0%
Expenditure: R0
Local Economic Development (LED)
Rand value spent on LED projects in the SLP in the current
reporting year
Reasonable R11,311,370
Procurement and Enterprise Development
Procurement spend from BEE entities (in line with the
mining charter categories of capital goods, services and
consumable goods)
Reasonable Capital goods: 89%
Services: 81%
Consumable goods: 83%
Ann
exur
e –
Ass
uran
ce
The Gold Fields Integrated Annual Report 2016127
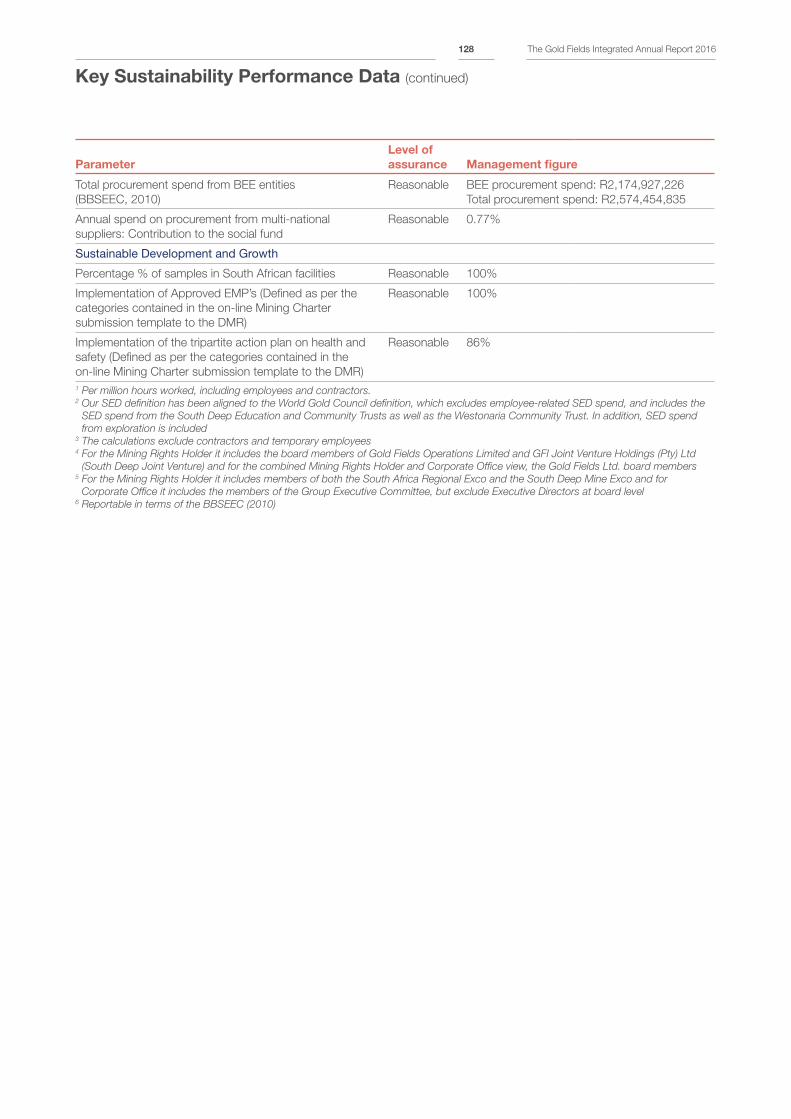
Key Sustainability Performance Data (continued)
Parameter
Level of
assurance Management figure
Total procurement spend from BEE entities
(BBSEEC, 2010)
Reasonable BEE procurement spend: R2,174,927,226
Total procurement spend: R2,574,454,835
Annual spend on procurement from multi-national
suppliers: Contribution to the social fund
Reasonable 0.77%
Sustainable Development and Growth
Percentage % of samples in South African facilities Reasonable 100%
Implementation of Approved EMP’s (Defined as per the
categories contained in the on-line Mining Charter
submission template to the DMR)
Reasonable 100%
Implementation of the tripartite action plan on health and
safety (Defined as per the categories contained in the
on-line Mining Charter submission template to the DMR)
Reasonable 86%
1 Per million hours worked, including employees and contractors.2 Our SED definition has been aligned to the World Gold Council definition, which excludes employee-related SED spend, and includes the
SED spend from the South Deep Education and Community Trusts as well as the Westonaria Community Trust. In addition, SED spend
from exploration is included3 The calculations exclude contractors and temporary employees4 For the Mining Rights Holder it includes the board members of Gold Fields Operations Limited and GFI Joint Venture Holdings (Pty) Ltd
(South Deep Joint Venture) and for the combined Mining Rights Holder and Corporate Office view, the Gold Fields Ltd. board members5 For the Mining Rights Holder it includes members of both the South Africa Regional Exco and the South Deep Mine Exco and for
Corporate Office it includes the members of the Group Executive Committee, but exclude Executive Directors at board level6 Reportable in terms of the BBSEEC (2010)
The Gold Fields Integrated Annual Report 2016128
Administration and corporate information
BASTION GRAPHICS
COMPANY SECRETARY
Lucy Mokoka
Tel: +27 11 562 9719
Fax: +27 11 562 9829
email: [email protected]
REGISTERED OFFICE
Johannesburg
Gold Fields Limited
150 Helen Road
Sandown
Sandton
2196
Postnet Suite 252
Private Bag X30500
Houghton
2041
Tel: +27 11 562 9700
Fax: +27 11 562 9829
OFFICE OF THE UNITED KINGDOM SECRETARIES
London
St James’s Corporate Services Limited
Suite 31, Second Floor
107 Cheapside
London EC2V 6DN United Kingdom
Tel: +44 20 7796 8644
Fax: +44 20 7796 8645
email: [email protected]
AMERICAN DEPOSITORY RECEIPTS TRANSFER
AGENT
Shareholder Correspondence should be mailed to:
BNY Mellon Shareowner Services
P.O. Box 30170
College Station, TX 77842-3170
Overnight Correspondence should be sent to:
BNY Mellon Shareowner Services
211 Quality Circle, Suite 210
College Station, TX 77845
email: [email protected]
Phone Numbers
Tel: +1 888 269 2377 Domestic
Tel: +1 201 680 6825 Foreign
GOLD FIELDS LIMITED
Incorporated in the Republic of South Africa
Registration number 1968/004880/06
Share code: GFI
Issuer code: GOGOF
ISIN – ZAE 000018123
WEBSITE
www.goldfields.com
LISTINGS
JSE/NYSE/GFI
SWX: GOLI
INVESTOR ENQUIRIES
Avishkar Nagaser
Tel: +27 11 562 9775
Mobile: +27 82 312 8692
email: [email protected]
Thomas Mengel
Tel: +27 11 562 9849
Mobile: +27 72 493 5170
email: [email protected]
MEDIA ENQUIRIES
Sven Lunsche
Tel: +27 11 562 9763
Mobile: +27 83 260 9279
email: [email protected]
TRANSFER SECRETARIES
South Africa
Computershare Investor Services (Proprietary) Limited
Rosebank Towers
15 Biermann Avenue
Rosebank
Johannesburg
2196
PO Box 61051
Marshalltown
2107
Tel: +27 11 370 5000
Fax: +27 11 688 5248
United Kingdom
Capita Asset Services
The Registry
34 Beckenham Road
Beckenham Kent BR3 4TU England
Tel: 0871 664 0300
[calls cost 12p per minute plus network extras,
lines are open 09h00 – 17h30 Mon-Fri] or [from overseas]
Overseas: +44 20 8639 5000
Fax: +44 20 8658 3430
email: [email protected]
SPONSOR
JP Morgan Equities South Africa (Pty) Ltd
DIRECTORS
CA Carolus° (Chair) RP Menell° (Deputy Chair)
NJ Holland*• (Chief Executive Officer) PA Schmidt•
(Chief Financial Officer)
A Andani#° PJ Bacchus° TP Goodlace° DMJ Ncube°
SP Reidˆ° YGH Suleman° GM Wilson°
ˆ Australian * British # Ghanaian
° Independent Director • Non-independent Director

www.goldfields.com