glucose transport in isolated brush border membrane from rat
TRANSCRIPT
THE JOURN.~ OF BIOLOGICAL CIKEYISTRY Vol. 248, No. 1, Issue of January 10, pp. 25-32, 1973
Pm&d in U.S.A.
Glucose Transport in Isolated Brush Border
Membrane from Rat Small Intestine*
(Received for publication, June 2, 1972)
ULRICH HOPFER,$ KRISTIXE ~YELSON,$ JOSEPH PERROTTO, AND KURT J. ISSELBACHER
From the Departnlellt of &?edicine, Harvard Medical School and the d!fedical Services (Gastrointestinal Unit), .Vassachusetts Gmeral Hospital, Boston, Massachusetts 0211/,
SUMMARY
Uptake of labeled D- and L-glucose has been shown to occur with highly purified brush border membranes from the epi- thelial cells of rat small intestine using a Millipore filtration technique. An intact glucose carrier system in the isolated membranes was demonstrated as evidenced by the following. (a) D-Glucose was taken up and released faster than L-glu- cose. (b) Sodium ions increased initial rate and extent of D-glucose uptake 3- to 5-fold; no other cation showed this effect. (c) D-Glucose uptake and release was inhibited by phlorizin. (d) Countertransport of D-glucose was demon- strated. (e) D- and L-glucose reached the same level of uptake after prolonged incubation. (j) Uptake of labeled D-glucose was inhibited by higher concentrations of unlabeled D-galactose and vice versa.
Glucose uptake by membrane vesicles represented entry into an intravesicular aqueous space rather than binding to the membrane. Exposure of the membrane to increasing cellobiose concentrations led to osmotic shrinkage of the intravesicular space and decreased glucose uptake. Infinite medium osmolarity and therefore zero intravesicular space resulted in no glucose uptake. Sodium in the medium (but not in the intravesicular spaces) stimulated D-glucose trans- port.
It is concluded that isolated brush border membranes of intestinal epithelial cells retain the glucose carrier system. The reported findings are consistent with the concept that (a) glucose transport across the brush border membrane represents “facilitated diffusion”; (b) the glucose carrier is dependent on sodium ions; and (c) high extracellular, but not intracellular sodium concentrations lead to increased glucose transport.
The normal absorption nud transport of nutrients by t’rle intestine involves the vcrt.oriaI or predomina,nt.ly unidirectional
* This work was supported by a grant from the National In- stitutes of Health (AM-03014).
$ Recipient of a fellowship from the Medical Foundation of Boston. Present address, Department of Biochemistry, Swiss Federal Inst.itute of Technology, 8006 Zurich, Switzerland.
$ Present address, Department of Biochemistry, Swiss Federal Institute of Technology, 8OOG Zurich, Switzerland.
movement of substances from the lumen into the blood and lymph. In most in vitro studies of intestinal transport, slices and sacs have been employed such that polarity of the epithelial cell remains intact. The observed transport characteristics of the isolated tissue correspond quite well to those of the intestinal epithelial cell (l-3). The functional polarity of the epithelial cell is undoubtedly related to the fact that it possesses two types of surface membranes: (a) the brush border or microvillus mem- brane of the luminal surface which contains disaccharidases, alkaline phosphatases, leucyl naphthylamide hydrolase but no (Na+, K+)-dependent ATPase (4-6) ; and (b) the lateral-basal plasma membrane facing the serosal compartment which contains (Na+, K+)-dependent ATPase and 5’.nucIeotidase but no disac- charidases (7).
Several attempts have been made to use isolated intestinal cells for transport studies. Recently, Kimmich (8, 9) studied glucose transport in isolated chick intestinal cells. However, these isolated epithelial cells had lost their functional polarity; and thus it is difficult to evaluate the role of the two different plasma membranes in the observed transport properties of the whole cell (10).
The present experiments were designed to study glucose transport with an even simpler system without the drawbacks of isolat,ed cells. Pure brush border membranes have been prepared lvhich can vesicu1at.e under appropriate conditions so that an int,ravesicular aqueous space is separated from t,he medium by t.he membrane. With such isolated brush border membranes t’ransport properties can be investigated without interference or participation of cellular metabolism and energy or intracellular compartmentation. Furthermore the transport properties of the brush border membrane can be studied in- dependently from those of the lateral-basal plasma membrane. Similar investigations have been carried out with other types of plasma membrane (11, 12).
Hesose tra,nsport Ga the intestinal glucose carrier system (for reviews see Kcfcrences 13-16) is distinguished by two features: (n) absorption of sugars is dependent on sodium ions; indeed a coupling of sugar and sodium ilow across the intestine has been shown (17) ; and (b) transport is effectively inhibited by phlorizin. It is not,eworthy that these two characteristics are demonstrable in the transport system with isolated brush border membranes.
METHODS AND MATERIALS
Xentbrane Isolation Tecknique-Erush border membrane were obtained by the method of Forstner et al. (18) with the
25
by guest on February 12, 2018http://w
ww
.jbc.org/D
ownloaded from
26
modification t.h:it 1 11131 Tris-HEPES1 buffer was present in all solutions. ?\Irmbr:mc~s were prepnrcd in two stages. First,, “purified” brush borders were isolated from intestinal scrapings. Subsequently, the membl.ancs were separated from the fibrous core ma,tcrial and the tcrminxl web.
The method for the fractionation of intact brush borders indo mcmbrancs mid COIP components was altered subst.antiallg from that described previously (18). Volumes mentioned in this paragraph refer to the material obtained from jejunal and ileal scrapings of one malt Sprague-11awley rat (Holtzman Co., Madison, Rise.) weighing 220 40 260 g. All steps in the prepara- tion of the membrane were performed on ice or at, 4”. Purified brush borders were washed once with 1 m&t Tris-HEPES buffer, pH 7.5, containing 5 mllr Naz-EI)TA, a.nd sedimented by low speed ccntrifugation (Step 1). The brush borders were then sus- pended in 20 ml of 1.00 mM D-IrxUitlitO~-1 rnnf Tris-HEPES (Buffer A), pH 7.5, and reisolated aft,er centrifugabion at 24,000 x g for 20 min (Step 2). The pellet from Step 2 was homogenized for 30 s with 20 ml of lhlffer A in a. glass-Teflon homogenizer at 1,000 rpm (Step 3). iYIgSO* was added immediately to yield a final concentration of 0.1 IllM. The homogenate was then spun at 4,500 x g for 10 min (Step 4). The turbid supernatant from Step 4 contained the brush border membranes and was saved. Viewed under the phase microscope the pellet appea.red to con- tain fibrous as well as membranous material. The yield of membrane was increased by repetition of Steps 3 and 4 (Steps 3’ and 4’). Brush border membra.nes were collected by centrifu- gation of the supernatants from Steps 4 and 4’ at 24,000 x g for 30 min (Step 5) and suspended in 1.5 ml of Buffer A supple- mented with 0.1 m&f >1gSO+ Small amounts of fibrous material were collected in the pellet by another centrifugation at 2,000 x g for 5 min (Step 6) and discarded. The supernatant from Step 6 contained the final membranes used for the transport experi- ments. They were suspended in the appropriate buffer and collected after centrifugation at 24,000 X g for 10 min (Step 7).
For the experiments reported in Table V and Fig. 6 the mem- branes were prepared with mono- and disaccharides, respectively. The appropriate sugar replaced an equal concentration of D- mannitol in all buffers during the prepalstion of the membrane from brush borders. Membranes obtained under these con- ditions were similar in purity or yield to those prepared with Buffer A.
Uptake JPethod-The membranes (1 to 4 mg of protein per ml) were usually incubated at 25” with 1 mM D-[l-r&hcOSe and 1 mM L-[lJ4C]glucose, both at a specific act,ivity of 1.0 to 1.6 X lo4 cpm per nmole. The uptake of sugars was terminated by removal of a sample (20 to 80 pg of protein) and dilution with a 50.fold excess of cold 0.9% NaCl solut.ion supplemented with 10 mM Tris-HEPES and 0.2 mM phlorizin. The membranes were immediately collected on a washed Millipore filter (HA025, pore size 0.45 p) and washed once with 3 ml of the above YaCl solu- tion.
The Milliporc filter IIh rctaincd brush border membranes quantitatively as measured by the activity of sucmse, a brush border membrane marker. Neither binding nor retention of D- or L-glucose by the filter could be detected.
The difference in uptake between D- and L-glucose is termed net n-glucose and, in a first approximation, is regarded as re- flecting the specific component of u-glucose. Uptake values for net D-glucose from duplicate samples of the same preparation were within 77; (st,andard deviation) of the mea,n; or in absolute
1 The abbreviation used is: HEPES, N-Zhydroxyethylpiper- azine-i\:‘-2.ethanesulfonic acid.
terms, the average difference between duplicates was 20 pmoles per mg of protein. In general, duplicates for I)~ and I,-glucose
. exhtblted the same variation as for net I)-glucose. However, occasionally a higher variation was detect.cd for 1). and L-glucose upta.ke which did not affect net I)-glucose. It could be shown that this variation was caused by retention of the two sugars on the filter due to insufficient washing. *Is t,hc tlbsolute amounts of sugar uptake varied up to a fact.or of three among different preparations, results of typical single espcriments are presrnted. However all experiments were performed at, least in triplicate with similar results.
Radioactive Isotopes-Radioactive isot.opes were counted by a standard technique for doubly labeled samples in a Packard Tri-Carb model 3375 scintillation count,er. The fluor consisted of toluene-Triton X-100 in a ratio 2: 1 (v/v) containing 8.35 g of 2,5-diphenyloxazole (PPO) and 0.1 g p-bis[2-(5-phenyloxa- zolyl)]benzene (POPOP) per liter of t.olucne. Counts were eor- rected for background and spillage of 14C into the tritium channel. Specific activity of radioactive substances was determined by counting an appropriate amount under identical conditions as the samples from the uptake studies.
The higher uptake of u-glucose compared to L-glucose, as ob- served in this study, could not be ascribed to a.rtifact,s of the counting procedure. No substantial difference was found for the uptake of D-[Tjmannitol and L-[‘*C]glucose in double labeling experiments. In addition, when I)+C]glucose and n-[TIman- nitol were used instead of n-[‘l’lglucose and I+Z]glucose the D-&cOSe to D-mannitol uptake ra.tio was similar to the n-glucose to L-glucose ratio.
Sucrase A&&y--Sucrase activity was mea.sured by the method of Messer and Dahlqvist (19) escept that the assay was performed in a two-step rather than a one-step procedure. The fraction containing sucrase was first incubated with substrate and after heat inactivation of sucrase the liberated glucose was measured by the usual coupled enzymic assay. Results were identical with the original method.
Protein Detemnination-Protein determination was carried out by the method of Resch et al. (20) with a Perkin-Elmer fluorim- eter model 204. Protein fluorescence was determined in a solution of 0.1% sodium dodecyl sulfate. Initially, the fluo- rescence of the various fractions with known protein cont.ent was determined relative to tryptophan and conversion factors were calculated. Protein concentrations of subsequent samples were calculated from their fluorescence, the tryptophan fluorescence, and the conversion factor. The protein contents of the various fractions used for calibration were determined by the m&hod of Lowry et al. (21) with crystalline bovine serum albumin as the standard.
Paper C~~romatogruplly-Pnl)el. clnomat,ograph~ of sugars was performed on Whatman No. 3MM paper in an ascending system of butanol-ethanol-water-acetic arid (8: 2: 3 : 1). The RF of glucose was 0.22 in this system.
Electron fllicroscop2/-For positively stained preparations, a portion of the brush border membrane pellet was fixed in 37, glutaraldehyde in 0.1 M cacodylate buffer, $17.5, and post-fixed in Dalton’s chrome osmium. The membranes were then soaked in 0.5yo uranyl acetate, dehydrated, and embedded in epoll- araldite. Sections of 900 A were obtained with an LKB ultra- microtome, stained with lead citrate and uranyl acetate.
Materials-The following radioactive compounds were ob- tained from New England Nuclear Corp. (Boston, Mass.): D-[I-T]glucose, D-[1-TJgalactose, n-[l-T]mannitol, L-[l-L4C]glu- case, and n-[UJ4C]glucosc. Unlabeled n- and L-glucose,
by guest on February 12, 2018http://w
ww
.jbc.org/D
ownloaded from
n-galactose, and cellobiose were purchased from Sigma Chemical Co. (St. Louis, MO.). n-Mannitol was a product of Mallinckrodt Chemical Works (St. Louis, MO.). Phlorizin was purchased from ICN-Nutritional Biochemicals (Cleveland, Ohio) and recrystallized twice from hot water before use. HEPES, glucose oxidase, hexokinase, and horseradish peroxidase were obtained from Sigma Chemical Co.
The following stock solutions were used to prepare buffers for isolation and incubation of the brush border membrane: (a) Tris-HEPES buffer, pH 7.5, 0.1 M with respect to HEPES; (5) n-mannitol, 0.5 M, which had been passed over a mixed bed exchange resin (AG 501-X8, Bio-Rad Laboratories, Richmond, Cal.).
RESULTS
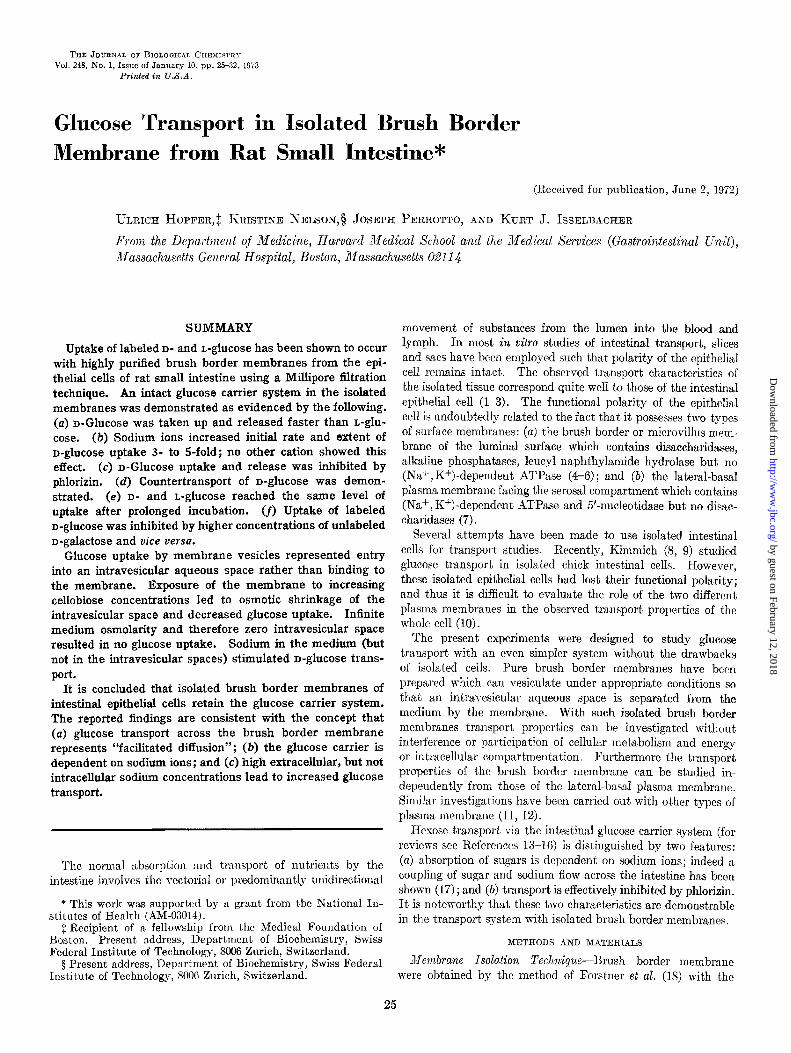
Preparation of Brush Border Membranes-The purity and yield of brush border membranes was routinely followed by measuring the activity of the marker enzyme, sucrase (Table I). About one-fourth of the sucrase activity was recovered in the final membrane preparation, giving a al-fold increase in specific activity. It is noteworthy that the sucrase specific activity was 1.8 times greater in the membrane than in the intact brush border fraction. The electron microscopic appearance of the brush border membrane is that of a highly purified membrane fraction (Fig. 1). Many membranes assumed a vesicular form with a size approximately that of a microvillus. Fibrous core
TABLE I
Sucrase activity
Fraction Specific Purifica- activity”
Yield tion
---
%
Homogenate of intestinal scrapings.. 0.08 100 1.0 “Purified” brush borders. 1.47 38 17.4 Brush border membrane.. 2.63 26 31.1
c Micromoles of sucrose split per min per mg of protein at 37” and pH 6.0.
FIG. 1. Electron micrograph of positively stained purified brush border membranes. Note the purity of the brush border membrane fraction (i.e. the virtual absence of fibrous core ma- terial) and the vesicular form of many membranes.
27
material was virtually absent in the isolated membrane prepara- tion.
The core fibers consist of actin (22). Their depolymerization at low ionic strength and repolymerization in the presence of Mg+f probably represent the basis for the ability to remove them by low speed centrifugation. Since the separation methods involved only differential centrifugation, brush border mem- branes could be prepared within 6 hours from the time the rats were killed. Uptake experiments were carried out the same day. This was necessary because the differential uptake of D- and L-
glucose (see below) could only be detected on the day of prepara- tion.
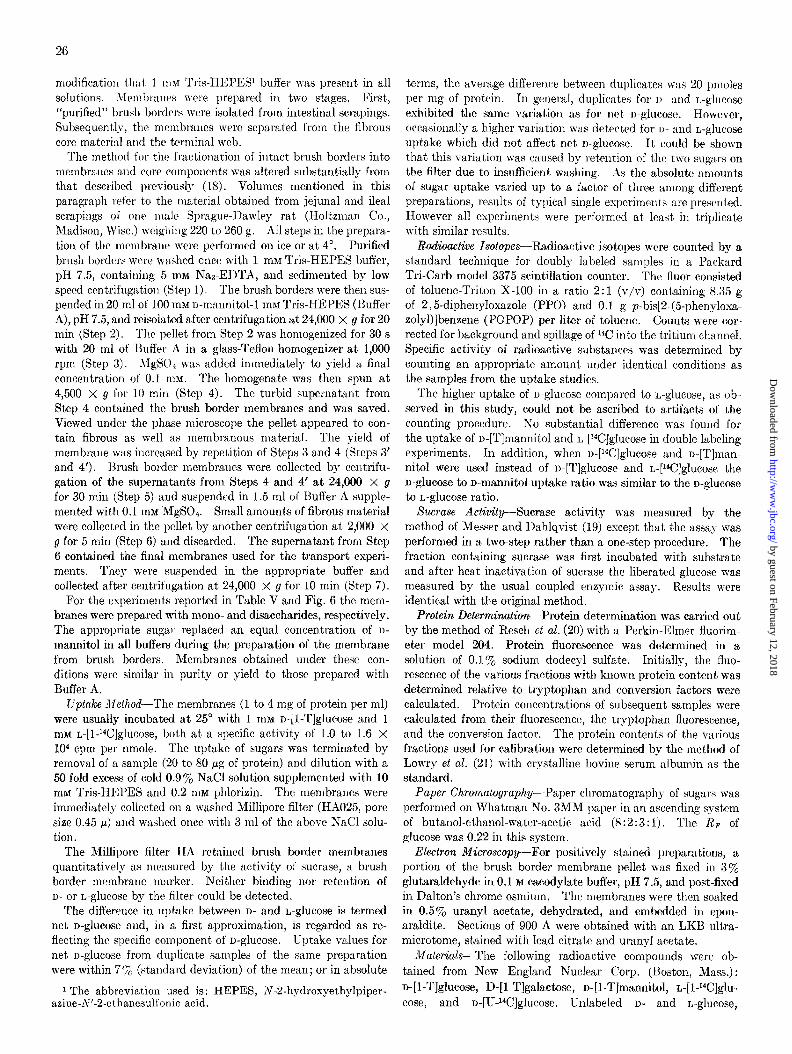
Uptake of Labeled D- and L-Glucose-When isolated membranes were incubated with labeled D- and L-glucose a differential time course of uptake was detected for the two isomers. One of the most striking findings was the rapid uptake of D-ghCOSe com- pared to L-glucose (Fig. 2, A and B). The presence of sodium ions increased this difference and enhanced both the initial rate as well as the extent of n-glucose uptake. Net n-glucose uptake was increased 2- to 5-fold during the first 5 min of incubation (Fig. 2, B versus A). The difference in uptake of D- and L-glu- case became smaller as the incubation was continued such that net n-glucose uptake tended to approach zero (Fig. 2, A to C). Phlorizin, 1 mM, inhibited n-glucose uptake and decreased it to about the level of L-glucose (Fig. 2C). The rate of n- as well as L-glucose uptake was depressed by lowering the temperature of incubation.
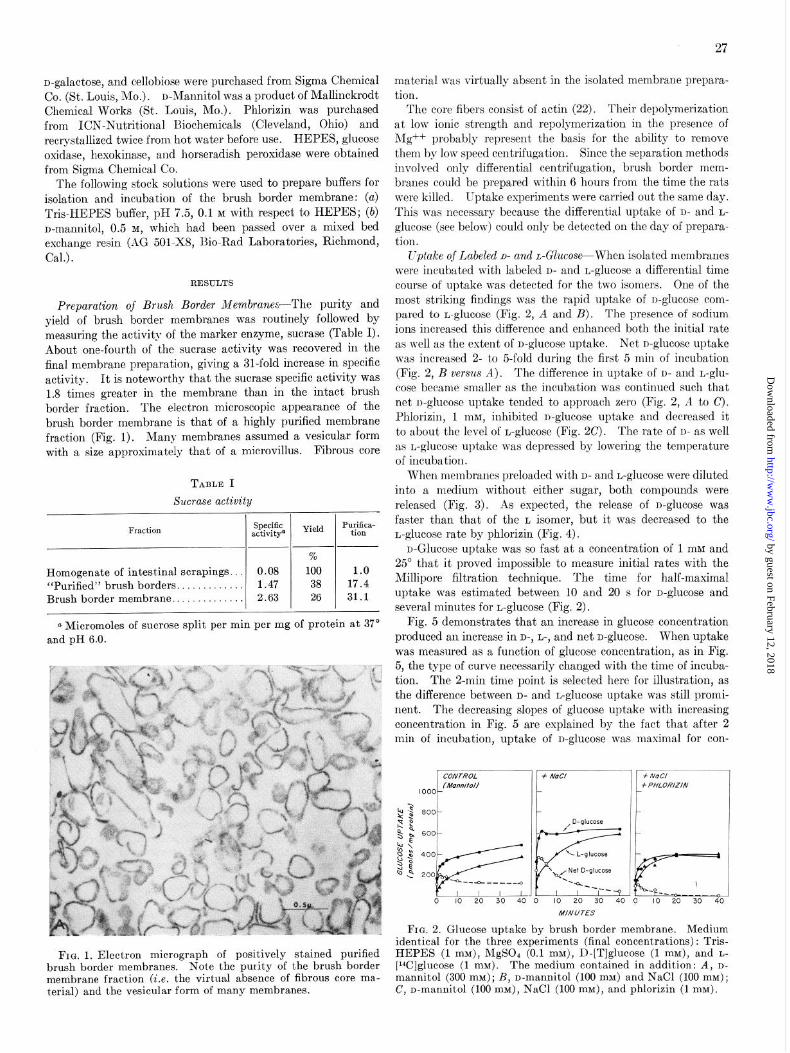
When membranes preloaded with D- and L-glucose were diluted into a medium without either sugar, both compounds were released (Fig. 3). As expected, the release of D-ghCOSe was faster than that of the L isomer, but it was decreased to the L-glucose rate by phlorizin (Fig. 4).
n-Glucose uptake was so fast at a concentration of 1 mM and 25” that it proved impossible to measure initial rates with the Millipore filtration technique. The time for half-maximal uptake was estimated between 10 and 20 s for n-glucose and several minutes for n-glucose (Fig. 2).
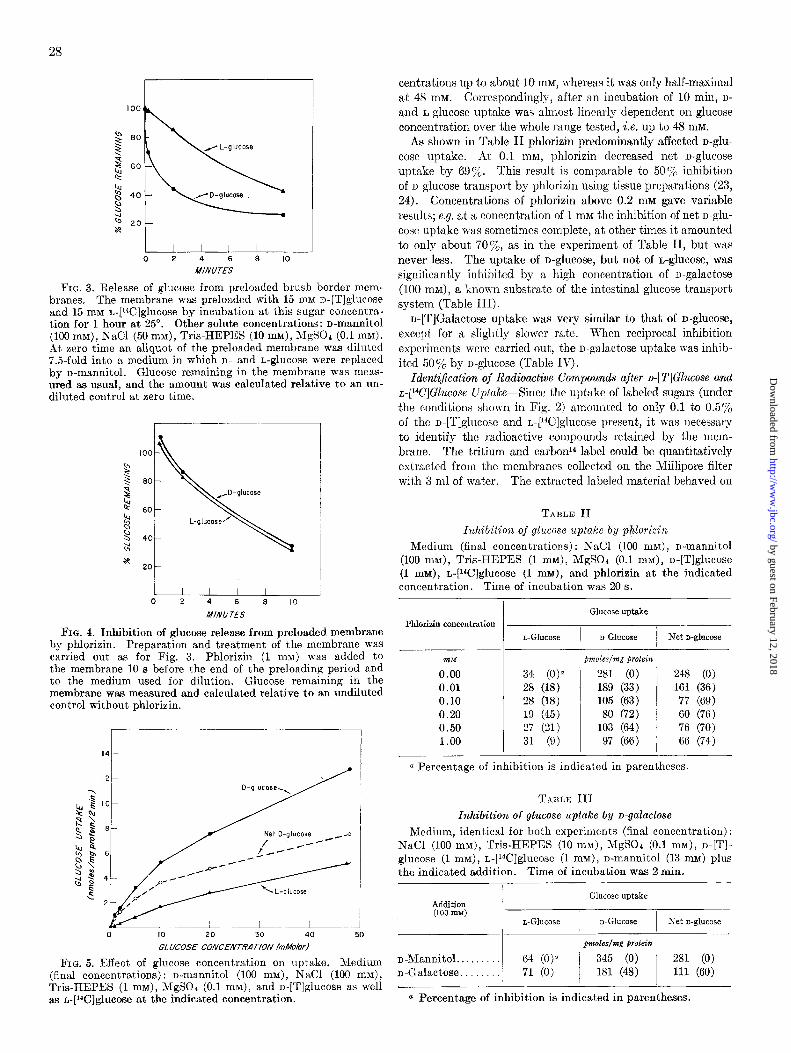
Fig. 5 demonstrates that an increase in glucose concentration produced an increase in D-, L-, and net n-glucose. When uptake was measured as a function of glucose concentration, as in Fig. 5, the type of curve necessarily changed with the time of incuba- tion. The 2-min time point is selected here for illustration, as the difference between D- and L-glucose uptake was still promi- nent. The decreasing slopes of glucose uptake with increasing concentration in Fig. 5 are explained by the fact that after 2 min of incubation, uptake of n-glucose was maximal for con-
FIG. 2. Glucose uptake by brush border membrane. Medium identical for the three experiments (final concentrations): Tris- HEPES (1 mM), MgSOa (0.1 MM), D-[Tlglucose (1 mM), and L-
]‘4C]glucose (1 mM). The medium contained in addition: A, D- mannitol (300 mM); R, n-mannitol (100 mM) and NaCl (100 mM); C, n-mannitol (100 mM), NaCl (100 mM), and phlorizin (1 mM).
by guest on February 12, 2018http://w
ww
.jbc.org/D
ownloaded from
28
L---k-- 0 2 4 6 IO MtNUTES
FIG. 3. Release of glucose from preloaded brush border mem- branes. The membrane was preloaded with 15 mM D-[T]glucose and 15 mM L-[W]glucose by incubation at this sugar concent.ra- tion for 1 hour at 25”. Other solute concentrat.ions : n-ma.nnit,ol (100 mM), NaCl (50 mM), Tris-HEPES (10 mM), MgSOc (0.1 mM). At zero time an aliquot of the preloaded membrane ww diluted 7.5-fold into a medium in which D- and L-glucose were replaced by D-mannitol. Glucose remaining in the membrane was meas- ured as usual, and the amount was calculated relative t.o an un- diluted control at zero time.
- 0
MINU JES
FIG. 4. Inhibition of glucose release from preloaded membrane by phlorizin. Preparation and treatment of the membrane was carried out as for Fig. 3. Phlorizin (1 mM) was added to the membrane 10 s before the end of the preloading period and to the medium used for dilution. Glucose remaining in the membrane was measured and calculat.ed relative to an undilut.ed control without phlorizin.
GLUCOSE CONCENM’AUOIV fmhfdar~
FIG. 5. Effect of glucose concentration on uptake. Medium (final concentrations): n-mannitol (100 mM), NaCl (100 mM), Tris-HEPES (1 mM), MgSOa (0.1 mM): and n-[Tlglucose as well as L-[W]glucose at the indicated concentration.
Phlorizin concentration
fm4
0.00 0.01 0.10 0.20 0.50 1.00
L-GllKfXe D-GlUCOSe Net n-glucose
I- pm01es/mg proteim
34 (0)a 281 (0) 248 (0) 28 (18) 189 (33) 161 (36) 28 (18) 105 (63) 77 (69) 19 (45) 80 (72) 60 (76) 27 (21) 103 (64) 76 (70)
31 (9) 97 (66) 66 (74)
centrations up to about 10 mM, 1vherea.s it was only half-maximal at 48 mM. Correspondingly, after an incubation of 10 min, D- and L-glucose uptake was almost linearly dependent on glucose concentration over the whole range tested, i.e. up to 48 mM.
As shown in Table II phlorizin predominantly affected D-gh-
case uptake. At 0.1 mM, phlorizin decreased net D-glucose uptake by 6970. This result is comparable to 50% inhibition of D-glucose transport by phlorizin using tissue preparations (23, 24). Concentrations of phlorizin above 0.2 rnnf gave va.riable
results; e.g. at a concentration of 1 mM the inhibition of net D-&P case uptake was sometimes complete, at other times it amounted to only about 707,, as in the experiment of Table II, but was never less. The uptake of D-glucose, but not of L-glucose, was significantly inhibited by a high concentration of n-galactose (100 m;\l), a known substrate of the intestinal glucose transport system (Table III).
D-[T]Galactose uptake was very similar t,o that of D-glucose,
except for a slightly sIower rate. When reciprocal inhibition experiments were carried out, the u-galactose uptake was inhib- ited 50% by D-glucose (Table IV).
Identijcalion of Radioactive Compounds after o-[TlGlucose and @C]GZucose Upfake-Since thr upt.ake of labeled sugars (under the conditions shown in Fi g. 2) amounted to only 0.1 to 0.5% of the u-[‘l’lglucose and L-[W]glucose present, it was necessary to identify the radioactive compounds retained by the mem- brane. The tritium and carbonI lnbel could be quantitatively extracted from the membranes collected on the Millipore filter with 3 ml of water. The extracted labeled material behaved on
TABLE II
Inhibition of glucose uptake by phlorizin
Medium (final concentrations) : NaCl (100 mM), n-mannitol (100 mBd), Tris-HEPES (1 MM), MgS04 (0.1 mM), n-[T]glucose (1 mM), r.@C]glucose (1 mM), and phlorizin at the indicated concentration. Time of incubation was 20 s.
Glucose uptake
a Percentage of inhibition is indicated in parentheses.
TABLE III
Inhibition of glucose uptake by o-galactose
Medium, identical for both experiments (final concentration) : NaCl (100 mM), Tris-HEPES (10 MM), MgSOc (0.1 mM), D-[T]- glucose (1 mM), L-[14C]glucose (1 mM), n-mannitol (13 mM) plus the indicated addition. Time of incubation was 2 min.
Glucose uptake Addition (100 InM)
~-Glucose D-GlUCOS.5 Net D-glucose
p?des/mg grotein
n-Mannitol.. 64 (0)a 345 (0) 281 (0) n-Galactose. 71 (0) 181 (48) 111 (60)
a Percentage of inhibition is indicated in parentheses.
by guest on February 12, 2018http://w
ww
.jbc.org/D
ownloaded from
29
Inhibition of o-galactose uptake by n-glucose
D-Galactose and L-glucose uptake were measured under the same conditions as reported in Table III, except D-[T]galactose (1 mM) replaced D-[T]glucose and unlabeled n-glucose (100 mhb) replaced unlabeled n-galactose.
Addition (100 mla)
D-Mannitol.. . n-Glucose. .
Uptalie
~-Glucose wGalactose nTet n-galactose
pmoles/mg protein/z rni%
45 (0)” 154 (0) 109 (0)
41 (9) ! 96 (38) 55 (50)
a Percentage of inhibition is indicat,ed in parentheses.
paper cl~ron~atogmpl~y as one compound with an RF identical
with that of glucose. 130th isotopes passed freely through an anion exchange rosin (I>owes l-X8), as was true for glucose.
Howerer, the tritiatcd compound, but not the carbon14 label,
was retained by the anion eschauge resin after the extracted material had been incubated with hesokiuase and ATP such
that wglucose B-phosphate could be formed from n-glucose. Both observations, i.e. the bcllavior on paper chromatography and the conversion of the tritiated material to an anion, led to the conclusion that I)-[Tlglucose and #C]glucose were not chemically altered during the uptake process.
Distinction between Binding 01” Sugar to Membrane Versus Sugar Transport into an Intrnresicular Aqueous Space-The question of whether the uptake of D- or L-glucose represented
mcmbranc binding or sugar upt.akc into an intravesicular space is important because sevcwl authors hare reported observations of specific sugar biudilq by isolated intestinal brush borders (25-28). Thcrcforc csperimruts were carried out to examine the effect of the intravesicular space on sugar uptake. Since I)- as well as L-glucose was c~losc to equilibrium after 10 min of incubation, the amount of glucose uptake after this time should be dependent on the available iutravesicular volume. The intra- vesicular space was decreased by increasing the medium os-
molarity with cellobiose, an impermeable solute, and glucose up- take was simultaneously measured.” The intravesicular space should be inversely proportional to the medium osmolarity as long as the impermeable solute represents the main component
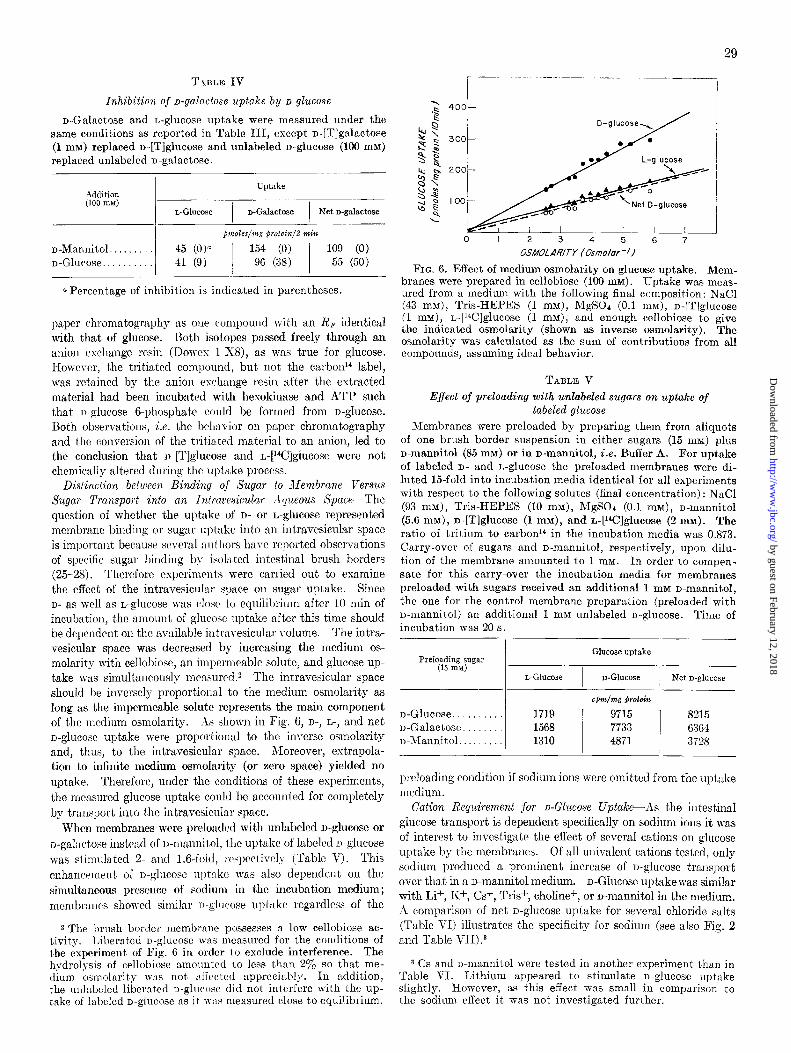
of the medium osmolarity. As shown in Fig. 6, D-, L-, and net n-glucose uptake were proportional to the inverse osmolarity and, t,hus, to the intravesicular space. Moreover, extrapola- t.ion to infiuite medium osmolarity (or zero space) yielded no
uptake. Therefore, under the conditions of these experiments,
the measured glucose uptake could bc accounted for completely by transport into the intravesicular space.
When membranes were prelonded with unlabeled II-glucose or
n-galactose instead of wm:umitol, the uptukc of lab&d D-glucose was stimulated 2- mid 1.6-fold, rwprc’tivcly (Table V). This
enhancement of u-glucose uptake was also dependent on the simult,aneous prcscncc of sodium in t,he incubation medium;
membranes showed similar n-glucose uptake regardless of the
2 The brush border membrane possesses a low cellobiose ac- t,ivity. 1,iberated D-glt~cosc was mcasurcd for the conditions of the experiment, of Fig. G in order to exclude interference. The hydrolysis of cellobiose amounted to less t,han 270 so that me- dium osmolarity was not a l’fected appreciably. In addition, the unlabeled liberated D-g111cosc did not interfere with the up- take of labeled D-glucose as it was measured close to equi!ibrium.
OSMOLARIJY /Osmolar-‘J FIG. 6. Effect of medium osmolarity on glucose uptake. Mem-
branes were prepared in cellobiose (100 mM). Uptake was meas- ured from a medium with the following final ccmposition: NaCl (43 mnz), Tris-HEPES (1 mM), MgSO4 (0.1 mM), D-[T]glucose (1 mn), L-[W]glucose (1 m&f), and enough cellobiose to give the indicated osmolarity (shown as inverse osmolarity). The osmolarity was calculat,ed as the sum of contributions from all compounds, assuming ideal behavior.
TABLE V
E$ect of preloading with unlabeled sugars on uptake of labeled glucose
Membranes were preloaded by preparing them from aliquots of one brush border suspension in either sugars (15 mM) plus D-mannitol (85 mm) or in n-mannitol, i.e. Buffer A. For uptake of labeled D- and L-glucose the preloaded membranes were di- luted 15.fold into incubation media identical for all experiments with respect to the following solutes (final concentration) : NaCl (93 mM), Tris-HEPES (10 mM), MgS04 (0.1 mM), D-mannitol (5.G mM), n-[T]glucose (1 mM), and L-[Wlglucose (2 mM). The ratio of tritium to carbonI in the incubation media was 0.873. Carry-over of sugars and D-mannitol, respectively, upon dilu- tion of the membrane amounted to 1 mM. In order to compen- sate for this carry-over the incubation media for membranes preloaded with sugars received an additional 1 mM o-mannitol, the one for the control membrane preparation (preloaded with D-mannitol) an additional 1 mM unlabeled D-glucose. Time of incubation was 20 s.
I Glucose uptake
~-Glucose ) ~-Glucose 1 Net D-glucose
D-Glucose. D-Galactose. n-Mannitol.
1719 9715 1568 1310
! !
8215 7733 63G4 4871 3728
prcloading condition if sodium ions were omitted from the uptake medium.
Cation Requirement jar D-Glucose Uptake-As the intestinal glucose t,ransport is dependent specifically on sodium ions it was
of interest t,o iilvcstigate the effect of scvcral cations on glucose
uptake by the membranes. Of all univalent cations tested, only sodium produced a prominent increase of ~-glucose transport over that. in a u-mannitol medium. D-Clucosc upta.kewas similar with Lif, I<+, Cs+, Tris+, choline+, or D-maunitol in the medium. ,4 comparison of net D-glucose uptake for several chloride salts
(Table VI) illustrates the specificity for sodium (see also Fig. 2 and Table VII) .3
3 Cs and D-mannitol were tested in another experiment than in Table \‘I. Lithium appeared to stimulate D-glucose uptake slightly. However, as this effect was small in comparison to the sodium effect it was not investigated further.
by guest on February 12, 2018http://w
ww
.jbc.org/D
ownloaded from
30
TABLIG VI TABLE VII Cation TeqGement jar glucose uptake
Medium (final concentrations) : n-mannitol (100 m&r), Tris- HEPES (1 nlM), MgS04 (0.1 mM), D-[T]ghlCOSe (1 mM), L-[WI-
glucose (1 mM), and the indicated salt concentration. Time of incubation was 20 s.
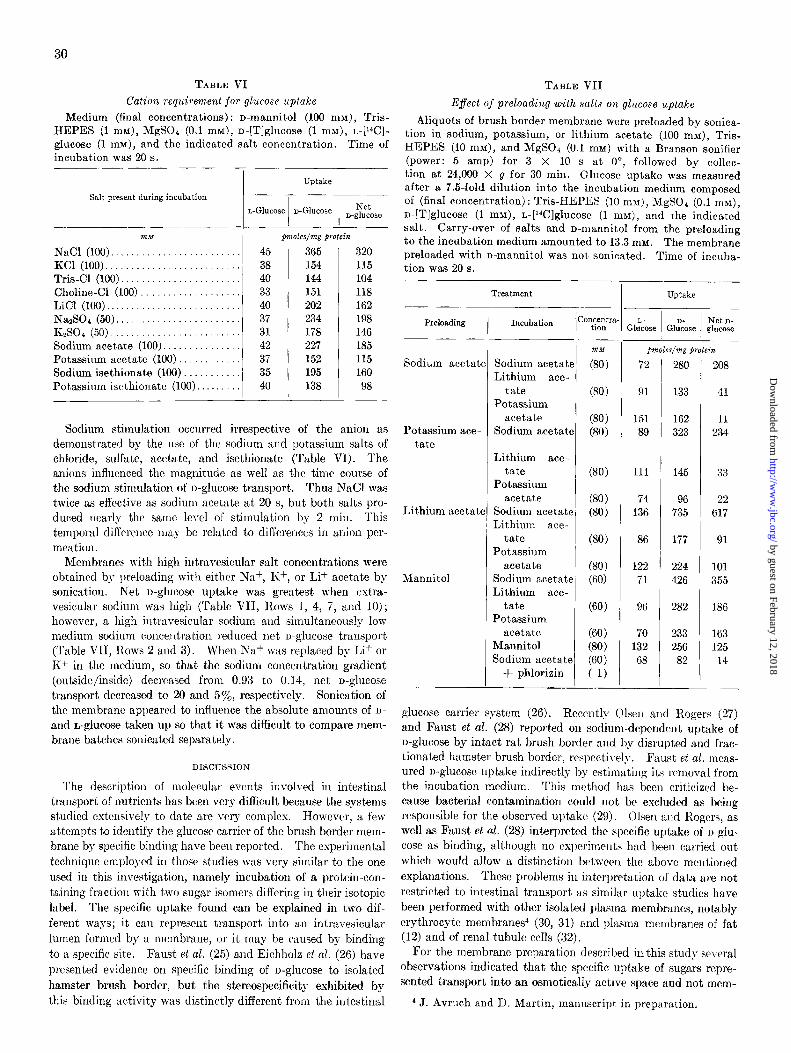
Effect of preloading with salts ox glucose uptake
Aliquots of brush border membrane were preloaded by sonica- tion in sodium, potassium, or lithium acetate (100 mM), Tris- HEPES (10 mM), and MgS04 (0.1 mM) (power: 5 amp) for 3 X 10 s at Ow
it,h a Branson sonifier O, followed by collec-
Salt present during incubation
NaCl (100). .................... KC1 (100). ..................... Tris-Cl (100). .................. Choline-Cl (100) ............... LiCl (100). ..................... NatSO (50) .................... KzS04 (50). .................... Sodium acetat,e (100). .......... Potassium acetate (100). ....... Sodium isethionate (100). ...... Potassium isethionate (100). ....
45 365 320 38 154 115 40 144 104 33 151 118 40 202 162 37 234 198 31 178 148 42 227 185 37 152 115 35 195 160 40 138 98
Sodium stinmlat,ion occurred irrespective of the auiou as demonstrated by the use of the sodium and potassium salts of chloride, sulfate, acetate, and isethionate (Table VI). The anions influenced the magnitude as well as the time course of t.he sodium stimulation of u-glucose tra.nsport.. Thus NsCl wvas twice as effective a.~ sodium ncetata at 20 s, but bot,h salts pro- duced nearly the same level of stimulation by 2 min. This temporal difference may be related to differences in anion per- meation.
Membranes with high intravesicular salt concentrations were obtained by prelonding wit,h eithrr Na+, K+, or Li+ acetate by sonicwtiou. Net I)-glucose uptake was great,est when ext.ra- vesicular sodium was high (Table VII, Rows 1, 4, 7, and 10); however, a high intraresicular sodium and simultaneously low medium sodium concelltrat,ion reduced net u-glucose transport (Table VII, Rows 2 aud 3). When Nat was replaced by Li+ or K+ in the medium, so that. the sodium concentration gradient (outside/inside) decreased from 0.93 to 0.14, net u-glucose transport decreased to 20 and 5$Zo, respectively. Sonicatiou of the membrauc appeared to influence the absolute amounts of U- aud ~-glucose taken up so that it was difficult to compare mem- brane batches souicatcd separately.
DISCUSSION L L
The descript,ion of molecular events involved in intestinal transport of nutrients 1~a.s beeu very difficult because the systems studied extensively to date are very complex. Howevn, a few attempts to idcutify t,hc glucose carrier of the brush border mem- brane by specific biuding have been report.cd. The experimental technique employed in those studies was very similar to the one used in this investigation, namely incubation of a proteiu-con- taining fraction wit,h two sugar isomers differing in their isotopic label. The specific uptake found can be explained in two dif- ferent ways; it can represent t,raiisport iiito au intravesicular lumen formed by a membrane, or it may be caused by binding to a specific site. Faust et al. (25) and Eichholz et al. (26) have presented evidence on specific biuding of D-glucose to isolated hamster brush border, but the stereospecificity exhibited by this binding activity was distinctly different from the intestinal
t,ion at 24,000 X g for 30 min. Glucose uptake was measured after a ?&fold dilution into t.he incubation medium composed of (final concentration) : Tris-HEPES (10 mM), MgSO, (0.1 mM), n-[T]glucose (1 mM), L-[14C]glucose (1 mM), and the indicated salt. Carry-over of salts and n-mannitol from the preloading to the incubation medium amounted to 13.3 mM. The membrane preloaded with n-mannitol was not sonicated. Time of incuba- tion was 20 s.
Preloading
Sodium acetatl e
Potassium ace- tate
Lithium acetate
Mannitol
I- Incubation Concentrr tion
,llM
Sodium acetate (80) Lithium ace-
tate (80) Potassium
acetate (80) Sodium acetate (80)
Lithium ace- tate (80)
Potassium acetate 630)
Sodium acetat,e, (80) Lithium ace-
tate (80) Potassium
acetate (8’3) Sodium acetate (60) Lithium ace- ’
tate (60) Potassium
acetate 63’3) Mannit,ol (8’3) Sodium acetate (60)
+ phlorizin ( 1)
-_
L-
--
-
Uptake
zbnoles/mg protein 72 280 208
91 133 41
151 162 11 89 323 234
111 145 33
74 96 22 136 735 617
86 177 91
122 224 101 71 426 355
96 282 186
70 233 132 25G
68 82
163 125
14
glucose carrier system (26). Rcceutlp Olsen and Roger:: (27) and Faust et al. (28) reported on sodium-dependent uptake of D-&COSe by intact rat brush border and by disrupted a.nd frac- tionated hamster brush border, respectirely. Faust et al. meas- ured n-glucose uptake indirectly by e&mating its removal from the incubation medium. This method has been criticized be- cause bacterial contamination could uot bc excluded as being responsible for the observed uptake (29). Olsen aud Rogers, as well as Faust et al. (28) interpreted the specific uptake of ~glu- case as biuding, although no cxperirnetlts had been carried out which would allow a distinction bet.wcrn the above mentioned explanations. These problems in int.crpretation of data are not restricted to intestinal transport as similar uptake studies have been performed with other isolat.ed plasma membranes, not.ably erythrocyte membranes4 (30, 31) and plasma membranes of fat (12) and of renal tubule cells (32).
For the membrane preparation described in this study several observations indicated that the specific uptake of sugars repre- sented transport int,o an osmotically active space and not mem-
4 J. Avruch and D. Martin, manuscript in preparation.
by guest on February 12, 2018http://w
ww
.jbc.org/D
ownloaded from
$1
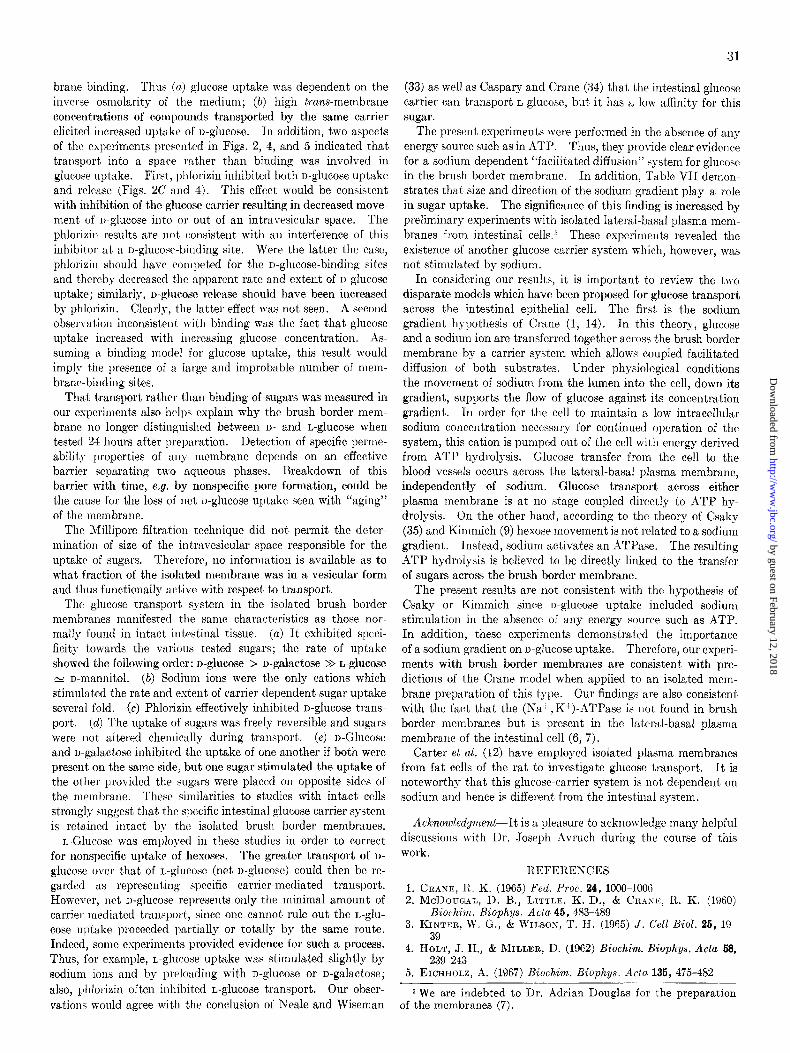
brane binding. Thus (n) glucose uptake was dependent on the inverse osmolarity of the medium; (b) high trans-membrane concentrations of compounds transported by the same carrier elicited increased uptake of I)-glucose. In addition, two aspects of the experiments prcscntcd in Figs. 2, 4, and 5 indicated that transport into a space rather than binding was involved in glucose uptake. First, phlorizin inhibited both n-glucose uptake and release (Figs. 2C and 4). This effect would be consistent with inhibition of t,hc glucose carrier resulting in decreased move- ment’ of u-glucose into or out of an intravesicular space. The phlorizin results are not consistent with an interference of this inhibitor at a n-glucose-binding site. Were the latter the case, phlorizin should have competed for the n-glucose-binding sites and thereby decreased thr apparent rate and extent of n-glucose uptake; similarly, u-glucose rdcase should have been increased by phlorizin. Cienrl~-, the latter effect was not seen. A second observation inconsistent with binding was the fact that glucose uptake increased with illcreasing glucose concentration. As- suming B binding model for glucose uptake, this result would imply the presence of a large and improbable number of mem- brane-binding sites.
That transport rather than binding of sugars was measured in our experiments also helps explain why the brush border mem- brane no longer distinguished between D- and L-glucose when tested 24 hours after preparation. Detection of specific perme- abilit)- properties of any membrane depends on an effective barrier separating t,wo aqueous phases. Breakdown of this barrier wit.11 time, e.g. by nonspecific pore formation, could be the cause for the loss of net n-glucose uptake seen with “aging” of the membrane.
The Millipore filtrat,ion technique did not permit the deter- mination of size of the intrnvcsicular space responsible for the uptake of sugars. Therefore, no information is available as to what fraction of the isolated membrane was in a vesicular form and thus functionally act’ive with respect to transport.
The glucose transport, system in the isolated brush border membranes mnnifestjed the same characteristics as those nor- mally found in intact intrstinal tissue. (a) It exhibited speci- ficity towards the various tested sugars; the rate of uptake showed the following order: n-glucose > n-galactose >> L-glucose N n-mannitol. (b) Sodium ions were the only cations which stimulated the rate and extent of carrier-dependent sugar uptake several fold. (c) Phlorizin effectively inhibited n-glucose trans- port. (d) The uptake of sugars was freely reversible and sugars were not altered chemically during transport. (e) n-Glucose and I>-galactoso inhibited the uptake of one another if both were present. on the sntnc side, but one sugar stimulated the uptake of the other provided the sugars were placed on opposite sides of the membrane. Thrsc sitnilarities to studies with intact cells strongly sug;;est that thrx specific intestinal glucose carrier system is retained intact by the isolated brush border membranes.
L-Glucose was employc,d in thcsc studies in order to correct for nonspecific uptake of hcsoses. The greater trailsport of I)- glucose over that of L-gluroxc (net n-glucose) could then be re- garded as reprcscnting specific carrier-mediated transport. However, net n-glucose rel)resetlts only the minimal amount of carrier-mediatrd transport, since one cannot rule out the L-glu-
case uptake proceeded partially or totally by the same route. Indeed, some experiments provided evidence for such a process. Thus, for example, L-glucose uptake was stimulated slightly by sodium ions and by preloadin g with n-glucose or D-g&CtOSe;
also, phlorizin often inhibited L-glucose transport. Our obser-
(33) as well as Caspary and Crane (34) that the intestinal glucose carrier can transport L-glucose, but, it has a low affinity for this sugar.
The present experiments were performed in the absence of any energy source such as in ATP. Thus, they provide clear evidence for a sodium-dependent “facilitated diffusion” system for glucose in the brush border membrane. In sddition, Table VII demon- strates that size and direction of the sodium gradient play a role in sugar upt.ake. The significance of this finding is increased by preliminary experiments with isolated lateral-basal plasma mcm- branes from intestinal cells.” These experitnents revealed the existence of another glucose carrier system which, however, was not stimulated by sodium.
In considering our results, it is important to review the two disparate models which have been proposed for glucose transport across the intestinal epithelial cell. The first is the sodium gradient hypothesis of Crane (1, 14). In this theory, glucose and a sodium ion are transferred together across the brush border membrane by a carrier system which allows coupled facilitated diffusion of both substrates. Under physiological conditions the movement of sodium from the lumen into the cell, down its gradient, supports the flow of glucose against its concentration gradient. In order for the cell to maintain a low intracellular sodium concentration necessary for continued operation of the system, this cation is pumped out of the cell with energy derived from ATP hydrolysis. Glucose transfer from the cell to the blood vessels occurs across the lateral-basal plasma membrane, independent.ly of sodium. Glucose tra.nsport across either plasma membrane is at no stage coupled directly to ATP hy- drolysis. On the other hand, according to the theory of Csaky (35) and Kimmich (9) hexose movement is not related to a sodium gradient. Instead, sodium activates an ATPase. The resulting ATP hydrolysis is believed to be directly linked to the transfer of sugars across the brush border membrane.
The present results are not consistent with the hypothesis of Csaky or Kimmich since n-glucose upt’ake included sodium stimulation in the absence of any energy source such as ATP. In addition, these experiments demonstrated the importance of a sodium gradient on D-glUCOSe uptake. Therefore, our experi- ments wit.h brush border membranes are consistent with pre- dictions of the Crane model when applied to an isolated mem- brane preparation of this type. Our findings are also consistent with the fact that the (Na+,K+)-ATPase is not found in brush border membranes but is present in the lateral-basal plasma membrane of the intestinal cell (6, 7).
Carter et aE. (12) have employed isolated plasma membranes from fat cells of the rat to investigate glucose transport. It is noteworthy that this glucose-carrier systetn is not dependent on sodium and hence is different from the intestinal system.
Acknowledgnzent-It is a pleasure to acknowledge many helpful discussions with I>r. *Joseph Avruch during the course of this work.
1. CRANE, 11. K. (1965) Fed. Proc. 24, 1000~1000 2. MCDOUGAL. II. B.. LITTLE. K. D.. & CRANIC. 11. K. I19601
Biochirn. ‘Biophys. Acta 4i, 483%4i9 I ,
3. KINTER, W. G., & WILSON, T. IT. (1965) J. Cell Viol. 26, 19- 39
4. HOLT, J. H., & MILLER, D. (1962) Biochim. Biophys. A& 58, 239-243
5. EICHHOLZ, A. (19G7) Riochim. Biophys. Acta 136, 475-482
5 We are indebted to Dr. Adrian Douglas for the preparation vat,ions would agree wit,h the conclusion of Neale and Wiseman of the membranes (7).
by guest on February 12, 2018http://w
ww
.jbc.org/D
ownloaded from
32
6. FUJITA, M., MATSUI, I-I., NAT~NO, K., & NATO, M. (1971) 21. LOWRY, 0. H., ROSEBROUGH, N. J., FARR, A. L., &RANDALL, Biochim. Biophys. Acta 233,404-408 R. J. (1951) J. BioZ. Chem. 193,265-275
7. DOUGLAS, A., KERLI~Y, R., & ISSELBICIIXR, K. J. (1972) 22. TILNEY, L. G., & MOOSEI~ER, M. (1971) Proc. Nat. Acad. Biochem. J. 128.1329-1338 Sci. U. S. A. 68,2611-2615
8. KIMMICH, G. A. (1970) Biochemistry 9, 3659-3668 9. KIMMICH, G. A. (1970) Biochemistru 9. 3669-3677
10. SEMEN& G. (19k) & Transport kc;oss the Intestine (BUR- LAND, W. L., ed) pp. 78-92, P. D. Samuel, London
11. KABACK, H. R. (1968) J. Biol. C&em. 243, 37113724 12. CURTER, J. R., Jx., Avnuc~, J., & MARTIN, D. B. (1972) J.
BioZ. Chem. 247, 2682-2688 13. CRANIO, R. K. (1960) Physiol. Rev. 40, 789-825 14. CRANE, R. K. (1968) in Handbook of PhysioZogy (HEIDEL, W.,
ed) Section 6, Vol. III, pp. 1323-1352, American Physiologi- cal Society, Washington
15. KOTYK, A., & JANAUIX<, K. (1970) Cell Alembrane Transport, Principles and Techniques, pp. 411-431, Plenum Press, New York
16. SMYTH, D. H. (1971) Phil. Trans. Roy. Sot. London 262, 121- 130
17. SCHULTZ, S. G., & Z~LUSI<Y, R. (1964) J. Gen. Physiol. 47, 1043-1059
18. FORSTNER, G. G., s.4~~SIN, S. M., & ISS~LRACHER, K. J. (19%) Biochem. J. 106, 381-390
19. MIXSSER, M., & DAHLQVIST, A. (1966) Anal. Biochem. 14, 376-362
20. RESCH, K., IMM, W., FERBER, IX., WALLACH, D. F. H., & FISCTHER, H. (1971) Natuvwissenschaften 68, 220
23. PARSONS, B. J., SMYTH, D. H., & TAYLOR, C. B. (1958) J. Physiol. (London) 144, 387-402
24. HANO, D. W., SANDFORD, P. A., & SMYTH, D. H. (1966) Na- ture 209,618
25. FAUST, R. G., LE~DBE~ER, M. G., PLENGB, R. K., & Mc- C~SLIN, A. J. (1968) J. Gen. Physiol. 62, 482
26. EICHHOLZ, A., HOWELL, K. E., & CRINE, R. K. (1969) Bio- chim. Biophys. Acta 193, 179-192
27. OLSEN, W. A., & ROGERS, L. (1971) Comp. Biochem. Physiol. 39B, 617-625
28. FAUST, R. G., SHEARIN, S. J., & hbscq D. W. (1972) Bio- chim. Biophvs. Acta 266. 685-690
29. TORRES-PI&O, R., GARCIA-CASTINIURAS, S., & ALVARADO, F. (1972) Fed. Proc. 31,239
30. JUNG, C. Y., CARLSON, L. M., & WHALXY, W. A. (1971) Bio- chim. Biophys. Acta 241, 613427
31. KAHLENBERG, A., URMBNN, B., & DOLANSI~Y, D. (1971) Bio- chemistry 10, 3154-3162
32. Busss, D., ELSAS, L. J., & ROSENBEBG, L. E. (1972) J. Biol. Chem. 247, 1188-1193
33. NEALT”, R. J., & WISEMAN, G. (1968) Nature 218, 473-474 34. CASPARY, W. F., & CRANE, R. K. (1968) Biochim. Riophys.
Acta 163, 395-400 35. CSAKY, T. 2. (1963) Fed. Proc. 22,3-7
by guest on February 12, 2018http://w
ww
.jbc.org/D
ownloaded from
Ulrich Hopfer, Kristine Nelson, Joseph Perrotto and Kurt J. IsselbacherGlucose Transport in Isolated Brush Border Membrane from Rat Small Intestine
1973, 248:25-32.J. Biol. Chem.
http://www.jbc.org/content/248/1/25Access the most updated version of this article at
Alerts:
When a correction for this article is posted•
When this article is cited•
to choose from all of JBC's e-mail alertsClick here
http://www.jbc.org/content/248/1/25.full.html#ref-list-1
This article cites 0 references, 0 of which can be accessed free at
by guest on February 12, 2018http://w
ww
.jbc.org/D
ownloaded from