glucose dehydrogenase of bacterium anitratum: an enzyme ... · 3632 glucose dehydrogenase of...
TRANSCRIPT
THE JOURNAL OF BIOLOGICAL CHEMISTRY Vol. 239, No. 11, November 1964
Printed in U.S.A.
Glucose Dehydrogenase of Bacterium anitratum: an Enzyme with a Novel Prosthetic Group*
JENS G. HAUGE~
From the Department of Microbial Physiology, National Institute of Public Health, Oslo, Norway
(Received for publication, May 12, 1964)
Glucose dehydrogenase of Bacterium anitratum catalyzes the reduction by glucose and other aldoses of dyes such as 2,6-di- chlorophenol indophenol and phenazine methosulfate without the intervention of pyridine or flavin nucleotides (2, 3). The primary hydrogen acceptor is a group that is linked to the protein and revealed by a broad absorption band in the near ultraviolet in the oxidized state, a band which upon addition of glucose is replaced by a sharper band with maximum at 337 rnp (4). In order to throw further light on the nature of this prosthetic group, it was necessary to improve the isolation procedure for the enzyme. The present paper describes the modified proce- dure and presents observations on the properties of the prosthetic group, in situ and in isolation.
EXPERIMENTAL PROCEDURE
Xtrains and Conditions of Culture-The strain used was the one originally isolated in this laboratory (2). Several other strains were tested, including strain 7844 of the National Collec- tion of Type Cultures, London. These strains all produced glucose dehydrogenase, but not in yields surpassing that of the original strain.
Several modifications in the growth medium have been intro- duced since the first report. The yield of enzyme is improved considerably by using tap water for the medium instead of distilled water. We have not yet been able to replace this effect with a trace metal supplement to the distilled water. An ammo- nium salt has been introduced as the source of nitrogen instead of casamino acids, as this does not affect the enzyme production. The glucose originally included is now omitted since it was found to inhibit rather than to stimulate synthesis of glucose dehydrogenase. The new medium used for the growth of the organism contains per liter of water 15 g of sodium succinate . 6Hz0, 4 g of NH&l, 2 g of KzHPO+ and 0.06 g of MgS04.7HzO.
The cells were grown at 28” in a 20-liter laboratory fermentor or in a 170~liter pilot plant fermentor (Stainless & Steel Products Company) under vigorous aeration. The growth rate in the large scale fermentor corresponded to a generation time of 100 minutes. In the laboratory fermentor, the growth was fre- quently considerably slower, for reasons that have not been established. During these slower growths there was an in- creased differential rate of synthesis of the enzyme.
Enzyme Assay-The determination of the enzyme activity
*A preliminary account of part of this work was presented before the Meeting of Scandinavian Biochemists, Copenhagen, January 1963 (1).
t Present address, Department of Biochemistry, University of Bergen, Bergen, Norway.
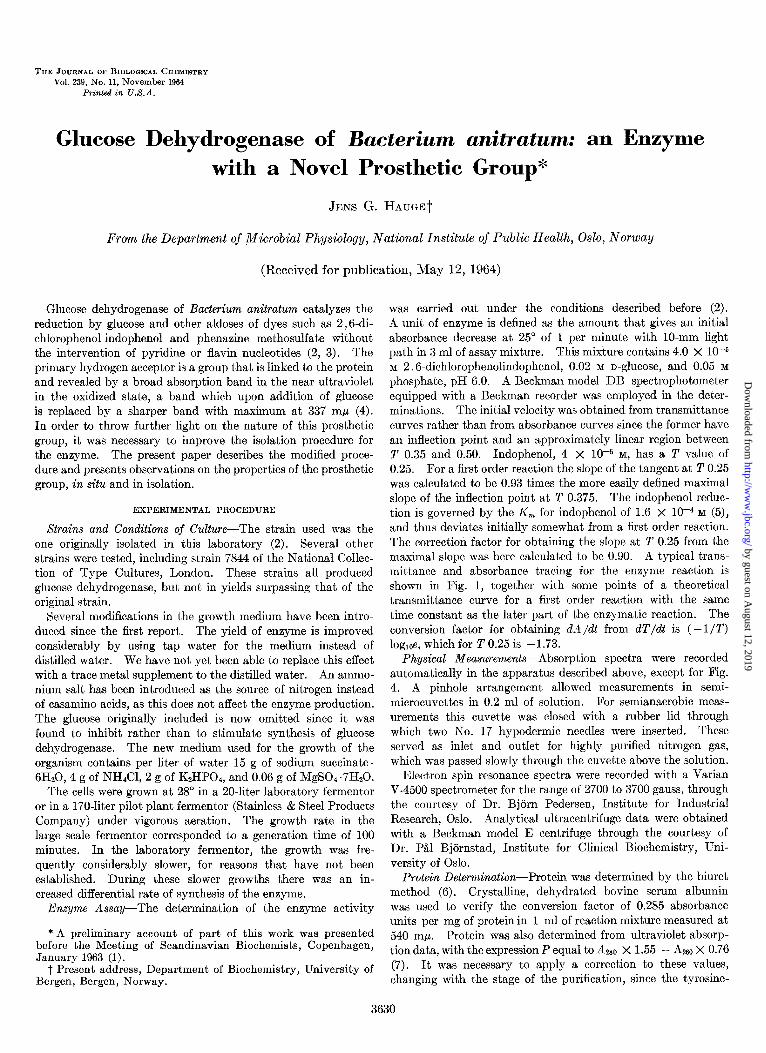
was carried out under the conditions described before (2). A unit of enzyme is defined as the amount that gives an initial absorbance decrease at 25” of 1 per minute with lo-mm light path in 3 ml of assay mixture. This mixture contains 4.0 X low5 M 2,6-dichlorophenolindophenol, 0.02 M n-glucose, and 0.05 M phosphate, pH 6.0. A Beckman model DB spectrophotometer equipped with a Beckman recorder was employed in the deter- minations. The initial velocity was obtained from transmittance curves rather than from absorbance curves since the former have an inflection point and an approximately linear region between T 0.35 and 0.50. Indophenol, 4 x 10h5 M, has a T value of 0.25. For a first order reaction the slope of the tangent at T 0.25 was calculated to be 0.93 times the more easily defined maximal slope of the inflection point at T 0.375. The indophenol reduc- tion is governed by the K, for indophenol of 1.6 X lop4 M (5), and thus deviates initially somewhat from a first order reaction. The correction factor for obtaining the slope at T 0.25 from the maximal slope was here calculated to be 0.90. A typical trans- mittance and absorbance tracing for the enzyme reaction is shown in Fig. 1, together with some points of a theoretical transmittance curve for a first order reaction with the same time constant as the later part of the enzymatic reaction. The conversion factor for obtaining dA/dt from dT/dt is (-l/T) loglOe, which for T 0.25 is - 1.73.
Physical Measurements-Absorption spectra were recorded automatically in the apparatus described above, except for Fig. 4. A pinhole arrangement allowed measurements in semi- microcuvettes in 0.2 ml of solution. For semianaerobic meas- urements this cuvette was closed with a rubber lid through which two No. 17 hypodermic needles were inserted. These served as inlet and outlet for highly purified nitrogen gas, which was passed slowly through the cuvette above the solution.
Electron spin resonance spectra were recorded with a Varian V-4500 spectrometer for the range of 2700 to 3700 gauss, through the courtesy of Dr. Bjbrn Pedersen, Institute for Industrial Research, Oslo. Analytical ultracentrifuge data were obtained with a Beckman model E centrifuge through the courtesy of Dr. P&l Bjornstad, Institute for Clinical Biochemistry, Uni- versity of Oslo.
Protein Determination-Protein was determined by the biuret method (6). Crystalline, dehydrated bovine serum albumin was used to verify the conversion factor of 0.285 absorbance units per mg of protein in 1 ml of reaction mixture measured at 540 rnp. Protein was also determined from ultraviolet absorp- tion data, with the expression P equal to Atso x 1.55 - A260 X 0.76 (7). It was necessary to apply a correction to these values, changing with the stage of the purification, since the tyrosine-
3630
by guest on August 12, 2019
http://ww
w.jbc.org/
Dow
nloaded from
November 1964 J. G. Hauge 363 1
FIG. 1. Recorder tracings for the reduction of 2,6-dichloro- phenolindophenol. Curve T, transmittance; Curve A, absorbance. Points are shown for the calculated transmittance curve for a reaction following the expression T = 10-B-2.60t where t is reaction time in minutes.
tryptophan content of proteins varies considerably. A solution of bovine serum albumin is thus 20% underestimated by the expression, while the highly purified glucose dehydrogenase is 60% overestimated as compared to the biuret value.
MatetialsThe solution of a-n-glucose was made from anhy- drous dextrose, the solution of P-n-glucose from the crystalline product of Sigma Chemical Company, and the solution of D- glucono-d-lactone from n-gluconolactone of Hoffmann-La Roche and Company. These solutions were made in cold water less than 5 minutes before use. All other chemicals were purchased from commercial sources.
RESULTS
Preparation and Properties of Holoenzyme
Isolation of Enzyme-The purification procedure routinely used is summarized in Table I which contains data from one isolation. All steps were carried out at 2-6”. In detail the procedure was as follows. Frozen cell paste, 137 g was thawed and diluted with 130 ml of 0.1 M phosphate, pH 6. The suspen- sion was passed once through a French pressure cell (American Instruments Company, Inc.) under 9 to 12 tons of pressure and diluted with 45 ml of the above buffer and 200 ml of water. Whole cells and large fragments were sedimented by centrifuga- tion twice, 5 minutes each, at 20,000 X g. The sediment was washed in 80 ml of 0.01 M phosphate, pH 6, and the second supernatant fraction was added to the first. This constitutes the crude extract. Preparation of the extract in this way rather than by grinding with Ballotini beads as previously used (2) was found to give more stable enzyme preparations.
The crude extract was centrifuged for 30 minutes at 20,000 X g to remove smaller fragments, and then made 1% with respect to protamine sulfate. After 30 minutes stirring, the precipitate formed was removed by centrifugation. Solid ammonium sul- fate was added in the steps 0 to 45,45 to 55, 55 to 58, and 58 to 70% saturation, while pH was held at 6.1 to 6.3. The first two steps removed a large proportion of the enzyme units in the form of particle-bound glucose dehydrogenase (2)) whereas the soluble
enzyme precipitated only when the saturation exceeded 58%. The yellow precipitate formed between 58 and 70% saturation was dissolved in 0.005 M phosphate, pH 7, and dialyzed with internal stirring against the same buffer for 5 hours. The ma- terial that became insoluble during the dialysis was removed. At this point the preparation was usually frozen and stored at -2O”, often for several weeks, with only minor losses.
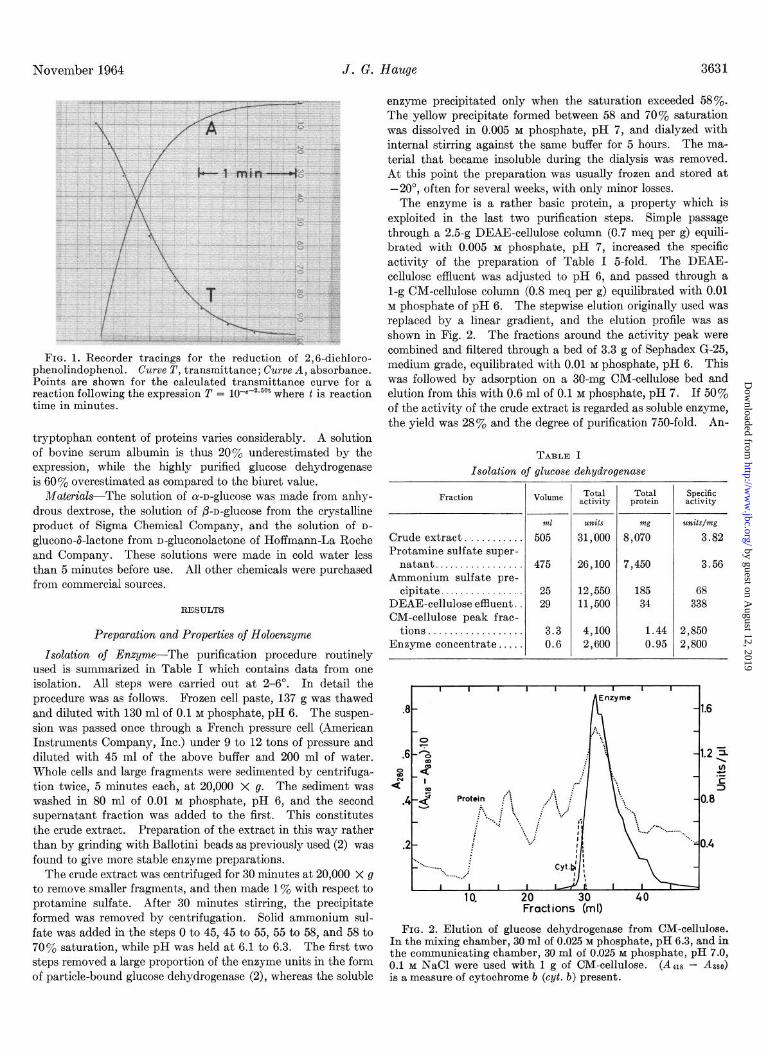
The enzyme is a rather basic protein, a property which is exploited in the last two purification steps. Simple passage through a 2.5-g DEAE-cellulose column (0.7 meq per g) equili- brated with 0.005 M phosphate, pH 7, increased the specific activity of the preparation of Table I 5-fold. The DEAE- cellulose effluent was adjusted to pH 6, and passed through a l-g CM-cellulose column (0.8 meq per g) equilibrated with 0.01 M phosphate of pH 6. The stepwise elution originally used was replaced by a linear gradient, and the elution profile was as shown in Fig. 2. The fractions around the activity peak were combined and filtered through a bed of 3.3 g of Sephadex G-25, medium grade, equilibrated with 0.01 M phosphate, pH 6. This was followed by adsorption on a 30-mg CM-cellulose bed and elution from this with 0.6 ml of 0.1 M phosphate, pH 7. If 50% of the activity of the crude extract is regarded as soluble enzyme, the yield was 28% and the degree of purification 750-fold. An-
TABLE I
Isolation of glucose dehydrogenase
Fraction
Crude extract. ‘. . Protamine sulfate super-
natant. Ammonium sulfate pre-
cipitate............... DEAE-cellulose effluent. CM-cellulose peak frac-
tions Enzyme concentrate. . . .
-
--
-
V0hIle
ml
505
Total activity
units
31,000
475 26,100
25 12,550 29 11,500
3.3 4,100 0.6 2,600
Total Specific protein activity
w units/mg 8,070 3.82
7,450
185 34
1.44 0.95
3.56
68 338
2,850 2,800
FIG. 2. Elution of glucose dehydrogenase from CM-cellulose. In the mixing chamber, 30 ml of 0.025 M phosphate, pH 6.3, and in the communicating chamber, 30 ml of 0.025 M phosphate, pH 7.0, 0.1 M NaCl were used with 1 g of CM-cellulose. (AU - Ad is a measure of cytochrome b (cyt. b) present.
by guest on August 12, 2019
http://ww
w.jbc.org/
Dow
nloaded from
3632 Glucose Dehydrogenase of Bacterium anitratum Vol. 239, No. 11
other 25% of the original units were obtained from side fractions of the CM-cellulose column in 500-fold purification.
Purity of Enzyme-Comparison of the 280-rnb profile and the activity curve of Fig. 2 indicates glucose dehydrogenase to be the dominating component in the area near the peak. The average specific activity for the combined fractions was 9% lower than that of the peak fraction. The specific activity of the pure enzyme is thus equal to or somewhat larger than 1.10 X 2850 E 3150 units per mg. This estimate agrees fairly well with the appearance in the analytical ultracentrifuge of a preparation of specific activity of 2600 (Fig. 3). The slower sedimenting com- ponent is seen to be approximately 20 to 30% of the total. The difficulty encountered in attempting to separate the dehydro- genase from cytochrome 6 with the stepwise elution procedure (2) is understandable from Fig. 2. In order to obtain a prepara- tion completely free from cytochrome b it is necessary to sacrifice some of the early, rather active dehydrogenase fractions.
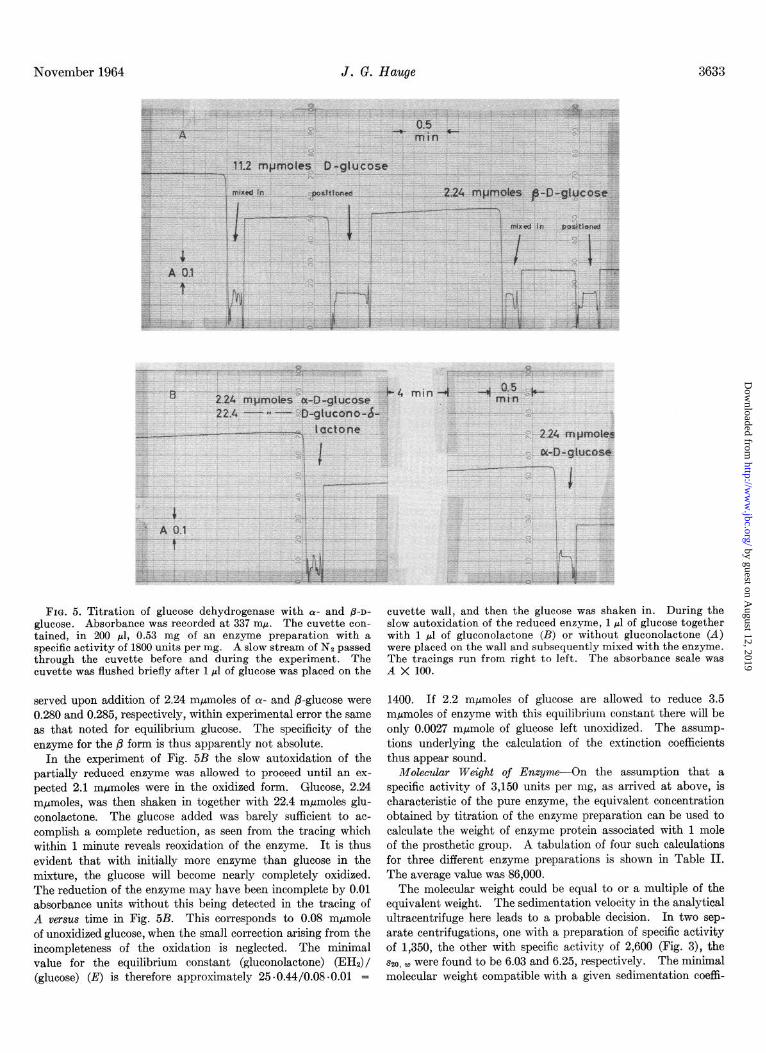
Spectral Properties of Intact Enzyme-The absorption spectrum of the enzyme concentrate of Table I is shown in Fig. 4. The oxidized state is characterized by a broad band in the region of 320 to 390 rnp with peak at 347 mu and by a ratio, A280:A260, of 1.65. On addition of glucose a sharper band appears in the near ultraviolet, as already reported (4), with a maximum at 337 rnp. At the same time the absorption below 300 rnp is reduced, maxi- mally at about 260 mp, so that the ratio, A,,,:A260, is now 1.90. The 337-rnp band also appears with dithionite or borohydride as reducing agent. These spectral features are much like those of muscle triosephosphate dehydrogenase (8), which contains 2 moles of bound NAD per mole of enzyme. As documented in an
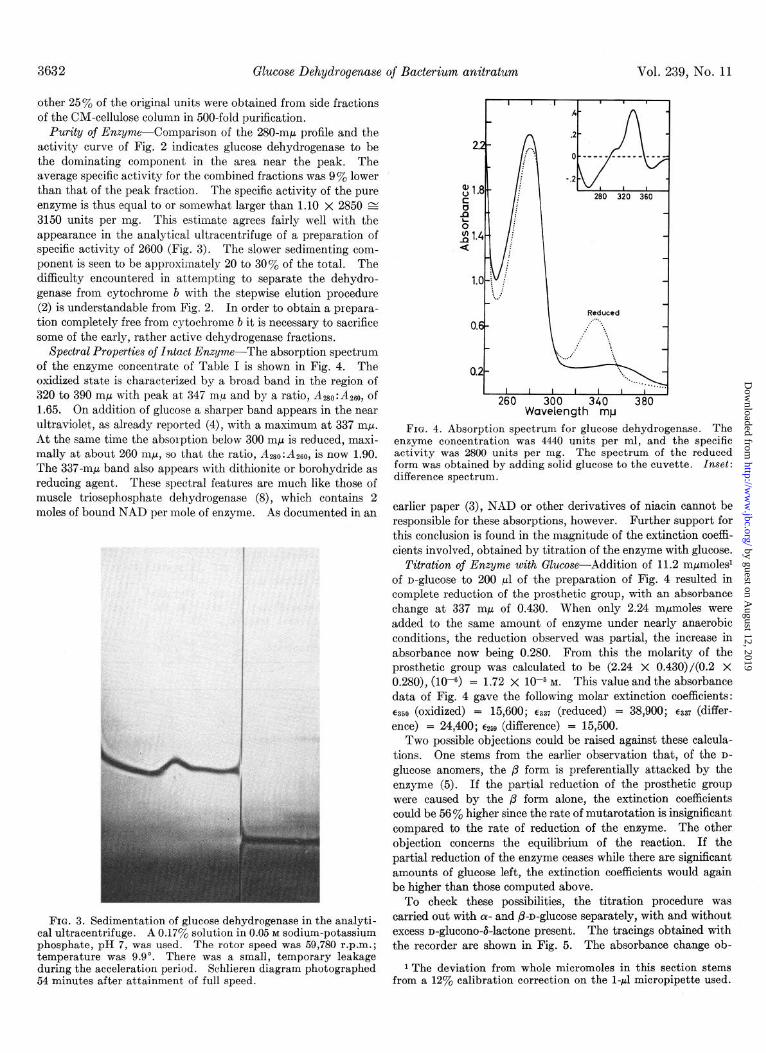
FIG. 3. Sedimentation of glucose dehydrogenase in the analyti- cal ultracentrifuge. A 0.17% solution in 0.05 M sodium-potassium phosphate, pH 7, was used. The rotor speed was 59,780 r.p.m.; temperature was 9.9”. There was a small, temporary leakage during the acceleration period. Schlieren diagram photographed 54 minutes after attainment of full speed.
t I Reduced 1
I I I I , I 1
260 300 340 380 Wavelength mp
FIG. 4. Absorption spectrum for glucose dehydrogenase. The enzyme concentration was 4440 units per ml, and the specific activity was 2800 units per mg. The spectrum of the reduced form was obtained by adding solid glucose to the cuvette. Inset: difference spectrum.
earlier paper (3), NAD or other derivatives of niacin cannot be responsible for these absorptions, however. Further support for this conclusion is found in the magnitude of the extinction coeffi- cients involved, obtained by titration of the enzyme with glucose.
Titration of Enzyme with Glucose-Addition of 11.2 mpmolesl of n-glucose to 200 ~1 of the preparation of Fig. 4 resulted in complete reduction of the prosthetic group, with an absorbance change at 337 rnp of 0.430. When only 2.24 mpmoles were added to the same amount of enzyme under nearly anaerobic conditions, the reduction observed was partial, the increase in absorbance now being 0.280. From this the molarity of the prosthetic group was calculated to be (2.24 X 0.430)/(0.2 X 0.280), (10w6) = 1.72 X low5 M. This value and the absorbance data of Fig. 4 gave the following molar extinction coefficients: ~~50 (oxidized) = 15,600; ~337 (reduced) = 38,900; ~337 (differ- ence) = 24,400; e259 (difference) = 15,500.
Two possible objections could be raised against these calcula- tions. One stems from the earlier observation that, of the D-
glucose anomers, the /3 form is preferentially attacked by the enzyme (5). I f the partial reduction of the prosthetic group were caused by the p form alone, the extinction coefficients could be 56% higher since the rate of mutarotation is insignificant compared to the rate of reduction of the enzyme. The other objection concerns the equilibrium of the reaction. If the partial reduction of the enzyme ceases while there are significant amounts of glucose left, the extinction coefficients would again be higher than those computed above.
To check these possibilities, the titration procedure was carried out with (Y- and &n-glucose separately, with and without excess n-gluconod-lactone present. The tracings obtained with the recorder are shown in Fig. 5. The absorbance change ob-
1 The deviation from whole micromoles in this section stems from a 12% calibration correction on the l-p1 micropipette used.
by guest on August 12, 2019
http://ww
w.jbc.org/
Dow
nloaded from
No\ rember 1964 J. G. Hauge 3633
FIG. 5. Titration of glucose dehydrogenase with (Y- and D-D-
glucose. Absorbance was recorded at 337 rnp. The cuvette con- tained, in 200 ~1, 0.53 mg of an enzyme preparation with a specific activity of 1800 units per mg. A slow stream of Nz passed through the cuvette before and during the experiment. The cuvette was flushed briefly after 1 pl of glucose was placed on the
served upon addition of 2.24 mmnoles of CY- and @-glucose were 0.280 and 0.285, respectively, within experimental error the same as that noted for equilibrium glucose. The specificity of the enzyme for the /3 form is thus apparently not absolute.
In the experiment of Fig. 5B the slow autoxidation of the partially reduced enzyme was allowed to proceed until an ex- pected 2.1 mpmoles were in the oxidized form. Glucose, 2.24 mpmoles, was then shaken in together with 22.4 mMmoles glu- conolactone. The glucose added was barely sufficient to ac- complish a complete reduction, as seen from the tracing which within 1 minute reveals reoxidation of the enzyme. It is thus evident that with initially more enzyme than glucose in the mixture, the glucose will become nearly completely oxidized. The reduction of the enzyme may have been incomplete by 0.01 absorbance units without this being detected in the tracing of A versus time in Fig. 5B. This corresponds to 0.08 mpmole of unoxidized glucose, when the small correction arising from the incompleteness of the oxidation is neglected. The minimal value for the equilibrium constant (gluconolactone) (EHZ) / (glucose) (E) is therefore approximately 25.0.44/0.08 .O.Ol =
cuvette wall, and then the glucose was shaken in. During the slow autoxidation of the reduced enzyme, 1~1 of glucose together with 1 ~1 of gluconolactone (B) or without gluconolactone (A) were placed on the wall and subsequently mixed with the enzyme. The tracings run from right to left. The absorbance scale was A X 100.
1400. If 2.2 mpmoles of glucose are allowed to reduce 3.5 mpmoles of enzyme with this equilibrium constant there will be only 0.0027 mpmole of glucose left unoxidized. The assump- tions underlying the calculation of the extinction coefficients thus appear sound.
Molecular Weight of Enzyme-On the assumption that a specific activity of 3,150 units per mg, as arrived at above, is characteristic of the pure enzyme, the equivalent concentration obtained by titration of the enzyme preparation can be used to calculate the weight of enzyme protein associated with 1 mole of the prosthetic group. A tabulation of four such calculations for three different enzyme preparations is shown in Table II. The average value was 86,000.
The molecular weight could be equal to or a multiple of the equivalent weight. The sedimentation velocity in the analytical ultracentrifuge here leads to a probable decision. In two sep- arate centrifugations, one with a preparation of specific activity of 1,350, the other with specific activity of 2,600 (Fig. 3), the szo, W were found to be 6.03 and 6.25, respectively. The minimal molecular weight compatible with a given sedimentation coeffi-
by guest on August 12, 2019
http://ww
w.jbc.org/
Dow
nloaded from
3634 Glucose Dehydrogenase of Bacterium anitratum Vol. 239, No. 11
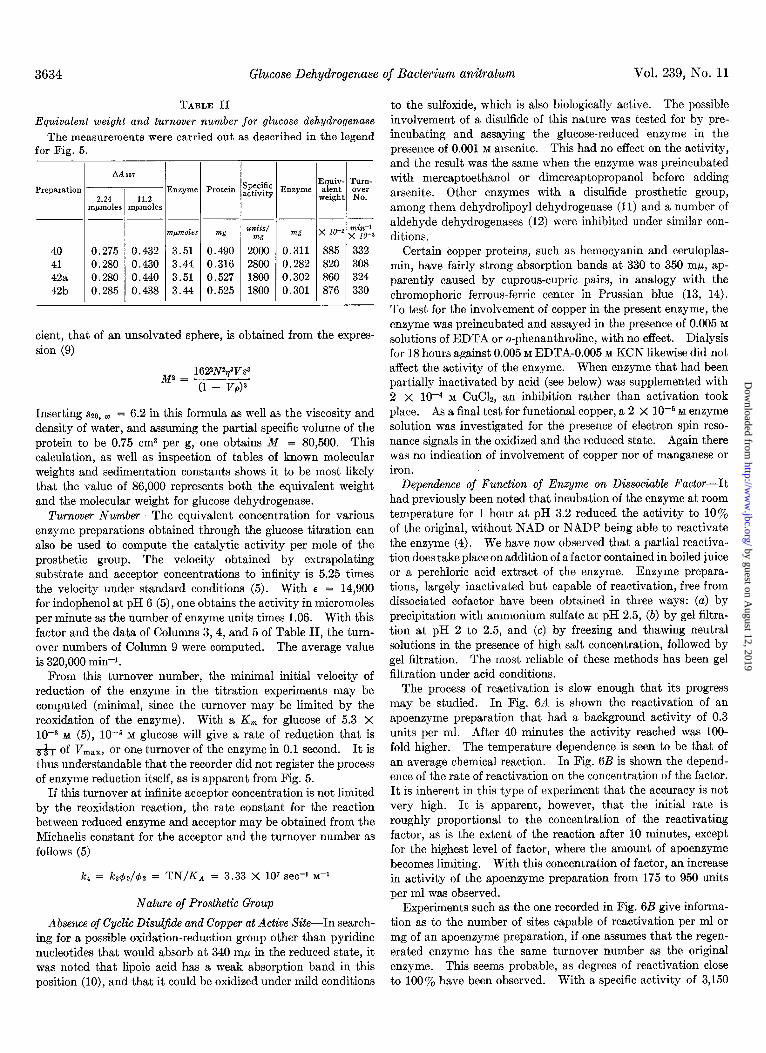
TABLE II Equivalent weight and turnover number for glucose dehydrogenase
The measurements were carried out as described in the legend for Fig. 5.
AAssr
Preparation 2.24 11.2
Enzyme Protein zf$,.i$l
m&lmoles mJLmoles ,
m)mJles nig units/ w
40 0.275 0.432 3.51 0.490 2000 41 0.280 0.430 3.44 0.316 2800 42a 0.280 0.440 3.51 0.527 1800 42b 0.285 0.438 3.44 0.525 1800
0.311 885 332 0.282 820 308 0.302 860 324 0.301 876 330
cient, that of an unsolvated sphere, is obtained from the expres- sion (9)
162W%+Vs3
M2 = (1 - VP)3
Inserting 820, u) = 6.2 in this formula as well as the viscosity and density of water, and assuming the partial specific volume of the protein to be 0.75 cm3 per g, one obtains M = 80,500. This calculation, as well as inspection of tables of known molecular weights and sedimentation constants shows it to be most likely that the value of 86,000 represents both the equivalent weight and the molecular weight for glucose dehydrogenase.
Turnover Number-The equivalent concentration for various enzyme preparations obtained through the glucose titration can also be used to compute the catalytic activity per mole of the prosthetic group. The velocity obtained by extrapolating substrate and acceptor concentrations to infinity is 5.25 times the velocity under standard conditions (5). With E = 14,900 for indophenol at pH 6 (5)) one obtains the activity in micromoles per minute as the number of enzyme units times 1.06. With this factor and the data of Columns 3,4, and 5 of Table II, the turn- over numbers of Column 9 were computed. The average value is 320,000 min-l.
From this turnover number, the minimal initial velocity of reduction of the enzyme in the titration experiments may be computed (minimal, since the turnover may be limited by the reoxidation of the enzyme). With a K, for glucose of 5.3 x 10m3 M (5), 1O-5 M glucose will give a rate of reduction that is -s-&i of VInax, or one turnover of the enzyme in 0.1 second. It is thus understandable that the recorder did not register the process of enzyme reduction itself, as is apparent from Fig. 5.
I f this turnover at infinite acceptor concentration is not limited by the reoxidation reaction, the rate constant for the reaction between reduced enzyme and acceptor may be obtained from the Michaelis constant for the acceptor and the turnover number as follows (5)
k4 = k3+0/& = TN/KA = 3.33 X 10⁷ set-1 M-I
Nature of Prosthetic Group
Absence of Cyclic DisulJide and Copper at Active Site--In search- ing for a possible oxidation-reduction group other than pyridine nucleotides that would absorb at 340 rnp in the reduced state, it was noted that lipoic acid has a weak absorption band in this position (lo), and that it could be oxidized under mild conditions
to the sulfoxide, which is also biologically active. The possible involvement of a disulfide of this nature was tested for by pre- incubating and assaying the glucose-reduced enzyme in the presence of 0.001 M arsenite. This had no effect on the activity, and the result was the same when the enzyme was preincubated with mercaptoethanol or dimercaptopropanol before adding arsenite. Other enzymes with a disulfide prosthetic group, among them dehydrolipoyl dehydrogenase (11) and a number of aldehyde dehydrogenases (12) were inhibited under similar con- ditions.
Certain copper-proteins, such as hemocyanin and ceruloplas- min, have fairly strong absorption bands at 330 to 350 rnp, ap- parently caused by cuprous-cupric pairs, in analogy with the chromophoric ferrous-ferric center in Prussian blue (13, 14). To test for the involvement of copper in the present enzyme, the enzyme was preincubated and assayed in the presence of 0.005 M
solutions of EDTA or o-phenanthroline, with no effect. Dialysis for 18 hours against 0.005 M EDTA-0.005 M KCN likewise did not, affect the activity of the enzyme. When enzyme that had been partially inactivated by acid (see below) was supplemented with 2 x 1O-4 M CuC&, an inhibition rather than activation took place. As a final test for functional copper, a 2 X 10F5 M enzyme solution was investigated for the presence of electron spin reso- nance signals in the oxidized and the reduced state. Again there was no indication of involvement of copper nor of manganese or iron.
Dependence of Function of Enzyme on Dissociable Factor--It had previously been noted that incubation of the enzyme at room temperature for 1 hour at pH 3.2 reduced the activity to 10% of the original, without NAD or NADP being able to reactivate the enzyme (4). We have now observed that a partial reactiva- tion does take place on addition of a factor contained in boiled juice or a perchloric acid extract of the enzyme. Enzyme prepara- tions, largely inactivated but capable of reactivation, free from dissociated cofactor have been obtained in three ways: (a) by precipitation with ammonium sulfate at pH 2.5, (b) by gel filtra- tion at pH 2 to 2.5, and (c) by freezing and thawing neutral solutions in the presence of high salt concentration, followed by gel filtration. The most reliable of these methods has been gel filtration under acid conditions.
The process of reactivation is slow enough that its progress may be studied. In Fig. 6A is shown the reactivation of an apoenzyme preparation that had a background activity of 0.3 units per ml. After 40 minutes the activity reached was lOO- fold higher. The temperature dependence is seen to be that of an average chemical reaction. In Fig. 6B is shown the depend- ence of the rate of reactivation on the concentration of the factor. It is inherent in this type of experiment that the accuracy is not very high. It is apparent, however, that the initial rate is roughly proportional to the concentration of the reactivating factor, as is the extent of the reaction after 10 minutes, except for the highest level of factor, where the amount of apoenzyme becomes limiting. With this concentration of factor, an increase in activity of the apoenzyme preparation from 175 to 950 units per ml was observed.
Experiments such as the one recorded in Fig. 6B give informa- tion as to the number of sites capable of reactivation per ml or mg of an apoenzyme preparation, if one assumes that the regen- erated enzyme has the same turnover number as the original enzyme. This seems probable, as degrees of reactivation close to 100% have been observed. With a specific activity of 3,150
by guest on August 12, 2019
http://ww
w.jbc.org/
Dow
nloaded from
November 1964 J. G. Hauge 3635
Minutes 4 8 12 Minutes
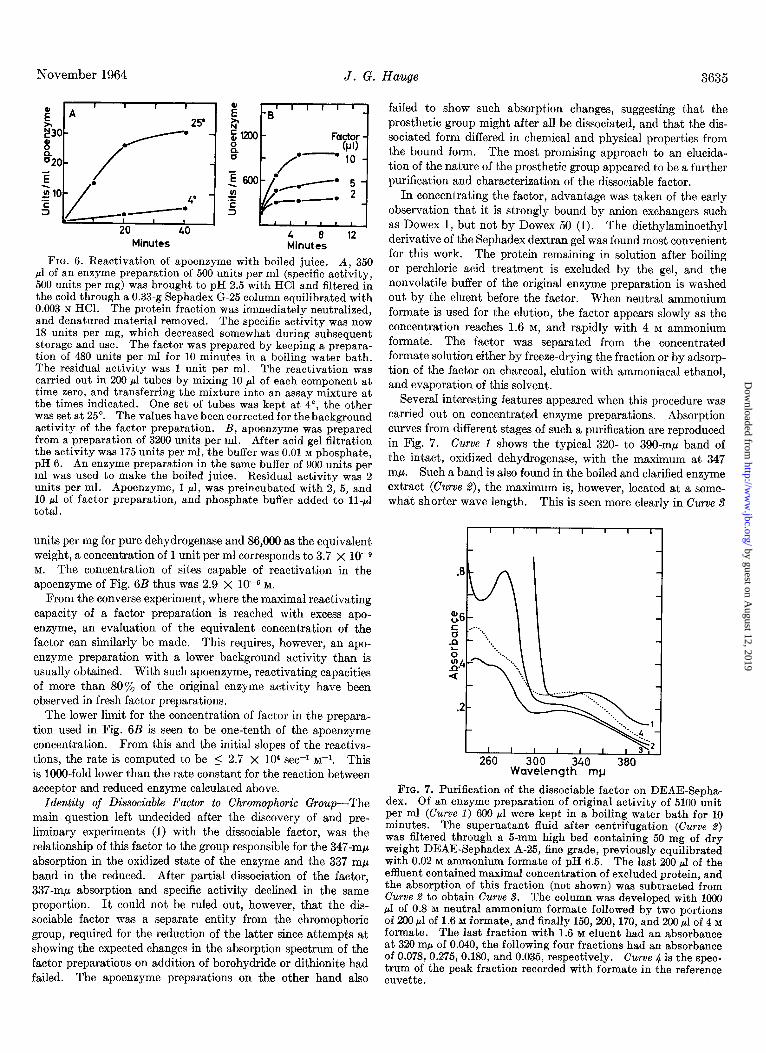
FIG. 6. Reactivation of apoenzyme with boiled juice. A, 350 ~1 of an enzyme preparation of 500 units per ml (specific activity, 500 units per mg) was brought to pH 2.5 with HCl and filtered in the cold through a 0.33-g Sephadex G-25 column equilibrated with 0.003 N HCl. The protein fraction was immediately neutralized, and denatured material removed. The specific activity was now 18 units per mg, which decreased somewhat during subsequent storage and use. The factor was prepared by keeping a prepara- tion of 480 units per ml for 10 minutes in a boiling water bath. The residual activity was 1 unit per ml. The reactivation was carried out in 200.~1 tubes by mixing 10 ~1 of each component at time zero, and transferring the mixture into an assay mixture at the times indicated. One set of tubes was kept at 4”, the other was set at 25”. The values have been corrected for the background activity of the factor preparation. B, apoenzyme was prepared from a preparation of 3200 units per ml. After acid gel filtration the activity was 175 units per ml, the buffer was 0.01 M phosphate, pH 6. An enzyme preparation in the same buffer of 900 units per ml was used to make the boiled juice. Residual activity was 2 units per ml. Apoenzyme, 1 ~1, was preincubated with 2, 5, and 10 ~1 of factor preparation, and phosphate buffer added to ll-~1 total.
units per mg for pure dehydrogenase and 86,000 as the equivalent weight, a concentration of 1 unit per ml corresponds to 3.7 X lo-9 M. The concentration of sites capable of reactivation in the apoensyme of Fig. 6B thus was 2.9 X 10-G M.
From the converse experiment, where the maximal reactivating capacity of a factor preparation is reached with excess apo- enzyme, an evaluation of the equivalent concentration of the factor can similarly be made. This requires, however, an apo- enzyme preparat,ion with a lower background activity than is usually obtained. With such apoenzyme, reactivating capacities of more than 80% of the original enzyme activity have been observed in fresh factor preparations.
The lower limit for the concentration of factor in the prepara- tion used in Fig. 6B is seen to be one-tenth of the apoenzyme concentration. From this and the initial slopes of the reactiva- tions, the rate is computed to be I 2.7 X lo4 see-i ~-1. This is lOOO-fold lower than the rate constant for the reaction between acceptor and reduced enzyme calculated above.
260 300 340 Wavelength mp
380
Identity of D&sociable Factor to Chromophoric Group-The main question left undecided after the discovery of and pre- liminary experiments (1) with the dissociable factor, was the relationship of this factor to the group responsible for the 347-rnp absorption in the oxidized state of the enzyme and the 337 rnp band in the reduced. After partial dissociation of the factor, 337-rnp absorption and specific activity declined in the same proportion. It could not be ruled out, however, that the dis- sociable factor was a separate entity from the chromophoric group, required for the reduction of the latter since attempts at showing the expected changes in the absorption spectrum of the factor preparations on addition of borohydride or dithionite had failed. The apoenzyme preparations on the other hand also
FIG. 7. Purification of the dissociable factor on DEAE-Sepha- dex. Of an enzyme preparation of original activity of 5100 unit per ml (Curve 1) 600 ~1 were kept in a boiling water bath for 10 minutes. The supernatant fluid after centrifugation (Curve Z) was filtered through a 5-mm high bed containing 50 mg of dry weight DEAE-Sephadex A-25, fine grade, previously equilibrated with 0.02 M ammonium formate of pH 6.5. The last 200 ~1 of the effluent contained maximal concentration of excluded protein, and the absorption of this fraction (not shown) was subtracted from Curve B to obtain Curve S. The column was developed with 1000 ~1 of 0.8 M neutral ammonium formate followed by two portions of 200 ~1 of 1.6 M formate, and finally 150,200,170, and 200 ~1 of 4 M formate. The last fraction with 1.6 M eluent had an absorbance at 320 rnN of 0.040, the following four fractions had an absorbance of 0.078,0.275,0.180, and 0.035, respectively. Curve 4 is the spec- trum of the peak fraction recorded with formate in the reference cuvette.
failed to show such absorption changes, suggesting that the prosthetic group might after all be dissociated, and that the dis- sociated form differed in chemical and physical properties from the bound form. The most promising approach to an elucida- tion of the nature of the prosthetic group appeared to be a further purification and characterization of the dissociable factor.
In concentrating the factor, advantage was taken of the early observation that it is strongly bound by anion exchangers such as Dowex 1, but not by Dowex 50 (1). The diethylaminoethyl derivative of the Sephadex dextran gel was found most convenient for this work. The protein remaining in solution after boiling or perchloric acid treatment is excluded by the gel, and the nonvolatile buffer of the original enzyme preparation is washed out by the eluent before the factor. When neutral ammonium formate is used for the elution, the factor appears slowly as the concentration reaches 1.6 M, and rapidly with 4 M ammonium formate. The factor was separated from the concentrated formate solution either by freeze-drying the fraction or by adsorp- tion of the factor on charcoal, elution with ammoniacal ethanol, and evaporation of this solvent.
Several interesting features appeared when this procedure was carried out on concentrated enzyme preparations. Absorption curves from different stages of such a purification are reproduced in Fig. 7. Curve 1 shows the typical 320- to 390-rnp band of the intact, oxidized dehydrogenase, with the maximum at 347 rnp. Such a band is also found in the boiled and clarified enzyme extract (Curve .2), the maximum is, however, located at a some- what shorter wave length. This is seen more clearly in Curve S
by guest on August 12, 2019
http://ww
w.jbc.org/
Dow
nloaded from
3636 Glucose Dehydrogenase of Bacterium anitratum Vol. 239, No. 11
which is the difference between Curve 2 and the absorption of the high molecular material of the extract that was excluded by the gel. This curve also shows that the low molecular portion of the boiled juice has characteristic absorption bands in the region of 240 to 300 mp. Some material with absorption at 260 rnp appeared with formate concentrations below 1.6 M, unac- companied, however, by the higher band and by factor activity. The peak fraction of cofactor activity had the absorption spec- trum of Curve 4, similar to that of the corrected boiled juice spectrum. These observations give strong support to the hypothesis that the active principle of the boiled juice and the spectrally demonstrable prosthetic group of the intact enzyme are identical. The finding of bands in the region of 240 to 300 rnp is in agreement with expectations for the isolated prosthetic group because of the minimum in the difference spectrum for the oxidized-reduced enzyme at 260 rnp (Fig. 4).
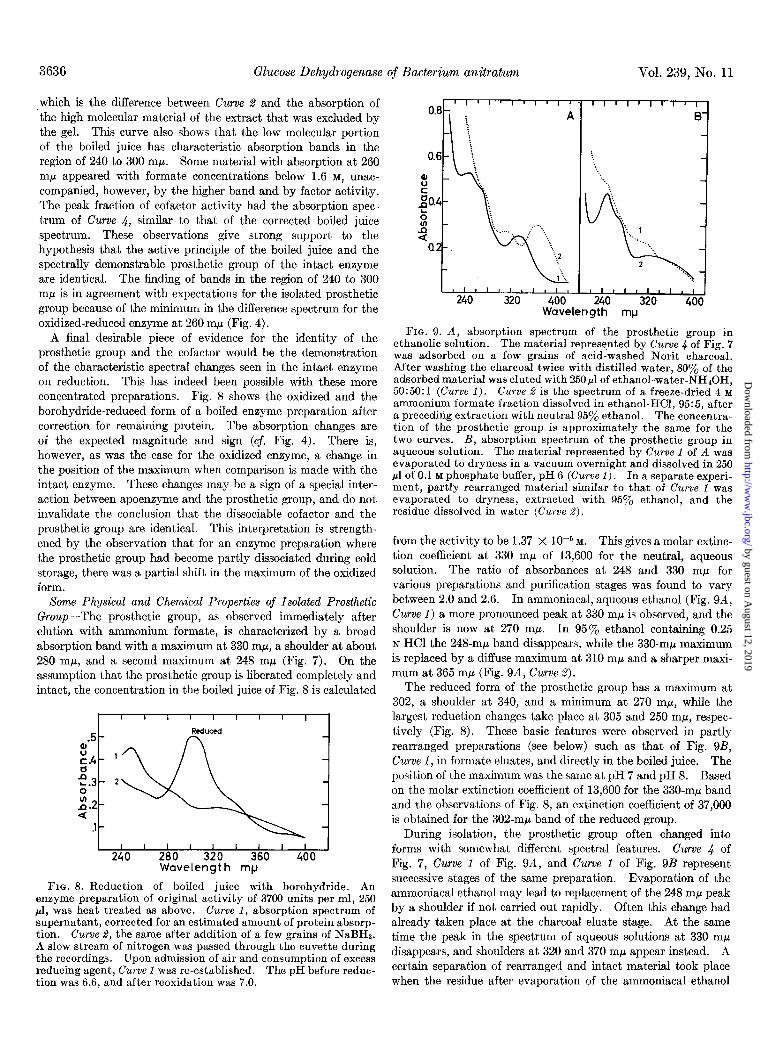
A final desirable piece of evidence for the identity of the prosthetic group and the cofactor would be the demonstration of the characteristic spectral changes seen in the intact enzyme on reduction. This has indeed been possible with these more concentrated preparations. Fig. 8 shows the oxidized and the borohydride-reduced form of a boiled enzyme preparation after correction for remaining protein. The absorption changes are of the expected magnitude and sign (cf. Fig. 4). There is, however, as was the case for the oxidized enzyme, a change in the position of the maximum when comparison is made with the intact enzyme. These changes may be a sign of a special inter- action between apoenzyme and the prosthetic group, and do not invalidate the conclusion that, the dissociable cofactor and the prosthetic group are identical. This interpretation is strength- ened by the observation that for an enzyme preparation where the prosthetic group had become partly dissociated during cold storage, there was a partial shift in the maximum of the oxidized form.
Some Physical and Chemical Properties of Isolated Prosthetic Group-The prosthetic group, as observed immediately after elution with ammonium formate, is characterized by a broad absorption band with a maximum at 330 mp, a shoulder at about 280 rnp, and a second maximum at 248 rnp (Fig. 7). On the assumption that the prosthetic group is liberated completely and intact, the concentration in the boiled juice of Fig. 8 is calculated
I I I I I I I I I I I 240 280 320 360 400
Wavelength mp
FIG. 8. Reduction of boiled juice with borohydride. An enzyme preparation of original activity of 3700 units per ml, 250 ~1, was heat treated as above. Curve 1, absorption spectrum of supernatant, corrected for an estimated amount of protein absorp- tion. Curwe 2, the same after addition of a few grains of NaBHa. A slow stream of nitrogen was passed through the cuvette during the recordings. Upon admission of air and consumption of excess reducing agent, Curve 1 was re-established. The nH before reduc- tion was6.6, and after reoxidation was 7.0.
LII! I I II I Illl,lrl,l#,r,l 240 320 400 240 320 400
Wavelength mp
FIG. 9. A, absorption spectrum of the prosthetic group in ethanolic solution. The material represented by Curve 4 of Fig. 7 was adsorbed on a few grains of acid-washed Norit charcoal. After washing the charcoal twice with distilled water, 80% of the adsorbed material was eluted with 250~1 of ethanol-water-NH40H, 50:50:1 (Curve 1). Curve 2 is the spectrum of a freeze-dried 4 M ammonium formate fraction dissolved in ethanol-HCl, 95:5, after a preceding extraction with neutral 95% ethanol. The concentra- tion of the prosthetic group is approximately the same for the two curves. B, absorption spectrum of the prosthetic group in aqueous solution, The material represented by Curve 1 of A was evaporated to dryness in a vacuum overnight and dissolved in 250 ~1 of 0.1 M phosphate buffer, nH 6 (Curve 1). In a senarate exneri- _ _ ._ ment, partly rearranged material similar to that of Curve 1 was evaporated to dryness, extracted with 95% ethanol, and the residue dissolved in water (Curve 2).
from the activity to be 1.37 X 1O-5 M. This gives a molar extinc- tion coefficient at 330 rnp of 13,600 for the neutral, aqueous solution. The ratio of absorbances at 248 and 330 rnp for various preparations and purification stages was found to vary between 2.0 and 2.6. In ammoniacal, aqueous ethanol (Fig. QA, Curve 1) a more pronounced peak at 330 rnp is observed, and the shoulder is now at 270 rnp. In 95% ethanol containing 0.25 N HCl the 248-rnp band disappears, while the 330-rnp maximum is replaced by a diffuse maximum at 310 rnp and a sharper maxi- mum at 365 rnp (Fig. QA, Curve @.
The reduced form of the prosthetic group has a maximum at 302, a shoulder at 340, and a minimum at 270 m/l, while the largest reduction changes take place at 305 and 250 mp, respec- tively (Fig. 8). These basic features were observed in partly rearranged preparations (see below) such as that of Fig. QB, Curve 1, in formate eluates, and directly in the boiled juice. The position of the maximum was the same at pH 7 and pH 8. Based on the molar extinction coefficient of 13,600 for the 330-rnp band and the observations of Fig. 8, an extinction coefficient of 37,000 is obtained for the 302-rnp band of the reduced group.
During isolation, the prosthetic group often changed into forms with somewhat different spectral features. Curve 4 of Fig. 7, Curve 1 of Fig. QA, and Curve 1 of Fig. QB represent successive st,ages of the same preparation. Evaporation of the ammoniacal ethanol may lead to replacement of the 248 rnp peak by a shoulder if not carried out rapidly. Often this change had already taken place at the charcoal eluate stage. At the same time the peak in the spectrum of aqueous solutions at 330 rnp disappears, and shoulders at 320 and 370 rnp appear instead. A certain separation of rearranged and intact material took place when the residue after evaporation of the ammoniacal ethanol
by guest on August 12, 2019
http://ww
w.jbc.org/
Dow
nloaded from
November 1964 J. G. Hauge
was first extracted with 95% ethanol. In one experiment, 80% of the 330-rnp absorbing material and half the factor activity went into solution in ethanol. The residue dissolved in water had the absorption spectrum shown in Curve 2 of Fig. 9B and a factor activity per unit of absorbance at 330 rnp equal to that of fresh boiled juice.
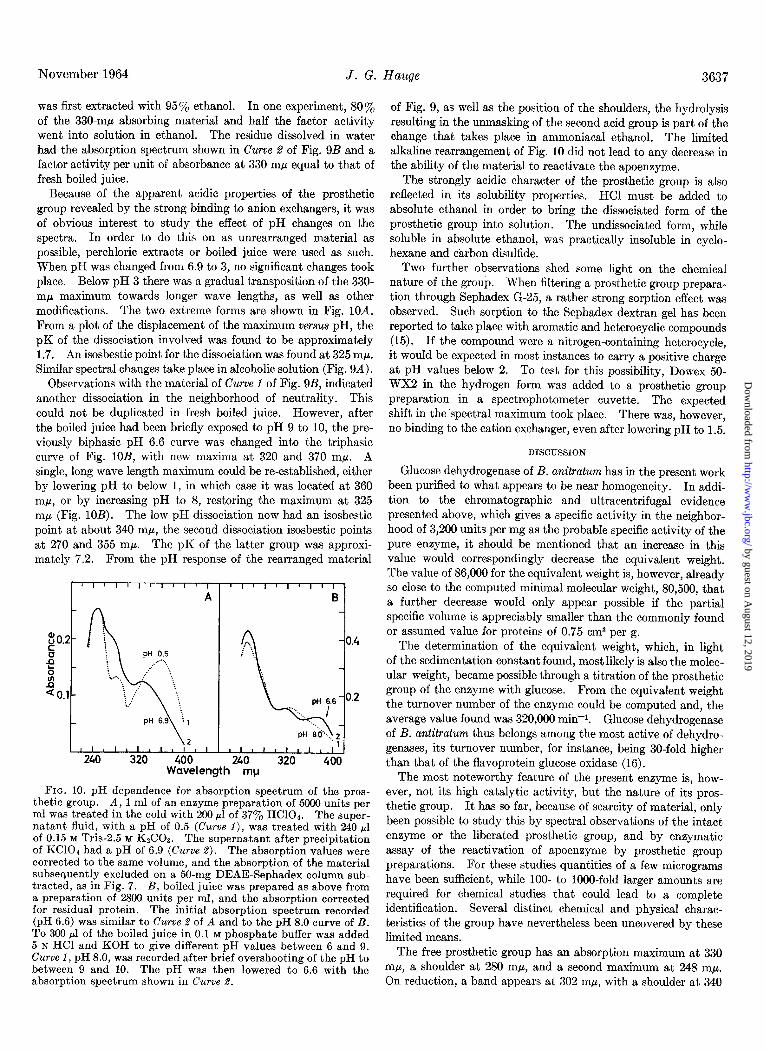
Because of the apparent acidic properties of the prosthetic group revealed by the strong binding to anion exchangers, it was of obvious interest to study the effect of pH changes on the spectra. In order to do this on as unrearranged material as possible, perchloric extracts or boiled juice were used as such. When pH was changed from 6.9 to 3, no significant changes took place. Below pH 3 there was a gradual transposition of the 330- rnp maximum towards longer wave lengths, as well as other modifications. The two extreme forms are shown in Fig. 10A. From a plot of the displacement of the maximum versus pH, the pK of the dissociation involved was found to be approximately 1.7. An isosbestic point for the dissociation was found at 325 rnp. Similar spectral changes take place in alcoholic solution (Fig. 94).
Observations with the material of Curve 1 of Fig. 9B, indicated another dissociation in the neighborhood of neutrality. This could not be duplicated in fresh boiled juice. However, after the boiled juice had been briefly exposed to pH 9 to 10, the pre- viously biphasic pH 6.6 curve was changed into the triphasic curve of Fig. lOB, with new maxima at 320 and 370 rnp. A single, long wave length maximum could be re-established, either by lowering pH to below 1, in which case it was located at 360 rnp, or by increasing pH to 8, restoring the maximum at 325 rnp (Fig. 10B). The low pH dissociation now had an isosbestic point at about 340 mp, the second dissociation isosbestic points at 270 and 355 mp. The pK of the latter group was approxi- mately 7.2. From the pH response of the rearranged material
Wavelength mp
FIG. 10. pH dependence for absorption spectrum of the pros- thetic group. A, 1 ml of an enzyme preparation of 5000 units per ml was treated in the cold with 200 ~1 of 37% HClOa. The super- natant fluid, with a pH of 0.5 (Curve 1), was treated with 240 bl of 0.15 M Tris-2.5 M K&03. The supernatant after precipitation of KC104 had a pH of 6.9 (Curve 2). The absorption values were corrected to the same volume, and the absorption of the material subsequently excluded on a 50.mg DEAE-Sephadex column sub- tracted, as in Fig. 7. B, boiled juice was prepared as above from a preparation of 2800 units per ml, and the absorntion corrected for residual protein. The initial absorption speitrum recorded (pH 6.6) was similar to Curve 2 of A and to the pH 8.0 curve of B. To 300 ~1 of the boiled juice in 0.1 M phosphate buffer was added 5 N HCI and KOH to give different pH values between 6 and 9. Curve 1, pH 8.0, was recorded after brief overshooting of the pH to between 9 and 10. The pH was then lowered to 6.6 with the absorption spectrum shown in Curve 2.
3637
of Fig. 9, as well as the position of the shoulders, the hydrolysis resulting in the unmasking of the second acid group is part of the change that takes place in ammoniacal ethanol. The limited alkaline rearrangement of Fig. 10 did not lead to any decrease in the ability of the material to reactivate the apoenzyme.
The strongly acidic character of the prosthetic group is also reflected in its solubility properties. HCl must be added to absolute ethanol in order to bring the dissociated form of the prosthetic group into solution. The undissociated form, while soluble in absolute ethanol, was practically insoluble in cyclo- hexane and carbon disulfide.
Two further observations shed some light on the chemical nature of the group. When filtering a prosthetic group prepara- tion through Sephadex G-25, a rather strong sorption effect was observed. Such sorption to the Sephadex dextran gel has been reported to take place with aromatic and heterocyclic compounds (15). I f the compound were a nitrogen-containing heterocycle, it would be expected in most instances to carry a positive charge at pH values below 2. To test for this possibility, Dowex 50- WX2 in the hydrogen form was added to a prosthetic group preparation in a spectrophotometer cuvette. The expected shift in the ‘spectral maximum took place. There was, however, no binding to the cation exchanger, even after lowering pH to 1.5.
DISCUSSION
Glucose dehydrogenase of B. anitratum has in the present work been purified to what appears to be near homogeneity. In addi- tion to the chromatographic and ultracentrifugal evidence presented above, which gives a specific activity in the neighbor- hood of 3,200 units per mg as the probable specific activity of the pure enzyme, it should be mentioned that an increase in this value would correspondingly decrease the equivalent weight. The value of 86,000 for the equivalent weight is, however, already so close to the computed minimal molecular weight, 80,500, that a further decrease would only appear possible if the partial specific volume is appreciably smaller than the commonly found or assumed value for proteins of 0.75 cm3 per g.
The determination of the equivalent weight, which, in light of the sedimentation constant found, most likely is also the molec- ular weight, became possible through a titration of the prosthetic group of the enzyme with glucose. From the equivalent weight the turnover number of the enzyme could be computed and, the average value found was 320,000 min-I. Glucose dehydrogenase of B. antitratum thus belongs among the most active of dehydro- genases, its turnover number, for instance, being 30-fold higher than that of the flavoprotein glucose oxidase (16).
The most noteworthy feature of the present enzyme is, how- ever, not its high catalytic activity, but the nature of its pros- thetic group. It has so far, because of scarcity of material, only been possible to study this by spectral observations of the intact enzyme or the liberated prosthetic group, and by enzymatic assay of the reactivation of apoenzyme by prosthetic group preparations. For these studies quantities of a few micrograms have been sufficient, while lOO- to 1000-fold larger amounts are required for chemical studies that could lead to a complete identification. Several distinct chemical and physical charac- teristics of the group have nevertheless been uncovered by these limited means.
The free prosthetic group has an absorption maximum at 330 rnp, a shoulder at 280 mp, and a second maximum at 248 mp. On reduction, a band appears at 302 mp, with a shoulder at 340
by guest on August 12, 2019
http://ww
w.jbc.org/
Dow
nloaded from
3638 Glucose Dehydrogenase of Bacterium anitratum Vol. 239, No. 11
rnp. The absorption in the region of 240 to 280 rnp at the same time declines. The free prosthetic group thus in general has spectral properties agreeing with observations made with the intact enzyme. The maxima are, however, shifted to shorter wave lengths, the change being 17 rnp for the oxidized form and 35 rnp for the reduced form. These shifts may be an expression of a rather strong interaction between the prosthetic group and the protein, such as have been observed for liver alcohol dehy- drogenase and NAD (17), the old yellow enzyme and flavin mononucleotide (18), and in other instances. The shift is ex- ceptionally large for the reduced form. A shoulder remains, however, for the free prosthetic group at the position of the maximum of the bound form, and the difference spectrum for the intact enzyme conversely indicates a shoulder at the position of the maximum for the free group (Fig. 4).
Equally as important for the characterization of the compound as the position of the absorption bands are, of course, their extinc- tion values. These have been determined through titration with glucose. The long wave length band of the oxidized prosthetic group is rather strong, log e being 4.13. Even stronger is the absorption of the reduced group, log E here being close to 4.6 both for the free and the attached group. This is 6-fold higher than the molar absorbtivity for reduced pyridine nucleotides at 340 mp. The 248 rnp band of the oxidized form has a log e of about 4.5.
These spectral features, together with the finding of an un- charged acid group of pK 1.7 and an additional, easily hydro- lyzed group of pK 7.2 greatly narrows the field of possible can- didates for the unknown oxidation-reduction group of the enzyme, without, however, in any way deciding the issue. One type of compound which offers itself as an attractive possibility is a suitably substituted 1,4naphthoquinone. 1,4-Naphtho- quinone has absorption maxima at 330 and 250 mp, coupled with increased absorption at about 330 rnp in the reduced state, and decreased absorption between 260 and 280 mp. Furthermore, certain naphthoquinones are known for their participation in electron transport, at least in vitro (19). They have suitable oxidation-reduction potentials for this task, & (pH 7) ranging between +0.036 and -0.260 volt for various derivatives (20). A glucose dehydrogenase with a naphthoquinone as a prosthetic group would thus become completely reduced by an equivalent amount of glucose, as was indeed observed for the present en- zyme, since the glucose-gluconolactone couple has an &’ (pH 7) of -0.32 volt (21). The main difficulty with the naphthoqui- none hypothesis is that the 330 rnp band, especially, of the un- substituted compound is rather weak, log e being 3.44 (22). It does not appear impossible, however, that suitable substitutions with hydroxyl, carbonyl, and carboxyl could both increase the intensity of this band, and at the same time give the compound the required water solubility and acidity. Anthraquinone, which contains the same chromophore, C,H,CO .R, thus has a log e for this band of 3.75, and 2,6-dihydroxyanthraquinone has a log E of 3.9 for the same band (22).
The prosthetic group of the soluble and the particulate glucose dehydrogenases of B. anitratum may well have a wider occur- rence. A particulate glucose dehydrogenase from Rhodopseu- domonas spheroides was observed to require an unknown factor present in the boiled soluble fraction for the reduction of phena- zine methosulfate or ferricyanide (23, 24). This factor was adsorbed by anion exchange resins and charcoal, as is the B.
anitratum factor. The Rhodopseudomonas enzyme, furthermore, could be reactivated by a boiled extract of B. anitratum.2 Glu- cose-oxidizing particles of Pseudomonas Jluorescens and Acetobac- ter suboxydans were shown to have several traits in common with the B. anitratum particles (25). These, and the long series of other particle-bound glucose dehydrogenases of Acetobacter and Pseudomonas species are thus the most promising material in a further search for the new prosthetic group. It is possible that one of these other organisms would be the richer source which is desirable in order to produce the group in quantities sufficient for chemical analysis.
SUMMARY
Glucose dehydrogenase of Bacterium anitratum has been purified to a state close to homogeneity. Its equivalent weight was found to be 86,000 =t 4%‘,, based on titration of the prosthetic group of the enzyme with glucose. The ~20, w value of 6.2 sug- gests this to be the molecular weight as well. The turnover number of the enzyme is 320,000 min+.
The prosthetic group is revealed in the absorption spectrum of the dehydrogenase as a broad band at 347 rnp (log 6, 4.18). On reduction of the enzyme with glucose, a sharper band at 337 nip appears (log E, 4.59). When the enzyme is boiled, a factor that will reactivate enzyme preparations inactivated by gel filtration at pH 2.5 is liberated. This factor has been concentrated and purified by chromatography on small columns of DEAE-Sepha- dex. The spectral properties of the product strongly suggest that the dissociable factor and the prosthetic group are identical. The maximum of the oxidized form, as well as the maximum observed upon reduction with sodium borohydride are, however, shifted to somewhat shorter wave lengths, to 330 and 302 rnp, respectively. The extinction coefficients at the maxima were similar to those observed for the intact enzyme, log e being 4.13 and 4.57, respectively. The liberated prosthetic group in its oxidized form is further characterized by a maximum at 248 rnb (log E, 4.5), and a shoulder at 270 to 280 mp. A decrease in absorption takes place in the region of 240 to 270 rnp upon reduc- tion, a phenomenon also observed for the glucose-reduced intact enzyme.
Spectral observations of the free prosthetic group at different pH values revealed an acid dissociation constant with a pK of 1.7. Under mildly alkaline conditions, the prosthetic group readily underwent a hydrolysis resulting in the appearance of a second dissociation, with a pK of 7.2. The latter form of the prosthetic group showed undiminished capacity to reactivate apoenzyme.
Adcnowledgment-The skillful technical assistance of Ingeborg Winsnes is gratefully acknowledged.
REFERENCES
1. HAUGE, J. G., Acta Chem. &and., 17, 898 (1963). 2. HAUGE, J. G., Biochim. et Biophys. Acta, 46, 250 (1960). 3. HAUGE, J. G., AND MOORER, E. H., Biochim. et Biophys. Acta,
81, 244 (1964). 4. HAUQE, J. G., Arch. Biochem. Biophys., 94,308 (1961). 5. HAUGE, J. G., Biochim. et Biophys. Acta, 45, 263 (1960). 6. GORNALL, A. G., BARDAWILL, C. J., AND DAVID, M. M., J.
Biol. Chem., 1’7’7, 751 (1949). 7. COLOWICK, S. P., AND KAPLAN, N. 0. (Editors), Methods in
enzymology, Vol. III, Academic Press, Inc., New York, 1957, p. 454.
2 D. J. Niederpruem, personal communication.
by guest on August 12, 2019
http://ww
w.jbc.org/
Dow
nloaded from
November 1964 J. G. Hauge 3639
8. 9.
10.
11.
12.
13. 14.
15. 16.
VELICK, S. F., J. Biol. Chem., 203, 563 (1953). GREENBERG, D. M., Amino acids and proteins, Charles C
Thomas, Springfield, Ill., 1951, p. 375. BARLTROP, J. A., HAYES, P. M., AND CALVIN, M., J. Am. Chem.
Sot., 76, 4348 (1954). SEARLS, R. L., PETERS, J. M., AND SANADI, D. R., J. Biol.
Chem., 236, 2317 (1961). JACOBY, W. B., in P. D. BOYER, H. LARDY, AND K. MYRBXCK
(Editors), The enzymes, Vol. 7, Academic Press, Inc., New York, 1963, p. 203.
KLOTZ, I. M., AND KLOTZ, T. A., Science, 121, 477 (1955). BLTJMBERG, W. E., AND EISINGER, J., J. Biol. Chem., 238, 1675
(1963). GELOTTE, B., J. Chromatog., 3, 330 (1960). BENTLEY, R., in P. D. BOYER, H. LARDY, AND K. MYRBXCK
(Editors), The enzymes, Vol. 7, Academic Press, Inc., New York, 1963, p. 585.
17. THEORELL, H., AND BONNICHSEN, R., Acta Chem. Stand., 6, 1105 (1951).
18. THEORELL, H., AND MESON, A., Arch. Biochem. Biophys., 66, 439 (1956).
19.
20.
21.
22. 23.
24.
25.
DAM, H., AND S~NDERGAARD, E., in P. D. BOYER, H. LARDY, AND K. MYRB~CK (Editors). The enzumes. Vol. SB, Academic Press, Inc., New York, 1960, p. 342: ’ ’
WALLENFELS, K., AND M~HLE, W., Ber. deut. them. Ges., 76B, 924 (1943).
STRECKER, H. J., AND KORKES, S., J. Biol. Chem., 196, 769 (1952).
MORTON, R. A., AND EARLAM, W. T., J. Chem. Sot., 159 (1941). SZYMONA, M., AND DOUDOROFF, M., J. Gen. Microbial., 22, 167
(1960). NIEDERPRUEM, D. J., AND DOUDOROFF, M., Bacteriological
proceedings, Society of American Bacteriologists, Baltimore, i961, p. 16i. -
HAUGE, J. G., J. Bacterial., 82, 609 (1961).
by guest on August 12, 2019
http://ww
w.jbc.org/
Dow
nloaded from
Jens G. HaugeProsthetic Group
an Enzyme with a NovelBacterium anitratum:Glucose Dehydrogenase of
1964, 239:3630-3639.J. Biol. Chem.
http://www.jbc.org/content/239/11/3630.citation
Access the most updated version of this article at
Alerts:
When a correction for this article is posted•
When this article is cited•
to choose from all of JBC's e-mail alertsClick here
http://www.jbc.org/content/239/11/3630.citation.full.html#ref-list-1
This article cites 0 references, 0 of which can be accessed free at
by guest on August 12, 2019
http://ww
w.jbc.org/
Dow
nloaded from