glosho'14: germany showcase - angelika geiger
TRANSCRIPT

Energiewende in Germany: from generation to integration
Germany Trade and Invest
Angelika Geiger
16.10.2014 | www.gtai.com
•Main Objectives
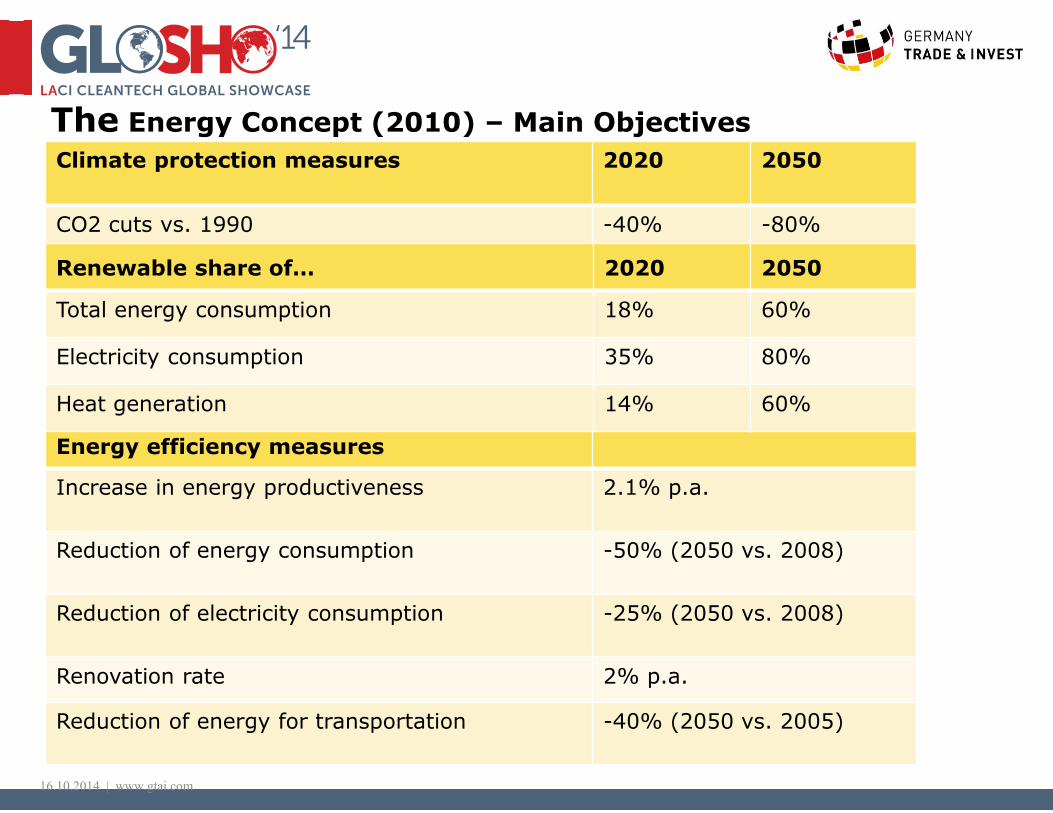
The Energy Concept (2010) – Main Objectives
Energy efficiency measures
Increase in energy productiveness 2.1% p.a.
Reduction of energy consumption -50% (2050 vs. 2008)
Reduction of electricity consumption -25% (2050 vs. 2008)
Renovation rate 2% p.a.
Reduction of energy for transportation -40% (2050 vs. 2005)
Climate protection measures 2020 2050
CO2 cuts vs. 1990 -40% -80%
Renewable share of… 2020 2050
Total energy consumption 18% 60%
Electricity consumption 35% 80%
Heat generation 14% 60%

16.10.2014 | www.gtai.com
Total capacity of renewables (End 2000)
Wind energy
PV
Biomass
The circle diameter is proportional to the electrical capacity
~ 30,000 installations
Sources: 50HertzT, TenneT, Amprion, TransnetBW, internal data
~ 221,000 installations
Total capacity of renewables (End 2005)
~ 750,000 installations
Total capacity of renewables (End 2010)
~ 1.300.000 installations
Total capacity of renewables (End 2012)

www.gtai.com
Due to the nuclear disaster in
Fukushima in 2011, closure of nuclear
power plants was brought forward from
2036 to 2022
8 out of 17 nuclear power plants were
already shut down in 2011
2011: 17.6% nuclear power of total
energy consumption (2010: 22.6%)1
Germany‘s nuclear power phase-out
1) Quelle: BMWi „Die Energiewende in Deutschland“, Februar 2012
2) Quelle: DAtF, 2012
Active nuclear reactor with
date of scheduled closure
Nuclear reactor already closed
Berlin
Hamburg
Cologne
Munich
Stuttgart
Frankfurt
2021
2022
2021
2021
2017 2022
20192022
2015
21.547
4.285
0 0
5000
10000
15000
20000
25000
2010 2011 2012 2015 2019 2021 2022 2023
Development of installed nuclear power plants capacity in MW2
22.6 % of
electricity
generation
(2010)
In 2012:
99 TWh electricty produced which
accounts for 16% of nuclear power!
16.10.2014 | www.gtai.com
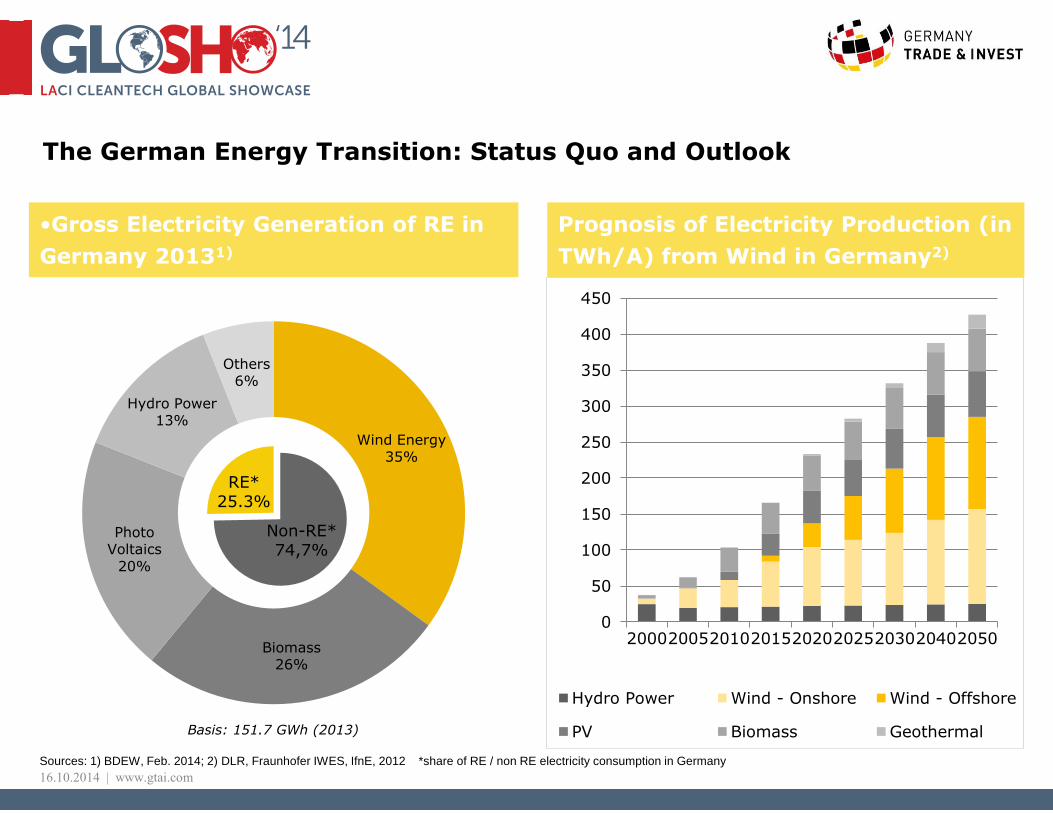
The German Energy Transition: Status Quo and Outlook
•Gross Electricity Generation of RE in
Germany 20131)
• of renewable energies Prognosis of yearly
installed offshore capacity (in GW)1)
Sources: 1) BDEW, Feb. 2014; 2) DLR, Fraunhofer IWES, IfnE, 2012 *share of RE / non RE electricity consumption in Germany
Wind Energy 35%
Biomass 26%
Photo Voltaics
20%
Hydro Power 13%
Others 6%
Non-RE* 74,7%
RE* 25.3%
Basis: 151.7 GWh (2013)
Prognosis of Electricity Production (in
TWh/A) from Wind in Germany2)
0
50
100
150
200
250
300
350
400
450
200020052010201520202025203020402050
Hydro Power Wind - Onshore Wind - Offshore
PV Biomass Geothermal
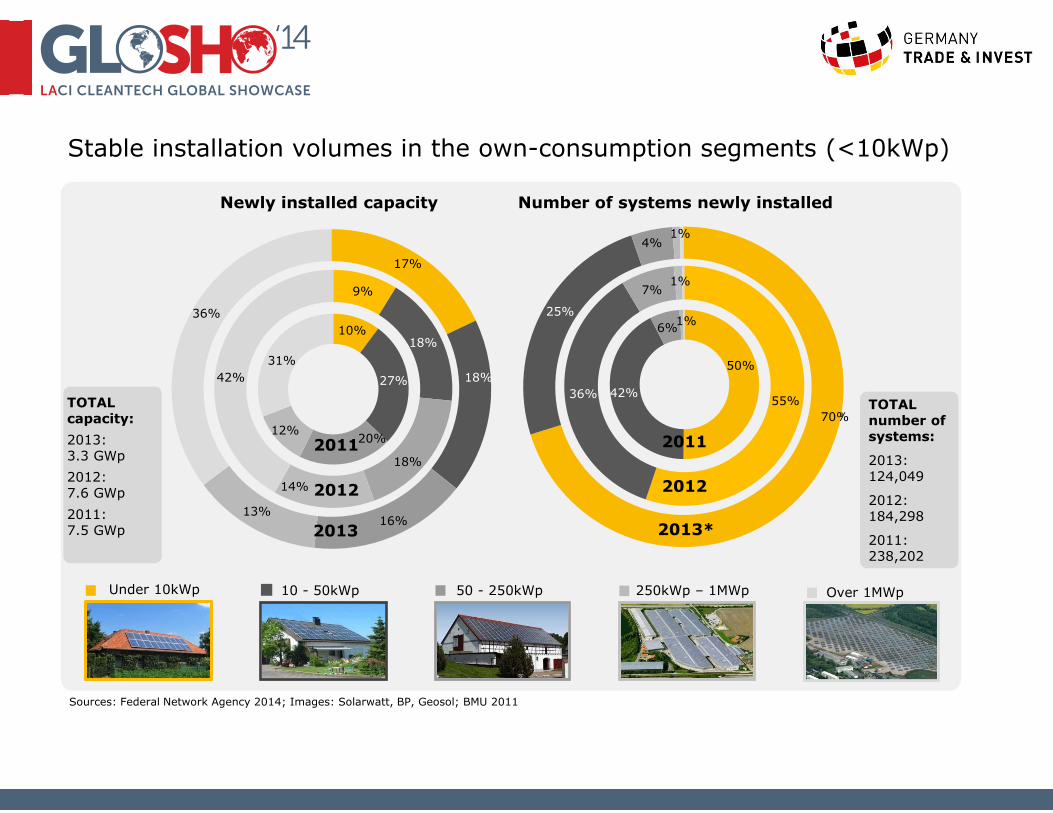
Sources: Federal Network Agency 2014; Images: Solarwatt, BP, Geosol; BMU 2011
10 - 50kWp 50 - 250kWp 250kWp – 1MWp Under 10kWp
Number of systems newly installed
TOTAL capacity:
2013: 3.3 GWp
2012: 7.6 GWp
2011: 7.5 GWp
Over 1MWp
TOTAL number of systems:
2013: 124,049
2012: 184,298
2011: 238,202
70%
Newly installed capacity
18%
2011 20%
27%
10%
31%
12%
2012
18%
18%
14%
42%
9%
2013
17%
13% 16%
36% 6%
50%
42%
2011
1%
2012
55% 36%
7% 1%
2013*
25%
4% 1%
70%
Stable installation volumes in the own-consumption segments (<10kWp)

The Principle of „Own-Consumption“
Wattage
Time of day
0h 3h 6h 9h 12h 15h 18h 21h 24h
Energy from grid
PV Energy
Energy Demand
„Own-Consumption“ of PV Energy
•Notes: 1) Depending on size /type of system; Min. to max . tariff in 2013 of new EEG 2012 2) Depending on electricity retail price of respective utility company.
Germany Trade & Invest 28.03.2014

First Home Energy Storage and Home Energy Management systems are currently installed in Germany

www.gtai.com
5 MW/ 5MWh
Lithium ion technology
Bought and operated by medium sized
German municipal utility WEMAG
Fully automated, turnkey battery park
Battery park will be ready for the primary
control power market
Performance guarantee of 20 years on the
battery system
Key Data
Prequalified for the primary control power market (WEMAG/Younicos)
www.gtai.com
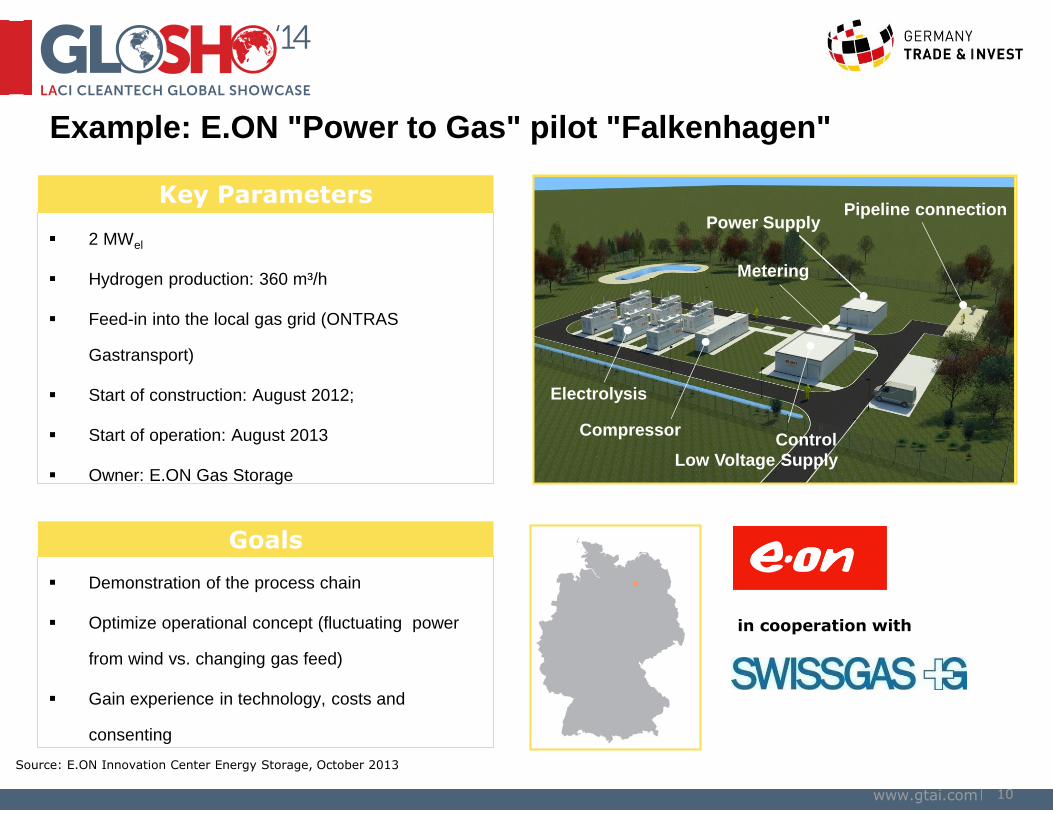
Example: E.ON "Power to Gas" pilot "Falkenhagen"
Electrolysis
Metering
Pipeline connection Power Supply
Control
Low Voltage Supply
Compressor
Source: E.ON Innovation Center Energy Storage, October 2013
2 MWel
Hydrogen production: 360 m³/h
Feed-in into the local gas grid (ONTRAS
Gastransport)
Start of construction: August 2012;
Start of operation: August 2013
Owner: E.ON Gas Storage
Key Parameters
Demonstration of the process chain
Optimize operational concept (fluctuating power
from wind vs. changing gas feed)
Gain experience in technology, costs and
consenting
Goals
in cooperation with
10
16.10.2014 | www.gtai.com
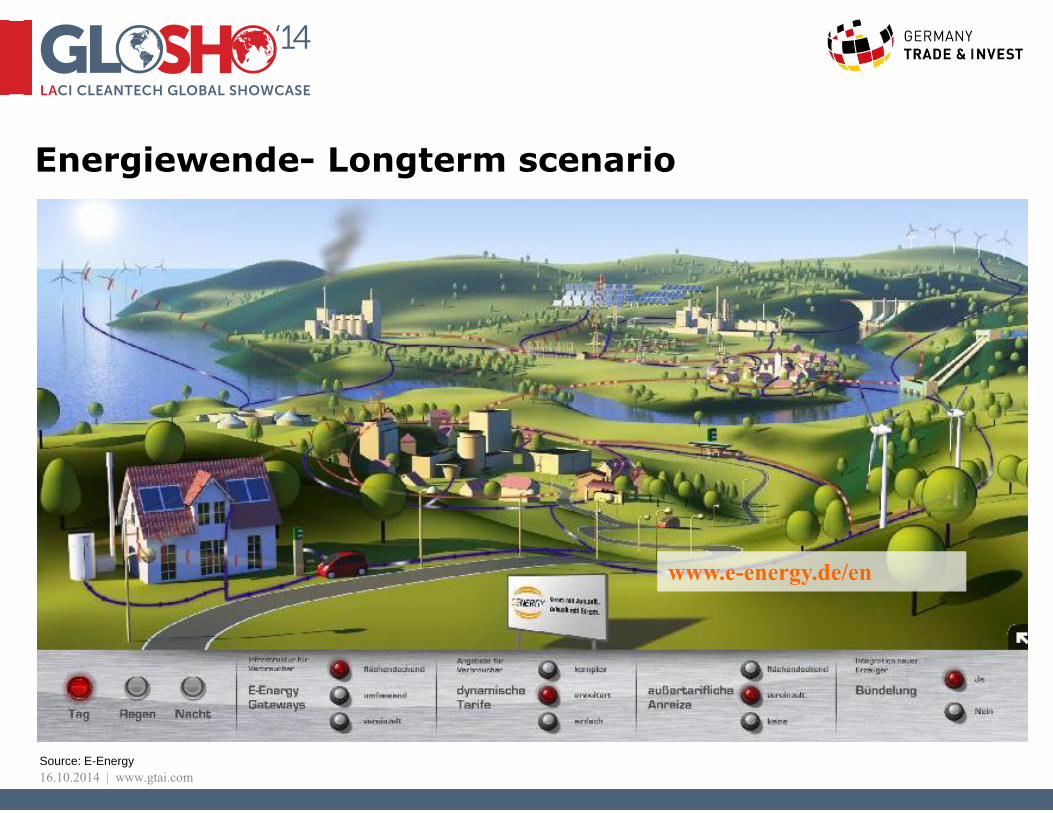
Energiewende- Longterm scenario
Source: E-Energy
www.e-energy.de/en

16.10.2014 | www.gtai.com
Mumbai Office Tokyo Office
Berlin - Headquarters
Mr. Thomas Grigoleit Director Energy, Environment and Resources T. +49 30 200 099-224 [email protected]
Mr. Tobias Rothacher Senior Manager Photovoltaics and Storage T. +49 30 200 099-225 [email protected]
Energy, Environment and Resources Division:
Mr. Markus Hempel China Representative Beijing, China T. +86 10 6539 6725 F. +86 10 6590 6167 [email protected]
North America
Europe
Asia-Pacific
© 2014 Germany Trade & Invest All information provided by Germany Trade & Invest has been put together with the utmost care. However, we assume no liability for the accuracy of the information provided.
Mr. Iwami Asakawa Japan Representative Tokyo, Japan T. +81 3 5275 2072 F. +81 3 5275 2012 [email protected]
Mr. Claus Habermeier Director New York, USA T: +1 212 584 9715 F: +1 212 262 6449 [email protected]
Ms. Angelika Geiger Director San Francisco, USA T: +1 415 248 1246 F: +1 415 627 9169 [email protected]
Ms. Asha-Maria Sharma India Representative Mumbai, India T. +91 22 66 65 21 80 [email protected]
New York Office San Francisco Office
Beijing Office
Mr. Heiko Staubitz Senior Manager Energy Storage and Smart Grid T. +49 30 200 099-226 [email protected]
Mrs. Flérida Regueira Cortizo Senior Manager Environmental Technologies T. +49 30 200 099-230 [email protected]
Ms. Esther Frey Manager Wind T. +49 30 200 099-253 [email protected]
Mr. Max Hildebrandt Manager Photovoltaics and Storage T. +49 30 200 099-223 [email protected]
Mr. Henning Ellermann Manager Energy Efficiency T. +49 30 200 099-257 [email protected]
Mr. David J.Warne Senior Manager Geo Energy & Resources T. +49 30 200 099-601 [email protected]