globemed bulletin medical outcomes management€¦ · legal disclaimer globemed lebanon is...
TRANSCRIPT

Prepared byBekhazi H, MD
GLOBEMED BULLETIN
MEDICAL OUTCOMES MANAGEMENT
Copyright GlobeMed Ltd, 2012. All rights reserved.
LEGAL DISCLAIMER
GlobeMed Lebanon is providing this bulletin as an information tool only, without any other purposes whatsoever. Although GlobeMed Lebanon has made every effort to ensure that its contents are correct and accurate, it cannot be held liablefor any of the information contained herein.
This bulletin is not addressed to the general public. It is designed to be distributedto GlobeMed Lebanon partners and clients (insurance companies, healthcare providers, etc.). It serves as a means of communication that opens up a dialogue and promotesa better understanding of health issues that are of interest to all parties.

5GLOBEMED BULLETIN / MEDICAL OUTCOMES MANAGEMENT / 2012
ACKNOWLEDGEMENTS
• To M. Sleiman Haroun, the President of the Syndicate of Hospitals, for the presentation given at GlobeMed Lebanon re-outcomes management and for his precious support.
• To Dr. Roy Nasnas, for his valuable opinion on the infections' rates and the use of antibiotics.
• To Dr. Sarkis El Zein, Vice President at GlobeMed Lebanon, Actuarial and Reinsurance Service Division, for reviewing the bulletin and putting his magical touch on it.
• To Pr. Samir Alam (Head of Division of Cardiology at AUBMC) for his valuable comments on the cardiac results.
“On the mountains of truth you can never climb in vain; either you will reach a point higher up today or you will be training your powers so that you will be able to climb higher tomorrow“. Friedrich Nietzsche
ABSTRACT
The “Medical Outcomes Management” bulletin investigated the effects of adverse medical outcomes as a result of hospitalizations in Lebanon. Four outcomes are monitored: infection, complication, readmission and death.Our aim is to:1. Highlight where each of GlobeMed Lebanon’s providers stands in terms
of their rates of each of the 4 outcomes2. Compare GlobeMed Lebanon’s local results to international figures.3. Interpret the potential additional costs associated with these outcomes
between 2005 and 20104. Identify action to be implemented in order to reduce the incidence of
above mentioned outcomes
This study is “ad-hoc” in the sense that it examined claims from past experience of overnight stay claims, using GlobeMed Lebanon portfolio, and investigated each outcome category, by diagnosis and by provider, in terms of rates of occurrence and additional costs incurred.
Our results show that 5% of the admissions to the hospitals encounterat least one of the 4 outcomes described and are responsible for 16%of the approved amounts. Comparatively, according to the Center forDisease Control (CDC), adverse events (bad outcomes) affecting medical care occur in about 3 to 4% of all patients. Further more, our study showed that infection is the outcome having the highest impact on the length of stay and cost, increasing the average length of stay about 10 folds (from 2.3 to 24.4 days), and the average cost of claim about 9 folds (from $1,602 to $15,531). The infection rate in our study is only 0.40% for all admissions but increases to 2% for admissions with hospitalizations of more than 1 day.
In general it is safer to be admitted in the university hospitals which have an average outcomes rate lower than the total network’s rate, but this is not necessarily the case when considering each outcome separately.
Whether these events are preventable or not is very difficult to determine, however we hope that this bulletin serves to increase awareness for the concerned parties and encourages them to implement measures that will help mitigate the risk of these outcomes.Statistics have no value if they are not used to better understand the problem and improve the performance.
GlobeMed Lebanon, Medical Outcomes Bulletin 2011

Table of Contents
IntroductionStudy Design and MethodsScope of the study Outcomes per DiagnosisOutcomes per HospitalLimitations of the Study ResultsGeneralitiesImpact on cost Outcomes per Diagnosis Outcomes per ProviderConclusions and recommendationsGlossaryAppendix
List of Tables
Table 01 Outcomes Rates Table 02 GlobeMed Lebanon versus US regulated hospitals, outcomes rate post CABG Table 03 GlobeMed Lebanon versus US data, types of complications post CABGTable 04 Elective versus Emergency admissionTable 05 Characteristics of patients and average length of stayTable 06 Outcomes of THR, GlobeMed Lebanon versus international dataTable 07 Characteristics of patients and average length of stayTable 08 Outcomes of TKR Table 09 Outcomes of cholecystectomy Table 10 Average length of stay in cholecystectomy - GlobeMed Lebanon versus othersTable 11 Pneumonia ALOS and mortality rate, in UH versus non UH Table 12 Outcomes, average length of stay and related additional cost in pneumonia Table 13 CABG outcomes in lebanese hospitalsTable 14 Rate of each type of outcome in some lebanese hospitals, when length of stay is more than 1 dayTable 15 Outcomes rate versus number of claims in GlobeMed Lebanon network of hospitals
List of Graphs
Graph 01 Gender and Age Distribution in GlobeMed Lebanon Population Graph 02 Relation between Outcomes and Length of StayGraph 03 Additional Cost related to OutcomesGraph 04 Additional Length of Stay related to OutcomesGraph 05 Outcomes over the Years : Trend per Rate and Number per 100,000 ExposuresGraph 06 Trend of Additional Cost related to Outcomes over the Years Graph 07 Coronary Artery Bypass Graft and related Outcomes Rate Graph 08 Gender distribution in CABGGraph 09 Age and Gender distribution in CABG Graph 10 Outcomes in elective versus emergency CABG Graph 11 Outcomes of CABG versus co morbidities Graph 12 ALOS in CABG Graph 13 Average cost in CABG Graph 14 ALOS per outcome in CABGGraph 15 Average cost per outcome in CABGGraph 16 Age in THR Graph 17 Gender in THR Graph 18 Discharge diagnosis in THR Graph 19 Revision of hip arthroplastyGraph 20 Rate of THR over 1000 exposed to risk populationGraph 21 Impact of infection on LOS and cost in THR Graph 22 Impact of comorbodities on outcomes in THR Graph 23 Age and Gender distribution of TKR Graph 24 Rate of TKR over 1000 exposed to risk populationGraph 25 Impact of complications on length of stay in TKRGraph 26 Impact of complications on cost in TKRGraph 27 Impact of the infection on cost and average length of stay in TKR Graph 28 Outcomes of Cholecystectomy Graph 29 Outcomes of Cholecystectomy over the yearsGraph 30 ALOS of Cholecystectomy elective versus urgent, laparoscopic versus conventional Graph 31 Impact of outcome on cost in cholecystectomy Graph 32 Age distribution for pneumoniaGraph 33 Average length of stay and cost of pneumonia by age bracketGraph 34 Mortality rate by age bracket, with versus without comorboditiesGraph 35 ICU and death rate from pneumonia Graph 36 Average outcomes rate versus outcomes in hospitals with high load Graph 37 General outcomes rate in lebanese hospitals Graph 38 Relation between admission class and readmission rate in lebanese hospitalsGraph 39 Cholecystectomy highest outcomes rate in CholecystectomiesGraph 40 Cholecystectomy outcomes rate in lebanese hospitals with the highest load
0810101111121313141740434549
131818202327283033343839495052
10131414 1516171920212122222223242425252627282929 31313232333435353637384040424950

GLOBEMED BULLETIN / MEDICAL OUTCOMES MANAGEMENT / 2012
9
We, at GlobeMed Lebanon, are particularly interested in identifying andanalyzing the retrospective incidence of major outcome categories of healthcarein our database.
Our outcomes of interest include:• Patient death rates• Complication/Adverse Event rates• Readmission rates• Nosocomial infection rates
Two additional subjects are of interest under the outcomes chapter but they willnot be included in our study.These are the medical errors and the medications’ errors.
A “Medical error is the failure of a planned action to be completed as intended(ie error of execution) or the use of a wrong plan to achieve an aim (ie error of planning). It includes errors committed by any individual or set of individuals in a healthcare organization."
In 1999, the Institute of Medicine (IOM) issued the report “To Err is Human” and estimated that 44,000 and perhaps as many as 98,000 American die each year as a result of medical error. This is equivalent to the number of people who would die if a jumbo jet crashed every other day and all its passengers died.
In 2009, Consumers Union published “To Err is Human. To Delay is Deadly. Ten years later, a million lives lost, billions of dollars wasted." This report emphasized on the failure of healthcare professionals to achieve evident progress on Patient Safety.
The same IOM report of 1999 identified medication errors as a substantial source of preventable errors in hospitals. Medication errors include administering the wrong drug, wrong dose, and wrong route of administration to patients, in addition to providing drugs without regard to drug allergies or interactions with other medications the patient may be taking.
In 2006, the IOM returned to the same subject and concluded that at least 1.5 million preventable medication errors cause harm in the United States each yearand cost 3.5$ billion yearly.
GlobeMed Lebanon is not keeping specific data about medication errors, unless described by the ICD9 and at this time it falls under the adverse events.
Outcomes in healthcare are becoming a topicof increasing public interest, with news broadcasts, television programs and documentaries addressing stories of catastrophic complications and consequent post-operative deaths.
Medical care systems and policymakers throughout the world are strugglingto improve patient safety while trying to contain health care expenditures.Cost-containment strategies such as prepaid health plans and professional review organizations have mainly been used for restricting the use of high-cost medical services. However, it wasn’t until recently that managing medical outcomes hasbeen looked at as a means to reduce costs i.e. the reduction of hospital Length of Stay (LOS) and of additional treatments, through the prevention of complications, infections and re-admissions arising from hospitalizations.
Reference to this presentation, the subject of outcomes raises the paradox of:• First do no harm • To err is human
Patient Safety being the major concern, the hospital should be able to establish operational systems and processes that minimize the likelihood of errors and maximize the likelihood of intercepting them when they occur.
Lebanese Hospitals are aware of the importance of controlling their outcomes, and the project IMPROVE (Indicator, Measurement, Performance, Report, Observatory, Valid benchmarking, Education) led by Dr. Fady El Jardali from AUB, is the first one in the country to support hospitals in collecting data on outcomes, standardize performance indicators, and report benchmarks.
INTRODUCTION
“Surviving Your Hospital Stay“, is the title chosenby Mr. Sleiman Haroun, the President of the Syndicate of Hospitals in Lebanon, in his presentation given at GlobeMed Lebanon premises regarding the medical outcomes.

11GLOBEMED BULLETIN / MEDICAL OUTCOMES MANAGEMENT / 2012
Scope of the Study
This bulletin studies 151,989 admissions between 2005 and 2010 with the aim of:1. Highlighting where each of GlobeMed Lebanon’s providers stands in terms
of their rates of death, complication, nosocomial infection, andreadmission outcomes.
2. Comparing GlobeMed Lebanon’s local results to international figures. 3. Interpreting the potential additional costs associated with these outcomes. 4. Identifying action to be implemented in order to improve the current situation.
The studied population is made of 52.12% male and 47.88% female, mostof them being between the ages 18 and 60.
Graph 01: Gender and Age Distribution in GlobeMed Lebanon Population
The study examined the past experience of overnight stay claims; i.e. it excluded emergency(a) and one day treatment cases(b).
Only claims that are paid through direct-billing have been included in the study because these are complemented with concurrent reviews(c) whereas reimbursement claims that usually occur abroad or locally but outside of the GlobeMed Lebanon Network of providers lack needed details.
a) Emergency case: any acute treatment taking place within the emergency room.b) One Day Treatment: any diagnostic or therapeutic procedure done in the external ward of a hospital.c) Concurrent Review: daily follow up done after the admission of an adherent, especially for accepted cases.
STUDY DESIGN AND METHODS The data is collected from patient medical files at hospitals, and is used to build our Electronic Medical Record (EMR) where a patient’s complete set of medical records can be found, including discharge diagnosis, comorbidities, allergies, complications, infections, readmissions, and deaths. Diseases are categorized using ICD-9 codes and the procedures are processed as per the Lebanese Nomenclature of Medical and Surgical Acts.
Trained registered nurses and medical officers with long experience in the insurance field check the medical files at hospitals and report the information in a structured manner. The Medical Review Committee of GlobeMed Lebanon studies the files with outcomes looking for medical errors, trends of infections or complications, and to communicate on each subject with the medical committees of hospitals.
GlobeMed Lebanon started collecting outcomes’ data by the end of 2003. Over the years, several reviews and improvements were introduced. Currently the Electronic Medical Record and particularly the outcomes data is a precise reflection of the medical file at hospitals (The GlobeMed Lebanon team is committed to report complete medical information about each admission).
Outcomes per Diagnosis
This study will analyze the 4 outcomes of 4 surgical procedures, in addition to 1 medical condition considered of interest.
Outcomes per Hospital
The hospitals within GlobeMed Lebanon Network were studied based on GlobeMed Lebanon population excluding the Internal Security Forces. They remain anonymous and are referred to as H1, H2, etc. We classify them based on the total of the 4 outcomes rate and highlight the cost implication.
The 101 hospitals within our Network do not have all the same specifications. In fact the number of beds per hospital varies between 10 and 544. The services provided also vary from only one specialty by hospital, to a complete set of specialties. This has a major influence on the outcomes, as these are directly related to the complexities of the cases.
Many articles suggest that outcomes are inversely related to the provider’s volume of procedures(1) (2) (3). Another factor of influence is the effectiveness of reporting; some hospitals do not report negative outcomes in their medical files. In fact according to the Journal of Nursing(4) there is a significant difference between adverse events documented in medical files and those reported by patients.
Source of information: GlobeMed Lebanon
4 outcomes: death, complication, infection, readmission
4 surgical procedures: 1 medical condition:
• Open Heart (Coronary Artery Bypass Graft) • Pneumonia
• Total Hip Replacement
• Total Knee Replacement
• Cholecystectomy
Gender distribution Age distribution
62.80%
25.51%
11.69%
52.12% 47.88%

13GLOBEMED BULLETIN / MEDICAL OUTCOMES MANAGEMENT / 2012
Limitations of the Study
There are some limitations related to internal factors and someothers to external factors.
Internal factors
1. Our outcomes data is collected during hospital stay only. All complicationsand infections and even deaths that occur at home after discharge are not reported. We have noted that most of the international studies take into consideration the outcomes data up to a specific period after discharge, making the comparison more difficult.
2. Our study is limited to GlobeMed Lebanon population which behaves differently than the general population. In fact the insured population has easy accessto the health care services, and at the same time some diseases are subject to exclusions and financial limitations. The mean age could also differ. The numberof cases is sometimes limited and the generalization becomes difficult.
3. For the readmissions, GlobeMed Lebanon changed its definition in 2009. While the readmissions were reported up to 14 days after discharge before 2009, we changed it to "30 days after discharge" which is more in line with the international literature. As a consequence our readmission rate over the study period from 2005 to 2010 could be underestimated.
4. Our death rate is taking into consideration all the deaths that occur at hospitalswhether these are the natural evolution of the disease or the consequenceof a negative outcome.
External factors
1. The quality of the medical file at hospitals needs improvement. Most doctors haveresistance to write details whether in the operative notes, progress notes, etc.This has a big impact on the outcome's study and leads to underreporting and consequently underestimating the problem. On another hand, basic informationis missing such as weight, height and smoking habits, all considered as risk factors that we cannot include in our studies because of lack of accurate data.
2. There are no established benchmarks at the national or regional level to compareour results to. In the USA it is mandatory, by law, to publish the outcomes rate by hospital. In the UK, a private organization studies the outcomes rates by hospital and offers them on line to the public. In Lebanon there is not any law about the outcomes and there is not yet a private organism having enough data to publish.
3. There is an awareness problem related to the outcomes, both at hospitaland governmental levels. While the hospitals started to take action through the project of IMPROVE, the Ministry of Health limited its action to the accreditation process.
4. There is no alignment of the population structure between Lebanon andthe referred to countries such as USA.
Generalities
Out of 151,989 admissions, 7600 had at least one of the 4 outcomes during their hospital stay, which is 5% of the total admissions. The breakdown of these outcomes is as follow:
Table 01: Outcomes Rates
The association to the length of stay is remarkable. In fact:• 136,985 are admitted for one day or less at hospital and have 5,790 outcomes associated (4%).• 15,004 are admitted for more than one day in hospital and have 1,810 outcomes associated (12%).
Graph 02: Relation between Outcomes and Length of Stay
RESULTS
Outcome Number of Claims Rate over total outcomes
Rate over totalnumber of claims
Death 1028 13.5% 0,7%
Infection 596 7.8% 0,4%
Complication 1718 22.6% 1,1%
Readmission 4258 56.0% 2,8%
Source of information: GlobeMed Lebanon
Source of information: GlobeMed Lebanon
10%
0%
20%
30%
40%
50%
60%
70%
80%
90%
100%
With OutcomesNo Outcomes
131.195
13.194
5.790
1.810

15GLOBEMED BULLETIN / MEDICAL OUTCOMES MANAGEMENT / 2012
The outcomes in prolonged LOS are well described in the literature, especiallyin regards to the ICU. In our data, about 19% of ICU admissions had outcomes.
Impact on cost
Each one of the 4 outcomes has its impact on the cost of claims; however it is obvious that the nosocomial infection, when it occurs, tops the list in terms of cost impact. GlobeMed tried to act on this fact by transferring stable patients to a Home Care services provider, to continue the course of infection treatment at home, however the cost of the infections remains high.
Graph 03: Additional Cost related to Outcomes
Graph 04: Additional Length of Stay related to Outcomes
Source of information: GlobeMed Lebanon
Source of information: GlobeMed Lebanon
The overall outcomes rate is increasing over the years in the GlobeMed Lebanon Network of providers. This can be related to the expansion in the hospitals:the learning curve for the medical staff to deal with new services andnew technologies needs time. During this time the rate of adverse events may be higher than usual. It can also be related to a deficiency in the patient safety process: with the absence of reporting system or corrective measure theincidence of adverse events will continue to increase. It can also be relatedto the aging of the population: while the average age of GlobeMed populationwas 34.78 in 2005, it continued increasing and it was 36.50 in 2010.
Graph 05: Outcomes over the years: Trend per Rate and Number per 100,000 exposures
1000%
800%
600%
400%
200%
0%
InfectionDeath
444.54%
841.93%
Complication
437.24%
3,99%
1000%
900%
800%
700%
600%
500%
400%
300%
200%
100%
0%
InfectionDeath
476.40%
872.42%
Complication
412.95%
74.21%
Source of information : GlobeMed Lebanon
Source of information : GlobeMed Lebanon

17GLOBEMED BULLETIN / MEDICAL OUTCOMES MANAGEMENT / 2012
Graph 06: Trend of Additional Cost related to Outcomes over the Years
As a consequence to the increase in outcomes rate, the related additional cost is increasing. The inflation is a non negligible factor, but an increase of more than 50% cannot be explained by sole factor of inflation. The severity of the cases and their frequency are both involved.
Figure 01: Adverse Events and related Consequences
The adverse event, when it happens, not only disrupts the patient’s recovery, but also leads to additional tests, more pharmaceuticals and increased doctor fees, all contributing to additional cost. In addition, the patient morale will be affected, the availability of beds at the hospital for new patients will be limited, and the hospital will acquire a bad reputation especially if complications become frequent.
Source of information : GlobeMed Lebanon
In the USA, a system categorizing potentially preventable complications was developed within the context of hospital outcomes improvement (66). It contains 64 mutually exclusive categories. Out of the complications included in their list as preventable, we have chosen a restricted number in our data to evaluate their related cost:• Post operative hemorrhage • Decubitus ulcer• Volume depletion disorder• Pneumonia
We found that the 4 mentioned complications account for $2 millions, which represent 1% of the total cost of claims. The “root cause analysis” of these outcomes is needed in order to plan and implement significant changes that will lead to reduce the complications rate.
Outcomes per Diagnosis
1- Open Heart Surgery (Coronary Artery Bypass Graft)
The study involved 413 Coronary Artery Bypass Graft (CABG) surgeries between 2005 and 2010. The average length of stay was 10.6 days and the average cost for all classes was $14,279. According to our results, patients have 16.4% risk of having one of the 4 outcomes whenever they undergo a CABG, and the breakdown is as follows:
Graph 07: Coronary Artery Bypass Graft and related Outcomes Rate
Source of information : GlobeMed Lebanon

19GLOBEMED BULLETIN / MEDICAL OUTCOMES MANAGEMENT / 2012
Graph 08: Gender distribution in CABG
The demographic data of the patients is not the same as the literature. In fact, the mean age of patients undergoing CABG is 61.24 years. Compared to the review from Massachusetts Cardiac Surgeons (5) where the mean age is 66.7 years and the females rate is 25.8%, our population needs the CABG surgery at a younger age. Also as per the review of California outcomes (8) , the mean age is 66.2 years and the females rate is 25.2% in 2006.As per GlobeMed Lebanon results, male surgeries are noticed starting from the age of 36 in contrast with female surgeries that start at age 46.
Compared to the Massachusetts Department of Public Health Data Analysis Center,(5)
the discharge mortality rate is the same (1.9%), but the Lebanese Hospitals seem to have better outcomes for the complications, infections and readmissions. This does not mean that Lebanese Hospitals do not have to do any effort to improve their results: a general outcomes rate of 16% is not negligible, and we suspect, throughout our study (not only in the case of open heart) a deficit in the reporting of the nosocomial infections.
Table 02: GlobeMed Lebanon versus US regulated hospitals, outcomes rate post CABG
It is to be noted that the incidence of major adverse events in patients after CABG varies widely across studies and patient populations, and this heterogeneity must be controlled when using the literature to benchmark safety (6).
Table 03: GlobeMed Lebanon versus US data, types of complications post CABG
The types of complications are mostly cardiac in nature. While in our study we are considering all types of coronary lesions requiring CABG, the UK data is only about the surgery for left main stem stenosis.
As for the types of infections, the most common are the urinary infections withE. Coli, followed by wound infection and finally Pseudomonas.
Source of information : GlobeMed Lebanon
GlobeMed Lebanon Massachussetts Cardiac Surgeons (5)
Complications and Infections 9.4% 23,1%
Readmission 5.1% 10.8%
Death 1.9% 1.9%
Source of information: GlobeMed Lebanon and the Health Research and Educational Trust
GlobeMed Lebanon UK data (7)
Cardiac 2.6% 2.2% (Myocardial Infarct)
Respiratory 2.4% NA
Hemorrhage 1.2% 7.7%
Renal failure 1.2% 3.9%
Stroke 0.5% 3.6%
Wound Infection 0.2% 2.8%
Source of information: GlobeMed Lebanon and the American College of Cardiology

21GLOBEMED BULLETIN / MEDICAL OUTCOMES MANAGEMENT / 2012
The outcomes percentage for emergency admissions was higher than that of elective admissions except for “readmissions”:
Graph 10: Outcomes in elective versus emergency CABG
Another factor influencing the outcomes rate is the medical history of the patient.The associated diseases, known as comorbidities, increase the risk of developing one of the four outcomes for CABG patients.
Graph 11: Outcomes of CABG versus co morbidities
After studying which factors impact the outcomes, we will study the impactof the outcomes on the length of stay and cost. Graphs 12 and 13 show that when one of the four outcomes occur, the average length of stay increases by 4.5 daysand the average cost increases by more than 40%.
Graph 09: Age and Gender distribution of CABG
Most admissions were elective, but in our reference from Massachusetts (5) most of the admissions were emergencies(64.7%),whereas in a Canadian study published in the Journal of Cardiovascular Nursing (9), 80% of the cases were elective and only 20% were emergencies.
Table 04: Elective versus Emergency admission
GlobeMedLebanon
Massachusssetts (5)
Canada(9)
Australia (10)
Elective admission 56% 35.3% 80% 43.6%
Emergency admission
44% 64.7% 20% 56.4%
Source of information: GlobeMed Lebanon, Health Research And Educational Trust, the Journal of Cardiovascular Nursing, Heart Lung Circ
Number of cases ALOS Average cost
Elective Admission 231 9.0 $12,878
Emergency Admission 182 12.7 $15,906
Source of information: GlobeMed Lebanon
Source of information: GlobeMed Lebanon
Source of information: GlobeMed Lebanon
Source of information: GlobeMed Lebanon

23GLOBEMED BULLETIN / MEDICAL OUTCOMES MANAGEMENT / 2012
Graph 12: ALOS in CABG
Graph 13: Average cost in CABG
The infection remains the cause of the highest increase in the cost of the CABG surgery, and this is directly related to the prolonged LOS.
Graph 14: ALOS per outcome in CABG
Source of information: GlobeMed Lebanon
Source of information: GlobeMed Lebanon
Graph 15: Average cost per outcome in CABG
The hospital acquired infection is not paid by Medicare in USA, as it is considered a preventable disorder. Post CABG infection, specially wound infection and mediastinitis is associated to internal (diabetes, renal failure, other immunosuppressive diseases) and external factors (non sterile atmosphere, bacterial infection of skin, insufficient sanitization of skin, bacteria on operating staff hands or gloves).
The hospitals within our network are not all involved. Only 19 out of our 101 hospitals had a number of open heart surgeries ranging from 2 (lowest load)to 108 (highest load).Although scarce, the number of outcomes is related to the load by provider.
The results by hospital (anonymous) are presented in the Appendix, table 13.
2- Total Hip Replacement
Over the study period, a total of 205 Total Hip Replacement (THR) surgeries were performed, out of which 41% were done at University Hospitals (AUB, HDF, SGH, Rizk).Most of the THR surgeries are done on women above the age of 70. This is in line with the international literature. (see table below)
Table 05: Characteristics of patients and average length of stay
Outcome GlobeMed Lebanon Ontario (2) USA (25)
Mean Age 66.59 70 67
Gender Female (70.7%) Female (57.5%) Female (58.2%)
Diagnosis Arthritis Arthritis Arthritis
ALOS (days) 7 6.4 5.81
Source of information: GlobeMed Lebanon
Source of Information: GlobeMed Lebanon, Can.JSurg, Am J Orthp
Source of information: GlobeMed Lebanon

25GLOBEMED BULLETIN / MEDICAL OUTCOMES MANAGEMENT / 2012
Graph 16: Age in THR
Graph 17: Gender in THR
The major admitting diagnosis is arthritis, constituting 52% of total admissions for THR, versus 45% for fractures. According to the American Journal of Physical Medicine and Rehabilitation (14), the major admitting diagnoses were arthritis(74%) and fractures (26%).
Source of information: GlobeMed Lebanon
Graph 18: Discharge diagnosis in THR
Our data shows that the revision of a hip arthroplasty is more frequently secondary to trauma rather than to arthritis and it affects people below the age of 60 more frequently than others. However these results are subject to change due to small number of cases.
Graph 19: Revision of hip arthroplasty
Source of information: GlobeMed Lebanon
Source of information: GlobeMed Lebanon
Source of information: GlobeMed Lebanon
Source of information: GlobeMed Lebanon

27GLOBEMED BULLETIN / MEDICAL OUTCOMES MANAGEMENT / 2012
There is a radical difference between the primary hip arthroplasty and the revision. But since the demand on THR is increasing over the years, and with the increased longevity of the population, we expect to have more revisions at older agesin the future.
Graph 20: Rate of THR over 1000 exposed to risk population
THR is classified as a major surgery. However our results show that it is a relatively safe procedure with a 0.5% mortality rate. On the other hand, 8.4% of all procedures had an outcome thus indicating the need for concerned hospitals to take preventive measures to address this problem.This is of utmost importance as the demand of THR is increasing with experienced doctors, enhanced quality of prostheses and the aging of the population. A greater awareness of risk factors and adverse events encourage the hospitals to implement preventive measures and consequently have fewer outcomes.
Source of information: GlobeMed Lebanon
Source of information: GlobeMed Lebanon
Table 06: Outcomes of THR, GlobeMed Lebanon versus International data
While the overall complications rate is 5.9%, it reached 50% in some hospitals. It is worth noting here that hospitals with higher loads have fewer complications than the rest.As for infections, a 71% increase in the average length of stay and 178% increase in the average cost were found over the study period.
Graph 21: Impact of infection on LOS and cost in THR
The likelihood of experiencing an outcome more than doubles for patients withcomorbidities.
GlobeMed Lebanon USA (25) Ontario (2) UK (11)
Death 0.5% 0.32% 0.60% 1.4%
Complications 5.9% 8.33% 6% 17.2%
Infections 1.0% 0.47% NA 2.4%
Readmissions 1.0% NA 1.6% (revisionat 1 y)
1.6%
Source of Information: GlobeMed Lebanon, Am J Orthop, Can J Surg, Ann R Coll Surg Engl

29GLOBEMED BULLETIN / MEDICAL OUTCOMES MANAGEMENT / 2012
Graph 22: Impact of comorbodities on outcomes in THR
We were expecting that comorbidities constitute a major factor in the outcomes and specifically on mortality, but we found that the comorbidities did not affect neither outcomes nor mortality. In fact among the 205 THR, only 1 case of death occurred and this patient did not have comorbidities or risk factors
3- Total Knee Replacement
From 2005 to 2010, 152 Total Knee Replacement (TKR) surgeries were performed, with 35% at University Hospitals (AUB, HDF, SGH, Rizk).Most of the TKR surgeries are done on women above the age of 70. This is in line with the international literature. (see table below)
Table 07: Characteristics of patients and average length of stay
Graph 23: Age and Gender Distribution of TKR
The major admitting diagnosis is arthritis, constituting 97 % of total admissions for TKR, versus 0.6% for fractures.
In GlobeMed Lebanon population, the demand on the total knee replacement is increasing over the past 3 years.
Graph 24: Rate of TKR over 1000 exposed to risk population
Source of Information: GlobeMed Lebanon, Can J surg, BMC
Source of Information: GlobeMed Lebanon
Source of Information: GlobeMed Lebanon
GlobeMed Lebanon Ontario (2) Cleveland (3)
Mean Age 68.78 70 71
Gender Female Female Female
ALOS (days) 6 days 6 days 13 days

31GLOBEMED BULLETIN / MEDICAL OUTCOMES MANAGEMENT / 2012
TKR, similar to THR, is considered a big surgery. The mortality rate is low at 0.6%, but the total outcomes rate (total of complications, infections, readmissions within 30 days and death) is 10.5%.
According to the American Association of Orthopedic Surgeons, fewer than 2%of people undergoing knee replacement surgery experience serious complications.
In GlobeMed Lebanon population, 2% had a pulmonary embolism post operatively which is considered the most dangerous complication. In all cases of TKR, precautions are necessary with early mobilization, thromboembolic disease stockings, foot pumps, and anticoagulant therapy (15) .
The benefits of TKR include pain relief, correction of deformity and regaining mobility such as walking, climbing stairs and getting in and out of chairs.
With the significant advances in the technique, the choice of prosthesis, the experience of the surgeons and the anesthesiologists, this surgery is becoming more successful with time. Approximately 130,000 knee replacements are performed every year in the USA and this number is expected to increase by 647% by the year 2030.
Most patients who undergo TKR are elderly with comorbidities. Patients must have good cardiopulmonary function to withstand anesthesia and to withstand a blood loss of 1000-1500 ml over the perioperative period (15) .
In the GlobeMed Lebanon population, the outcomes rate per age bracket of the Total Knee Replacement surgery is as follows:
Table 08: Outcomes of TKR
The most common types of complications are:
1. Atrial fibrillation2. Non Healing Surgical Wound3. Postoperative shock4. Postoperative hemorrhage and anemia5. Pulmonary embolism
The Non Healing Surgical Wound has the highest impact on the length of stay, while the pulmonary embolism has the highest impact on cost.
Graph 25: Impact of complications on length of stay in TKR
Graph 26: Impact of complications on cost in TKR
The infection in post TKR impacts the average length of stay by increasing it 83% and the average cost by increasing it 95%.
GlobeMed Lebanon Germany (12) Cleveland (3) USA (1)
Death 0.6% 0.1% 0.5% 0.1%
Complications 6.6% 1.5% 2.9% 3%
Infections 4.0% 0.6% 0.4% NA
Readimissions 1.3% NA NA 4.0%
Source of Information: GlobeMed Lebanon, JBJS, BMC
Source of Information: GlobeMed Lebanon
Source of Information: GlobeMed Lebanon

33GLOBEMED BULLETIN / MEDICAL OUTCOMES MANAGEMENT / 2012
Graph 27: Impact of the infection on cost and average length of stay in TKR
4- Cholecystectomy
Over 2,000 cholecystectomies were performed between 2005 and 2010 at 72 hospitals within our network, and the outcomes rate varied between 0% and 54.5%.
Although this procedure is a safe procedure in general, the average outcomes rate is 8%, mainly readmissions (3.9%) and complications (3.2%).
Graph 28: Outcomes of Cholecystectomy
Most of the complications are mild, such as vomiting, ileus. They result in prolonged hospital stay. Major complications such as hemorrhage, pulmonary collapse, and cardiac arrest occur less frequently.
Source of Information: GlobeMed Lebanon
Source of Information: GlobeMed Lebanon
Table 09: Outcomes of cholecystectomy
The outcomes rate is increasing over the years. Two factors contributed to this increase: workload and the experience of the surgeon. The drop of 2006 is probably related to the war; during that time, the admission rate dropped.Some hospitals, especially ones in the South and Dahieh regions did not receiveany GlobeMed Lebanon patient.
Graph 29: Outcomes of Cholecystectomy over the years
The review of cholecystectomy claims indicates an average hospital stay of2.3 days while the benchmark for this surgery is only 1 day. This does not seem secondary to the outcome, as claims with no outcome have an average LOS of2 days. The benchmark can be applied to cold cases, laparoscopic surgeries. But the incurred cases over the past 6 years comprise 26% of conventional surgeries and 28% of cases admitted through the emergency room, and this could justifythe LOS above the benchmark. In fact the elective laparoscopic cholecystectomies stayed 1.4 days on average only while the urgent same procedures stayed2.6 days on average.
GlobeMed Lebanon North America (16) Denmark (17) Romania (18) International (19)
Death 0.5% 0.3% NA 0.1% 0.1%
Complications 3.2% 3.1% NA 0.9% 0.7%
Infections 0.5% 1.3% NA NA 0.9%
Readimissions 3.9% NA 9.4% NA 2.8%
Source of Information: GlobeMed Lebanon, J, Am Col Surg, Annals of Surgery, Int J Qula Health Care, HPB
Source of Information: GlobeMed Lebanon

35GLOBEMED BULLETIN / MEDICAL OUTCOMES MANAGEMENT / 2012
Table 10: Average length of stay in cholecystectomy - GlobeMed Lebanon versus others
The outcomes rate is increasing over the years. Two factors contributed to this increase: workload and the experience of the surgeon. The drop of 2006 is probably related to the war; during that time, the admission rate dropped.Some hospitals, especially ones in the South and Dahieh regions did not receiveany GlobeMed Lebanon patient.
Graph 30: ALOS of cholecystectomy, elective versus urgent, laparoscopic versus conventional
As per the Society of American Gastrointestinal and Endoscopic Surgeons(21), “patients undergoing uncomplicated laparoscopic cholecystectomy for symptomatic cholelithiasis may be discharged home on the day of surgery.Control of postoperative pain, nausea, and vomiting are important to successful same day discharge, and admission rates despite planned same day discharge are reported to be 1-39%; patients older than age 50 may be at increased risk for admission. Readmission rates range from 0-8%; common causes for readmission after same day discharge include pain, intra-abdominal fluid collections, bile leaks, and bile duct stones. Time to discharge after surgery for patients with acute cholecystitis, bile duct stones, or in patients converted to an open procedure should be determined on an individual basis.”
As for the impact of the outcomes on the average cost of claim, complications leading to death are the most expensive followed by infections, as perthe below graph:
Graph 31: Impact of outcome on cost in cholecystectomy
5- Pneumonia
Pneumonia is the fourth most frequent cause of hospitalizations in the USA and more than 1 million people are hospitalized each year due to this condition. This infection kills 40,000 to 70,000 people each year (23).
GlobeMed Lebanon processed 3,768 admissions for pneumonia from 2005 to 2010. The highest number of claims occurred in the young population but the older the patient is the higher the length of stay and cost at hospital are.
Graph 32: Age distribution for pneumonia
GlobeMed Lebanon Amman Jordan (20) US Surgons (21) Northumbria (22)
ALOS 2.3 days 2.8 days 0.9 day 2.6 days
Source of Information: GlobeMed Lebanon, Hepatogastroenterology, SAGES, Am R Coll Surg Engl
Source of Information: GlobeMed Lebanon
Source of Information: GlobeMed Lebanon
Source of Information: GlobeMed Lebanon

37GLOBEMED BULLETIN / MEDICAL OUTCOMES MANAGEMENT / 2012
Graph 33: Average length of stay and cost of pneumonia by age bracket
Death occurred in 43 cases, most of them being elderly with comorbidities.Men are more likely than women to die from pneumonia; this is in line withwhat was reported by the Maryland Medical Center(23).
Graph 34: Mortality rate by age bracket, with versus without comorbidities
Severe cases that necessitated admission to the Intensive Care Unit (ICU) represented 6.4% of all the cases, compared to the Romanian study publishedin Maedica (37) where similar cases represent 5-10% of all admissionsfor pneumonias.
Out of 242 patients admitted to the ICU, 26 died (10.7%) compared to only17 deaths outside the ICU from a total of 3526 admissions (less than 1%).
Source of Information: GlobeMed Lebanon
Source of Information: GlobeMed Lebanon
Source of Information: GlobeMed Lebanon
Source of Information: GlobeMed Lebanon

39GLOBEMED BULLETIN / MEDICAL OUTCOMES MANAGEMENT / 2012
Graph 35: ICU and death rate from pneumonia
As per Maedica (37), a bacterial etiology was identified in 27.5% of the casesin Romania. The germ was identified in 0.5% of the cases of GlobeMed Lebanon.The need to start rapidly an empirical antibiotic regimen can explain this result.It is important to note that as per the American Journal of Respiratory and Critical Care medicine (38), the initial microbiologic studies did not affect outcome in adults hospitalized with Community Acquired Pneumonia.
By reviewing our pneumonia cases by hospital, we noted that 64% were admitted in Great Beirut Hospitals and 36% in the peripherals. The most severe cases were admitted to University Hospitals that were classified among the ones having the highest LOS and a high mortality rate..
Table 11: Pneumonia ALOS and mortality rate, in UH versus non UH
After having focused on the mortality related to pneumonia, the restof the Outcomes are described shortly in the following figures:
Table 12: Outcomes, average length of stay and related additional cost in pneumonia
Figure 02: Types of Infections and Complications associated to pneumonia
Finally our study highlighted the severity and morbidity of a common disease: pneumonia. Despite the big advances in medicine and the availabilityof a wide range of antibiotics, pneumonia remains a high risk that requiresprompt management.
Source of Information: GlobeMed Lebanon
University Hospitals Non University Hospitals
Average length of stay (days) 7.6 4.3
Mortality rate 2.7% 0.6%
Outcome'sRate ALOS
Average Additional Cost
per Claim
Death 1.1% 25 $14,549
Infection 0.7% 26 $17,107
Complication 1.5% 20 $14,652
Readmission 2.7% 6 $529
Source of Information: GlobeMed Lebanon
Source of Information: GlobeMed Lebanon
Types of Infections associatedto Pneumonia
Types of Complications associated to Pneumonia
• Urinary Infection • Respiratory failure
• Mycosis • Acute Myocardial Infarct
• Septicemia • Renal failure
• Lymphangitis • Electrolytes imbalance
• Pneumothorax
• Phlebitis and Thrombophlebitis
• Poisoning by drugs
Source of Information: GlobeMed Lebanon
41GLOBEMED BULLETIN / MEDICAL OUTCOMES MANAGEMENT / 2012
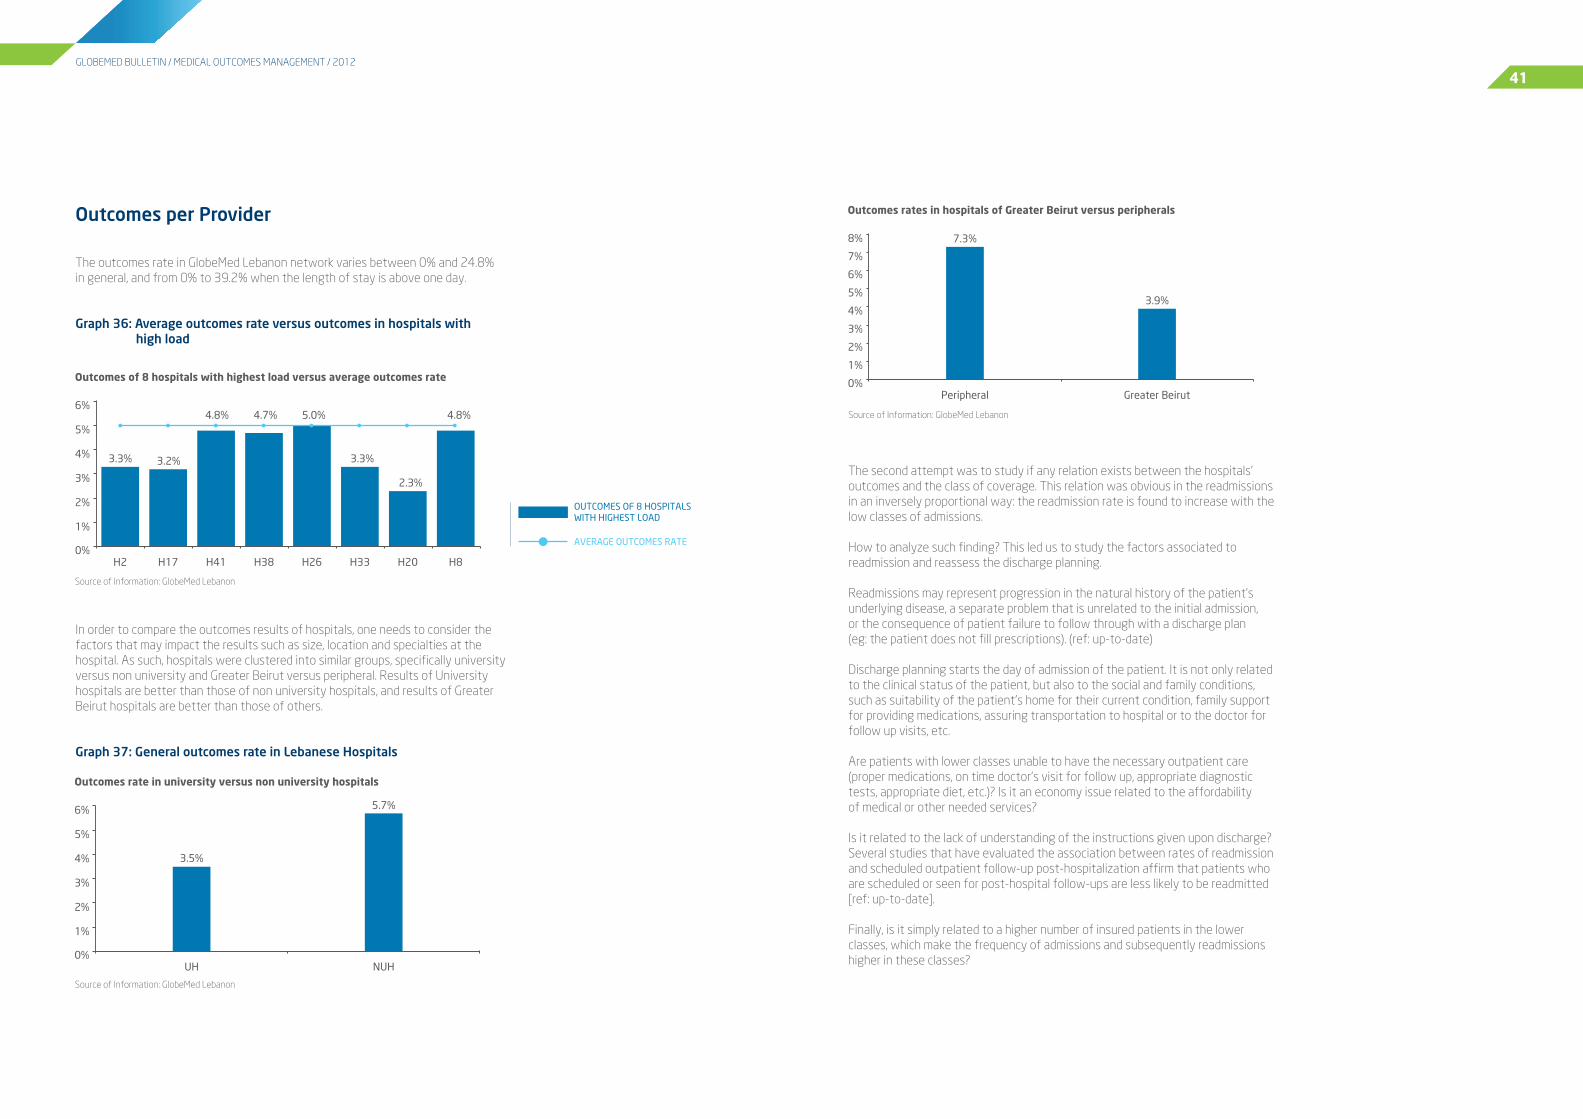
Outcomes per Provider
The outcomes rate in GlobeMed Lebanon network varies between 0% and 24.8%in general, and from 0% to 39.2% when the length of stay is above one day.
Graph 36: Average outcomes rate versus outcomes in hospitals with high load
In order to compare the outcomes results of hospitals, one needs to consider the factors that may impact the results such as size, location and specialties at the hospital. As such, hospitals were clustered into similar groups, specifically university versus non university and Greater Beirut versus peripheral. Results of University hospitals are better than those of non university hospitals, and results of Greater Beirut hospitals are better than those of others.
Graph 37: General outcomes rate in Lebanese Hospitals
The second attempt was to study if any relation exists between the hospitals’ outcomes and the class of coverage. This relation was obvious in the readmissions in an inversely proportional way: the readmission rate is found to increase with the low classes of admissions.
How to analyze such finding? This led us to study the factors associated to readmission and reassess the discharge planning.
Readmissions may represent progression in the natural history of the patient's underlying disease, a separate problem that is unrelated to the initial admission,or the consequence of patient failure to follow through with a discharge plan(eg: the patient does not fill prescriptions). (ref: up-to-date)
Discharge planning starts the day of admission of the patient. It is not only related to the clinical status of the patient, but also to the social and family conditions, such as suitability of the patient’s home for their current condition, family support for providing medications, assuring transportation to hospital or to the doctor for follow up visits, etc.
Are patients with lower classes unable to have the necessary outpatient care (proper medications, on time doctor’s visit for follow up, appropriate diagnostic tests, appropriate diet, etc.)? Is it an economy issue related to the affordabilityof medical or other needed services?
Is it related to the lack of understanding of the instructions given upon discharge?Several studies that have evaluated the association between rates of readmission and scheduled outpatient follow-up post-hospitalization affirm that patients who are scheduled or seen for post-hospital follow-ups are less likely to be readmitted [ref: up-to-date].
Finally, is it simply related to a higher number of insured patients in the lower classes, which make the frequency of admissions and subsequently readmissions higher in these classes?
Source of Information: GlobeMed Lebanon
Source of Information: GlobeMed Lebanon
Source of Information: GlobeMed Lebanon

43GLOBEMED BULLETIN / MEDICAL OUTCOMES MANAGEMENT / 2012
Graph 38: Relation between admission class and readmission rate in Lebanese Hospitals
Readmission rates are comparable to international data. But we have to link these results to the quality of the medical files at hospitals. In fact despite the standards imposed by the accreditation, we are noting in our daily review of files crucial missing information such as the detailed operative note. Complications may occur intra operatively but such information is not available to be studied.
An important question is raised: will the good reporting and the good quality of medical file in a hospital reflect badly on its ranking in terms of outcomes results? Whatever the answer, hospitals with high outcomes rates should analyze their results and work toward improving their performance, and hospitals with poor quality of medical files should focus on the consistent documentation of the outcomes and invest in analyzing their records and measuring their performance.
CONCLUSIONS & RECOMMENDATIONS
Conclusions
Hospitals within GlobeMed Lebanon network have an average outcomes rate of 5%, higher than the 3-4% of the USA (13), and less than the 7.5% of Canada (29).Yet hospitals have to take seriously the issue of reporting, analyzing and actingon the outcomes, specifically those having high rates.
Cost implication of the outcomes should be taken to the forefront. We cannot ignore the magnitude of this problem when our results show an impact of more than 800% for infection and 400% for complication.
As for the results per procedure/disease, Coronary Artery Bypass Graft affects men as of 46. Comorbidities have high impact on the outcomes. The general outcomes rate is 16.4% and it increases the average cost by 30%.
Total Hip Replacement affects women above 70 and the outcomes increasewith the presence of comorbidities. The outcomes rate is 8%, it increasesthe average cost by 62%.
Total Knee Replacement affects women above 70 and the outcomes are not affected by the comorbidities. The outcomes rate is 10% and it increasescost by 75%.
Cholecystectomy has a general outcomes rate of 8% and its impact on costis an increase of 18%.
Pneumonia is a disease affecting all ages but it is more dangerous for elderlywho have encountered higher length of stay, higher cost and higher morbidity. Since most severe cases were referred to University hospitals, the highest mortality rates are noted there.
Source of Information: GlobeMed Lebanon

45GLOBEMED BULLETIN / MEDICAL OUTCOMES MANAGEMENT / 2012
GLOSSARY
Medical Outcome is a change in the health status of a patient [the value of which can be measured], resulting from a clinical intervention (MedicineNet, Inc. 2010).For each of the 4 subject outcomes of this study, we will give the international practice, the GlobeMed Lebanon practice and an example from GlobeMed Lebanon experience.
Intra-hospital death
International Practice
• This is referred to a hospital mortality and defined as a vital statistic measuringor recording the rate of death from any cause in hospitalized populations(online medical dictionary).
• The risk-adjusted rate of all-cause in-hospital deaths occuring within 30 days of first admission to an acute care hospital. (www.statcan.gc.ca)
GlobeMed Lebanon Practice
• The rate of death occuring at any time after patient is admitted (ER is excluded). • This includes all cases regardless whether related to complications or not.
Example
• Patient: N.A.• Gender: female• DOB: 1942• Admission for Aortic Aneurysm, cold case• Outcome: death after one month of hospital stay, secondary to complications
and infections.• Additional LOS: 15 days• Additional cost: $125,000
Recommendations
1. Start by prioritizing the documentation of the outcomes through theenhancement of the quality of the medical files. Without proper collection of data, there is no performance indicator and consequently no remedial action and no improvement in the healthcare services provided.
2. Issue regular reports about the outcomes rates and their associated factors.Analysis of these reports in the morbidity/mortality committee of each hospital will lead to a better assessment of the risks related to each procedure establishment of best practices guidelines and consequently enhancementof the quality of care. This needs commitment from hospitals and support from different stakeholders.
Reporting is the cornerstone of the whole outcomes management process.
As per the World Health Organization:• The primary purpose of patient safety reporting systems is to learn from
experience.• A reporting system must produce a visible, useful response to justify the
resources expended and to stimulate reporting.• The most important function of a reporting system is to use the results of data
analysis and investigation to formulate and disseminate recommendations for systems change.
3. Put a discharge planning process in place whereby the length of stay iscontrolled and medically justified. Prolonged length of stay increases the riskof nosocomial infections.
4. Collect information from the patient: incidents reports and complaints may reveal adverse events that are not declared in the medical file. These shouldbe investigated and analyzed before being used.
5. Better control of the cause of death in hospitals. Almost all deaths that occurat hospitals are labeled secondary to cardiac arrest. Hospital staff should be encouraged to write down the actual cause of death such as “end stage cancer” or “post-operative complications” as causes of death.
6. Contribute to a national registry of outcomes to enable benchmarkingof both processes and outcomes.
7. Collaborate with the insurers and Third Party Administrators and create anarrangement based on the performance. For example the hospital that is able to maintain the average length of stay or the average cost of a procedure within a specific benchmark is paid a reward. Otherwise, the hospital will have to assume partially or totally the extra cost related to the outcomes.
8. Involve the Lebanese Order of Physicians in the medical outcomes review andanalysis to identify weaknesses, the need for training or other actions towards the doctors responsible for an adverse event.

47GLOBEMED BULLETIN / MEDICAL OUTCOMES MANAGEMENT / 2012
Complications
International Practice
• An unfavorable evolution of disease, health condition or medical treatment, leading health status to become worse in severity or to show a higher numberof signs, symptoms or new pathological changes throughout the body i.e. literally. (en.wikipedia.org)
• Also known as an Adverse Event (AE), this is a state or event unfavorable to the patient's health, arising either during admission while a patient is receiving a medical treatment or within 30 days after discharge, after their treatment has been completed. This either causes unintentional injury or requires patient to undergo additional treatment. (The Association of Surgeons in Netherlands)
• An injury or harm related to (or from) the delivery of care. (Institute for • • Healthcare Improvement, IHI)
• Any deviation from usual medical care that causes an injury to the patientor poses a risk of harm. Includes errors, preventable adverse events,and hazards (WHO).
GlobeMed Lebanon Practice
• An unfavorable evolution of a health condition or medical treatment leading • • health status to become worse in severity or to show a higher number of signs, symptoms or new pathological changes occuring during hospital stay. This excludes readmissions as they are being measured separately.
• Complications can occur in medical or surgical cases. • Complications occurring after discharge are excluded since they cannot be •
detected by GlobeMed Lebanon.
Examples
• Patient: A.S. • Gender: Female • DOB: 1961 • Surgery for hemorrhoids • Outcome: hemorrhage • Additional LOS: 5 days • Additional cost: $3200
• Patient: M.M • Gender: F • DOB: 1935 • Breast Surgery • Outcomes: hemorrhage necessitating transfusion and ICU stay • Additional LOS: 20 days • Additional cost: $7500
Re-Admissions
International Practice
• Hospital readmission is any unplanned admission to the same hospital occurring • within a specified time frame (7, 15 or 30 days) after discharge from an earlier • hospital stay. A readmission case at thr Mayo Clinic is the admission of a patient • to a hospital within seven days after being discharged from an earlier hospital • stay. (www.mayoclinic.org)
• A pair of consecutive hospital admissions to the same hospital where the timebetween discharge from the first hospitalization and admission for the second • hospitalization is less than equal to 90 days. Readmissions are further classified • into three subgroups; (1) time to readmission is less or equal to 30 days, (2) less • or equal to 60 days, and (3) less or equal to 90 days. (Medicaid)
GlobeMed Lebanon Practice
• Any unplanned admission to a hospital occuring within 30 days of the patient's • initial admission, for a related health condition.
Examples
• Patient: R.K.• Gender: Female• DOB: 1978• C-Section• Outcome: Readmission 5 days after discharge for a surgical pad left
inside the abdomen• Additional LOS: 5 days• Additional cost: $3200
• Patient: M.A.• Gender: Male• DOB: 1938• Total Knee Replacement• Outcomes: Readmission 3 times for luxation of prosthesis, removal of prosthesis
and application of spacer then total knee revision• Additional LOS: 20 days• Additional cost: $10,000

49GLOBEMED BULLETIN / MEDICAL OUTCOMES MANAGEMENT / 2012
Nosocomial Infection
International Practice
• Any infection that originates in, or that is acquired, in a hospital. A nosocomial • infection is specifically one that was not present or incubating prior to the • • • patient being admitted to the hospital, but occurred within 72 hours after • admittance to the hospital. (www.medterms.com)
• An infection that first appears between 48 hours and four days after a patientis admitted to a hospital or other health-care facility. (The encyclopedi of surgery)
• A hospital-acquired infection (or, in generic terms healthcare-associated • infection) that first appears 48 hours or more after hospital admission or within30 days after discharge. (en.wikepedia.org)
GlobeMed Lebanon Practice
• Any documented hospital-acquired infection that is a result of treatment ina hospital. Nosocomial infections appear during hospital stay and they werenot present prior to the patient being admitted to the hospital.
• Infections occurring after discharge are excluded since they cannot beby GlobeMed Lebanon.
Examples
• Patient: E.K.• Gender: Female• DOB: 1946• Spine surgery with instrumentation• Outcome: Infection with removal of material• Additional LOS: 25 days• Additional cost: $12,500
• Patient: E.N• Gender: Male• Open Heart (CABG)• Outcomes: Iinfection of lower limb • Additional LOS: 60 days• Additional cost: $30,000
APPENDIX
Table 13: CABG Outcomes in Lebanese hospitals
Graph 39: Cholecystectomy highest outcomes rate in Lebanese Hospitals
Hospital Number of Cases Outcomes Rate
H37 7 71.4%
H28 18 50.0%
H7 3 33.3%
H35 3 33.3%
H8 8 25.0%
H26 25 24.0%
H12 5 20.0%
H18 5 20.0%
H33 25 16.0%
H29 19 15.8%
H2 108 13.9%
H41 45 13.3%
H20 8 12.5%
H17 99 12.1%
H34 12 8.3%
H36 11 0.0%
H32 6 0.0%
H27 4 0.0%
H50 2 0.0%
Source of Information: GlobeMed Lebanon
Source of Information: GlobeMed Lebanon

51GLOBEMED BULLETIN / MEDICAL OUTCOMES MANAGEMENT / 2012
Graph 40: Cholecystectomy outcomes rate in Lebanese Hospitals with the highest load
Safety Procedures
• CABG: It is safe to do it in H2, H17, H41• THR: This procedure is safe to be done in H17, H22, and H33• TKR: It is safe to do it in H17, H20, H22 and H41• Cholecystectmy: It is safe to do it in many hospitals such as H2, H4, H13, H17,• •
H20, H34, and H41
Table 14: Rate of each type of outcome in some Lebanese hospitals, when length of stay is more than 1 day
Source of Information: GlobeMed Lebanon
Length of Stay > 1 day
InvestigatedGlobeMed Lebanon Provider
Death Rate Complication & Adverse Event rate
Readmission Rate NosocomialInfection Rate
All Hospitals 2.7% 4.9% 2.4% 2%
H16 3.20% 0.00% 0.00% 0.00%
H17 3.50% 0.50% 5.10% 4.30%
H18 4.20% 9.70% 2.80% 0.00%
H19 2.80% 0.00% 8.30% 0.00%
H20 0.50% 0.80% 2.20% 1.10%
H21 4.20% 6.20% 8.30% 2.10%
H22 5.00% 2.50% 2.10% 1.70%
H23 2.80% 2.80% 4.50% 2.20%
H24 2.80% 7.00% 2.80% 1.40%
H25 2.80% 1.40% 2.80% 1.40%
H26 4.80% 3.10% 5.60% 0.20%
H27 1.20% 0.00% 0.00% 0.60%
H28 3.60% 11.20% 14.80% 5.30%
H29 7.20% 11.40% 16.00% 4.60%
H30 0.00% 13.10% 8.10% 5.00%
H31 7.10% 3.60% 10.70% 0.00%
H32 4.20% 0.00% 2.10% 1.10%
H33 2.50% 1.80% 4.60% 1.50%
H34 1.70% 0.60% 1.40% 0.00%
H35 0.90% 1.70% 0.00% 0.00%
H36 0.70% 0.70% 4.00% 1.30%
H37 4.50% 6.90% 14.60% 4.50%
H38 2.60% 3.40% 4.40% 1.40%
H39 2.40% 7.30% 7.30% 2.40%
H40 3.80% 1.30% 5.10% 0.00%
H41 2.80% 1.80% 2.40% 0.70%
H42 2.70% 4.10% 8.10% 0.00%
H43 2.90% 5.00% 4.00% 0.70%
H44 0.40% 0.40% 0.60% 0.20%
Length of Stay > 1 day
InvestigatedGlobeMed Lebanon Provider
Death Rate Complication & Adverse Event rate
Readmission Rate NosocomialInfection Rate
All Hospitals 2.7% 4.9% 2.4% 2%
H1 2.20% 11.40% 6.50% 1.30%
H2 2.00% 0.40% 6.10% 2.80%
H3 0.80% 9.40% 3.90% 0.80%
H4 0.50% 3.00% 1.50% 0.50%
H5 2.20% 6.50% 8.70% 2.20%
H6 10.10% 7.80% 7.80% 3.90%
H7 4.10% 0.00% 8.20% 0.00%
H8 2.80% 3.40% 4.30% 1.40%
H9 16.70% 4.20% 4.20% 0.00%
H10 0.00% 2.90% 5.90% 2.90%
H11 0.00% 0.00% 4.40% 2.20%
H12 3.10% 10.60% 5.00% 0.60%
H13 1.60% 1.10% 2.20% 0.00%
H14 1.20% 0.00% 0.00% 0.00%
H15 5.30% 1.30% 5.30% 0.00%
Source of Information: GlobeMed Lebanon
Continued on page 49
Continued from page 48

53GLOBEMED BULLETIN / MEDICAL OUTCOMES MANAGEMENT / 2012
Table 15: Outcomes rate versus number of claims in GlobeMed Lebanon network of hospitals
LOS >1 Total LOS
Code Total # of Claims Outcomes Rate Total # of Claims Outcomes Rate
All Hospitals 15,004 12.1% 151,989 5.0%
H1 229 21.4% 3,256 12.5%
H2 3,150 11.4% 19,249 3.3%
H3 128 14.8% 2,691 9.3%
H4 198 5.6% 2,571 2.1%
H5 46 19.6% 364 11.8%
H6 129 29.5% 1,354 9.7%
H7 49 12.2% 1,223 1.1%
H8 352 11.9% 3,851 4.8%
H9 24 25.0% 844 6.8%
H10 34 11.8% 929 2.7%
H11 45 6.7% 727 3.0%
H12 160 19.4% 2,806 7.6%
H13 182 4.9% 2,036 4.1%
H14 81 1.2% 1,123 1.9%
H15 75 12.0% 977 4.5%
H16 94 3.2% 1,427 1.1%
H17 2,139 13.3% 15,798 3.2%
H18 72 16.7% 797 11.4%
H19 36 11.1% 608 1.6%
H20 370 4.6% 4,063 2.3%
H21 48 20.8% 755 8.5%
H22 239 11.3% 2,878 5.5%
H23 178 12.4% 1,835 5.3%
H24 71 14.1% 505 6.5%
H25 144 8.3% 1,867 2.8%
H27 19 31.6% 149 10.1%
H28 393 34.9% 3,663 11.8%
H29 237 39.2% 3,584 13.4%
H30 99 26.3% 1,442 12.6%
H31 28 21.4% 722 4.7%
H32 95 7.4% 1,456 1.9%
H33 606 10.4% 4,757 3.3%
H34 350 3.7% 3,539 2.2%
H35 116 2.6% 2,092 1.0%
H36 149 6.7% 1,844 2.4%
H37 246 30.5% 3,682 11.2%
H38 504 11.7% 5,864 4.7%
H39 124 19.4% 2,268 8.3%
LOS >1 Total LOS
Code Total # of Claims Outcomes Rate Total # of Claims Outcomes Rate
All Hospitals 15,004 12.1% 151,989 5.0%
H40 157 10.2% 2,063 5.5%
H41 1,239 7.7% 7,553 4.8%
H42 74 14.9% 862 6.6%
H43 278 12.6% 2,710 7.5%
H44 545 1.5% 3,754 1.6%
Continued on page 51
Continued from page 50

55GLOBEMED BULLETIN / MEDICAL OUTCOMES MANAGEMENT / 2012
13. Challenges Changes and Innovation in Health Care Delivery-Safety:www.libraryindex.com pages 1863.
14. Tian W, DeJong G, Munin MC, Smout R: Patterns of Rehabilitation After HipArthroplasty and the Association with Outcomes. An episode of Care View. Am J Phys Med Rehabil 2010;89:905-922.
15. Mervyn J Cross: Complications of Total Knee Arthroplasty. Medscape,Aug 3, 2011.
16. Ingraham A, Cohen M, Ko C, Lee Hall B: A Current Profile and Assessmentof North American Cholecystectomy: Results from the American Collegeof Surgeons National Surgical Quality Improvement Program.Journal of the American College of Surgeons, Volume 211, Issue 2 ,Pages 176-186, August 2010
17. Harboe K, Bardram L: Nationwide quality improvement of cholecystectomy:results from a national database. Int J Qual Health Care (2011) doi:10.1093
18. Duca S, Bãlã O, Al-Hajjar N, lancu C, Puia IC, Munteanu D, Graur F: Laparoscopic cholecystectomy: incidents and complications. A retrospective analysis of9542 consecutive laparoscopic operations. HPB (Oxford). 2003; 5(3): 152–158.
19. Shea J, Healey M, Berlin J, Clarke J, Malet P, Staroscik R, Schwartz J, Williams S: Mortality and Complications Associated with Laparoscopic Cholecystectomy.A Meta Analysis. Annals of Surgery, Vol 224 , No 5, 609-620.1996.
20. Daradkeh S.: Laparoscopic cholecystectomy: analytical study of 1208 cases. Hepatogastroenterology, 2005 Jul-Aug: 52(64):1011-4.
21. Overby DW, Apelgren K, Curcillo P, Awad Z, Clements R, Edelman D,
22. Down SK, Nicolic M, Abdulkarim H, Skelton N, Harris AH, Koak Y: Low ninety-day readmisison rates after emergency and elective laparoscopic cholecystectomyin a district general hospital. Ann R Coll Surg Engl 2010 May:92 (4):307-10
23. Pneumonia – Prognosis. University of Maryland Medical Center
24. Knee Replacement: Mayo Clinic
25. Memtsoudis S; Ma Y; Gonzalez Della Valle A; Besculides M; Gaber L; Koulouvaris P; Liu S: Demo-graphics, outcomes, and risk factors for Adverse Events Associated With Primary and Revision Total Hip Arthroplasties in the United States . Am J Orthop, 2010 Aug;39(8): E72-7.
26. Consumers Union: To Err is Human-To Delay is Deadly. Ten years later,a million lives lost, billions of dollars wasted. Safe Patient Project.org. May 2009.
27. Wenzel R and Edmond M: The Impact of Hospital-Acquired Bloodstream Infections. www.cdc.gov, Vol 7, No 2, Mar-Apr 2001.
References
01. Bozic K, Maselli J, Peko P, Lindenauer P, Vail T, Auerbach A: The Influenceof Procedure Volumes and Standardization of Care on Quality and Efficiency inTotal Joint Replacement Surgery. J Bone Joint Surg Am 2010; 92:2643-2652.
02. Paterson J.M., Williams J.I, Kreder H., Mahomed N., Gunraj N., Wang X, LaupacisA: Provider volumes and early outcomes of primary total joint replacement in Ontario. Can J Surg Vol 53 No 3 June 2010.
03. Husni et al.: Decreasing medical complications for total knee arthroplasty:Effect of Critical Pathways on Outcome. BMC Musculosquelettal disorders,2010, 11:160.
04. Patient Reports Can Identify, Reduce Adverse Events in Hospitals:Journal of Nursing; Aug 1,2008 (ASRN)
05. Huesh M:Outcomes and Quality.Provider-Hospital "Fit" and Patient Outcomes:Evidence from Massachusetts Cardiac Surgeons, 2002-2004. Health Researchand Educational Trust DOI:10.1111/j.1475-6773.2010.01169.
06. Nalysnyk L, Fahrbach K, Reynolds MW, Zhao SZ, Ross S: Adverse events incoronary artery by pass graft (CABG) trials: a systematic review and analysis. Heart. 2003 July; 89(7): 767–772.
07. Meliga E, Valgimigli M, Buszman P, Serruys P, MD: Percutaneous CoronaryIntervention or Coronary Artery Bypass Graft for Unprotected Left Main Coronary Artery Disease: The Endless De-bate. J Am Coll Cardiol, 2008;52:582-584, doi:10.1016/j.jacc.2008.04.048
08. Li Z, Carlisle D, Marcin J, Castellanos L, Romano P, Young JN, AmsterdamE: Impact of Public Reporting on Access to Coronary Artery Bypass Surgery:The California Outcomes Reporting Pro-gram. Ann Thorac Surg 2010;89:1131-1138
09. Sawatzky JA, Naimark B: Coronary Artery Bypass Graft Surgery. Exploring aBroader Perspective of Risks and Outcomes. Journal of Cardiovascular Nursing,Vol 24, No 3, pp 198-206.
10. Morton AP, Smith SE, Mullany DV, Clarke AJ, Wall D, Pohlner P: An applicationof outcomes monitoring for coronary artery bypass surgery 2005-2008 at TPCH. Heart Lung Circ,2011 May; 20(5):312-7.Epub 2011 Mar 5.
11. Gordon Bannister, Mansoor Ahmed, Miles Bannister, Rachel Bray, Paul Dillon, Stephen Eastaugh-Waring: Early complications of total hip and total knee replacement; a comparison of outcomes in a regional orthopaedic hospital and two independent treatment centres . Ann R Coll Surg Engl 20110;92:610-614.
12. Ohmann C, Verde PE, Blum K, Fisher B, de Cruppe W, Geraedts M: Two Short-TermOutcomes After Instituting a National regulation Regarding Minimum Procedural Volumes for Total Knee Replacement . J Bone Joint Surg Am 2010; 92:629-638.

57GLOBEMED BULLETIN / MEDICAL OUTCOMES MANAGEMENT / 2012
42. Association for Victims of Nosocomial Infections (ADVIN). What is Nosocomial Infection? General Documentation February 2009 (http://www.advin.org/en/general-documentation/what-is-a-nosocomial-infection.html)
43. Brill, Andrew et al. The effects of laparoscopic cholecystectomy, hysterectomy, and appendectomy on nosocomial infection risks. Surg Endosc. 2008 April;22: 4: 1112–1118
44. Chang, Ya-Shu et al. Comparison of adult patients hospitalized with pandemic (H1N1) 2009 influenza & seasonal influenza during the “PROTECT” phase of the pandemic response. The Medical Journal of Australia (MJA) 2010; 192:2: 90-93
45. Davis, P. et al. Adverse events in New Zealand public hospitals: occurrenceand impact, N.Z.Med.J 2002. Vol. 115:1167:U271.
46. Forster, Alan J. Adverse events among medical patients after discharge from hospital. CMAJ February 2004; 170 (3)
47. Frieden, Joyce. Medicare working to prevent beneficiary readmissions.MD Consult; March 2010.
48. Gawande AA. Et al. The incidence and nature of surgical adverse events in Colorado and Utah in 1992. Surgery 1999; 126:1:66-75.
49. Goldfield, Norbert et al. Strategies to decrease the rate of preventable readmission to hospital. Canadian Medical Association Journal, April 2010.
50. Hayward R. A., MD, Estimating Hospital Deaths Due to Medical Errors; Preventability is in the Eye of the Reviewer. JAMA July 2001; 286:4.
51. Hernandez, Adrian MD, MHS et al. Early follow up after hospital discharge can lower readmission rates for heart failure patients. Journal of the American Medical Association, May 5, 2010.
52. Hoonhout, Lilian HF et al. Direct medical costs of adverse events in Dutch hospitals, BioMed Central (BMC) Health Services Research 2009, 9:27.
53. Jha, Ashish K. M.D. et al. Preventing readmissions with improved hospital discharge planning. The New England Journal of Medicine, December 2009
54. Leape M.D., Lucian L. The Nature of Adverse Events in Hospitalized Patients Results of the Harvard Medical Practice Study II. NEJM February 1991;324:377-384
55. Lindenauer, Peter et al. Perspective: Reexamining readmissions. MD Consult, February 2010.
56. Mason A et al. Use of case fatality and readmission measures to compare hospital performance in gynecology. International Journal of Obstetrics & Gynecology (BJOG) 2006; 113:6:695–699
28. Gatnes R, Richards C, Edwards J, Emori TG, Horan T, Alonso-Echanove J, Fridkin S, Lawton R, Peavy G,Tolson J, and the NNIS System Hospitals: Feeding Back Surveillance Data To Prevent Hospital-Acquired Infections. www.cdc.gov, Vol 7, No 2, Mar-Apr 2001.
29. Baker G.,Norton P,Flintot V, Blais R, Brown A, Cox J, Etchells E, Ghali W, Hebert P, Majumdar S, O’Beime M,Palacios-Dellingher L, Reid R, Sheps S, Tamblyn R:The Canadian Adverse Events Study: the incidence of adverse events among hospital patients in Canada .CMAJ. 2004 May 25:170(11):1678-1686.
30. Mitchell P: Defining Patient Safety and Quality Care. Evidence Based Handbook for Nurses (AHRQ publication No 08-0043)
31. Measuring Quality in Private Hospitals; Prepared by NHMRC Centre of Research in Patient Safety Department of Epidemiology and Preventive Medicine Monash University September 2008, ACHR.
32. Judez L, Aibar R, Ortega M, Aquilella D, Aranaz A, Guifierrez C: Incidence of Adverse events in a general surgery unit. Cir Esp 2009 Aug 86(2) 79-86, Epub
33. Healey M, Shackford S, Osler T, Rogers F, Burns E:Complications in Surgical Patients. Arch Surg. 2002;137:611-618
34. Klevens R, Edwards J, Richards C, Horan T, Gaynes R, Pollock D, Cardo D: Estimating Health Care-Associated Infections and Deaths in U.S. Hospitals, 2002. Public Health Reports, March April 2007, Vol 122.
35. Ferris T, Torchiana D: Public Release of Clinical Outcomes Data-Online CABG Report Cards. N Engl J Med 363;17 NEJM.ORG October 21, 2010.
36. Szabó Z, Håkanson E, Svedjeholm R: Early postoperative outcome andmedium term survival in 540 diabetic and 2239 nondiabetic patients undergoing coronary artery bypass grafting. Ann Thorac Surg 2002; 74:712-719
37. Tudose C, Moisoiu A, Bogdan M: Mortality Risk and Etiologic Spectrum of Community acquired Pneumonia in Hospitalized Adult Patients. Maedica (Buchar). 2010 December; 5(4): 258–264.
38. Sanyal S, Smith P, Saha A, Gupta S, Berkowitz l, Homel P: Initial microbiologic studies did not affect outcome in adults hospitalized with Community-acquired pneumonia. Am J Respir Crit Care Med Vol 160. pp346–348, 1999
39. Veen E , Bik M , Janssen-Heijnen M , De Jongh M, Roukema A: Outcome measurement in laparoscopic cholecystectomy by using a prospective complication registry: results of an audit Int. Journal for Quality in Health Care, Volume 20, Issue 2, Pp. 144-151.
40. Agency for Healthcare Research and Quality (AHRQ)-HCUP net. Statistics 2008
41. Angulo, Piedrola G. Reflections after forty years of nosocomial infections.An R Acad Nac Med (Madr), Jan 2009;126:3:477-84

GLOBEMED BULLETIN / MEDICAL OUTCOMES MANAGEMENT / 2012
57. National Institute for Clinical Excellence (NICE). Surgical Site Infection:Final Scope (www.nice.org.uk)
58. National Institute for Health and Clinical Excellence (NICE). Interventional procedure consulta-tion document: Laparoscopic hysterectomy for endometrial cancer. September 2010
59. NHS Performance indicators, 2000
60. Nosocomial infections at Clinical Centre in Kragujevac: Prevalence study.Srp Arh Celok Lek, May 2010; 138:5-6:337-42.
61. Readmission Rates; Mayo Clinic.http://www.mayoclinic.org/quality/readmissionrates.html, 2007
62. Singh, Mandeep MD, et al. Validation of Mayo clinic risk adjustment model for in-hospital com-plications after percutaneous coronary interventions, using the National Heart, Lung, and Blood Institute dynamic registry. J Am Coll Cardiol, 2003; 42:1722-1728.
63. Thomas, E. J. et al. A comparison of iatrogenic injury studies in Australia
and the USA. I: Context, methods, case mix, population, patient and hospital characteristics, Int.J.Qual.Health Care 2000, vol. 12:5:371-378.
64. Weingart, Saul N. Epidemiology of medical error. BMJ March 2000; 320 (18) 65. World Health Organization, World Health Statistics 2008.
66. Lagoe R, Westert G: Evaluation of hospital inpatient complications:a planning approach. BMC Health Services Research 2010, 10:200.

GlobeMed Lebanon
Kazandjian Building 213, Street 64 Sin El Fil, Metn 2707 6205 P.O.Box 55664, Lebanon
T +961 1 518000F +961 1 518152
[email protected] www.globemedlebanon.com