global warming myth and marxism - icecapicecap.us/images/uploads/globalwarmingmyth.pdf · global...
TRANSCRIPT
1
Edward F. Blick
Global Warming Myth
and MarxismHow the U.N. and Marxist Economists Have Used the Global Warming Myth to Wreck
World Economies
Edward F. Blick, Ph.D.
Global Warming Myth and Marxism
2
All Scripture quotations are from the King James Version of the Holy Bible, unless otherwise noted.
© 2009 by Southwest Radio Church of the Air. All rights reserved. No part of this book may be reproduced in any manner whatsoever without written permission of the publisher, except in the case of brief quotations in articles and reviews. For more information, write South-west Radio Ministries, P.O. Box 100, Bethany, OK 73008; call 1-800-652-1144; or e-mail www.swrc.com.
Printed in the United States of America
About the AuthorDr. Edward F. Blick holds a M.S. in Aeronautical Engineering, and a Ph.D. in Engineering Science. He served as a U.S. Air Force weatherman from 1951 to 1954. He has also been a professor at the University of Oklahoma in the School of Petroleum & Geological Engineering, the School of Meteorology, the College of Medicine, and the School of Aerospace, Mechanical & Nuclear Engineering. Dr. Blick has worked for Lockheed Missile and Space Co. and McDonnell Aircraft Corp., and has consulted for several corporations and government agencies, including NASA and the United States Air Force.
3
Edward F. Blick
Global Warming Myth Used by U.N. and Marxists to Wreck
World Economies
Summary
United Nations politicians, while admitting their lack of evidence, gave birth and nurtured the fraud of Anthropogenic Global Warming (AGW). Their Malthusian purpose is to frighten people into accepting the U.N. as the “centerpiece of democratic global governance” and let the U.N. ration our fossil fuel. World temperature records show no evidence of AGW (Fig. 9). Solar activity in the twentieth century was extremely high. Atmospheric CO2 levels rose as the sea surface warmed (Fig. 4). Henry’s Solubility Law, coupled with mass balances of carbon and its isotopes, prove the total increase in atmospheric CO2 from pre–industrial times is 2–4 percent. Burning all our remaining fossil fuels, cannot double the CO2, but only increase it by 20 percent. Beck (2007) cataloged 90,000 chemical measurements of atmospheric CO2 in the 1800s, some as high as 470 ppm (parts per million) (greater than the current Mauna Loa value of 385 ppm). These data exposed as false the U.N. IPCC’s 280–ppm ice core values, supposedly measured during the 1800s. IPCC’s ice core measurements of CO2 were incorrect due to their inability to correct
Global Warming Myth and Marxism
4
for problems with gas solubility and the extreme pressures in glaciers. God rules the climate, not man
Introduction
AGW is a hoax and has become the political agenda for the Democratic Party and their environmental extremist supporters. There is no con-vincing evidence for it. The originator of the AGW myth is the United Nations. They have undiluted power to deceive the public. They are law-less, corrupt, anti–God, and an utter fraud. They are using the delusion that man’s use of fossil fuels causes global warming in order to frighten people into allowing them to rule the world, because any group that controls carbon, controls the world. AGW is a hoax, religion, junk science, and is worthless in its predictions of future global temperatures. It is as scientific as astrology!
The U.N. and the Marxists
The source of this hoax is important. Everyone should be aware that the AGW hoax was initiated and nurtured by the corrupt politicians of the United Nations, the same people who colluded with Saddam Hussein to skim billions of dollars in their “Oil for Food” scheme! AGW is environ-mental extremism. Dr. Tim Ball, the distinguished former climatology professor at the University of Winnipeg, has stated it is “possibly the greatest deception in human history.” The environmental extremists aim to destroy the industry western civilization. Many of these green Nazis are misanthropic fanatics. Man is bad . . . polar bears are good! Limit the number of people on the Earth! They will not be satisfied until we are all living in a hut, defecating in a bucket, and cooking our food on our dried dung.
After the 1989 fall of the Soviet Union, the Marxists, socialists, and anti–capitalists wackos were looking for a new way to reinvent them-
5
Edward F. Blick
selves and find a new way to destroy America and western economies. They found it in the evil U.N.’s contrived “man is destroying the planet by burning fossil fuel religion.” This new religion of the socialists and anti–consumerists oppose large corporations, global free trade, and eco-nomic growth. They hate oil, coal, and gas companies. Thirty years ago they, along with Jane Fonda and her movie China Syndrome, destroyed nuclear energy in this country. At present we have a Marxist president in our White House who shares many of their views. Our Marxist media, who love to publish gloom and doom stories about global warming, have joined hands with him.
Our president’s aversion to nuclear energy, and his vow to banish coal, is frightening. Coal provides over 50 percent of our electricity. Coal, oil, and natural gas built our modern economy during a fifty–year period from 1880 to 1930. During that period we went from horse transportation to planes, trains, and automobiles. Carbon–based energy has brought lower infant mortality, longer life expectancy, running water, electricity, astounding medical advances, and modern dentistry.
Socialist Maurice Strong is the man behind the curtain in the United Nations, pulling the levers to use AGW as the vehicle to shift powers away from individuals and sovereign nations to a small band of un-accountable international elites. He has been the U.N. high priest of environmentalism going as far back as U.N. Secretary General U Thant (a Burmese Marxist). Maurice Strong has been involved in many U.N. scandals, including the notorious Iraqi “Oil for Food” program. In 1997, while serving as advisor to Kofi Annan, he reportedly took a check for almost $1 million from Saddam Hussein’s U.N.–sanctioned regime. Strong is an enemy of our way of life. He is the mentor of Al Gore.
Strong and the U.N. set up the 1992 Rio de Janeiro conference en-titled “The Earth Summit.” It was attended by Vice President Al Gore. At this conference Strong stated, “The Earth Summit will play an impor-tant role in reforming and strengthening the U.N. as the centerpiece of the emerging system of democratic global governance,” i.e. a one–world
Global Warming Myth and Marxism
6
government run by the U.N.Maurice Strong and the U.N. set up the 1997 Kyoto conference on
global warming. All countries were urged to sign a treaty to reduce their CO2 output in order to save the planet. China, India, and the U.S. refused. Most of Europe joined, but have done little in the way of low-ering their CO2 output. The National Review magazine, September 1, 1997, quoted Strong, “The only way of saving the world may be for industrial civilization to collapse, deliberately seek poverty, and set levels of mortality.” Futile attempts to control carbon by rationing fossil fuel use by Western governments are exacerbating the present world economy, which is now circling around the drain. Timothy Wirth, former U.S. Senator from Colorado and president of the United Nation’s Foundation stated, “We have to ride the theory of global warming even if it is wrong.” Richard Benedict, former advisor to Kofi Annan stated, “A global warming treaty must be implemented even if there is no evidence of global warming.” These guys know AGW is not true, and are deceiving the world by saying they are saving our planet.
The urge to save humanity is almost always a false front for the urge to rule.
—H. L. Mencken
In 1988, the corrupt U.N. politicians set up a phony scientific panel called the Intergovernmental Panel on Climate Control (IPCC). Its purpose was to frighten people of AGW, and have them beg for a government solu-tion. There was no scientific evidence then or now of any significant AGW, so they had to create a masterful lie. Sir John Houghton, the first chairman of the U.N.’s IPCC stated, “Unless we announce disaster, no one will listen”!
Here is how they succeeded. As a smoke screen, qualified experts in science and climatology were hired to investigate if man has affected the warming of the earth. Here is the summary the scientists wrote for the 1995 IPCC Draft Report:
7
Edward F. Blick
1. None of the studies have shown any clear evidence of climate changes due to greenhouse gases.
2. No study has positively attributed any climate change to an-thropogenic causes.
3. Any claims of positive detection of significant climate change are likely to remain controversial until uncertainties in the total natural variability of the climate are reduced.
This was not what the U.N. wanted! After the real scientists dropped off their report, the U.N. politicians removed all three of the above quotes and inserted the following bold–faced lie in the final 1995 IPCC Sum-mary Report for lawmakers:
The balance of evidence suggests a discernible human influence on global climate.
Because of this stab in the back lie, many of the IPCC scientists quit and threatened the U.N. with a lawsuit in order to have their names removed from the IPCC final report.
The U.N. political appointees have adopted a strange and unusual way of writing their IPCC reports. They first publish a summary report for lawmakers. Then several months later they publish the scientific report so as to assure its consistency with the previous summary re-port. This is political indoctrination, not science! I’ve never known of a science project where the summary is written first, and then the scientific work is completed and reported later. After the 1995 IPCC report, the lies, deceit, and sleight of hand were repeated in 2001 and 2007 IPCC reports.
Al Gore, the Chicken Little of Global Warming
Al Gore, the “Chicken Little” of global warming is a politician, not a
Global Warming Myth and Marxism
8
scientist. He made an “F” on his College Board physics exam and a “D” in chemistry. He flunked out of Vanderbilt’s divinity school, with five “F”s. He later transferred to Harvard and had only two college natural science courses. He made a “D” in an evolution class, and a “C+” in the other science course. With this academic background, does anyone really think he could have written two cleverly crafted science–fiction books on global warming? Could Gore’s friends at the U.N. have ghost-written those two books for Al? Gore ducks all challenges to debate on AGW. It is reported he collects $250,000 for his colorful “dog and pony” show “on man’s destruction of the earth by [AGW].” Of course, he is a hypocrite; his home reportedly uses over twenty times the amount of electricity as an ordinary American home. To add insult to injury, Al Gore was awarded a Nobel Prize. This prize should have come with an engraved plaque of Proverbs 26:8, “Honoring a fool, is as foolish as tying a stone to a slingshot.”
Dr. James Hansen: Fox Guarding the Hen House Dr. James Hansen has been Al Gore’s global warming mentor for several decades, and is a media darling depicted as a non–partisan scientist. But his immense arrogance is dwarfed by his great dishonesty. He is the di-rector of NASA’s GISS lab that keeps track of global temperature. Several prominent scientists have accused Hansen of cooking the temperature books in order to make them appear to show that global warming has occurred. Over 9,000 news stories have quoted his pro–global warming lies. Recently, Oklahoma senator James Inhofe “cleaned Hansen’s clock” when he testified before Inhof’s Senate committee.
In 1988 he appeared before Senator Al Gore’s committee and stated he was 99 percent certain the earth was warming due to man’s burning of fossil fuels. He made a prediction to the senators about how much the earth would warm up in the 1990s. His prediction was too high by 300 percent. In 2004, he publicly endorsed John Kerry for president,
9
Edward F. Blick
and then he received a $250,000 gift from the charity of Kerry’s wife, Theresa Heinz. On June 23, 2008, Hansen asked Congress to convict Big Oil leaders for the high crime of doubting global warming! In a moment of candor, he did admit he is willing to exaggerate science in order to get public attention. In February 2009, Hansen equated coal with death. Some responsible climatologists have called for his termination. With the Marxist coup that took over our country on January 20, 2009, it is doubtful that will happen, since our president is singing the same tune as Hansen.
CO2: Gas of Life
CO2 is not a pollutant. It is the gas of life for plants, man, and animals. All plant life is sustained by photosynthesis, where CO2 plus water plus the sun’s energy form carbohydrates plus oxygen. Humans and animals breathe in oxygen and exhale CO2. It sounds like an intelligent design!
Many qualified climate scientists have noted the earth has been cooling for the past ten years. Some are predicting this cooling effect is due to periodic cycles of the solar output and may continue for many decades. If this happens, we are going to have less land to produce crops, since many millions of acres of land in the northern regions of North America, Europe, and Asia will be too cold to farm. To improve the productivity of the land that can be farmed we need as much CO2 in the atmosphere as possible. Yet some Green Nazis in our govern-ment want to sequester CO2—that is, they want to take CO2 out of our atmosphere and pump it into the ground! We have met the enemy, and it is our governments, from the U.N. on down to our national, state, and local levels. The Green Nazis have gained a lot of power since our 2008 November election!
If atmospheric CO2 falls to 220 ppm, plants get sick. They die at 160 ppm. In a field of corn on a sunny day, unless wind currents stir up the air, all of the CO2 is consumed within one meter of the ground in
Global Warming Myth and Marxism
10
five minutes (Source: personal communication with Daryl Smika, Plant Physiologist, U.S. Dept. of Agriculture). In order to increase their yield, commercial greenhouse owners increase the CO2 levels to 600–1,000 ppm. According to the Mauna Loa Observatory, the present atmospheric CO2 is about 385 ppm, but in times past it was as high as 2450 ppm. (Jaworoski, 1992a, 1992b).
Evidence Against Global Warming
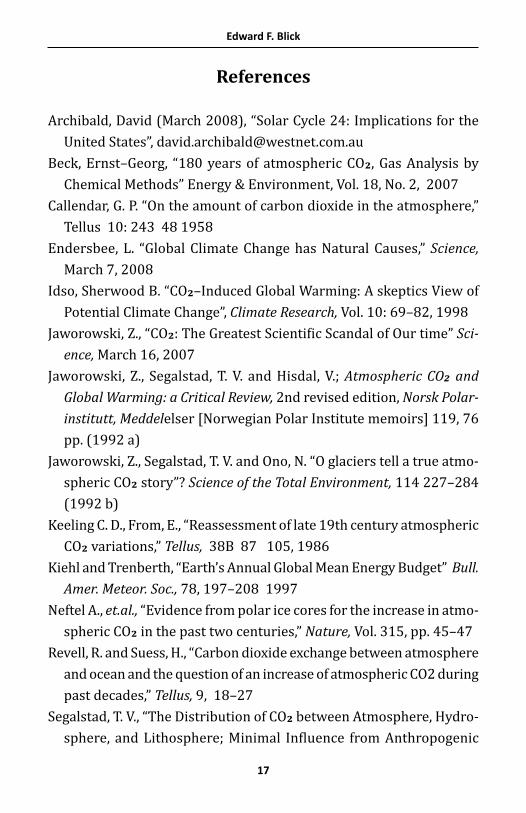
The hottest years for America in the twentieth century were in the 1930s (Fig.1). Twenty–four states had their high temperature records set in the 1930s. Only seventeen had their temperature records set in last fifty years of the twentieth century! Where is the fingerprint of “AGW”? Looking at these data, how can any reasonable person believe it?
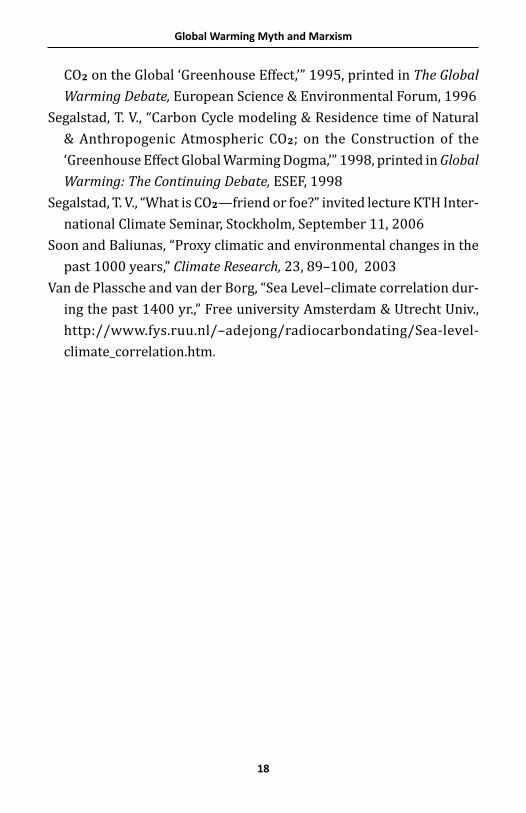
During the twentieth century the Earth warmed up about 0.6° C. The warming correlated with the great increase in solar activity (Fig. 2). Similarly, astronomers noted that Jupiter, Mars, Saturn, Neptune, and Pluto all warmed up in the twentieth century (Archibald, 2008). Since 1998, global warming has taken a vacation. We’ve had global cooling from a lazy sun with its reduced sun spot activity (Archibald, 2008).
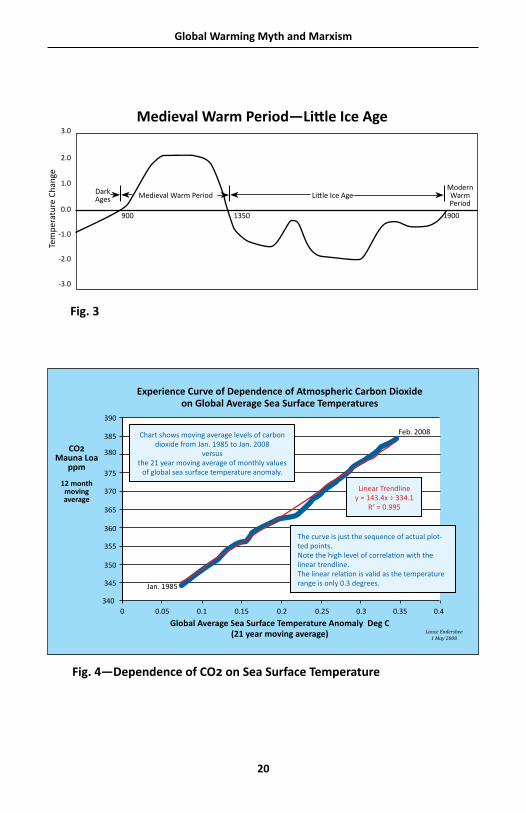
We’ve all seen the CO2 bubbles rise out of a glass of a cola drink as it warms after taken out of the refrigerator. Similarly the oceans “breathe” carbon dioxide in and out with its cooling or heating by the sun. CO2 is less soluble in water as it warms and more soluble as it cools. The warming during the twentieth century caused the oceans to emit more CO2 into the atmosphere (Endersbee, 2008, Fig. 4).
Since the late 1800s, a miniscule amount of atmospheric global heating of ½ W/m2 was due to an increase of 2–4 percent of atmo-spheric CO2, due to the burning fossil fuels (Segalstad, 1996). This corresponds to a tiny 0.05° C rise in temperature, using the climate sensitivity parameter of 0.1° C per W/m2 (Kiehl and Trenberth, 1997). This climate sensitivity parameter of 0.1° C per W/m2 agrees with eight
11
Edward F. Blick
natural experiments (Idso, 1998). U.N. climate models use sensitivity values 5–10 times higher than 0.1° C per W/m2. Why? It allows the U.N. results to frighten people with exaggerated predictions of future global temperatures!
Archer (2008) extrapolated the atmospheric CO2 to be 380–420 ppm in the next twenty years. Using the University of Chicago’s MOD-TRAN facility, he obtained a 0.4 W/m2 increase in global warming. Using Idso’s 0.1° C per W/m2 sensitivity value, he predicted a 0.04° C increase in temperature due to CO2 green house effect. This is an insignificant rise in temperature. If a room temperature increased 0.04° C (0.07° F), a human would not be able to notice such a tiny increase in temperature! Yet the environmental extremists scream the lie that man is going to burn up the planet and drown us all, due to melting glaciers. Trillions of dollars can be poured into this nonexistent problem by trying to eliminate the use of fossil fuels and CO2 but it will accomplish nothing but wreck our economy and pour the money down a rat hole.
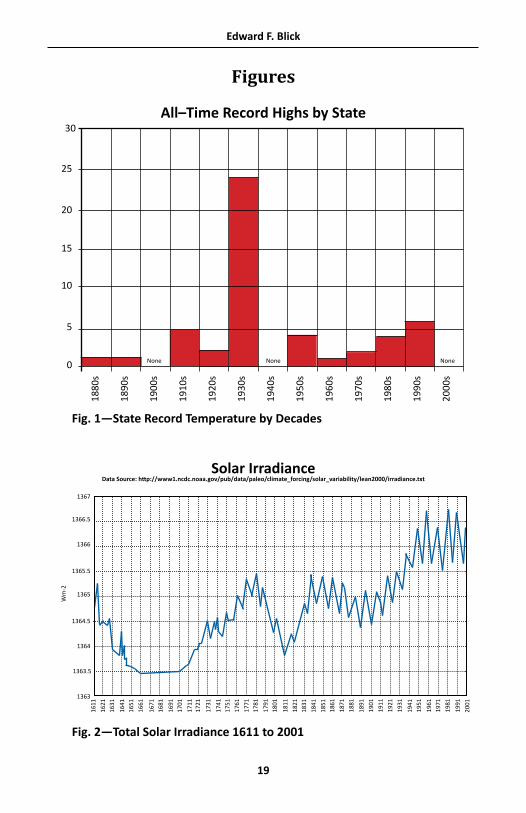
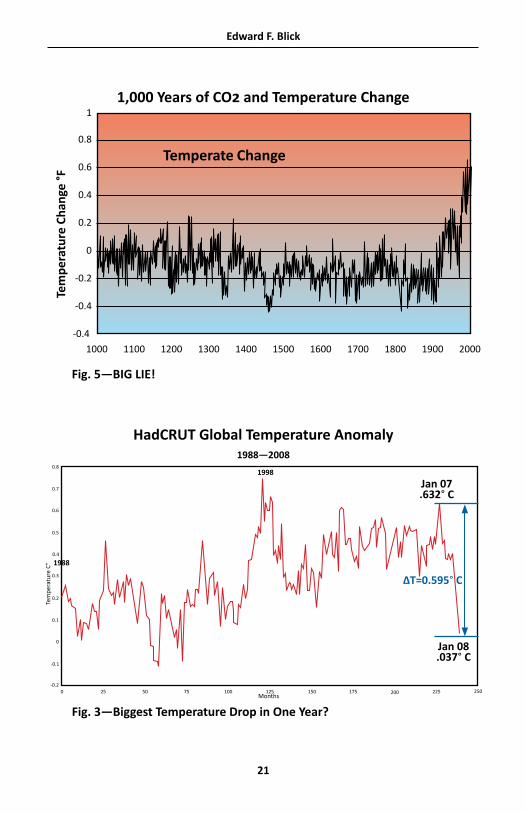
In 1995, the U.N. IPCC produced a chart, Fig. 3, showing global temperature anomalies for the past 1,300 years. This chart agreed with hundreds of scientific papers written on the Medieval Warm Period and the Little Ice Age which followed. From about a.d. 900 to 1350, the earth was approximately 2° C warmer than now. During this time, the Vikings colonized Greenland, and many of the great cathedrals were built in Europe. The Chinese navy sailed in the Arctic with little sign of ice. The Little Ice Age that followed lasted about 400 years (Soon & Baliunas, 2003). The bodies of the Viking colonists are now buried under Greenland’s permafrost. Yet, in 2001, six years after the U.N. published Fig. 3, the U.N. did an about–face, and published a new, radically different “hockey stick” chart (Fig. 5). It showed essentially a flat temperature for the 1,000–year prior to the twentieth century, followed by a rapid rise of earth’s temperature in the twentieth century. The U.N. blamed the rise on AGW. The man who conjured up this false chart was accused of “cherry picking” the data. The U.N.’s hockey stick was broken in 2007
Global Warming Myth and Marxism
12
after scores of reputable scientists protested against this fraudulent chart. Two scientists, McIntyre and McKitrick, using 1,000 years of proxy data, uncovered the “hockey stick” lie. Hearings were held in Congress and the National Academy of Sciences. The U.N. hockey stick chart was labeled fraudulent, and designed to deceive the public and lawmakers.
The green movement to limit or eliminate the burning of fossil fuels eagerly seized upon this U.N. AGW myth. As of now, one of our political parties has joined hands with the environmental extremists and refuses to allow for oil and gas drilling in promising areas, all in the name of controlling carbon. MIT professor Dr. Richard Lindzen (one of our top climate scientists) was an original member of the IPCC team (before he discovered the IPCC was a fraud, and quit). Lindzen stated, “Controlling carbon is a bureaucrat’s dream. If you control carbon, you control life!”
The most important greenhouse gas is water vapor. Its mass is 54 times greater than CO2. “The first 30 feet of water vapor absorbs 80 percent of the earth’s heat radiation. You can go outside and spit and have the same effect as doubling CO2!” (Dr. Reid Bryson, former director of Meteorology, University of Wisconsin.)
One hundred fifty years ago, the atmospheric CO2 contained 700 Gt of carbon (1 Gt = 1 billion tons), and the earth contained 7,000 Gt of carbon in the form of fossil fuels. It is estimated that man has burned 1,000 Gt of the original 7,000 Gt. (Segalstad, 1998). For water, at nor-mal temperature, Henry’s Law of Solubility dictates there will be 50 parts of CO2 in solution, for one part of gaseous CO2 above the water. Experimental measurements have shown that the residence time of CO2 in the atmosphere is about five years. The corrupt U.N. politicians (without any proof) say the residence time is 50–200 years. Hence today, after 150 years, the amount of CO2 added by man to the atmo-sphere is (1/50) × 1000 = 20 Gt, and the increase in atmospheric CO2 is (700 + 20)/700 = 1.03 or a 3 percent increase!! (Segalstad, 1998). The U.N., using junk science and mysterious fudge–factors, said the increase is 21 percent. Where is their proof? They don’t have any!
13
Edward F. Blick
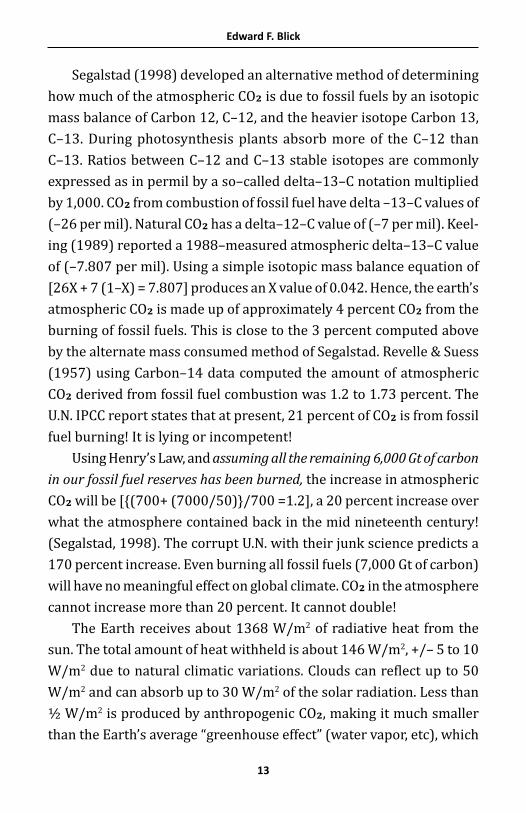
Segalstad (1998) developed an alternative method of determining how much of the atmospheric CO2 is due to fossil fuels by an isotopic mass balance of Carbon 12, C–12, and the heavier isotope Carbon 13, C–13. During photosynthesis plants absorb more of the C–12 than C–13. Ratios between C–12 and C–13 stable isotopes are commonly expressed as in permil by a so–called delta–13–C notation multiplied by 1,000. CO2 from combustion of fossil fuel have delta –13–C values of (–26 per mil). Natural CO2 has a delta–12–C value of (–7 per mil). Keel-ing (1989) reported a 1988–measured atmospheric delta–13–C value of (–7.807 per mil). Using a simple isotopic mass balance equation of [26X + 7 (1–X) = 7.807] produces an X value of 0.042. Hence, the earth’s atmospheric CO2 is made up of approximately 4 percent CO2 from the burning of fossil fuels. This is close to the 3 percent computed above by the alternate mass consumed method of Segalstad. Revelle & Suess (1957) using Carbon–14 data computed the amount of atmospheric CO2 derived from fossil fuel combustion was 1.2 to 1.73 percent. The U.N. IPCC report states that at present, 21 percent of CO2 is from fossil fuel burning! It is lying or incompetent!
Using Henry’s Law, and assuming all the remaining 6,000 Gt of carbon in our fossil fuel reserves has been burned, the increase in atmospheric CO2 will be [{(700+ (7000/50)}/700 =1.2], a 20 percent increase over what the atmosphere contained back in the mid nineteenth century! (Segalstad, 1998). The corrupt U.N. with their junk science predicts a 170 percent increase. Even burning all fossil fuels (7,000 Gt of carbon) will have no meaningful effect on global climate. CO2 in the atmosphere cannot increase more than 20 percent. It cannot double!
The Earth receives about 1368 W/m2 of radiative heat from the sun. The total amount of heat withheld is about 146 W/m2, +/– 5 to 10 W/m2 due to natural climatic variations. Clouds can reflect up to 50 W/m2 and can absorb up to 30 W/m2 of the solar radiation. Less than ½ W/m2 is produced by anthropogenic CO2, making it much smaller than the Earth’s average “greenhouse effect” (water vapor, etc), which
Global Warming Myth and Marxism
14
varies naturally within 96 to 176 W/m2 (Segalstad, 2006).The total internal energy of the whole ocean is 3.3 x 1027 Joules,
about 3,500 times greater than the total energy of the entire atmo-sphere, 9.4 × 10²³ joules. The global climate is primarily governed by the enormous heat energy stored in the oceans and the latent heat of melting of the ice caps. From a thermodynamic heat balance, the small amounts of heat generated by anthropogenic CO2 could not possibly cause significant increases in sea level (Segalstad, 1995).
Fourteen hundred years of study found approximately 10 inches of difference in sea level between the thermal expansions of the Medieval Warm Period and thermal contractions of the Little Ice Age (van de Plassche).
One of the biggest global temperature drops ever recorded occurred from January 2007–08 (Fig. 6). The drop in temperature was about equal to the net gain in average temperature for the twentieth century.
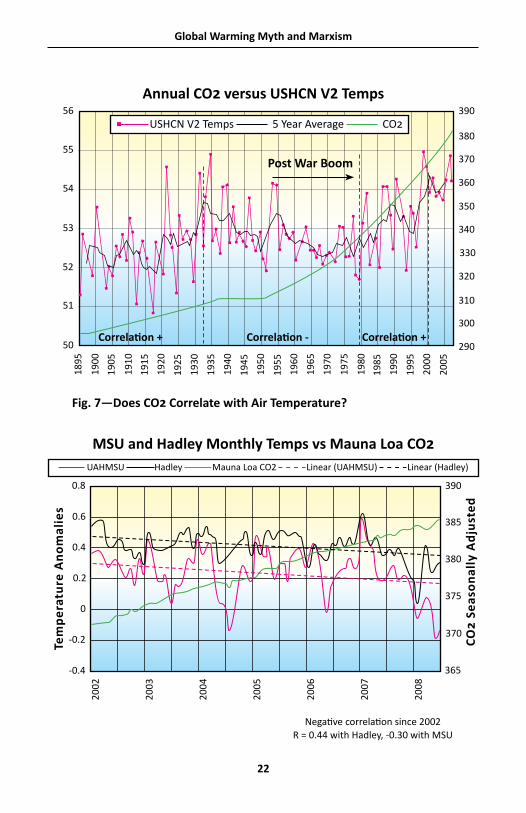
Figure 7—Does the atmospheric CO2 correlate with temperature? It should if AGW were correct. But Figure 7 shows it does not always correlate. Figure 4 shows CO2 does correlates very well with sea surface temperature.
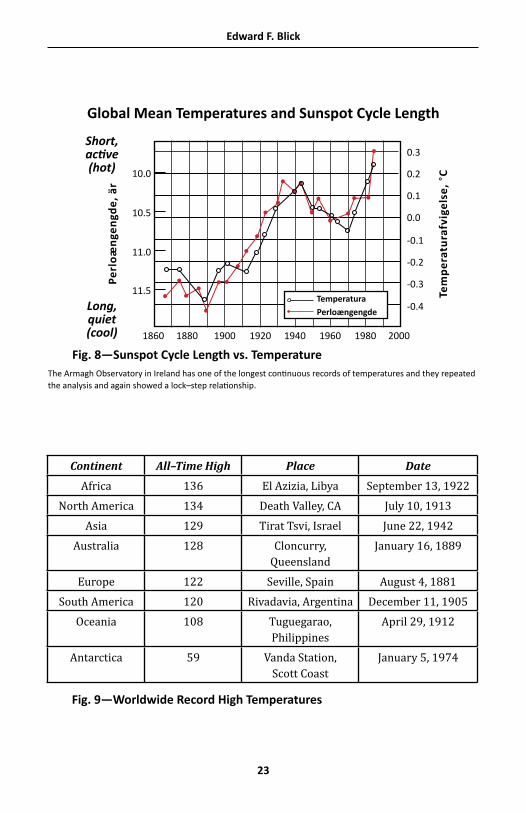
Figure 8—The long temperature record at Armagh, Ireland, shows a strong correlation of temperature with sunspot cycle length. The lon-ger the sunspot cycle, the colder the temperature. Presently we are in the last months of solar cycle 23 that is 12½ years long and Archibald (2008) predicts it will last to 13½ years. Solar weathermen here and in Russia are predicting globally 20–30 years of cold weather, after this solar cycle 23! (We’ve been cooling since 1998.)
Figure 9—High temperature records from all the Continents and Oceania indicate that all except one high temperature record occurred before 1943! This is bad news for the proponents of AGW.
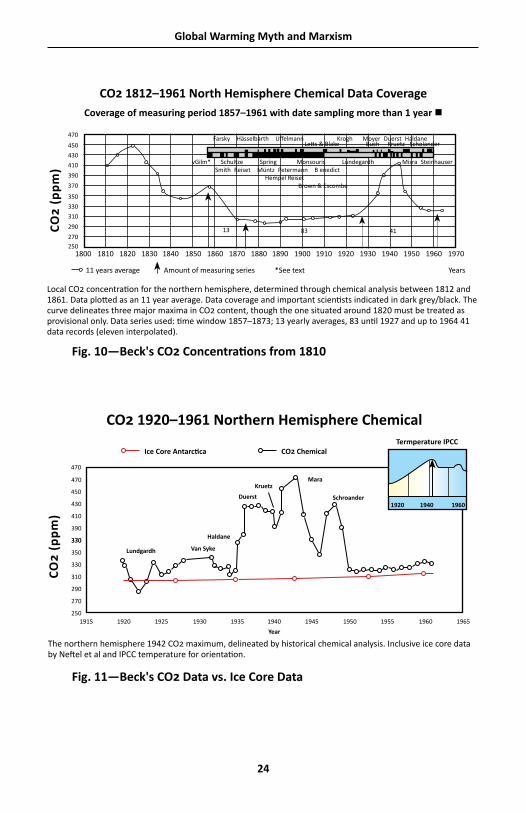
Figure 10—More bad news for the U.N. IPCC crowd . . . Ernst–Georg Beck’s 2007 paper tabulated 90,000 accurate chemical analysis of CO2 in air. These standard textbook measurements from 380 scientific papers
15
Edward F. Blick
had an accuracy of better than 3 percent. Several scientists who won the Nobel Prize made these measurements. Beck’s CO2 peaks (370–450 ppm) occurred around 1823, 1859, and 1944. Historically no one ever reported seeing SUVs or coal–fired electric generating plants during 1823–1859!
Figure 11—A comparison of Beck’s CO2 data versus Neftel’s ice core data show a wide difference. The IPCC dogma is a “hockey stick” curve showing that CO2 concentrations of 280 ppm existed from the beginning of the time to the late 1800s. Then man increased the atmo-spheric CO2 in the twentieth century due his burning of fossil fuels. Beck criticized Callendar and Keeling, the men who crafted the flat por-tion of the “hockey stick” CO2 chart. Beck essentially said that “cherry picking” was involved, in that any CO2 measurements were rejected if they did not fit the hypothesis of anthropogenic climate warming, the hypothesis being CO2 was 280 ppm for any time prior to late 1800s! Beck also stated that Callandar and Keeling only examined 10 percent of the available literature.
Zbigniew Jaworowski, M.D., Ph.D., D.SC. (2007) is a CO2 glaciolo-gist. He has studied glaciers all over the world. He has published many papers on climate, most of them concerning CO2 measurements in ice cores. He strongly believes the CO2 measurements used in the U.N. IPCC reports have been corrupted and are false.
He pointed out, “Drilling ice cores is a brutal system and a polluting procedure, drastically disturbing the ice samples.” He also states that ice cores cannot be regarded as a closed system and used to measure CO2 levels of air trapped in ice. He stated there are “more than 20 physical–chemical processes operating in situ . . . in the ice cores. . . . In cold water, CO2 is more than 70 times more soluble than nitrogen and more than 30 times more than oxygen.” Liquid water is commonly in present in the polar snow and ice even at the eutectic temperature of –73° C.” This phenomenon alone will reduce the percentage of CO2 in the air bubbles trapped in ice. The Knudsen effect, combined with
Global Warming Myth and Marxism
16
inward diffusion, depletes CO2 in ice cores exposed to drastic pressure changes (up to 300 bars, for ice buried in glaciers). The effects of in-creased solubility and extreme pressures could explain the difference between chemical CO2 and ice core measurements in Beck’s Figure 11.
Jaworowski noted that these effects were discovered “only recently, many years after the ice–based edifice of anthropogenic warming had reached a skyscraper height. . . .” Jaworowski noted how Neftel (1985), et. al., fraudulently combined the CO2 values of 328 ppm from ice de-posited in 1890 and combined it with 328 ppm CO2 values measured at Mauna Loa volcano, Hawaii, 83 years later. This fraudulent data curve was then published in the 2001 IPCC report, and is now part of the dogma of the AGW crowd. The real data, 83 years apart, makes it shockingly clear that pre–industrial levels of CO2 were the same as in the second half of the twentieth century. Because there is no difference in CO2 levels over 83 years apart, Jaworowski believes that “human beings may be responsible for less than 0.01° C of warming during the last century” and that AGW is a myth.
This book closes with the title of Jaworowski’s 2007 paper:
CO2: The Greatest Scandal of Our Time!
17
Edward F. Blick
References
Archibald, David (March 2008), “Solar Cycle 24: Implications for the United States”, [email protected]
Beck, Ernst–Georg, “180 years of atmospheric CO2, Gas Analysis by Chemical Methods” Energy & Environment, Vol. 18, No. 2, 2007
Callendar, G. P. “On the amount of carbon dioxide in the atmosphere,” Tellus 10: 243 48 1958
Endersbee, L. “Global Climate Change has Natural Causes,” Science, March 7, 2008
Idso, Sherwood B. “CO2–Induced Global Warming: A skeptics View of Potential Climate Change”, Climate Research, Vol. 10: 69–82, 1998
Jaworowski, Z., “CO2: The Greatest Scientific Scandal of Our time” Sci-ence, March 16, 2007
Jaworowski, Z., Segalstad, T. V. and Hisdal, V.; Atmospheric CO2 and Global Warming: a Critical Review, 2nd revised edition, Norsk Polar-institutt, Meddelelser [Norwegian Polar Institute memoirs] 119, 76 pp. (1992 a)
Jaworowski, Z., Segalstad, T. V. and Ono, N. “O glaciers tell a true atmo-spheric CO2 story”? Science of the Total Environment, 114 227–284 (1992 b)
Keeling C. D., From, E., “Reassessment of late 19th century atmospheric CO2 variations,” Tellus, 38B 87 105, 1986
Kiehl and Trenberth, “Earth’s Annual Global Mean Energy Budget” Bull. Amer. Meteor. Soc., 78, 197–208 1997
Neftel A., et.al., “Evidence from polar ice cores for the increase in atmo-spheric CO2 in the past two centuries,” Nature, Vol. 315, pp. 45–47
Revell, R. and Suess, H., “Carbon dioxide exchange between atmosphere and ocean and the question of an increase of atmospheric CO2 during past decades,” Tellus, 9, 18–27
Segalstad, T. V., “The Distribution of CO2 between Atmosphere, Hydro-sphere, and Lithosphere; Minimal Influence from Anthropogenic
Global Warming Myth and Marxism
18
CO2 on the Global ‘Greenhouse Effect,’” 1995, printed in The Global Warming Debate, European Science & Environmental Forum, 1996
Segalstad, T. V., “Carbon Cycle modeling & Residence time of Natural & Anthropogenic Atmospheric CO2; on the Construction of the ‘Greenhouse Effect Global Warming Dogma,’” 1998, printed in Global Warming: The Continuing Debate, ESEF, 1998
Segalstad, T. V., “What is CO2—friend or foe?” invited lecture KTH Inter-national Climate Seminar, Stockholm, September 11, 2006
Soon and Baliunas, “Proxy climatic and environmental changes in the past 1000 years,” Climate Research, 23, 89–100, 2003
Van de Plassche and van der Borg, “Sea Level–climate correlation dur-ing the past 1400 yr.,” Free university Amsterdam & Utrecht Univ., http://www.fys.ruu.nl/–adejong/radiocarbondating/Sea-level-climate_correlation.htm.
19
Edward F. Blick
Figures
Solar IrradianceData Source: http://www1.ncdc.noaa.gov/pub/data/paleo/climate_forcing/solar_variability/lean2000/irradiance.txt
Fig. 2—Total Solar Irradiance 1611 to 2001
1611
Wm
-2
1711
1661
1761
1621
1721
1671
1771
1631
1731
1681
1781
1641
1741
1691
1791
1651
1751
1701
1801
1811
1821
1841
1851
1861
1871
1881
1891
1901
1911
1921
1931
1941
1951
1961
1971
1981
1991
2001
1831
1367
1366
1365.5
1365
1364.5
1364
1363.5
1363
1366.5
All–Time Record Highs by State
Fig. 1—State Record Temperature by Decades
0
5
10
15
20
25
30
1880
s
1890
s
1900
s
1910
s
1920
s
1930
s
1940
s
1950
s
1960
s
1970
s
1980
s
1990
s
2000
s
None None None
Global Warming Myth and Marxism
20
Medieval Warm Period—Little Ice Age
Fig. 3
-3.0
900 1350 1900
-2.0
-1.0
0.0
1.0
2.0
3.0
Tem
pera
ture
Cha
nge
DarkAges
Modern Warm Period
Medieval Warm Period Little Ice Age
Fig. 4—Dependence of CO2 on Sea Surface Temperature
CO2Mauna Loa
ppm
12 monthmovingaverage
Experience Curve of Dependence of Atmospheric Carbon Dioxideon Global Average Sea Surface Temperatures
Global Average Sea Surface Temperature Anomaly Deg C(21 year moving average)
390
385
380
375
370
365
360
355
350
345
340
Feb. 2008
Jan. 1985
0 0.05 0.1 0.15 0.2 0.25 0.3 0.35 0.4
Lance Endersbee1 May 2008
Chart shows moving average levels of carbon dioxide from Jan. 1985 to Jan. 2008
versusthe 21 year moving average of monthly values
of global sea surface temperature anomaly.
The curve is just the sequence of actual plot-ted points.Note the high level of correlation with the linear trendline.The linear relation is valid as the temperature range is only 0.3 degrees.
Linear Trendliney = 143.4x ÷ 334.1
R2 = 0.995
21
Edward F. Blick
1,000 Years of CO2 and Temperature Change
Temperate Change
Fig. 5—BIG LIE!
-0.2
-0.4
-0.4
1000 1100 1200 1300 1400 1500 1600 1700 1800 20001900
0
0.2
0.4
0.6
0.8
1
Tem
pera
ture
Cha
nge
°F
HadCRUT Global Temperature Anomaly1988—2008
Fig. 3—Biggest Temperature Drop in One Year?
0.8
0.7
0.6
0.5
0.4
0.2
0.1
0
0 25 75 100 125 150 175 200 225 25050
-0.1
-0.2
0.3
Tem
pera
ture
C°
Months
1988
1998
Jan 07.632° C
ΔT=0.595° C
Jan 08.037° C
Global Warming Myth and Marxism
22
Annual CO2 versus USHCN V2 Temps56
55
54
53
52
51
50
1895
1900
1905
1910
1915
1920
1925
1930
1935
1940
1945
1950
1955
1960
1965
1970
1975
1980
1985
1990
1995
2000
2005
390
380
370
360
350
340
330
320
310
300
290
USHCN V2 Temps 5 Year Average CO2
Post War Boom
Correlation + Correlation - Correlation +
Fig. 7—Does CO2 Correlate with Air Temperature?
MSU and Hadley Monthly Temps vs Mauna Loa CO2 UAHMSU Hadley Mauna Loa CO2 Linear (UAHMSU) Linear (Hadley)
0.8
0.6
0.4
0.2
0
-0.2
-0.4
Tem
per
atu
re A
no
mal
ies
CO2
Seas
on
ally
Ad
just
ed390
385
380
375
370
365
2002
2003
2004
2005
2006
2007
2008
Negative correlation since 2002R = 0.44 with Hadley, -0.30 with MSU
23
Edward F. Blick
Global Mean Temperatures and Sunspot Cycle Length
Short,active(hot)
Long,quiet(cool)
Perl
oæ
nge
ngd
e, ä
r
Tem
per
atu
rafv
igel
se, °
C10.0
0.3
1860 1880 1900 1920 1940 1960 1980 2000
0.2
0.1
0.0
-0.1
-0.2
-0.3
-0.4
10.5
11.0
11.5
Fig. 8—Sunspot Cycle Length vs. TemperatureThe Armagh Observatory in Ireland has one of the longest continuous records of temperatures and they repeated the analysis and again showed a lock–step relationship.
TemperaturaPerloængengde
Fig. 9—Worldwide Record High Temperatures
Continent All–Time High Place Date
Africa 136 El Azizia, Libya September 13, 1922North America 134 Death Valley, CA July 10, 1913
Asia 129 Tirat Tsvi, Israel June 22, 1942Australia 128 Cloncurry,
QueenslandJanuary 16, 1889
Europe 122 Seville, Spain August 4, 1881South America 120 Rivadavia, Argentina December 11, 1905
Oceania 108 Tuguegarao, Philippines
April 29, 1912
Antarctica 59 Vanda Station,Scott Coast
January 5, 1974
Global Warming Myth and Marxism
24
CO2 1920–1961 Northern Hemisphere Chemical
CO2 1812–1961 North Hemisphere Chemical Data CoverageCoverage of measuring period 1857–1961 with date sampling more than 1 year
470
450
430
410
390
370
350
330
310
290
270250
13 83CO2
(pp
m)
1800 1810 1820 1830 1840 1850 1860 1870 1880 1890 1900 1910 1920 1930 1940 1950 1960 1970
Farsky Hässelbarth Uffelmann Krogh Moyer Duerst Haldane Letts & Blake Buch Kruetz Scholander
vGilm* Schultze Spring Monsouris Lundegardh Misra Steinhauser Smith Reiset Müntz Petermann B enedict Hempel Reiset Brown & Escombe
11 years average Amount of measuring series *See text Years
41
Local CO2 concentration for the northern hemisphere, determined through chemical analysis between 1812 and 1861. Data plotted as an 11 year average. Data coverage and important scientists indicated in dark grey/black. The curve delineates three major maxima in CO2 content, though the one situated around 1820 must be treated as provisional only. Data series used: time window 1857–1873; 13 yearly averages, 83 until 1927 and up to 1964 41 data records (eleven interpolated).
Fig. 10—Beck's CO2 Concentrations from 1810
CO2
(pp
m)
470
470
450
430
410
390
370
350
330
330
310
290
270
2501915 1920 1930 1940
Year
Ice Core Antarctica
Lundgardh
CO2 ChemicalTermperature IPCC
1950 19601925 1935 1945 1955 1965
Van Syke
Haldane
Duerst
KruetzMara
Schroander1940 19601920
The northern hemisphere 1942 CO2 maximum, delineated by historical chemical analysis. Inclusive ice core data by Neftel et al and IPCC temperature for orientation.
Fig. 11—Beck's CO2 Data vs. Ice Core Data