global warming and extreme weather - environment america · global warming and extreme weather the...
TRANSCRIPT
Hurricanes SnowstormsTropical Storms DroughtWildfire Coastal StormsFlooding Heat Waves
Extreme Rainfall WildfireHurricanes SnowstormsFire Drought Hurricanes
Global Warming and Extreme Weather
The Science, the Forecast, and the Impacts on America
Global Warming and Extreme Weather The Science, the Forecast,
and the Impacts on America
Environment America Research & Policy Center
Tony Dutzik, Frontier Group
Nathan Willcox, Environment America
Research & Policy Center
September 2010
Acknowledgments
Environment America Research & Policy Center thanks Kevin Trenberth, head of the Climate Analysis Section at the National Center for Atmospheric Research; Amanda Staudt, climate scientist with the National Wildlife Federation; Paul Epstein, associate director of the Center for Health and the Global Environment at Harvard Medical School; and Brenda Ekwurzel, assistant director of climate research and analysis for the Climate and Energy Program of the Union of Concerned Scientists for their review of drafts of this document, as well as their insights and suggestions. Thanks also to Clair Embry and Kurt Walters for their research assistance and Susan Rakov and Travis Madsen of Frontier Group for their editorial assistance.
The authors express sincere gratitude to the many scientists and researchers working to help society understand the causes and likely impacts of global warming.
Environment America Research & Policy Center thanks the Energy Foundation, Oak Founda-tion and New York Community Trust for making this report possible.
The authors bear responsibility for any factual errors. The recommendations are those of Environment America Research & Policy Center. The views expressed in this report are those of the authors and do not necessarily reflect the views of our funders or those who provided review.
© 2010 Environment America Research & Policy Center
Environment America Research & Policy Center is a 501(c)(3) organization. We are dedicated to protecting America’s air, water and open spaces. We investigate problems, craft solutions, educate the public and decision makers, and help Americans make their voices heard in local, state and national debates over the quality of our environment and our lives. For more infor-mation about Environment America Research & Policy Center or for additional copies of this report, please visit www.environmentamerica.org/center.
Frontier Group conducts independent research and policy analysis to support a cleaner, healthier and more democratic society. Our mission is to inject accurate information and compelling ideas into public policy debates at the local, state and federal levels. For more information about Frontier Group, please visit www.frontiergroup.org.
Cover: bocky, Shutterstock.com Design and layout: Harriet Eckstein Graphic Design
Table of Contents
Executive Summary 1
Introduction 6
Global Warming: The Scientific Consensus 8America’s Changing Climate 9
Extreme Weather and Why it Matters 11What Is Extreme Weather? 11Why Care About Extreme Weather? 12
Extreme Weather: The Trends, The Impacts, and Predictions for the Future 14Hurricanes and Tropical Storms 14Coastal Storms and Sea Level Rise 18Flooding and Extreme Rainfall 24Snowstorms 30Drought, Wildfire and Heat Waves 32
Conclusions and Recommendations 38
Notes 40

Executive Summary 1
Executive Summary
Patterns of extreme weather are chang-ing in the United States, and climate science predicts that further changes
are in store. Extreme weather events lead to billions of dollars in economic damage and loss of life each year. Scientists project that global warming could affect the frequency, timing, location and severity of many types of extreme weather events in the decades to come.
Over the last five years, science has continued to make progress in exploring the connections between global warm-ing and extreme weather. Meanwhile, the United States has experienced a string of extreme events—including massive floods in the Midwest, Tennessee and Northeast, intense hurricanes in Florida and along the Gulf Coast, drought and wildfire in the Southeast and Southwest—that serve as a reminder of the damage that extreme weather can cause to people, the economy and the environment.
This report reviews recent trends in several types of extreme weather, the im-pacts caused by notable events that have occurred since 2005, and the most recent scientific projections of future changes in extreme weather.
To protect the nation from the damage to property and ecosystems that results from changes in extreme weather pat-terns—as well as other consequences of global warming—the United States must move quickly to reduce emissions of global warming pollutants.
The worldwide scientific consensus that the earth is warming and that hu-man activities are largely responsible has solidified in recent years.
• A recent report published by the U.S. National Academy of Sciences stated that “the conclusion that the Earth sys-tem is warming and that much of this warming is very likely due to human activities” is “so thoroughly examined and tested, and supported by so many independent observations and results,” that its “likelihood of subsequently being found to be wrong is vanishingly small.”
• The national academies of sciences of 13 leading nations issued a joint statement in 2009 stating that “climate change is happening even faster than previously estimated.”
2 Global Warming and Extreme Weather
• A 2009 study of the work of more than 1,300 climate researchers actively publishing in the field found that 97 to 98 percent of those researchers agree with the central theories behind global warming.
The consequences of global warming are already beginning to be experienced in the United States, and are likely to grow in the years to come, particularly if emissions of global warming pollut-ants continue unabated.
• Average temperature in the United States has increased by more than 2° Fahrenheit over the last 50 years. Temperatures are projected to rise by as much as an additional 7° F to 11° F on average by the end of the century, should emissions of global warming pollutants continue to increase.
• The United States has experienced an increase in heavy precipitation events, with the amount of precipitation falling in the top 1 percent of rainfall events increasing by 20 percent over the course of the 20th century. The trend toward extreme precipitation is projected to continue, even as higher temperatures and drier summers in-crease the risk of drought in much of the country.
• Snow cover has decreased over the past three decades in the Northern Hemisphere, and the volume of spring snowpack in the Mountain West and Pacific Northwest has declined signifi-cantly since the mid-20th century.
• Sea level has risen by nearly 8 inches globally since 1870. Global sea level is currently projected to rise by as much as 2.5 to 6.25 feet by the end of the century if global warming
pollution continues unabated. Parts of the northeastern United States could experience an additional 8 inches of sea-level rise due to changes in ocean circulation patterns.
Several types of extreme weather events have occurred more frequently or with greater intensity in recent years. Global warming may drive changes in the frequency, timing, location or sever-ity of such events in the future.
Hurricanes
• The strongest tropical cyclones have been getting stronger around the globe over the last several decades, with a documented increase in the number of severe Category 4 and 5 hurricanes in the Atlantic Ocean since 1980. (See page 14.)
• Scientists project that global warming may bring fewer—but more intense—hurricanes worldwide, and that those hurricanes will bring in-creased precipitation. The number of intense Category 4 and 5 hurricanes in the Atlantic may nearly double over the course of the next century. (See page 16.)
• Estimated total damages from the seven most costly hurricanes to strike the United States since the beginning of 2005 exceed $200 billion. (See page 16.) That includes damages from Hurricane Katrina, which was not only the most costly weather-related disaster of all time in the United States, but which also caused major changes to important ecosystems, includ-ing massive loss of land on barrier islands along the Gulf Coast. (See pages 12-13.)
Executive Summary 3
Sea Level Rise and Coastal Storms
• Sea level at many locations along the East Coast has been rising at a rate of nearly 1 foot per century due to the expansion of sea water as it has warmed and due to the melting of glaciers. Relative sea level has risen faster along the Gulf Coast, where land has been subsiding, and less along the northern Pacific Coast.
• In addition to sea-level rise, wave heights have been rising along the northern Pacific coast in recent years, possibly indicating an increase in the intensity of Pacific winter storms. In the 1990s, scientists estimated that the height of a “100-year wave” (one ex-pected to occur every 100 years) off the coast of the Pacific Northwest was ap-proximately 33 feet; now it is estimated to be 46 feet. (See page 20.)
• Projected future sea-level rise of 2.5 to 6.25 feet by the end of the century would put more of the nation’s coast-line at risk of erosion or inundation by even today’s typical coastal storms.
oIn the mid-Atlantic region alone, between 900,000 and 3.4 million people live in areas that would be threatened by a 3.3 foot (1 meter) rise in sea level. (See page 18.)
oAlong the Gulf Coast from Galves-ton, Texas, to Mobile, Alabama, more than half the highways, nearly all the rail miles, 29 airports and almost all existing port infra-structure are at risk of flooding in the future due to higher seas and storm surges.
oHad New York City experienced a 20-inch (0.5 meter) rise in sea level over the 1997 to 2007 period (at
the low end of current projections for sea level rise by the end of the century), the number of moderate coastal flooding events would have increased from zero to 136—the equivalent of a coastal flood warn-ing every other week.
Rainfall, Floods and Extreme Snow-storms
• The number of heavy precipitation events in the United States increased by 24 percent between 1948 and 2006, with the greatest increases in New England and the Midwest. In much of the eastern part of the country, a storm so intense that once it would have been expected to occur every 50 years can now be expected to occur every 40 years. (See page 25.)
• The largest increases in heavy rainfall events in the United States are pro-jected to occur in the Northeast and Midwest. The timing of overall pre-cipitation is also projected to change, with increases in precipitation during the winter and spring in much of the north, but drier summers across most of the country. (See page 26.)
• Global warming is projected to bring more frequent intense precipitation events, since warmer air is capable of holding more water vapor. Changing precipitation patterns could lead to increased risk of floods. What is now a 100-year flood in the Columbia River basin could occur once every three years by the end of the 21st century under an extreme global warming sce-nario, due to the combination of wet-ter winters and accelerated snowmelt. This change is projected to occur even as the region experiences an increase in summer drought due to reduced summer precipitation and declining
4 Global Warming and Extreme Weather
availability of snowmelt in the sum-mer. (See page 27.)
• Flooding is the most common weather-related disaster in the United States. Recent years have seen a string of incredibly destructive floods, in-cluding the 2008 Midwest flood that inundated Cedar Rapids, Iowa, and caused an estimated $8 to $10 bil-lion in damage, and the massive 2010 floods in New England and Tennes-see. (See pages 28 and 29.)
• Projections of more frequent heavy precipitation apply to both rain and snow storms (although warming will bring a shift in precipitation from snow to rain over time). The 2010 record snowfalls in the mid-Atlantic region (dubbed “Snowmageddon”) are fully consistent with projections of increased extreme precipitation in a warming world—and with the string of massive flooding events elsewhere in the coun-try during 2010. (See page 30.)
Heat Waves, Drought and Wildfires
• Over the past century, drought has become more common in parts of the northern Rockies, the Southwest and the Southeast. Periods of extreme heat have also become more common since 1960. (See page 32.)
• Large wildfires have become more fre-quent in the American West since the mid-1980s, with the greatest increases in large wildfires coming in the north-ern Rockies and northern California.
• Heat waves are projected to be more frequent, more intense, and last longer in a warming world. Much of the Unit-ed States—especially the Southwest—is projected to experience more frequent or more severe drought. (See page 34.)
• Scientists project that a warmer climate could lead to a 54 percent increase in the average area burned by western wildfires annually, with the greatest increases in the Pacific Northwest and Rocky Mountains. (See page 35.)
• Heat waves are among the most lethal of extreme weather events. A 2006 heat wave that affected the entire con-tiguous United States was blamed for at least 147 deaths in California and another 140 deaths in New York City. (See page 36.)
• Wildfire is capable of causing great damage to property, while the cost of fighting wildfires is a significant drain on public resources. In 2008, Cali-fornia spent $200 million in a single month fighting a series of wildfires in the northern part of the state. (See page 36.)
Avoiding the potential increased risks from extreme weather events—and their costs to the economy and society—is among the reasons the United States and the world should reduce emissions of global warming pollution.
• The United States and the world should adopt measures designed to prevent an increase in global average temperatures of more than 2° C (3.6° F) above pre-industrial levels—a com-mitment that would enable the world to avoid the most damaging impacts of global warming.
• The United States should commit to emission reductions equivalent to a 35 percent reduction in global warming pollution from 2005 levels by 2020 and an 83 percent reduction by 2050, with the majority of near-term
Executive Summary �
emission reductions coming from the U.S. economy. A variety of policy measures can be used to achieve this goal, including:
oA cap-and-trade system that puts a price on emissions of global warm-ing pollutants.
oA renewable energy standard to promote the use of clean renewable energy.
oA strong energy efficiency resource standard for utilities that maximiz-es the use of cost-effective energy efficiency improvements.
oEnhanced energy efficiency stan-dards for appliances and vehicles and stronger energy codes for new or renovated commercial and resi-dential buildings.
oInvestments in low-carbon trans-portation infrastructure—includ-ing transit and passenger rail—and
support for a transition to plug-in and other alternative fuel vehicles.
oRetention of the EPA’s author-ity to require reductions in global warming pollution at power plants, as well as retention of state author-ity to go beyond federal minimum standards in reducing global warm-ing pollution.
• State and local governments should adopt similar measures to reduce glob-al warming pollution and encourage a transition to clean energy.
• In addition, federal, state and local officials should take steps to better protect the public from the impact of extreme weather events. Government officials should explicitly factor the potential for global warming-induced changes in extreme weather patterns into the design of public infrastruc-ture and revise policies that encourage construction in areas likely to be at risk of flooding in a warming climate.
6 Global Warming and Extreme Weather
On August 29, 2005, Hurricane Ka-trina made landfall along the Gulf Coast. Katrina was the most expen-
sive natural disaster in U.S. history and one of the most deadly. Its landfall—especially in the context of a 2005 season that shat-tered all previous records for hurricane fre-quency, intensity and damage—launched a vigorous discussion among the public and in the media about the role global warming may play in extreme weather trends.
That discussion is renewed—often heatedly—virtually every time an extreme weather event occurs in the United States, whether it is an unprecedented string of snowstorms in the nation’s capital, massive flooding in Nashville, Tennessee, or a sea-son of rampant wildfires in California.
Five years after Hurricane Katrina, it is worthwhile to take a step back and review what we know about the connec-tion between global warming and extreme weather and why it matters.
The first thing we know is that the world’s climate has changed. The evidence is now “unequivocal” that air and ocean temperatures have increased globally, snow and ice cover has decreased, and global average sea level has risen.1
We also know from the world’s lead-ing scientific authorities that much of the warming that has occurred is very likely the result of human activities, especially the release of global warming pollution.
We know that the climate has not just changed on average, but also that there have been changes at the extremes—such as an increase in the frequency of extremely hot days and heavy precipitation events worldwide.2 We also understand, with a high degree of confidence, why some of these changes in extremes are occurring. We know, for example, that warmer air is capable of holding more water vapor, and that water vapor content in the atmosphere has in fact increased over time—and that these changes would be expected to lead to an increase in heavy precipitation events.
For other types of extreme weather—es-pecially rare or complex events that are caused or made more severe by the conflu-ence of several weather phenomena—dis-cerning long-term trends and attributing causes is much more difficult. Yet, the re-cent increase in the severity and frequency of some of these events is troubling. To be concerned that the apparent changes in some extreme events may have something
Introduction
Introduction �
to do with the broader changes humans have made in the climate is not “hyste-ria”—it is simple common sense.
Ultimately, however, we may never know if global warming is the “cause” of trends such as the recent uptick in extreme hurricanes or severe Western wildfires. That is because every weather event now reflects both natural variability and hu-man-induced climate change.
It is important for us to know, as a soci-ety, how the changes that have taken place in the climate are likely to affect patterns of extreme weather and how these events will change in the future. Many critical decisions—which crops to plant, where to build homes, how to manage and preserve ecosystems—depend on that knowledge, some of them with life-or-death conse-quences.
When it comes to predicting the future, science again gives us good tools to un-derstand the broad changes in the climate that will occur if global warming pollu-tion continues unabated. It is very likely that the world will continue to warm, and the degree of warming will exceed that which has already taken place.3 Future changes are also likely to take place at the extremes—extremely hot days, heat waves, and heavy precipitation events can all be expected to become more frequent globally in a warming world.4
Complex weather events are, again, harder to predict—as is the exact degree to which the world will warm for a given level of global warming pollution in the atmosphere—but scientists continue to make remarkable strides in this direction.
All of the above—the knowledge that the climate has changed, the strength of the scientific evidence predicting con-tinued warming if emissions continue
unabated, the understanding that climate will change not only on average but also at the extremes, and the scientific evidence on the links between global warming and specific extreme weather events—is reason for alarm.
Avoiding increases in the frequency or severity of extreme weather events is not the only reason to take action against global warming. But it is an extremely good one. America’s ecosystems and built envi-ronment are designed for a particular cli-mate—including the expected boundaries of extreme events. That climate has already changed and will change further. But the degree of change that could occur if global warming pollution continues unabated could outstrip the ability of human and natural systems to react and adapt—with massive consequences to life, property, critical ecosystems and our economy.
Coming to grips with what those changes might mean—both in the up-coming decades and for the lives of future generations—is difficult. As anyone who has lived through, or volunteered in the wake of a natural disaster can attest, the impacts transcend any measure of dollars and cents.
The profiles of extreme weather events included in this report—all of which have occurred since 2005—are intended to illus-trate the impacts of major extreme weather events. Their inclusion in this report is not an assertion that these events were “caused by global warming.” Rather, these stories are intended to remind us—just as Hurricane Katrina did in 2005—that the potential for damage from extreme weather is worth avoiding. One important way to protect our future is by swiftly reducing emissions of pollutants that are changing our climate.
8 Global Warming and Extreme Weather
In 2007, the Intergovernmental Panel on Climate Change (IPCC)—the world’s foremost scientific authority on the
subject—completed its fourth assessment of the science of global warming. The report, which reflected the work of thou-sands of scientists worldwide, concluded that “warming of the climate system is un-equivocal” and that “[m]ost of the observed increase in global average temperatures since the mid-20th century is very likely due to the observed increase in anthropogenic [greenhouse gas] concentrations.”5
In the years since publication of the Fourth Assessment Report, the consen-sus surrounding the basic science behind global warming has further crystallized. The world’s leading scientific authorities have concluded that the planet is warming and emissions of global warming pollutants are very likely to blame.
A recent report published by the U.S. National Academy of Sciences concluded:
Some scientific conclusions or theo-ries have been so thoroughly exam-ined and tested, and supported by so many independent observations and results, that their likelihood of
subsequently being found to be wrong is vanishingly small. Such conclusions and theories are then regarded as settled facts. This is the case for the conclusion that the Earth system is warming and that much of this warming is very likely due to hu-man activities.6 (emphasis added)
Similarly, 13 national academies of sci-ences from around the world produced a joint statement in 2009 concluding:
[C]limate change is happening even faster than previously estimated; global CO2 emissions since 2000 have been higher than even the highest predictions, Arctic sea ice has been melting at rates much faster than predicted, and the rise in sea level has become more rapid. … The need for urgent action to address climate change is now indisputable.7 (empha-sis added)
The scientific consensus behind global warming is underscored by a recent study of more than 1,300 climate researchers ac-tively publishing in the field, which found
Global Warming: The Scientific Consensus
Global Warming: The Scientific Consensus 9
that 97 to 98 percent of those researchers agree with the central theories behind global warming as laid out by the Inter-governmental Panel on Climate Change.8
There remain many unanswered ques-tions about the specific impacts of global warming, but in the world’s most respected scientific institutions, the issues of whether global warming is occurring, and whether human activities are playing a role, are largely settled. Global warming is already changing America’s climate, and will lead to even greater changes in the decades to come—particularly if human-caused emissions of global warming pollutants continue unchecked.
America’s Changing Climate Global warming will bring major changes to America’s climate over the coming decades. Some of those changes have al-ready begun to occur and are projected to accelerate if emissions of global warming pollutants continue unabated.
• Temperature: Average temperature in the United States has increased by more than 2° F over the last 50 years.9 Temperatures are expected to rise by as much as an additional 7° F to 11° F on average by the end of this century under a high-emission scenario.10 Heat waves have become more common and more intense in recent years.11
The heat content of the ocean has also increased since the mid-20th century.12 Sea surface temperatures in the Gulf of Mexico and Atlantic Ocean have in-creased over the last 100 years during the July to September period, when many hurricanes form.13
• Precipitation: Precipitation has increased on average in the United
States over the last 50 years. However, the increase in precipitation has not been uniform around the country, with the Northeast and upper Mid-west receiving more precipitation on average since the late 1950s and the Southeast and parts of the Southwest receiving less.14 In addition, a greater share of precipitation is falling in heavy rainstorms and snowstorms, and there have been shifts in the seasonal distribution of precipitation. Scientists project that global warming will result in an increase in the share of precipi-tation that comes in heavy events and will cause important seasonal shifts. Virtually the entire United States, for example, may experience drier summers by the end of the century if global warming pollution continues to increase unabated.15
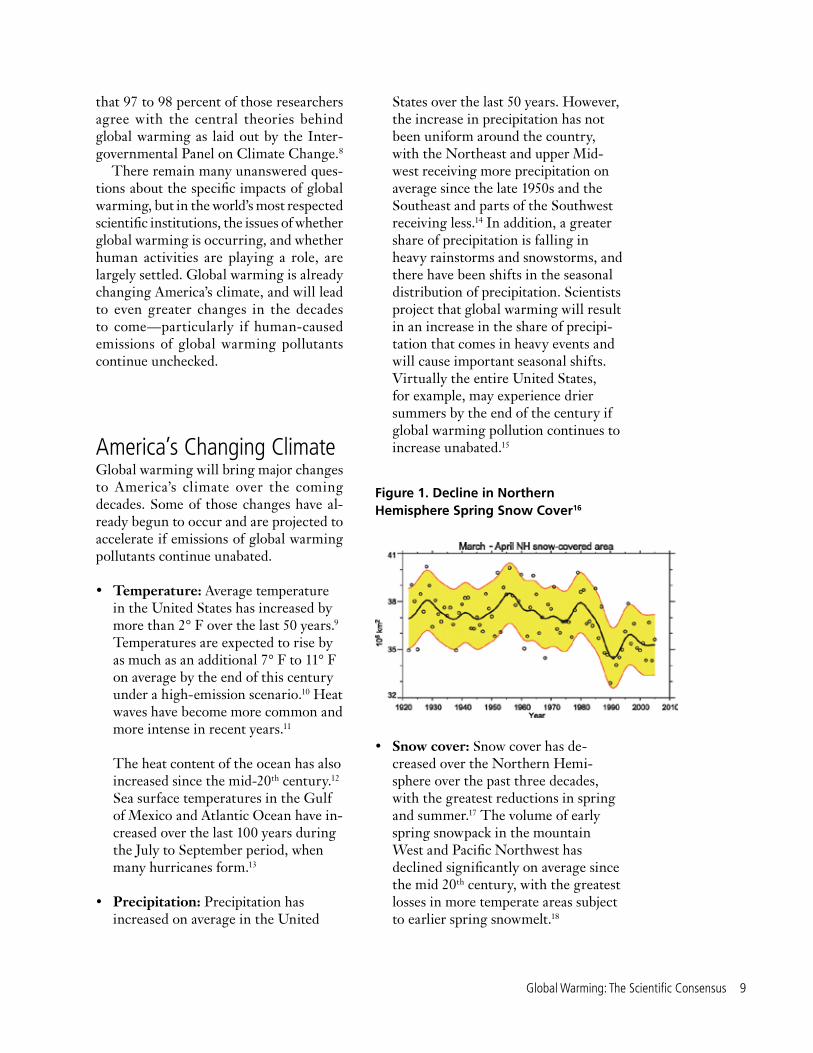
Figure 1. Decline in Northern Hemisphere Spring Snow Cover16
• Snow cover: Snow cover has de-creased over the Northern Hemi-sphere over the past three decades, with the greatest reductions in spring and summer.17 The volume of early spring snowpack in the mountain West and Pacific Northwest has declined significantly on average since the mid 20th century, with the greatest losses in more temperate areas subject to earlier spring snowmelt.18
10 Global Warming and Extreme Weather
• Sea level rise: Sea level has risen by nearly 8 inches (20 cm) globally since 1870, with the rate of sea level rise increasing in recent years. Sea level rise is occurring both because of the thermal expansion of sea water as it warms and by the melting of glaciers and ice caps.19 Relative sea level has risen along U.S. shorelines (with ex-ceptions in parts of the Pacific North-west and Alaska) since early in the 20th century, with the greatest relative rise in the mid-Atlantic and Gulf Coast regions. (See page 19.) A recent study suggests that global sea level could rise by an average of between 2.5 and 6.25 feet (0.75 and 1.9 meters) by the end of the century, depending on future trends in global warming pollution.20 Changes in ocean circulation patterns could result in some areas—such as the northeastern U.S. coastline—
experiencing greater increases in sea level than the global average. (See page 22.)
• Shifts in species and ecosystems: Global warming has already had significant effects on ecosystems, with shifts in the timing of spring events, the observed migration of plant and animal species northward and to higher elevations, and the spread of infestations by insect pests and inva-sive species.21
In addition to these changes, climate sci-ence projects that there will be changes in the timing, frequency, severity and impacts of “extreme weather” events, both in the United States and worldwide.
Extreme Weather and Why it Matters 11
What Is Extreme Weather?“Extreme weather” is a term potentially fraught with ambiguity. According to the Intergovernmental Panel on Climate Change:
An extreme weather event is an event that is rare at a particular place and time of year. Definitions of rare vary, but an extreme weather event would normally be as rare as or rarer than the 10th or 90th percentile of the observed probability density function. By definition, the char-acteristics of what is called extreme weather may vary from place to place in an absolute sense.22
The IPCC definition reinforces that “extreme” is a relative term, one that only has meaning when compared with a par-ticular historical record (or other reference point) at a particular place. For instance, a storm that brought 12 inches of snow in a 24-hour period would hardly be extreme today in Buffalo, New York, but it would be highly unusual in Washington, D.C.
However, it is important to remember
that extremes in meteorological mea-surements—temperature, rainfall, wind speed—are mainly meaningful because of the impact they have on people and the environment. Changes brought about by global warming, as well as decisions made by humans, can make humans and eco-systems more vulnerable to the impacts of even “routine” weather events. Sea level rise, for example, magnifies the danger of damage to property, human life, and the environment of both “extreme” storms and storms that would be considered “normal” today.
In addition, there is a blurry line between what the IPCC calls extreme “weather” events, which are of short dura-tion, and extreme “climate” events, which take place over a longer period of time (for example, droughts or extremely rainy seasons).23 If an area that has experienced months of above-normal rainfall receives a sudden downpour that triggers a flood, or an area locked in a dry spell experiences a severe thunderstorm that sparks a fire, is the resulting disaster attributable to a “climate” event or a “weather” event?
In this report, we will use the term “ex-treme weather” broadly to describe weather
Extreme Weather and Why it Matters
12 Global Warming and Extreme Weather
events that would be considered rare when compared to the modern historical record, events that create extreme impacts on hu-mans or the environment (particularly if those impacts are likely to be exacerbated by global warming), as well as longer-term events that might otherwise be described as extreme climate events.
Why Care About Extreme Weather?Changes in the frequency and severity of extreme weather events are among many projected impacts of global warming. Extreme weather events tend to attract great notice by the public and the media, leading television news coverage and grabbing headlines. But other impacts of global warming that occur slowly over a long period of time, or are less amenable to media coverage, may also cause tremendous damage to human health and well-being or to treasured ecosystems.
Extreme weather events, however, are vitally important. By definition, extreme weather tests the boundaries of human-built and natural systems. Extreme weather events are capable of inflicting massive damage on human life, the economy, and the environment in a variety of ways:
• Property and crop damage: Count-less private and public investment decisions—from the location of roads and buildings to the design of bridges and flood control systems—are made based on assumptions about the prob-ability and likely maximum severity of extreme weather events. When extreme weather events defy those expectations, massive damage to property can result. According to the National Oceanic and Atmospheric Administration, insured property
losses from weather-related disasters in the United States in 2008 totaled more than $30 billion.24 Because many losses are not covered by insurance, the total cost of damages from natu-ral catastrophes is likely to be much higher.
• Death and injury: Improvements in weather forecasting and communica-tions now enable early warning of many extreme weather events, giving many vulnerable people the opportu-nity to escape from harm’s way. Even with these advances, however, extreme weather events cause significant loss of life in the United States each year. In 2008, for example, weather-related events killed 568 Americans and in-jured more than 2,000 people.25
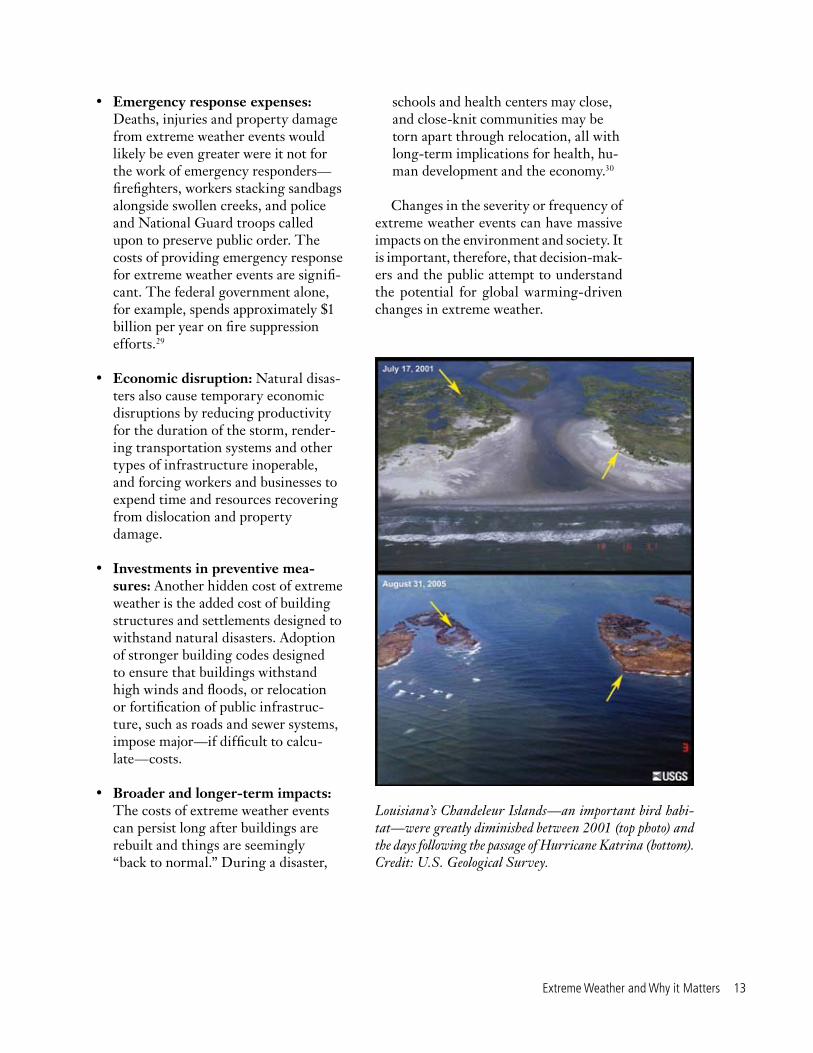
• Permanent changes to ecosys-tems: Extreme weather events can also result in permanent changes to ecosystems. The storm surge created by Hurricane Katrina, for example, permanently converted 118 square miles of wetlands and dry land along the Gulf Coast to open water, remov-ing an important protection for the Louisiana coast.26 The Chandeleur Islands off the Louisiana coast—part of the nation’s second-oldest national wildlife refuge and an important bird habitat—lost 84 percent of their land area following Hurricane Katrina.27 Similarly, persistent drought, unusual-ly hot temperatures, and pest infesta-tion in the southwestern United States have led to the widespread die-off of piñon pine trees—an event described by National Geographic News in 2005 as “arguably the most extensive die-off of trees ever documented by modern sci-ence.”28 The economic costs of these changes wrought by extreme weather events are rarely tabulated or included in estimates of storm damage.
Extreme Weather and Why it Matters 13
• Emergency response expenses: Deaths, injuries and property damage from extreme weather events would likely be even greater were it not for the work of emergency responders—firefighters, workers stacking sandbags alongside swollen creeks, and police and National Guard troops called upon to preserve public order. The costs of providing emergency response for extreme weather events are signifi-cant. The federal government alone, for example, spends approximately $1 billion per year on fire suppression efforts.29
• Economic disruption: Natural disas-ters also cause temporary economic disruptions by reducing productivity for the duration of the storm, render-ing transportation systems and other types of infrastructure inoperable, and forcing workers and businesses to expend time and resources recovering from dislocation and property damage.
• Investments in preventive mea-sures: Another hidden cost of extreme weather is the added cost of building structures and settlements designed to withstand natural disasters. Adoption of stronger building codes designed to ensure that buildings withstand high winds and floods, or relocation or fortification of public infrastruc-ture, such as roads and sewer systems, impose major—if difficult to calcu-late—costs.
• Broader and longer-term impacts: The costs of extreme weather events can persist long after buildings are rebuilt and things are seemingly “back to normal.” During a disaster,
schools and health centers may close, and close-knit communities may be torn apart through relocation, all with long-term implications for health, hu-man development and the economy.30
Changes in the severity or frequency of extreme weather events can have massive impacts on the environment and society. It is important, therefore, that decision-mak-ers and the public attempt to understand the potential for global warming-driven changes in extreme weather.
Louisiana’s Chandeleur Islands—an important bird habi-tat—were greatly diminished between 2001 (top photo) and the days following the passage of Hurricane Katrina (bottom). Credit: U.S. Geological Survey.
14 Global Warming and Extreme Weather
Patterns of extreme weather events are already changing in the United States, and climate science predicts
that further changes are in store. In this report, we review recent trends in several types of extreme weather events, the im-pacts caused by notable events that have occurred since 2005, and the most recent scientific projections of future changes in extreme weather.
Hurricanes and Tropical StormsHurricanes are the most costly extreme weather events that affect the United States. Hurricane Katrina was, in nominal terms, the most costly single weather-re-lated disaster in American history, with property damages estimated to be as much as $125 billion.33 Hurricanes can unleash flooding rains, violent winds, tornadoes, and massive coastal storm surges, inflict-ing severe damage to property and natural systems over a wide area.
In recent decades, there has been a
trend toward stronger, more destructive hurricanes. Climate science projects that global warming may bring about increased hurricane activity, with changes in the number, intensity, duration or size of those storms.34
Recent TrendsThere has been a clear trend in recent years toward stronger, more destructive hurricanes in the Atlantic Ocean and worldwide.
The strongest tropical cyclones have been getting stronger around the globe in recent decades.35 There has been an ob-served increase in the number of Category 4 and 5 hurricanes in the Atlantic since 1980.36 Measurements that aggregate the destructive power of tropical storms—in terms of their intensity, duration and fre-quency—over entire storm seasons have shown a marked increase in the power of hurricanes in the Atlantic since the 1970s.37 Other research has found that both the en-ergy of and amount of precipitation in trop-ical cyclones in the Atlantic have increased in recent years, with an abrupt, step-wise increase in cyclone energy and precipita-tion occurring in the mid-1990s.38
Extreme Weather: The Trends, the Impacts, and Predictions for the Future
Extreme Weather: The Trends, the Impacts, and Predictions for the Future 1�
The general trend toward increases in hurricane strength is correlated with warmer sea surface temperatures39 which, in turn, have been linked to the increase in the concentration of global warming pol-lution in the atmosphere.40 However, the number, size and strength of hurricanes in any particular year vary dramatically based on a number of other factors, and the relative importance of global warm-ing as a factor in recent trends remains uncertain.41
Very recent records show an unmis-takable increase in hurricane activity in the Atlantic during the 1995-2005 period compared with the average for the second
half of the 20th century—a phenomenon that has been linked to warmer sea waters during the August-September period of maximum hurricane activity.42
While there has been a clear trend toward stronger hurricanes in recent decades, longer-term trends—which are important for sorting out the potential impacts of global warming versus the normal decade-to-decade variability in hurricane frequency and strength—are less clear. Much of this uncertainty is due to questions about the consistency of the historical hurricane record, given the vast improvements in our ability to detect and track hurricanes since record-keeping on
A Focus on the Most Damaging Extreme Weather Events
Not all extreme weather events are created equal. Floods, tornadoes and wildfires occur frequently across the United States. The vast majority of the damage caused by extreme weather events, however, comes from the few
extreme events that are either so intense, or cover such a large geographic area, that they overwhelm the defenses and adaptive ability of human and natural systems.
For example, “major” hurricanes—those in Categories 3, 4 and 5 of the widely used Saffir-Simpson Scale—pack a far greater destructive punch than minor Cat-egory 1 or 2 hurricanes. Indeed, between 1990 and 2005, major hurricanes accounted for only 24 percent of landfalling U.S. hurricanes, but were responsible for 85 per-cent of total hurricane damages.31 A reconstruction of historical damage estimates from floods shows a similar dynamic, with the estimated damages from flooding events in any given state typically dominated by a few, very extreme events.32
At present, there is no single, reliable, consistent, and comprehensive source of data on economic or other damages from extreme weather events. As such, in this report we will focus on describing the damage inflicted by several “notable” extreme weather events since the beginning of 2005—either those that are the most deadly or most costly in economic terms, or that are extremely unusual for their location. The estimates of damages and loss of life used in this report are compiled from various sources, which include or exclude various costs associated with extreme weather events. The intention is not to provide definitive estimates of the cost of particular natural disasters where none likely exist, nor to compare the cost of one event to that of another, but rather to illustrate the severe impact that extreme weather events impose on the economy, society and the environment.
16 Global Warming and Extreme Weather
Atlantic hurricanes began in the 1850s. As a result, scientists disagree about whether the number of hurricanes has increased43 since the 19th century, or there has been no change.44
Hurricanes in a Warming WorldGlobal warming is projected to lead to an increase in the destructive power of hurricanes, with a likely increase in the number of extreme storms, but a possible decrease in the overall number of hur-ricanes.45 Hurricanes, like all storms, are expected to bring more precipitation in a warming world.
An expert team convened by the World Meteorological Organization (WMO) recently concluded that hurricane activity could change in important ways by the end of this century if global warming continues unabated:
• The number of tropical cyclones is projected to decrease globally, by an estimated 6 to 34 percent, but with great potential variation in trends for specific ocean basins.
• Average maximum wind speeds are projected to increase globally by 2 to 11 percent.
• The number of intense hurricanes is projected to increase.46
• Tropical cyclones are projected to bring more rainfall, with a projected average increase of about 20 percent.47
These global trends are likely to vary by region. Five of seven climate models in one recent study pointed to an increase in the aggregate power of hurricanes in the Atlantic by the end of the next century, with an average increase in power across all models of 10 percent.48 Another recent modeling effort projected that the number of severe Category 4 and 5 hurricanes could
be expected to double in the Atlantic over the course of the 21st century as a result of global warming.49
Climate scientists have made great progress in improving their understand-ing of the links between global warming and hurricanes over the past five years, but there remain areas of uncertainty about the timing and degree of projected changes in hurricane activity—particularly when the scale of analysis is narrowed from the entire globe to particular ocean basins. Projected trends toward increasingly intense hurri-canes that bring more rainfall, if they hold true along the Atlantic or Gulf coasts, pose serious risks to coastal communities—par-ticularly when coupled with rising sea level. (See page 18.)
Notable Recent Hurricanes and Their ImpactsAccording to the National Oceanic and Atmospheric Administration, there have been seven hurricanes since the beginning of 2005 that inflicted more than $1 billion in damages or costs.50 (It is likely that these estimates, while the most comprehensive available, still undercount the damage imposed by these disasters.) Collective damage from these storms exceeded $200 billion. Major destructive hurricanes dur-ing this period include:
• Katrina 2005 - $134 billion in esti-mated damages (normalized 2007 dollars)51
• Ike 2008 - $27 billion
• Rita 2005 - $17.1 billion
• Wilma 2005 - $17.1 billion
• Gustav 2008 - $5 billion
• Dennis 2005 - $2.2 billion
• Dolly 2005 - $1.2 billion
Extreme Weather: The Trends, the Impacts, and Predictions for the Future 1�
Damages from hurricanes extend far beyond the destruction of property and loss of life. Hurricanes are capable of inflicting permanent change to coastal ecosystems (see page 12), triggering oil spills and the discharge of toxic chemicals that can threaten public health, and caus-ing destructive inland flooding hundreds of miles from the point of landfall. In ad-dition to Hurricane Katrina, the costliest weather-related disaster in U.S. history, several other hurricanes have caused major damage in recent years.
Hurricane Ike (2008)
Texas, Louisiana, Arkansas, Tennessee, Ohio, Indiana, Illinois, Missouri, Ken-tucky, Michigan, Pennsylvania
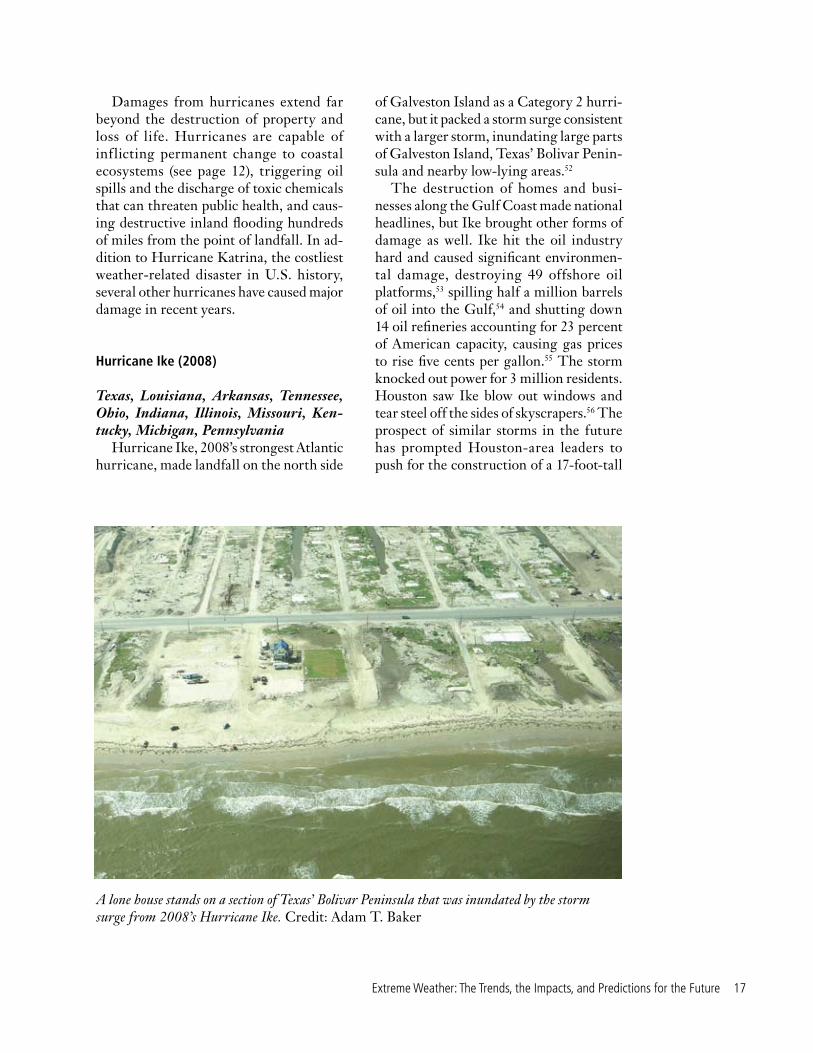
Hurricane Ike, 2008’s strongest Atlantic hurricane, made landfall on the north side
of Galveston Island as a Category 2 hurri-cane, but it packed a storm surge consistent with a larger storm, inundating large parts of Galveston Island, Texas’ Bolivar Penin-sula and nearby low-lying areas.52
The destruction of homes and busi-nesses along the Gulf Coast made national headlines, but Ike brought other forms of damage as well. Ike hit the oil industry hard and caused significant environmen-tal damage, destroying 49 offshore oil platforms,53 spilling half a million barrels of oil into the Gulf,54 and shutting down 14 oil refineries accounting for 23 percent of American capacity, causing gas prices to rise five cents per gallon.55 The storm knocked out power for 3 million residents. Houston saw Ike blow out windows and tear steel off the sides of skyscrapers.56 The prospect of similar storms in the future has prompted Houston-area leaders to push for the construction of a 17-foot-tall
A lone house stands on a section of Texas’ Bolivar Peninsula that was inundated by the storm surge from 2008’s Hurricane Ike. Credit: Adam T. Baker
18 Global Warming and Extreme Weather
“Ike Dike” that would stretch 60 miles and protect the area from floodwaters. If built, the structure would cost an estimated $2 billion to $4 billion.57
Ike was responsible for 112 deaths in the United States and the Caribbean. While the destruction along the Gulf Coast at-tracted the bulk of the attention, flooding rains from the storm affected large parts of the Midwest and Canada. Authorities blamed at least 28 deaths in the Midwest and Appalachian regions on flooding from Ike, and ranked the storm as one of the costliest natural disasters in the history of Ohio.58
Hurricane Wilma (2005)
FloridaBy the time Hurricane Wilma formed in October 2005, the 2005 U.S. hurricane season had already tied or broken records for both the highest number of hurricanes and of Category 5 hurricanes, had already registered two of the five strongest hurri-canes on record (Katrina and Rita), and had seen the costliest hurricane ever in terms of estimated damage (Katrina).59
Hurricane Wilma, however, showed that records still remained to be broken during 2005, becoming the strongest Atlantic hurricane on record. Within a 24-hour period, Wilma intensified from a tropical storm to a Category 5 hurricane, a rate of intensification that staff at the National Hurricane Center described as “by far the largest in the available records … going back to 1851.”60
Wilma weakened slightly to a Category 4 hurricane before striking Cozumel, Mex-ico. After crossing the Yucatan peninsula, Wilma emerged into the Gulf of Mexico and restrengthened (to a Category 3) before making landfall in southwestern Florida. Wilma knocked out power to 98 percent of South Florida and caused 23 deaths in all, five of them in Florida.61 Wilma’s storm surge inundated the Florida Keys, putting
60 percent of Key West underwater—the worst storm surge flooding in the Keys since 1965.62 The cost of damage from the storm was estimated at nearly $21 billion, making it (at the time) the third costliest hurricane in U.S. history.
Coastal Storms and Sea Level RiseThe United States is the world’s third-largest country by land area, but much of our population and property is clustered along the coasts. Nearly three out of every 10 Americans live in counties that abut the Atlantic or Pacific Oceans or the Gulf of Mexico.63 The coasts are home to five of the nation’s 10 largest cities as well as much of its economic productivity, key infrastructure, culture and history. All in all, between 900,000 and 3.4 million people in the mid-Atlantic region alone live on city blocks or land parcels with some land below 3.3 feet (1 meter) in elevation.64
The images of widespread destruction along the Gulf Coast after Hurricane Katrina and Hurricane Ike reinforce the association of storm surge damages with hurricanes. But coastal flooding is not only a problem in the southern states and not only a result of hurricanes. In 2003, for example, Hurricane Isabel pushed storm surge waters far up Chesapeake Bay, in-undating low-lying portions of Baltimore, Annapolis and other communities.65 In-tense winter storms along the East and West coasts also cause flooding that dam-ages coastal property.
The U.S. coastline faces a double threat from global warming—the potential for more intense storms that generate greater storm surge and wave action and the projected rise in sea level that will enable coastal storms to have a more destructive impact further inland.
Extreme Weather: The Trends, the Impacts, and Predictions for the Future 19
Recent TrendsSea level along the U.S. coast is on the rise and there are indications of an increase in the number of intense winter storms off the U.S. Pacific coast.
Rising sea level is not a “weather event,” but it can play a major role in magnifying the damage done by severe storms.
Sea level has risen by nearly 8 inches (20 cm) globally since 1870, with the rate of sea level rise increasing in recent years. Sea level rise is occurring both because of the thermal expansion of sea water as it warms and because of the melting of glaciers and ice caps.66
Sea level rise is not experienced the same way at all points along the coastline, for two
reasons. First, land along the coast is rising or falling as a result of long-term geological processes (and, in some cases, such as along the Gulf Coast, by the drawdown of un-derground reserves of fossil fuels or fresh water). Second, global warming is likely to cause sea level to rise more in some loca-tions than others, due to associated changes in ocean circulation patterns.
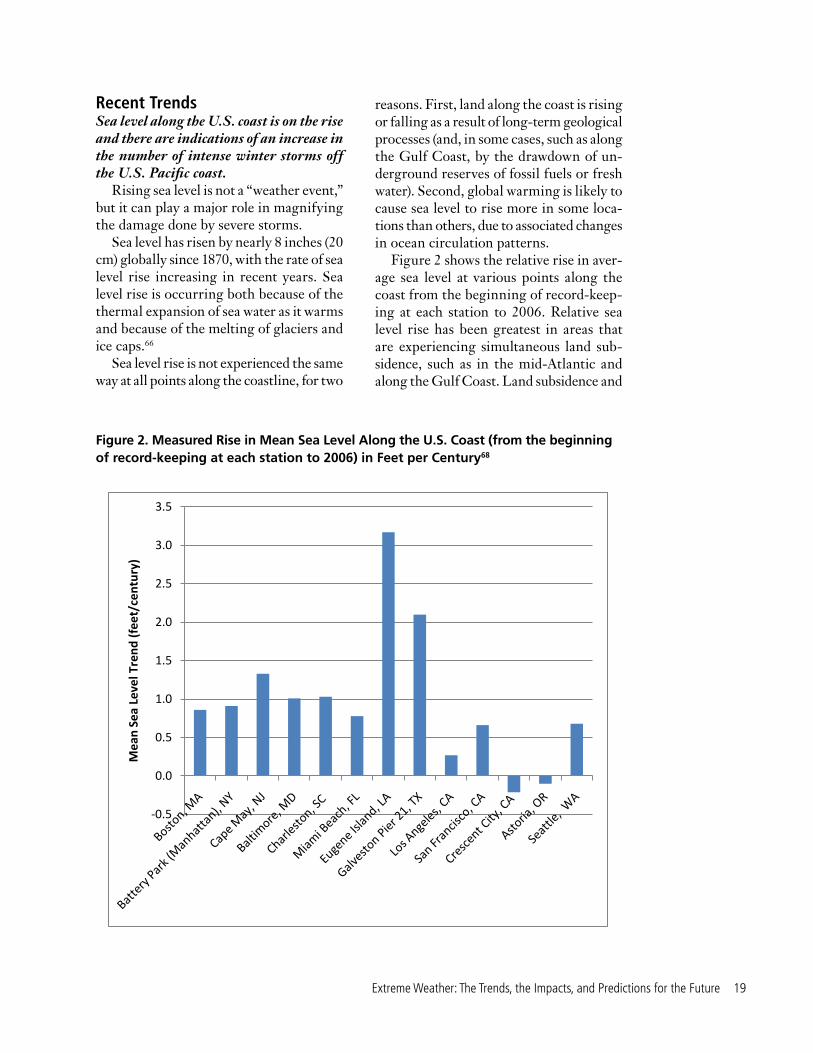
Figure 2 shows the relative rise in aver-age sea level at various points along the coast from the beginning of record-keep-ing at each station to 2006. Relative sea level rise has been greatest in areas that are experiencing simultaneous land sub-sidence, such as in the mid-Atlantic and along the Gulf Coast. Land subsidence and
-0.5
0.0
0.5
1.0
1.5
2.0
2.5
3.0
3.5
Mea
n Se
a Le
vel T
rend
(fee
t/ce
ntur
y)
Figure 2. Measured Rise in Mean Sea Level Along the U.S. Coast (from the beginning of record-keeping at each station to 2006) in Feet per Century68
20 Global Warming and Extreme Weather
rising seas have been contributing factors to the loss of 1,900 square miles of coastal wetlands in Louisiana.67
Sea level rise has the potential to in-crease the destructive capability of coastal storms—both tropical storms and extra-tropical storms such as the “Nor’easters” that frequently hammer the East Coast and the vicious winter storms that occur along the Pacific Coast.
The storm tracks of extratropical cy-clones have shifted toward the poles in recent decades, coinciding with a decline in the number of such storms off the U.S. Atlantic and Pacific coasts.69
Parts of the Pacific off the U.S. West Coast, however, have experienced increas-ing numbers of intense winter storms since the middle of the 20th century.70 One clue to the increase in the power of winter storms has come from the measurement of wave heights off the coast of the Pacific Northwest. Researchers have found that waves off the Oregon coast are higher than they were 35 years ago, with the greatest increase coming in the largest waves.71 As recently as the early 1990s, scientists esti-mated that the height of a “100-year wave” (one expected to occur only once every century) was 33 feet; now it is estimated to be 46 feet.72 The study also found that the increases in wave height have been greatest off the coast of Washington and northern Oregon, and less in southern Oregon. The study is consistent with other research that suggests an increase in the height of the highest waves along the West Coast,
particularly in the Pacific Northwest.73 (Similar research has found an increase in maximum wave heights on the Atlantic Coast resulting from hurricanes.74)
As described below, however, sea level rise is likely to increase the destructive power of even “normal” coastal storms.
Sea Level Rise and Coastal Storms in a Warming WorldGlobal warming will bring higher seas as glaciers and ice caps melt and sea water continues to expand as it warms. Rising sea level will increase the damage that can be inflicted by coastal storms. The implica-tions of global warming for changes in the number and severity of non-tropical coastal storms are less clear, though these storms will likely bring more rainfall.
A warmer world will bring higher seas as glaciers and ice caps continue to melt and sea water continues to expand as it warms.
In 2007, the Intergovernmental Panel on Climate Change estimated that sea level would likely rise by 7 to 23 inches (18 to 59 centimeters) by the end of the century. That estimate, however, (as the IPCC acknowledged at the time) did not include the potential for sea level change resulting from the potential changes in the flow of ice sheets in Greenland or Antarctica.75
Research conducted since publication of the IPCC’s Fourth Assessment projects that sea level rise will be significantly greater than the IPCC estimate. The
Table 1. Land Area Less than One Meter in Elevation Above Spring High Water, Mid-Atlantic Region (sq. mi.)
NY NJ PA DE MD DC VA NC TOTAL
Dry Land 63 106 9 49 174 2 135 528 1,065
Non-Tidal Wetland 4 66 1 12 47 0 57 1,193 1,381
All Land 91 551 13 199 652 2 817 2,212 4,536
Extreme Weather: The Trends, the Impacts, and Predictions for the Future 21
U.S. Climate Change Research Program concluded in 2008 that, based on observed changes in the behavior of the Greenland and Antarctic ice sheets, “including these processes in models will very likely show that IPCC AR4 [Fourth Assessment Re-port] projected sea level rises for the end of the 21st century are too low.”76 One recent study projects that sea level rise by the end of the century could be more than double that predicted by the IPCC—or between 2.5 and 6.25 feet (75 centimeters and 1.9 meters).77
What would such an increase mean for America’s coastline? In the mid-Atlantic region from New York to North Carolina, approximately 1,065 square miles of dry land, as well as vast areas of wetland, are less than 3.3 feet (1 meter) above the spring high water mark. (See Table 1.)78
Rising sea level will increase the destructive power of even routine coastal
storms by driving storm surge further inland. Under a high-emission scenario, a “100-year” coastal flood in New York City (a flood of a size expected to occur once a century based on historical records—see the text box on page 26), could happen twice as often by the middle of this century, and 10 times as often by the end of the cen-tury.79 Meanwhile, higher seas would raise the water level of tidally influenced rivers, creating greater risk of inland flooding during heavy rainfall events.
The risks to property and infrastructure posed by a combination of sea level rise and strong storms are severe. In the portion of the Gulf Coast stretching from Galveston, Texas, to Mobile, Alabama, more than half of the highways, nearly half of the rail miles, 29 airports and almost all port infrastructure are subject to flooding in the future due to the combination of higher sea levels and hurricane storm surge. Much
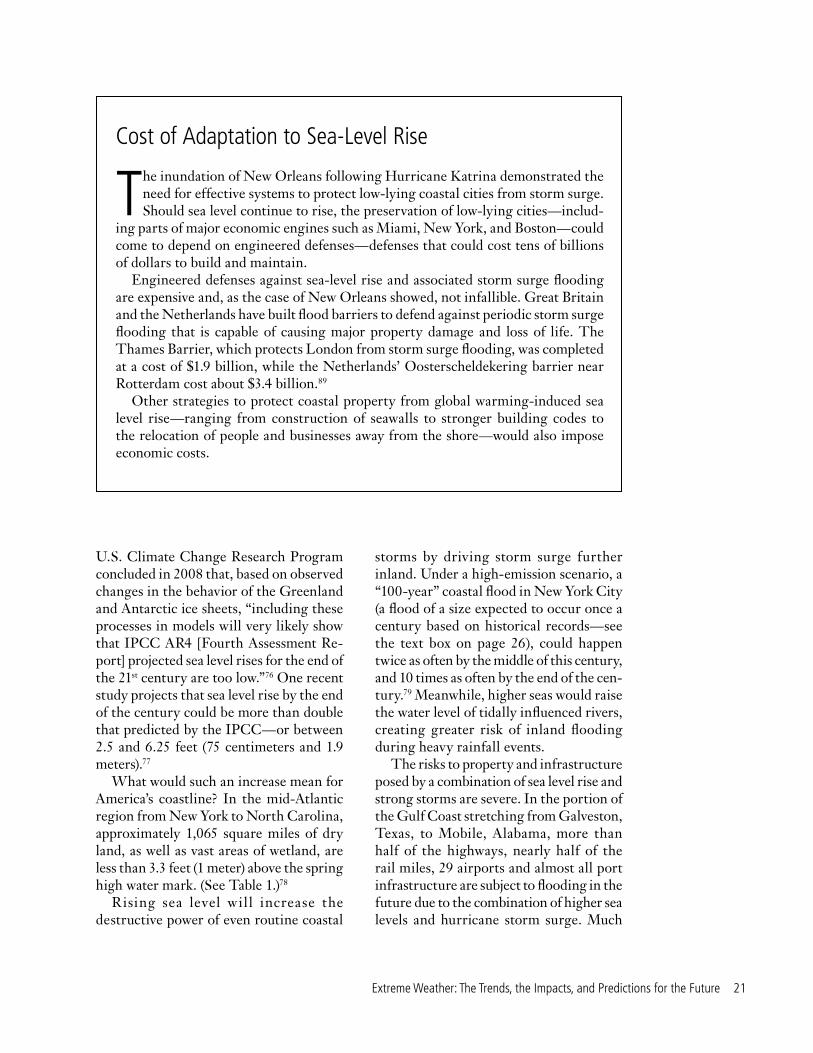
Cost of Adaptation to Sea-Level Rise
The inundation of New Orleans following Hurricane Katrina demonstrated the need for effective systems to protect low-lying coastal cities from storm surge. Should sea level continue to rise, the preservation of low-lying cities—includ-
ing parts of major economic engines such as Miami, New York, and Boston—could come to depend on engineered defenses—defenses that could cost tens of billions of dollars to build and maintain.
Engineered defenses against sea-level rise and associated storm surge flooding are expensive and, as the case of New Orleans showed, not infallible. Great Britain and the Netherlands have built flood barriers to defend against periodic storm surge flooding that is capable of causing major property damage and loss of life. The Thames Barrier, which protects London from storm surge flooding, was completed at a cost of $1.9 billion, while the Netherlands’ Oosterscheldekering barrier near Rotterdam cost about $3.4 billion.89
Other strategies to protect coastal property from global warming-induced sea level rise—ranging from construction of seawalls to stronger building codes to the relocation of people and businesses away from the shore—would also impose economic costs.
22 Global Warming and Extreme Weather
of this infrastructure is at risk even in the absence of storm surge due to projected sea-level rise.80
In the mid-Atlantic region, a one-meter sea level rise could result in the breakup or migration of barrier islands, and convert vast areas of wetland to open water. In areas such as the New York City metropolitan area, sea-level rise coupled with storm surge from coastal storms could result in severe damage to transportation infra-structure, including airports, highways, tunnels, railroads, ports and public trans-portation systems. A review of past storm surges in New York City estimated that a 20-inch (50 centimeter) rise in sea level (well below the current low-end estimate of sea level rise by the end of the century if global warming pollution continues un-abated), had it been present during the period between 1997 and 2007, would have
increased the number of moderate coastal flooding events at Battery Park from zero to 136, or the equivalent of a coastal flood warning every other week.81
Making matters worse for residents of the northeastern United States is evidence suggesting that sea-level rise in that region will be greater than the global average, due to global warming-induced changes in ocean circulation patterns. The result could be an additional 8 inches of sea-level rise in cities such as Boston, New York and Washington, D.C., atop the roughly three feet that will occur globally, further mag-nifying the damage caused by even routine coastal storms.82
There is less clarity regarding the potential impacts of global warming on extratropical storms. Recent studies sug-gest that global warming will reduce the number of extratropical cyclones in the
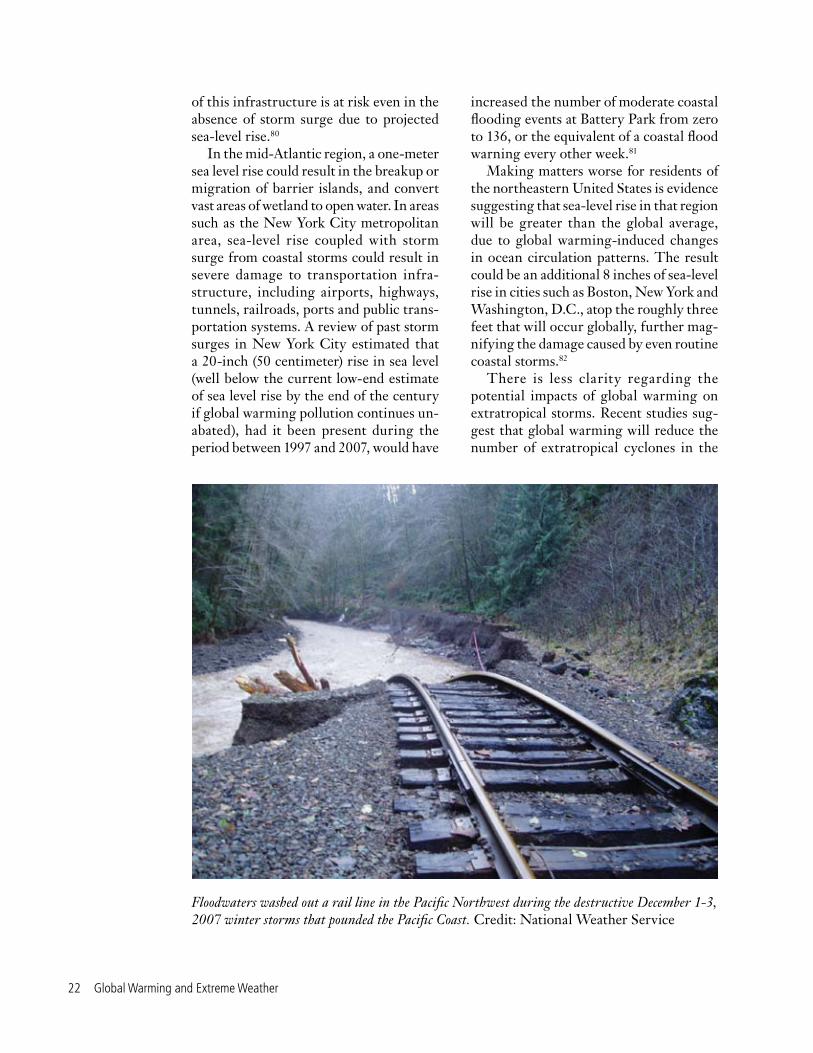
Floodwaters washed out a rail line in the Pacific Northwest during the destructive December 1-3, 2007 winter storms that pounded the Pacific Coast. Credit: National Weather Service
Extreme Weather: The Trends, the Impacts, and Predictions for the Future 23
Northern Hemisphere—consistent with the already-falling number of these storms as shown by the historical data.83 The U.S. Climate Change Science Program conclud-ed that the number of strong extratropical storms in the Northern Hemisphere would increase.84 Other research, however, sug-gests that there will be no intensification of extratropical storms on the whole.85
One clear conclusion of the research is that global warming will likely result in a poleward shift of extratropical storm tracks, with the strength of those poleward-mov-ing storms increasing.86 Shifting tracks of autumn extratropical cyclones in the North Atlantic may move those storms closer to the U.S. East Coast and the storms may cover a greater area.87
Another conclusion is that extratropical storms—like tropical storms—are likely to deliver increased precipitation, leading to increased potential for flooding rains (see page 24) and major snowfall (see page 30) from those storms.88
Scientific understanding of non-tropi-cal storms continues to evolve. It is clear, however, that sea level rise will increase the danger posed by even routine storms, and that precipitation from extratropical storms can be expected to increase.
Notable Recent Coastal Storms and Their ImpactsCoastal storms have multiple impacts, bringing large amounts of rainfall that causes inland flooding, as well as snow-fall and strong winds that cause coastal flooding.
The most damaging extratropical storm in U.S. history was the 1993 “Superstorm” or “Storm of the Century,” which formed in the Gulf of Mexico and swept up the East Coast, bringing blizzard conditions to much of the eastern United States, dropping snow from the Deep South to Maine, closing every airport on the East Coast, causing storm surge damage along
the Gulf and Atlantic coasts, spawning deadly tornadoes in Florida, and cutting off power to millions of customers.90 An estimated 270 people died in the storm, with property damages and other costs estimated at nearly $8 billion.91
More recent coastal storms have also caused major damage to property and life.
Great Coastal Gale (2007)
Oregon, WashingtonThe coastline of Washington and Oregon is dotted with small communities that are no strangers to severe winter storms. The storms of December 1-3, 2007, however, are likely to go down in regional lore as among the strongest and most destructive in memory.
A series of three powerful, tightly-spaced storms brought hurricane-force winds, coastal f looding, and record or near-record rainfall in many locations. High, persistent winds snapped trees and downed power lines. In Washington state, trees were felled in an estimated 29,000 acres of forest—including areas in which 75 percent or more of trees were blown down.92 The storm cut off transportation, electricity and communications to parts of the Oregon coast. Floodwaters (some outside of the 500-year flood zone) and mudslides completely isolated Vernonia, Oregon—a logging town inland from the coast—from the rest of the state.93 (See note explaining the meaning of “500-year flood” and similar terms on page 26.) The Chehalis River in southwest Washington experienced double its previous record rate of streamflow, with major flooding affecting the towns of Chehalis and Cen-tralia.94
The storm was the strongest to hit the region in at least 45 years, causing an esti-mated $180 million in damage in Oregon and possibly more than a billion dollars more in Washington.95
24 Global Warming and Extreme Weather
Southwest Winter Storm (2010)
California, Arizona, Utah, NevadaThe winter of 2009-2010 will be best remembered for the series of massive snowstorms (dubbed “Snowmageddon”) that smashed snowfall records in Wash-ington, D.C., and the mid-Atlantic region. But January 2010 saw other records fall in America’s Southwest.
Strong winter storms are not uncommon in the Southwest during El Niño periods, but the January 2010 storm was truly epic, setting all-time records for low pressure across 10 to 15 percent of the United States, including Los Angeles, Salt Lake City, Las Vegas and Phoenix.96 The storm brought heavy snowfall to higher elevations, heavy rain elsewhere, and strong winds, along with severe thunderstorms and tornadoes. In California, which experiences an aver-age of six tornadoes a year, there were unconfirmed reports of seven tornadoes in January, which would make it the all-time busiest January for tornadoes and the sixth busiest of any month since 1950.97
In Arizona, Yuma and Flagstaff experi-enced their wettest January days on record, with heavy rainfall also recorded in Phoe-nix and Tucson.98 Accumulation of heavy, wet snow collapsed the roofs of buildings in Flagstaff and heavy rains caused flooding that led to the death of a six-year-old boy as well as evacuations of low-lying areas.99
Another potential calamity, however, was averted, when rainfall fell short of projec-tions in California. Public officials ordered evacuations and warned residents of the potential for mudslides in areas that had been burned in wildfires the previous year. While some mudslides were reported in areas affected by the 2009 Station wildfire, according to Susan Cannon, a research geologist at the U.S. Geological Survey, “If the initial forecast had held, it’s likely some catchment basins would have overflowed, potentially sending rivers of fast-moving debris into communities.”100
Flooding and Extreme RainfallFlooding is a major cause of property dam-age and loss of life in the United States. Major floods can devastate communities, ruin crops, and bring transportation to a halt. The 1993 Midwestern flood, for example, was the fifth most-costly weather-related disaster since 1980, trailing only Hurricane Katrina, heat waves and related droughts in 1980 and 1988, and 1992’s Hur-ricane Andrew.101
Property damage from flooding results in part from human decisions—such as the location of houses and transporta-tion infrastructure in floodplains or the paving-over of large areas of natural land with impervious surfaces, which acceler-ates the flow of runoff into waterways. But precipitation—in the form of rain or melt-ing snow—is a key ingredient of any flood event. And with the number of extreme downpours in the United States increasing in recent decades—and projected to con-tinue to increase in the future—flooding may well become an even more important concern in the years to come.
Recent TrendsThe number of extreme rainfall events has increased in the United States in recent decades.
Over the last century, the amount of precipitation falling over most of the Unit-ed States has increased, with the exception of the Southwest, which has received less precipitation.102
However, the increase in precipitation has come largely in the form of heavy precipitation events. Research suggests that there has either been no change or a decrease in the number of light or aver-age precipitation days during the last 30 years.103 But, the amount of precipitation falling in the top 1 percent of rainfall events has increased by 20 percent over the course of the 20th century.104
Extreme Weather: The Trends, the Impacts, and Predictions for the Future 2�
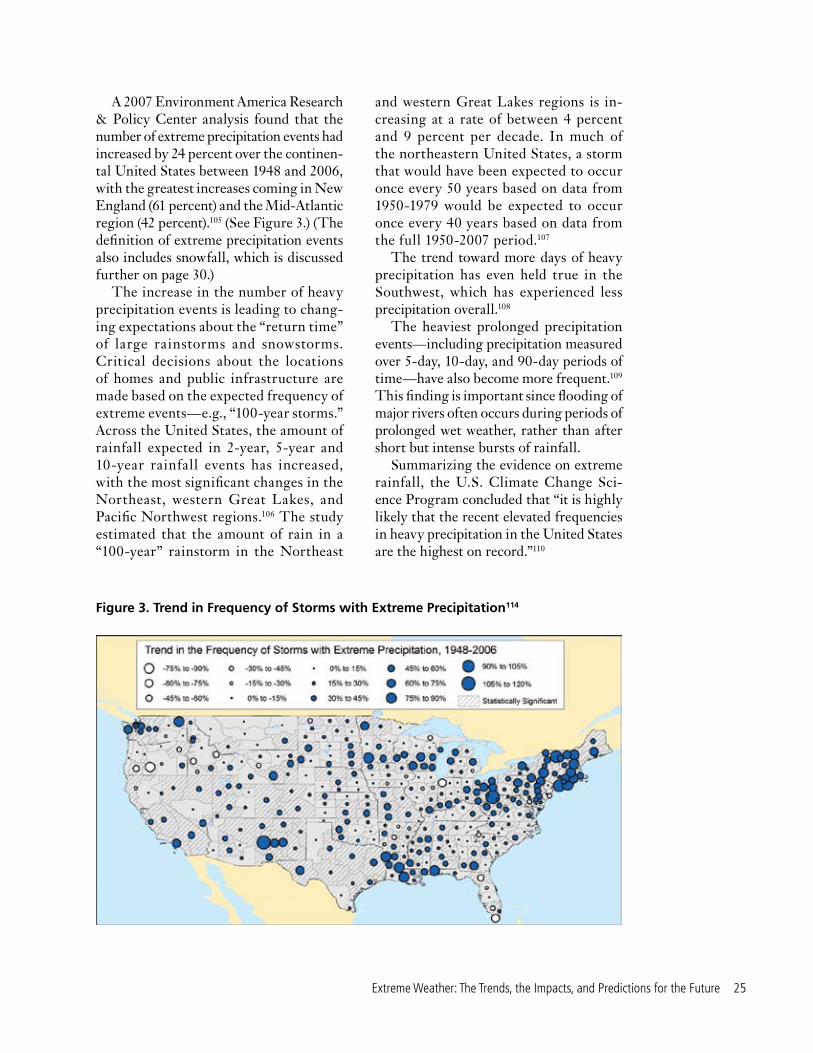
A 2007 Environment America Research & Policy Center analysis found that the number of extreme precipitation events had increased by 24 percent over the continen-tal United States between 1948 and 2006, with the greatest increases coming in New England (61 percent) and the Mid-Atlantic region (42 percent).105 (See Figure 3.) (The definition of extreme precipitation events also includes snowfall, which is discussed further on page 30.)
The increase in the number of heavy precipitation events is leading to chang-ing expectations about the “return time” of large rainstorms and snowstorms. Critical decisions about the locations of homes and public infrastructure are made based on the expected frequency of extreme events—e.g., “100-year storms.” Across the United States, the amount of rainfall expected in 2-year, 5-year and 10-year rainfall events has increased, with the most significant changes in the Northeast, western Great Lakes, and Pacific Northwest regions.106 The study estimated that the amount of rain in a “100-year” rainstorm in the Northeast
and western Great Lakes regions is in-creasing at a rate of between 4 percent and 9 percent per decade. In much of the northeastern United States, a storm that would have been expected to occur once every 50 years based on data from 1950-1979 would be expected to occur once every 40 years based on data from the full 1950-2007 period.107
The trend toward more days of heavy precipitation has even held true in the Southwest, which has experienced less precipitation overall.108
The heaviest prolonged precipitation events—including precipitation measured over 5-day, 10-day, and 90-day periods of time—have also become more frequent.109 This finding is important since flooding of major rivers often occurs during periods of prolonged wet weather, rather than after short but intense bursts of rainfall.
Summarizing the evidence on extreme rainfall, the U.S. Climate Change Sci-ence Program concluded that “it is highly likely that the recent elevated frequencies in heavy precipitation in the United States are the highest on record.”110
Figure 3. Trend in Frequency of Storms with Extreme Precipitation114
26 Global Warming and Extreme Weather
Flooding and Extreme Rainfall in a Warming World
The trend toward more extreme rainfall events is expected to continue in a warm-ing climate, bringing with it an increased risk of flooding.111
Warmer temperatures lead to greater evaporation, and warmer air is capable of holding more water vapor. These two factors will result in rainfall events that bring more frequent heavy precipitation events in a warmer world, even in locations where there is no overall increase in annual rainfall.112
The greatest increase in intense pre-cipitation is projected for the Northeast and Midwest.113 As discussed earlier, both hurricanes (see page 14) and extra-tropi-cal storms (see page 18) are also projected
to come with increased precipitation in a warming world.
The question of whether increases in heavy precipitation events will lead to in-creased flooding, however, is more compli-cated—depending not only on the number and severity of extreme events, but also on their timing, as well as the effective-ness of human-built systems in managing stormwater. By the end of the century, precipitation is expected to increase during the winter months in much of the northern United States, with the greatest increases taking place in the Northeast and North-west. The summer months are projected to be drier over most of the nation.115
A good example of the complicated connections between precipitation and flooding is the Columbia River basin of Washington and Oregon. Climate science
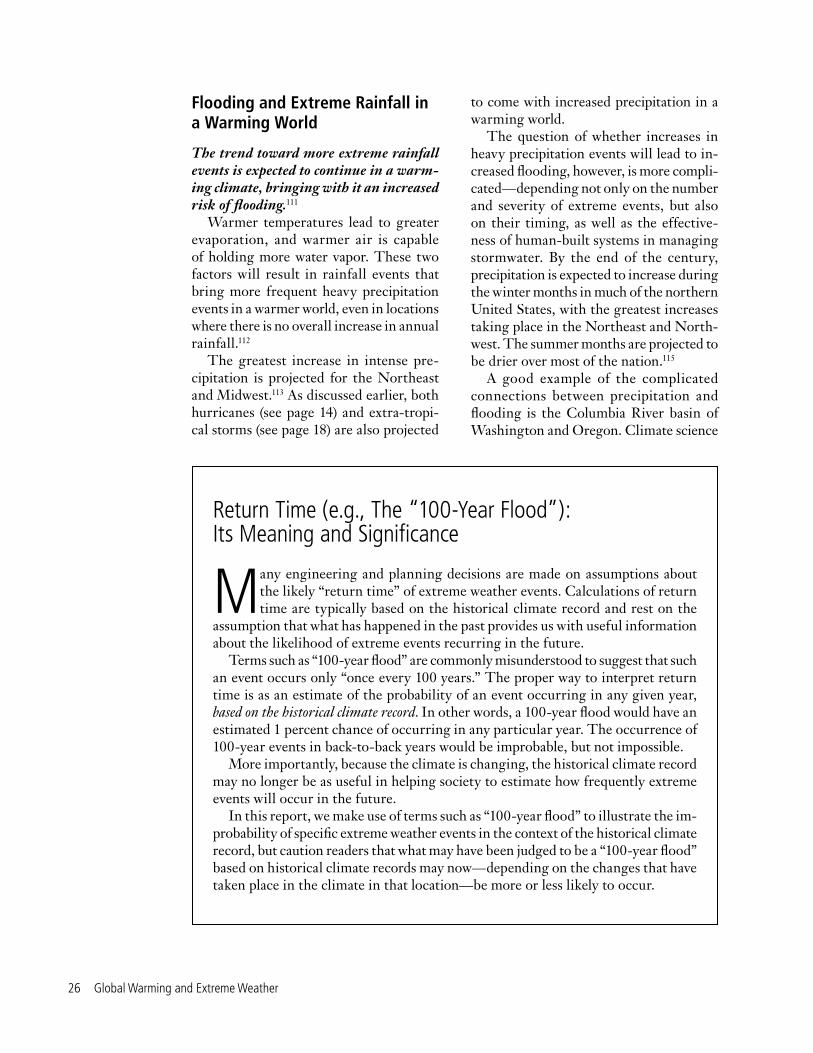
Return Time (e.g., The “100-Year Flood”): Its Meaning and Significance
Many engineering and planning decisions are made on assumptions about the likely “return time” of extreme weather events. Calculations of return time are typically based on the historical climate record and rest on the
assumption that what has happened in the past provides us with useful information about the likelihood of extreme events recurring in the future.
Terms such as “100-year flood” are commonly misunderstood to suggest that such an event occurs only “once every 100 years.” The proper way to interpret return time is as an estimate of the probability of an event occurring in any given year, based on the historical climate record. In other words, a 100-year flood would have an estimated 1 percent chance of occurring in any particular year. The occurrence of 100-year events in back-to-back years would be improbable, but not impossible.
More importantly, because the climate is changing, the historical climate record may no longer be as useful in helping society to estimate how frequently extreme events will occur in the future.
In this report, we make use of terms such as “100-year flood” to illustrate the im-probability of specific extreme weather events in the context of the historical climate record, but caution readers that what may have been judged to be a “100-year flood” based on historical climate records may now—depending on the changes that have taken place in the climate in that location—be more or less likely to occur.
Extreme Weather: The Trends, the Impacts, and Predictions for the Future 2�
projects that spring snowmelt will occur earlier in the Pacific Northwest, while precipitation will increase in the winter but decrease during the summer.116 The result is projected to be a shift toward higher river flows during the winter and spring months.117 A 2008 study of the potential for flooding in major river basins worldwide under an extreme climate change scenario projected that the Columbia River could experience what is now a “100-year flood” as frequently as once every three years by the end of the 21st century.118
However, the increased risk of major flooding in the Columbia basin is expected to occur at the same time that the region also becomes more susceptible to sum-mertime drought, due to reduced summer precipitation, a reduction in the availabil-ity of water from snowmelt, and higher
temperatures. Indeed, the same study that projected a dramatic increase in the fre-quency of severe floods also projected that the Columbia basin will experience triple the number of drought days and lower to-tal discharge from the Columbia over the course of the year under a scenario marked by dramatic increases in global warming pollution.119 (See discussion of drought on page 32.)
This same complex combination of factors will affect future trends in flooding in other major river basins. A 2002 study of the potential for “great f loods” in river basins worldwide projected that the Ohio River would be more than twice as likely to experience a 100-year f lood following a quadrupling of atmospheric carbon dioxide beyond pre-industrial levels (though the same study projected
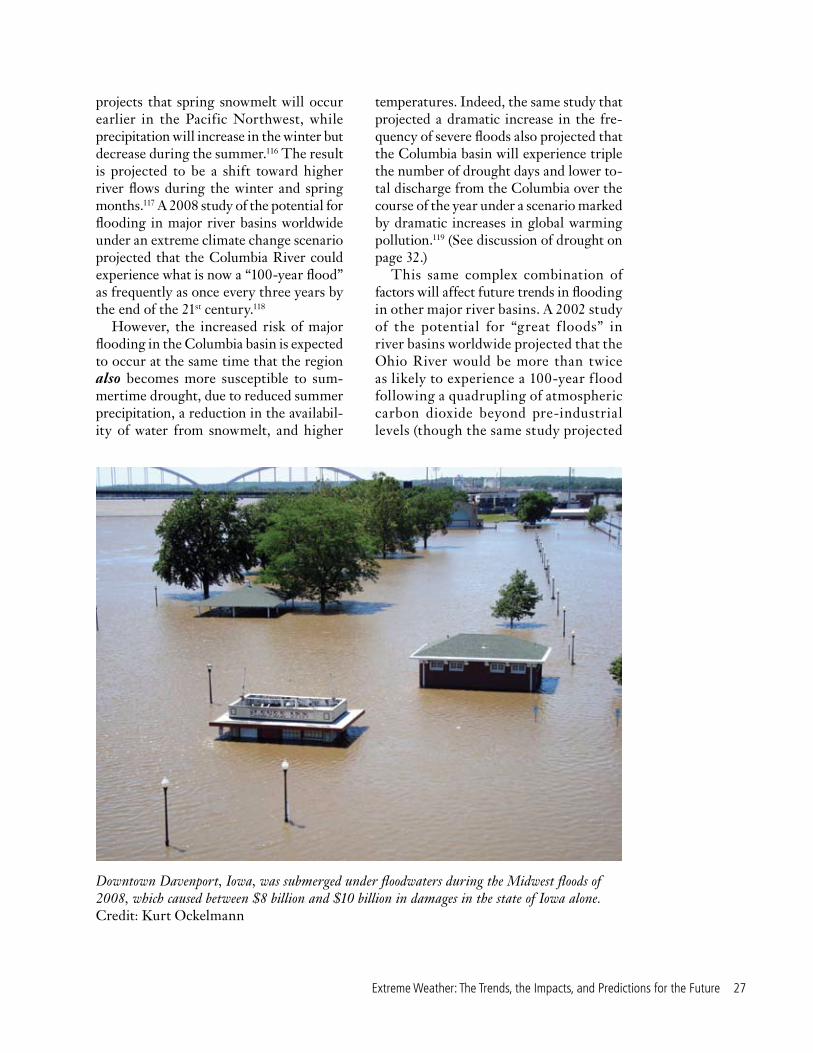
Downtown Davenport, Iowa, was submerged under floodwaters during the Midwest floods of 2008, which caused between $8 billion and $10 billion in damages in the state of Iowa alone. Credit: Kurt Ockelmann
28 Global Warming and Extreme Weather
a slightly lower probability of 100-year floods in the upper Mississippi River, the only river studied worldwide that exhibited a negative extreme flooding trend.)120
On a more localized level, an increase in the number of heavy downpours could be expected to increase the risk of flash flooding and urban flooding, which are also capable of inflicting property damage and loss of life.
Notable Recent Floods and Extreme Rainfall Events and their ImpactsHistorically, flooding has been the most common natural disaster affecting the United States.121 Damaging floods can oc-cur in any region of the country, and major floods can inflict massive damage. In parts of the country—particularly those that have experienced the greatest increase in extreme rainfall events—extreme flooding seems to be happening more frequently, with two massive “500-year” floods occur-ring in the Midwest over a 15-year period and a pattern of increasingly frequent major floods in New England.
Midwest Floods (2008)
Iowa, Wisconsin, Illinois, Indiana, Mis-souri, Minnesota, NebraskaIn June 2008, abnormally heavy rains trig-gered the Midwest’s second “500-year” flooding event in 15 years. The rains came following an unusually wet winter and spring. During June, more than 1,000 new daily precipitation records were set across the Midwest, as were new all-time records for streamflow on rivers such as the Cedar, Wisconsin and Des Moines rivers.122
Iowa was hit especially hard by the floods, which left 1,300 city blocks of Ce-dar Rapids under water and devastated the surrounding region.123 The flood was deemed to be the worst natural disaster ever to hit the state of Iowa124 and 85 of the state’s 99 counties were declared disaster
areas by the President.125 Damage to the state was extensive, with 40,000 Iowans forced from their homes and 3,000 homes destroyed.126 Economic losses were monu-mental. Total job losses stemming from the flood were estimated at 7,500,127 and the American Farm Bureau estimated that there were $4 billion in agricultural losses in Iowa,128 contributing to total damages estimated by state officials at between $8 billion and $10 billion.129 The floods were also responsible for 24 deaths and 148 injuries.130
Northeast Floods (2010)
Rhode Island, Massachusetts, New Hamp-shire, Maine, New York, New Jersey, Pennsylvania
In March, 2010, New England was struck by a series of extremely wet “Nor’easters” that dumped record rainfall on much of the region. On March 13, a large storm dropped 6 to 10 inches of rain in parts of New England and the mid-Atlantic region. Then, two weeks later, a second major storm deposited several more inches of rain on the region’s already saturated ground. Rainfall records throughout the region were smashed, with New York, Boston and Portland, Maine, experiencing their raini-est March ever and Providence setting a record for its all-time rainiest month since records have been kept.131
The damage was most severe in Rhode Island. Having just started to recover from a “100-year” flooding event in mid-March, the late March rains created an even worse, “500-year” flooding event.132 The Pawtuxet River crested at nearly 21 feet—12 feet higher than its usual level—leaving homes, businesses and transportation infrastruc-ture underwater.133 The floods damaged sewage treatment plants and created an environmental crisis as raw sewage flowed into Narragansett Bay. In addition to leav-ing 2,000 residents homeless for several weeks,134 the storm prompted officials to
Extreme Weather: The Trends, the Impacts, and Predictions for the Future 29
ask residents to not flush toilets because of the damaged treatment plants.135 The flooding led to over $200 million in dam-age, a significant setback to a state with unemployment over 13 percent.136
The 2010 floods were the fourth major flooding event in New England in five years, following floods in October 2005 (which caused 10 deaths),137 May 2006 (during which Boston experienced its second-highest four-day rainfall in 125 years of record-keeping),138 and April 2007 (which recorded the third- to fifth-high-est streamflows since 1936 at numerous locations in Massachusetts).139 Weather experts have noted a pattern of increas-ingly frequent major floods since 1970 in the region.140
Tennessee Floods (2010)
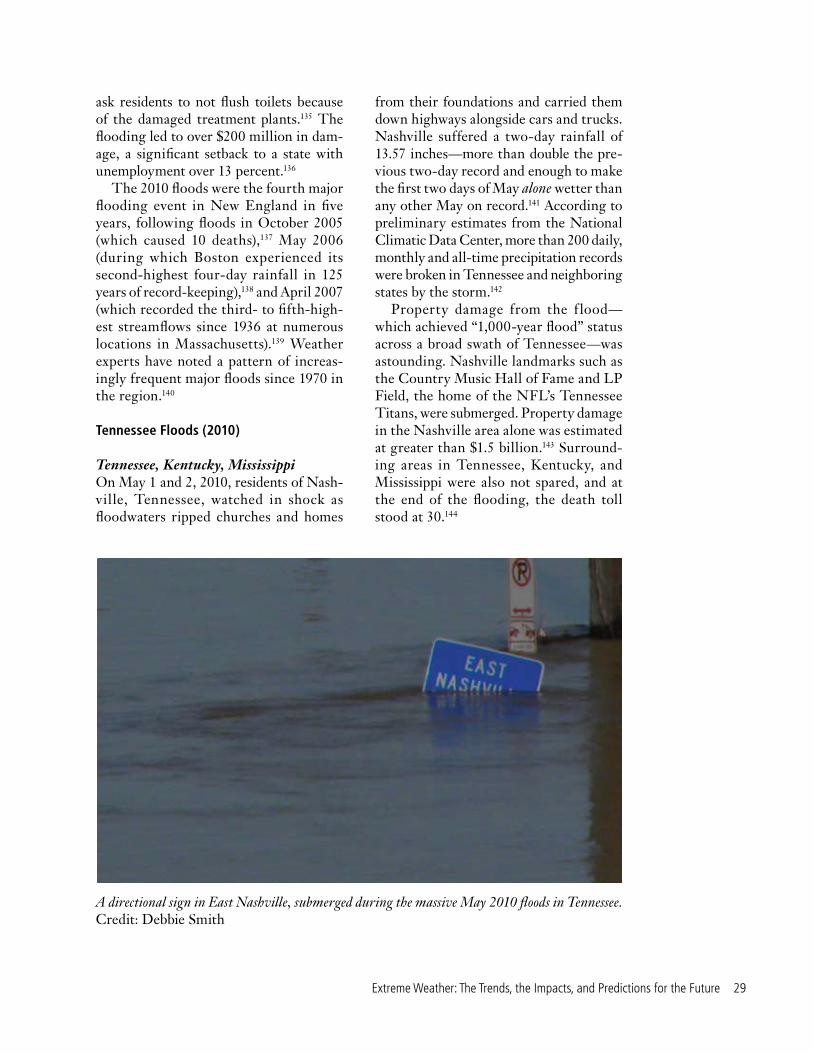
Tennessee, Kentucky, MississippiOn May 1 and 2, 2010, residents of Nash-ville, Tennessee, watched in shock as floodwaters ripped churches and homes
from their foundations and carried them down highways alongside cars and trucks. Nashville suffered a two-day rainfall of 13.57 inches—more than double the pre-vious two-day record and enough to make the first two days of May alone wetter than any other May on record.141 According to preliminary estimates from the National Climatic Data Center, more than 200 daily, monthly and all-time precipitation records were broken in Tennessee and neighboring states by the storm.142
Property damage from the f lood—which achieved “1,000-year flood” status across a broad swath of Tennessee—was astounding. Nashville landmarks such as the Country Music Hall of Fame and LP Field, the home of the NFL’s Tennessee Titans, were submerged. Property damage in the Nashville area alone was estimated at greater than $1.5 billion.143 Surround-ing areas in Tennessee, Kentucky, and Mississippi were also not spared, and at the end of the flooding, the death toll stood at 30.144
A directional sign in East Nashville, submerged during the massive May 2010 floods in Tennessee. Credit: Debbie Smith
30 Global Warming and Extreme Weather
SnowstormsThe idea that global warming might fuel more extreme snowfall events might seem counter-intuitive. After all, common sense would suggest that a warmer world will bring less snow. And, on average, that is true—climate science suggests that northern portions of the United States will experience a greater share of precipitation falling as rain and less as snow in a warm-ing world.145
But, as with other weather events, much of the damage caused by snow is caused by extreme snowfall events, those with the capability to collapse roofs, impair transportation, and shut down economic activity. Global warming has the potential to increase the risk of extreme snowfall events for areas that remain cold enough to receive snow.
Recent TrendsTrends toward increases in extreme pre-cipitation events apply equally to snow and rain events. There has been a northward shift in snowstorm occurrence over the past century, along with an apparent increase in lake effect snow.
The same conditions that lead to more intense rainstorms—including increased evaporation from oceans and the ability of warmer air to hold more water vapor—can also be expected to contribute to an in-crease in extreme snowstorms. Indeed, a study of snowstorms during the 20th cen-tury found that most snowstorms occurred during warmer-than-normal years in most of the United States.146
During the 20th century, there was no significant trend in snowstorms nation-wide, but there were significant changes at the regional level. Snowstorms became more frequent over the course of the cen-tury in the upper Midwest and Northeast, and less frequent in the lower Midwest and South.147
For different reasons—also potentially
linked to global warming—there has been an apparent increase in lake-effect snows. Lake-effect snows occur when cold air blows across the surface of the Great Lakes, causing water evaporated from the lakes to be deposited on the far shore as snow.
Lake-effect snow is not possible after ice has formed on the lakes—this may be one reason why areas downwind of the Great Lakes experience the greatest snowstorm activity early in the winter, during December, compared with other areas where snowstorm activity peaks later in the season.148
Ice cover on the Great Lakes has declined by roughly 30 percent on aver-age since the early 1970s as the result of warmer temperatures.149 As ice cover has declined, lake-effect snows have appar-ently increased. A 2003 study found that there had been a significant increase in snowfall at sites receiving lake-effect snow since the early 1930s, compared with no trend for comparable areas not receiving lake-effect snow. The study noted, for example, that Syracuse, New York—a lake-effect snow hot spot—experienced its snowiest decade of the 20th century during the 1990s.150
Extreme Snowstorms in a Warming WorldProjected increases in extreme precipita-tion events apply to both snow and rain events, though, over time, the share of precipitation falling as snow versus rain is expected to decrease.
The U.S. Global Change Research Program projects that the strongest winter storms are likely to become stronger and more frequent in the decades to come.151 To the extent that certain areas of the country remain cold enough for snowfall during periods of the winter, this would suggest increased frequency of “storms of the century” in a warming world.
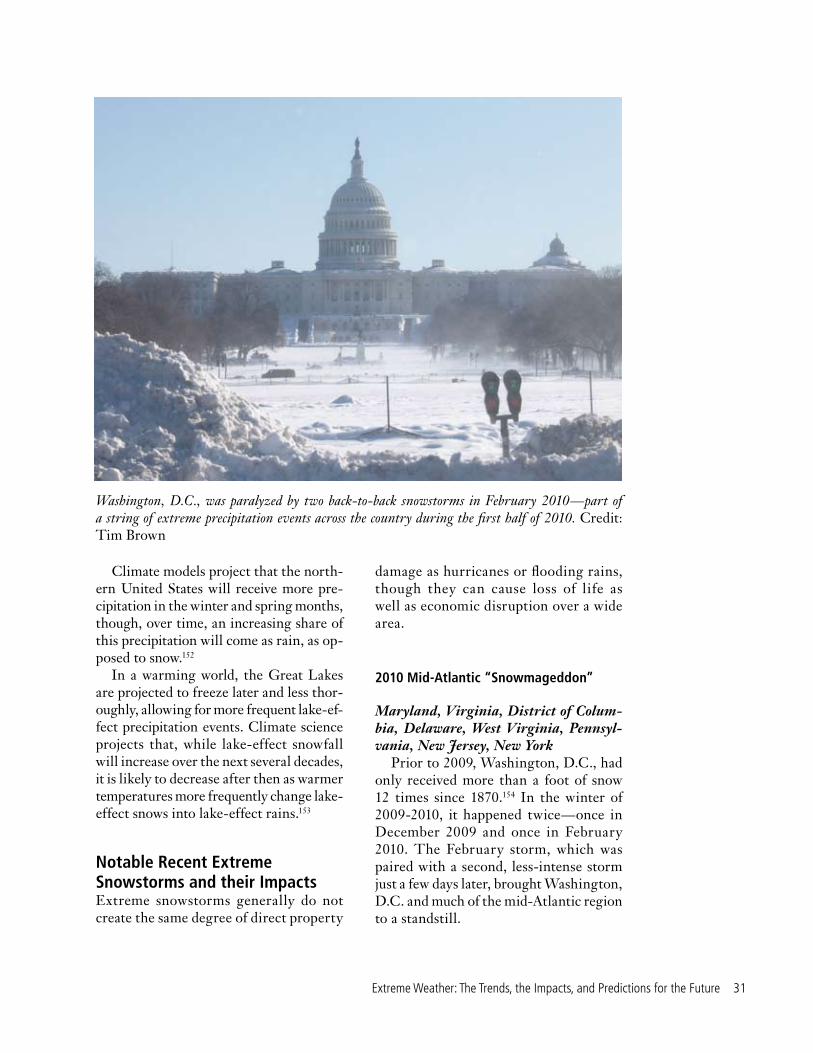
Extreme Weather: The Trends, the Impacts, and Predictions for the Future 31
Climate models project that the north-ern United States will receive more pre-cipitation in the winter and spring months, though, over time, an increasing share of this precipitation will come as rain, as op-posed to snow.152
In a warming world, the Great Lakes are projected to freeze later and less thor-oughly, allowing for more frequent lake-ef-fect precipitation events. Climate science projects that, while lake-effect snowfall will increase over the next several decades, it is likely to decrease after then as warmer temperatures more frequently change lake-effect snows into lake-effect rains.153
Notable Recent Extreme Snowstorms and their ImpactsExtreme snowstorms generally do not create the same degree of direct property
damage as hurricanes or flooding rains, though they can cause loss of life as well as economic disruption over a wide area.
2010 Mid-Atlantic “Snowmageddon”
Maryland, Virginia, District of Colum-bia, Delaware, West Virginia, Pennsyl-vania, New Jersey, New York
Prior to 2009, Washington, D.C., had only received more than a foot of snow 12 times since 1870.154 In the winter of 2009-2010, it happened twice—once in December 2009 and once in February 2010. The February storm, which was paired with a second, less-intense storm just a few days later, brought Washington, D.C. and much of the mid-Atlantic region to a standstill.
Washington, D.C., was paralyzed by two back-to-back snowstorms in February 2010—part of a string of extreme precipitation events across the country during the first half of 2010. Credit: Tim Brown
32 Global Warming and Extreme Weather
Dubbed “Snowmaggedon” or the “Snowpocalypse,” the storms dropped 32 inches155 of snow at Washington-Dulles Airport on February 5-6 and nine more inches of snow156 on February 10-11, virtu-ally paralyzing the nation’s capital.157 All modes of transportation were affected as roads became impassable, transit service on all but the underground portions of the city’s Metro system came to a halt, Amtrak canceled most service, and the vast majority of flights to and from the city were stopped.158 The U.S. Postal Service did not deliver mail on Saturday, Febru-ary 6—the first time in 30 years that the Postal Service canceled delivery.159
The economic costs of the storm were estimated at more than $2 billion.160 With the roads blocked, federal employees had to take unplanned leave starting four hours early on Friday and lasting into the following week, at an estimated cost to taxpayers of $100 million each day.161 The snow also caused the collapse of several buildings throughout the area, including a jet hanger at Dulles International Air-port.162 While the massive snowfall in the nation’s capital received the most media attention, seasonal snowfall records were also broken in Baltimore and Philadelphia and economic disruption spread through-out the mid-Atlantic region.163
At the t ime, the Februar y 2010 “Snowmageddon” appeared to many to be a freak occurrence, but it was actu-ally one of a series of damaging extreme precipitation events in the United States during the latter part of 2009 and early 2010—including the massive mid-Atlan-tic and eastern snowstorm of December 2009, the “500-year” flood event in New England in March 2010 (see page 28), the “1,000-year” flood event in Tennessee in May 2010 (see page 29), and massive flood-ing in Oklahoma in June 2010.164
Drought, Wildfire and Heat WavesExtended periods of drought have broad impacts on the economy and the environ-ment. Crops fail, reservoirs dry up, cities and towns scramble to find water to supply the needs of residents and industry, and forests and grasslands become increasingly susceptible to damaging wildfires. The sec-ond and third most costly weather disasters of the last 30 years were droughts and heat waves that struck the eastern and central United States in 1980 and 1988.165
Global warming threatens to increase the occurrence of extreme drought world-wide, with the percentage of the globe in extreme drought projected to increase from 1 percent today to 30 percent by the end of the century if global warming emis-sions continue unabated.166 The United States is not immune, with global warming projected to increase drought in much of the country, which could contribute to an increase in wildfire activity.
Heat waves do not create the same de-gree of direct physical damage to property and crops as other extreme weather events (not counting their contribution to drought or wildfire), but they are often far more le-thal. The U.S. Centers for Disease Control and Prevention estimates that excessive heat killed more than 8,000 Americans between 1979 and 2003.167
Recent TrendsOver the past century, drought has become more common in parts of the northern Rockies, the Southwest and the Southeast. Periods of extreme heat have become more common since 1960, and large wildfire activity in the American West has increased markedly since the mid-1980s.
Heat waves, droughts and wildfires are often related events. Heat waves occur over a span of days to weeks, while droughts typically develop following long periods
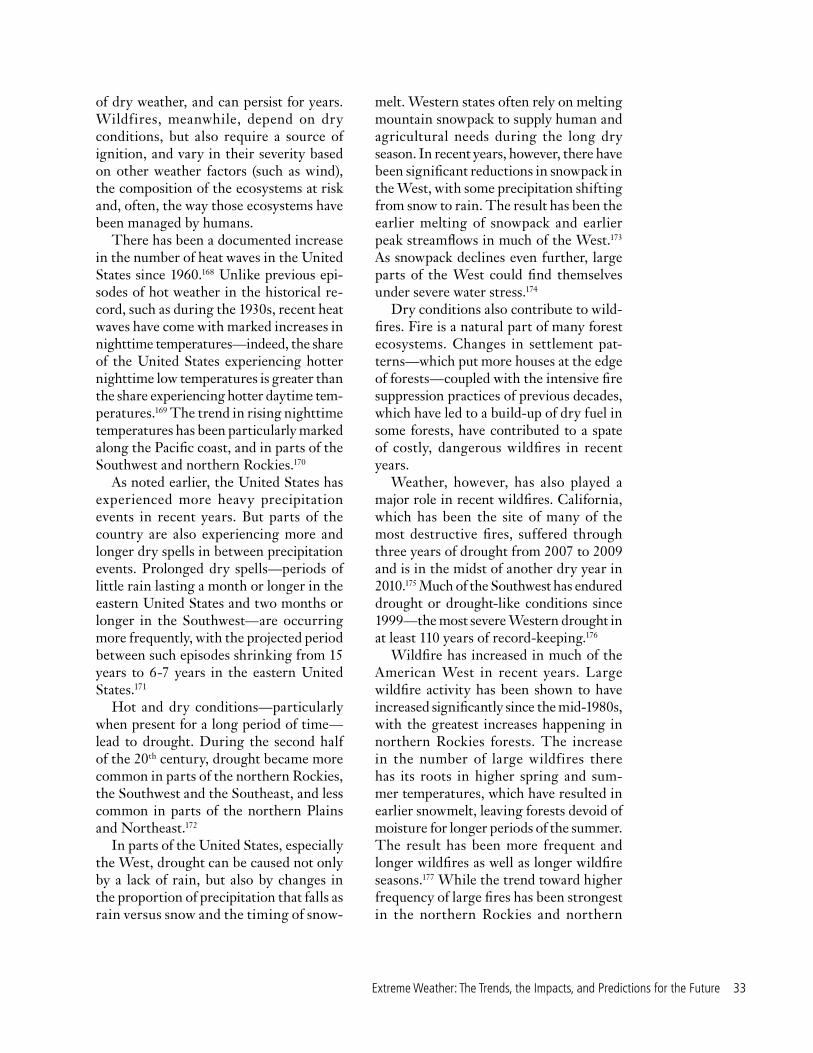
Extreme Weather: The Trends, the Impacts, and Predictions for the Future 33
of dry weather, and can persist for years. Wildfires, meanwhile, depend on dry conditions, but also require a source of ignition, and vary in their severity based on other weather factors (such as wind), the composition of the ecosystems at risk and, often, the way those ecosystems have been managed by humans.
There has been a documented increase in the number of heat waves in the United States since 1960.168 Unlike previous epi-sodes of hot weather in the historical re-cord, such as during the 1930s, recent heat waves have come with marked increases in nighttime temperatures—indeed, the share of the United States experiencing hotter nighttime low temperatures is greater than the share experiencing hotter daytime tem-peratures.169 The trend in rising nighttime temperatures has been particularly marked along the Pacific coast, and in parts of the Southwest and northern Rockies.170
As noted earlier, the United States has experienced more heavy precipitation events in recent years. But parts of the country are also experiencing more and longer dry spells in between precipitation events. Prolonged dry spells—periods of little rain lasting a month or longer in the eastern United States and two months or longer in the Southwest—are occurring more frequently, with the projected period between such episodes shrinking from 15 years to 6-7 years in the eastern United States.171
Hot and dry conditions—particularly when present for a long period of time—lead to drought. During the second half of the 20th century, drought became more common in parts of the northern Rockies, the Southwest and the Southeast, and less common in parts of the northern Plains and Northeast.172
In parts of the United States, especially the West, drought can be caused not only by a lack of rain, but also by changes in the proportion of precipitation that falls as rain versus snow and the timing of snow-
melt. Western states often rely on melting mountain snowpack to supply human and agricultural needs during the long dry season. In recent years, however, there have been significant reductions in snowpack in the West, with some precipitation shifting from snow to rain. The result has been the earlier melting of snowpack and earlier peak streamflows in much of the West.173 As snowpack declines even further, large parts of the West could find themselves under severe water stress.174
Dry conditions also contribute to wild-fires. Fire is a natural part of many forest ecosystems. Changes in settlement pat-terns—which put more houses at the edge of forests—coupled with the intensive fire suppression practices of previous decades, which have led to a build-up of dry fuel in some forests, have contributed to a spate of costly, dangerous wildfires in recent years.
Weather, however, has also played a major role in recent wildfires. California, which has been the site of many of the most destructive fires, suffered through three years of drought from 2007 to 2009 and is in the midst of another dry year in 2010.175 Much of the Southwest has endured drought or drought-like conditions since 1999—the most severe Western drought in at least 110 years of record-keeping.176
Wildfire has increased in much of the American West in recent years. Large wildfire activity has been shown to have increased significantly since the mid-1980s, with the greatest increases happening in northern Rockies forests. The increase in the number of large wildfires there has its roots in higher spring and sum-mer temperatures, which have resulted in earlier snowmelt, leaving forests devoid of moisture for longer periods of the summer. The result has been more frequent and longer wildfires as well as longer wildfire seasons.177 While the trend toward higher frequency of large fires has been strongest in the northern Rockies and northern
34 Global Warming and Extreme Weather
California, increases in large wildfire fre-quency have occurred throughout most of the western United States.178
Heat Waves, Drought and Wildfire in a Warming WorldHeat waves are projected to be more fre-quent, more intense, and last longer in a warming world. Parts of the United States are projected to experience more frequent or severe drought, and to experience an increase in wildfire activity.
Climate models project that the entire contiguous United States will experience a significant increase in the number of ex-treme heat days by the end of the century under a scenario in which global warming pollution continues unabated.179 By the end of the century, parts of the nation, particularly in the West, may experience a once-in-20-years heat event (based on the historical record) as frequently as once every other year.180
Heat waves and unusually hot seasons are also projected to become more com-mon in a warming world. Recent research projects that seasons as hot as the hottest on record for the second half of the 20th century will occur four to seven times per decade by the 2030s in much of the United States.181 Other research projects that the number of 90 degree days will increase dramatically by the end of the century, more than doubling in the southern part of the country.182
Extreme heat, coupled with an expected decline in summer precipitation across most of the United States, could contrib-ute to widespread summer drying and increased risk of drought. Climate models project that nearly the entire lower 48 states will experience more dry days by the end of the century, with strong agreement among the models across most of the country.183
Hot, dry conditions are expected to increase the risk of drought in much of the country. In the Northeast, climate models project an increase in the frequency of
short and medium-term droughts by the end of the century under two emission scenarios, with greater changes under a high-emission scenario.184
Climate models are in strong agreement that the Southwest will receive less annual precipitation, with significant reductions in soil moisture, over the course of the next century.185 Despite the Southwest’s reputation as an arid region, research into the long-term weather history of the western United States suggests that the first half of the 20th century—the period during which intense settlement of the area began—was actually an anomalously wet period in the region’s history and that the region has historically been subjected to “megadroughts” that are associated with warmer temperatures.186 (Similar findings have been made with regard to the historic climate record of the Southeast, which ex-perienced an unusually wet period during the 20th century in the context of the last thousand years and has experienced severe, prolonged drought in the past.)187
Higher temperatures, prolonged dry spells, and drought are also expected to contribute to an increase in wildfire activity in parts of the country.
Global warming is expected to bring major changes to America’s forests. Tree species are expected to move toward the north and upslope, while there are already signs of increasing destructive impacts from invasive species and insect pests, some of which may be linked to rising temperatures.188
On the whole, climate science predicts that conditions in the American West will change in ways that will bring about more frequent and more destructive wildfires. The area burned by wildfire in the west-ern United States is projected to increase over time as a result of climate change. 189 Recent trends toward more frequent and bigger fires in the interior West, Southwest and Alaska are projected to continue.190 A study of the western United States projects
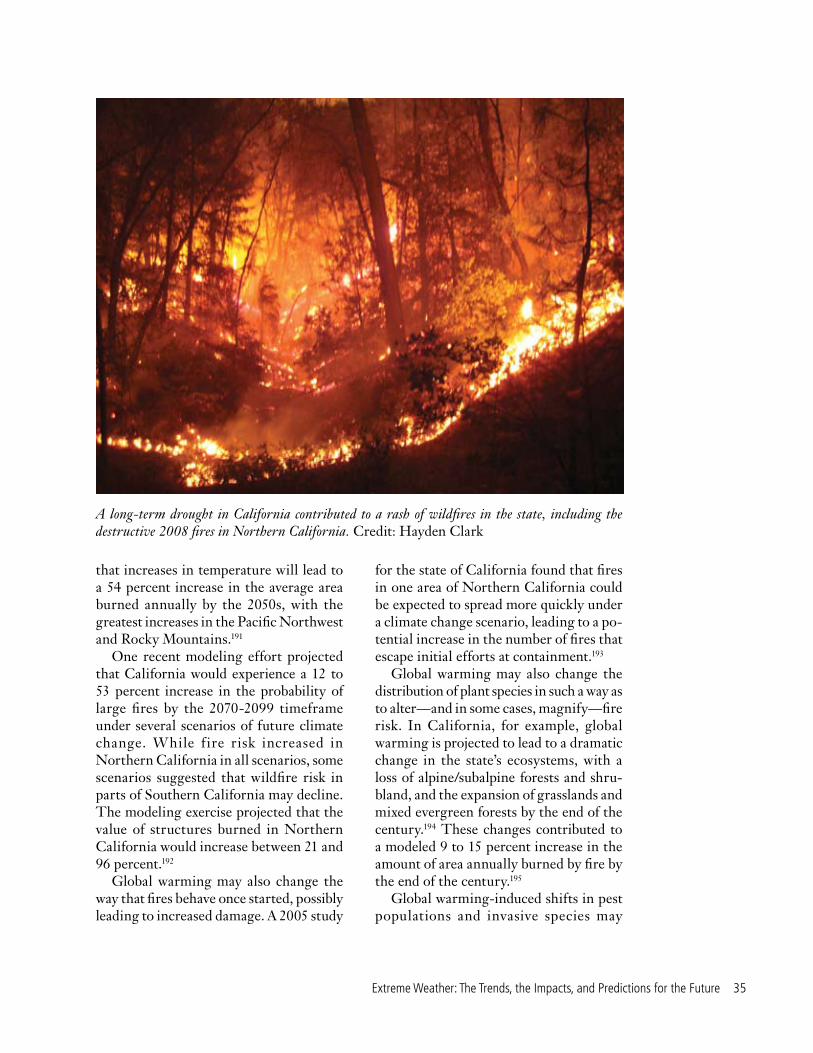
Extreme Weather: The Trends, the Impacts, and Predictions for the Future 3�
that increases in temperature will lead to a 54 percent increase in the average area burned annually by the 2050s, with the greatest increases in the Pacific Northwest and Rocky Mountains.191
One recent modeling effort projected that California would experience a 12 to 53 percent increase in the probability of large fires by the 2070-2099 timeframe under several scenarios of future climate change. While f ire risk increased in Northern California in all scenarios, some scenarios suggested that wildfire risk in parts of Southern California may decline. The modeling exercise projected that the value of structures burned in Northern California would increase between 21 and 96 percent.192
Global warming may also change the way that fires behave once started, possibly leading to increased damage. A 2005 study
for the state of California found that fires in one area of Northern California could be expected to spread more quickly under a climate change scenario, leading to a po-tential increase in the number of fires that escape initial efforts at containment.193
Global warming may also change the distribution of plant species in such a way as to alter—and in some cases, magnify—fire risk. In California, for example, global warming is projected to lead to a dramatic change in the state’s ecosystems, with a loss of alpine/subalpine forests and shru-bland, and the expansion of grasslands and mixed evergreen forests by the end of the century.194 These changes contributed to a modeled 9 to 15 percent increase in the amount of area annually burned by fire by the end of the century.195
Global warming-induced shifts in pest populations and invasive species may
A long-term drought in California contributed to a rash of wildfires in the state, including the destructive 2008 fires in Northern California. Credit: Hayden Clark
36 Global Warming and Extreme Weather
further increase fire risk. The invasion of non-native grassland species in arid por-tions of the West is expected to increase fire risk in these regions.196 In addition to the threats to property, the loss of iconic plants of the Southwest—including the saguaro cactus and the Joshua tree—is considered likely.197
As noted earlier, the changes that global warming will impose on western forests are complex and multi-faceted, such that wildfire trends differ by location. In some pockets of the West, global warming could result in reduced fire risk, as a reduction in moisture inhibits plant growth, reducing the availability of fuel. 198
While this discussion has thus far been focused on the West, the risk of damag-ing wildfires may increase in other parts of the United States as well.199 According to one recent modeling exercise, fire po-tential would increase across the country, with the potential for fires moving from “low” to “moderate” in the southeastern and northwestern United States, and fire potential increasing in the Northeast and Southwest as well.200
Notable Recent Heat Waves, Droughts, and WildfiresHeat waves, droughts and wildfires are all related phenomena linked with higher tem-peratures and dry conditions. But they have very different impacts, with heat waves primarily causing damage in the form of premature death, droughts hampering crop growth and straining water supplies, and wildfires damaging forests and threatening human settlements.
Since 2005, major droughts have im-posed damages and other costs exceeding $19 billion in the United States. Wildfires have caused more than $1 billion in dam-ages each year since 2006.201 Deadly heat waves have hit parts of the United States each year since 2005, including 2010. The following examples illustrate damage caused by these types of events.
U.S. Heat Wave (2006)
NationwideDuring July and August 2006, much of the United States was affected by a strong and unusually long-lasting heat wave. The heat wave set 50 new all-time high temperature records in the central and western United States.202 The month of July was the second-hottest July on record nationwide.203
The heat wave had lethal impacts across the country, including on both coasts. In California, county coroners reported 147 deaths resulting from the heat wave, though a subsequent analysis found that the true number of deaths from the heat wave could have been two to three times that number.204 In New York City, 40 people were reported to have died of heat stroke, while public health officials estimated that the heat contributed to the deaths of an additional 100 people.205
California Drought and Wildfires (2008)
CaliforniaThe spring of 2008 was the driest one on record for Northern California, with Gov-ernor Arnold Schwarzenegger declaring the first statewide drought in 17 years.206 Sacramento saw only 0.17 inches of rain, less than a third of the previous record low of 0.55 inches in 1934.207 San Francisco was similarly dry, with only 0.67 inches of rain falling from March to May, the low-est amount since record-keeping began in 1850.208 Rare dry lightning strikes on June 20 and 21 ignited thousands of fires in Northern California, burning more than 1.2 million acres.209
CalFire, the state’s fire-fighting agen-cy, spent about $204 million in June battling these Northern California fires, almost matching the $225 million it typically spends in a year for the entire state.210 Gov. Schwarzenegger was forced to mobilize military forces for the first
Extreme Weather: The Trends, the Impacts, and Predictions for the Future 3�
time since 1977 to help battle the blaze.211 Costs from fighting these and other wildfires throughout the West forced $400 million in spending cuts by the U.S. Forest Service, causing closures of campgrounds and forest access through-out the region.212 Health in the region also suffered, as smoke created unhealthy levels of particulates in the air. Economic activity was slowed by the closure of six highways,213 and more than 30 homes were destroyed.214 These fires contrib-uted heavily to more than $1.7 billion in overall federal and state fire suppression costs in the state that year.215
Southeast Drought and Wildfires (2007)
Georgia, Florida, North Carolina, South Carolina, Tennessee, AlabamaA period of dry weather dating back to 2005 blossomed into a catastrophic drought in much of the Southeast during 2007. Low levels of precipitation, coupled with hot temperatures, left much of the Southeast exceptionally dry. As of August of that year, 2007 was the driest year-to-date on record
for the Southeast region.216 At one point, 83 percent of the Southeast was in moderate to exceptional drought.217
The drought created massive water supply problems as reservoirs and streams shrank. It also caused significant reduction in the yield of various agricultural crops, costing southeastern farmers an estimated $1.3 billion.218
The drought also contributed to an unprecedented outbreak of wildfires. Wildfires are common in the Southeast during the summer months, but the 2007 wildfires that swept through parts of Geor-gia and Florida were the worst to strike the region in recorded history, burning for more than two months and consuming more than 560,000 acres of forest.219 Hot, dry weather—coupled with a build-up of fuel in the state’s forests—helped the fires to explode dramatically and defy normal fire-fighting techniques.
Despite striking a lightly populated area of the state, and destroying only nine homes, the cost imposed by fire suppres-sion and property damage exceeded $100 million.220
38 Global Warming and Extreme Weather
Extreme weather events impose massive costs on the nation and threaten the health and survival both of people af-
fected by those events and of treasured eco-systems. Recent scientific findings about the potential impacts of global warming on extreme weather patterns provide yet another reason for the world to take action against global warming.
Climate science suggests that there is still time for the world to avoid the worst impacts of global warming—if we take immediate action to reduce emissions of global warming pollutants. While all na-tions in the world have an important role to play in curbing emissions, the United States—as the world’s second-leading emit-ter of global warming pollution and the nation responsible for more of the human-caused carbon dioxide in the atmosphere than any other—has a special responsibility to lead.
The nation should move immediately to adopt policies that will reduce America’s emissions of global warming pollution. Specifically:
• The United States and the world
should adopt measures designed to prevent an increase in global average temperatures of more than 2° C (3.6° F) above pre-industrial levels—a com-mitment that would enable the world to avoid the most damaging impacts of global warming.
• The United States should commit to emission reductions equivalent to a 35 percent reduction in global warming pollution from 2005 levels by 2020 and an 83 percent reduction by 2050, with the majority of near-term emis-sion reductions coming from the U.S. economy (instead of through reducing or offsetting emissions in other parts of the world). A variety of policy mea-sures can be used to achieve this goal, including:
oA cap-and-trade system that puts a price on emissions of global warm-ing pollutants.
oA renewable energy standard to promote the use of clean renewable energy.
Conclusions and Recommendations
Conclusions and Recommendations 39
oA strong energy efficiency resource standard for utilities that maximiz-es the use of cost-effective energy efficiency improvements.
oEnhanced energy efficiency stan-dards for appliances and vehicles and stronger energy codes for new or renovated commercial and resi-dential buildings.
oInvestments in low-carbon trans-portation infrastructure—includ-ing transit and passenger rail—and to support a transition away from oil to plug-in and other alternative vehicles.
oRetention of the EPA’s author-ity to require reductions in global warming pollution at power plants,
as well as retention of state author-ity to go beyond federal minimum standards in reducing global warm-ing pollution.
• State and local governments should adopt similar measures to reduce glob-al warming pollution and encourage a transition to clean energy.
In addition, federal, state and local officials should take steps to better protect the public from the impact of extreme weather events. Government officials should explicitly factor the potential for global warming-induced changes in extreme weather patterns into the design of public infrastructure and revise policies that encourage construction in areas likely to be at risk of flooding in a warming climate.
40 Global Warming and Extreme Weather
1 Intergovernmental Panel on Climate Change, “Summary for Policymakers” in S. Solomon, et al. (eds.), Climate Change 2007: The Physical Science Basis, Contribution of Working Group I to the Fourth Assessment Report of the Intergovernmental Panel on Climate Change, 2007.
2 “Heavy precipitation”: Kevin E. Trenberth, Philip D. Jones, et al., “Observations: Surface and Atmospheric Climate Change” in S. Solomon, et al. (eds.), Climate Change 2007: The Physical Science Basis, Contribution of Working Group I to the Fourth Assessment Report of the Intergovernmental Panel on Climate Change, 2007.
3 Intergovernmental Panel on Climate Change, Climate Change 2007: Synthesis Report: Contribution of Working Groups I, II and III to the Fourth Assessment Report of the Intergovernmental Panel on Climate Change, 2007.
4 Ibid.
5 Ibid.
6 National Research Council, Advancing the Science of Climate Change (prepublication copy), National Academies Press, 2010, 17.
7 Jacob Palis, Jr., et al., G8+5 Academies Joint Statement: Climate Change and the Transformation of Energy Technologies for a Low
Carbon Future, May 2009.
8 William R.L. Anderegg, et al., “Expert Credibility in Climate Change,” Proceedings of the National Academy of Sciences, doi: 10.1073/pnas.1003187107, published online 21 June 2010.
9 Thomas R. Karl, Jerry M. Melillo and Thomas C. Peterson (eds.), U.S. Global Change Research Program, Global Climate Change Impacts in the United States, 2009.
10 Ibid.
11 Ibid.
12 Nathaniel L. Bindoff, Jurgen Willebrand, et al., “Observations: Oceanic Climate Change and Sea Level” in S. Solomon, et al. (eds.), Climate Change 2007: The Physical Science Basis, Contribution of Working Group I to the Fourth Assessment Report of the Intergovernmental Panel on Climate Change, 2007.
13 Axel Graumann, et al., National Oceanic and Atmospheric Administration, National Climatic Data Center, Hurricane Katrina: A Climatological Perspective, updated August 2006.
14 See note 9.
15 Ibid.
16 Peter Lemke and Jiawen Ren, et al., “Observations: Changes in Snow, Ice and
Notes
Notes 41
Frozen Ground,” in S. Solomon, et al. (eds.), Climate Change 2007: The Physical Science Basis, Contribution of Working Group I to the Fourth Assessment Report of the Intergovernmental Panel on Climate Change, 2007.
17 National Snow and Ice Data Center, State of the Cryosphere: Northern Hemisphere Snow, downloaded from nsidc.org/sotc/snow_extent.html, 14 July 2010.
18 Philip W. Mote, et al., “Declining Mountain Snowpack in Western North America,” Bulletin of the American Meteorological Society, January 2005.
19 I. Allison, et al., The Copenhagen Diagnosis: Updating the World on the Latest Climate Science, University of New South Wales Climate Research Center, 2009.
20 Martin Vermeer and Stefan Rahmstorf, “Global Sea Level Linked to Global Temperature,” Proceedings of the National Academy of Sciences, doi: 10.1073_pnas.0907765106, published online 7 December 2009.
21 See note 9.
22 A.P.M. Baede, ed., “Annex I: Glossary,” in S. Solomon, et al. (eds.), Climate Change 2007: The Physical Science Basis, Contribution of Working Group I to the Fourth Assessment Report of the Intergovernmental Panel on Climate Change, 2007.
23 Ibid.
24 National Oceanic and Atmospheric Administration, National Weather Service, Summary of Natural Hazard Statistics for 2008 in the United States, 28 January 2010.
25 Ibid.
26 Virginia Burkett, U.S. Geological Survey, Natural Barriers: To Serve and Protect (Powerpoint presentation), 9 March 2006.
27 A. Sallenger, et al., “Barrier Island Failure During Hurricane Katrina” (abstract), American Geophysical Union Fall Meeting 2006, Abstract H31I-O3, 2006.
28 Piñon pines: M. Lisa Floyd, et al., “Rela-tionship of Stand Characteristics to Drought-Induced Mortality in Three Southwestern Piñon-Juniper Woodlands,” Ecological Applica-tions, 19(5): 1223-1230, 2009; “Most extensive die-off”: Hope Hamashige, “Drought Causing
Record Forest Destruction in U.S. Southwest,” National Geographic News, 5 December 2005.
29 Robert A. Robinson, U.S. Government Accountability Office, Wildland Fire Suppression: Better Guidance Needed to Clarify Sharing of Costs Between Federal and Nonfederal Entities, testimony before the Subcommittee on Public Lands and Forests, Committee on Energy and Natural Resources, U.S. Senate, 21 June 2006.
30 Erica Brown Gaddis, et al. “Full-Cost Accounting of Coastal Disasters in the United States: Implications for Planning and Preparedness,” Ecological Economics, 63: 307-318, doi:10.1016/j.ecolecon.2007.01.015, 2007.
31 Roger A. Pielke, Jr., et al., “Normalized Hurricane Damage in the United States: 1900-2005,” Natural Hazards Review, 9(1):29-42, February 2008.
32 Roger A. Pielke, Jr., Mary W. Downton and J. Zoe Barnard Miller, Flood Damage in the United States: 1926-2006, A Reanalysis of National Weather Service Estimates, June 2002.
33 See note 13.
34 Kevin E. Trenberth and John Fasullo, “Energy Budgets of Atlantic Hurricanes and Changes from 1970,” Geochemistry, Geophysics, Geosystems, 9(9), doi: 10.1029/2007GC001847, 18 September 2008.
35 James B. Elsner, James P. Kossin and Thomas H. Jagger, “The Increasing Intensity of the Strongest Tropical Cyclones,” Nature, 455: 92-95, doi: 10.1038/nature07234, 4 September 2008.
36 Morris A. Bender, et al., “Modeled Impact of Anthropogenic Warming on the Frequency of Intense Atlantic Hurricanes,” Science, 327(5964):454-458, doi: 10.1126/science.1180568, 22 January 2010. Supporting materials available on-line at www.sciencemag.org/cgi/data/327/5964/454/DC1/1.
37 Kerry Emanuel, “Environmental Factors Affecting Tropical Cyclone Power Dissipation,” Journal of Climate, 20:5497-5509, doi: 10.1175/2007JCLI1571.1, 15 November 2007.
38 See note 34.
39 See note 37.
40 “have been linked”: World
42 Global Warming and Extreme Weather
Meteorological Organization, Statement on Tropical Cyclones and Climate Change, November 2006.
41 Gerard A. Meehl, Thomas F. Stocker, et al., “Global Climate Projections,” in S. Solomon, et al. (eds.), Climate Change 2007: The Physical Science Basis, Contribution of Working Group I to the Fourth Assessment Report of the Intergovernmental Panel on Climate Change, 2007.
42 Mark A. Saunders and Adam S. Lea, “Large Contribution of Sea Surface Warming to Recent Increase in Atlantic Hurricane Activity,” Nature, 451: 557-561, doi:10.1038/nature06422, 31 January 2008.
43 Greg J. Holland and Peter J. Webster, “Heightened Tropical Cyclone Activity in the North Atlantic: Natural Variability or Climate Trend?” Philosophical Transactions of the Royal Society A, doi: 10.1098/rsta.2007.2083, 365: 2695-2716, 2007.
44 Christopher W. Landsea, et al., “Impact of Duration Thresholds on Atlantic Tropical Cyclone Counts,” Journal of Climate, 23: 2508-2519, 2010.
45 Increase in strength of hurricanes was considered “likely” (better than two-in-three chance of occurring), by IPCC, see note 41.
46 The level of confidence in this finding is “more likely than not,” meaning a greater than 50 percent probability: Thomas R. Knutson, et al., “Tropical Cyclones and Climate Change,” Nature Geoscience 3: 157-163, doi: 10.1038/ngeo779, March 2010.
47 Thomas R. Knutson, et al., “Tropical Cyclones and Climate Change,” Nature Geoscience 3: 157-163, doi: 10.1038/ngeo779, March 2010.
48 Kerry Emanuel, Ragoth Sundararajan and John Williams, “Hurricanes and Global Warming: Results from Downscaling IPCC AR4 Simulations,” Bulletin of the American Meteorological Society, March 2008.
49 See note 36.
50 National Oceanic and Atmospheric Administration, National Climatic Data Center, Billion Dollar U.S. Weather Disasters, downloaded from www.ncdc.noaa.gov/oa/reports/billionz.html, 24 June 2010.
51 Ibid.
52 Robbie Berg, National Hurricane Center, Tropical Cyclone Report: Hurricane Ike, updated 3 May 2010.
53 U.S. Minerals Management Service, Minerals Management Service Updates Ike Damage Assessments (press release), 18 September 2008.
54 Associated Press, “AP Investigation: Hurricane Ike Environmental Toll Apparent,” Dallas Morning News, 5 October 2008.
55 Bruce Nichols and Erwin Seba, “Hurricane Ike Hits Heart of U.S. Oil Sector,” Reuters, 13 September 2008.
56 Clifford Krauss and James C. McKinley, Jr., “Hurricane Damage Extensive in Texas,” New York Times, 13 September 2008.
57 Ben Casselman, “Planning the ‘Ike Dike’ Defense,” Wall Street Journal, 4 June 2009.
58 See note 52.
59 National Oceanic and Atmospheric Administration, NOAA Reviews Record-Setting 2005 Atlantic Hurricane Season, updated 13 April 2006.
60 Richard J. Pasch, et al., National Hurricane Center, Tropical Cyclone Report: Hurricane Wilma, 15-25 October 2005, 12 January 2006.
61 Ibid.
62 Kennard Chip Kaiser, National Weather Service, Key West Forecast Office, Hurricane Wilma in the Florida Keys, downloaded from www.srh.noaa.gov/key/?n=wilma, 15 July 2010.
63 U.S. Census Bureau, Coastline Population Trends in the United States: 1960 to 2008, May 2010.
64 Stephen K. Gill, et al., “Population, Land Use and Infrastructure,” in James G. Titus, et al., U.S. Climate Change Science Program, Coastal Sensitivity to Sea Level Rise: A Focus on the Mid-Atlantic Region, January 2009.
65 National Oceanic and Atmospheric Administration, National Weather Service, Service Assessment: Hurricane Isabel: September 18-19, 2003, May 2004.
66 See note 19.
67 1,900 square miles: See note 9.
Notes 43
68 National Oceanic and Atmospheric Administration, Linear Mean Sea Level (MSL) Trends and 95% Confidence Intervals in Feet/Century, downloaded from tidesandcurrents.noaa.gov/sltrends/msltrendstablefc.htm, 25 June 2010. Please see linked Web site for 95% confidence intervals and dates of first measurement.
69 U. Ulbrich, G.C. Leckebusch and J.G. Pinto, “Extra-Tropical Cyclones in the Present and Future Climate: A Review,” Theoretical and Applied Climatology, 96: (1-2) 117-131, doi: 10.1007/s00704-008-0083-8, April 2009.
70 Xiaolan L. Wang, Val R. Swail and Francis W. Zwiers, “Climatology and Changes of Extratropical Cyclone Activity: Comparison of ERA-40 with NCEP-NCAR Reanalysis for 1958-2001,” Journal of Climate, 19: 3145-3166, doi: 10.1175/JCLI3781.1, 1 July 2006.
71 Peter Ruggiero, Paul D. Komar and Jona-than C. Allan, “Increasing Wave Heights and Extreme Value Projections: The Wave Climate of the U.S. Pacific Northwest,” Coastal Engi-neering, 57(5): 539-552, doi: 10.1016/j.coastaleng.2009.12.005, May 2010.
72 Oregon State University, Maximum Height of Extreme Waves Up Dramatically in Pacific Northwest (press release), 25 January 2010.
73 Sergey K. Gulev and Vika Grigorieva, “Last Century Changes in Ocean Wind Wave Height from Global Visual Wave Data,” Geophysical Research Letters, 31: L24302, doi:10.1029/2004GL021040, 2004.
74 P.D. Komar and J.C. Allan, “Higher Waves along U.S. East Coast Linked to Hurricanes,” Eos, 88(30): 301-308, 24 July 2007.
75 See note 1.
76 Peter U. Clark, Andrew J. Weaver, et al., “Executive Summary,” in U.S. Climate Change Science Program, Abrupt Climate Change, December 2008.
77 See note 20.
78 James G. Titus, Russell Jones and Richard Streeter, “Area of Land Close to Sea Level by State,” Section 1.2 Appendix in J.G. Titus and E.M. Strange (eds.), Background Documents Sup-porting Climate Change Science Program Synthesis
and Assessment Product 4.1: Coastal Elevations and Sensitivity to Sea Level Rise.
79 Union of Concerned Scientists, New York: Confronting Climate Change in the U.S. Northeast, downloaded from www.climatechoices.org/assets/documents/climatechoices/new-york_necia.pdf, 6 July 2010.
80 Joanne R. Potter, Michael J. Savonis and Virginia R. Burkett, “Executive Summary” in U.S. Climate Change Science Program, Impacts of Climate Change and Variability on Transportation Systems and Infrastructure: Gulf Coast Study, Phase I, March 2008.
81 Brian A. Colle, Katherine Rojowsky and Frank Buonaito, “New York City Storm Surges: Climatology and an Analysis of the Wind and Cyclone Evolution,” Journal of Applied Meteorology and Climatology, 49: 85-100, doi: 10.1175/2009JAMC2189.1, January 2010.
82 Jianjun Yin, Michael E. Schlesinger and Ronald J. Stouffer, “Model Projections of Rapid Sea-Level Rise on the Northeast Coast of the United States,” Nature Geoscience, 2: 262-266, doi: 10.1038/ngeo462, 15 March 2009.
83 See note 69.
84 W.J. Gutkowski, et al., “Causes of Observed Changes in Extremes and Projections of Future Changes,” in T.R. Karl, et al. (eds.), U.S. Climate Change Science Program, Weather and Climate Extremes in a Changing Climate, Regions of Focus: North America, Hawaii, Caribbean and U.S. Pacific Islands, June 2008. See also: Steven J. Lambert and John C. Fyfe, “Changes in Winter Cyclone Frequencies and Strengths Simulated in Enhanced Greenhouse Warming Experiments: Results from the Models Participating in the IPCC Diagnostic Exercise,” Climate Dynamics, 26: 713-728, doi: 10.1007/s00382-006-0110-3, June 2006.
85 “No intensification …” Lennart Bengtsson, Kevin I. Hodges and Noel Keenlyside, “Will Extratropical Storms Intensify in a Warming Climate?” Journal of Climate, 22(9): 2276-2301, doi: 10.1175/2008JCLI2678.1 , May 2009.
86 Ibid.
44 Global Warming and Extreme Weather
87 Jing Jiang and William Perrie, “The Impacts of Climate Change on Autumn North Atlantic Midlatitude Cyclones,” Journal of Climate, 20: 1174-1187, doi: 10.1175/JCLI4058.1, 1 April 2007.
88 See note 85.
89 Kristina Hill and Jonathan Barnett, “Design for Rising Sea Levels,” Harvard Design Magazine, Fall 2007/Winter 2008.
90 Neal Lott, National Climatic Data Center, The Big One! A Review of the March 12-14, 1993 “Storm of the Century,” 14 May 1993.
91 See note 50.
92 Washington State Department of Natural Resources, Tree Blowdown Aerial Survey: Dates Flown March 6-7, 2008, Washington Coast, undated.
93 Dartmouth Flood Observatory, 2007 Global Register of Major Flood Events, downloaded from www.dartmouth.edu/~floods/Archives/2007sum.htm, 6 July 2010.
94 Maryanne Reiter, Weyerhaeuser Company, December 1-4, 2007 Storm Events Summary, 8 February 2008.
95 $180 million: Erik A. Knoder, Oregon Employment Department, Storm Damage, 25 January 2008; “possibly more than a billion”: Hal Bernton and Ralph Thomas, “Flood-Damaged I-5 to Stay Closed Until this Weekend,” Seattle Times, 5 December 2007.
96 National Oceanic and Atmospheric Administration, National Climatic Data Center, State of the Climate: Global Hazards: January 2010, downloaded from www.ncdc.noaa.gov/sotc/?report=hazards&year=2010&month=1, 15 July 2010.
97 National Oceanic and Atmospheric Administration, National Climatic Data Center, State of the Climate: Tornadoes: January 2010, downloaded from lwf.ncdc.noaa.gov/sotc/?report=tornadoes&year=2010&month=1, 15 July 2010.
98 National Oceanic and Atmospheric Administration, National Weather Service, Local Service Assessment: 18-23 January 2010 Arizona Winter Storms, undated.
99 Ibid.
100 See note 92.
101 See note 50.
102 See note 2.
103 Kenneth Kunkel, et al., “Observed Changes in Weather and Climate Extremes” in Thomas R. Karl, et al. (eds.), U.S. Climate Change Science Program, Weather and Climate Extremes in a Changing Climate, June 2008.
104 Pavel Ya. Groisman, et al., “Contemporary Changes of the Hydrological Cycle over the Contiguous United States: Trends Derived from In Situ Observations,” Journal of Hydrometeorology, 5: 64-84, February 2004.
105 Travis Madsen and Emily Figdor, Environment America Research & Policy Center, When it Rains, it Pours: Global Warming and the Rising Frequency of Extreme Precipitation in the United States, December 2007.
106 Arthur T. DeGaetano, “Time-Dependent Changes in Extreme-Precipitation Return-Period Results in the Continental United States,” Journal of Applied Meteorology and Climatology, 48: 2086-2099, doi: 10.1175/2009JAMC2179.1, 2009.
107 Ibid.
108 See note 9.
109 See note 103.
110 Ibid.
111 See note 9.
112 See note 105.
113 See note 9.
114 See note 105.
115 Jens Hesselbjerg Christensen, Bruce Hewitson, et al., “Regional Climate Projections,” in Intergovernmental Panel on Climate Change, Climate Change 2007: The Physical Science Basis, Contribution of Working Group I to the Fourth Assessment Report of the Intergovernmental Panel on Climate Change, 2007.
116 See note 9.
117 Christopher B. Field, Linda D. Mortsch, et al., “North America,” in Intergovernmental Panel on Climate Change, Climate Change 2007: Impacts,
Notes 4�
Adaptation and Vulnerability, Contribution of Working Group II to the Fourth Assessment Report of the Intergovernmental Panel on Climate Change, 2007.
118 Yukiko Hirabayashi, et al., “Global Projections of Changing Risks of Floods and Droughts in a Changing Climate,” Hydrological Sciences, 53(4): 754-772, August 2008.
119 Ibid.
120 P.C.D. Milly, et al., “Increasing Risk of Great Floods in a Changing Climate,” Nature, 415: 514-517, doi:10.1038/415514a, 31 January 2002.
121 Rawle O. King, Congressional Research Service, Federal Flood Insurance: The Repetitive Loss Problem, 30 June 2005.
122 National Oceanic and Atmospheric Administration, National Climatic Data Center, 2008 Midwestern Floods, downloaded from www.ncdc.noaa.gov/special-reports/2008-floods.html, 15 July 2010.
123 Grant Schulte, “A Year After Devastating Flood, Cedar Rapids Fights Back,” USA Today, 16 June 2009.
124 Tony Leys, “U.S. Experts Hesitate to Rank Iowa’s Disaster,” Des Moines Register, 14 July 2008.
125 Rebuild Iowa Office, Facts & Figures, downloaded from www.rio.iowa.gov/resources/facts.html, 6 July 2010.
126 See note 124.
127 George Ford, “Small Business Owners Losing Hope for Flood Aid,” The Gazette, 7 June 2010.
128 See note 124.
129 Associated Press, “$517M in Federal Disaster Funds Announced for Iowa,” ClaimsJournal.com, 11 June 2009.
130 See note 122.
131 National Oceanic and Atmospheric Administration, National Climatic Data Center, State of the Climate: Global Hazards: March 2010, downloaded from www.ncdc.noaa.gov/sotc/?report=hazards&year=2010&month=3, 6 July 2010.
132 Oren Dorell, “R.I. Flooding: ‘It Makes You Want to Cry,’” USA Today, 5 April 2010.
133 See note 131.
134 Associated Press, “Weeks After RI Flooding, Cleanup, Tough Choices,” The Hour, 23 April 2010.
135 CBS and Associated Press, “Floods Put Rhode Island Economy Under Water,” CBSNews.com, 1 April 2010.
136 See note 134.
137 National Oceanic and Atmospheric Administration, National Climatic Data Center, State of the Climate: Global Hazards: October 2005, downloaded from www.ncdc.noaa.gov/sotc/index.php?report=hazards&year=2005&month=oct, 6 July 2010.
138 National Oceanic and Atmospheric Administration, National Weather Service, Taunton, Mass. Forecast Office, Public Information Statement: Spotter Reports, 637 PM EDT WED MAY 17 2006, 17 May 2006.
139 Phillip J. Zarriello and Carl S. Carlson, U.S. Geological Survey, Characteristics of the April 2007 Flood at 10 Streamflow-Gaging Stations in Massachusetts, 2009.
140 William H. Armstrong, IV, Mathias J. Collins and Noah P. Snyder, “Evidence for Increased Flood Risk in New England Over the Past Century Using Statistical Analysis of the Partial Duration Flood Series” (abstract), Geological Society of America Abstracts with Programs, 42(1): 146, 2010.
141 Bobby Boyd, National Weather Service, Flood of May 2010, downloaded from www.srh.noaa.gov/news/display_cmsstory.php?wfo=ohx&storyid=51976&source=0, 6 July 2010.
142 National Oceanic and Atmospheric Administration, National Climatic Data Center, State of the Climate: Global Hazards: May 2010, downloaded from www.ncdc.noaa.gov/sotc /?report=hazards&year=2010&month=5&submitted=Get+Report, 6 July 2010.
143 Associated Press, “Damages at $1.5 Billion, Climbing in Nashville,” WMCTV.com, 7 May 2010.
144 Sheila Burke and Travis Loller, Associated Press, “Nashville Flood Death Rises to 30,” Salon.com, 6 May 2010.
145 See note 9.
146 Stanley A. Changnon, David Changnon and Thomas R. Karl, “Temporal and Spatial Characteristics of Snowstorms in the
46 Global Warming and Extreme Weather
Contiguous United States,” Journal of Applied Meteorology and Climatology, 45: 1141-1155, doi: 10.1175/JAM2395.1, August 2006.
147 See note 103.
148 See note 146.
149 See note 9.
150 Adam W. Burnett, et al., “Increasing Great Lake-Effect Snowfall During the Twentieth Century: A Regional Response to Global Warming?” Journal of Climate, 16: 3535-3542, 1 November 2003.
151 See note 9.
152 Ibid.
153 Ibid.
154 National Oceanic and Atmospheric Administration, National Weather Service, Baltimore/Washington Forecast Office, History of Big Winter Storms, downloaded from www.erh.noaa.gov/lwx/winter/storm-pr.htm, 6 July 2010.
155 National Oceanic and Atmospheric Administration, National Weather Service, Baltimore/Washington Forecast Office, Public Information Statement: 139 PM EST THU FEB 11 2010, 11 February 2010.
156 National Oceanic and Atmospheric Administration, National Weather Service, Baltimore/Washington Forecast Office, Public Information Statement: 1030 PM EST SAT FEB 06 2010, 6 February 2010.
157 Dennis Chesters and Rob Gutro, National Aeronautics and Space Administration, GOES Satellite Movie Captures Record-Setting February Blizzards in Washington, downloaded from www.nasa.gov/topics/earth/features/snow-record.html, 7 July 2010.
158 David Morgan, et al., “Blizzard Paralyzes U.S. Mid-Atlantic; Two Killed,” Reuters, 6 February 2010.
159 Carol Morello and Ashley Halsey, III, “Historic Snowstorm in D.C. Leaves a Mess to Be Reckoned With,” Washington Post, 7 February 2010.
160 National Oceanic and Atmospheric Administration, National Climatic Data Center, State of the Climate: Global Analysis February 2010, downloaded from www.ncdc.noaa.gov/sotc/
?report=hazards&year=2010&month=2, 7 July 2010.
161 Ewen MacAskill, “Washington D.C. Paralyzed by Snow for Fifth Working Day in a Row,” The Guardian, 11 February 2010.
162 See note 158.
163 See note 160.
164 National Oceanic and Atmospheric Administration, National Climatic Data Center, State of the Climate: Global Hazards: June 2010, downloaded from www.ncdc.noaa.gov/sotc /?report=hazards&year=2010&month=5&submitted=Get+Report, 15 July 2010.
165 See note 50.
166 Eleanor J. Burke, Simon J. Brown and Nikolaos Christidis, “Modeling the Recent Evolution of Global Drought and Projections for the Twenty-First Century with the Hadley Climate Centre Model,” Journal of Hydrometeorology, 7: 1113-1125, October 2006.
167 U.S. Centers for Disease Control and Prevention, Emergency Preparedness and Response: Extreme Heat: A Prevention Guide to Promote Your Personal Health and Safety, downloaded from www.bt.cdc.gov/disasters/extremeheat/heat_guide.asp, 13 July 2010.
168 See note 103.
169 Ibid.
170 Ibid.
171 Pavel Ya. Groisman and Richard W. Knight, “Prolonged Dry Episodes over the Conterminous United States: New Tendencies Emerging during the Last 40 Years,” Journal of Climate, 21(9): 1850-1862, doi: 10.1175/2007JCLI2013.1, May 2008.
172 See note 9.
173 Ibid.
174 Ibid.
175 National Oceanic and Atmospheric Administration, National Climatic Data Center, State of the Climate: Drought: Annual 2009, downloaded from www.ncdc.noaa.gov/sotc/index.php?report=drought&year=2009&month=ann, 24 June 2010.
176 See note 9.
177 A.L. Westerling, et al., “Warming and Earlier Spring Increase Western U.S. Forest
Notes 4�
Wildfire Activity,” Science, 313: 940-943, 18 August 2006.
178 Ibid.
179 See note 9.
180 Ibid.
181 N.S. Diffenbaugh and M. Ashfaq, “Intensification of Hot Extremes in the United States,” Geophysical Research Letters, 37:L15701, doi:10.1029/2010GL043888, 2010.
182 See note 9.
183 Bryson Bates, et al. (eds.), Climate Change and Water, technical paper of the Intergovernmental Panel on Climate Change, 2008.
184 Katharine Hayhoe, et al., “Past and Future Changes in Climate and Hydrological Indicators in the U.S. Northeast,” Climate Dynamics, doi: 10.1007/s00382-006-0187-8, 2006.
185 See note 183.
186 Edward R. Cook, et al., “Long-Term Aridity Changes in the Western United States,” Science, 306: 1015-1018, 5 November 2004.
187 Richard Seager, et al., “Drought in the Southeastern United States: Causes, Variability Over the Last Millennium, and the Potential for Future Hydroclimate Change,” Journal of Climate, 22: 5021-5045, doi: 10.1175/2009JCLI2683.1, 1 October 2009.
188 See note 9.
189 Ibid.
190 Peter Backlund, et al., “Executive Summary,” in U.S. Climate Change Science Program, The Effects of Climate Change on Agriculture, Land Resources, Water Resources and Biodiversity in the United States, 2008.
191 Domenick V. Spracklen, et al., “Impacts of Climate Change from 2000 to 2050 on Wildfire Activity and Carbonaceous Aerosol Concentrations in the Western United States,” Journal of Geophysical Research, 114: D20301, doi:10.1029/2008JD010966, 2009.
192 A.L. Westerling and B.P. Bryant, “Climate Change and Wildfire in California,” Climatic Change, 87 (Suppl 1): S231-S249, doi: 10.1007/s10584-007-9363-z , 2008.
193 Jeremy S. Fried, et al., Predicting the Effect of Climate Change on Wildfire Severity and Outcomes in California: Preliminary Analysis, California Climate Change Center, March 2006.
194 James M. Lenihan, et al., “Response of Vegetation Distribution, Ecosystem Productivity, and Fire to Climate Change Scenarios for California,” Climatic Change, 87 (Suppl 1): S215-S230, doi: 10.1007/s10584-007-9362-0, 2008.
195 Ibid.
196 See note 190.
197 Ibid.
198 See note 192.
199 Marko Scholze, et al., “A Climate-Change Risk Analysis for World Ecosystems,” Proceedings of the National Academy of Sciences, 103(35): 13116-13120, doi: 10.1073_pnas.0601816103, 29 August 2006.
200 Yongqiang Liu, John Stanturf and Scott Goodrick, “Trends in Global Wildfire Potential in a Changing Climate,” Forest Ecology and Management, 259(4): 685-697, doi: 10.1016/j.foreco.2009.09.002, February 2010.
201 See note 50.
202 National Oceanic and Atmospheric Administration, Summer’s Peak Has Arrived: Caution: Deadly Heat Wave Reaches East Coast, 1 August 2006.
203 National Oceanic and Atmospheric Administration, National Climatic Data Center, State of the Climate: National Overview, July 2006, downloaded from www.ncdc.noaa.gov/sotc/?report=national&year=2006&month=7, 15 July 2010.
204 Bart D. Ostro, et al., “Estimating the Mortality Effect of the July 2006 California Heat Wave,” Environmental Research, 109(5): 614-619, doi: 10.1016/j.envres.2009.03.010, July 2009.
205 Richard Perez-Pena, “Heat Wave Was a Factor in 140 Deaths, New York Says,” New York Times, 16 November 2006.
206 Kelly Zito and Matthew Yi, “Governor Declares Drought in California,” San Francisco Chronicle, 5 June 2008.
207 Eric Bailey, “Rare Lightning Storm
48 Global Warming and Extreme Weather
Sets Off Scattered Fires,” Los Angeles Times, 24 June 2008.
208 Demian Bulwa, “Firefighters Battling Hundreds of Blazes,” San Francisco Chronicle, 24 June 2008.
209 California Department of Forestry and Fire Protection, 2008 Lightning Siege Fire Overview, downloaded from www.fire.ca.gov/index_incidents_overview.php, 6 July 2010.
210 Dylan Darling, “Summer Wildfire Battles Costs Astronomical,” Redding Record Searchlight, 23 November 2008.
211 Catherine Saillant and Eric Bailey, “Push Is on to Stall Goleta Fire Before Winds; More Evacuations at Big Sur,” Los Angeles Times, 2 July 2008.
212 Trevor Hughes, “Wildfires Force $400M in Cuts at Forest Service,” USA Today, 30 August 2008.
213 Demian Bulwa, “Myriad Wildfires Pollute Air, Pose Health Risks and Keep on Spreading,” San Francisco Chronicle, 27 June 2008.
214 See note 211.
215 Bettina Boxall, “Spending to Fight California Wildfires Surpasses $1 Billion,” Los Angeles Times, 31 December 2008.
216 National Oceanic and Atmospheric Administration, National Climatic Data Center, State of the Climate: Drought: August 2007, downloaded from www.ncdc.noaa.gov/sotc/index.php?report=drought&year=2007&month=aug, 15 July 2010.
217 Ibid.
218 Ya Ding and Kelly Helm Smith, National Drought Mitigation Center, “Economic Impacts of the 2007 Drought,” DroughtScape, Winter 2010.
219 Georgia Forestry Commission, The Historic 2007 Georgia Wildfires: Learning from the Past—Planning for the Future, downloaded from www.wildfirelessons.net/documents/Historic_2007_GA_Wildfires.pdf, 6 July 2010.
220 Ibid.