global validation of envisat ozone profiles using lidar measurements
TRANSCRIPT
This article was downloaded by: [University of Connecticut]On: 11 October 2014, At: 13:56Publisher: Taylor & FrancisInforma Ltd Registered in England and Wales Registered Number: 1072954 Registeredoffice: Mortimer House, 37-41 Mortimer Street, London W1T 3JH, UK
International Journal of RemoteSensingPublication details, including instructions for authors andsubscription information:http://www.tandfonline.com/loi/tres20
Global validation of ENVISAT ozoneprofiles using lidar measurementsJ. A. E. Van Gijsel a , D. P. J. Swart a , J.-L. Baray b , H. Claudec , T. Fehr d , P. Von Der Gathen e , S. Godin-Beekmann f , G.H. Hansen g , T. Leblanc h , I. S. McDermid h , Y. J. Meijer d , H.Nakane i , E. J. Quel l , W. Steinbrecht c , K. B. Strawbridge j , B.Tatarov k & E. A. Wolfram la Laboratory for Environmental Monitoring, National Institute forPublic Health and the Environment (RIVM) , P.O. Box 1, 3720 BA,Bilthoven, The Netherlandsb Laboratoire de l'Atmosphère et des Cyclones (LACy), Universitéde la Réunion , UMR CNRS 8105, 15 avenue René Cassin, BP 7151,97715 Saint Denis Messag Cedex 9, Francec Ozone Research Unit, Meteorological ObservatoryHohenpeissenberg, German Weather Service (DWD) , Albin-Schwaiger-Weg 10, 82383, Hohenpeissenberg, Germanyd European Space Agency (ESA-ESRIN) , Via Galileo Galilei, 00044,Frascati (RM), Italye Polar and Marine Research, Alfred Wegener Institute (AWI) ,Telegrafenberg A43, 14473, Potsdam, Germanyf Service d'Aeronomie/IPSL, CNRS/UPMC/UVSQ , UPMC – Boite 102,4 Place Jussieu, 75252, Paris Cedex 05, Franceg Polar Environmental Centre 9296, Norwegian Air ResearchInstitute (NILU) , Troms⊘, Norwayh NASA, JPL, Table Mountain Facility , PO Box 367, Wrightwood,CA, 92397, USAi Asian Environment Research Group, National Institute forEnvironmental Studies (NIES) , 16-2, Onogawa, Tsukuba, Ibaraki,305-8506, Japanj Science and Technology Branch, Centre for AtmosphericResearch Experiments (CARE) , Environment Canada, 6248 EightLine, R.R. #1, Egbert (ON), LOL 1N0, Canadak Atmospheric Environment Division, National Institute forEnvironmental Studies (NIES) , 16-2, Onogawa, Tsukuba, Ibaraki,305-8506, Japan
l CEILAP (CITEFA-CONICET) , Juan B. de La Salle 4397, B1603 ALOVilla Martelli, ArgentinaPublished online: 29 Jul 2009.
To cite this article: J. A. E. Van Gijsel , D. P. J. Swart , J.-L. Baray , H. Claude , T. Fehr , P. VonDer Gathen , S. Godin-Beekmann , G. H. Hansen , T. Leblanc , I. S. McDermid , Y. J. Meijer , H.Nakane , E. J. Quel , W. Steinbrecht , K. B. Strawbridge , B. Tatarov & E. A. Wolfram (2009) Globalvalidation of ENVISAT ozone profiles using lidar measurements, International Journal of RemoteSensing, 30:15-16, 3987-3994, DOI: 10.1080/01431160902821825
To link to this article: http://dx.doi.org/10.1080/01431160902821825
PLEASE SCROLL DOWN FOR ARTICLE
Taylor & Francis makes every effort to ensure the accuracy of all the information (the“Content”) contained in the publications on our platform. However, Taylor & Francis,our agents, and our licensors make no representations or warranties whatsoever as tothe accuracy, completeness, or suitability for any purpose of the Content. Any opinionsand views expressed in this publication are the opinions and views of the authors,and are not the views of or endorsed by Taylor & Francis. The accuracy of the Contentshould not be relied upon and should be independently verified with primary sourcesof information. Taylor and Francis shall not be liable for any losses, actions, claims,proceedings, demands, costs, expenses, damages, and other liabilities whatsoever orhowsoever caused arising directly or indirectly in connection with, in relation to or arisingout of the use of the Content.
This article may be used for research, teaching, and private study purposes. Anysubstantial or systematic reproduction, redistribution, reselling, loan, sub-licensing,systematic supply, or distribution in any form to anyone is expressly forbidden. Terms &Conditions of access and use can be found at http://www.tandfonline.com/page/terms-and-conditions
Dow
nloa
ded
by [
Uni
vers
ity o
f C
onne
ctic
ut]
at 1
3:56
11
Oct
ober
201
4
Global validation of ENVISAT ozone profiles using lidarmeasurements
J. A. E. VAN GIJSEL*†, D. P. J. SWART†, J.-L. BARAY‡, H. CLAUDE§,
T. FEHR¶, P. VON DER GATHENj, S. GODIN-BEEKMANN¤,
G. H. HANSEN¥, T. LEBLANC††, I. S. MCDERMID††, Y. J. MEIJER¶,
H. NAKANE‡‡, E. J. QUELjj, W. STEINBRECHT§, K. B. STRAWBRIDGE§§,
B. TATAROV¶¶ and E.A. WOLFRAMjj†Laboratory for Environmental Monitoring, National Institute for Public Health and the
Environment (RIVM), P.O. Box 1, 3720 BA, Bilthoven, The Netherlands
‡Laboratoire de l’Atmosphere et des Cyclones (LACy), Universite de la Reunion, UMR
CNRS 8105, 15 avenue Rene Cassin, BP 7151, 97715 Saint Denis Messag Cedex 9, France
§Ozone Research Unit, Meteorological Observatory Hohenpeissenberg, German Weather
Service (DWD), Albin-Schwaiger-Weg 10, 82383, Hohenpeissenberg, Germany
¶European Space Agency (ESA-ESRIN), Via Galileo Galilei, 00044, Frascati (RM), Italy
jPolar and Marine Research, Alfred Wegener Institute (AWI), Telegrafenberg A43, 14473,
Potsdam, Germany
¤Service d’Aeronomie/IPSL, CNRS/UPMC/UVSQ, UPMC – Boite 102, 4 Place Jussieu,
75252 Paris Cedex 05, France
¥Polar Environmental Centre 9296, Norwegian Air Research Institute (NILU),
Tromsø, Norway
††NASA, JPL, Table Mountain Facility, PO Box 367, Wrightwood, CA 92397, USA
‡‡Asian Environment Research Group, National Institute for Environmental Studies
(NIES), 16-2, Onogawa, Tsukuba, Ibaraki 305-8506, Japan
§§Science and Technology Branch, Centre for Atmospheric Research Experiments
(CARE), Environment Canada, 6248 Eight Line, R.R. #1, Egbert (ON), LOL 1N0,
Canada
¶¶Atmospheric Environment Division, National Institute for Environmental Studies
(NIES), 16-2, Onogawa, Tsukuba, Ibaraki 305-8506, Japan
jjCEILAP (CITEFA-CONICET), Juan B. de La Salle 4397, B1603 ALO Villa Martelli,
Argentina
Satellite sensors provide global measurements of ozone concentration that can be
used to study the effects of the implementation of the Montreal Protocol.
However, a key issue in deriving long-term ozone trends from successive satellite
instruments is inter-comparability. Ground-based measurements offer continuous
time series, but only at a few locations. The combination of ground-based mea-
surements with satellite data is therefore an effective means to evaluate satellite
instrument inter-comparability. In this study, we present validation results of
ozone profiles from three atmospheric sensors onboard ENVISAT by comparison
with lidar measurements. Results for the SCIAMACHY ozone profiles (version
3.01) show reasonable agreement with ground-based measurements (0 to -20%).
The MIPAS full-resolution (version 4.61) dataset has good agreement with lidar
*Corresponding author. Email: [email protected]
International Journal of Remote SensingISSN 0143-1161 print/ISSN 1366-5901 online # 2009 Taylor & Francis
http://www.tandf.co.uk/journalsDOI: 10.1080/01431160902821825
International Journal of Remote Sensing
Vol. 30, Nos. 15–16, August 2009, 3987–3994
Dow
nloa
ded
by [
Uni
vers
ity o
f C
onne
ctic
ut]
at 1
3:56
11
Oct
ober
201
4
(0 to 10%), whereas a small positive bias (up to 20%) was found for the MIPAS
reduced-resolution prototype data. GOMOS dark-limb data (version 5.00) agree
very well (0 � 5%) with the correlative data, but underestimate ozone concentra-
tion at the polar regions.
1. Introduction
In order to assess the effectiveness of the measures taken in the framework of the
Montreal Protocol, accurate and reliable measurements of atmospheric properties,
such as ozone and temperature, are essential. In addition, coordinated in-situ
measurements provide and have provided a valuable contribution to our understand-ing of stratospheric processes. For instance, studies with ozone sondes have
shown that ozone loss is not only related to enhanced chlorine levels, but also has a
strong dependence on stratospheric temperature (Schulz et al. 2000, 2001). Lidar
measurements have, for example, been used to characterise polar stratospheric clouds
(Massoli et al. 2006) and to study geographic differences in observed stratospheric
temperature and waves (Blum et al. 2004). Nevertheless, ground-based and balloon-
borne measurements are only available at a few locations.
Satellite instruments are, in this respect, an excellent source of information as theycan provide cost-effective and timely global coverage. However, one of the key issues
when using different satellite instruments to derive long-term ozone trends is the
degree to which the measurements of these instruments correlate properly. This is
especially of concern when no simultaneous measurements are available due to cover-
age gaps in successive missions. A second major issue is the trade-off between the
geographic coverage (i.e. temporal and spatial resolutions) and the obtained accuracy
for satellite retrievals (Meijer et al. 2004).
The establishment of a long-term time series of ground-based measurements withknown quality and comparison with satellite measurements is therefore a prerequisite
to assess the quality of satellite data and to ensure a good performance of individual
sensors, as well as an appropriate combination of multi-sensor datasets. Ground-
based and balloon-borne measurements have already proven to be essential in the
validation of various models (Reid et al. 1998) and satellite retrievals (Meijer et al.
2003, Cortesi et al. 2007, Jiang et al. 2007, Ridolfi et al. 2007, Witte et al. 2008).
In this study, we evaluate the ozone profiles derived from the measurements of the
three atmospheric instruments onboard ENVISAT: the SCanning Imaging AbsorptionspectroMeter for Atmospheric CHartographY (SCIAMACHY), the Michelson inter-
ferometer for passive atmosphere sounding (MIPAS) and the Global Ozone
Monitoring by Occultation of Stars (GOMOS). More precisely, four ozone profile
products, derived from measurements by these instruments are compared with ground-
based lidar measurements.
2. Datasets and methodology
In this study, we have investigated the differences between lidar and satellite-based
measurements of stratospheric ozone. The lidar measurements of stratospheric ozone
were taken at 11 sites (see table 1) ranging from Lauder, New Zealand (45.04� S) to
Eureka, Canada (80.05� N). All of these lidar systems are differential absorptionlidars (DIALs), which make use of two wavelengths. Since the absorption by ozone is
3988 J. A. E. van Gijsel et al.
Dow
nloa
ded
by [
Uni
vers
ity o
f C
onne
ctic
ut]
at 1
3:56
11
Oct
ober
201
4
wavelength dependent, comparison of the return signals allows the derivation of the
ozone concentration as a function of altitude.
The validation approach followed in this study is similar to that of Meijer et al.(2004). Both satellite and lidar data were first interpolated using a linear spline to a
common altitude grid and then compared in a quality assessment. The selected datasets
were subsequently compared in terms of mean, median, standard deviation and
standard error of the differences for various subsets, such as the geographical region,
measurement conditions and collocation criteria. Here, a lower confidence altitude
limit was set for all lidar data to 18 km and the upper altitude limit was set to 45 km.
One prototype and three operational European Space Agency (ESA) satellite
products from three atmospheric sensors have been compared with lidar:
– SCIAMACHY level 2 processor version 3.01. SCIAMACHY observes the solar
radiation transmitted or reflected by the atmosphere during sunrise and sunset
from 240 to 2380 nm. From these observations, vertical columns and profiles areretrieved for various atmospheric constituents. See Bovensmann et al. (1999) for
an overview of the measurement techniques of this instrument
– MIPAS full-resolution (FR) level 2 processor version 4.61. MIPAS provides
profiles of temperature and atmospheric constituents from limb-viewing mid-
infrared emission measurements using a high-resolution Fourier transform
spectrometer. The high-resolution observations cover the upper troposphere/
lower stratosphere (UTLS) to the mesosphere. Fischer et al. (2008) provides a
more detailed description of this sensor.– MIPAS reduced-resolution (RR) prototype data.
– GOMOS processor version 5.00. GOMOS uses the stellar occultation technique
to detect atmospheric trace gasses (with a focus on ozone), as well as tempera-
ture. The transmitted radiation of the star setting in the atmosphere is analysed
by spectrometers covering the ultraviolet to visible (250 to 675 nm, 756 to 773
nm) and near infrared bands (926 to 952 nm), with a spectral resolution of 1.2
and 0.2 nm, respectively. Geophysical variables are retrieved over the altitude
range from 15 to 100 km with an approximate height resolution of 1.7 km. SeeKyrola et al. (2004) for a review of this sensor.
Over 12 000 collocations (maximum of 800 km and 20 hours difference between
measurements) of the SCIAMACHY profiles with lidar were found for the period
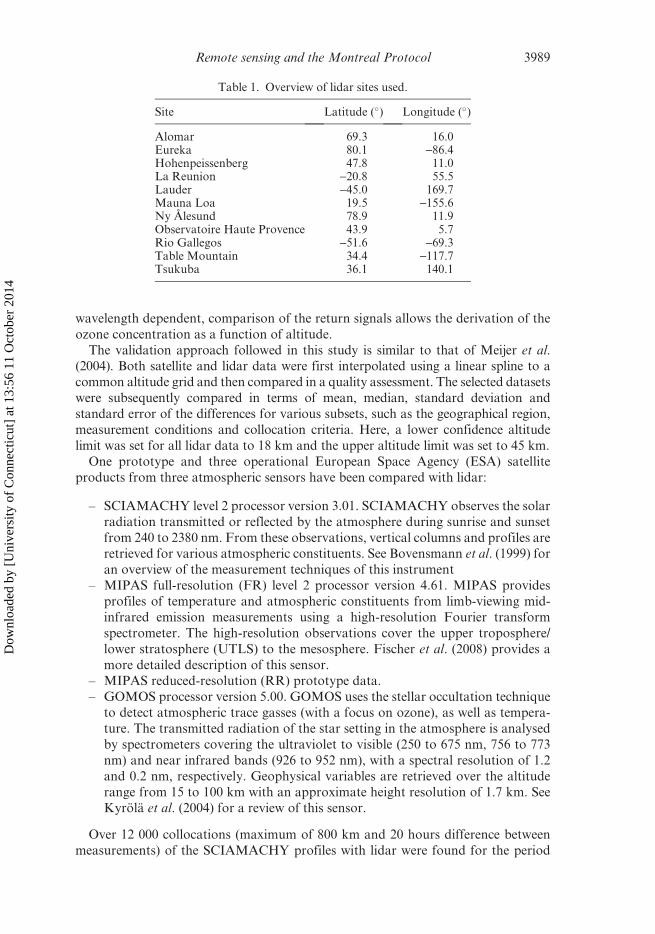
Table 1. Overview of lidar sites used.
Site Latitude (�) Longitude (�)
Alomar 69.3 16.0Eureka 80.1 -86.4Hohenpeissenberg 47.8 11.0La Reunion -20.8 55.5Lauder -45.0 169.7Mauna Loa 19.5 -155.6Ny Alesund 78.9 11.9Observatoire Haute Provence 43.9 5.7Rio Gallegos -51.6 -69.3Table Mountain 34.4 -117.7Tsukuba 36.1 140.1
Remote sensing and the Montreal Protocol 3989
Dow
nloa
ded
by [
Uni
vers
ity o
f C
onne
ctic
ut]
at 1
3:56
11
Oct
ober
201
4

2002 to 2007. The upper altitude limit for the comparison interval is restricted to 40
km, as recommended in the SCIAMACHY data disclaimer.
The MIPAS instrument encountered an anomaly in March 2004. It was able to
continue measurements in January 2005, but with a reduced spectral resolution. There
are therefore two different MIPAS products available. For the comparison with theoperational MIPAS FR version 4.61 data, the collocations were restricted to a
maximum of 10 hours and a maximum distance of 400 km (. 600 collocations).
The RR data are not operationally produced, and only a very limited dataset was
available for verification activities. The collocation criteria have therefore been
extended to a maximum of 20 hours and a distance of 500 km (only 28 collocations).
For the GOMOS processor version 5.00, a maximum time lapse of 20 hours and a
maximum distance of 800 km were chosen. The solar zenith angle was further
restricted to 108� or larger to ensure that only star occultations in dark-limb condi-tions are considered. The maximum error that was allowed for both the GOMOS data
as well as the lidar data was set to 30%. More than 1600 collocations fulfilled these
criteria. The analysis results for these collocated datasets are shown in §3.
3. Results
3.1 SCIAMACHY processor version 3.01
Figure 1 displays the comparison results for the SCIAMACHY processor version
3.01. The left panel shows the mean ozone number densities of the lidar (thick blue
line) and the SCIAMACHY (thick red line) measurements, together with the
Figure 1. Validation results for the SCIAMACHY operational processor version 3.01 incomparison with lidar measurements. Left panel: mean SCIAMACHY (thick red line) andmean lidar (thick blue lines) ozone concentrations with their respective standard deviations(thin lines) as a function of altitude. Middle panel: mean (thick black line) plus/minus onestandard deviation (thin black lines) of all individual difference profiles from the mean differ-ence profile and mean difference plus/minus two standard errors (thin grey lines) and median(green line) percentage difference (SCIAMACHY minus lidar divided by lidar) as a function ofaltitude. On the right-hand side of the middle panel is listed the number of collocations for eachaltitude. The right panel shows the standard deviations of SCIAMACHY (red), lidar (blue) andthe standard deviation of the differences between SCIAMACHY and lidar (black line) as afunction of altitude.
3990 J. A. E. van Gijsel et al.
Dow
nloa
ded
by [
Uni
vers
ity o
f C
onne
ctic
ut]
at 1
3:56
11
Oct
ober
201
4
standard deviations (thin lines) as a function of altitude. It is clear that SCIAMACHY
is underestimating the ozone concentrations. We can quantify the underestimation
using the middle panel, which shows the mean and median of the differences with
respect to lidar. The underestimation of ozone is ranging between about 5% at the
bottom of the profile (18 km) increasing to 25% at an altitude of 40 km. These resultssupported the SCIAMACHY processor development, and the verification of the new
prototype has shown significant improvements. This new dataset will be available
from early 2010.
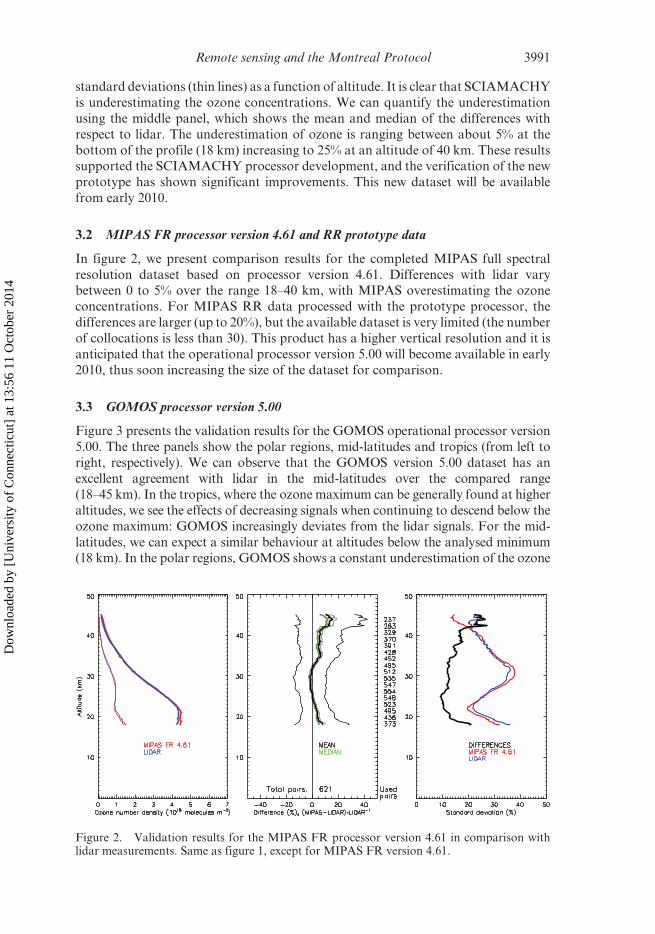
3.2 MIPAS FR processor version 4.61 and RR prototype data
In figure 2, we present comparison results for the completed MIPAS full spectral
resolution dataset based on processor version 4.61. Differences with lidar varybetween 0 to 5% over the range 18–40 km, with MIPAS overestimating the ozone
concentrations. For MIPAS RR data processed with the prototype processor, the
differences are larger (up to 20%), but the available dataset is very limited (the number
of collocations is less than 30). This product has a higher vertical resolution and it is
anticipated that the operational processor version 5.00 will become available in early
2010, thus soon increasing the size of the dataset for comparison.
3.3 GOMOS processor version 5.00
Figure 3 presents the validation results for the GOMOS operational processor version
5.00. The three panels show the polar regions, mid-latitudes and tropics (from left to
right, respectively). We can observe that the GOMOS version 5.00 dataset has an
excellent agreement with lidar in the mid-latitudes over the compared range
(18–45 km). In the tropics, where the ozone maximum can be generally found at higher
altitudes, we see the effects of decreasing signals when continuing to descend below the
ozone maximum: GOMOS increasingly deviates from the lidar signals. For the mid-
latitudes, we can expect a similar behaviour at altitudes below the analysed minimum(18 km). In the polar regions, GOMOS shows a constant underestimation of the ozone
Figure 2. Validation results for the MIPAS FR processor version 4.61 in comparison withlidar measurements. Same as figure 1, except for MIPAS FR version 4.61.
Remote sensing and the Montreal Protocol 3991
Dow
nloa
ded
by [
Uni
vers
ity o
f C
onne
ctic
ut]
at 1
3:56
11
Oct
ober
201
4
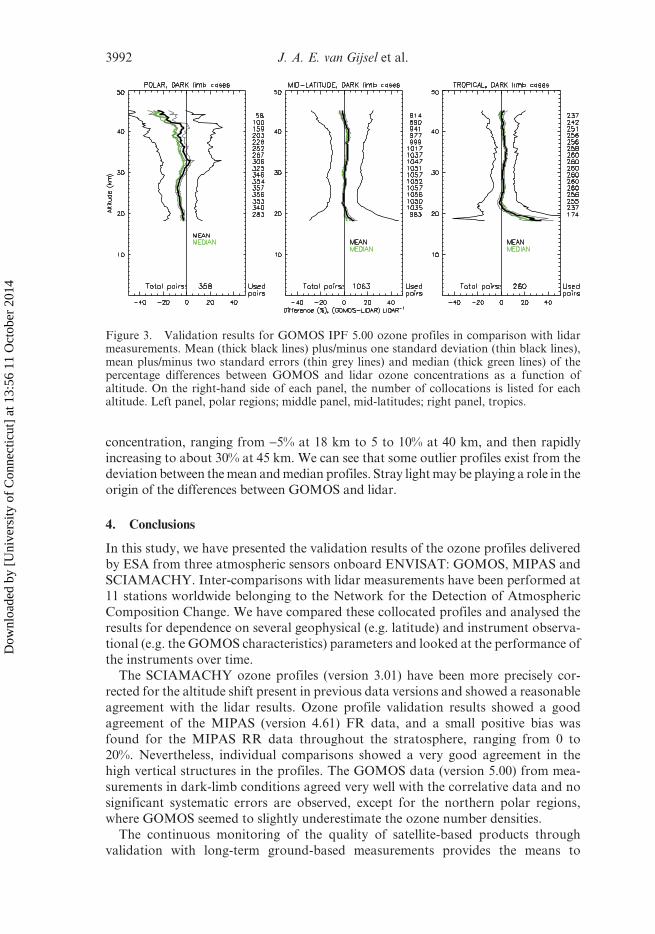
concentration, ranging from -5% at 18 km to 5 to 10% at 40 km, and then rapidlyincreasing to about 30% at 45 km. We can see that some outlier profiles exist from the
deviation between the mean and median profiles. Stray light may be playing a role in the
origin of the differences between GOMOS and lidar.
4. Conclusions
In this study, we have presented the validation results of the ozone profiles delivered
by ESA from three atmospheric sensors onboard ENVISAT: GOMOS, MIPAS and
SCIAMACHY. Inter-comparisons with lidar measurements have been performed at
11 stations worldwide belonging to the Network for the Detection of Atmospheric
Composition Change. We have compared these collocated profiles and analysed theresults for dependence on several geophysical (e.g. latitude) and instrument observa-
tional (e.g. the GOMOS characteristics) parameters and looked at the performance of
the instruments over time.
The SCIAMACHY ozone profiles (version 3.01) have been more precisely cor-
rected for the altitude shift present in previous data versions and showed a reasonable
agreement with the lidar results. Ozone profile validation results showed a good
agreement of the MIPAS (version 4.61) FR data, and a small positive bias was
found for the MIPAS RR data throughout the stratosphere, ranging from 0 to20%. Nevertheless, individual comparisons showed a very good agreement in the
high vertical structures in the profiles. The GOMOS data (version 5.00) from mea-
surements in dark-limb conditions agreed very well with the correlative data and no
significant systematic errors are observed, except for the northern polar regions,
where GOMOS seemed to slightly underestimate the ozone number densities.
The continuous monitoring of the quality of satellite-based products through
validation with long-term ground-based measurements provides the means to
Figure 3. Validation results for GOMOS IPF 5.00 ozone profiles in comparison with lidarmeasurements. Mean (thick black lines) plus/minus one standard deviation (thin black lines),mean plus/minus two standard errors (thin grey lines) and median (thick green lines) of thepercentage differences between GOMOS and lidar ozone concentrations as a function ofaltitude. On the right-hand side of each panel, the number of collocations is listed for eachaltitude. Left panel, polar regions; middle panel, mid-latitudes; right panel, tropics.
3992 J. A. E. van Gijsel et al.
Dow
nloa
ded
by [
Uni
vers
ity o
f C
onne
ctic
ut]
at 1
3:56
11
Oct
ober
201
4

instrument inter-comparison and algorithm development. Despite data gaps between
satellite missions, the ozone layer can be globally monitored in a consistent way,
ensuring that the trends in ozone will be properly identified.
Acknowledgements
These studies have been performed in the framework of the ENVISAT quality
assessment with lidar (EQUAL) project, which was financed by the European Space
Agency. The authors would also like to thank the members of the GOMOS, MIPAS
and SCIAMACHY quality working groups for their inputs and discussions. We also
acknowledge the feedback from the anonymous reviewer, which has provided valu-
able improvements to this manuscript.
References
BLUM, U., FRICKE, K.H., BAUMGARTEN, G. and SCHOCH, A., 2004, Simultaneous lidar observa-
tions of temperatures and waves in the polar middle atmosphere on the east and west
side of the Scandinavian mountains: a case study on 19/20 January 2003. Atmospheric
Chemistry and Physics, 4, pp. 809–816.
BOVENSMANN, H., BURROWS, J.P., BUCHWITZ, M., FRERICK, J., NOEL, S., ROZANOV, V.V.,
CHANCE, K.V. and GOEDE, A.P.H., 1999, SCIAMACHY: Mission objectives and
measurement modes. Journal of the Atmospheric Sciences, 56, pp. 127–150.
CORTESI, U., LAMBERT, J.C., DE CLERCQ, C., BIANCHINI, G., BLUMENSTOCK, T., BRACHER, A.,
CASTELLI, E., CATOIRE, V., CHANCE, K.V., DE MAZIE?RE, M., DEMOULIN, P., GODIN-
BEEKMANN, S., JONES, N., JUCKS, K., KEIM, C., KERZENMACHER, T., KUELLMANN, H.,
KUTTIPPURATH, J., IARLORI, M., LIU, G.Y., LIU, Y., MCDERMID, I.S., MEIJER, Y.J.,
MENCARAGLIA, F., MIKUTEIT, S., OELHAF, H., PICCOLO, C., PIRRE, M., RASPOLLINI, P.,
RAVEGNANI, F., REBURN, W.J., REDAELLI, G., REMEDIOS, J.J., SEMBHI, H., SMALE, D.,
STECK, T., TADDEI, A., VAROTSOS, C., VIGOUROUX, C., WATERFALL, A., WETZEL, G. and
WOOD, S., 2007, Geophysical validation of MIPAS-ENVISAT operational ozone data.
Atmospheric Chemistry and Physics, 7, pp. 4807–4867.
FISCHER, H., BIRK, M., BLOM, C., CARLI, B., CARLOTTI, M., VON CLARMANN, T., DELBOUILLE, L.,
DUDHIA, A., EHHALT, D., ENDEMANN, M., FLAUD, J.M., GESSNER, R., KLEINERT, A.,
KOOPMAN, R., LANGEN, J., LOPEZ-PUERTAS, M., MOSNER, P., NETT, H., OELHAF, H.,
PERRON, G., REMEDIOS, J., RIDOLFI, M., STILLER, G. and ZANDER, R., 2008, MIPAS: An
instrument for atmospheric and climate research. Atmospheric Chemistry and Physics,
8, pp. 2151–2188.
JIANG, Y.B., FROIDEVAUX, L., LAMBERT, A., LIVESEY, N.J., READ, W.G., WATERS, J.W., BOJKOV,
B., LEBLANC, T., MCDERMID, I.S., GODIN-BEEKMANN, S., FILIPIAK, M.J., HARWOOD,
R.S., FULLER, R.A., DAFFER, W.H., DROUIN, B.J., COFIELD, R.E., CUDDY, D.T.,
JARNOT, R.F., KNOSP, B.W., PERUN, V.S., SCHWARTZ, M.J., SNYDER, W.V., STEK, P.C.,
THURSTANS, R.P., WAGNER, P.A., ALLAART, M., ANDERSEN, S.B., BODEKER, G., CALPINI,
B., CLAUDE, H., COETZEE, G., DAVIES, J., DE BACKER, H., DIER, H., FUJIWARA, M.,
JOHNSON, B., KELDER, H., LEME, N.P., KONIG-LANGLO, G., KYRO, E., LANEVE, G.,
FOOK, L.S., MERRILL, J., MORRIS, G., NEWCHURCH, M., OLTMANS, S., PARRONDOS,
M.C., POSNY, F., SCHMIDLIN, F., SKRIVANKOVA, P., STUBI, R., TARASICK, D.,
THOMPSON, A., THOURET, V., VIATTE, P., VOMEL, H., VON DER GATHEN, P., YELA, M.
and ZABLOCKI, G., 2007, Validation of Aura Microwave Limb Sounder Ozone by
ozonesonde and lidar measurements. Journal of Geophysical Research, 112, D24S34.
KYROLA, E., TAMMINEN, J., LEPPELMEIER, G.W., SOFIEVA, V.F., HASSINEN, S., BERTAUX, J.-L.,
HAUCHECORNE, A., DALAUDIER, F., COT, C., KORABLEV, O., FANTON D’ANDON, O.,
BARROT, G., MANGIN, A., THEODORE, B., GUIRLET, M., ETANCHAUD, F., SNOEIJ, P.,
KOOPMAN, R.M., SAAVEDRA, L., FRAISSE, R., FUSSEN, D. and VANHELLEMONT, F.,
Remote sensing and the Montreal Protocol 3993
Dow
nloa
ded
by [
Uni
vers
ity o
f C
onne
ctic
ut]
at 1
3:56
11
Oct
ober
201
4

2004, GOMOS on Envisat: an overview. Advances in Space Research, 33,
pp. 1020–1028.
MASSOLI, P., MATURILLI, M. and NEUBER, R., 2006, Climatology of Arctic polar stratospheric
clouds as measured by lidar in Ny-Alesund, Spitsbergen (79� N, 12� E). Journal of
Geophysical Research, 111, D09206.
MEIJER, Y.J., VAN DER A, R.J., VAN OSS, R.F., SWART, D.P.J., KELDER, H.M. and JOHNSTON,
P.V., 2003, Global ozone monitoring experiment ozone profile characterization using
interpretation tools and lidar measurements for intercomparison. Journal of
Geophysical Research, 108, D23.
MEIJER, Y.J., SWART, D.P.J., ALLAART, M., ANDERSEN, S.B., BODEKER, G., BOYD, I., BRAATHEN,
G., CALIZESI, Y., CLAUDE, H., DOROKHOV, V., VON DER GATHEN, P., GIL, M., GODIN-
BEEKMANN, S., GOUTAIL, F., HANSEN, G., KARPETCHKO, A., KECKHUT, P., KELDER,
H.M., KOELEMEIJER, R., KOIS, B., KOOPMAN, R.M., KOPP, G., LAMBERT, J.-C.,
LEBLANC, T., MCDERMID, I.S., PAL, S., SCHETS, H., STUBI, R., SUORTTI, T., VISCONTI,
G. and YELA, M., 2004, Pole-to-pole validation of Envisat GOMOS ozone profiles
using data from ground-based and balloon sonde measurements. Journal of
Geophysical Research, 109, D23305.
REID, S.J., REX, M., VON DER GATHEN, P., FLØISAND, I., STORDAL, F., CARVER, G.D., BECK, A.,
REIMER, E., KRUGER-CASTENSEN, K., DE HAAN, L.L., BRAATHEN, G., DOROKHOV, V.,
FAST, H., KYRO, E., GIL, M., LITYNSKA, Z., MOLYNEUX, M., MURPHY, G., O’CONNOR,
F., RAVEGNANI, F., VAROTSOS, C., WENGER, J. and ZEREFOS, C., 1998, A study of ozone
laminae using diabatic trajectories, contour advection and photochemical trajectory
model simulations. Journal of Atmospheric Chemistry, 30, pp. 187–207.
RIDOLFI, M., BLUM, U., CARLI, B., CATOIRE, V., CECCHERINI, S., CLAUDE, H., DE CLERCQ, C.,
FRICKE, K.H., FRIEDL-VALLON, F., IARLORI, M., KECKHUT, P., KERRIDGE, B., LAMBERT,
J.C., MEYER, Y.J., MONA, L., OELHAF, H., PAPPALARDO, G., PIRRE, M., RIZI, V.,
ROBERT, C., SWART, D., VON CLARMANN, T., WATERFALL, A. and WETZEL, G., 2007,
Geophysical validation of temperature retrieved by the ESA processor from MIPAS/
ENVISAT atmospheric limb-emission measurements. Atmospheric Chemistry and
Physics, 7, pp. 4459–4487.
SCHULZ, A., REX, M., HARRIS, N.R.P., BRAATHEN, G.O., REIMER, E., ALFIER, R., KILBANE-
DAWE, I., ECKERMANN, S., ALLAART, M., ALPERS, M., BOJKOV, B., CISNEROS, J., CLAUDE,
H., CUEVAS, E., DAVIES, J., DE BACKER, H., DIER, H., DOROKHOV, V., FAST, H., GODIN,
S., JOHNSON, B., KOIS, B., KONDO, Y., KOSMIDIS, E., KYRO, E., LITYNSKA, Z.,
MIKKELSEN, I.S., MOLYNEUX, M.J., MURPHY, G., NAGAI, T., NAKANE, H., O’CONNOR,
F., PARRONDO, C., SCHMIDLIN, F.J., SKRIVANKOVA, P., VAROTSOS, C., VIALLE, C., VIATTE,
P., YUSHKOV, V., ZEREFOS, C. and VON DER GATHEN, P., 2001, Arctic ozone loss in
threshold conditions: match observations in 1997/1998 and 1998/1999. Journal of
Geophysical Research, 106, pp. 7495–7503.
SCHULZ, A., REX, M., STEGER, J., HARRIS, N.R.P., BRAATHEN, G.O., REIMER, E., ALFIER, R.,
BECK, A., ALPERS, M., CISNEROS, J., CLAUDE, H., DE BACKER, H., DIER, H., DOROKHOV,
V., FAST, H., GODIN, S., HANSEN, G., KANZAWA, H., KOIS, B., KONDO, Y., KOSMIDIS, E.,
KYRO, E., LITYNSKA, Z., MOLYNEUX, M.J., MURPHY, G., NAKANE, H., PARRONDO, C.,
RAVEGNANI, F., VAROTSOS, C., VIALLE, C., VIATTE, P., YUSHKOV, V., ZEREFOS, C. and
VON DER GATHEN, P., 2000, Match observations in the Arctic winter 1996/97: high
stratospheric ozone loss rates correlate with low temperatures deep inside the polar
vortex. Geophysical Research Letters, 27, pp. 205–208.
WITTE, J.C., SCHOEBERL, M.R., DOUGLASS, A.R. and THOMPSON, A.M., 2008, The quasi-biennial
oscillation and annual variations in tropical ozone from SHADOZ and HALOE.
Atmospheric Chemistry and Physics, 8, pp. 3929–3936.
3994 J. A. E. van Gijsel et al.
Dow
nloa
ded
by [
Uni
vers
ity o
f C
onne
ctic
ut]
at 1
3:56
11
Oct
ober
201
4