global survey on voluntary sustainability standards...
TRANSCRIPT
Research Institute of Organic AgricultureForschungsinstitut für biologischen Landbau
Global survey on Voluntary Sustainability Standards (VSS)Key figuresJulia Lernoud and Helga WillerResearch Institute of Organic Agriculture (FiBL), Frick, Switzerland, February 2017
Institut de recherche de l’agriculture biologique
www.fibl.org
Partners
› Research Institute of Organic Agriculture (FiBL)
› International Trade Centre (ITC)
› International Institute for Sustainable Development
2
› The Swiss State Secretariat for Economic Affairs SECO
Supporter
www.fibl.org
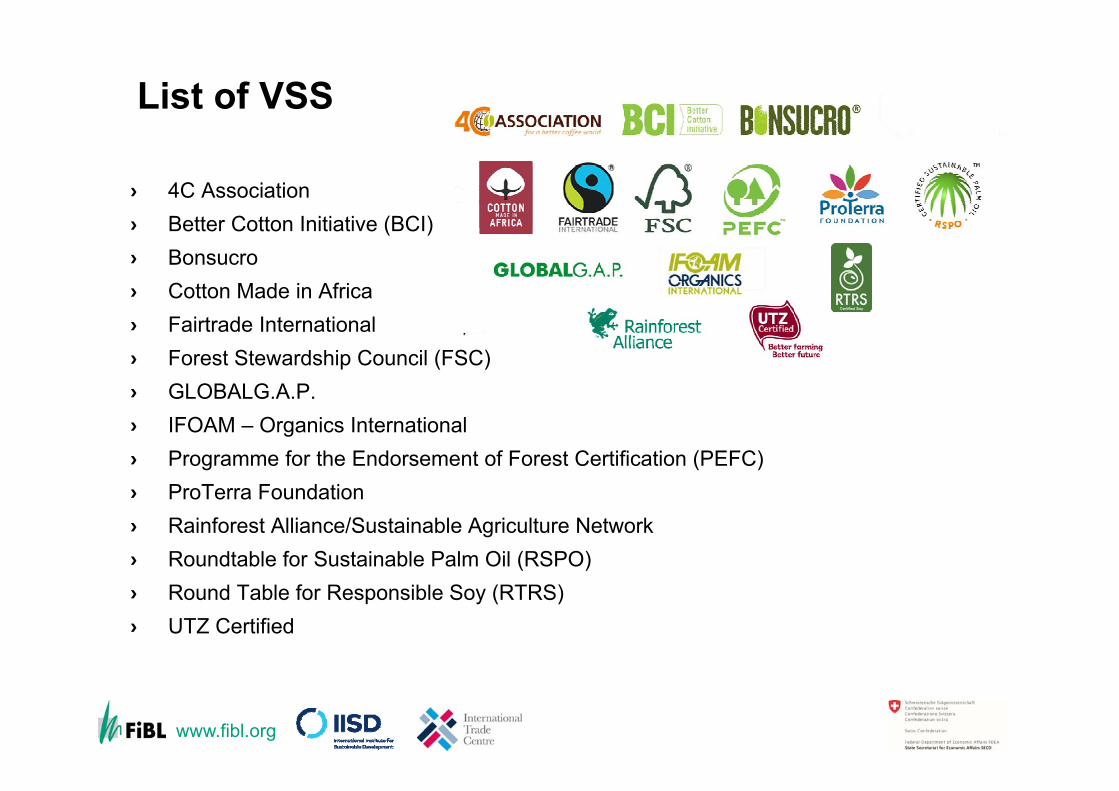
List of VSS
› 4C Association› Better Cotton Initiative (BCI)› Bonsucro› Cotton Made in Africa› Fairtrade International› Forest Stewardship Council (FSC)› GLOBALG.A.P.› IFOAM – Organics International› Programme for the Endorsement of Forest Certification (PEFC)› ProTerra Foundation› Rainforest Alliance/Sustainable Agriculture Network› Roundtable for Sustainable Palm Oil (RSPO)› Round Table for Responsible Soy (RTRS)› UTZ Certified
3
www.fibl.org
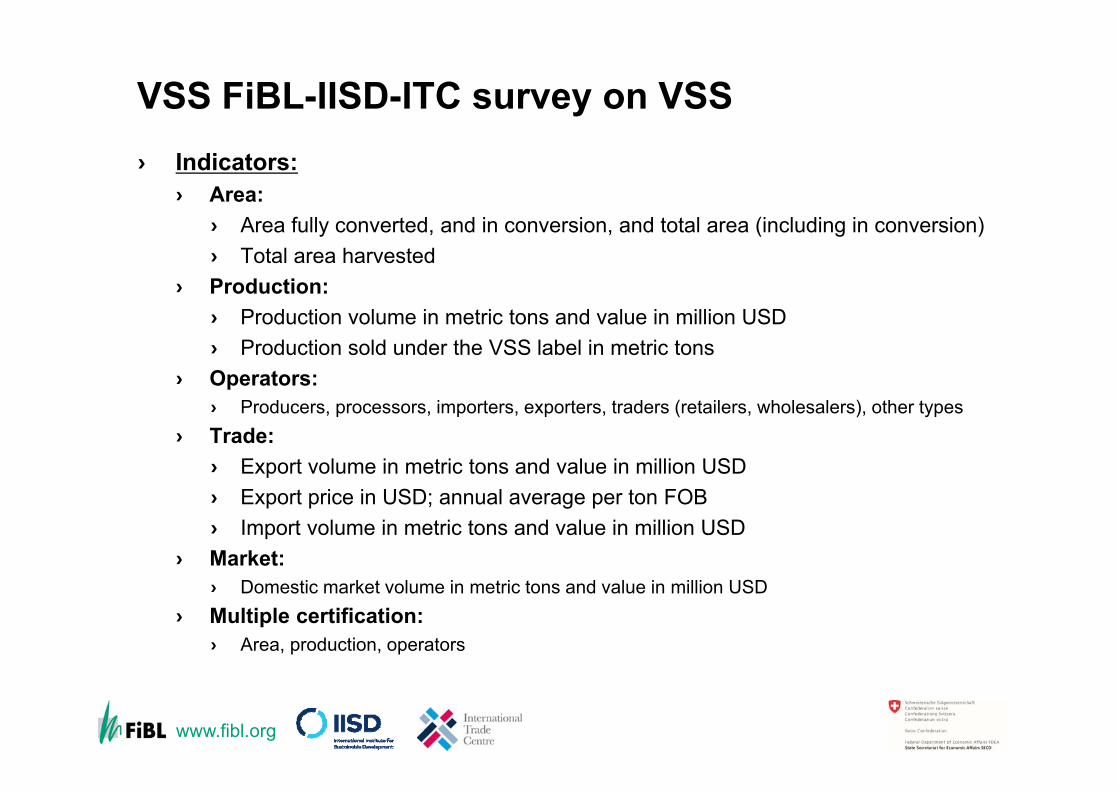
VSS FiBL-IISD-ITC survey on VSS› Indicators:
› Area:› Area fully converted, and in conversion, and total area (including in conversion)› Total area harvested
› Production:› Production volume in metric tons and value in million USD› Production sold under the VSS label in metric tons
› Operators:› Producers, processors, importers, exporters, traders (retailers, wholesalers), other types
› Trade:› Export volume in metric tons and value in million USD› Export price in USD; annual average per ton FOB› Import volume in metric tons and value in million USD
› Market:› Domestic market volume in metric tons and value in million USD
› Multiple certification:› Area, production, operators
4
www.fibl.org
VSS FiBL-IISD-ITC survey
› Methodology and scope› Common indicators and commodities: The aim is to collect as much information
available as possible› Selected agricultural commodities: bananas, cocoa, coffee, cotton, palm oil,
soybeans, sugarcane, and tea› Forestry: area data, operators (forest managers/owners and chain of custody)› Full set of data: apart of the selected commodities, the VSS were asked to provide
data for all the commodities they certified
› Data providers and data sources› A part of the covered VSS, a wide range of experts were contacted and VSS
annual reports were used
5
www.fibl.org
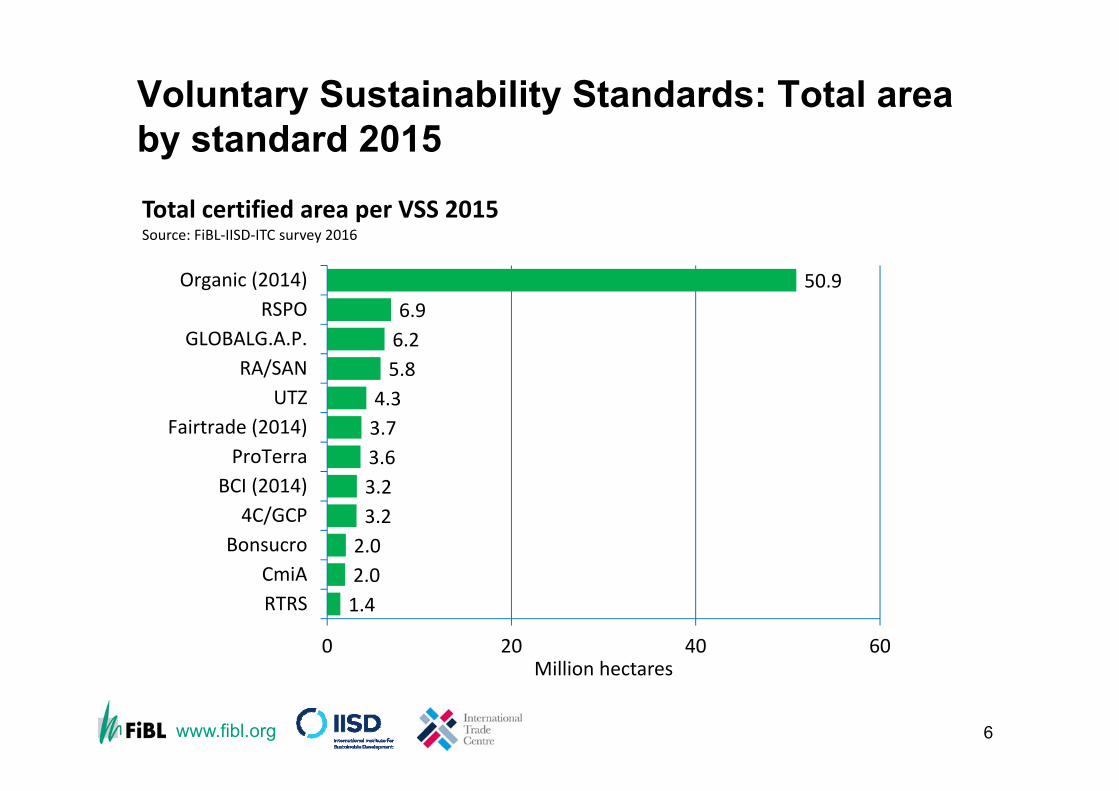
Voluntary Sustainability Standards: Total area by standard 2015
6
1.42.02.03.23.23.63.74.35.86.26.9
50.9
0 20 40 60
RTRSCmiA
Bonsucro4C/GCP
BCI (2014)ProTerra
Fairtrade (2014)UTZ
RA/SANGLOBALG.A.P.
RSPOOrganic (2014)
Million hectares
Total certified area per VSS 2015Source: FiBL‐IISD‐ITC survey 2016
www.fibl.org
Cocoa
Other
Rainforest Alliance
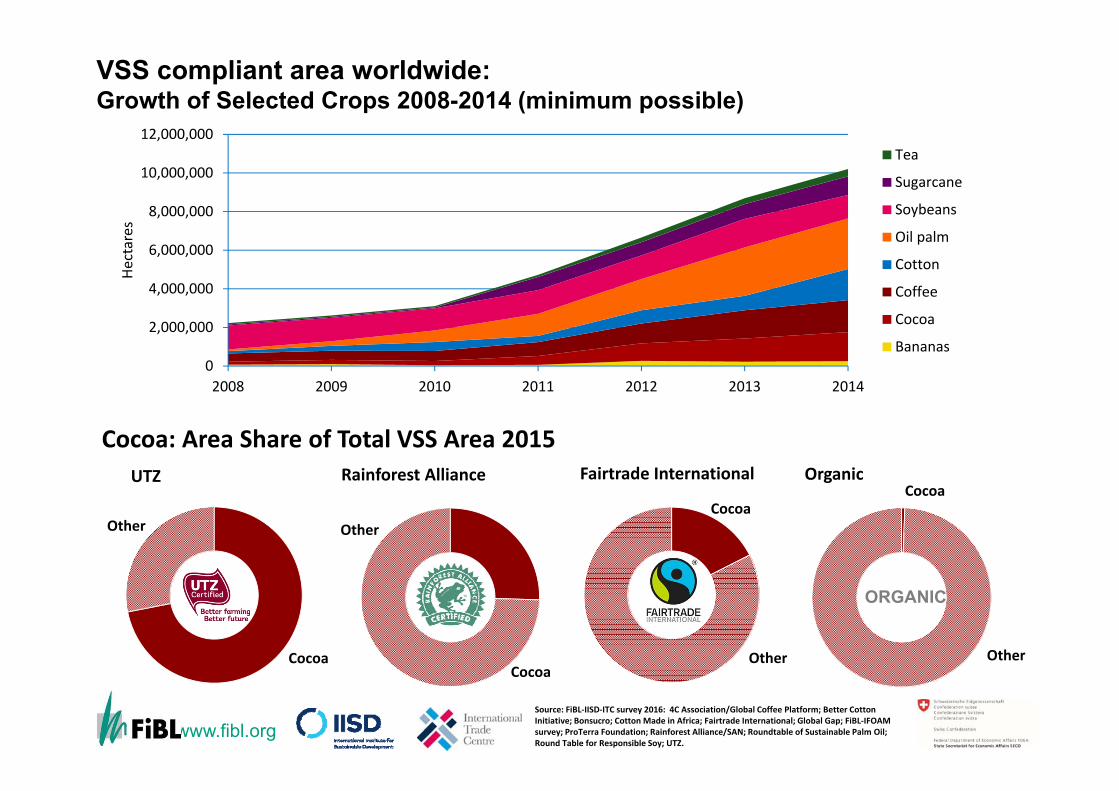
VSS compliant area worldwide: Growth of Selected Crops 2008-2014 (minimum possible)
0
2,000,000
4,000,000
6,000,000
8,000,000
10,000,000
12,000,000
2008 2009 2010 2011 2012 2013 2014
Hectares
Tea
Sugarcane
Soybeans
Oil palm
Cotton
Coffee
Cocoa
Bananas
Cocoa: Area Share of Total VSS Area 2015
Cocoa
Other
Fairtrade InternationalCocoa
Other
Organic
Cocoa
Other
UTZ
ORGANIC
Source: FiBL‐IISD‐ITC survey 2016: 4C Association/Global Coffee Platform; Better Cotton Initiative; Bonsucro; Cotton Made in Africa; Fairtrade International; Global Gap; FiBL‐IFOAM survey; ProTerra Foundation; Rainforest Alliance/SAN; Roundtable of Sustainable Palm Oil; Round Table for Responsible Soy; UTZ.
www.fibl.org
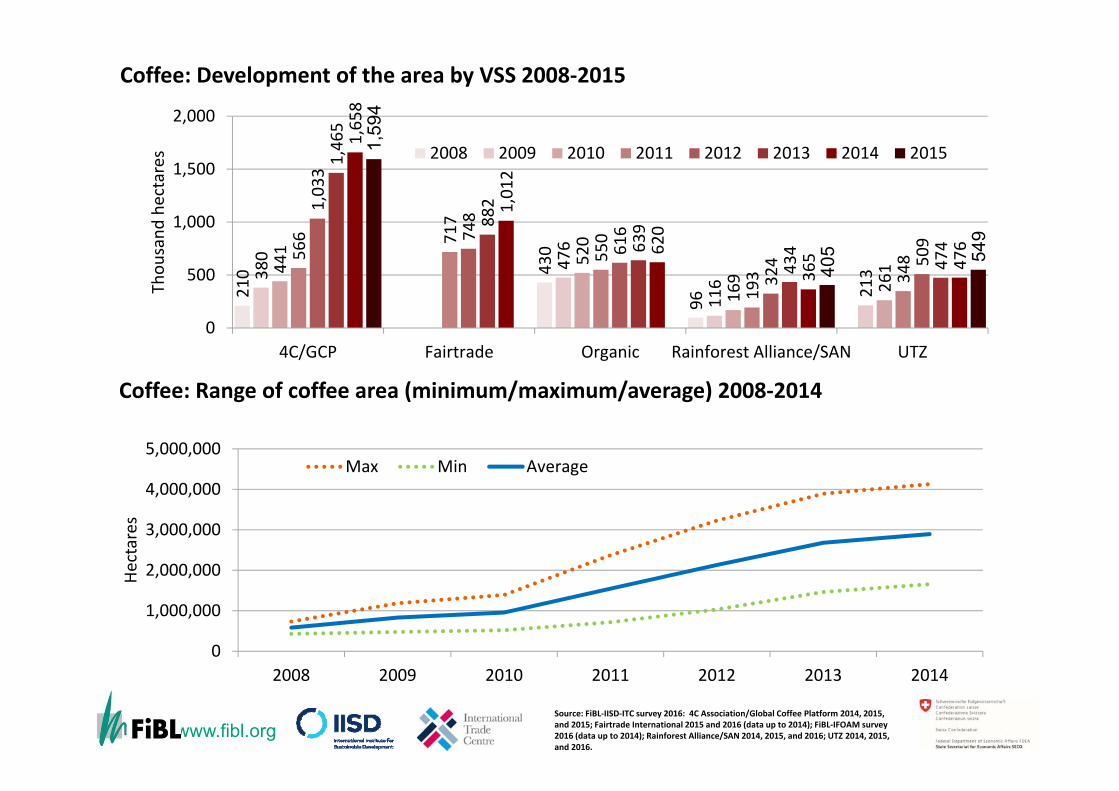
210 43
0
96
380 476
116 21344
1 520
169 261
566 717
550
193 348
1,033
748
616
324 50
9
1,465
882
639
434
474
1,658
1,012
620
365 476
1,59
4
405 54
9
0
500
1,000
1,500
2,000
4C/GCP Fairtrade Organic Rainforest Alliance/SAN UTZ
Thou
sand
hectares
Coffee: Development of the area by VSS 2008‐2015
2008 2009 2010 2011 2012 2013 2014 2015
8
0
1,000,000
2,000,000
3,000,000
4,000,000
5,000,000
2008 2009 2010 2011 2012 2013 2014
Hectares
Coffee: Range of coffee area (minimum/maximum/average) 2008‐2014
Max Min Average
Source: FiBL‐IISD‐ITC survey 2016: 4C Association/Global Coffee Platform 2014, 2015, and 2015; Fairtrade International 2015 and 2016 (data up to 2014); FiBL‐IFOAM survey 2016 (data up to 2014); Rainforest Alliance/SAN 2014, 2015, and 2016; UTZ 2014, 2015, and 2016.
www.fibl.org
152
219
37 11
220
117
17339
2
195
154
460
433
201
642 90
2
449
208
838
1,199
425
229
847
1,502
738
1,53
0
0
500
1,000
1,500
2,000
Fairtrade Organic Rainforest Alliance UTZ
Thou
sand
hectares
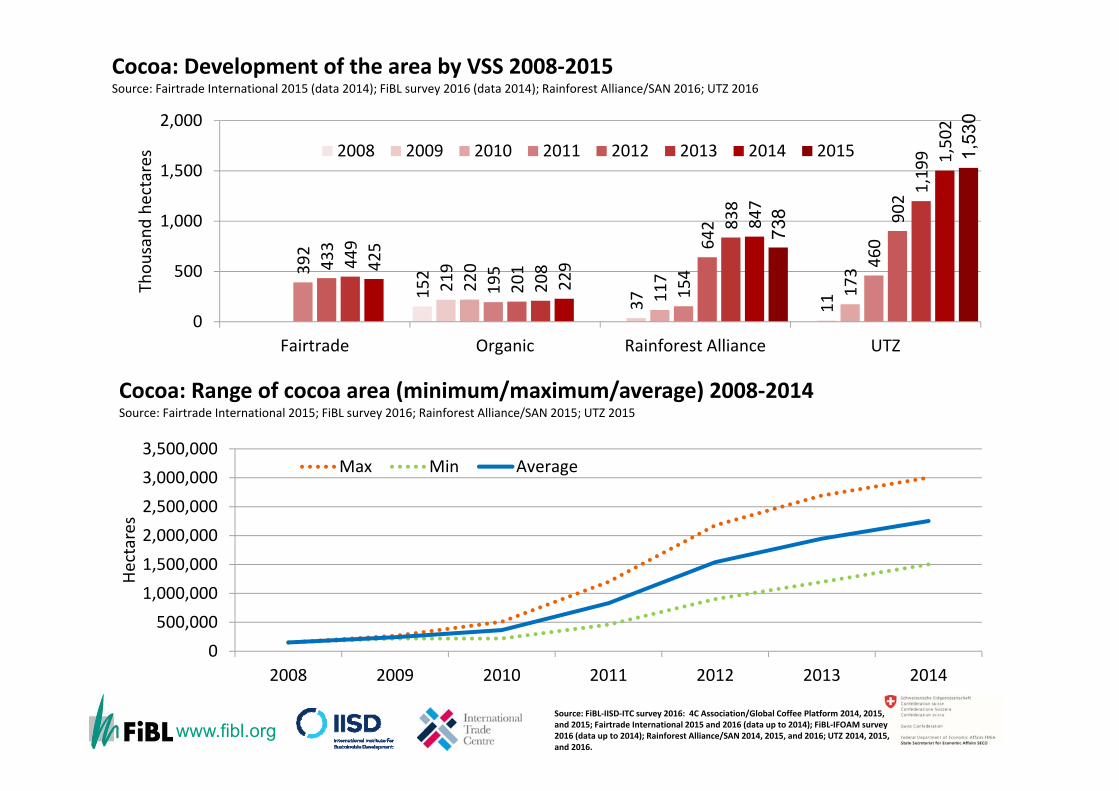
Cocoa: Development of the area by VSS 2008‐2015Source: Fairtrade International 2015 (data 2014); FiBL survey 2016 (data 2014); Rainforest Alliance/SAN 2016; UTZ 2016
2008 2009 2010 2011 2012 2013 2014 2015
9
0500,000
1,000,0001,500,0002,000,0002,500,0003,000,0003,500,000
2008 2009 2010 2011 2012 2013 2014
Hectares
Cocoa: Range of cocoa area (minimum/maximum/average) 2008‐2014Source: Fairtrade International 2015; FiBL survey 2016; Rainforest Alliance/SAN 2015; UTZ 2015
Max Min Average
Source: FiBL‐IISD‐ITC survey 2016: 4C Association/Global Coffee Platform 2014, 2015, and 2015; Fairtrade International 2015 and 2016 (data up to 2014); FiBL‐IFOAM survey 2016 (data up to 2014); Rainforest Alliance/SAN 2014, 2015, and 2016; UTZ 2014, 2015, and 2016.
www.fibl.org
Africa & Middle East
Latin America
Fairtrade International
Africa
Latin America
Asia
UTZ
Latin America
Africa
Other
Organic
Africa
Latin America
Asia
Rainforest Alliance/SAN
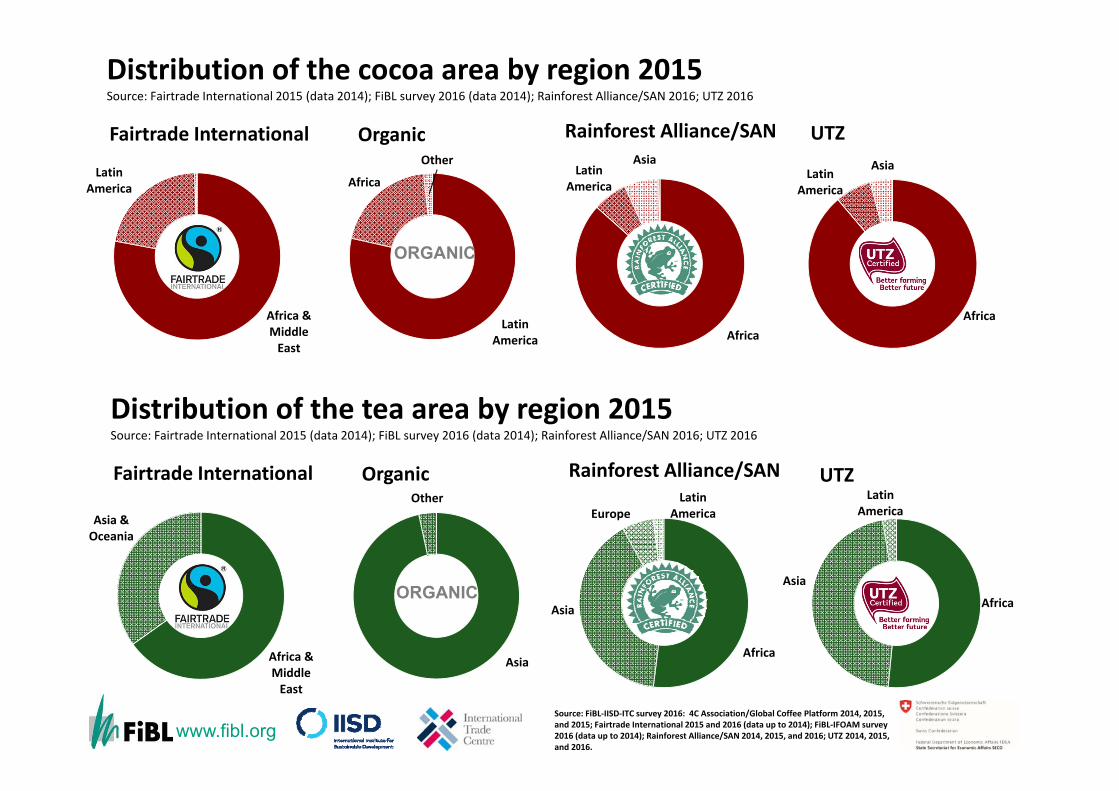
Distribution of the cocoa area by region 2015Source: Fairtrade International 2015 (data 2014); FiBL survey 2016 (data 2014); Rainforest Alliance/SAN 2016; UTZ 2016
Africa & Middle East
Asia & Oceania
Fairtrade International
Africa
Asia
Latin America
UTZ
Asia
Other
Organic
Africa
Asia
EuropeLatin
America
Rainforest Alliance/SAN
Distribution of the tea area by region 2015Source: Fairtrade International 2015 (data 2014); FiBL survey 2016 (data 2014); Rainforest Alliance/SAN 2016; UTZ 2016
ORGANIC
ORGANIC
Source: FiBL‐IISD‐ITC survey 2016: 4C Association/Global Coffee Platform 2014, 2015, and 2015; Fairtrade International 2015 and 2016 (data up to 2014); FiBL‐IFOAM survey 2016 (data up to 2014); Rainforest Alliance/SAN 2014, 2015, and 2016; UTZ 2014, 2015, and 2016.
www.fibl.org
The organic and the Fairtrade markets
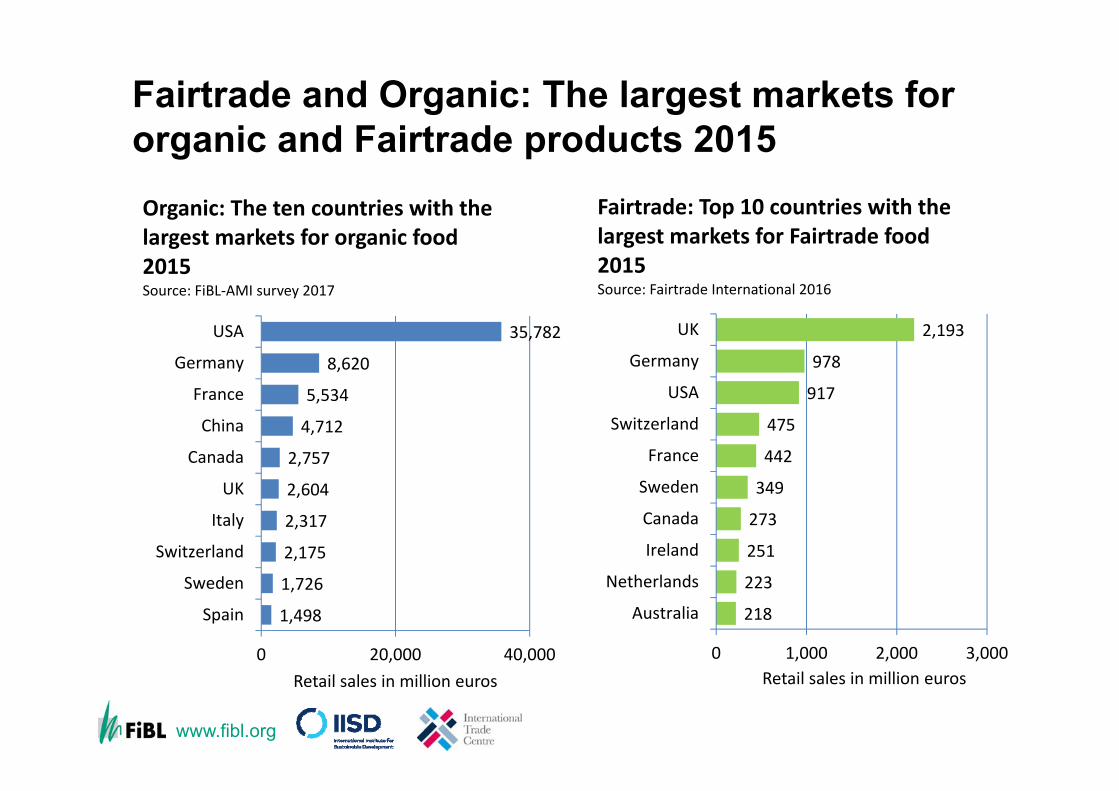
› Since 2000, when the global market for organic food was at approximately 16.5 billion euros (Organic Monitor), it has more than quadrupled, reaching approx. 75 euros in 2015. According to Fairtrade International, global Fairtrade sales reached 7.3 billion euros 2015.
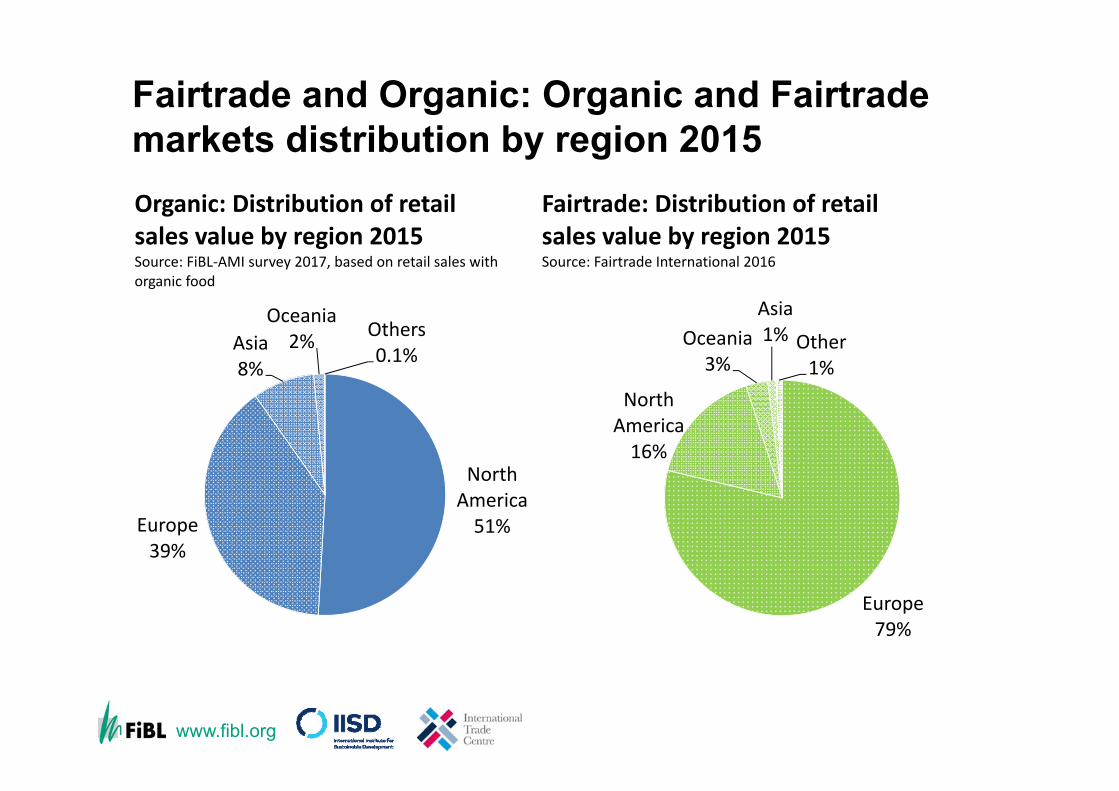
› About 90 percent of the sales of organic and Fairtrade products are in Europe and North America. North America is the largest organic market, with over 50 percent of the global organic market, while Europe represents almost 80 percent of Fairtrade retail sales.
› The variety of Fairtrade products is smaller than that of organic products. Currently, consumers can find almost all food products in organic quality, while the scope of Fairtrade products is smaller.
› When considering processed foods, another big difference emerges between organic and Fairtrade products. For a processed product to be labelled as organic, at least 95 percent of the ingredients of the final product need to be from organic-certified raw materials (IFOAM – Organics International 2014). In comparison, for a Fairtrade composite food product to carry the Fairtrade label, the product needs to have at least 50 percent of its ingredients Fairtrade-certified (Fairtrade International 2003).
11
www.fibl.org
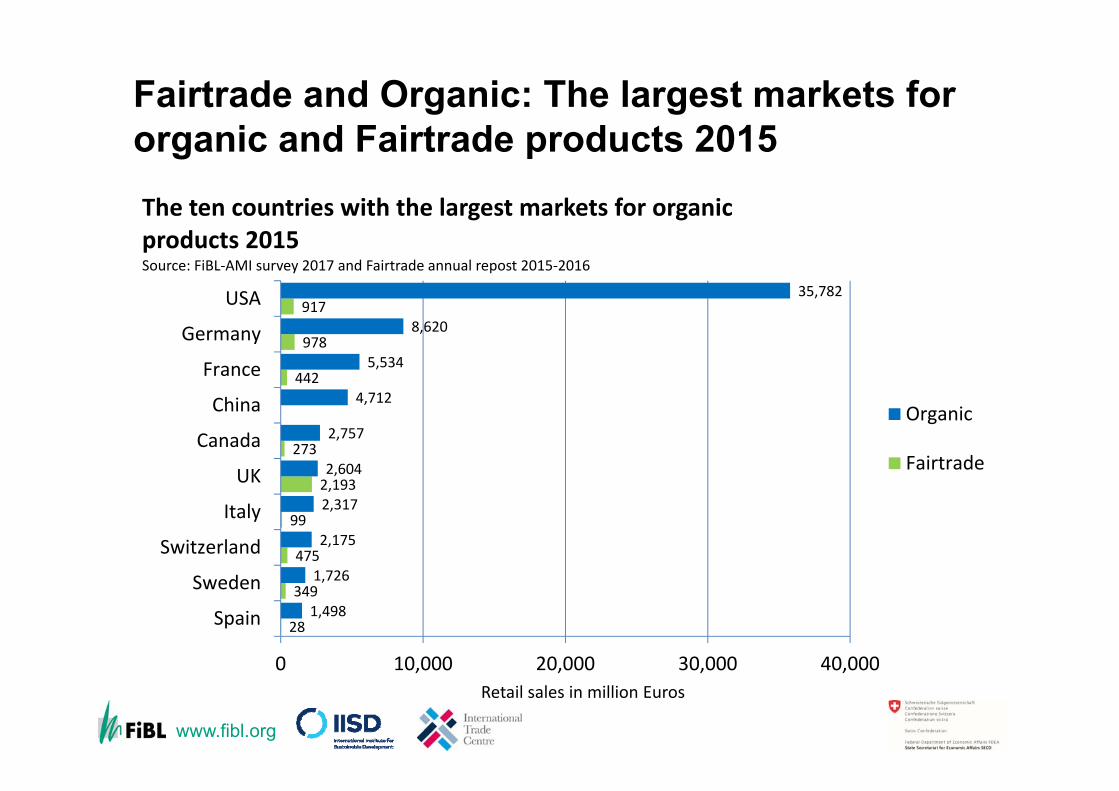
Fairtrade and Organic: The largest markets for organic and Fairtrade products 2015
12
28
349
475
99
2,193
273
442
978
917
1,498
1,726
2,175
2,317
2,604
2,757
4,712
5,534
8,620
35,782
0 10,000 20,000 30,000 40,000
Spain
Sweden
Switzerland
Italy
UK
Canada
China
France
Germany
USA
Retail sales in million Euros
The ten countries with the largest markets for organic products 2015Source: FiBL‐AMI survey 2017 and Fairtrade annual repost 2015‐2016
Organic
Fairtrade
www.fibl.org
1,498
1,726
2,175
2,317
2,604
2,757
4,712
5,534
8,620
35,782
0 20,000 40,000
Spain
Sweden
Switzerland
Italy
UK
Canada
China
France
Germany
USA
Retail sales in million euros
Organic: The ten countries with the largest markets for organic food 2015Source: FiBL‐AMI survey 2017
218
223
251
273
349
442
475
917
978
2,193
0 1,000 2,000 3,000
Australia
Netherlands
Ireland
Canada
Sweden
France
Switzerland
USA
Germany
UK
Retail sales in million euros
Fairtrade: Top 10 countries with the largest markets for Fairtrade food 2015Source: Fairtrade International 2016
Fairtrade and Organic: The largest markets for organic and Fairtrade products 2015
www.fibl.org
North America51%Europe
39%
Asia8%
Oceania2% Others
0.1%
Organic: Distribution of retail sales value by region 2015Source: FiBL‐AMI survey 2017, based on retail sales with organic food
Global market: Distribution of total retail sales value by single markets (total: 47.8 billion) Euros 2013
Europe79%
North America16%
Oceania3%
Asia1% Other
1%
Fairtrade: Distribution of retail sales value by region 2015Source: Fairtrade International 2016
Fairtrade and Organic: Organic and Fairtrade markets distribution by region 2015
www.fibl.org
77
83
106
111
127
142
170
177
191
262
0 100 200 300
Canada
France
Germany
USA
Austria
Liechtenstein
Luxembourg
Sweden
Denmark
Switzerland
Per capita consumption in euros
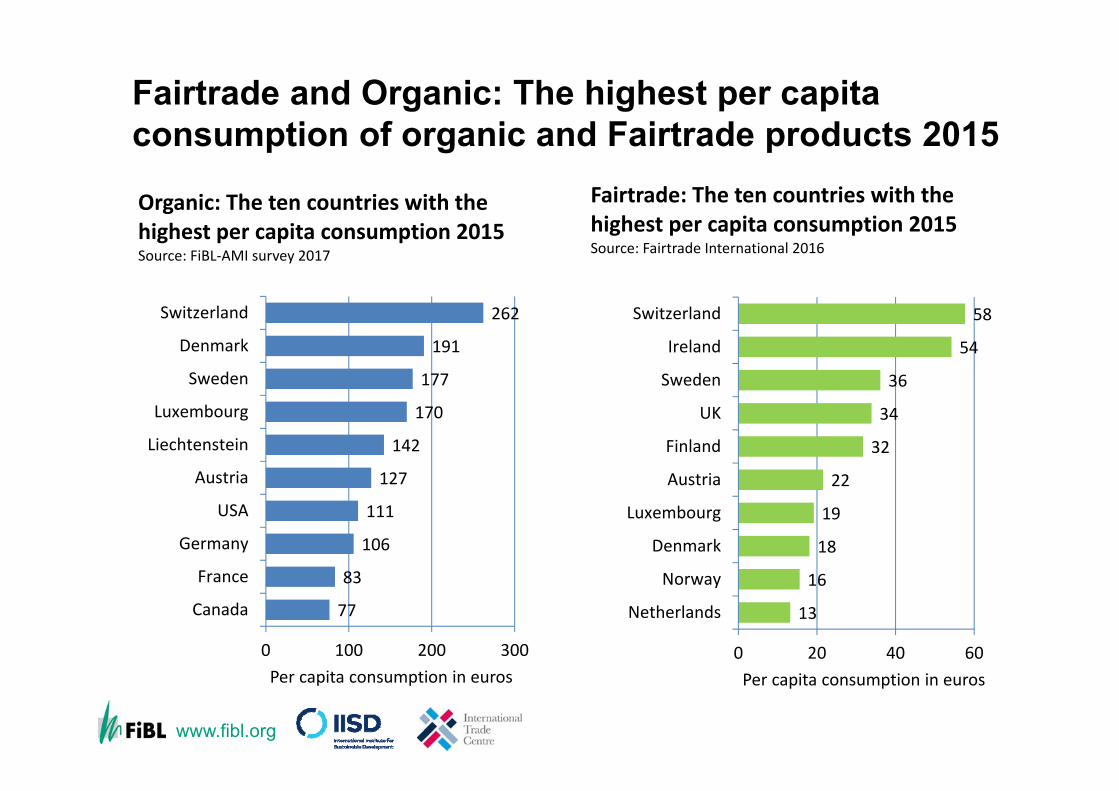
Organic: The ten countries with the highest per capita consumption 2015Source: FiBL‐AMI survey 2017
The ten countries with the largest per capita consumption for 2013
13
16
18
19
22
32
34
36
54
58
0 20 40 60
Netherlands
Norway
Denmark
Luxembourg
Austria
Finland
UK
Sweden
Ireland
Switzerland
Per capita consumption in euros
Fairtrade: The ten countries with the highest per capita consumption 2015Source: Fairtrade International 2016
Fairtrade and Organic: The highest per capita consumption of organic and Fairtrade products 2015
www.fibl.org
The State of Sustainable MarketsStatistics and Emerging Trends 2015
16
› Julia Lernoud, Jason Potts, Gregory Sampson, Vivek Voora, Helga Willer and Joseph Wozniak (2015): The State of Sustainable Markets – Statistics and Emerging Trends 2015. ITC, Geneva.
› http://www.intracen.org/publication/The-State-of-Sustainable-Markets/
› The 2017 edition of “The State of Sustainable Markets” will be launched at the 2017 ISEAL Conference, Zurich, June 2017
www.fibl.org
Conclusions
› Most of the VSS are growing very fast reaching high growth rates, but organic still has the lead with the most hectares certified worldwide
› Most of the VSS focus on a small range of products, and organic covers almost the whole product range
› Multiple certification takes place in almost all of the selected commodities, which makes it challenging to avoid double counting
› Market data: retail sales and international trade data is not available for most of the VSS
17