global peace index report 2015
TRANSCRIPT

Quantifying Peace and its Benefits
The Institute for Economics and Peace (IEP) is an independent, non-partisan, non-profit think tank dedicated to shifting the world’s focus to peace as a positive, achievable, and tangible measure of human well-being and progress.
IEP achieves its goals by developing new conceptual frameworks to define peacefulness; providing metrics for measuring peace; and uncovering the relationships between business, peace and prosperity as well as promoting a better understanding of the cultural, economic and political factors that create peace.
IEP has offices in Sydney, New York and Mexico City. It works with a wide range of partners internationally and collaborates with intergovernmental organizations on measuring and communicating the economic value of peace.
For more information visit www.economicsandpeace.org
EXECUTIVE SUMMARY 2
RESULTS AND FINDINGS 5Highlights
2015 Global Peace Index rankings 8
Regional overview 10
Risers and fallers 16
GPI domain and indicator: Annual changes 20
Trends in the Global Peace Index domains 22
Ongoing domestic and international conflict 23
Societal safety and security 29
Militarisation 35
TRENDS IN PEACE 43Highlights 45
Eight-year trends 46
Indicator trends 49
Regional trends 55
Global distribution of peace 59
GLOBAL ECONOMIC VALUE OF PEACE 63Highlights 65
Conceptual overview and methodology 68
Global violence containment: Results and trends 72
Trends in global violence containment expenditure 74
Countries with the highest cost of violence containment as a per cent of GDP 77
Countries with the highest cost of violence containment expenditure 78
POSITIVE PEACE 79Why Positive Peace is transformational 81
Defining and measuring Positive Peace 82
Positive Peace and resistance movements 91
Positive Peace and the close link to other development goals 94
Five post-conflict countries with largest Positive Peace improvements 97
ANNEXES 99Annex A: GPI methodology 100
Annex B: GPI indicator sources, definitions and scoring criteria 103
Annex C: Violence containment costs by country 112
Annex D: 2015 GPI Domain Scores 114
REFERENCES 117
END NOTES 120
CONTENTS
1
2
3
4
EXECUTIVE SUMMARY
In addition to presenting the findings from the 2015 GPI and
its eight-year trend analysis, this year’s report provides an
updated methodology to account for the economic impact of
violence on the global economy. The report also contains a new
analysis on Positive Peace and describes its relationship to
development and other significant and positive societal
outcomes. A detailed thematic analysis of the three
aforementioned domains of the GPI is also included.
Last year the global GPI score remained stable. However,
while the average level of global peacefulness was stable, a
number of indicators and countries did deteriorate while
others improved. Four out of the nine geographical regions
experienced an improvement in peace: Europe, North America,
sub-Saharan Africa and Central America and the Caribbean.
The other five regions became less peaceful. The most
substantial changes in the Index occurred in the Middle East
and North Africa (MENA) where several countries suffered
from an upsurge in violence related to sectarian strife and civil
conflicts, resulting in the region being ranked as the least
peaceful in the world.
The societal safety and security domain improved slightly last
year, driven by falls in the homicide rate and the likelihood of
violent demonstrations. The improvements in homicide rates
mainly reflected data updates in some high homicide countries.
This improvement was counterbalanced by deteriorations in
the ongoing conflict and militarisation domains, owing to
increases in deaths from internal conflict, non-payment of UN
peacekeeping dues, and a continuing deterioration in the
impact of terrorism indicator.
Iceland is the most peaceful country, with the ten highest
ranking nations in the GPI all being stable democracies. Nordic
and Alpine countries are particularly well represented.
Asia-Pacific is also represented at the top, with New Zealand
ranked 4th, Japan at 8th and Australia at 9th.
MENA now ranks as the most violent region, overtaking South
Asia from last year’s GPI. Yet again, Europe maintained its
position as the most peaceful region in the world, supported
by a lack of domestic and external conflicts. It was also the
region that experienced the largest improvement in its score
compared with 2014, continuing its eight-year trend of
improving peacefulness.
This year Guinea-Bissau had the largest improvement in peace,
resulting in a rise of 24 places in the rankings to 120th. The next
four largest improvements occurred in Cote d’Ivoire, Egypt,
Tajikistan and Benin. A common theme among the largest
improvers was a fall in the level of organised conflict, which
occurred in all of the four aforementioned African nations.
Cancelling out its strong improvement in the 2014 edition of
the GPI, Libya experienced the largest deterioration this year.
Its score deteriorated substantially and consequently it fell 13
places down to 149th to become the 14th least peaceful country.
Unsurprisingly the second biggest decline was recorded for the
Ukraine, due to the conflict between Russian separatists and
the Ukrainian government as well as the instability caused by
Russia’s annexation of Crimea. Other countries that
substantially deteriorated were Djibouti and Niger which fell
42 and 28 places, respectively.
Over the past eight years the average country score
deteriorated 2.4 percent, highlighting that on average the world
has become slightly less peaceful. However, this decrease in
peacefulness has not been evenly spread, with 86 counties
deteriorating while 76 improved. MENA has suffered the largest
decline of any region in the world, deteriorating 11 per cent over
the past eight years.
The eight-year downward trend in peacefulness has been driven
predominately by the deterioration in indicators of internal
peacefulness. Of the five key indicators which deteriorated by
more than five per cent, four are internal and one external:
This is the ninth edition of the Global Peace Index (GPI), which ranks the nations of the world according to their level of peacefulness. The index is composed of 23 qualitative and quantitative indicators from highly respected sources and ranks 162 independent states, covering 99.6 per cent of the world’s population. The index gauges global peace using three broad themes: the level of safety and security in society, the extent of domestic and international conflict and the degree of militarisation.
2GLOBAL PEACE INDEX 2015
only accounts for less than 0.17 per cent of violence
containment expenditure.
The report outlines new findings on Positive Peace,
highlighting its impact on peace, development and other
important societal goals. In societies where Positive Peace is
stronger, developmental goals are more likely to be achieved.
These societies are more resilient when faced with crisis and
have fewer grievances. They are more likely to achieve
non-violent positive outcomes when faced with resistance
movements and are more likely to adapt and make concessions
to reconcile grievances. Additionally, Positive Peace is also
statistically associated with many other outcomes considered
desirable: stronger business environments, better performance
on well-being measures, gender equality and better
performance on ecological measures.
The report also includes a thematic analysis of the three domains
of the GPI:
Ongoing domestic and international conflicts: This section comments on the six major MENA conflicts
occurring in Syria, Iraq, Yemen, Libya, Israel and Lebanon.
It identifies many of the drivers of these conflicts, which
include challenges to government legitimacy, deepening
sectarian divides, the destabilising presence of ISIL and the
cross-cutting proxy conflict between Saudi Arabia and Iran.
Societal safety and security: This section analyses the effects of urbanisation on violence,
and finds that peace generally increases with higher levels of
urbanisation. This is a by-product of higher levels of
development. However, countries that have weak rule of law,
high levels of intergroup grievances and high levels of
inequality are more likely to experience deteriorations in
peace as urbanisation increases.
Militarisation: Since 1990, there has been a slow and steady decrease in
measures of global militarisation, with large changes in
militarisation occurring rarely and usually associated with
larger, globally driven geopolitical and economic shifts.
Surprisingly, very few major socio-economic measures are
associated with militarisation; however, the research did find
that countries with weak Positive Peace factors are more likely
to use the military for internal suppression.
refugees and IDPs as a percentage of the population, deaths
from internal conflict, the impact of terrorism, the likelihood
of violent demonstrations and perceptions of criminality.
The deterioration in the indicators measuring the number of
refugees and IDPs and the impact of terrorism is most
concerning. The latest UNHCR estimates indicate that more
than 50 million people are now either refugees or internally
displaced because of conflict and violence, which is the highest
number since the end of the Second World War. A third of
people displaced by conflict inside their own countries in 2014
are in Iraq and Syria alone.
Terrorism has grown steadily over the last decade, a trend that
shows no sign of abating. Deaths caused by terrorism increased
by 61 per cent in 2013, which resulted in almost 18,000 people
being killed in terrorist attacks. Of those deaths, 82 per cent
occurred in just five countries: Iraq, Afghanistan, Pakistan,
Nigeria and Syria. The threat of terrorism has also affected many
of the world’s most peaceful countries, with terrorist attacks
occurring in France, Denmark and Australia in the last year.
On the positive side, several indicators of external peacefulness
actually improved over the last eight years. Relations with
neighbouring countries has grown stronger, particularly in
South America, financial contributions to UN peacekeeping
funding has improved and the number and intensity of external
conflicts has fallen as many countries wound down their
military involvement in Iraq and Afghanistan.
It is important to note that peace is becoming more unevenly
distributed. While Europe continued its long-term trend of
improvement, the Middle East continued its recent trend of
deterioration, further increasing the distance between the
most and least peaceful regions and countries. In Europe and
in many other developed countries, homicide rates and other
forms of interpersonal violence continue to drop and are at
historic lows.
In 2008, there were only three countries that had a score worse
than 3 out of 5: Somalia, Iraq and Sudan. However, by 2015 this
increased to nine countries: Syria, Iraq, Afghanistan, South
Sudan, Central African Republic, Somalia, Sudan, Democratic
Republic of the Congo and Pakistan, highlighting the further
deterioration amongst the least peaceful countries in the world.
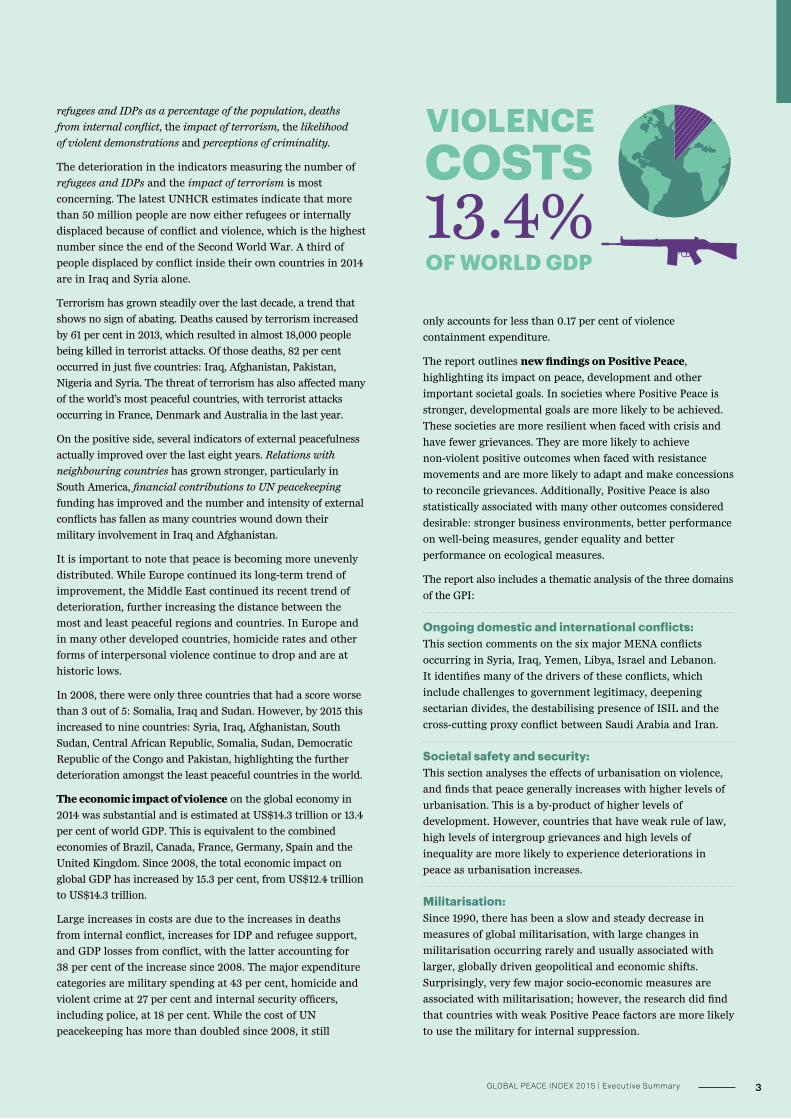
The economic impact of violence on the global economy in
2014 was substantial and is estimated at US$14.3 trillion or 13.4
per cent of world GDP. This is equivalent to the combined
economies of Brazil, Canada, France, Germany, Spain and the
United Kingdom. Since 2008, the total economic impact on
global GDP has increased by 15.3 per cent, from US$12.4 trillion
to US$14.3 trillion.
Large increases in costs are due to the increases in deaths
from internal conflict, increases for IDP and refugee support,
and GDP losses from conflict, with the latter accounting for
38 per cent of the increase since 2008. The major expenditure
categories are military spending at 43 per cent, homicide and
violent crime at 27 per cent and internal security officers,
including police, at 18 per cent. While the cost of UN
peacekeeping has more than doubled since 2008, it still
3GLOBAL PEACE INDEX 2015 | Executive Summary
GLOSSARY
The following terms used throughout the 2015 Global Peace Index Report are defined here for reference:
Correlation
The statistical relationship between two variables. IEP uses linear
correlations to compare the strength of the association between
different variables.
Correlation coefficient
A value between -1 and 1 that shows the strength of the correlation
between two variables, where -1 means a perfect negative correlation,
0 means no correlation and 1 means a perfect positive correlation.
Direct cost of violence
Costs which are directly attributed to a specific form of violence or
violence prevention. This includes items such as materials, expenses
and labour. For example, the direct costs of violent crime can include
such items as court and hospital costs.
Economic impact of violence
Includes the total direct and indirect costs of violence multiplied by a
factor of two. This represents the total flow on effects on the world
economy and the opportunity cost due to the misallocation of resources
into non-productive areas associated with violence.
External peace
A set of indicators that measures how peaceful a country is outside its
national borders.
Global Peace Index (GPI) domains:
§ Ongoing domestic and international conflictIndicators of the number and intensity of ongoing civil and
international wars.
§ Societal safety and securityIndicators of the levels of safety and security within a country, such
as the perception of criminality in society, the level of political
instability and the rate of homicides and violent crimes.
§ MilitarisationIndicators of a nation’s military capacity, both in terms of the
economic resources committed to the military and support for
multilateral operations.
Indirect cost of violence
Accounts for costs that are not directly related to an act of violence and
accrue over the long run. This can include losses of income due to injury
or pain or grievance of others who were not directly involved in the crime.
Internal peace
A set of indicators that measures how peaceful a country is inside its
national borders.
Multiplier
A factor of proportionality that estimates how much one variable
changes in response to a change in another variable. For example, the
economic impact of violence is calculated using a multiplier of two.
Negative Peace
The absence of violence or fear of violence.
Positive Peace
The attitudes, institutions and structures which create and sustain
peaceful societies. These same factors also lead to many other positive
outcomes that support the optimum environment for human potential
to flourish.
Positive Peace Index (PPI)
A composite measurement of Positive Peace based on 24 indicators
grouped into eight domains.
Resilience
The ability of a country to absorb and recover from shocks, for example
natural disasters or fluctuations in commodity prices.
Significant
Of high importance or noteworthiness.
Significant, statistically
A result that is unlikely to be due to chance alone, as measured
statistically using probability. A standard definition is a p-score of less
than .05. This means that there is only a 5% chance that the results of
an analysis are due to chance.
Violence containment
Economic activity related to the consequences or prevention of violence
where the violence is directed against people or property.
4GLOBAL PEACE INDEX 2015 | Executive Summary4
RESULTS & FINDINGS
5GLOBAL PEACE INDEX 2015
HIGHLIGHTS
The most substantial change in the index was
recorded for the Middle East and North Africa
(MENA) — where several countries suffered from an
upsurge in violence related to sectarian strife and
civil conflicts, as well as a rise in actions by Islamist
extremist groups. It was followed by South America,
where ypeacefulness was most affected in some
countries by a rise in the perceptions of criminality
and in popular protests. MENA now ranks as the
most violent region, overtaking South Asia (which
includes Afghanistan) from last year’s GPI. Yet again,
Europe maintained its position as the most peaceful
region in the world, supported by a lack of domestic
and external conflicts. It was also the region that
experienced the largest relative improvement in its
score compared with 2014.
In terms of societal safety and security, there was a
modest deterioration in the score for violent crime,
even though there was improvement in the
homicide rate. Globally, the incarceration rate
increased. Latin America remained the world’s most
violent region in terms of societal safety and
security, as highlighted by its poor results in most
related categories. This is particularly the case for
Central America and the Caribbean, the lowest
ranked region and where many of the world’s
highest homicide rates can be found. There was a
general improvement in the score for political instability,
with only Asia-Pacific recording a slight erosion.
However, political terror worsened overall, the result of
a deterioration in South America, Central America and
the Caribbean, South Asia and especially MENA. In the
case of Latin America, this may reflect a harder line
taken by security forces to deal with crime, civil protests
and guerrilla movements (in the case of Colombia). In
MENA it results from growing civil conflicts and terrorist
acts by extremist groups, along with efforts by state
security forces to counter these challenges. On the
other hand, the score decreased overall for the
likelihood of violent demonstrations, driven by
improvements in Europe, Central America and the
Caribbean, sub-Saharan Africa and MENA (the latter as
protests related to the Arab Spring abated). Finally, the
number of refugees and IDPs rose during the past year,
exacerbated by an increase in the intensity of internal
conflict in MENA and Sub-Saharan Africa, but also in
certain Latin American countries, notably Colombia.
In Colombia, a potential peace agreement being
negotiated between government and leftist guerrilla
groups offers hope of an end to the region’s longest-
standing conflict.
With regards to ongoing domestic and international
conflict, there was a modest improvement in the
number of deaths from external conflict, driven by a
better score for Europe. All other regions showed no
change. Relations with neighbouring countries
deteriorated in Europe, resulting from score changes
for the Baltic states, and in MENA; driven by a large
The 2015 Global Peace Index score remained stable compared with 2014, but still registered a worse performance than in 2008. For 2015, four out of the nine geographical regions experienced an improvement in peace while five became less peaceful.
6GLOBAL PEACE INDEX 2015 | Results & Findings
in most regions, with the exception of Russia and
Eurasia, reflecting the continued flow of Russian
arms to the MENA region. Much of this has been sent
to support Syrian government forces against the
rebels which, in contrast, have received much lower
quantities of weaponry from the West.
In terms of nuclear and heavy weapons capabilities,
this variable was stable in the 2015 index versus 2014.
The improvement registered in 2014 may reverse as
Middle East countries seek to bolster their
capabilities amid broadening conflict in countries
such as Yemen (where a coalition of neighbouring
countries led by Saudi Arabia have engaged in air
strikes). An increase in aggressions by Russia against
Ukraine could also trigger rearmament among NATO
countries. This would be particularly evident in some
of the NATO states bordering or close to Russia but
could also affect core countries like Germany which
over the past few years have trimmed down their
armed forces and stocks of heavy weaponry.
change for Libya. Although there were no new wars
between countries, tense relationships between the
two Koreas, concerns over China’s growing military
assertiveness in the Asia-Pacific region, the potential
further expansion of the Middle East conflicts across
borders, and the possibility that conflict between
Russia and the Ukraine escalates into all out military
confrontation suggest these may become hotspots
for international conflict in the future. In the case of
deaths from internal conflict, the scores for most
regions deteriorated (the exceptions being South
America and Central America and the Caribbean).
The individual countries with the biggest score
erosion for this indicator were Ukraine and Central
African Republic, owing to ongoing and worsening
civil wars. For the indicator of internal conflicts
fought, internal conflict escalated most in the Middle
East and North Africa. The situation improved in
South America and South Asia.
Lastly, the militarisation domain was characterised by
stability in the armed services personnel rate
globally. However, this masked increases in personnel
in sub-Saharan Africa and Asia-Pacific, as these were
offset by decreases in MENA. By contrast, military
expenditure as a percentage of GDP increased
globally; three regions, Europe, North America and
Asia-Pacific, posted a reduction in military
expenditure, while the others registered increases.
The arms trade (exports) saw a fall or remained stable
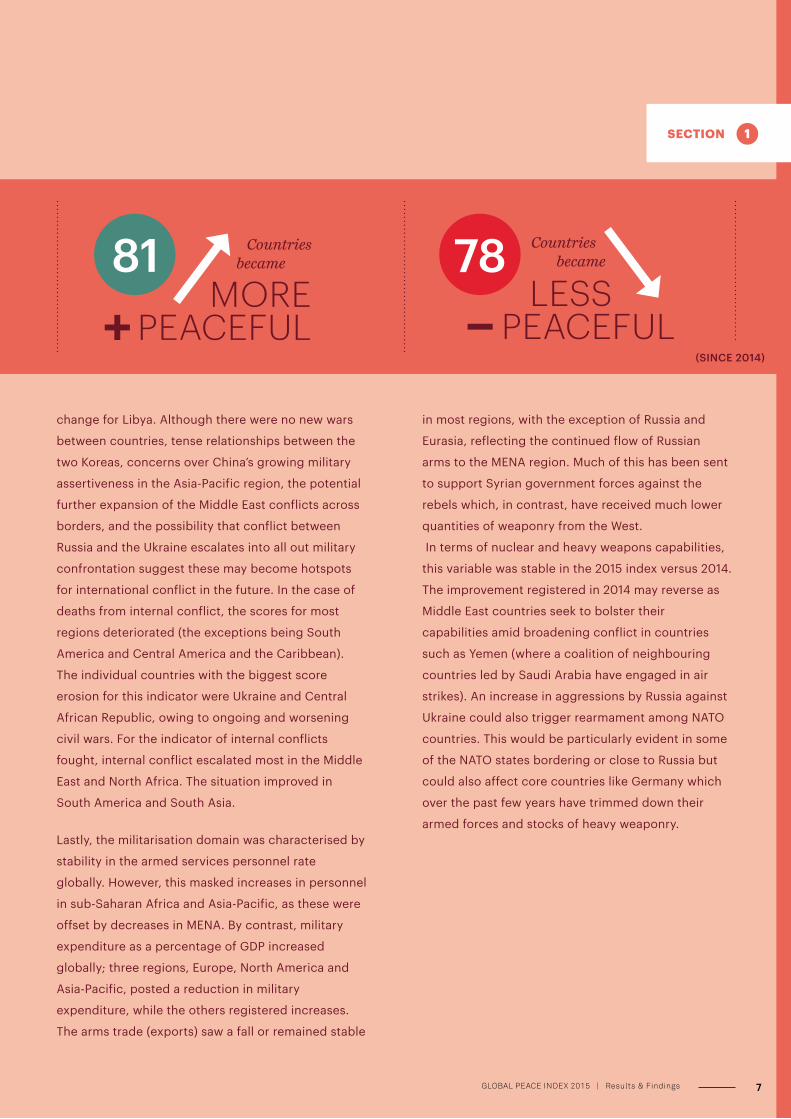
(SINCE 2014)
MORE PEACEFUL
Countries
became
LESSPEACEFUL
7GLOBAL PEACE INDEX 2015 | Results & Findings

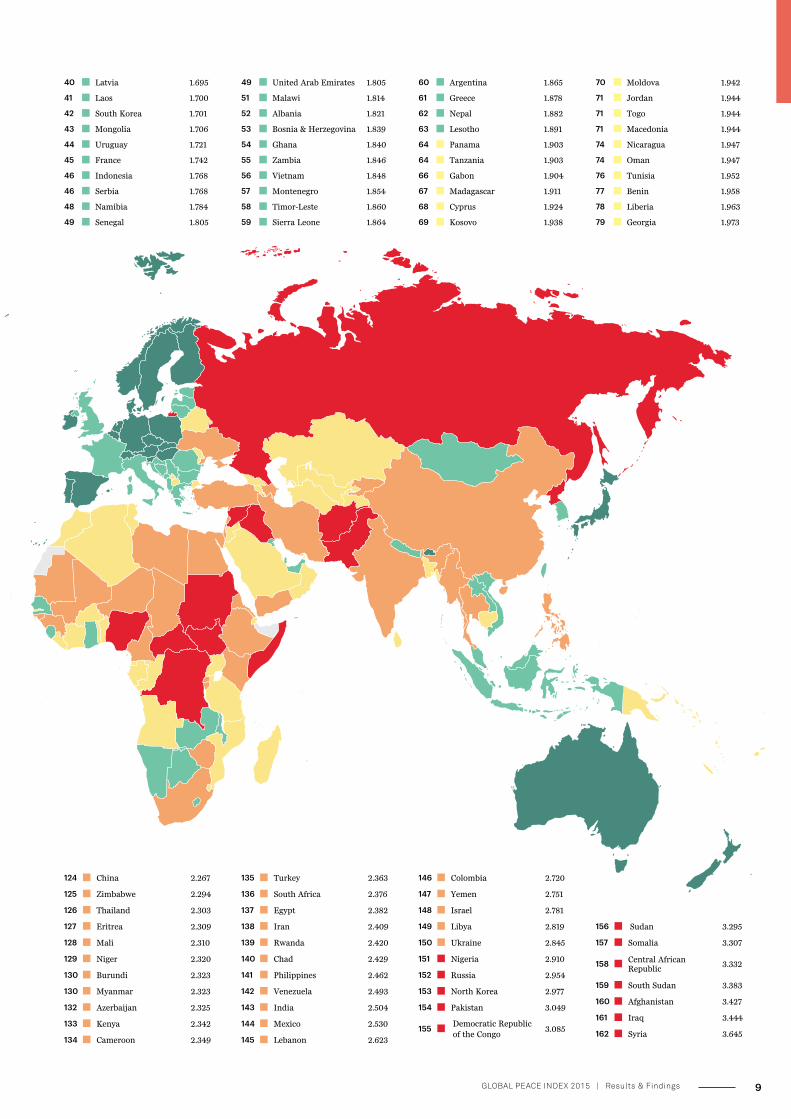
A SNAPSHOT OF THE GLOBAL STATE OF PEACE
2015 GLOBAL PEACE INDEX
80 Mozambique 1.976
81 Equatorial Guinea 1.987
82 Cuba 1.988
83 Burkina Faso 1.994
84 Bangladesh 1.997
84 Ecuador 1.997
86 Morocco 2.002
87 Kazakhstan 2.008
88 Angola 2.020
89 Paraguay 2.023
90 Bolivia 2.025
91 Armenia 2.028
92 Guyana 2.029
92 Peru 2.029
94 United States 2.038
95 Saudi Arabia 2.042
96 Papua New Guinea 2.064
97 Trinidad and Tobago 2.070
98 Haiti 2.074
99 Gambia 2.086
100 Dominican Republic 2.089
101 Swaziland 2.102
102 Djibouti 2.113
103 Brazil 2.122
104 Algeria 2.131
105 Cote d'Ivoire 2.133
106 Turkmenistan 2.138
107 Bahrain 2.142
108 Tajikistan 2.152
109 Jamaica 2.153
110 Belarus 2.173
111 Cambodia 2.179
111 Uganda 2.179
113 Uzbekistan 2.187
114 Sri Lanka 2.188
115 Congo 2.196
116 Honduras 2.210
117 Guinea 2.214
118 Guatemala 2.215
119 Ethiopia 2.234
120 Guinea-Bissau 2.235
121 Kyrgyzstan 2.249
122 Mauritania 2.262
123 El Salvador 2.263
1 Iceland 1.148
2 Denmark 1.150
3 Austria 1.198
4 New Zealand 1.221
5 Switzerland 1.275
6 Finland 1.277
7 Canada 1.287
8 Japan 1.322
9 Australia 1.329
10 Czech Republic 1.341
11 Portugal 1.344
12 Ireland 1.354
13 Sweden 1.360
14 Belgium 1.368
15 Slovenia 1.378
16 Germany 1.379
17 Norway 1.393
18 Bhutan 1.416
19 Poland 1.430
20 Netherlands 1.432
21 Spain 1.451
22 Hungary 1.463
23 Slovakia 1.478
24 Singapore 1.490
25 Mauritius 1.503
26 Romania 1.542
27 Croatia 1.550
28 Malaysia 1.561
29 Chile 1.563
30 Qatar 1.568
31 Botswana 1.597
32 Bulgaria 1.607
33 Kuwait 1.626
34 Costa Rica 1.654
35 Taiwan 1.657
36 Italy 1.669
37 Lithuania 1.674
38 Estonia 1.677
39 United Kingdom 1.685
RANK COUNTRY SCORE
RANK COUNTRY SCORE
Very high
High
Medium
Low
Very low
Not included
THE STATE OF PEACE
8GLOBAL PEACE INDEX 2015 | Results & Findings
124 China 2.267
125 Zimbabwe 2.294
126 Thailand 2.303
127 Eritrea 2.309
128 Mali 2.310
129 Niger 2.320
130 Burundi 2.323
130 Myanmar 2.323
132 Azerbaijan 2.325
133 Kenya 2.342
134 Cameroon 2.349
135 Turkey 2.363
136 South Africa 2.376
137 Egypt 2.382
138 Iran 2.409
139 Rwanda 2.420
140 Chad 2.429
141 Philippines 2.462
142 Venezuela 2.493
143 India 2.504
144 Mexico 2.530
145 Lebanon 2.623
146 Colombia 2.720
147 Yemen 2.751
148 Israel 2.781
149 Libya 2.819
150 Ukraine 2.845
151 Nigeria 2.910
152 Russia 2.954
153 North Korea 2.977
154 Pakistan 3.049
155 Democratic Republic of the Congo
3.085
156 Sudan 3.295
157 Somalia 3.307
158 Central African Republic
3.332
159 South Sudan 3.383
160 Afghanistan 3.427
161 Iraq 3.444
162 Syria 3.645
40 Latvia 1.695
41 Laos 1.700
42 South Korea 1.701
43 Mongolia 1.706
44 Uruguay 1.721
45 France 1.742
46 Indonesia 1.768
46 Serbia 1.768
48 Namibia 1.784
49 Senegal 1.805
49 United Arab Emirates 1.805
51 Malawi 1.814
52 Albania 1.821
53 Bosnia & Herzegovina 1.839
54 Ghana 1.840
55 Zambia 1.846
56 Vietnam 1.848
57 Montenegro 1.854
58 Timor-Leste 1.860
59 Sierra Leone 1.864
60 Argentina 1.865
61 Greece 1.878
62 Nepal 1.882
63 Lesotho 1.891
64 Panama 1.903
64 Tanzania 1.903
66 Gabon 1.904
67 Madagascar 1.911
68 Cyprus 1.924
69 Kosovo 1.938
70 Moldova 1.942
71 Jordan 1.944
71 Togo 1.944
71 Macedonia 1.944
74 Nicaragua 1.947
74 Oman 1.947
76 Tunisia 1.952
77 Benin 1.958
78 Liberia 1.963
79 Georgia 1.973
9GLOBAL PEACE INDEX 2015 | Results & Findings

REGIONAL OVERVIEW
EUROPE OVERALL RANK
OVERALL SCORE
CHANGE IN SCORE
REGIONAL RANK
Iceland 1 1.148 -0.002 1
Denmark 2 1.150 +0.010 2
Austria 3 1.198 -0.003 3
Switzerland 5 1.275 -0.036 4
Finland 6 1.277 -0.016 5
Czech Republic 10 1.341 -0.030 6
Portugal 11 1.344 -0.045 7
Ireland 12 1.354 -0.006 8
Sweden 13 1.360 -0.006 9
Belgium 14 1.368 0.020 10
Slovenia 15 1.378 -0.008 11
Germany 16 1.379 -0.024 12
Norway 17 1.393 +0.013 13
Poland 19 1.430 -0.050 14
Netherlands 20 1.432 -0.035 15
Spain 21 1.451 -0.079 16
Hungary 22 1.463 +0.010 17
Slovakia 23 1.478 +0.008 18
Romania 26 1.542 -0.040 19
Croatia 27 1.550 +0.009 20
Bulgaria 32 1.607 +0.037 21
Italy 36 1.669 +0.026 22
Lithuania 37 1.674 -0.026 23
Estonia 38 1.677 +0.064 24
United Kingdom 39 1.685 -0.091 25
Latvia 40 1.695 +0.010 26
France 45 1.742 -0.006 27
Serbia 46 1.768 -0.104 28
Albania 52 1.821 -0.051 29
Bosnia and Herzegovina 53 1.839 +0.003 30
Montenegro 57 1.854 -0.004 31
Greece 61 1.878 -0.123 32
Cyprus 68 1.924 +0.011 33
Kosovo 69 1.938 0.000 34
Macedonia (FYR) 71 1.944 -0.057 35
Turkey 135 2.363 +0.027 36
REGIONAL AVERAGE 1.566
TABLE 1 EUROPE RANKINGSEUROPEEurope remained the most peaceful geographical region
in the world, securing the top three positions in the
Global Peace Index. Iceland came out on top as the
most peaceful country in the world. Denmark’s score
fell moderately following its decision to increase
military expenditure and due to the impact of terrorism
as a result of the 2015 Copenhagen shootings. France
and Belgium also saw their scores worsen owing to the
impact of terrorism; France’s score was pulled down
largely by the terror attack on the offices of the Charlie
Hebdo magazine.
Greece was the region’s greatest improver, jumping 22
places in the global rankings. The country experienced
an improvement in a host of indicators, including
reduced violent crime and political terror. In spite of a
still economically problematic situation, the country has
stabilised, particularly for indicators in the social safety
and security domain. Portugal was the greatest
improver locally, jumping five places in the both the
global and European rankings. Portugal’s score was
boosted by a reduction in political instability following
its exit from the EU/IMF economic and financial
adjustment programme. Like neighbouring Spain,
Portugal also benefitted from a reduction in the
likelihood of violent demonstrations at anti-austerity
marches. The Balkan countries were again among the
biggest gainers. As was the case in 2014, the
improvement in their scores was primarily due to a
reduction in military expenditure as a percentage of
GDP—a trend that was largely followed across the wider
region. A reduction in political instability also
contributed to the improvement in the score for these
countries. Serbia’s score for political instability was
reduced after one party, the Serbian Progressive Party,
won an outright majority in the March 2014 election—
marking a turning point in the country’s post-
communist history.
A number of countries across the region saw their score
improve for external conflicts fought. This can primarily
be accounted for by the withdrawal of NATO-led forces
from Afghanistan in December 2014. The UK, a major
player in Afghanistan, rose eight places in the global
rankings as a result of its exit from the Afghan mission.
10GLOBAL PEACE INDEX 2015 | Results & Findings
NORTH AMERICA
OVERALL RANK
OVERALL SCORE
CHANGE IN SCORE
REGIONAL RANK
Canada 7 1.287 +0.012 1
United States of America
94 2.038 -0.037 2
REGIONAL AVERAGE 1.662
TABLE 2 NORTH AMERICA RANKINGS
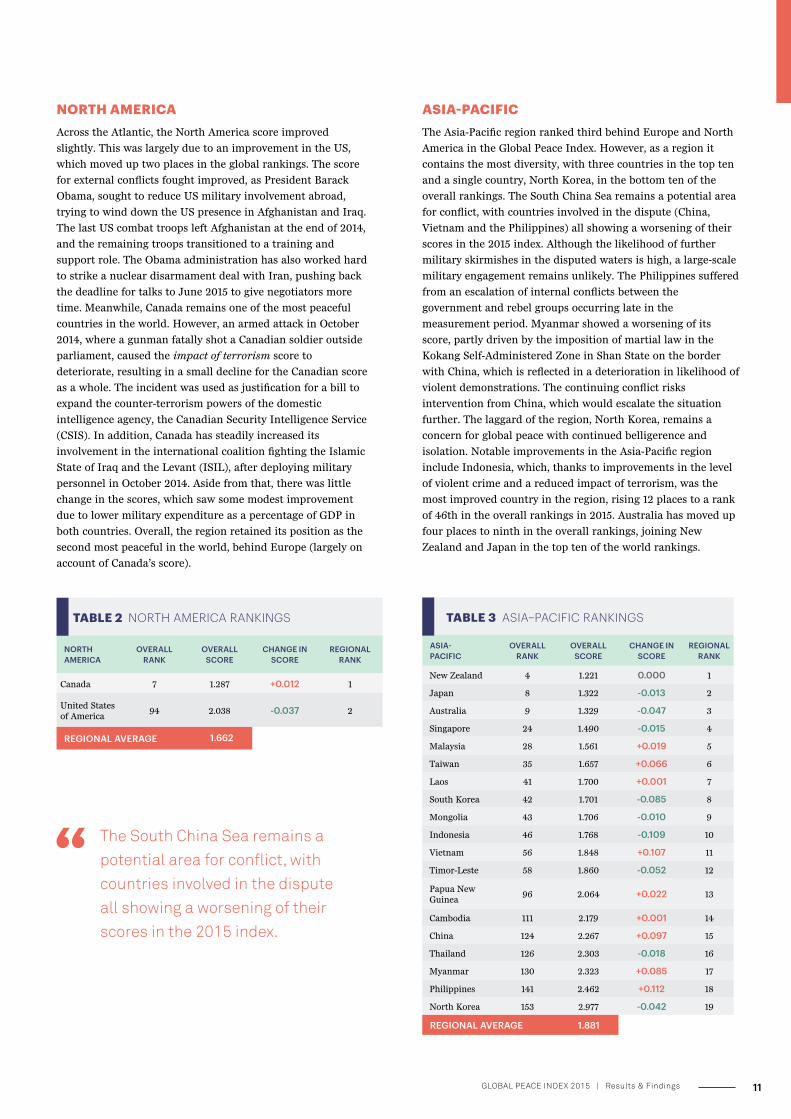
ASIA-PACIFICThe Asia-Pacific region ranked third behind Europe and North
America in the Global Peace Index. However, as a region it
contains the most diversity, with three countries in the top ten
and a single country, North Korea, in the bottom ten of the
overall rankings. The South China Sea remains a potential area
for conflict, with countries involved in the dispute (China,
Vietnam and the Philippines) all showing a worsening of their
scores in the 2015 index. Although the likelihood of further
military skirmishes in the disputed waters is high, a large-scale
military engagement remains unlikely. The Philippines suffered
from an escalation of internal conflicts between the
government and rebel groups occurring late in the
measurement period. Myanmar showed a worsening of its
score, partly driven by the imposition of martial law in the
Kokang Self-Administered Zone in Shan State on the border
with China, which is reflected in a deterioration in likelihood of
violent demonstrations. The continuing conflict risks
intervention from China, which would escalate the situation
further. The laggard of the region, North Korea, remains a
concern for global peace with continued belligerence and
isolation. Notable improvements in the Asia-Pacific region
include Indonesia, which, thanks to improvements in the level
of violent crime and a reduced impact of terrorism, was the
most improved country in the region, rising 12 places to a rank
of 46th in the overall rankings in 2015. Australia has moved up
four places to ninth in the overall rankings, joining New
Zealand and Japan in the top ten of the world rankings.
ASIA- PACIFIC
OVERALL RANK
OVERALL SCORE
CHANGE IN SCORE
REGIONAL RANK
New Zealand 4 1.221 0.000 1
Japan 8 1.322 -0.013 2
Australia 9 1.329 -0.047 3
Singapore 24 1.490 -0.015 4
Malaysia 28 1.561 +0.019 5
Taiwan 35 1.657 +0.066 6
Laos 41 1.700 +0.001 7
South Korea 42 1.701 -0.085 8
Mongolia 43 1.706 -0.010 9
Indonesia 46 1.768 -0.109 10
Vietnam 56 1.848 +0.107 11
Timor-Leste 58 1.860 -0.052 12
Papua New Guinea
96 2.064 +0.022 13
Cambodia 111 2.179 +0.001 14
China 124 2.267 +0.097 15
Thailand 126 2.303 -0.018 16
Myanmar 130 2.323 +0.085 17
Philippines 141 2.462 +0.112 18
North Korea 153 2.977 -0.042 19
REGIONAL AVERAGE 1.881
TABLE 3 ASIA–PACIFIC RANKINGS
NORTH AMERICA Across the Atlantic, the North America score improved
slightly. This was largely due to an improvement in the US,
which moved up two places in the global rankings. The score
for external conflicts fought improved, as President Barack
Obama, sought to reduce US military involvement abroad,
trying to wind down the US presence in Afghanistan and Iraq.
The last US combat troops left Afghanistan at the end of 2014,
and the remaining troops transitioned to a training and
support role. The Obama administration has also worked hard
to strike a nuclear disarmament deal with Iran, pushing back
the deadline for talks to June 2015 to give negotiators more
time. Meanwhile, Canada remains one of the most peaceful
countries in the world. However, an armed attack in October
2014, where a gunman fatally shot a Canadian soldier outside
parliament, caused the impact of terrorism score to
deteriorate, resulting in a small decline for the Canadian score
as a whole. The incident was used as justification for a bill to
expand the counter-terrorism powers of the domestic
intelligence agency, the Canadian Security Intelligence Service
(CSIS). In addition, Canada has steadily increased its
involvement in the international coalition fighting the Islamic
State of Iraq and the Levant (ISIL), after deploying military
personnel in October 2014. Aside from that, there was little
change in the scores, which saw some modest improvement
due to lower military expenditure as a percentage of GDP in
both countries. Overall, the region retained its position as the
second most peaceful in the world, behind Europe (largely on
account of Canada’s score).
The South China Sea remains a potential area for conflict, with countries involved in the dispute all showing a worsening of their scores in the 2015 index.
11GLOBAL PEACE INDEX 2015 | Results & Findings
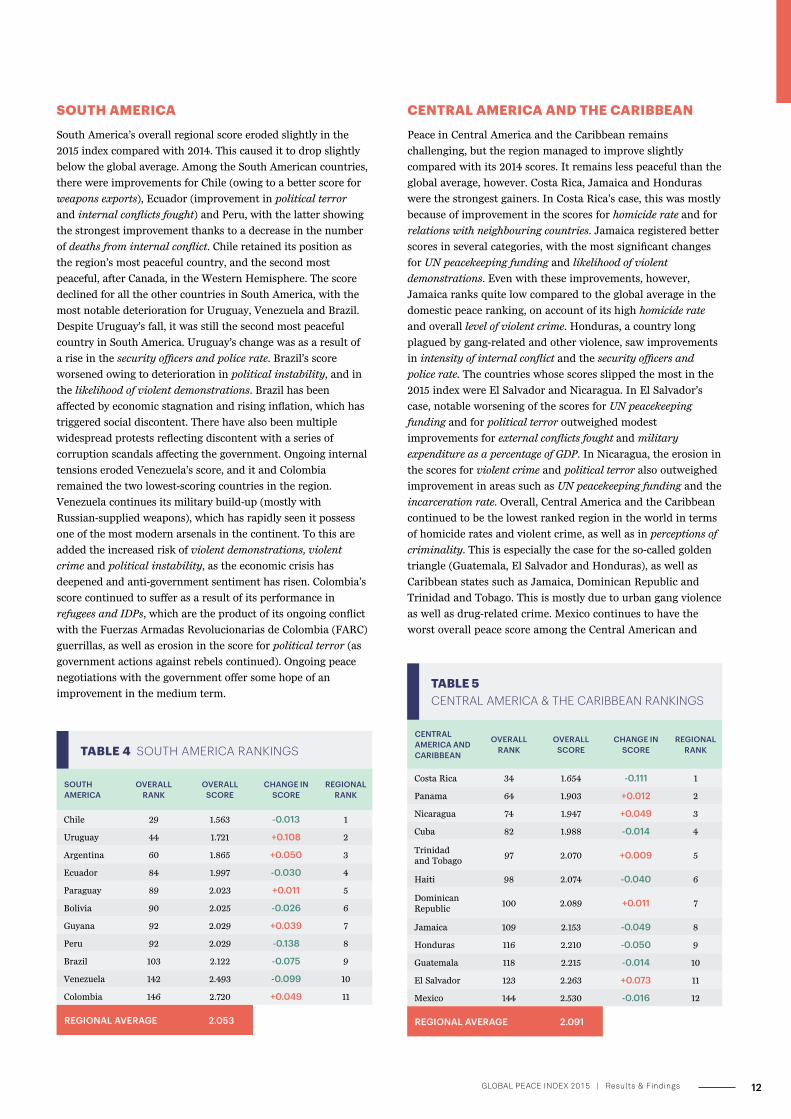
SOUTH AMERICA
South America’s overall regional score eroded slightly in the
2015 index compared with 2014. This caused it to drop slightly
below the global average. Among the South American countries,
there were improvements for Chile (owing to a better score for
weapons exports), Ecuador (improvement in political terror
and internal conflicts fought) and Peru, with the latter showing
the strongest improvement thanks to a decrease in the number
of deaths from internal conflict. Chile retained its position as
the region’s most peaceful country, and the second most
peaceful, after Canada, in the Western Hemisphere. The score
declined for all the other countries in South America, with the
most notable deterioration for Uruguay, Venezuela and Brazil.
Despite Uruguay’s fall, it was still the second most peaceful
country in South America. Uruguay’s change was as a result of
a rise in the security officers and police rate. Brazil’s score
worsened owing to deterioration in political instability, and in
the likelihood of violent demonstrations. Brazil has been
affected by economic stagnation and rising inflation, which has
triggered social discontent. There have also been multiple
widespread protests reflecting discontent with a series of
corruption scandals affecting the government. Ongoing internal
tensions eroded Venezuela’s score, and it and Colombia
remained the two lowest-scoring countries in the region.
Venezuela continues its military build-up (mostly with
Russian-supplied weapons), which has rapidly seen it possess
one of the most modern arsenals in the continent. To this are
added the increased risk of violent demonstrations, violent
crime and political instability, as the economic crisis has
deepened and anti-government sentiment has risen. Colombia’s
score continued to suffer as a result of its performance in
refugees and IDPs, which are the product of its ongoing conflict
with the Fuerzas Armadas Revolucionarias de Colombia (FARC)
guerrillas, as well as erosion in the score for political terror (as
government actions against rebels continued). Ongoing peace
negotiations with the government offer some hope of an
improvement in the medium term.
CENTRAL AMERICA AND CARIBBEAN
OVERALL RANK
OVERALL SCORE
CHANGE IN SCORE
REGIONAL RANK
Costa Rica 34 1.654 -0.111 1
Panama 64 1.903 +0.012 2
Nicaragua 74 1.947 +0.049 3
Cuba 82 1.988 -0.014 4
Trinidad and Tobago
97 2.070 +0.009 5
Haiti 98 2.074 -0.040 6
Dominican Republic
100 2.089 +0.011 7
Jamaica 109 2.153 -0.049 8
Honduras 116 2.210 -0.050 9
Guatemala 118 2.215 -0.014 10
El Salvador 123 2.263 +0.073 11
Mexico 144 2.530 -0.016 12
REGIONAL AVERAGE 2.091
TABLE 5 CENTRAL AMERICA & THE CARIBBEAN RANKINGS
SOUTH AMERICA
OVERALL RANK
OVERALL SCORE
CHANGE IN SCORE
REGIONAL RANK
Chile 29 1.563 -0.013 1
Uruguay 44 1.721 +0.108 2
Argentina 60 1.865 +0.050 3
Ecuador 84 1.997 -0.030 4
Paraguay 89 2.023 +0.011 5
Bolivia 90 2.025 -0.026 6
Guyana 92 2.029 +0.039 7
Peru 92 2.029 -0.138 8
Brazil 103 2.122 -0.075 9
Venezuela 142 2.493 -0.099 10
Colombia 146 2.720 +0.049 11
REGIONAL AVERAGE 2.053
TABLE 4 SOUTH AMERICA RANKINGS
CENTRAL AMERICA AND THE CARIBBEAN
Peace in Central America and the Caribbean remains
challenging, but the region managed to improve slightly
compared with its 2014 scores. It remains less peaceful than the
global average, however. Costa Rica, Jamaica and Honduras
were the strongest gainers. In Costa Rica’s case, this was mostly
because of improvement in the scores for homicide rate and for
relations with neighbouring countries. Jamaica registered better
scores in several categories, with the most significant changes
for UN peacekeeping funding and likelihood of violent
demonstrations. Even with these improvements, however,
Jamaica ranks quite low compared to the global average in the
domestic peace ranking, on account of its high homicide rate
and overall level of violent crime. Honduras, a country long
plagued by gang-related and other violence, saw improvements
in intensity of internal conflict and the security officers and
police rate. The countries whose scores slipped the most in the
2015 index were El Salvador and Nicaragua. In El Salvador’s
case, notable worsening of the scores for UN peacekeeping
funding and for political terror outweighed modest
improvements for external conflicts fought and military
expenditure as a percentage of GDP. In Nicaragua, the erosion in
the scores for violent crime and political terror also outweighed
improvement in areas such as UN peacekeeping funding and the
incarceration rate. Overall, Central America and the Caribbean
continued to be the lowest ranked region in the world in terms
of homicide rates and violent crime, as well as in perceptions of
criminality. This is especially the case for the so-called golden
triangle (Guatemala, El Salvador and Honduras), as well as
Caribbean states such as Jamaica, Dominican Republic and
Trinidad and Tobago. This is mostly due to urban gang violence
as well as drug-related crime. Mexico continues to have the
worst overall peace score among the Central American and
12GLOBAL PEACE INDEX 2015 | Results & Findings
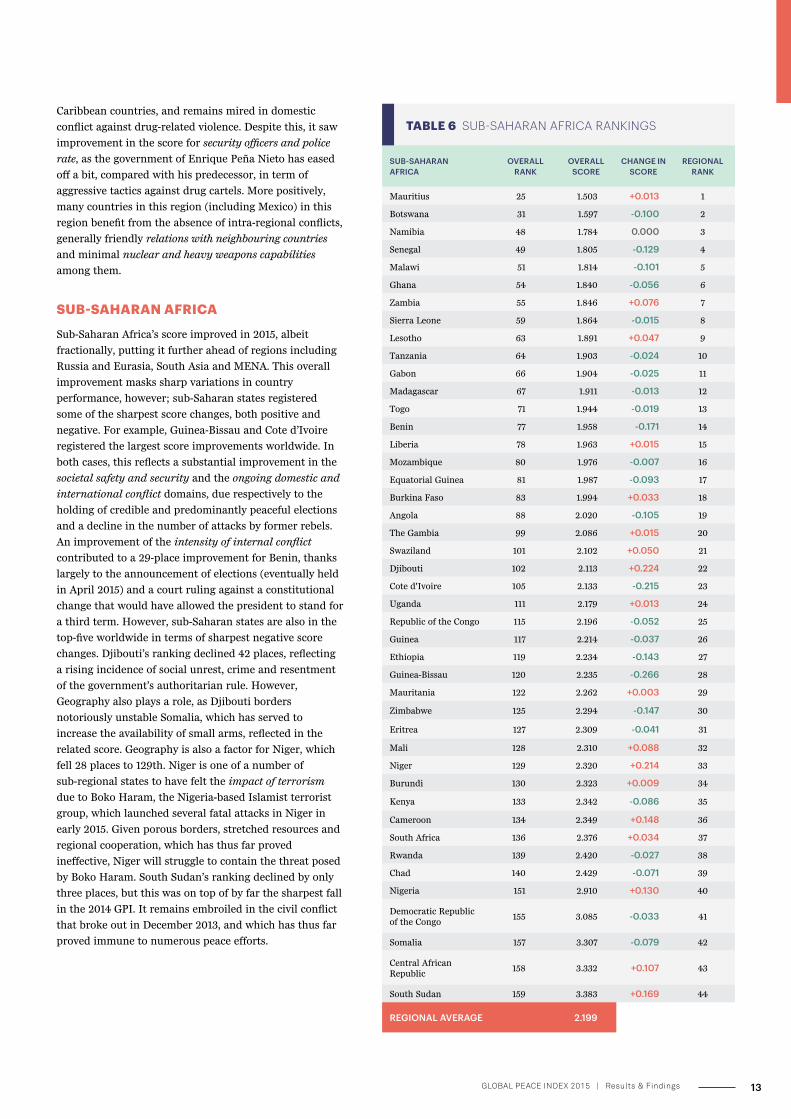
Caribbean countries, and remains mired in domestic
conflict against drug-related violence. Despite this, it saw
improvement in the score for security officers and police
rate, as the government of Enrique Peña Nieto has eased
off a bit, compared with his predecessor, in term of
aggressive tactics against drug cartels. More positively,
many countries in this region (including Mexico) in this
region benefit from the absence of intra-regional conflicts,
generally friendly relations with neighbouring countries
and minimal nuclear and heavy weapons capabilities
among them.
SUB-SAHARAN AFRICA
Sub-Saharan Africa’s score improved in 2015, albeit
fractionally, putting it further ahead of regions including
Russia and Eurasia, South Asia and MENA. This overall
improvement masks sharp variations in country
performance, however; sub-Saharan states registered
some of the sharpest score changes, both positive and
negative. For example, Guinea-Bissau and Cote d’Ivoire
registered the largest score improvements worldwide. In
both cases, this reflects a substantial improvement in the
societal safety and security and the ongoing domestic and
international conflict domains, due respectively to the
holding of credible and predominantly peaceful elections
and a decline in the number of attacks by former rebels.
An improvement of the intensity of internal conflict
contributed to a 29-place improvement for Benin, thanks
largely to the announcement of elections (eventually held
in April 2015) and a court ruling against a constitutional
change that would have allowed the president to stand for
a third term. However, sub-Saharan states are also in the
top-five worldwide in terms of sharpest negative score
changes. Djibouti’s ranking declined 42 places, reflecting
a rising incidence of social unrest, crime and resentment
of the government’s authoritarian rule. However,
Geography also plays a role, as Djibouti borders
notoriously unstable Somalia, which has served to
increase the availability of small arms, reflected in the
related score. Geography is also a factor for Niger, which
fell 28 places to 129th. Niger is one of a number of
sub-regional states to have felt the impact of terrorism
due to Boko Haram, the Nigeria-based Islamist terrorist
group, which launched several fatal attacks in Niger in
early 2015. Given porous borders, stretched resources and
regional cooperation, which has thus far proved
ineffective, Niger will struggle to contain the threat posed
by Boko Haram. South Sudan’s ranking declined by only
three places, but this was on top of by far the sharpest fall
in the 2014 GPI. It remains embroiled in the civil conflict
that broke out in December 2013, and which has thus far
proved immune to numerous peace efforts.
SUB-SAHARAN AFRICA
OVERALL RANK
OVERALL SCORE
CHANGE IN SCORE
REGIONALRANK
Mauritius 25 1.503 +0.013 1
Botswana 31 1.597 -0.100 2
Namibia 48 1.784 0.000 3
Senegal 49 1.805 -0.129 4
Malawi 51 1.814 -0.101 5
Ghana 54 1.840 -0.056 6
Zambia 55 1.846 +0.076 7
Sierra Leone 59 1.864 -0.015 8
Lesotho 63 1.891 +0.047 9
Tanzania 64 1.903 -0.024 10
Gabon 66 1.904 -0.025 11
Madagascar 67 1.911 -0.013 12
Togo 71 1.944 -0.019 13
Benin 77 1.958 -0.171 14
Liberia 78 1.963 +0.015 15
Mozambique 80 1.976 -0.007 16
Equatorial Guinea 81 1.987 -0.093 17
Burkina Faso 83 1.994 +0.033 18
Angola 88 2.020 -0.105 19
The Gambia 99 2.086 +0.015 20
Swaziland 101 2.102 +0.050 21
Djibouti 102 2.113 +0.224 22
Cote d'Ivoire 105 2.133 -0.215 23
Uganda 111 2.179 +0.013 24
Republic of the Congo 115 2.196 -0.052 25
Guinea 117 2.214 -0.037 26
Ethiopia 119 2.234 -0.143 27
Guinea-Bissau 120 2.235 -0.266 28
Mauritania 122 2.262 +0.003 29
Zimbabwe 125 2.294 -0.147 30
Eritrea 127 2.309 -0.041 31
Mali 128 2.310 +0.088 32
Niger 129 2.320 +0.214 33
Burundi 130 2.323 +0.009 34
Kenya 133 2.342 -0.086 35
Cameroon 134 2.349 +0.148 36
South Africa 136 2.376 +0.034 37
Rwanda 139 2.420 -0.027 38
Chad 140 2.429 -0.071 39
Nigeria 151 2.910 +0.130 40
Democratic Republic of the Congo
155 3.085 -0.033 41
Somalia 157 3.307 -0.079 42
Central African Republic
158 3.332 +0.107 43
South Sudan 159 3.383 +0.169 44
REGIONAL AVERAGE 2.199
TABLE 6 SUB-SAHARAN AFRICA RANKINGS
13GLOBAL PEACE INDEX 2015 | Results & Findings
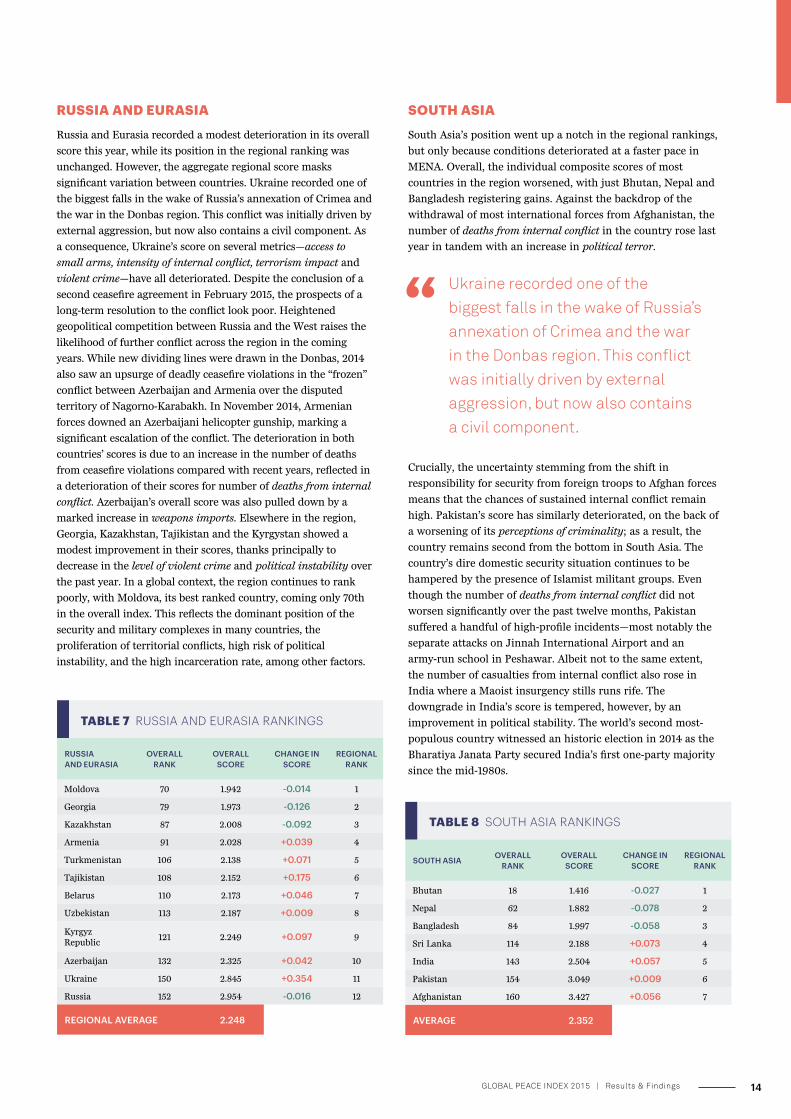
RUSSIA AND EURASIA
Russia and Eurasia recorded a modest deterioration in its overall
score this year, while its position in the regional ranking was
unchanged. However, the aggregate regional score masks
significant variation between countries. Ukraine recorded one of
the biggest falls in the wake of Russia’s annexation of Crimea and
the war in the Donbas region. This conflict was initially driven by
external aggression, but now also contains a civil component. As
a consequence, Ukraine’s score on several metrics —access to
small arms, intensity of internal conflict, terrorism impact and
violent crime—have all deteriorated. Despite the conclusion of a
second ceasefire agreement in February 2015, the prospects of a
long-term resolution to the conflict look poor. Heightened
geopolitical competition between Russia and the West raises the
likelihood of further conflict across the region in the coming
years. While new dividing lines were drawn in the Donbas, 2014
also saw an upsurge of deadly ceasefire violations in the “frozen”
conflict between Azerbaijan and Armenia over the disputed
territory of Nagorno-Karabakh. In November 2014, Armenian
forces downed an Azerbaijani helicopter gunship, marking a
significant escalation of the conflict. The deterioration in both
countries’ scores is due to an increase in the number of deaths
from ceasefire violations compared with recent years, reflected in
a deterioration of their scores for number of deaths from internal
conflict. Azerbaijan’s overall score was also pulled down by a
marked increase in weapons imports. Elsewhere in the region,
Georgia, Kazakhstan, Tajikistan and the Kyrgystan showed a
modest improvement in their scores, thanks principally to
decrease in the level of violent crime and political instability over
the past year. In a global context, the region continues to rank
poorly, with Moldova, its best ranked country, coming only 70th
in the overall index. This reflects the dominant position of the
security and military complexes in many countries, the
proliferation of territorial conflicts, high risk of political
instability, and the high incarceration rate, among other factors.
RUSSIA AND EURASIA
OVERALL RANK
OVERALL SCORE
CHANGE IN SCORE
REGIONAL RANK
Moldova 70 1.942 -0.014 1
Georgia 79 1.973 -0.126 2
Kazakhstan 87 2.008 -0.092 3
Armenia 91 2.028 +0.039 4
Turkmenistan 106 2.138 +0.071 5
Tajikistan 108 2.152 +0.175 6
Belarus 110 2.173 +0.046 7
Uzbekistan 113 2.187 +0.009 8
Kyrgyz Republic
121 2.249 +0.097 9
Azerbaijan 132 2.325 +0.042 10
Ukraine 150 2.845 +0.354 11
Russia 152 2.954 -0.016 12
REGIONAL AVERAGE 2.248
TABLE 7 RUSSIA AND EURASIA RANKINGS
SOUTH ASIA
South Asia’s position went up a notch in the regional rankings,
but only because conditions deteriorated at a faster pace in
MENA. Overall, the individual composite scores of most
countries in the region worsened, with just Bhutan, Nepal and
Bangladesh registering gains. Against the backdrop of the
withdrawal of most international forces from Afghanistan, the
number of deaths from internal conflict in the country rose last
year in tandem with an increase in political terror.
SOUTH ASIA OVERALL RANK
OVERALL SCORE
CHANGE IN SCORE
REGIONAL RANK
Bhutan 18 1.416 -0.027 1
Nepal 62 1.882 -0.078 2
Bangladesh 84 1.997 -0.058 3
Sri Lanka 114 2.188 +0.073 4
India 143 2.504 +0.057 5
Pakistan 154 3.049 +0.009 6
Afghanistan 160 3.427 +0.056 7
AVERAGE 2.352
TABLE 8 SOUTH ASIA RANKINGS
Ukraine recorded one of the biggest falls in the wake of Russia’s annexation of Crimea and the war in the Donbas region. This conflict was initially driven by external aggression, but now also contains a civil component.
Crucially, the uncertainty stemming from the shift in
responsibility for security from foreign troops to Afghan forces
means that the chances of sustained internal conflict remain
high. Pakistan’s score has similarly deteriorated, on the back of
a worsening of its perceptions of criminality; as a result, the
country remains second from the bottom in South Asia. The
country’s dire domestic security situation continues to be
hampered by the presence of Islamist militant groups. Even
though the number of deaths from internal conflict did not
worsen significantly over the past twelve months, Pakistan
suffered a handful of high-profile incidents—most notably the
separate attacks on Jinnah International Airport and an
army-run school in Peshawar. Albeit not to the same extent,
the number of casualties from internal conflict also rose in
India where a Maoist insurgency stills runs rife. The
downgrade in India’s score is tempered, however, by an
improvement in political stability. The world’s second most-
populous country witnessed an historic election in 2014 as the
Bharatiya Janata Party secured India’s first one-party majority
since the mid-1980s.
14GLOBAL PEACE INDEX 2015 | Results & Findings
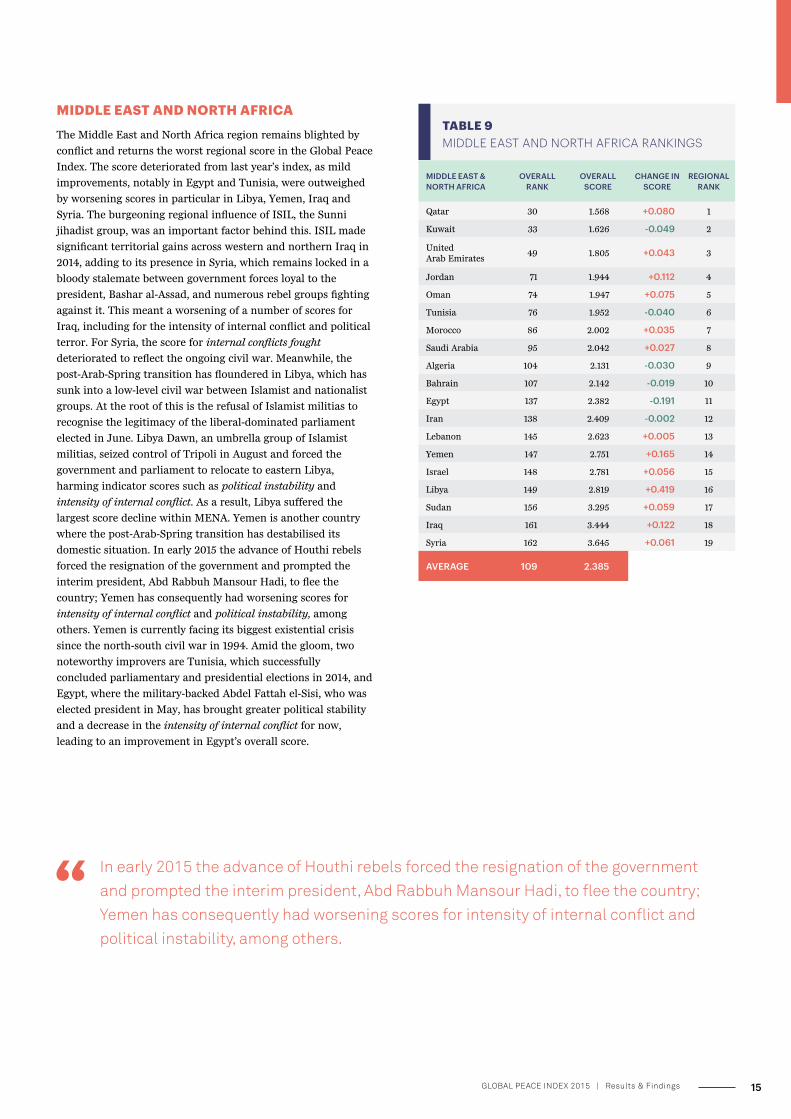
MIDDLE EAST AND NORTH AFRICA
The Middle East and North Africa region remains blighted by
conflict and returns the worst regional score in the Global Peace
Index. The score deteriorated from last year’s index, as mild
improvements, notably in Egypt and Tunisia, were outweighed
by worsening scores in particular in Libya, Yemen, Iraq and
Syria. The burgeoning regional influence of ISIL, the Sunni
jihadist group, was an important factor behind this. ISIL made
significant territorial gains across western and northern Iraq in
2014, adding to its presence in Syria, which remains locked in a
bloody stalemate between government forces loyal to the
president, Bashar al-Assad, and numerous rebel groups fighting
against it. This meant a worsening of a number of scores for
Iraq, including for the intensity of internal conflict and political
terror. For Syria, the score for internal conflicts fought
deteriorated to reflect the ongoing civil war. Meanwhile, the
post-Arab-Spring transition has floundered in Libya, which has
sunk into a low-level civil war between Islamist and nationalist
groups. At the root of this is the refusal of Islamist militias to
recognise the legitimacy of the liberal-dominated parliament
elected in June. Libya Dawn, an umbrella group of Islamist
militias, seized control of Tripoli in August and forced the
government and parliament to relocate to eastern Libya,
harming indicator scores such as political instability and
intensity of internal conflict. As a result, Libya suffered the
largest score decline within MENA. Yemen is another country
where the post-Arab-Spring transition has destabilised its
domestic situation. In early 2015 the advance of Houthi rebels
forced the resignation of the government and prompted the
interim president, Abd Rabbuh Mansour Hadi, to flee the
country; Yemen has consequently had worsening scores for
intensity of internal conflict and political instability, among
others. Yemen is currently facing its biggest existential crisis
since the north-south civil war in 1994. Amid the gloom, two
noteworthy improvers are Tunisia, which successfully
concluded parliamentary and presidential elections in 2014, and
Egypt, where the military-backed Abdel Fattah el-Sisi, who was
elected president in May, has brought greater political stability
and a decrease in the intensity of internal conflict for now,
leading to an improvement in Egypt’s overall score.
In early 2015 the advance of Houthi rebels forced the resignation of the government and prompted the interim president, Abd Rabbuh Mansour Hadi, to flee the country; Yemen has consequently had worsening scores for intensity of internal conflict and political instability, among others.
MIDDLE EAST & NORTH AFRICA
OVERALL RANK
OVERALL SCORE
CHANGE IN SCORE
REGIONALRANK
Qatar 30 1.568 +0.080 1
Kuwait 33 1.626 -0.049 2
United Arab Emirates
49 1.805 +0.043 3
Jordan 71 1.944 +0.112 4
Oman 74 1.947 +0.075 5
Tunisia 76 1.952 -0.040 6
Morocco 86 2.002 +0.035 7
Saudi Arabia 95 2.042 +0.027 8
Algeria 104 2.131 -0.030 9
Bahrain 107 2.142 -0.019 10
Egypt 137 2.382 -0.191 11
Iran 138 2.409 -0.002 12
Lebanon 145 2.623 +0.005 13
Yemen 147 2.751 +0.165 14
Israel 148 2.781 +0.056 15
Libya 149 2.819 +0.419 16
Sudan 156 3.295 +0.059 17
Iraq 161 3.444 +0.122 18
Syria 162 3.645 +0.061 19
AVERAGE 109 2.385
TABLE 9 MIDDLE EAST AND NORTH AFRICA RANKINGS
15GLOBAL PEACE INDEX 2015 | Results & Findings
RISERS & FALLERS
GUINEA-
BISSAU
LIBYA
COTE D’IV
OIRE
UKRAINE
EGYPT
DJIBOUTI
TAJIK
ISTA
N
NIGER
SOUTH SUDAN
BENIN
–0.266
+0.419
–0.214
+0.354
–0.192
+0.255
–0.175
+0.214
–0.171
+0.169
120
105
137108 77
149
150
102
129
159
GPI rank 2015
Change in score 2014/15
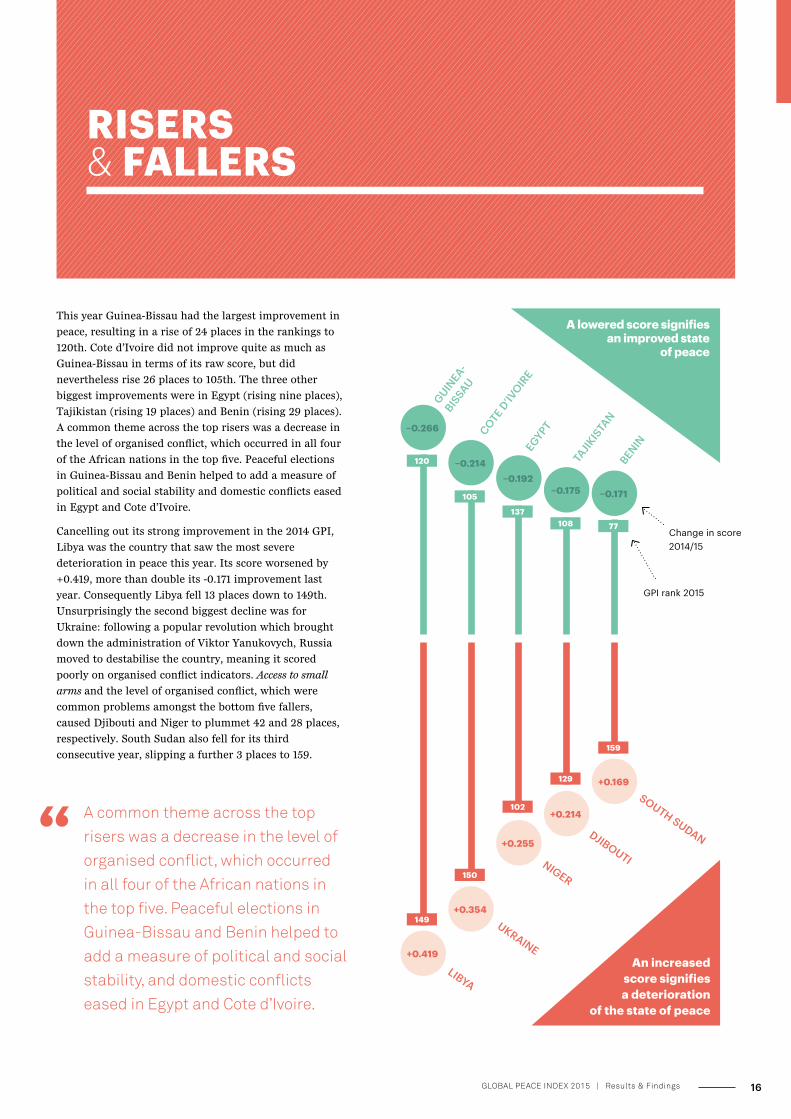
This year Guinea-Bissau had the largest improvement in
peace, resulting in a rise of 24 places in the rankings to
120th. Cote d’Ivoire did not improve quite as much as
Guinea-Bissau in terms of its raw score, but did
nevertheless rise 26 places to 105th. The three other
biggest improvements were in Egypt (rising nine places),
Tajikistan (rising 19 places) and Benin (rising 29 places).
A common theme across the top risers was a decrease in
the level of organised conflict, which occurred in all four
of the African nations in the top five. Peaceful elections
in Guinea-Bissau and Benin helped to add a measure of
political and social stability and domestic conflicts eased
in Egypt and Cote d’Ivoire.
Cancelling out its strong improvement in the 2014 GPI,
Libya was the country that saw the most severe
deterioration in peace this year. Its score worsened by
+0.419, more than double its -0.171 improvement last
year. Consequently Libya fell 13 places down to 149th.
Unsurprisingly the second biggest decline was for
Ukraine: following a popular revolution which brought
down the administration of Viktor Yanukovych, Russia
moved to destabilise the country, meaning it scored
poorly on organised conflict indicators. Access to small
arms and the level of organised conflict, which were
common problems amongst the bottom five fallers,
caused Djibouti and Niger to plummet 42 and 28 places,
respectively. South Sudan also fell for its third
consecutive year, slipping a further 3 places to 159.
A common theme across the top risers was a decrease in the level of organised conflict, which occurred in all four of the African nations in the top five. Peaceful elections in Guinea-Bissau and Benin helped to add a measure of political and social stability, and domestic conflicts eased in Egypt and Cote d’Ivoire.
A lowered score signifies an improved state
of peace
An increased score signifies a deterioration
of the state of peace
16GLOBAL PEACE INDEX 2015 | Results & Findings
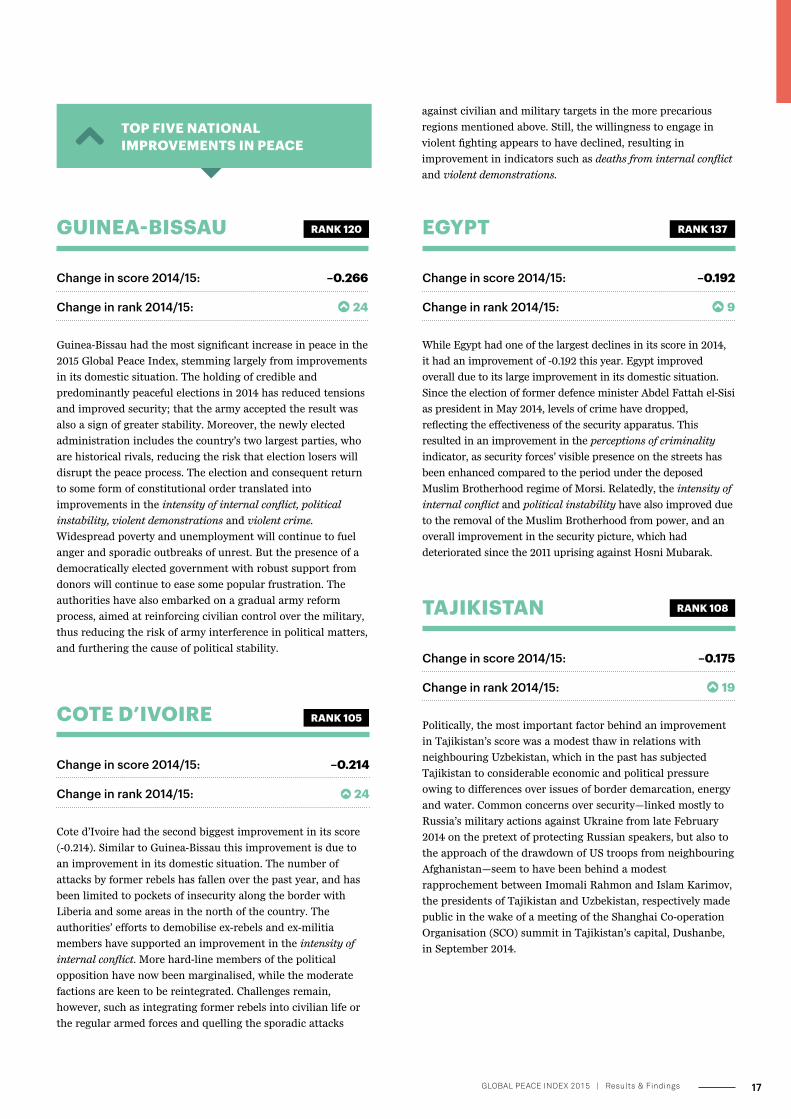
EGYPT
Change in score 2014/15: –0.192
Change in rank 2014/15: 9
RANK 137
While Egypt had one of the largest declines in its score in 2014,
it had an improvement of -0.192 this year. Egypt improved
overall due to its large improvement in its domestic situation.
Since the election of former defence minister Abdel Fattah el-Sisi
as president in May 2014, levels of crime have dropped,
reflecting the effectiveness of the security apparatus. This
resulted in an improvement in the perceptions of criminality
indicator, as security forces’ visible presence on the streets has
been enhanced compared to the period under the deposed
Muslim Brotherhood regime of Morsi. Relatedly, the intensity of
internal conflict and political instability have also improved due
to the removal of the Muslim Brotherhood from power, and an
overall improvement in the security picture, which had
deteriorated since the 2011 uprising against Hosni Mubarak.
TAJIKISTAN
Change in score 2014/15: –0.175
Change in rank 2014/15: 19
RANK 108
Politically, the most important factor behind an improvement
in Tajikistan’s score was a modest thaw in relations with
neighbouring Uzbekistan, which in the past has subjected
Tajikistan to considerable economic and political pressure
owing to differences over issues of border demarcation, energy
and water. Common concerns over security—linked mostly to
Russia’s military actions against Ukraine from late February
2014 on the pretext of protecting Russian speakers, but also to
the approach of the drawdown of US troops from neighbouring
Afghanistan—seem to have been behind a modest
rapprochement between Imomali Rahmon and Islam Karimov,
the presidents of Tajikistan and Uzbekistan, respectively made
public in the wake of a meeting of the Shanghai Co-operation
Organisation (SCO) summit in Tajikistan’s capital, Dushanbe,
in September 2014.
against civilian and military targets in the more precarious
regions mentioned above. Still, the willingness to engage in
violent fighting appears to have declined, resulting in
improvement in indicators such as deaths from internal conflict
and violent demonstrations.
COTE D’IVOIRE
Change in score 2014/15: –0.214
Change in rank 2014/15: 24
RANK 105
Cote d’Ivoire had the second biggest improvement in its score
(-0.214). Similar to Guinea-Bissau this improvement is due to
an improvement in its domestic situation. The number of
attacks by former rebels has fallen over the past year, and has
been limited to pockets of insecurity along the border with
Liberia and some areas in the north of the country. The
authorities’ efforts to demobilise ex-rebels and ex-militia
members have supported an improvement in the intensity of
internal conflict. More hard-line members of the political
opposition have now been marginalised, while the moderate
factions are keen to be reintegrated. Challenges remain,
however, such as integrating former rebels into civilian life or
the regular armed forces and quelling the sporadic attacks
GUINEA-BISSAU
Change in score 2014/15: –0.266
Change in rank 2014/15: 24
RANK 120
Guinea-Bissau had the most significant increase in peace in the
2015 Global Peace Index, stemming largely from improvements
in its domestic situation. The holding of credible and
predominantly peaceful elections in 2014 has reduced tensions
and improved security; that the army accepted the result was
also a sign of greater stability. Moreover, the newly elected
administration includes the country’s two largest parties, who
are historical rivals, reducing the risk that election losers will
disrupt the peace process. The election and consequent return
to some form of constitutional order translated into
improvements in the intensity of internal conflict, political
instability, violent demonstrations and violent crime.
Widespread poverty and unemployment will continue to fuel
anger and sporadic outbreaks of unrest. But the presence of a
democratically elected government with robust support from
donors will continue to ease some popular frustration. The
authorities have also embarked on a gradual army reform
process, aimed at reinforcing civilian control over the military,
thus reducing the risk of army interference in political matters,
and furthering the cause of political stability.
TOP FIVE NATIONAL IMPROVEMENTS IN PEACE
17GLOBAL PEACE INDEX 2015 | Results & Findings
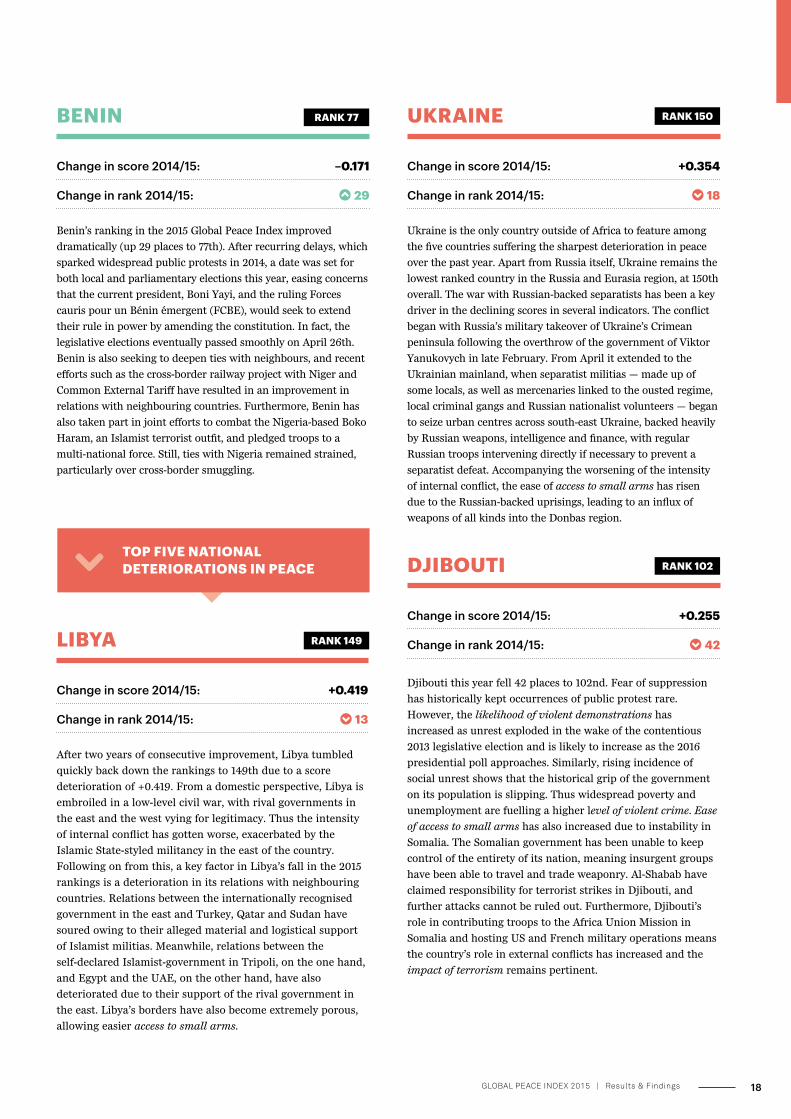
UKRAINE
Change in score 2014/15: +0.354
Change in rank 2014/15: 18
RANK 150
Ukraine is the only country outside of Africa to feature among
the five countries suffering the sharpest deterioration in peace
over the past year. Apart from Russia itself, Ukraine remains the
lowest ranked country in the Russia and Eurasia region, at 150th
overall. The war with Russian-backed separatists has been a key
driver in the declining scores in several indicators. The conflict
began with Russia’s military takeover of Ukraine’s Crimean
peninsula following the overthrow of the government of Viktor
Yanukovych in late February. From April it extended to the
Ukrainian mainland, when separatist militias — made up of
some locals, as well as mercenaries linked to the ousted regime,
local criminal gangs and Russian nationalist volunteers — began
to seize urban centres across south-east Ukraine, backed heavily
by Russian weapons, intelligence and finance, with regular
Russian troops intervening directly if necessary to prevent a
separatist defeat. Accompanying the worsening of the intensity
of internal conflict, the ease of access to small arms has risen
due to the Russian-backed uprisings, leading to an influx of
weapons of all kinds into the Donbas region.
DJIBOUTI
Change in score 2014/15: +0.255
Change in rank 2014/15: 42
RANK 102
Djibouti this year fell 42 places to 102nd. Fear of suppression
has historically kept occurrences of public protest rare.
However, the likelihood of violent demonstrations has
increased as unrest exploded in the wake of the contentious
2013 legislative election and is likely to increase as the 2016
presidential poll approaches. Similarly, rising incidence of
social unrest shows that the historical grip of the government
on its population is slipping. Thus widespread poverty and
unemployment are fuelling a higher level of violent crime. Ease
of access to small arms has also increased due to instability in
Somalia. The Somalian government has been unable to keep
control of the entirety of its nation, meaning insurgent groups
have been able to travel and trade weaponry. Al-Shabab have
claimed responsibility for terrorist strikes in Djibouti, and
further attacks cannot be ruled out. Furthermore, Djibouti’s
role in contributing troops to the Africa Union Mission in
Somalia and hosting US and French military operations means
the country’s role in external conflicts has increased and the
impact of terrorism remains pertinent.
BENIN
Change in score 2014/15: –0.171
Change in rank 2014/15: 29
RANK 77
Benin’s ranking in the 2015 Global Peace Index improved
dramatically (up 29 places to 77th). After recurring delays, which
sparked widespread public protests in 2014, a date was set for
both local and parliamentary elections this year, easing concerns
that the current president, Boni Yayi, and the ruling Forces
cauris pour un Bénin émergent (FCBE), would seek to extend
their rule in power by amending the constitution. In fact, the
legislative elections eventually passed smoothly on April 26th.
Benin is also seeking to deepen ties with neighbours, and recent
efforts such as the cross-border railway project with Niger and
Common External Tariff have resulted in an improvement in
relations with neighbouring countries. Furthermore, Benin has
also taken part in joint efforts to combat the Nigeria-based Boko
Haram, an Islamist terrorist outfit, and pledged troops to a
multi-national force. Still, ties with Nigeria remained strained,
particularly over cross-border smuggling.
LIBYA
Change in score 2014/15: +0.419
Change in rank 2014/15: 13
RANK 149
After two years of consecutive improvement, Libya tumbled
quickly back down the rankings to 149th due to a score
deterioration of +0.419. From a domestic perspective, Libya is
embroiled in a low-level civil war, with rival governments in
the east and the west vying for legitimacy. Thus the intensity
of internal conflict has gotten worse, exacerbated by the
Islamic State-styled militancy in the east of the country.
Following on from this, a key factor in Libya’s fall in the 2015
rankings is a deterioration in its relations with neighbouring
countries. Relations between the internationally recognised
government in the east and Turkey, Qatar and Sudan have
soured owing to their alleged material and logistical support
of Islamist militias. Meanwhile, relations between the
self-declared Islamist-government in Tripoli, on the one hand,
and Egypt and the UAE, on the other hand, have also
deteriorated due to their support of the rival government in
the east. Libya’s borders have also become extremely porous,
allowing easier access to small arms.
TOP FIVE NATIONAL DETERIORATIONS IN PEACE
18GLOBAL PEACE INDEX 2015 | Results & Findings
NIGER
Change in score 2014/15: +0.214
Change in rank 2014/15: 28
RANK 129
Niger’s score worsened by +0.214 this year, meaning it fell 28
places to 129th in the 2015 ranking. Internally, the Nigeria-
based Islamist terrorist group Boko Haram launched several
deadly attacks on Nigerien soil in early 2015. This suggests the
group is seeking to expand its influence across the sub-region,
especially after several high-profile attacks in Cameroon. Given
the porous borders, stretched resources, and lack of effective
regional cooperation Niger will struggle to contain the threat
posed by Boko Haram. As well as impacting the intensity of
internal conflict this caused a deterioration of the terrorism
impact score.
SOUTH SUDAN
Change in score 2014/15: +0.169
Change in rank 2014/15: 3
RANK 159
South Sudan’s peace level declined for the third consecutive
year. The country remains embroiled in a civil conflict between
forces loyal to the president, Salva Kiir, and those fighting on
behalf of his former deputy, Riek Machar. This commenced in
December 2013 and has continued despite numerous attempts
to reach an overall peace agreement, and threats of sanctions
from the UN and others. This has contributed to a decline in the
score for the internal conflicts fought indicator. Faced with a
protracted conflict, the government has increased military
expenditure, and increased the number of armed service
personnel, leading to deteriorations in these scores. At the same
time, tensions remain high with Sudan. Although Sudan’s
president has expressed qualified support for his South
Sudanese counterpart, both sides continue to allege that the
other government is offering support to rebel groups, and there
are periodic cross-border attacks, contributing to a decline in
the score for external conflicts fought.
A key factor in Libya’s fall in the 2015 rankings is a deterioration in its relations with neighbouring countries. Relations between the internationally recognised government in the east and Turkey, Qatar and Sudan have soured owing to their alleged material and logistical support of Islamist militias.
19GLOBAL PEACE INDEX 2015 | Results & Findings
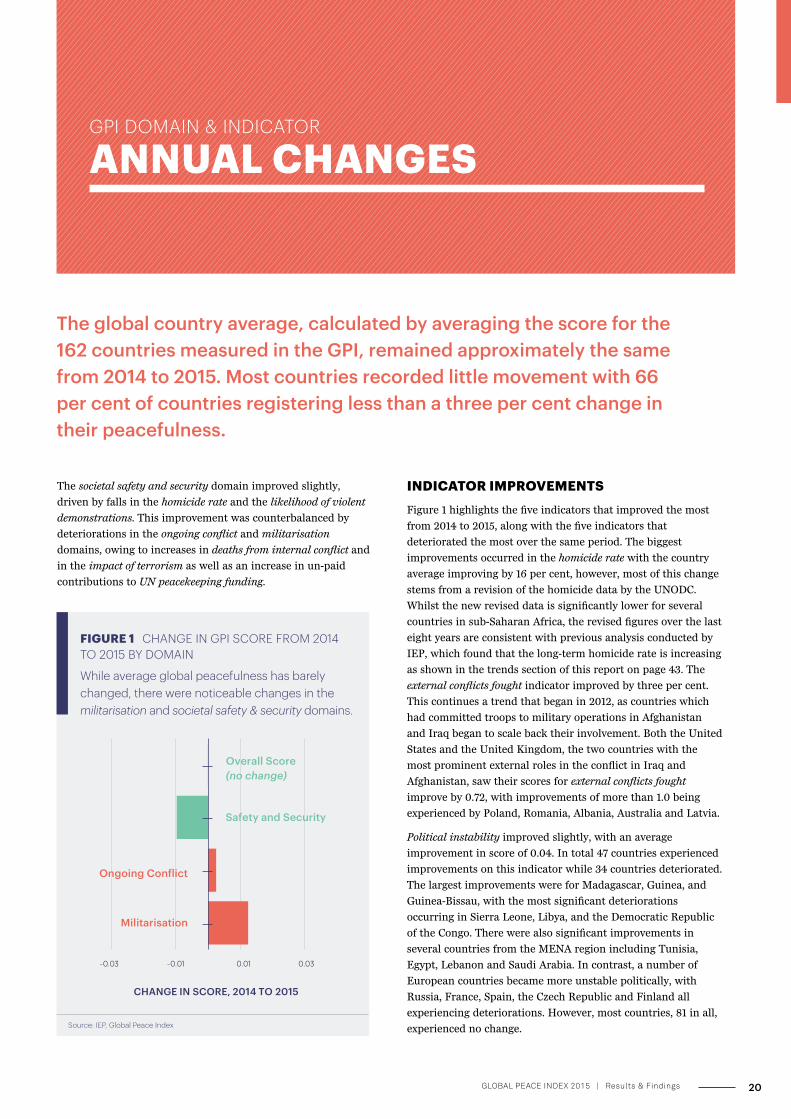
GPI DOMAIN & INDICATOR ANNUAL CHANGES
The global country average, calculated by averaging the score for the 162 countries measured in the GPI, remained approximately the same from 2014 to 2015. Most countries recorded little movement with 66 per cent of countries registering less than a three per cent change in their peacefulness.
The societal safety and security domain improved slightly,
driven by falls in the homicide rate and the likelihood of violent
demonstrations. This improvement was counterbalanced by
deteriorations in the ongoing conflict and militarisation
domains, owing to increases in deaths from internal conflict and
in the impact of terrorism as well as an increase in un-paid
contributions to UN peacekeeping funding.
FIGURE 1 CHANGE IN GPI SCORE FROM 2014 TO 2015 BY DOMAIN
While average global peacefulness has barely changed, there were noticeable changes in the militarisation and societal safety & security domains.
Source: IEP, Global Peace Index
-0.03 -0.01 0.01 0.03
Overall Score(no change)
Safety and Security
Ongoing Conflict
Militarisation
CHANGE IN SCORE, 2014 TO 2015
INDICATOR IMPROVEMENTS
Figure 1 highlights the five indicators that improved the most
from 2014 to 2015, along with the five indicators that
deteriorated the most over the same period. The biggest
improvements occurred in the homicide rate with the country
average improving by 16 per cent, however, most of this change
stems from a revision of the homicide data by the UNODC.
Whilst the new revised data is significantly lower for several
countries in sub-Saharan Africa, the revised figures over the last
eight years are consistent with previous analysis conducted by
IEP, which found that the long-term homicide rate is increasing
as shown in the trends section of this report on page 43. The
external conflicts fought indicator improved by three per cent.
This continues a trend that began in 2012, as countries which
had committed troops to military operations in Afghanistan
and Iraq began to scale back their involvement. Both the United
States and the United Kingdom, the two countries with the
most prominent external roles in the conflict in Iraq and
Afghanistan, saw their scores for external conflicts fought
improve by 0.72, with improvements of more than 1.0 being
experienced by Poland, Romania, Albania, Australia and Latvia.
Political instability improved slightly, with an average
improvement in score of 0.04. In total 47 countries experienced
improvements on this indicator while 34 countries deteriorated.
The largest improvements were for Madagascar, Guinea, and
Guinea-Bissau, with the most significant deteriorations
occurring in Sierra Leone, Libya, and the Democratic Republic
of the Congo. There were also significant improvements in
several countries from the MENA region including Tunisia,
Egypt, Lebanon and Saudi Arabia. In contrast, a number of
European countries became more unstable politically, with
Russia, France, Spain, the Czech Republic and Finland all
experiencing deteriorations. However, most countries, 81 in all,
experienced no change.
20GLOBAL PEACE INDEX 2015 | Results & Findings
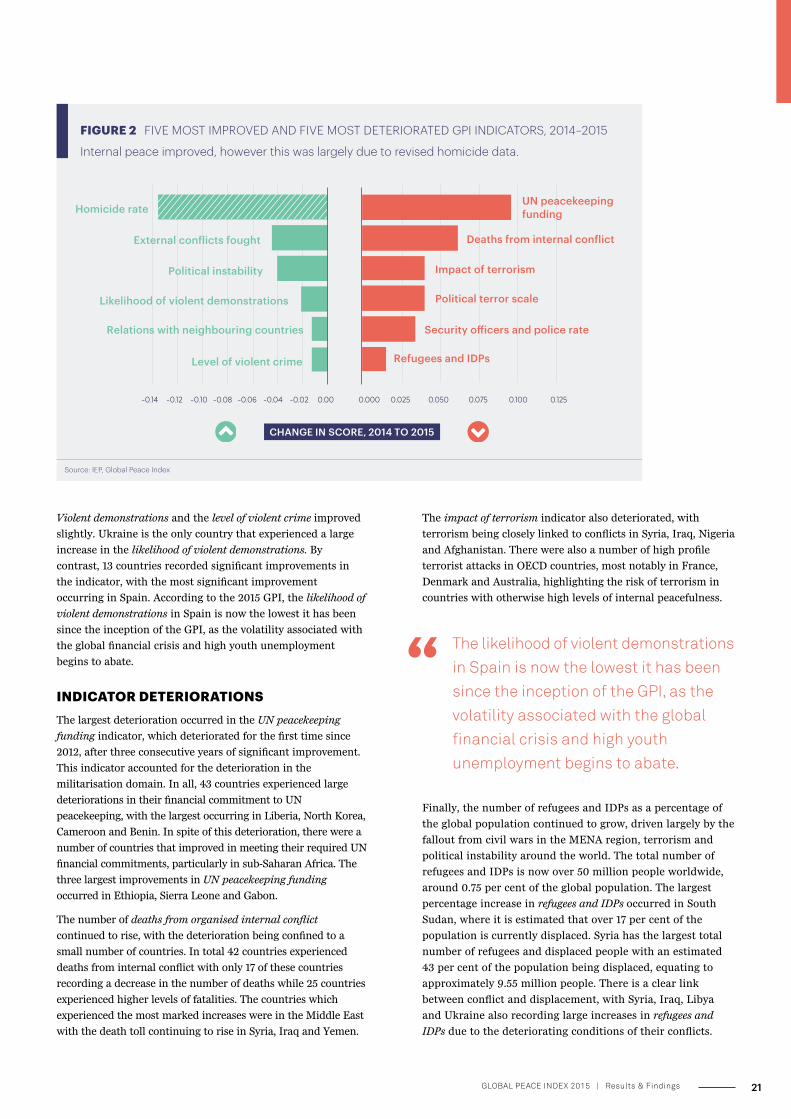
Violent demonstrations and the level of violent crime improved
slightly. Ukraine is the only country that experienced a large
increase in the likelihood of violent demonstrations. By
contrast, 13 countries recorded significant improvements in
the indicator, with the most significant improvement
occurring in Spain. According to the 2015 GPI, the likelihood of
violent demonstrations in Spain is now the lowest it has been
since the inception of the GPI, as the volatility associated with
the global financial crisis and high youth unemployment
begins to abate.
INDICATOR DETERIORATIONSThe largest deterioration occurred in the UN peacekeeping
funding indicator, which deteriorated for the first time since
2012, after three consecutive years of significant improvement.
This indicator accounted for the deterioration in the
militarisation domain. In all, 43 countries experienced large
deteriorations in their financial commitment to UN
peacekeeping, with the largest occurring in Liberia, North Korea,
Cameroon and Benin. In spite of this deterioration, there were a
number of countries that improved in meeting their required UN
financial commitments, particularly in sub-Saharan Africa. The
three largest improvements in UN peacekeeping funding
occurred in Ethiopia, Sierra Leone and Gabon.
The number of deaths from organised internal conflict
continued to rise, with the deterioration being confined to a
small number of countries. In total 42 countries experienced
deaths from internal conflict with only 17 of these countries
recording a decrease in the number of deaths while 25 countries
experienced higher levels of fatalities. The countries which
experienced the most marked increases were in the Middle East
with the death toll continuing to rise in Syria, Iraq and Yemen.
Source: IEP, Global Peace Index
-0.14 -0.12 -0.10 -0.08 -0.06 -0.04 -0.02 0.00
Level of violent crime
Relations with neighbouring countries
Likelihood of violent demonstrations
Political instability
External conflicts fought
Homicide rate
FIGURE 2 FIVE MOST IMPROVED AND FIVE MOST DETERIORATED GPI INDICATORS, 2014–2015
Internal peace improved, however this was largely due to revised homicide data.
0.000 0.050 0.100 0.1250.025 0.075
Refugees and IDPs
Political terror scale
Security o�icers and police rate
Impact of terrorism
Deaths from internal conflict
UN peacekeeping funding
CHANGE IN SCORE, 2014 TO 2015
The impact of terrorism indicator also deteriorated, with
terrorism being closely linked to conflicts in Syria, Iraq, Nigeria
and Afghanistan. There were also a number of high profile
terrorist attacks in OECD countries, most notably in France,
Denmark and Australia, highlighting the risk of terrorism in
countries with otherwise high levels of internal peacefulness.
The likelihood of violent demonstrations in Spain is now the lowest it has been since the inception of the GPI, as the volatility associated with the global financial crisis and high youth unemployment begins to abate.
Finally, the number of refugees and IDPs as a percentage of
the global population continued to grow, driven largely by the
fallout from civil wars in the MENA region, terrorism and
political instability around the world. The total number of
refugees and IDPs is now over 50 million people worldwide,
around 0.75 per cent of the global population. The largest
percentage increase in refugees and IDPs occurred in South
Sudan, where it is estimated that over 17 per cent of the
population is currently displaced. Syria has the largest total
number of refugees and displaced people with an estimated
43 per cent of the population being displaced, equating to
approximately 9.55 million people. There is a clear link
between conflict and displacement, with Syria, Iraq, Libya
and Ukraine also recording large increases in refugees and
IDPs due to the deteriorating conditions of their conflicts.
21GLOBAL PEACE INDEX 2015 | Results & Findings
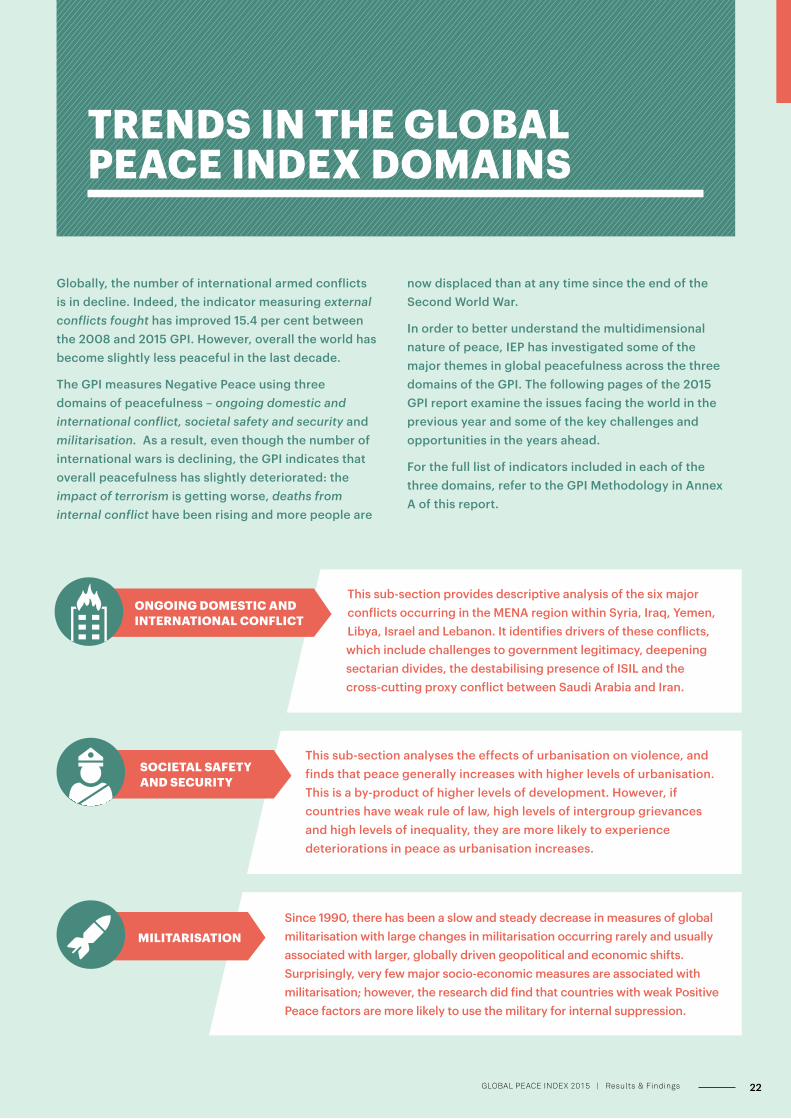
Globally, the number of international armed conflicts is in decline. Indeed, the indicator measuring external conflicts fought has improved 15.4 per cent between the 2008 and 2015 GPI. However, overall the world has become slightly less peaceful in the last decade.
The GPI measures Negative Peace using three domains of peacefulness – ongoing domestic and international conflict, societal safety and security and militarisation. As a result, even though the number of international wars is declining, the GPI indicates that overall peacefulness has slightly deteriorated: the impact of terrorism is getting worse, deaths from internal conflict have been rising and more people are
TRENDS IN THE GLOBAL PEACE INDEX DOMAINS
now displaced than at any time since the end of the Second World War.
In order to better understand the multidimensional nature of peace, IEP has investigated some of the major themes in global peacefulness across the three domains of the GPI. The following pages of the 2015 GPI report examine the issues facing the world in the previous year and some of the key challenges and opportunities in the years ahead.
For the full list of indicators included in each of the three domains, refer to the GPI Methodology in Annex A of this report.
Since 1990, there has been a slow and steady decrease in measures of global militarisation with large changes in militarisation occurring rarely and usually associated with larger, globally driven geopolitical and economic shifts. Surprisingly, very few major socio-economic measures are associated with militarisation; however, the research did find that countries with weak Positive Peace factors are more likely to use the military for internal suppression.
MILITARISATION
This sub-section provides descriptive analysis of the six major conflicts occurring in the MENA region within Syria, Iraq, Yemen, Libya, Israel and Lebanon. It identifies drivers of these conflicts, which include challenges to government legitimacy, deepening sectarian divides, the destabilising presence of ISIL and the cross-cutting proxy conflict between Saudi Arabia and Iran.
ONGOING DOMESTIC AND INTERNATIONAL CONFLICT
This sub-section analyses the effects of urbanisation on violence, and finds that peace generally increases with higher levels of urbanisation. This is a by-product of higher levels of development. However, if countries have weak rule of law, high levels of intergroup grievances and high levels of inequality, they are more likely to experience deteriorations in peace as urbanisation increases.
SOCIETAL SAFETY AND SECURITY
22GLOBAL PEACE INDEX 2015 | Results & Findings
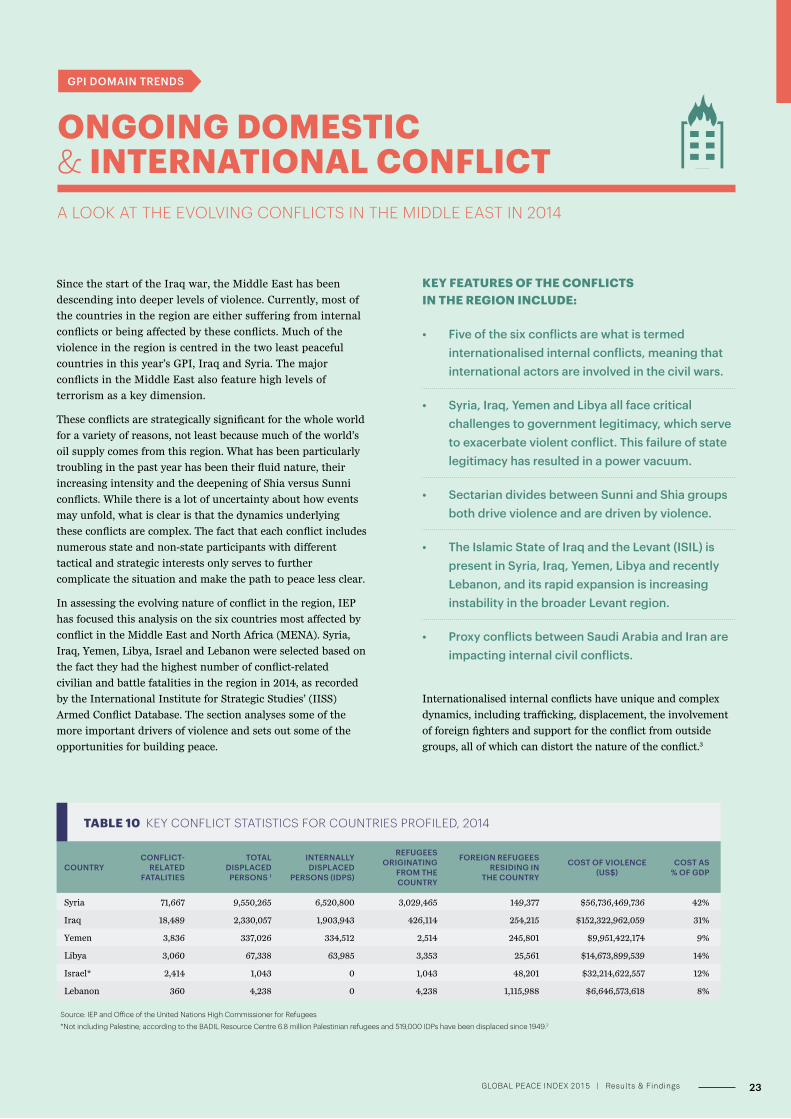
A LOOK AT THE EVOLVING CONFLICTS IN THE MIDDLE EAST IN 2014
GPI DOMAIN TRENDS
Since the start of the Iraq war, the Middle East has been
descending into deeper levels of violence. Currently, most of
the countries in the region are either suffering from internal
conflicts or being affected by these conflicts. Much of the
violence in the region is centred in the two least peaceful
countries in this year’s GPI, Iraq and Syria. The major
conflicts in the Middle East also feature high levels of
terrorism as a key dimension.
These conflicts are strategically significant for the whole world
for a variety of reasons, not least because much of the world’s
oil supply comes from this region. What has been particularly
troubling in the past year has been their fluid nature, their
increasing intensity and the deepening of Shia versus Sunni
conflicts. While there is a lot of uncertainty about how events
may unfold, what is clear is that the dynamics underlying
these conflicts are complex. The fact that each conflict includes
numerous state and non-state participants with different
tactical and strategic interests only serves to further
complicate the situation and make the path to peace less clear.
In assessing the evolving nature of conflict in the region, IEP
has focused this analysis on the six countries most affected by
conflict in the Middle East and North Africa (MENA). Syria,
Iraq, Yemen, Libya, Israel and Lebanon were selected based on
the fact they had the highest number of conflict-related
civilian and battle fatalities in the region in 2014, as recorded
by the International Institute for Strategic Studies’ (IISS)
Armed Conflict Database. The section analyses some of the
more important drivers of violence and sets out some of the
opportunities for building peace.
KEY FEATURES OF THE CONFLICTS IN THE REGION INCLUDE:
• Five of the six conflicts are what is termed internationalised internal conflicts, meaning that international actors are involved in the civil wars.
• Syria, Iraq, Yemen and Libya all face critical challenges to government legitimacy, which serve to exacerbate violent conflict. This failure of state legitimacy has resulted in a power vacuum.
• Sectarian divides between Sunni and Shia groups both drive violence and are driven by violence.
• The Islamic State of Iraq and the Levant (ISIL) is present in Syria, Iraq, Yemen, Libya and recently Lebanon, and its rapid expansion is increasing instability in the broader Levant region.
• Proxy conflicts between Saudi Arabia and Iran are impacting internal civil conflicts.
COUNTRYCONFLICT-
RELATED FATALITIES
TOTAL DISPLACED PERSONS 1
INTERNALLY DISPLACED
PERSONS (IDPS)
REFUGEES ORIGINATING
FROM THE COUNTRY
FOREIGN REFUGEES RESIDING IN
THE COUNTRY
COST OF VIOLENCE (US$)
COST AS % OF GDP
Syria 71,667 9,550,265 6,520,800 3,029,465 149,377 $56,736,469,736 42%
Iraq 18,489 2,330,057 1,903,943 426,114 254,215 $152,322,962,059 31%
Yemen 3,836 337,026 334,512 2,514 245,801 $9,951,422,174 9%
Libya 3,060 67,338 63,985 3,353 25,561 $14,673,899,539 14%
Israel* 2,414 1,043 0 1,043 48,201 $32,214,622,557 12%
Lebanon 360 4,238 0 4,238 1,115,988 $6,646,573,618 8%
Source: IEP and Office of the United Nations High Commissioner for Refugees
*Not including Palestine; according to the BADIL Resource Centre 6.8 million Palestinian refugees and 519,000 IDPs have been displaced since 1949.2
TABLE 10 KEY CONFLICT STATISTICS FOR COUNTRIES PROFILED, 2014
ONGOING DOMESTIC & INTERNATIONAL CONFLICT
Internationalised internal conflicts have unique and complex
dynamics, including trafficking, displacement, the involvement
of foreign fighters and support for the conflict from outside
groups, all of which can distort the nature of the conflict.3
23GLOBAL PEACE INDEX 2015 | Results & Findings
These internationalised internal conflicts affect all of the three
domains of the GPI and highlight the interconnectedness
between different aspects of violence. Two good examples are
indicators from the societal safety and security domain. In
some cases, civil conflicts combined with outside support have
created an environment where terrorism has flourished. In
others, terrorism has contributed to the escalation of civil war.
The impact of terrorism indicator for each of these countries is
notably worse than the average for MENA. Additionally, four
of the six countries covered in this section — Syria, Iraq,
Yemen and Libya — get the worst possible score for ease of
access to small arms and light weapons.
It is an oversimplification to say that divides between Sunnis
and Shia, or even Islamists and others, are the only source of
conflict, as described in IEP’s recent paper, Five Key Questions
Answered on the Link between Peace and Religion. Many MENA
countries have both Shia and Sunni populations and are
peaceful, such as Qatar, Kuwait and the United Arab Emirates.
However, as intergroup grievance is a key correlate of violence,
the presence of violence heightens sectarian divides.
These conflicts have complicated relations between Iran and
Saudi Arabia as both governments support competing armed
groups which exacerbate other regional dynamics. This is
most notable in Yemen where in early 2015 Iran was
supporting the Houthis while Saudi Arabia was directly
bombing their positions in support of President Hadi. The
regional conflicts are further complicated by the engagement
of global powers, such as the US and Russia, who see the
region as strategically significant.
Analysis of each conflict highlights what the International
Crisis Group calls “the recruitment potential that war and
chaos provide.”6 Mounting tensions and disintegrating security
have been advantageous to ISIL. The group has taken
advantage of sectarian rhetoric and anti-western sentiment to
swell its ranks with foreign fighters. The power vacuum
created by failed or failing states have also increased the
appeal of their caliphate as an alternative to problematic
governments, albeit at a significant cost.
ISIL has brought a new dimension to the conflicts within the
region. On 29 June 2014, ISIL leader Abu Bakr al-Baghdadi
declared himself caliph, or ultimate Muslim political and
religious leader.7 In renewing the Levant caliphate, ISIL has
attempted to apply an interpretation of Sharia that includes
the use of slavery, execution on religious grounds and war as a
means of religious salvation.8 ISIL’s Sunni followers believe
themselves to be acting out Quranic prophecy, including
victory in an international war.9
Although abhorrent to most people, the appeal of ISIL cannot
be underestimated: ISIL is engaged in sophisticated and
well-targeted global social media campaigns, it provides a
unifying purpose for the disenfranchised, and it is aligned
with Wahhabism and the Salafist schools that have broad
appeal in Saudi Arabia and other parts of MENA.
Understanding this appeal in the regional context is critical for
countering ISIL’s success.
Containing ISIL requires quelling its source of power: not just
territory or its financial sources, but addressing the sectarian
divide that drives Sunni communities to the organization.
Where there are fewer and fewer peaceful alternatives, ISIL
gains ground.
Religious identity or other loyalties often supersede national boundaries in the countries analysed. Therefore, if the state lacks legitimacy among the population, citizens are likely to look elsewhere for the benefits typically provided by governments — especially protection.
The ousting of Saddam Hussein’s Ba’athist regime in Iraq
began the most recent realignment of power in the Middle
East. President Nouri al-Maliki, who replaced Iraq’s post-
Hussein transitional government, failed to build consensus
between the Sunni and Shia groups in the country.
Disenfranchisement of Sunni communities under al-Maliki
created the environment for militias to grow, many of which
were Islamist and hostile to both Shia dominated government
and western influences. ISIL was the most successful of these
groups and used the context of the Syrian civil war to expand
into Syria. Eight of the top ten military leaders of ISIL are
believed to be Iraqi Ba’athists and three former Hussein-
government generals have joined the organisation.4
Religious identity or other loyalties often supersede national
boundaries in the countries analysed. Therefore, if the state
lacks legitimacy among the population, citizens are likely to
look elsewhere for the benefits typically provided by
governments – especially protection. These shortcomings in
state legitimacy are evidenced by persistently poor measures of
Positive Peace: the attitudes, institutions and structures that
support peaceful societies. For the past decade, the MENA
region has had an average Positive Peace Index score of 3.3 out
of 5, compared to the much better average of 2.2 for Europe.5
Reflecting the seriousness of the conflicts, Syria, Iraq, Yemen,
Lebanon and Libya continue to score much lower than the
regional average in Positive Peace.
24GLOBAL PEACE INDEX 2015 | Results & Findings
2014 was the worst year so far in the Syrian civil war and was also the deadliest conflict in the world in 2014, resulting in at least 72,000 civilian and battle-related deaths.
The conflict in Iraq deteriorated significantly in 2014, with the
number of fatalities more than doubling from 8,256 in 2013 to
18,489 in 2014 and the indicator for intensity of internal conflict
reaching the worst possible score. As ISIL undertook a rapid
and violent expansion across the region during 2014, it is not
surprising to see both Syria and Iraq experience deteriorations
in their GPI scores. Iraq is the second least peaceful country in
the 2015 GPI, after Syria.
The fall of the Saddam Hussein regime expedited the
realignment of power within the Middle East. Since the fall,
political figures that had been in political exile in Tehran
returned to Iraq and took a role in government. This has led to
the opportunity for rapprochement between Iraq and Iran, as
evidenced by the December 2014 signing of a memorandum of
understanding for Tehran to provide military support to Iraq
as well as the involvement of militias supported by Iran, such
as Hezbollah, and Iranian military advisors in the fight against
ISIL. Violence in Iraq has escalated in part due to the
concentration of power under Nouri al-Maliki’s largely Shia
government which disenfranchised the Sunni, leading to
grievances and the expansion of violent groups such as ISIL.
2014 was the worst year so far in the Syrian civil war and was
also the deadliest conflict in the world in 2014, resulting in at
least 72,000 civilian and battle-related deaths. This is nearly
three times more deaths than those that resulted from conflicts
in Iraq, Yemen, Libya and Lebanon combined.10 The armed
conflict in Syria began in 2011 when popular reform
movements swept through MENA, leading to demonstrations
seeking political and economic change from the authoritarian
regime of Bashar al-Assad.
Since then, Syria has been “the scene of many disputes,” as the
instability of the region and the engagement of global powers
played out inside and across its borders.11 Consequently, Syria
remains the least peaceful country in the 2015 GPI. In 2014,
Syria was the setting for many conflicts: between Assad’s
government and opposition militias, the government and ISIL,
and ISIL and other militias vying for territory. This context has
provided a fertile environment for ISIL to flourish and expand
its territory. The variety of religious identities in the country
combined with the government being dominated by the
Alawite minority contribute to the conflict dynamics, as
different religious groups align with different factions. Sunni
groups account for 74 per cent of the population, while 13 per
cent are Shia (Alawite, Twelvers and Ismailis), 10 per cent are
Christian and the remaining three per cent are Druze.12
SYRIA
GPI score: 3.65
RANK 162
IRAQ
GPI score: 3.44
RANK 161
And while individuals from at least 50 countries have joined on
the side of ISIL or the Syrian opposition, foreign governments
have supported both the Government of Syria and various
non-state actors. The US, which has supported some of the
Syrian opposition, expanded its anti-ISIL air strikes from Iraq
to Syria in September 2014, which at times has been helpful for
Assad.15 Arguably, Assad’s position in the conflict has
marginally deteriorated over the course of 2014, despite
Iranian and Russian support. Meanwhile, the already
fragmented opposition must defend itself on two fronts,
fighting in Aleppo against the government while fending off
ISIL to the east.16 With the regime weakened, ISIL advancing,
the opposition splitting its resources and no parties willing to
come to the negotiating table, it is difficult to find a viable
solution.17 It may be that only a shift in the regional power
balance or an agreement between the regional powers can
break the stalemate in the Syrian crisis.
The dynamics between Iran and Saudi Arabia mean that
neither can move decisively toward halting ISIL. However, an
agreement between Iran and the US, an ally of Saudi Arabia,
on Iran’s nuclear program could pave the way for productive
negotiations regarding Syria. Carnegie Fellow Karim Sajadpour
cites a former senior aid to Iranian President Hassan Rouhani:
“The best way to resolve US-Iranian tensions in Syria, he
argued, is to find a ‘Syrian Karzai’ — a Sunni Arab politician
palatable to Tehran, Washington, and the Syrian people.”18 If,
how and when that might come to pass remain to be seen.
In addition to the civil war and a major humanitarian crisis,
Syria was the theatre for two significant challenges to global
peacefulness that came to a head in 2014: an influx of foreign
fighters seeking to join the ranks of ISIL and the entanglement
of multiple power struggles between both regional and
international influences. The International Centre for the
Study of Radicalisation and Political Violence estimates that
9,730 foreigners joined various armed groups in Iraq and Syria
in 2014. In comparison, the high-end estimate for the three
prior years stands at 11,000 in total, which makes at least
20,000 foreign fighters over the duration of the conflict.13 Crisis
Group finds that the engagement of foreign fighters is fuelling
sectarian polarisation: “As Sunnis from Tunisia, Libya,
Lebanon and the West have joined the opposition rebels, Shiite
Lebanese, Iranians, Iraqis, Afghans and Pakistanis have
entered Syria on behalf of the regime.”14
25GLOBAL PEACE INDEX 2015 | Results & Findings
While ISIL has been active in Iraq for several years, the
organisation gained substantial territory in 2014, heightening
international concerns after publicising decapitations of
prisoners. This led to a reengagement of the US in Iraq, with the
strategic bombing of ISIL positions and the deployment of
military advisers to the Iraqi army.
The UN Mission to Iraq (UNAMI) documented possible war
crimes and crimes against humanity by both ISIL and Iraqi
security forces, including summary extrajudicial executions,
sexual violence and violence against civilians, including
children.19 Before the end of the year, al-Maliki resigned after
significant internal and international pressure and amidst
criticism that his government had increased the fragmentation
between Sunni and Shia communities and was
counterproductive for peace. The Kurdistan Regional
Government, which has long disputed Baghdad’s authority over
the Kurdish areas inside Iraq, also faced armed confrontations
with ISIL, further exemplifying the entanglement of conflicts
throughout the region.
Iraq’s Positive Peace scores for well functioning government and
acceptance of the rights of others have been stubbornly poor for
the past decade. International Crisis Group noted midyear that
the political alienation of Sunni communities in Iraq and their
sense of repression and neglect from the Iraqi state are among
the longstanding dynamics of conflict. The report notes that
governance reforms have been “sacrificed in the interest of
fighting ‘terrorism’, conveniently defined to encompass all forms
of Sunni violence and insurgency, but not Shiite equivalents
— an ill-conceived strategy that has produced the result it is
seeking to prevent.”20
In contrast, free flow of information improved by 27 per cent,
largely driven by an increase in mobile phone subscriptions
per capita. However, without an accompanying improvement
in the freedom of the press, increased access to digital
information is actually benefiting ISIL’s capabilities in
propaganda and social media.21
YEMEN
GPI score: 2.75
RANK 147
Yemen experienced approximately 3,800 conflict-related
deaths in 2014, the highest number recorded since IISS began
tracking conflict there in 2009. Similarly, Yemen’s intensity of
organised internal conflict indicator deteriorated to the worst
possible score of 5 out 5 in the 2015 GPI. Overt conflict broke
out in March of 2015, as simmering tensions rapidly
deteriorated into civil war. The World Health Organization
found that, “At least 1,080 people had been killed in the
country, including 48 children and 28 women, and a further
4,352 people had been injured in the violence between March
19 and April 20 [2015].”22
The Republic of Yemen is a fairly new state, resulting from an
agreement to merge North Yemen and South Yemen in 1990.
Saudi Arabia has a history of military and economic support
for both the Saleh and Hadi governments and also various
tribes within the country. In 2011, following other Arab Spring
movements, Yemeni citizens protested unemployment,
economic conditions and corruption, as well as then-President
Ali Ahmed Saleh’s attempt to remove presidential term limits
from the constitution.
A diplomatic solution in Libya holds promise for the region, as the spread of extremism relies on the absence of credible, peaceful alternatives. For any peace process to be successful, an agreement would involve power sharing arrangements and that groups would not face undue reprisals.
One of the groups participating in the revolution was the
Houthis, who represent the Zaidi Shia tribes from the north.
The Houthis gained ground via the 2011 uprisings by building
partnerships with other Yemeni groups and broadening their
popular support.23 In September 2014, the Houthis took over
the capital, Sana’a, which resulted in military support from
Saudi Arabia for the ousted government of interim president
Abd Rabbuh Mansour Hadi against the Houthis and
cumulating in airstrikes by the Saudis.
In March 2015, while a ten-nation coalition led by Saudi Arabia
carried out air strikes against Houthi fighters inside Yemen,
the Arab League announced the creation of a joint military
force. “Yemen is battling three security crises,” finds IISS,
“a violent ‘al-Houthi’ insurgency in the north, a secessionist
movement in the south, and the presence of al-Qaeda across
the country.”24 Throughout the past year, groups fighting the
Houthis have received support from Saudi Arabia while the
Houthis are being backed by Iran.25
The conflict has escalated amidst political and diplomatic
breakdowns since 2011. President Hadi was arrested by the
Houthis. He first resigned but then retracted his resignation
and subsequently fled to Riyadh.26 At the start of 2015, with a
civil war unfolding and a pending humanitarian crisis, the
country was immediately in need of an acceptable president or
presidential council.
The underlying factors of the 2011 unrest have not yet been
resolved, namely rivalries between elites, corruption and
economic distress.27 Indeed, Yemen’s poor Positive Peace score
for the corruption domain is influenced by the factionalised
elites indicator, which has deteriorated 10.5 per cent since
2005. The possibility of peace is severely hampered by the lack
of trust between the Houthis and Hadi’s supporters. Multiple
agreements have been proposed and both sides have
repeatedly violated them. In mid-May 2015 a humanitarian
ceasefire was signed but air strikes were conducted a day after
raising doubts over long term ceasefire.
26GLOBAL PEACE INDEX 2015 | Results & Findings
LIBYA
GPI score: 2.85
RANK 149
ISRAEL
GPI score: 2.78
RANK 148
It seems that only regional backing for a sustained ceasefire
and tangible action to build trust across conflict lines will
prevent Yemen from slipping into deeper violence. The
conflicting parties will need to make concessions; a protracted
civil war is more likely to benefit groups like al-Qaeda and ISIL
than anyone else.
After the ousting of former-Prime Minister Muammar Qaddafi
there were high hopes that Libya would transition into a
peaceful society. However, tribal and clan clashes resulted in a
power vacuum which has now created an environment where
other Islamist groups have formed and ISIL has gained a
foothold. The Libyan conflict is currently escalating, with IISS
recording 3,060 conflict-related fatalities in 2014. This is a
12-fold increase from 2013.
Libya’s GPI score had improved after 2012, reflecting some
progress since the 2011 Revolution. However the peace did not
last long, with the ensuing civil war resulting in the sharpest
deterioration in any country’s score in the 2015 GPI. Libya is
now ranked 149th. The score was affected by deteriorations in
political instability and the likelihood of violent demonstrations
and a resulting rise in refugees and IDPs, now numbering up to
7.3 per cent of the population. Moreover, the involvement of
Islamist groups in the strife has driven a deterioration in Libya’s
relations with neighbouring countries, particularly Egypt.
Libya faces a different crisis of legitimacy than its neighbours.
Rather than one weak government challenged by non-state
groups, Libya entered 2015 with two parliaments, two prime
ministers, and militias defending two capital cities. The
General National Congress (GNC), elected in 2012 and
currently based in Tripoli, includes Islamist groups alongside
secular constituencies. The Council of Deputies based in
Tobruk and elected in 2014, includes defectors from the
Qaddafi regime as well as loyalists and anti-Islamist groups.28
Each of these two governments represents a diverse set of
stakeholders in Libyan society, making the diplomatic process
both more complex but likely more viable.
Adding to the complications, tribal militias and jihadist groups
have taken advantage of the power vacuum. Most notably,
radical Islamist fighters seized Derna in 2014 and Sirte in 2015
in the name of ISIL, where the group beheaded 21 Egyptian
Coptic Christians. Egypt has retaliated with airstrikes.
There are two diplomatic opportunities to curtail violence.
Firstly, the UN process can encourage participation in
negotiations and observance of ceasefires and calls to de-
escalate. Secondly, an agreement on a head of state could lay
the groundwork for a disarmament process and pave the way
for integrated armed forces that would be representative of the
various groups.29 If either of these two outcomes can be
brought about inclusively and with buy-in from multiple
stakeholder groups, the stability needed for peacebuilding could
be achieved.
A diplomatic solution in Libya holds promise for the region,
as the spread of extremism relies on the absence of credible,
peaceful alternatives. For any peace process to be successful,
it will need to proceed on the basis that an agreement would
involve power sharing arrangements and that groups would not
face undue reprisals.
The Israeli-Palestinian conflict was reignited in 2014 by the tragic
deaths of several young people from both sides of the conflict.
Israel’s score fell in the 2015 GPI due to the conflict, which was
mainly reflected in the deterioration in its score for intensity of
internal conflict, and is now ranked 148th in the GPI. IISS
recorded 2,414 conflict-related deaths in 2014, up from 79 in 2013.
Although a ceasefire was in place at the start of the year, a border
clash in March 2014 resulted in the most rocket launches into
Israel since 2012.30 Several violent clashes between Israel and
different Palestinian groups occurred through April, May and
June of 2014, culminating in the July-August hostilities in Gaza.
Events escalated after the kidnapping and eventual death of three
Israeli teenagers in the West Bank. Israeli forces searched
thousands of homes in the area and arrested approximately 400
Palestinians.31 Prime Minister Benjamin Netanyahu blamed
Hamas for the kidnapping and, citing rocket fire from Hamas-
controlled Gaza, Israel commenced airstrikes over Gaza on 7 July
2014. Ground troops followed ten days later.32 In less than two
months, 2,104 Palestinians were killed, including 1,462 civilians,
almost 500 of whom were children. Israeli casualties numbered 66
soldiers and seven civilians.33
At the start of 2014, Palestine and Israel were engaged in peace
talks, but negotiations broke down before an agreement could be
reached for the 29 April deadline. Hamas and the Palestinian
Liberation Organization (PLO) signed a reconciliation agreement
on 24 April 2014, meant to unify the Palestinian national
movement and the two governments in Gaza and the West Bank.34
The agreement, however, prompted Israel’s refusal to continue
talks with an administration that included Hamas.35 A new
Palestinian unity government was nonetheless sworn in in June,
with varying degrees of recognition from the international
community, including the US, the EU and the UN.36
Crisis Group documented some Israeli actions that facilitated the
movement of goods and people in and out of Gaza, including the
limited issuing of work and travel permits to Palestinians and a
UN monitoring mechanism to deliver building materials to the
private sector. These steps do not constitute an end to the
blockade, nor is the volume of goods sufficient for unmet needs,
but it has resulted in a slight alleviation of tensions.37
27GLOBAL PEACE INDEX 2015 | Results & Findings
During the elections in Israel in early 2015 provocative
statements by Prime Minister Netanyahu drew international
condemnation, including from the US. His successful re-
election campaign promised voters that a Palestinian state
would not be realised. This declaration makes it unlikely that
the Israeli government will support progress toward a
two-state solution.
Lebanon has faced varying levels of ongoing conflict for decades
and the number of conflict-related fatalities climbed to 360 in
2014. The country saw tension and violence escalate as Lebanese
militias became involved in the Syrian conflict. Syria had
maintained a military presence in Lebanon from 1976 to 2005
and Hezbollah considers Syria a crucial ally.38 “The two
countries share a 365-kilometre, un-demarcated and largely
porous border as well as extremely close communal ties.”39
UNHCR’s plan in Lebanon for 2014 aimed to support 1.5 million
Syrian refugees and another 1.5 million Lebanese affected by the
Syrian conflict, highlighting that the Syrian war is having
significant consequences on the people of Lebanon.40
By February 2014, Hezbollah was actively fighting Syrian rebels
inside Syria and later extended its actions against ISIL into Iraq.
Hezbollah’s actions have been countered by Islamist militias
becoming active in Lebanon, with some in the Shia community
interpreting recent suicide bombings as reprisals.41 By October,
clashes were being reported inside Lebanon between Sunni
groups that support Syrian rebels and Alawite groups aligned
with the Syrian regime.42
The influx of millions of Syrian refugees has the potential to
significantly impact the Lebanese economy. Together, the cost
of violence to the Syrian and Lebanese economies is
approximately US$63 billion.43 This economic burden may
have a substantial impact on development and could be a
driver of further violence.
Rather than relying on refugee camps, Lebanon is allowing
Syrian refugees to integrate into the economy by renting
accommodation and purchasing their own goods.44 This may
have both a positive and negative effect on the country. The
influx of refugees improves the supply of human capital and
creates consumers who need housing and other essential
services. Due to these policies Lebanon may be unique, as it is
possible, according to the World Bank, that the net economic
effect of refugee inflows will be positive in the short term.45
However, strains do exist with many Syrians moving into the
poorest areas of Lebanon and having little access to support
services.46 In early 2015, UNHCR had only secured ten per cent
of its funding requirement for the year. Furthermore, refugee
inflows could depress wages by increasing labour supply and
further existing socio-economic divides.
LEBANON
GPI score: 2.62
RANK 145
It seems that only regional backing for a sustained ceasefire and tangible action to build trust across conflict lines will prevent Yemen from slipping into deeper violence. The conflicting parties will need to make concessions; a protracted civil war is more likely to benefit groups like al-Qaeda and ISIL than anyone else.
28GLOBAL PEACE INDEX 2015 | Results & Findings
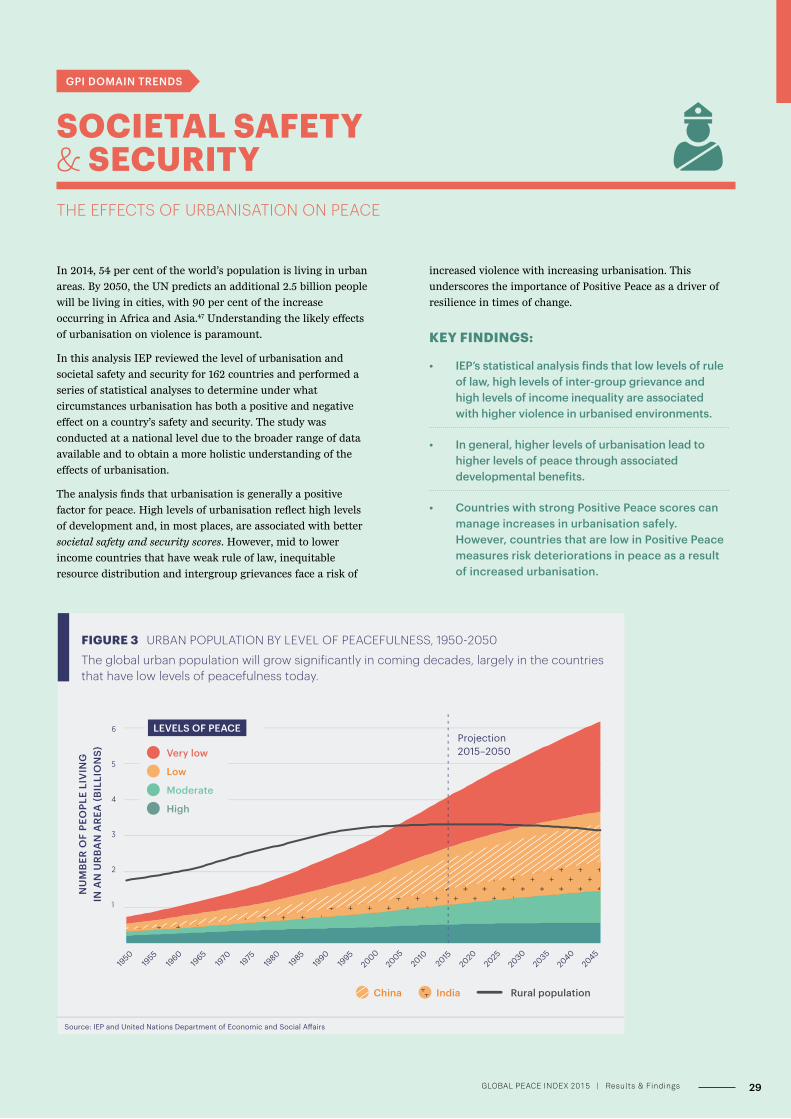
increased violence with increasing urbanisation. This
underscores the importance of Positive Peace as a driver of
resilience in times of change.
KEY FINDINGS:
• IEP’s statistical analysis finds that low levels of rule of law, high levels of inter-group grievance and high levels of income inequality are associated with higher violence in urbanised environments.
• In general, higher levels of urbanisation lead to higher levels of peace through associated developmental benefits.
• Countries with strong Positive Peace scores can manage increases in urbanisation safely. However, countries that are low in Positive Peace measures risk deteriorations in peace as a result of increased urbanisation.
SOCIETAL SAFETY & SECURITY THE EFFECTS OF URBANISATION ON PEACE
GPI DOMAIN TRENDS
In 2014, 54 per cent of the world’s population is living in urban
areas. By 2050, the UN predicts an additional 2.5 billion people
will be living in cities, with 90 per cent of the increase
occurring in Africa and Asia.47 Understanding the likely effects
of urbanisation on violence is paramount.
In this analysis IEP reviewed the level of urbanisation and
societal safety and security for 162 countries and performed a
series of statistical analyses to determine under what
circumstances urbanisation has both a positive and negative
effect on a country’s safety and security. The study was
conducted at a national level due to the broader range of data
available and to obtain a more holistic understanding of the
effects of urbanisation.
The analysis finds that urbanisation is generally a positive
factor for peace. High levels of urbanisation reflect high levels
of development and, in most places, are associated with better
societal safety and security scores. However, mid to lower
income countries that have weak rule of law, inequitable
resource distribution and intergroup grievances face a risk of
FIGURE 3 URBAN POPULATION BY LEVEL OF PEACEFULNESS, 1950-2050
The global urban population will grow significantly in coming decades, largely in the countries that have low levels of peacefulness today.
Source: IEP and United Nations Department of Economic and Social A�airs
1950
1955
1960
1965
1970
19
75
1980
1985
1990
1995
2000
2005
2010
2015
2020
2025
2030
2035
2040
2045
NU
MB
ER O
F PE
OPL
E LI
VIN
G
IN A
N U
RB
AN
AR
EA (B
ILLI
ON
S)
China Rural populationIndia
Very low
LEVELS OF PEACE
Low
Moderate
High
Projection 2015–2050
6
5
4
3
2
1
29GLOBAL PEACE INDEX 2015 | Results & Findings
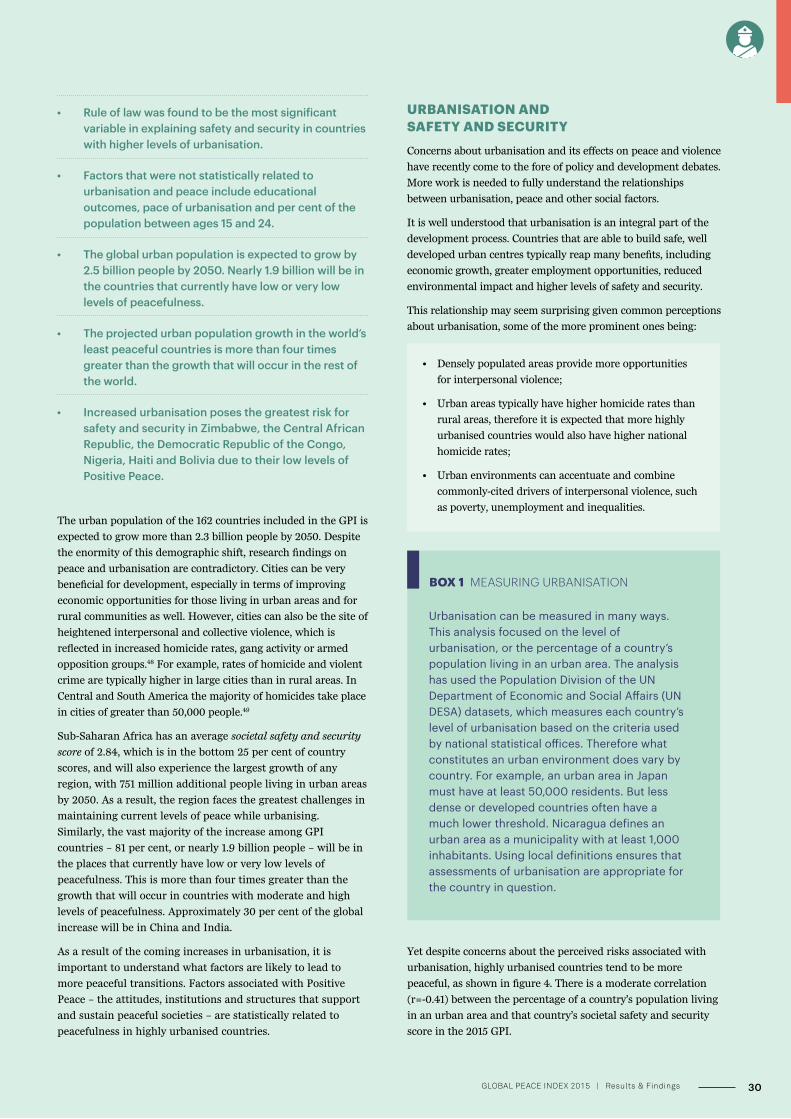
• Rule of law was found to be the most significant variable in explaining safety and security in countries with higher levels of urbanisation.
• Factors that were not statistically related to urbanisation and peace include educational outcomes, pace of urbanisation and per cent of the population between ages 15 and 24.
• The global urban population is expected to grow by 2.5 billion people by 2050. Nearly 1.9 billion will be in the countries that currently have low or very low levels of peacefulness.
• The projected urban population growth in the world’s least peaceful countries is more than four times greater than the growth that will occur in the rest of the world.
• Increased urbanisation poses the greatest risk for safety and security in Zimbabwe, the Central African Republic, the Democratic Republic of the Congo, Nigeria, Haiti and Bolivia due to their low levels of Positive Peace.
The urban population of the 162 countries included in the GPI is
expected to grow more than 2.3 billion people by 2050. Despite
the enormity of this demographic shift, research findings on
peace and urbanisation are contradictory. Cities can be very
beneficial for development, especially in terms of improving
economic opportunities for those living in urban areas and for
rural communities as well. However, cities can also be the site of
heightened interpersonal and collective violence, which is
reflected in increased homicide rates, gang activity or armed
opposition groups.48 For example, rates of homicide and violent
crime are typically higher in large cities than in rural areas. In
Central and South America the majority of homicides take place
in cities of greater than 50,000 people.49
Sub-Saharan Africa has an average societal safety and security
score of 2.84, which is in the bottom 25 per cent of country
scores, and will also experience the largest growth of any
region, with 751 million additional people living in urban areas
by 2050. As a result, the region faces the greatest challenges in
maintaining current levels of peace while urbanising.
Similarly, the vast majority of the increase among GPI
countries – 81 per cent, or nearly 1.9 billion people – will be in
the places that currently have low or very low levels of
peacefulness. This is more than four times greater than the
growth that will occur in countries with moderate and high
levels of peacefulness. Approximately 30 per cent of the global
increase will be in China and India.
As a result of the coming increases in urbanisation, it is
important to understand what factors are likely to lead to
more peaceful transitions. Factors associated with Positive
Peace – the attitudes, institutions and structures that support
and sustain peaceful societies – are statistically related to
peacefulness in highly urbanised countries.
URBANISATION AND SAFETY AND SECURITY
Concerns about urbanisation and its effects on peace and violence
have recently come to the fore of policy and development debates.
More work is needed to fully understand the relationships
between urbanisation, peace and other social factors.
It is well understood that urbanisation is an integral part of the
development process. Countries that are able to build safe, well
developed urban centres typically reap many benefits, including
economic growth, greater employment opportunities, reduced
environmental impact and higher levels of safety and security.
This relationship may seem surprising given common perceptions
about urbanisation, some of the more prominent ones being:
• Densely populated areas provide more opportunities
for interpersonal violence;
• Urban areas typically have higher homicide rates than
rural areas, therefore it is expected that more highly
urbanised countries would also have higher national
homicide rates;
• Urban environments can accentuate and combine
commonly-cited drivers of interpersonal violence, such
as poverty, unemployment and inequalities.
Urbanisation can be measured in many ways. This analysis focused on the level of urbanisation, or the percentage of a country’s population living in an urban area. The analysis has used the Population Division of the UN Department of Economic and Social Affairs (UN DESA) datasets, which measures each country’s level of urbanisation based on the criteria used by national statistical offices. Therefore what constitutes an urban environment does vary by country. For example, an urban area in Japan must have at least 50,000 residents. But less dense or developed countries often have a much lower threshold. Nicaragua defines an urban area as a municipality with at least 1,000 inhabitants. Using local definitions ensures that assessments of urbanisation are appropriate for the country in question.
BOX 1 MEASURING URBANISATION
Yet despite concerns about the perceived risks associated with
urbanisation, highly urbanised countries tend to be more
peaceful, as shown in figure 4. There is a moderate correlation
(r=-0.41) between the percentage of a country’s population living
in an urban area and that country’s societal safety and security
score in the 2015 GPI.
30GLOBAL PEACE INDEX 2015 | Results & Findings
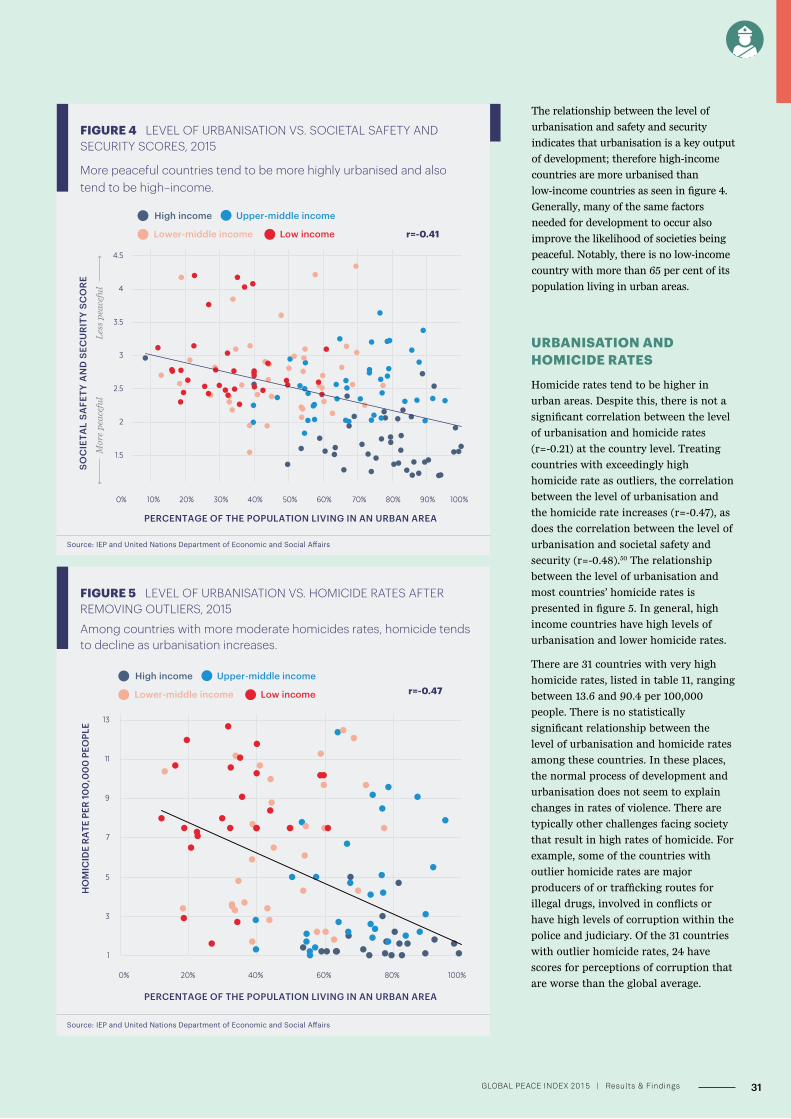
URBANISATION AND HOMICIDE RATES
Homicide rates tend to be higher in
urban areas. Despite this, there is not a
significant correlation between the level
of urbanisation and homicide rates
(r=-0.21) at the country level. Treating
countries with exceedingly high
homicide rate as outliers, the correlation
between the level of urbanisation and
the homicide rate increases (r=-0.47), as
does the correlation between the level of
urbanisation and societal safety and
security (r=-0.48).50 The relationship
between the level of urbanisation and
most countries’ homicide rates is
presented in figure 5. In general, high
income countries have high levels of
urbanisation and lower homicide rates.
There are 31 countries with very high
homicide rates, listed in table 11, ranging
between 13.6 and 90.4 per 100,000
people. There is no statistically
significant relationship between the
level of urbanisation and homicide rates
among these countries. In these places,
the normal process of development and
urbanisation does not seem to explain
changes in rates of violence. There are
typically other challenges facing society
that result in high rates of homicide. For
example, some of the countries with
outlier homicide rates are major
producers of or trafficking routes for
illegal drugs, involved in conflicts or
have high levels of corruption within the
police and judiciary. Of the 31 countries
with outlier homicide rates, 24 have
scores for perceptions of corruption that
are worse than the global average.
FIGURE 4 LEVEL OF URBANISATION VS. SOCIETAL SAFETY AND SECURITY SCORES, 2015
More peaceful countries tend to be more highly urbanised and also tend to be high–income.
Source: IEP and United Nations Department of Economic and Social A�airs
Mor
e p
eace
ful
L
ess
pea
cefu
l
1.5
2
2.5
3
3.5
4
4.5
0% 10% 20% 30% 40% 50% 60% 70% 80% 90% 100%
SOC
IETA
L SA
FETY
AN
D S
ECU
RIT
Y SC
OR
E
PERCENTAGE OF THE POPULATION LIVING IN AN URBAN AREA
High income Upper-middle income
Lower-middle income Low income r=-0.41
FIGURE 5 LEVEL OF URBANISATION VS. HOMICIDE RATES AFTER REMOVING OUTLIERS, 2015
Among countries with more moderate homicides rates, homicide tends to decline as urbanisation increases.
Source: IEP and United Nations Department of Economic and Social A�airs
HO
MIC
IDE
RATE
PER
100
,00
0 P
EOPL
E
PERCENTAGE OF THE POPULATION LIVING IN AN URBAN AREA
r=-0.47
7
9
11
13
1
3
5
0% 20% 40% 60% 80% 100%
High income Upper-middle income
Lower-middle income Low income
The relationship between the level of
urbanisation and safety and security
indicates that urbanisation is a key output
of development; therefore high-income
countries are more urbanised than
low-income countries as seen in figure 4.
Generally, many of the same factors
needed for development to occur also
improve the likelihood of societies being
peaceful. Notably, there is no low-income
country with more than 65 per cent of its
population living in urban areas.
31GLOBAL PEACE INDEX 2015 | Results & Findings
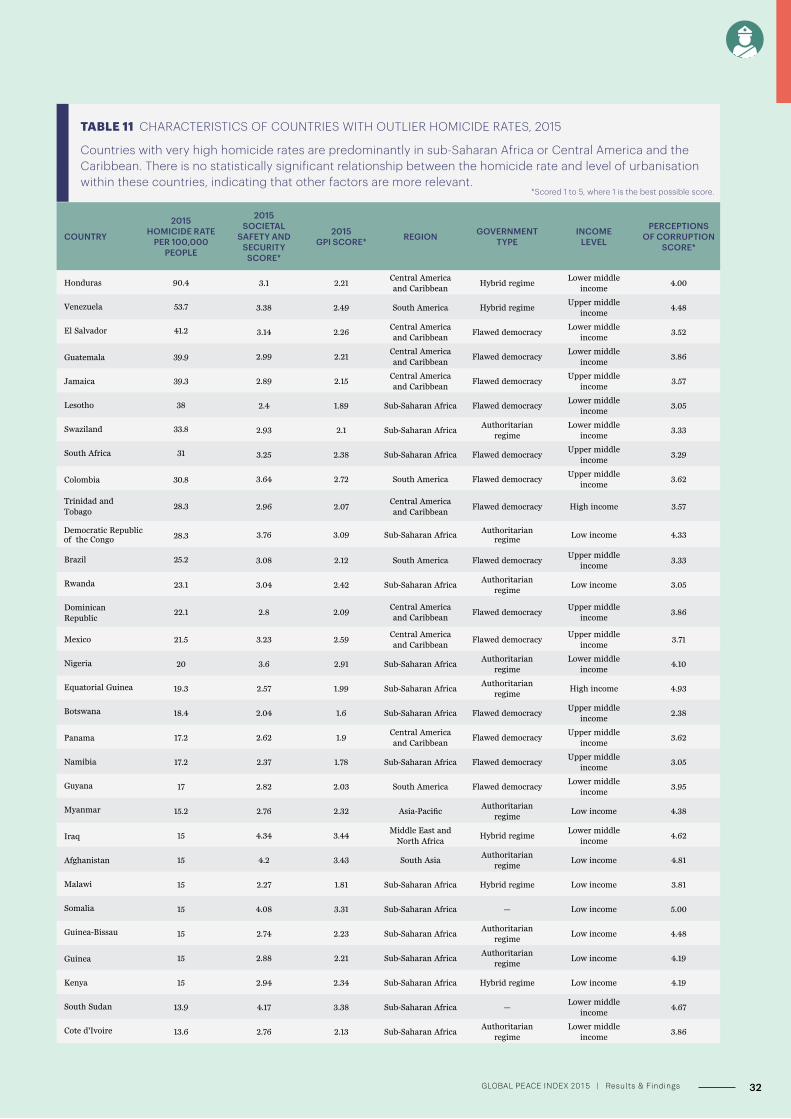
COUNTRY
2015 HOMICIDE RATE
PER 100,000 PEOPLE
2015 SOCIETAL
SAFETY AND SECURITY
SCORE*
2015 GPI SCORE* REGION GOVERNMENT
TYPEINCOME
LEVEL
PERCEPTIONS OF CORRUPTION
SCORE*
Honduras 90.4 3.1 2.21Central America and Caribbean
Hybrid regimeLower middle
income4.00
Venezuela 53.7 3.38 2.49 South America Hybrid regimeUpper middle
income4.48
El Salvador 41.2 3.14 2.26Central America and Caribbean
Flawed democracyLower middle
income3.52
Guatemala 39.9 2.99 2.21Central America and Caribbean
Flawed democracyLower middle
income3.86
Jamaica 39.3 2.89 2.15Central America and Caribbean
Flawed democracyUpper middle
income3.57
Lesotho 38 2.4 1.89 Sub-Saharan Africa Flawed democracyLower middle
income3.05
Swaziland 33.8 2.93 2.1 Sub-Saharan AfricaAuthoritarian
regimeLower middle
income3.33
South Africa 31 3.25 2.38 Sub-Saharan Africa Flawed democracyUpper middle
income3.29
Colombia 30.8 3.64 2.72 South America Flawed democracyUpper middle
income3.62
Trinidad and Tobago
28.3 2.96 2.07Central America and Caribbean
Flawed democracy High income 3.57
28.3 3.76 3.09 Sub-Saharan AfricaAuthoritarian
regimeLow income 4.33
Brazil 25.2 3.08 2.12 South America Flawed democracyUpper middle
income3.33
Rwanda 23.1 3.04 2.42 Sub-Saharan AfricaAuthoritarian
regimeLow income 3.05
Dominican Republic
22.1 2.8 2.09Central America and Caribbean
Flawed democracyUpper middle
income3.86
Mexico 21.5 3.23 2.59Central America and Caribbean
Flawed democracyUpper middle
income3.71
Nigeria 20 3.6 2.91 Sub-Saharan AfricaAuthoritarian
regimeLower middle
income4.10
Equatorial Guinea 19.3 2.57 1.99 Sub-Saharan AfricaAuthoritarian
regimeHigh income 4.93
Botswana 18.4 2.04 1.6 Sub-Saharan Africa Flawed democracyUpper middle
income2.38
Panama 17.2 2.62 1.9Central America and Caribbean
Flawed democracyUpper middle
income3.62
Namibia 17.2 2.37 1.78 Sub-Saharan Africa Flawed democracyUpper middle
income3.05
Guyana 17 2.82 2.03 South America Flawed democracyLower middle
income3.95
Myanmar 15.2 2.76 2.32 Asia-PacificAuthoritarian
regimeLow income 4.38
Iraq 15 4.34 3.44Middle East and
North AfricaHybrid regime
Lower middle income
4.62
Afghanistan 15 4.2 3.43 South AsiaAuthoritarian
regimeLow income 4.81
Malawi 15 2.27 1.81 Sub-Saharan Africa Hybrid regime Low income 3.81
Somalia 15 4.08 3.31 Sub-Saharan Africa — Low income 5.00
Guinea-Bissau 15 2.74 2.23 Sub-Saharan AfricaAuthoritarian
regimeLow income 4.48
Guinea 15 2.88 2.21 Sub-Saharan AfricaAuthoritarian
regimeLow income 4.19
Kenya 15 2.94 2.34 Sub-Saharan Africa Hybrid regime Low income 4.19
South Sudan 13.9 4.17 3.38 Sub-Saharan Africa —Lower middle
income4.67
Cote d'Ivoire 13.6 2.76 2.13 Sub-Saharan AfricaAuthoritarian
regimeLower middle
income3.86
TABLE 11 CHARACTERISTICS OF COUNTRIES WITH OUTLIER HOMICIDE RATES, 2015
Countries with very high homicide rates are predominantly in sub-Saharan Africa or Central America and the Caribbean. There is no statistically significant relationship between the homicide rate and level of urbanisation within these countries, indicating that other factors are more relevant.
Democratic Republic of the Congo
*Scored 1 to 5, where 1 is the best possible score.
32GLOBAL PEACE INDEX 2015 | Results & Findings
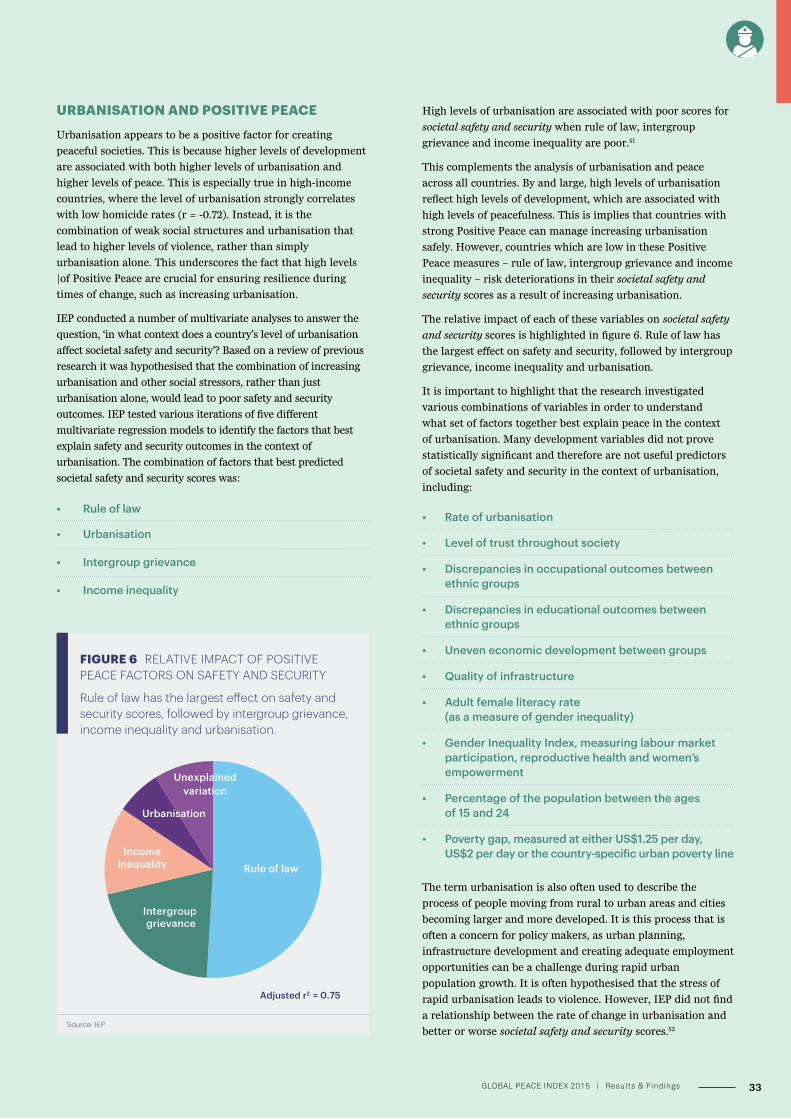
High levels of urbanisation are associated with poor scores for
societal safety and security when rule of law, intergroup
grievance and income inequality are poor.51
This complements the analysis of urbanisation and peace
across all countries. By and large, high levels of urbanisation
reflect high levels of development, which are associated with
high levels of peacefulness. This is implies that countries with
strong Positive Peace can manage increasing urbanisation
safely. However, countries which are low in these Positive
Peace measures – rule of law, intergroup grievance and income
inequality – risk deteriorations in their societal safety and
security scores as a result of increasing urbanisation.
The relative impact of each of these variables on societal safety
and security scores is highlighted in figure 6. Rule of law has
the largest effect on safety and security, followed by intergroup
grievance, income inequality and urbanisation.
It is important to highlight that the research investigated
various combinations of variables in order to understand
what set of factors together best explain peace in the context
of urbanisation. Many development variables did not prove
statistically significant and therefore are not useful predictors
of societal safety and security in the context of urbanisation,
including:
• Rate of urbanisation
• Level of trust throughout society
• Discrepancies in occupational outcomes between ethnic groups
• Discrepancies in educational outcomes between ethnic groups
• Uneven economic development between groups
• Quality of infrastructure
• Adult female literacy rate (as a measure of gender inequality)
• Gender Inequality Index, measuring labour market participation, reproductive health and women’s empowerment
• Percentage of the population between the ages of 15 and 24
• Poverty gap, measured at either US$1.25 per day, US$2 per day or the country-specific urban poverty line
The term urbanisation is also often used to describe the
process of people moving from rural to urban areas and cities
becoming larger and more developed. It is this process that is
often a concern for policy makers, as urban planning,
infrastructure development and creating adequate employment
opportunities can be a challenge during rapid urban
population growth. It is often hypothesised that the stress of
rapid urbanisation leads to violence. However, IEP did not find
a relationship between the rate of change in urbanisation and
better or worse societal safety and security scores.52
URBANISATION AND POSITIVE PEACE
Urbanisation appears to be a positive factor for creating
peaceful societies. This is because higher levels of development
are associated with both higher levels of urbanisation and
higher levels of peace. This is especially true in high-income
countries, where the level of urbanisation strongly correlates
with low homicide rates (r = -0.72). Instead, it is the
combination of weak social structures and urbanisation that
lead to higher levels of violence, rather than simply
urbanisation alone. This underscores the fact that high levels
|of Positive Peace are crucial for ensuring resilience during
times of change, such as increasing urbanisation.
IEP conducted a number of multivariate analyses to answer the
question, ‘in what context does a country’s level of urbanisation
affect societal safety and security’? Based on a review of previous
research it was hypothesised that the combination of increasing
urbanisation and other social stressors, rather than just
urbanisation alone, would lead to poor safety and security
outcomes. IEP tested various iterations of five different
multivariate regression models to identify the factors that best
explain safety and security outcomes in the context of
urbanisation. The combination of factors that best predicted
societal safety and security scores was:
• Rule of law
• Urbanisation
• Intergroup grievance
• Income inequality
FIGURE 6 RELATIVE IMPACT OF POSITIVE PEACE FACTORS ON SAFETY AND SECURITY
Rule of law has the largest e�ect on safety and security scores, followed by intergroup grievance, income inequality and urbanisation.
Source: IEP
Rule of law
Intergroup grievance
Income inequality
Urbanisation
Unexplained variation
Adjusted r2 = 0.75
33GLOBAL PEACE INDEX 2015 | Results & Findings
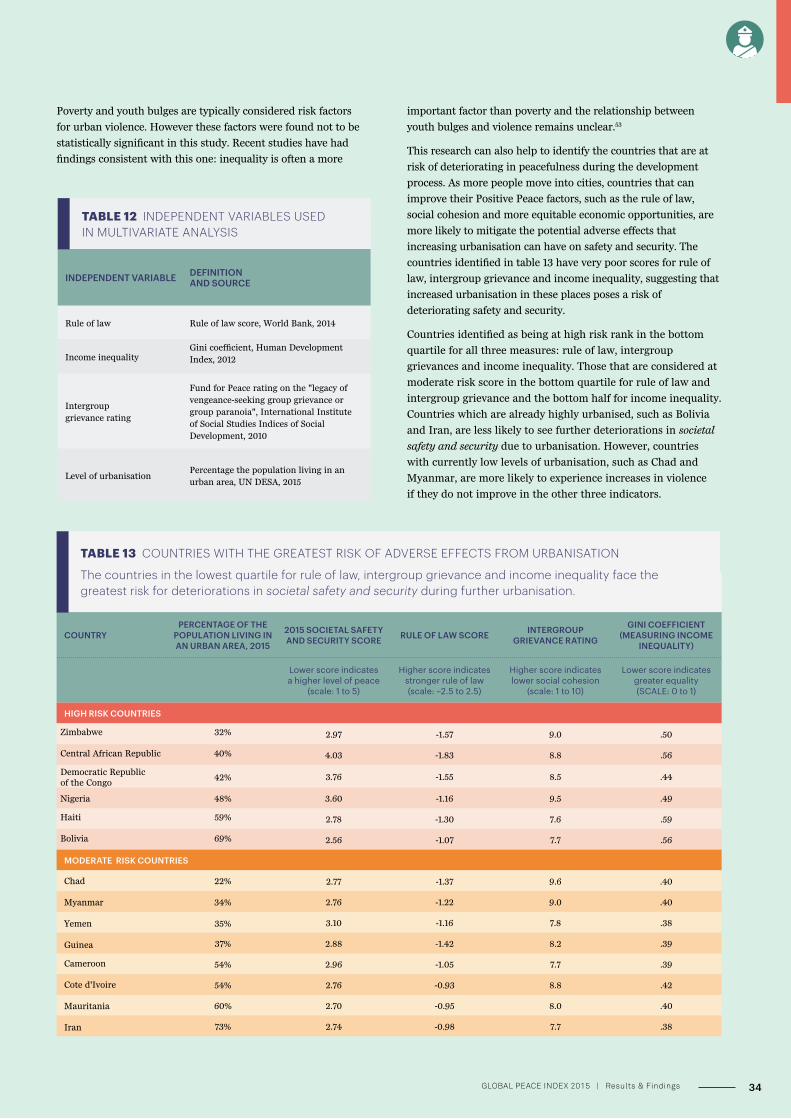
COUNTRYPERCENTAGE OF THE
POPULATION LIVING IN AN URBAN AREA, 2015
2015 SOCIETAL SAFETY AND SECURITY SCORE RULE OF LAW SCORE INTERGROUP
GRIEVANCE RATING
GINI COEFFICIENT (MEASURING INCOME
INEQUALITY)
Lower score indicates a higher level of peace
(scale: 1 to 5)
Higher score indicates stronger rule of law (scale: –2.5 to 2.5)
Higher score indicates lower social cohesion
(scale: 1 to 10)
Lower score indicates greater equality (SCALE: 0 to 1)
HIGH RISK COUNTRIES
Zimbabwe 32% 2.97 -1.57 9.0 .50
Central African Republic 40% 4.03 -1.83 8.8 .56
Democratic Republic of the Congo
42% 3.76 -1.55 8.5 .44
Nigeria 48% 3.60 -1.16 9.5 .49
Haiti 59% 2.78 -1.30 7.6 .59
Bolivia 69% 2.56 -1.07 7.7 .56
MODERATE RISK COUNTRIES
Chad 22% 2.77 -1.37 9.6 .40
Myanmar 34% 2.76 -1.22 9.0 .40
Yemen 35% 3.10 -1.16 7.8 .38
Guinea 37% 2.88 -1.42 8.2 .39
Cameroon 54% 2.96 -1.05 7.7 .39
Cote d'Ivoire 54% 2.76 -0.93 8.8 .42
Mauritania 60% 2.70 -0.95 8.0 .40
Iran 73% 2.74 -0.98 7.7 .38
TABLE 13 COUNTRIES WITH THE GREATEST RISK OF ADVERSE EFFECTS FROM URBANISATION
The countries in the lowest quartile for rule of law, intergroup grievance and income inequality face the greatest risk for deteriorations in societal safety and security during further urbanisation.
important factor than poverty and the relationship between
youth bulges and violence remains unclear.53
This research can also help to identify the countries that are at
risk of deteriorating in peacefulness during the development
process. As more people move into cities, countries that can
improve their Positive Peace factors, such as the rule of law,
social cohesion and more equitable economic opportunities, are
more likely to mitigate the potential adverse effects that
increasing urbanisation can have on safety and security. The
countries identified in table 13 have very poor scores for rule of
law, intergroup grievance and income inequality, suggesting that
increased urbanisation in these places poses a risk of
deteriorating safety and security.
Countries identified as being at high risk rank in the bottom
quartile for all three measures: rule of law, intergroup
grievances and income inequality. Those that are considered at
moderate risk score in the bottom quartile for rule of law and
intergroup grievance and the bottom half for income inequality.
Countries which are already highly urbanised, such as Bolivia
and Iran, are less likely to see further deteriorations in societal
safety and security due to urbanisation. However, countries
with currently low levels of urbanisation, such as Chad and
Myanmar, are more likely to experience increases in violence
if they do not improve in the other three indicators.
Poverty and youth bulges are typically considered risk factors
for urban violence. However these factors were found not to be
statistically significant in this study. Recent studies have had
findings consistent with this one: inequality is often a more
INDEPENDENT VARIABLE DEFINITION AND SOURCE
Rule of law Rule of law score, World Bank, 2014
Income inequalityGini coefficient, Human Development Index, 2012
Intergroup grievance rating
Fund for Peace rating on the "legacy of vengeance-seeking group grievance or group paranoia", International Institute of Social Studies Indices of Social Development, 2010
Level of urbanisationPercentage the population living in an urban area, UN DESA, 2015
TABLE 12 INDEPENDENT VARIABLES USED IN MULTIVARIATE ANALYSIS
34GLOBAL PEACE INDEX 2015 | Results & Findings
Two datasets have been used to measure militarisation.
The first is the militarisation domain of the GPI and the second
is Bonn International Centre for Conversion’s (BICC) Global
Militarisation Index (GMI). The GMI has been used for displaying
long-term trends while the GPI has been used for statistical
analysis. Both datasets contain the following information:
• Levels of arms production
• The size of defence expenditures
• Number of armed service personnel
• Volume of weapons exports and imports.
The key difference between the GPI and GMI militarisation
scores is that the GMI includes irregular forces as part of the
total number of armed services personnel per 100,000.
To determine which factors are statistically associated with
militarisation, IEP has compared the militarisation domain of
the GPI against 8,500 datasets, indices and attitudinal surveys.
Because economic size and capacity are primary factors
affecting militarisation, IEP has separated higher and lower
GDP per capita countries in this analysis. Low income
countries often lack the resources to achieve an efficient level
of militarisation while balancing poor state capacity and
generally high levels of violence.
Higher income countries are defined as countries with a per
capita income greater than US$4,086, representing the top half
of global income distribution, and lower income countries are
countries below US$4,085 per capita income and in the bottom
half of global income distribution.
The GMI was used to illustrate militarisation trends over time.
It provides a supplement to the GPI data, as it extends back to
1990 while the GPI only covers 2008 to 2015.
As would be expected, there is a clear relationship globally
between both lower internal and external levels of peacefulness
and militarisation. Higher levels of militarisation in lower
income countries are statistically associated with lack of
security legitimacy, higher levels of corruption and a less
equitable distribution of national resources. This reflects the
fact that low income countries with high corruption and
MILITARISATION MEASURING MILITARISATION AND UNDERSTANDING ITS CORRELATES
GPI DOMAIN TRENDS
Militarisation is a complex phenomenon and is affected by
events occurring within a country’s borders as well as
regional and international events. Military spending is one of
the larger sectors of global government spending,
representing approximately US$3.09 trillion PPP dollars54 or
2.9 per cent of global GDP. This section looks at how national
income, internal governance, and other forms of violence
relate to militarisation.
KEY FINDINGS:
• Large changes in the levels of global or regional militarisation are rare. They are associated with geopolitical realignments and global economic shifts.
• There is a statistically significant link between the Political Terror Scale and militarisation. This suggests that countries which are weak in other aspects of their GPI factors are more likely to use their military capacity domestically.
• Militarisation on its own is not the deciding factor for internal repression, but rather dependent on the mix of Positive Peace factors within a country. In lower income countries, two Positive Peace factors, low levels of corruption and the equitable distribution of resources, deteriorate with increases in militarisation.
• Surprisingly, militarisation does not meaningfully correlate with public opinion data such as the World Values Survey, Gallup World Poll and Social Progress Index, among others.
• Survey data from wealthy, highly militarised countries highlights that these countries have stronger disapproval of disarmament movements and a more positive view of the role of the military.
• High income, highly militarised countries tend to be the largest net donors of Official Development Assistance (ODA).
Higher levels of militarisation in lower income countries are statistically associated with lack of security legitimacy, higher levels of corruption and a less equitable distribution of national resources.
35GLOBAL PEACE INDEX 2015 | Results & Findings
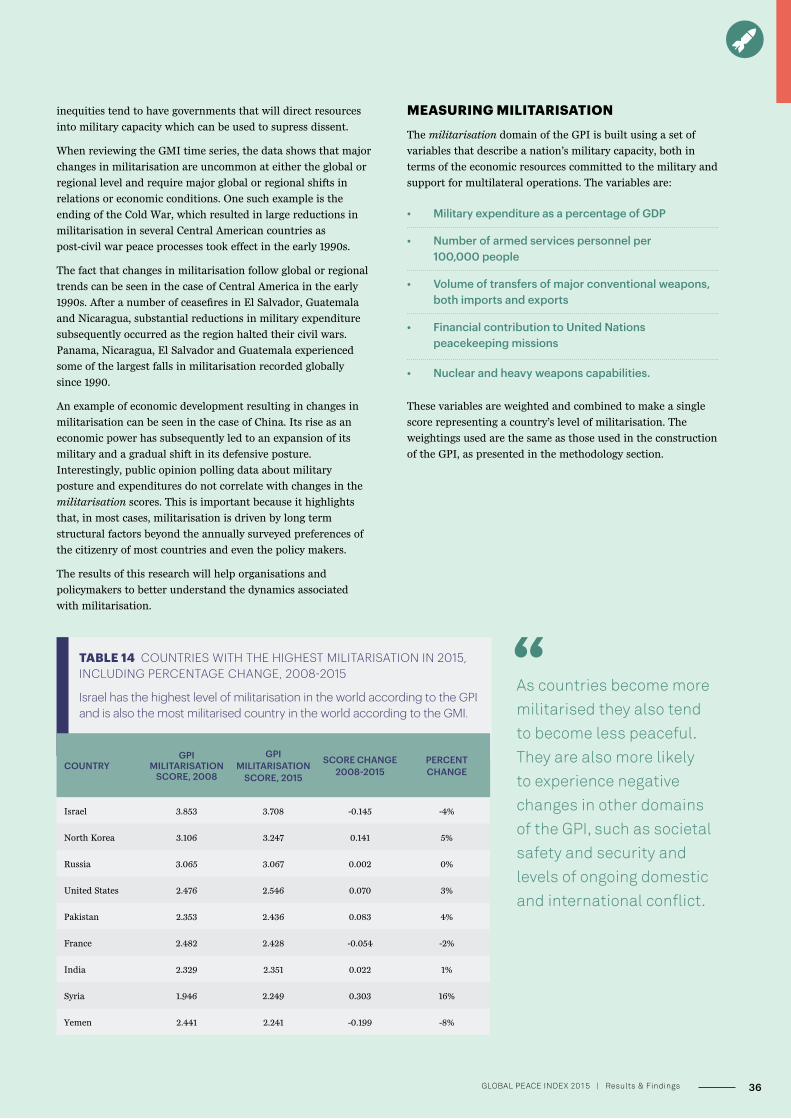
TABLE 14 COUNTRIES WITH THE HIGHEST MILITARISATION IN 2015, INCLUDING PERCENTAGE CHANGE, 2008-2015
Israel has the highest level of militarisation in the world according to the GPI and is also the most militarised country in the world according to the GMI.
inequities tend to have governments that will direct resources
into military capacity which can be used to supress dissent.
When reviewing the GMI time series, the data shows that major
changes in militarisation are uncommon at either the global or
regional level and require major global or regional shifts in
relations or economic conditions. One such example is the
ending of the Cold War, which resulted in large reductions in
militarisation in several Central American countries as
post-civil war peace processes took effect in the early 1990s.
The fact that changes in militarisation follow global or regional
trends can be seen in the case of Central America in the early
1990s. After a number of ceasefires in El Salvador, Guatemala
and Nicaragua, substantial reductions in military expenditure
subsequently occurred as the region halted their civil wars.
Panama, Nicaragua, El Salvador and Guatemala experienced
some of the largest falls in militarisation recorded globally
since 1990.
An example of economic development resulting in changes in
militarisation can be seen in the case of China. Its rise as an
economic power has subsequently led to an expansion of its
military and a gradual shift in its defensive posture.
Interestingly, public opinion polling data about military
posture and expenditures do not correlate with changes in the
militarisation scores. This is important because it highlights
that, in most cases, militarisation is driven by long term
structural factors beyond the annually surveyed preferences of
the citizenry of most countries and even the policy makers.
The results of this research will help organisations and
policymakers to better understand the dynamics associated
with militarisation.
COUNTRYGPI
MILITARISATION SCORE, 2008
GPI MILITARISATION
SCORE, 2015
SCORE CHANGE 2008-2015
PERCENT CHANGE
Israel 3.853 3.708 -0.145 -4%
North Korea 3.106 3.247 0.141 5%
Russia 3.065 3.067 0.002 0%
United States 2.476 2.546 0.070 3%
Pakistan 2.353 2.436 0.083 4%
France 2.482 2.428 -0.054 -2%
India 2.329 2.351 0.022 1%
Syria 1.946 2.249 0.303 16%
Yemen 2.441 2.241 -0.199 -8%
MEASURING MILITARISATION
The militarisation domain of the GPI is built using a set of
variables that describe a nation’s military capacity, both in
terms of the economic resources committed to the military and
support for multilateral operations. The variables are:
• Military expenditure as a percentage of GDP
• Number of armed services personnel per 100,000 people
• Volume of transfers of major conventional weapons, both imports and exports
• Financial contribution to United Nations peacekeeping missions
• Nuclear and heavy weapons capabilities.
These variables are weighted and combined to make a single
score representing a country’s level of militarisation. The
weightings used are the same as those used in the construction
of the GPI, as presented in the methodology section.
As countries become more militarised they also tend to become less peaceful. They are also more likely to experience negative changes in other domains of the GPI, such as societal safety and security and levels of ongoing domestic and international conflict.
36GLOBAL PEACE INDEX 2015 | Results & Findings
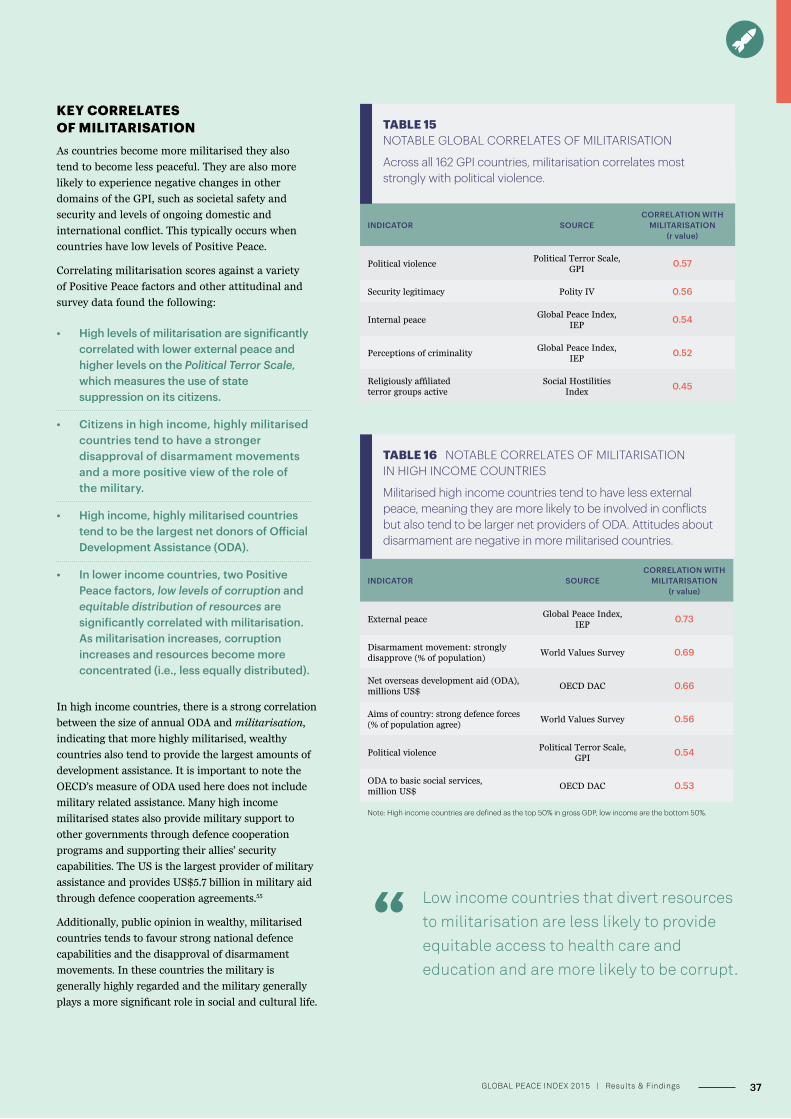
INDICATOR SOURCECORRELATION WITH
MILITARISATION (r value)
Political violencePolitical Terror Scale,
GPI0.57
Security legitimacy Polity IV 0.56
Internal peaceGlobal Peace Index,
IEP0.54
Perceptions of criminalityGlobal Peace Index,
IEP0.52
Religiously affiliated terror groups active
Social Hostilities Index
0.45
TABLE 15 NOTABLE GLOBAL CORRELATES OF MILITARISATION
Across all 162 GPI countries, militarisation correlates most strongly with political violence.
INDICATOR SOURCECORRELATION WITH
MILITARISATION (r value)
External peaceGlobal Peace Index,
IEP0.73
Disarmament movement: strongly disapprove (% of population)
World Values Survey 0.69
Net overseas development aid (ODA), millions US$
OECD DAC 0.66
Aims of country: strong defence forces (% of population agree)
World Values Survey 0.56
Political violencePolitical Terror Scale,
GPI0.54
ODA to basic social services, million US$
OECD DAC 0.53
Note: High income countries are defined as the top 50% in gross GDP, low income are the bottom 50%.
TABLE 16 NOTABLE CORRELATES OF MILITARISATION IN HIGH INCOME COUNTRIES
Militarised high income countries tend to have less external peace, meaning they are more likely to be involved in conflicts but also tend to be larger net providers of ODA. Attitudes about disarmament are negative in more militarised countries.
KEY CORRELATES OF MILITARISATION As countries become more militarised they also
tend to become less peaceful. They are also more
likely to experience negative changes in other
domains of the GPI, such as societal safety and
security and levels of ongoing domestic and
international conflict. This typically occurs when
countries have low levels of Positive Peace.
Correlating militarisation scores against a variety
of Positive Peace factors and other attitudinal and
survey data found the following:
• High levels of militarisation are significantly correlated with lower external peace and higher levels on the Political Terror Scale, which measures the use of state suppression on its citizens.
• Citizens in high income, highly militarised countries tend to have a stronger disapproval of disarmament movements and a more positive view of the role of the military.
• High income, highly militarised countries tend to be the largest net donors of Official Development Assistance (ODA).
• In lower income countries, two Positive Peace factors, low levels of corruption and equitable distribution of resources are significantly correlated with militarisation. As militarisation increases, corruption increases and resources become more concentrated (i.e., less equally distributed).
Low income countries that divert resources to militarisation are less likely to provide equitable access to health care and education and are more likely to be corrupt.
In high income countries, there is a strong correlation
between the size of annual ODA and militarisation,
indicating that more highly militarised, wealthy
countries also tend to provide the largest amounts of
development assistance. It is important to note the
OECD’s measure of ODA used here does not include
military related assistance. Many high income
militarised states also provide military support to
other governments through defence cooperation
programs and supporting their allies’ security
capabilities. The US is the largest provider of military
assistance and provides US$5.7 billion in military aid
through defence cooperation agreements.55
Additionally, public opinion in wealthy, militarised
countries tends to favour strong national defence
capabilities and the disapproval of disarmament
movements. In these countries the military is
generally highly regarded and the military generally
plays a more significant role in social and cultural life.
37GLOBAL PEACE INDEX 2015 | Results & Findings
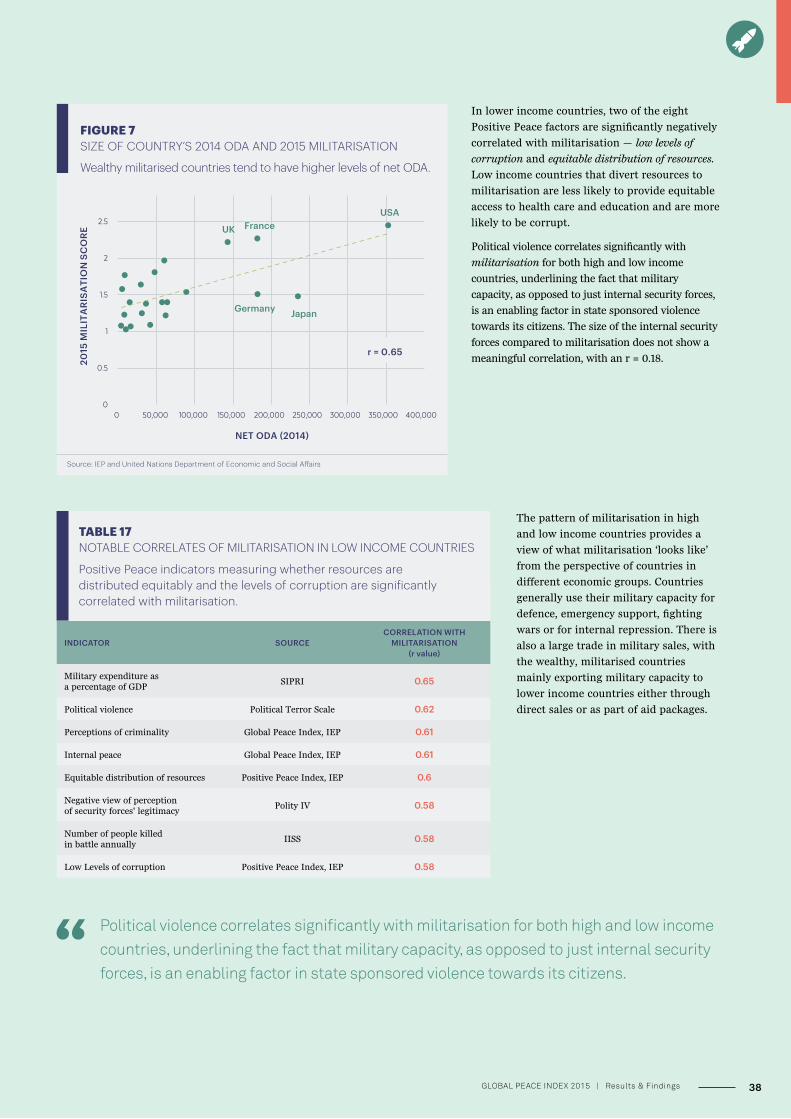
In lower income countries, two of the eight
Positive Peace factors are significantly negatively
correlated with militarisation — low levels of
corruption and equitable distribution of resources.
Low income countries that divert resources to
militarisation are less likely to provide equitable
access to health care and education and are more
likely to be corrupt.
Political violence correlates significantly with
militarisation for both high and low income
countries, underlining the fact that military
capacity, as opposed to just internal security forces,
is an enabling factor in state sponsored violence
towards its citizens. The size of the internal security
forces compared to militarisation does not show a
meaningful correlation, with an r = 0.18.
The pattern of militarisation in high
and low income countries provides a
view of what militarisation ‘looks like’
from the perspective of countries in
different economic groups. Countries
generally use their military capacity for
defence, emergency support, fighting
wars or for internal repression. There is
also a large trade in military sales, with
the wealthy, militarised countries
mainly exporting military capacity to
lower income countries either through
direct sales or as part of aid packages.
INDICATOR SOURCECORRELATION WITH
MILITARISATION (r value)
Military expenditure as a percentage of GDP
SIPRI 0.65
Political violence Political Terror Scale 0.62
Perceptions of criminality Global Peace Index, IEP 0.61
Internal peace Global Peace Index, IEP 0.61
Equitable distribution of resources Positive Peace Index, IEP 0.6
Negative view of perception of security forces' legitimacy
Polity IV 0.58
Number of people killed in battle annually
IISS 0.58
Low Levels of corruption Positive Peace Index, IEP 0.58
TABLE 17 NOTABLE CORRELATES OF MILITARISATION IN LOW INCOME COUNTRIES
Positive Peace indicators measuring whether resources are distributed equitably and the levels of corruption are significantly correlated with militarisation.
Political violence correlates significantly with militarisation for both high and low income countries, underlining the fact that military capacity, as opposed to just internal security forces, is an enabling factor in state sponsored violence towards its citizens.
FIGURE 7 SIZE OF COUNTRY’S 2014 ODA AND 2015 MILITARISATION
Wealthy militarised countries tend to have higher levels of net ODA.
Source: IEP and United Nations Department of Economic and Social A�airs
France
Germany Japan
UK
USA
0
0.5
1
1.5
2
2.5
0 50,000 100,000 150,000 200,000 250,000 300,000 350,000 400,000
2015
MIL
ITA
RIS
ATI
ON
SC
ORE
NET ODA (2014)
r = 0.65
38GLOBAL PEACE INDEX 2015 | Results & Findings
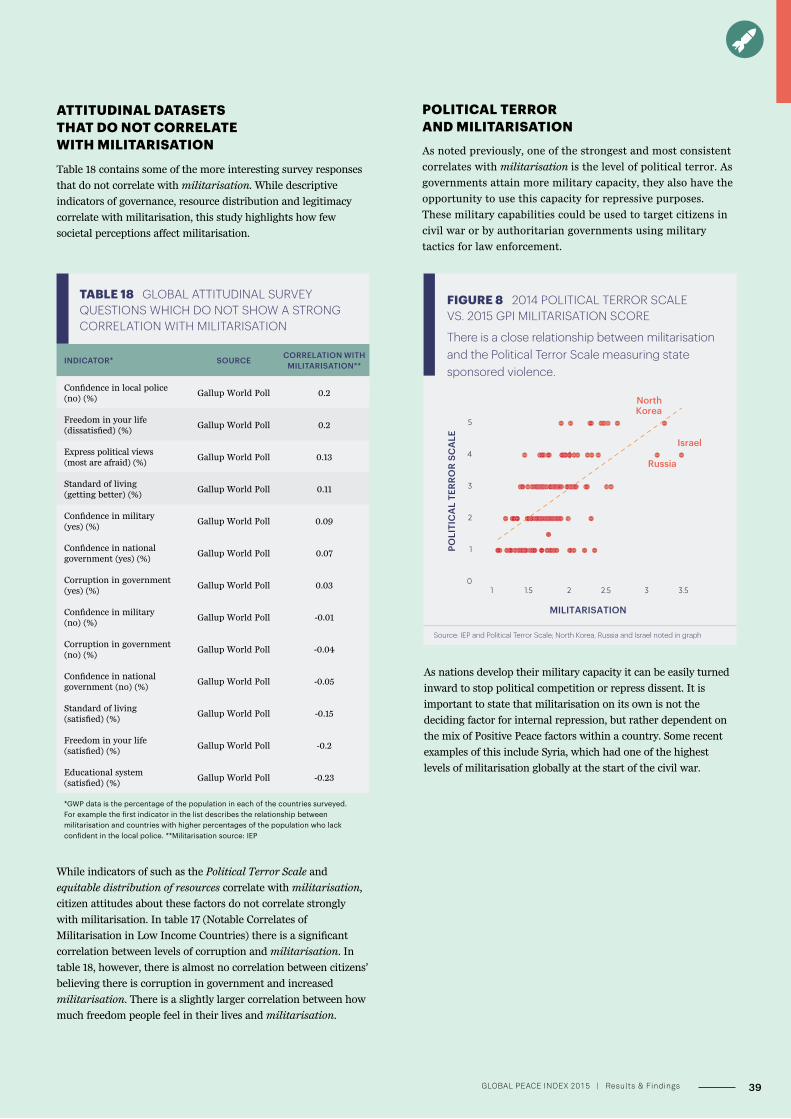
ATTITUDINAL DATASETS THAT DO NOT CORRELATE WITH MILITARISATION
Table 18 contains some of the more interesting survey responses
that do not correlate with militarisation. While descriptive
indicators of governance, resource distribution and legitimacy
correlate with militarisation, this study highlights how few
societal perceptions affect militarisation.
INDICATOR* SOURCE CORRELATION WITH MILITARISATION**
Confidence in local police (no) (%)
Gallup World Poll 0.2
Freedom in your life (dissatisfied) (%)
Gallup World Poll 0.2
Express political views (most are afraid) (%)
Gallup World Poll 0.13
Standard of living (getting better) (%)
Gallup World Poll 0.11
Confidence in military (yes) (%)
Gallup World Poll 0.09
Confidence in national government (yes) (%)
Gallup World Poll 0.07
Corruption in government (yes) (%)
Gallup World Poll 0.03
Confidence in military (no) (%)
Gallup World Poll -0.01
Corruption in government (no) (%)
Gallup World Poll -0.04
Confidence in national government (no) (%)
Gallup World Poll -0.05
Standard of living (satisfied) (%)
Gallup World Poll -0.15
Freedom in your life (satisfied) (%)
Gallup World Poll -0.2
Educational system (satisfied) (%)
Gallup World Poll -0.23
*GWP data is the percentage of the population in each of the countries surveyed. For example the first indicator in the list describes the relationship between militarisation and countries with higher percentages of the population who lack confident in the local police. **Militarisation source: IEP
TABLE 18 GLOBAL ATTITUDINAL SURVEY QUESTIONS WHICH DO NOT SHOW A STRONG CORRELATION WITH MILITARISATION
While indicators of such as the Political Terror Scale and
equitable distribution of resources correlate with militarisation,
citizen attitudes about these factors do not correlate strongly
with militarisation. In table 17 (Notable Correlates of
Militarisation in Low Income Countries) there is a significant
correlation between levels of corruption and militarisation. In
table 18, however, there is almost no correlation between citizens’
believing there is corruption in government and increased
militarisation. There is a slightly larger correlation between how
much freedom people feel in their lives and militarisation.
POLITICAL TERROR AND MILITARISATION
As noted previously, one of the strongest and most consistent
correlates with militarisation is the level of political terror. As
governments attain more military capacity, they also have the
opportunity to use this capacity for repressive purposes.
These military capabilities could be used to target citizens in
civil war or by authoritarian governments using military
tactics for law enforcement.
As nations develop their military capacity it can be easily turned
inward to stop political competition or repress dissent. It is
important to state that militarisation on its own is not the
deciding factor for internal repression, but rather dependent on
the mix of Positive Peace factors within a country. Some recent
examples of this include Syria, which had one of the highest
levels of militarisation globally at the start of the civil war.
FIGURE 8 2014 POLITICAL TERROR SCALE VS. 2015 GPI MILITARISATION SCORE
There is a close relationship between militarisation and the Political Terror Scale measuring state sponsored violence.
Source: IEP and Political Terror Scale; North Korea, Russia and Israel noted in graph
0
1
2
3
4
5
1 1.5 2 2.5 3 3.5
POLI
TIC
AL
TERR
OR
SCA
LE
MILITARISATION
NorthKorea
Russia
Israel
39GLOBAL PEACE INDEX 2015 | Results & Findings
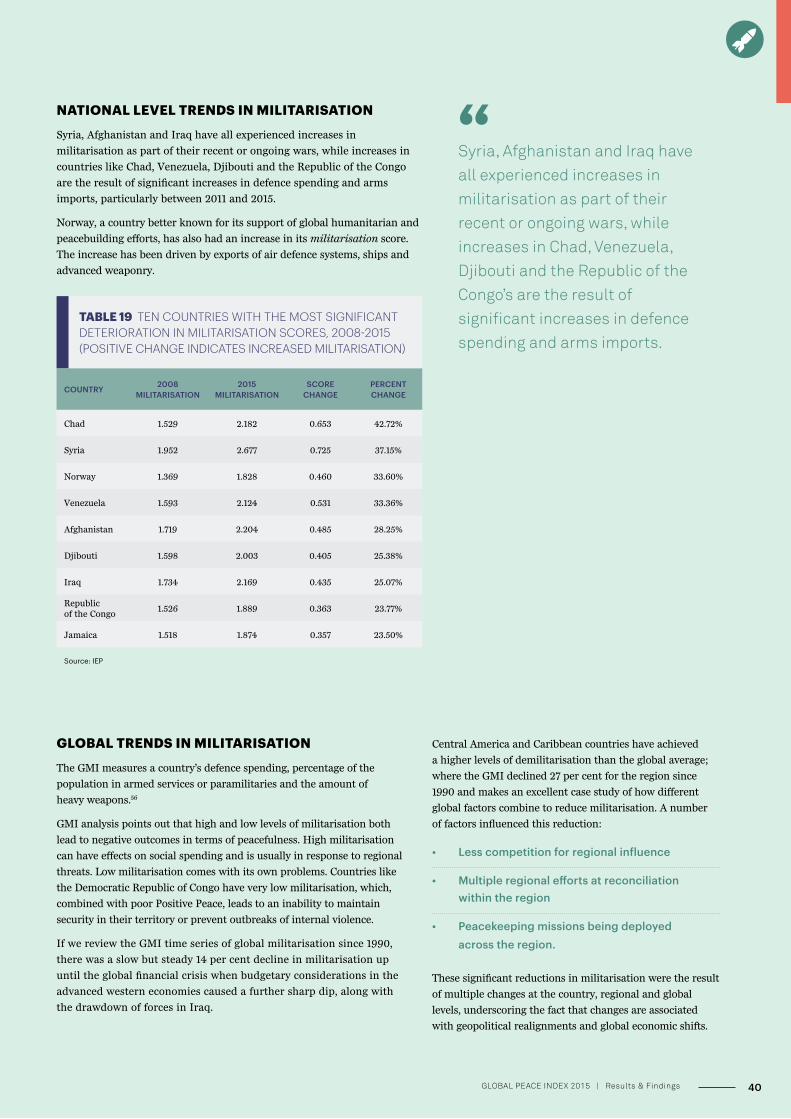
NATIONAL LEVEL TRENDS IN MILITARISATION
Syria, Afghanistan and Iraq have all experienced increases in
militarisation as part of their recent or ongoing wars, while increases in
countries like Chad, Venezuela, Djibouti and the Republic of the Congo
are the result of significant increases in defence spending and arms
imports, particularly between 2011 and 2015.
Norway, a country better known for its support of global humanitarian and
peacebuilding efforts, has also had an increase in its militarisation score.
The increase has been driven by exports of air defence systems, ships and
advanced weaponry.
TABLE 19 TEN COUNTRIES WITH THE MOST SIGNIFICANT DETERIORATION IN MILITARISATION SCORES, 2008-2015 (POSITIVE CHANGE INDICATES INCREASED MILITARISATION)
COUNTRY 2008 MILITARISATION
2015 MILITARISATION
SCORE CHANGE
PERCENT CHANGE
Chad 1.529 2.182 0.653 42.72%
Syria 1.952 2.677 0.725 37.15%
Norway 1.369 1.828 0.460 33.60%
Venezuela 1.593 2.124 0.531 33.36%
Afghanistan 1.719 2.204 0.485 28.25%
Djibouti 1.598 2.003 0.405 25.38%
Iraq 1.734 2.169 0.435 25.07%
Republic of the Congo
1.526 1.889 0.363 23.77%
Jamaica 1.518 1.874 0.357 23.50%
Source: IEP
Syria, Afghanistan and Iraq have all experienced increases in militarisation as part of their recent or ongoing wars, while increases in Chad, Venezuela, Djibouti and the Republic of the Congo’s are the result of significant increases in defence spending and arms imports.
GLOBAL TRENDS IN MILITARISATION
The GMI measures a country’s defence spending, percentage of the
population in armed services or paramilitaries and the amount of
heavy weapons.56
GMI analysis points out that high and low levels of militarisation both
lead to negative outcomes in terms of peacefulness. High militarisation
can have effects on social spending and is usually in response to regional
threats. Low militarisation comes with its own problems. Countries like
the Democratic Republic of Congo have very low militarisation, which,
combined with poor Positive Peace, leads to an inability to maintain
security in their territory or prevent outbreaks of internal violence.
If we review the GMI time series of global militarisation since 1990,
there was a slow but steady 14 per cent decline in militarisation up
until the global financial crisis when budgetary considerations in the
advanced western economies caused a further sharp dip, along with
the drawdown of forces in Iraq.
Central America and Caribbean countries have achieved
a higher levels of demilitarisation than the global average;
where the GMI declined 27 per cent for the region since
1990 and makes an excellent case study of how different
global factors combine to reduce militarisation. A number
of factors influenced this reduction:
• Less competition for regional influence
• Multiple regional efforts at reconciliation within the region
• Peacekeeping missions being deployed across the region.
These significant reductions in militarisation were the result
of multiple changes at the country, regional and global
levels, underscoring the fact that changes are associated
with geopolitical realignments and global economic shifts.
40GLOBAL PEACE INDEX 2015 | Results & Findings
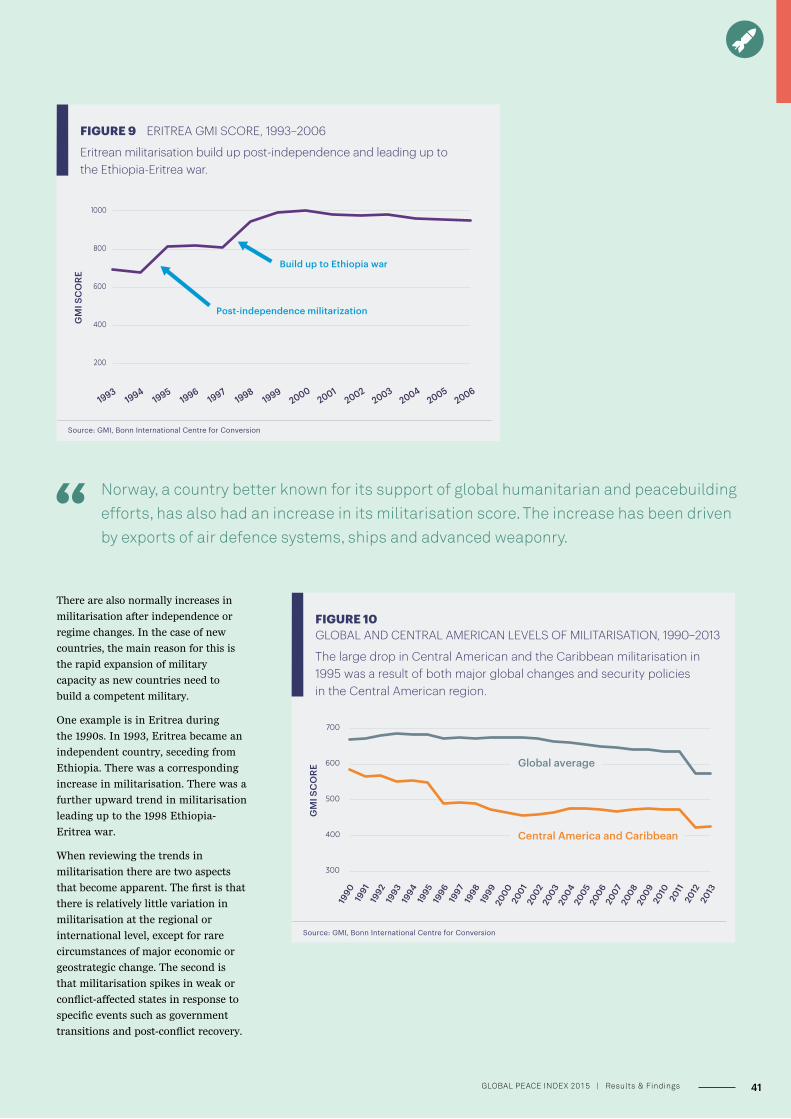
FIGURE 9 ERITREA GMI SCORE, 1993–2006
Eritrean militarisation build up post-independence and leading up to the Ethiopia-Eritrea war.
Source: GMI, Bonn International Centre for Conversion
200
400
600
800
1000
19931994
19951996
19971998
19992000
20012002
20032004
20052006
GM
I SC
ORE
Post-independence militarization
Build up to Ethiopia war
FIGURE 10 GLOBAL AND CENTRAL AMERICAN LEVELS OF MILITARISATION, 1990–2013
The large drop in Central American and the Caribbean militarisation in 1995 was a result of both major global changes and security policies in the Central American region.
Source: GMI, Bonn International Centre for Conversion
GM
I SC
ORE
Global average
Central America and Caribbean
300
400
500
600
700
1990
1991
1992
1993
1994
1995
1996
1997
1998
1999
2000
2001
2002
2003
2004
2005
2006
2007
2008
2009
2010
2011
2012
2013
There are also normally increases in
militarisation after independence or
regime changes. In the case of new
countries, the main reason for this is
the rapid expansion of military
capacity as new countries need to
build a competent military.
One example is in Eritrea during
the 1990s. In 1993, Eritrea became an
independent country, seceding from
Ethiopia. There was a corresponding
increase in militarisation. There was a
further upward trend in militarisation
leading up to the 1998 Ethiopia-
Eritrea war.
When reviewing the trends in
militarisation there are two aspects
that become apparent. The first is that
there is relatively little variation in
militarisation at the regional or
international level, except for rare
circumstances of major economic or
geostrategic change. The second is
that militarisation spikes in weak or
conflict-affected states in response to
specific events such as government
transitions and post-conflict recovery.
Norway, a country better known for its support of global humanitarian and peacebuilding efforts, has also had an increase in its militarisation score. The increase has been driven by exports of air defence systems, ships and advanced weaponry.
41GLOBAL PEACE INDEX 2015 | Results & Findings
TRENDS IN PEACE
43GLOBAL PEACE INDEX 2015
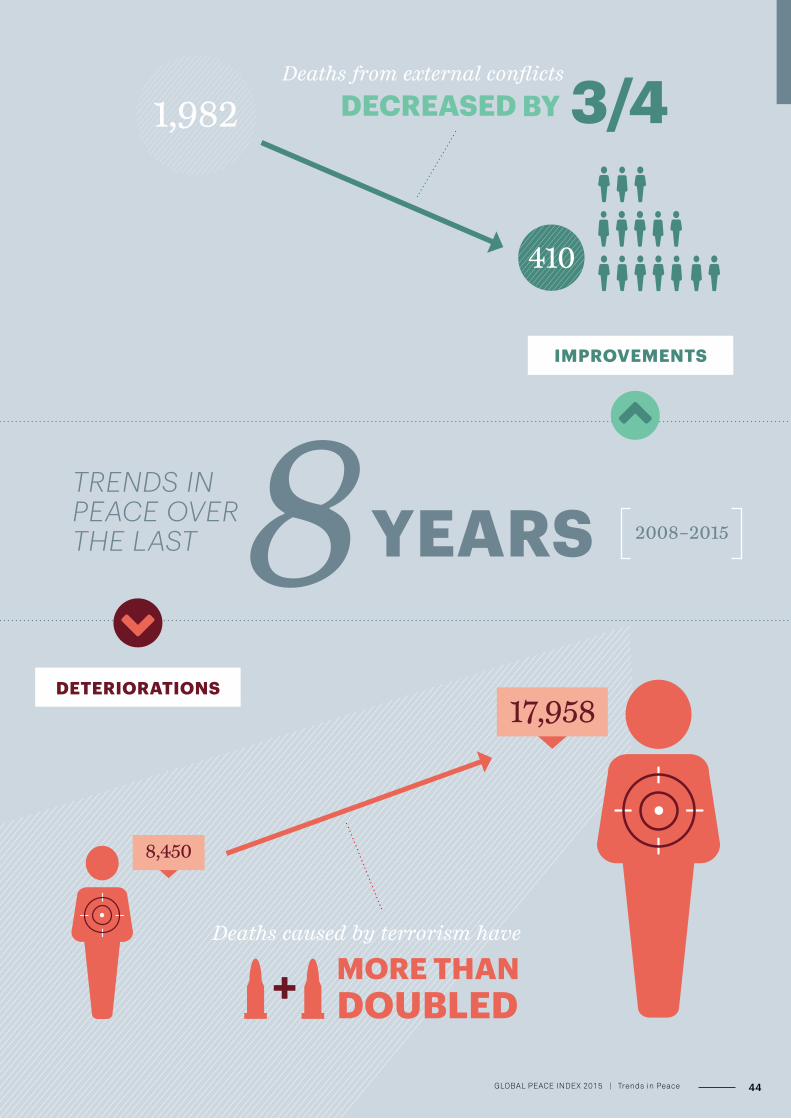
Deaths from external conflicts
DETERIORATIONS
IMPROVEMENTS
Deaths caused by terrorism have
44GLOBAL PEACE INDEX 2015 | Trends in Peace
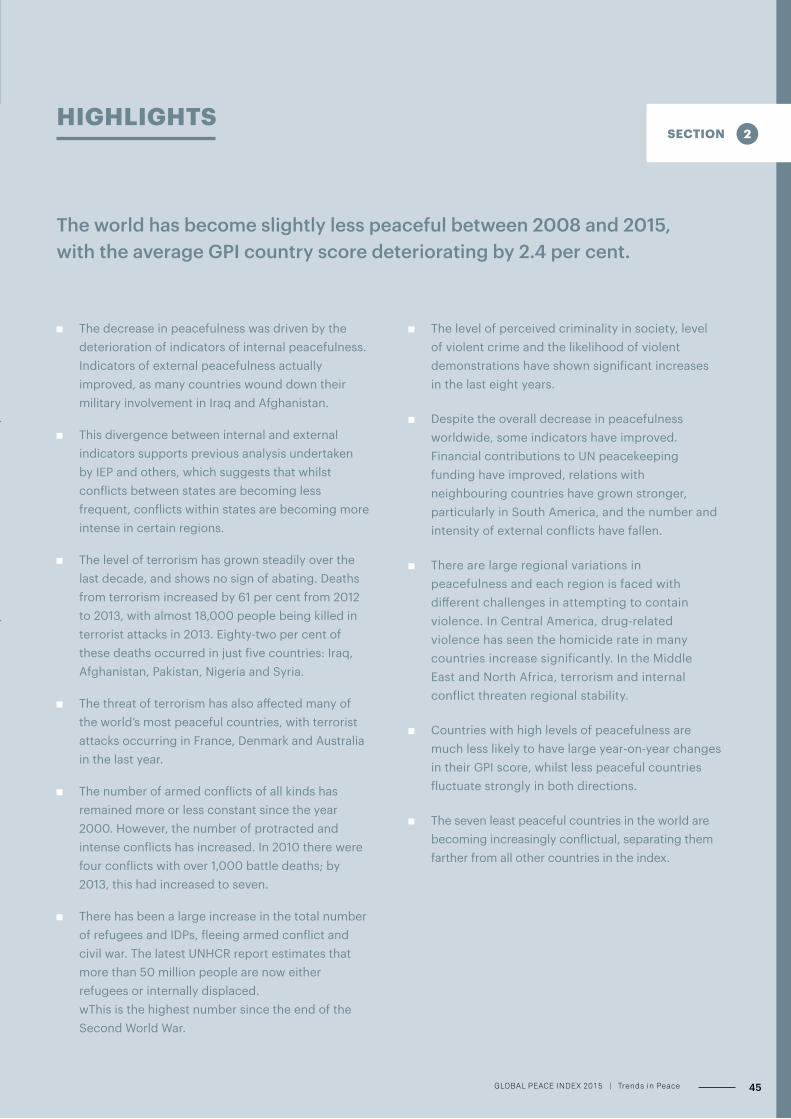
HIGHLIGHTS
The decrease in peacefulness was driven by the deterioration of indicators of internal peacefulness. Indicators of external peacefulness actually improved, as many countries wound down their military involvement in Iraq and Afghanistan.
This divergence between internal and external indicators supports previous analysis undertaken by IEP and others, which suggests that whilst conflicts between states are becoming less frequent, conflicts within states are becoming more intense in certain regions.
The level of terrorism has grown steadily over the last decade, and shows no sign of abating. Deaths from terrorism increased by 61 per cent from 2012 to 2013, with almost 18,000 people being killed in terrorist attacks in 2013. Eighty-two per cent of these deaths occurred in just five countries: Iraq, Afghanistan, Pakistan, Nigeria and Syria.
The threat of terrorism has also affected many of the world’s most peaceful countries, with terrorist attacks occurring in France, Denmark and Australia in the last year.
The number of armed conflicts of all kinds has remained more or less constant since the year 2000. However, the number of protracted and intense conflicts has increased. In 2010 there were four conflicts with over 1,000 battle deaths; by 2013, this had increased to seven.
There has been a large increase in the total number of refugees and IDPs, fleeing armed conflict and civil war. The latest UNHCR report estimates that more than 50 million people are now either refugees or internally displaced. wThis is the highest number since the end of the Second World War.
The world has become slightly less peaceful between 2008 and 2015, with the average GPI country score deteriorating by 2.4 per cent.
The level of perceived criminality in society, level of violent crime and the likelihood of violent demonstrations have shown significant increases in the last eight years.
Despite the overall decrease in peacefulness worldwide, some indicators have improved. Financial contributions to UN peacekeeping funding have improved, relations with neighbouring countries have grown stronger, particularly in South America, and the number and intensity of external conflicts have fallen.
There are large regional variations in peacefulness and each region is faced with different challenges in attempting to contain violence. In Central America, drug-related violence has seen the homicide rate in many countries increase significantly. In the Middle East and North Africa, terrorism and internal conflict threaten regional stability.
Countries with high levels of peacefulness are much less likely to have large year-on-year changes in their GPI score, whilst less peaceful countries fluctuate strongly in both directions.
The seven least peaceful countries in the world are becoming increasingly conflictual, separating them farther from all other countries in the index.
45GLOBAL PEACE INDEX 2015 | Trends in Peace
EIGHT-YEAR TRENDS
The world has become slightly less peaceful.
The world has become slightly less peaceful over the last eight
years, deteriorating by 2.4 per cent. However, this decrease in
peacefulness has not been evenly spread, with 76 countries
improving while 86 deteriorated. MENA has suffered the
largest decline of any region in the world, deteriorating 11 per
cent in eight years. This decrease in peacefulness reverses a
long-term trend dating back to the Second World War which
had seen steady increases in peace, especially after the end of
the Cold War.
Violence and violent conflict have been ever-present over the
past eight years. Conflict in Iraq and Syria has led to the rise of
ISIL and a massive increase in the number of refugees and
internally displaced people. Violence has also been prominent
in other regions around the world, with terrorism and civil
unrest coming to the fore in Nigeria, as well as an increase in
violence and death related to drug trafficking in Central
America where the average homicide rate doubled from the
2008 to 2015 GPI. Additionally, the violent crime indicator is
higher in Central America than in any other region.
The number and intensity of these high-profile conflicts and
atrocities has had a detrimental impact on peace but hides a
subtle and gradual trend of increased peacefulness in many
countries and regions. 76 countries became more peaceful,
along with four of the nine GPI regions: Europe, North
America, Asia-Pacific and Russia & Eurasia.
On average, a number of indicators improved over the period:
• Military expenditure as a percentage of GDP
• Number, duration and role in external conflicts
• Number of deaths from organised conflict (external)
• Political Terror Scale
• Financial contributions to UN peacekeeping missions
The long term trend in peacefulness is also positive. Over the
last sixty years, the world has become more peaceful. There has
been a marked and consistent downturn in levels of violence
and conflict since the end of the Second World War. Conflict
and war, particularly colonial and interstate conflicts, have
decreased consistently, as has the number of people killed in
conflicts. In the last 30 years developed countries have
experienced large decreases in homicide, assault, and robbery.
If the peace analysis is extended by centuries or even millennia,
the trend becomes even stronger. Many forms of violence and
conflict, from interpersonal direct confrontation, to homicide,
to war, to public attitudes towards the acceptability of violence,
have decreased since the beginning of recorded history.57
This mismatch between the long-term historical data and
recent short-term trends shows that peace has not improved in
a linear manner; sometimes going down and sometimes
improving. This lends confidence to humanity’s ability to
reverse the short-term trend and the long-term prospects for a
more peaceful world.
Figure 11 illustrates the GPI trend from 2008 by averaging the
scores of the 162 GPI countries for each year from 2008 to 2015.
This shows that there has been a deterioration in the average
country’s score since 2008, with a 2.4 per cent increase in GPI
score over the last eight years. Seventy-six countries saw
improvements in their GPI scores over this time period, with
86 registering deteriorations in peacefulness. The largest
average decrease in peacefulness occurred between 2008 and
2010, with every indicator except for four becoming less
peaceful. Subsequent years have had either small deteriorations
or very small improvements in peacefulness. Whilst the change
in the overall score does not seem to be very significant or
revealing, when disaggregated into its internal and external
components a clearer trend emerges.
46GLOBAL PEACE INDEX 2015 | Trends in Peace
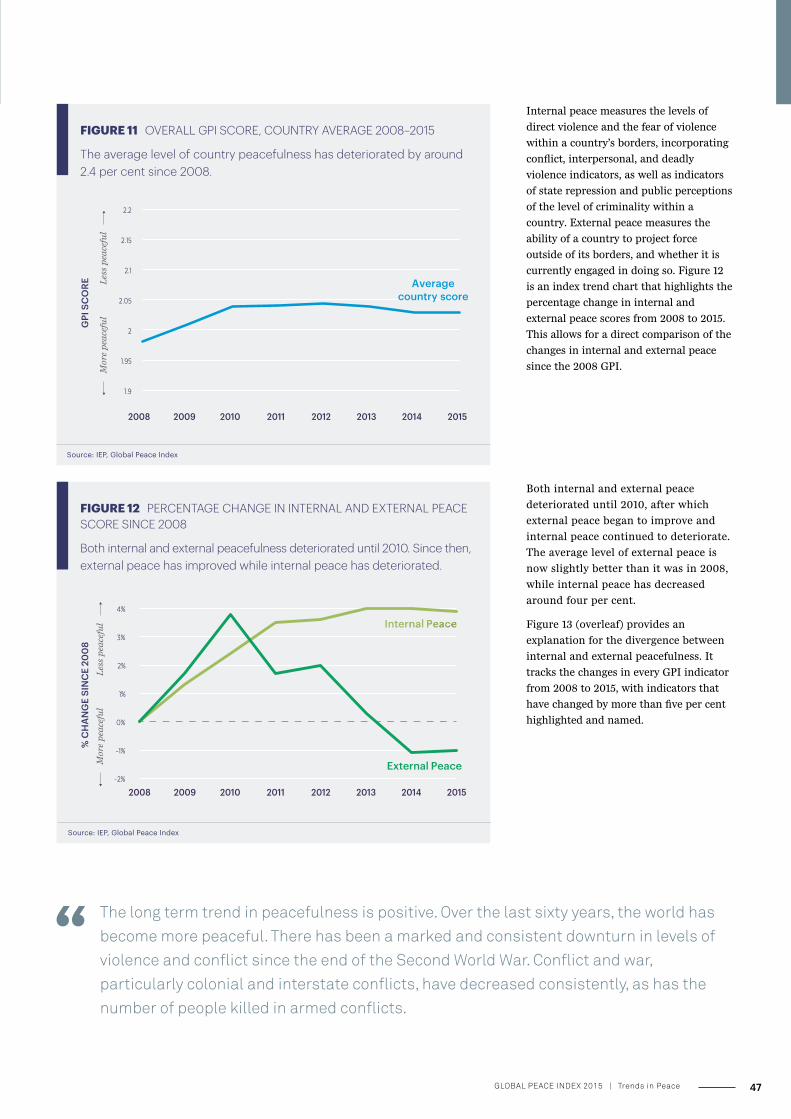
Internal peace measures the levels of
direct violence and the fear of violence
within a country’s borders, incorporating
conflict, interpersonal, and deadly
violence indicators, as well as indicators
of state repression and public perceptions
of the level of criminality within a
country. External peace measures the
ability of a country to project force
outside of its borders, and whether it is
currently engaged in doing so. Figure 12
is an index trend chart that highlights the
percentage change in internal and
external peace scores from 2008 to 2015.
This allows for a direct comparison of the
changes in internal and external peace
since the 2008 GPI.
FIGURE 11 OVERALL GPI SCORE, COUNTRY AVERAGE 2008–2015
The average level of country peacefulness has deteriorated by around 2.4 per cent since 2008.
Source: IEP, Global Peace Index
Average country score
1.9
1.95
2
2.05
2.1
2.15
2.2
2008 2009 2010 2011 2012 2013 2014 2015
GPI
SC
ORE L
ess
pea
cefu
lM
ore
pea
cefu
l
FIGURE 12 PERCENTAGE CHANGE IN INTERNAL AND EXTERNAL PEACE SCORE SINCE 2008
Both internal and external peacefulness deteriorated until 2010. Since then, external peace has improved while internal peace has deteriorated.
% C
HA
NG
E SI
NC
E 20
08
Les
s p
eace
ful
Mor
e p
eace
ful
Internal Peace
External Peace-2%
-1%
0%
1%
2%
3%
4%
2008 2009 2010 2011 2012 2013 2014 2015
Source: IEP, Global Peace Index
Both internal and external peace
deteriorated until 2010, after which
external peace began to improve and
internal peace continued to deteriorate.
The average level of external peace is
now slightly better than it was in 2008,
while internal peace has decreased
around four per cent.
Figure 13 (overleaf) provides an
explanation for the divergence between
internal and external peacefulness. It
tracks the changes in every GPI indicator
from 2008 to 2015, with indicators that
have changed by more than five per cent
highlighted and named.
The long term trend in peacefulness is positive. Over the last sixty years, the world has become more peaceful. There has been a marked and consistent downturn in levels of violence and conflict since the end of the Second World War. Conflict and war, particularly colonial and interstate conflicts, have decreased consistently, as has the number of people killed in armed conflicts.
47GLOBAL PEACE INDEX 2015 | Trends in Peace
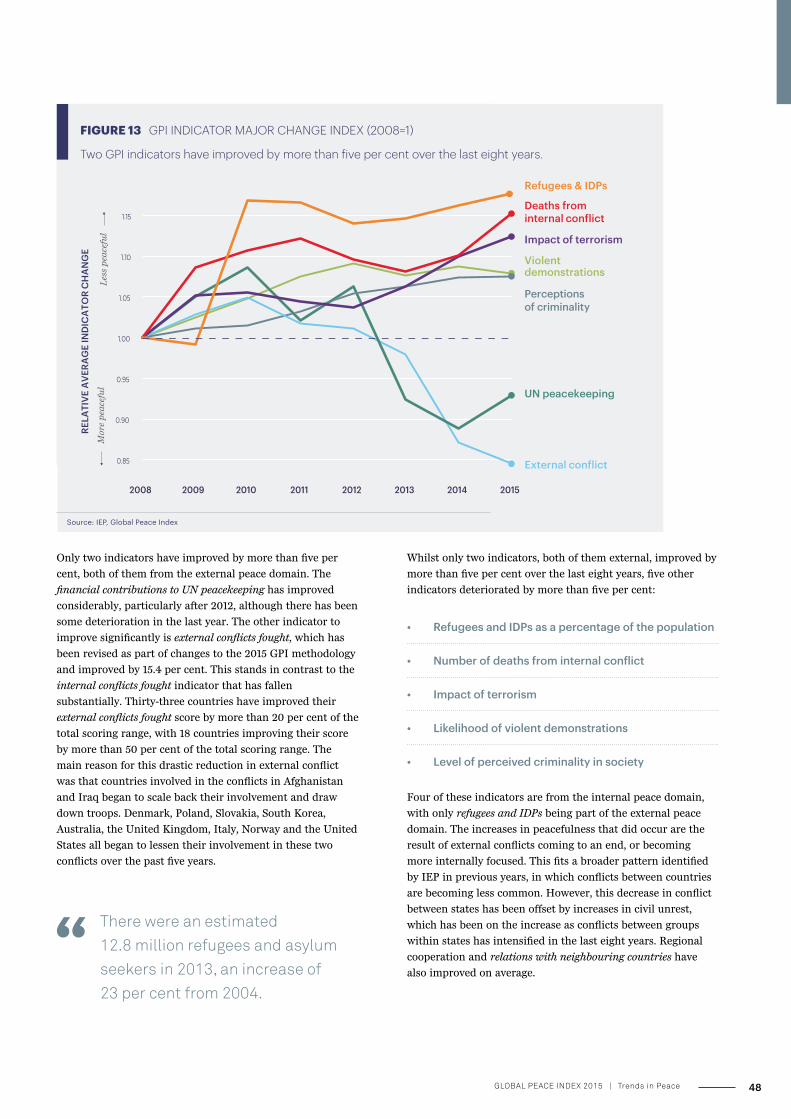
Only two indicators have improved by more than five per
cent, both of them from the external peace domain. The
financial contributions to UN peacekeeping has improved
considerably, particularly after 2012, although there has been
some deterioration in the last year. The other indicator to
improve significantly is external conflicts fought, which has
been revised as part of changes to the 2015 GPI methodology
and improved by 15.4 per cent. This stands in contrast to the
internal conflicts fought indicator that has fallen
substantially. Thirty-three countries have improved their
external conflicts fought score by more than 20 per cent of the
total scoring range, with 18 countries improving their score
by more than 50 per cent of the total scoring range. The
main reason for this drastic reduction in external conflict
was that countries involved in the conflicts in Afghanistan
and Iraq began to scale back their involvement and draw
down troops. Denmark, Poland, Slovakia, South Korea,
Australia, the United Kingdom, Italy, Norway and the United
States all began to lessen their involvement in these two
conflicts over the past five years.
Violent demonstrations
Perceptions of criminality
External conflict
UN peacekeeping
Impact of terrorism
Deaths from internal conflict
Refugees & IDPs
0.85
0.90
0.95
1.00
1.05
1.10
1.15
2008 2009 2010 2011 2012 2013 2014 2015
RELA
TIV
E A
VER
AG
E IN
DIC
ATO
R C
HA
NG
E
FIGURE 13 GPI INDICATOR MAJOR CHANGE INDEX (2008=1)
Two GPI indicators have improved by more than five per cent over the last eight years.
Les
s p
eace
ful
Mor
e p
eace
ful
Source: IEP, Global Peace Index
Whilst only two indicators, both of them external, improved by
more than five per cent over the last eight years, five other
indicators deteriorated by more than five per cent:
• Refugees and IDPs as a percentage of the population
• Number of deaths from internal conflict
• Impact of terrorism
• Likelihood of violent demonstrations
• Level of perceived criminality in society
Four of these indicators are from the internal peace domain,
with only refugees and IDPs being part of the external peace
domain. The increases in peacefulness that did occur are the
result of external conflicts coming to an end, or becoming
more internally focused. This fits a broader pattern identified
by IEP in previous years, in which conflicts between countries
are becoming less common. However, this decrease in conflict
between states has been offset by increases in civil unrest,
which has been on the increase as conflicts between groups
within states has intensified in the last eight years. Regional
cooperation and relations with neighbouring countries have
also improved on average.
There were an estimated 12.8 million refugees and asylum seekers in 2013, an increase of 23 per cent from 2004.
48GLOBAL PEACE INDEX 2015 | Trends in Peace
INDICATOR TRENDS
The average level of global peacefulness has decreased over the last eight years but this decline in peacefulness has not been evenly distributed across countries and regions. The increase in violence has also been confined to a subset of GPI indicators, while the majority have remained fairly stable over the past eight years. The large deteriorations were concentrated in a small number of countries, and almost as many countries improved as deteriorated, with 76 countries becoming more peaceful and 86 countries becoming less peaceful.
TERRORISM
The following analysis looks at changes in the level of violence over the last decade for four of the indicators which have deteriorated the most since 2008: terrorism impact, refugees and IDPs, internal conflicts fought and homicide rate.
There has been a surge in deaths from terrorism over the past
decade. After the end of the Cold War and various peace
processes led to the waning of ideological and nationalist
terrorism, the start of the 21st century saw a sharp increase in
terrorism by religious groups, often in the context of ongoing
conflict. Figure 13 highlights the number of deaths from
terrorism each year over the period 1998 to 2013.
The increase in deaths from terrorism has been particularly
noticeable over the past three years, increasing by 61 per cent
between 2012 and 2013 alone. Although a comprehensive
dataset of 2014 terrorism deaths is not yet available,
modelling conducted by IEP suggests that this trend will
continue. The majority of deaths from terrorism have
occurred in countries suffering from protracted civil conflict
or war, with 82 per cent of deaths from terrorism in 2013
occurring in just five countries: Iraq, Afghanistan, Pakistan,
Nigeria and Syria. However, the impact of terrorism has been
felt in an increasing number of countries across the globe,
with the number of countries experiencing more than 50
deaths from terrorism in a year rising from 15 in 2012 to 24 in
2013. A total of 60 countries recorded at least one death from
terrorism in 2013.
A handful of terrorist organisations are responsible for the
majority of deaths. The Taliban, ISIL, Boko Haram and al-Qa’ida
and its affiliates were responsible for 63 per cent of all deaths
from terrorism in 2013. All four groups have remained active in
2014 and 2015. The most notable recent incident took place in
Nigeria in January 2015, when Boko Haram reportedly massacred
as many as 2,000 civilians. Although the boundary between a
terrorist group and an armed insurgency is not always clear, the
dataset does distinguish all four groups are responsible for a
large number of conflict-related deaths as well.
Whilst the majority of deaths from terrorism have occurred in
the developing world, particularly in the Middle East, North
Africa, and the northernmost parts of sub-Saharan Africa,
there have been a number of deaths from terrorism in OECD
countries. Five per cent of deaths from terrorism occurred in
OECD countries in 2013, mainly Turkey and Mexico. There
have been a number of high-profile terrorist attacks in
Western Europe in 2014 and 2015. In January 2015, two
terrorists who identified themselves as part of al-Qa’ida in the
Arabian Peninsula shot and killed 11 staff of the satirical
newspaper Charlie Hebdo, and in February 2015 two
shootings resulted in three people being killed and five
injured in Denmark. Concerns have also been raised about
the number of foreign recruits that terrorist groups have been
able to attract from European countries, with estimates from
national government agencies suggesting that over 1,800
Europeans had joined ISIL, including 700 from France and
400 from the United Kingdom.
49GLOBAL PEACE INDEX 2015 | Trends in Peace
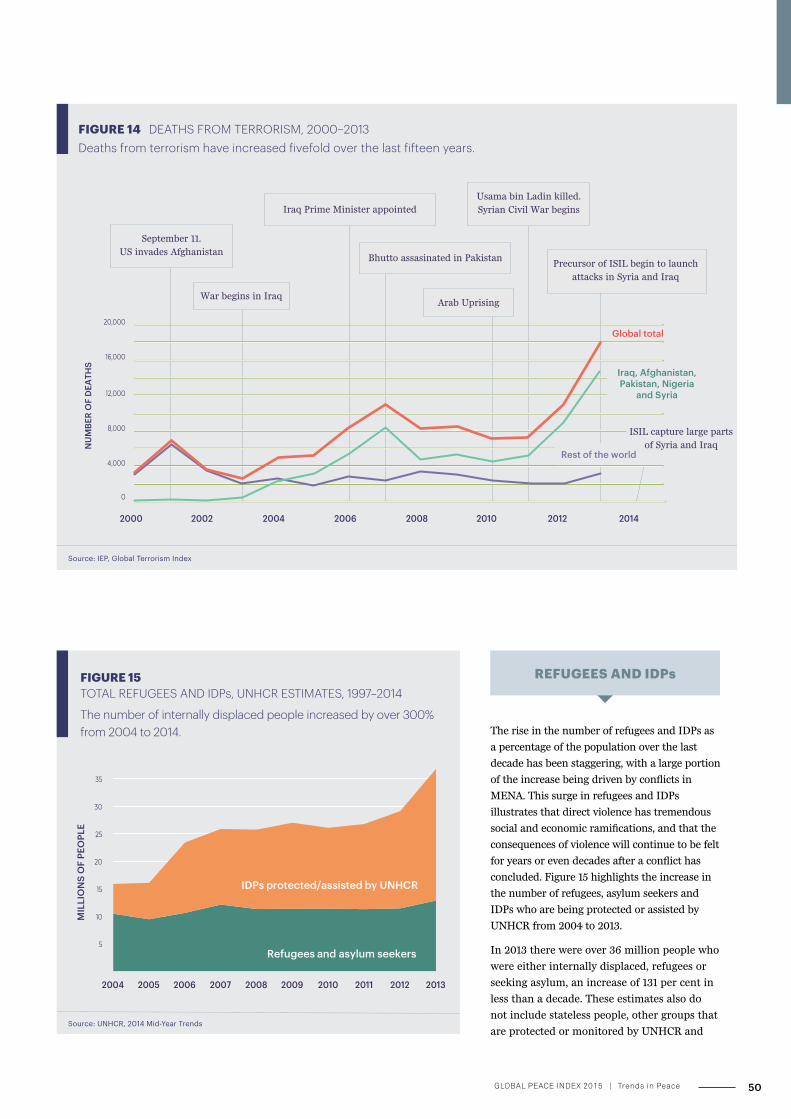
FIGURE 14 DEATHS FROM TERRORISM, 2000–2013Deaths from terrorism have increased fivefold over the last fifteen years.
Source: IEP, Global Terrorism Index
20,000
16,000
12,000
4,000
8,000
0
NU
MBE
R O
F D
EATH
S
Rest of the world
2000 2002 2004 2006 2008 2010 2012 2014
ISIL capture large parts
of Syria and Iraq
Global total
Iraq, Afghanistan, Pakistan, Nigeria
and Syria
September 11.
US invades Afghanistan
Iraq Prime Minister appointed
War begins in IraqArab Uprising
Bhutto assasinated in Pakistan
Usama bin Ladin killed.
Syrian Civil War begins
Precursor of ISIL begin to launch
attacks in Syria and Iraq
The rise in the number of refugees and IDPs as
a percentage of the population over the last
decade has been staggering, with a large portion
of the increase being driven by conflicts in
MENA. This surge in refugees and IDPs
illustrates that direct violence has tremendous
social and economic ramifications, and that the
consequences of violence will continue to be felt
for years or even decades after a conflict has
concluded. Figure 15 highlights the increase in
the number of refugees, asylum seekers and
IDPs who are being protected or assisted by
UNHCR from 2004 to 2013.
In 2013 there were over 36 million people who
were either internally displaced, refugees or
seeking asylum, an increase of 131 per cent in
less than a decade. These estimates also do
not include stateless people, other groups that
are protected or monitored by UNHCR and
REFUGEES AND IDPs
5
10
15
20
25
30
35
2004 2005 2006 2007 2008 2009 2010 2011 2012 2013
MIL
LIO
NS
OF
PEO
PLE
IDPs protected/assisted by UNHCR
FIGURE 15 TOTAL REFUGEES AND IDPs, UNHCR ESTIMATES, 1997–2014
The number of internally displaced people increased by over 300% from 2004 to 2014.
Refugees and asylum seekers
Source: UNHCR, 2014 Mid-Year Trends
50GLOBAL PEACE INDEX 2015 | Trends in Peace
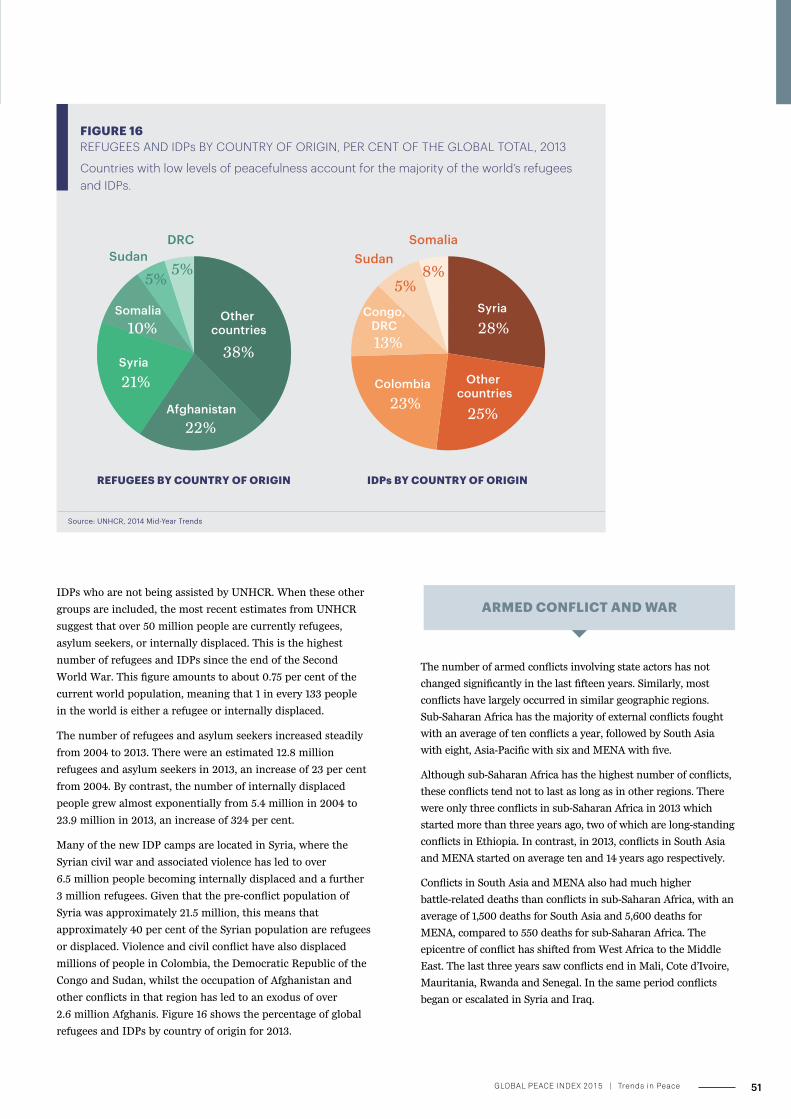
IDPs who are not being assisted by UNHCR. When these other
groups are included, the most recent estimates from UNHCR
suggest that over 50 million people are currently refugees,
asylum seekers, or internally displaced. This is the highest
number of refugees and IDPs since the end of the Second
World War. This figure amounts to about 0.75 per cent of the
current world population, meaning that 1 in every 133 people
in the world is either a refugee or internally displaced.
The number of refugees and asylum seekers increased steadily
from 2004 to 2013. There were an estimated 12.8 million
refugees and asylum seekers in 2013, an increase of 23 per cent
from 2004. By contrast, the number of internally displaced
people grew almost exponentially from 5.4 million in 2004 to
23.9 million in 2013, an increase of 324 per cent.
Many of the new IDP camps are located in Syria, where the
Syrian civil war and associated violence has led to over
6.5 million people becoming internally displaced and a further
3 million refugees. Given that the pre-conflict population of
Syria was approximately 21.5 million, this means that
approximately 40 per cent of the Syrian population are refugees
or displaced. Violence and civil conflict have also displaced
millions of people in Colombia, the Democratic Republic of the
Congo and Sudan, whilst the occupation of Afghanistan and
other conflicts in that region has led to an exodus of over
2.6 million Afghanis. Figure 16 shows the percentage of global
refugees and IDPs by country of origin for 2013.
FIGURE 16 REFUGEES AND IDPs BY COUNTRY OF ORIGIN, PER CENT OF THE GLOBAL TOTAL, 2013
Countries with low levels of peacefulness account for the majority of the world’s refugees and IDPs.
Source: UNHCR, 2014 Mid-Year Trends
IDPs BY COUNTRY OF ORIGINREFUGEES BY COUNTRY OF ORIGIN
Other countries
38%
Afghanistan22%
21%
10%Somalia
SudanDRC
5%5%
25%
Other countries
28%
25%
Congo, DRC
Sudan
5%
13%
23%
8%
Syria
Colombia
Somalia
Syria
ARMED CONFLICT AND WAR
The number of armed conflicts involving state actors has not
changed significantly in the last fifteen years. Similarly, most
conflicts have largely occurred in similar geographic regions.
Sub-Saharan Africa has the majority of external conflicts fought
with an average of ten conflicts a year, followed by South Asia
with eight, Asia-Pacific with six and MENA with five.
Although sub-Saharan Africa has the highest number of conflicts,
these conflicts tend not to last as long as in other regions. There
were only three conflicts in sub-Saharan Africa in 2013 which
started more than three years ago, two of which are long-standing
conflicts in Ethiopia. In contrast, in 2013, conflicts in South Asia
and MENA started on average ten and 14 years ago respectively.
Conflicts in South Asia and MENA also had much higher
battle-related deaths than conflicts in sub-Saharan Africa, with an
average of 1,500 deaths for South Asia and 5,600 deaths for
MENA, compared to 550 deaths for sub-Saharan Africa. The
epicentre of conflict has shifted from West Africa to the Middle
East. The last three years saw conflicts end in Mali, Cote d’Ivoire,
Mauritania, Rwanda and Senegal. In the same period conflicts
began or escalated in Syria and Iraq.
51GLOBAL PEACE INDEX 2015 | Trends in Peace

FIGURE 17 NUMBER OF CONFLICTS BY YEAR AND REGION, 1999–2013
The majority of armed conflicts occurred in sub-Saharan Africa, South Asia, Asia-Pacific and MENA.
14 13 14 139 8
58 10 11 11
811 10 11
10 11 97
109
8
10 89 9
65 6 6
4 6 6
5 55
8
6 66 6
5
74
7
44 4
3 44 5
6 55 6
6
9
7
5
7 5 5
4 4 7 6
4 66 5
6
5
54
1999 2000 2001 2002 2003 2004 2005 2006 2007 2008 2009 2010 2011 2012 2013
Sub-SaharanAfrica
South Asia
Asia-Pacific
MENA
Other
39 39 38
32 32 33 3234 35
37 37
31
37
32 33
Source: UCDP Note: Only includes conflicts with two actors that have over 25 battle deaths in the calendar year.
Totals
Although sub-Saharan Africa has the highest number of conflicts, these conflicts tend not to last as long as in other regions.
In 2013, the number of conflicts
including state and non-state
actors increased to the highest
levels since 2004. This was largely
due to the recent rise in the
number of non-state conflicts,
which stands at 48 and is the
highest in fifteen years. Non-state
conflicts are conflicts with at least
25 battle-related deaths in a year
involving two organised armed
groups, neither of which is a
government of a state.
Whilst the number of civil wars
has decreased by 30 per cent in
fifteen years, the number of
conflicts which started as civil
disputes but then involved
regional and international powers
has increased. These conflicts are
known as internationalized
internal conflicts and, in 2013,
included conflicts with
international involvement in
Afghanistan, Mali and Somalia as
well as Syria, Libya and Iraq.
Non-state conflicts also surged in
2013, with the biggest increases
occurring in Nigeria, Sudan and
Syria. These countries had 22
non-state conflicts, up from nine
in 2012. In Nigeria there have
been conflicts between smaller,
largely ethnic-based groups,
including the conflict between the
Islamist terrorist group Boko
Haram and the Civilian Joint
Task Force, which is a vigilante
group formed in northern Nigeria
to protect towns. Non-state
conflicts also intensified in Sudan
with skirmishes between
tribesmen, farmers and ethnic
clans. The rise in Syria reflects the
increasing number of militias in
the Syrian civil war.
One-sided conflicts have remained
lower than the high seen earlier
in the twenty-first century.
One-sided conflicts are where
high levels of violence are directed
by a government towards the
people they govern. These peaked
in 2002 and have remained under
30 per year since 2007.
Armed conflicts are conflicts which results in at least 25 battle-related deaths in a year.
Internal armed conflicts, also known as civil wars, are armed conflicts between the government of a state and one or more internal opposition groups.
Internationalized internal armed conflicts are internal armed conflicts which have interventions from other states on one or both sides of the conflict. An example of an internationalized internal armed conflict has been the conflict between the government of Afghanistan, with support from other state actors, including NATO partners up until 28 December 2014, against the Afghani Taliban.
Non-state conflicts are conflicts with at least 25 battle-related deaths in a year
involving two organised armed groups, neither of which is a government. In 2013, this included the conflict between ISIL and the Free Syrian Army as well as other conflicts within the Syrian civil war that do not include state actors.
One-sided conflicts are violence used by a state or non-state actor against civilians which result in at least 25 deaths. It does not include extrajudicial killings which, among other things, are measured in the Political Terror indicator for the GPI. In 2013, ISIL was the most deadly group for one-sided conflicts, killing over 2,000 civilians.
Interstate conflicts are conflicts between two different states. The number of interstate conflicts has fallen since the Cold War; in seven out of the last 15 years there were no interstate conflicts.
BOX 2 TYPES OF CONFLICT
52GLOBAL PEACE INDEX 2015 | Trends in Peace
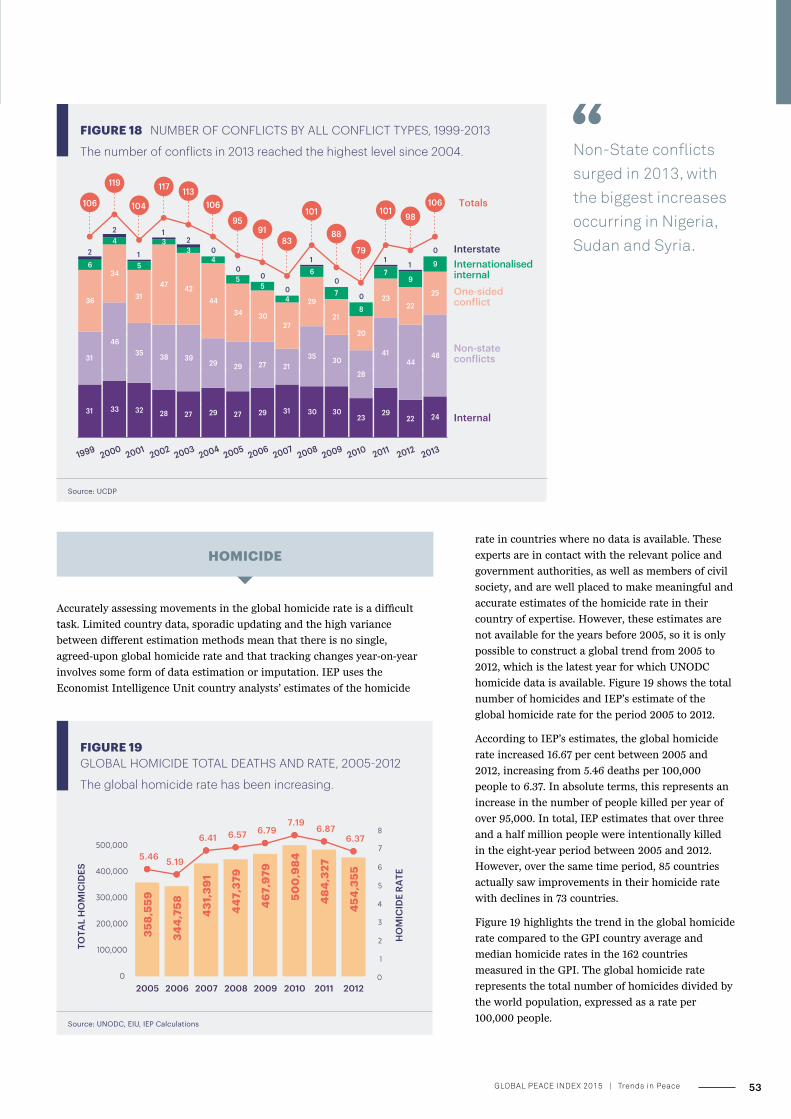
Totals
FIGURE 18 NUMBER OF CONFLICTS BY ALL CONFLICT TYPES, 1999-2013
The number of conflicts in 2013 reached the highest level since 2004.
Source: UCDP
31 33 32 28 27 29 27 29 31 30 3023
2922 24
31
4635 38 39
29 29 27 2135 30
28
4144
48
36
34
3147 42
4434 30
27
29
21
20
2322
25
6
4
5
33
4
55
4
6
7
8
79
92
2
1
12
0
00
0
1
0
0
11
0
106
119
104
117 113106
9591
83
101
88
79
10198
106
Internal
Non-stateconflicts
One-sidedconflict
Internationalisedinternal
Interstate
1999 2000 2001 2002 2003 2004 2005 2006 2007 2008 2009 2010 2011 2012 2013
HOMICIDE
Accurately assessing movements in the global homicide rate is a difficult
task. Limited country data, sporadic updating and the high variance
between different estimation methods mean that there is no single,
agreed-upon global homicide rate and that tracking changes year-on-year
involves some form of data estimation or imputation. IEP uses the
Economist Intelligence Unit country analysts’ estimates of the homicide
FIGURE 19 GLOBAL HOMICIDE TOTAL DEATHS AND RATE, 2005-2012
The global homicide rate has been increasing.
Source: UNODC, EIU, IEP Calculations
358,
559
344
,758
431
,39
1
44
7,37
9
46
7,9
79
500
,984
484
,327
454
,355
5.46 5.19
6.41 6.57 6.797.19
6.876.37
0
1
2
3
4
5
6
7
8
0
100,000
200,000
300,000
400,000
500,000
2005 2006 2007 2008 2009 2010 2011 2012
HO
MIC
IDE
RATE
TOTA
L H
OM
ICID
ES
Non-State conflicts surged in 2013, with the biggest increases occurring in Nigeria, Sudan and Syria.
rate in countries where no data is available. These
experts are in contact with the relevant police and
government authorities, as well as members of civil
society, and are well placed to make meaningful and
accurate estimates of the homicide rate in their
country of expertise. However, these estimates are
not available for the years before 2005, so it is only
possible to construct a global trend from 2005 to
2012, which is the latest year for which UNODC
homicide data is available. Figure 19 shows the total
number of homicides and IEP’s estimate of the
global homicide rate for the period 2005 to 2012.
According to IEP’s estimates, the global homicide
rate increased 16.67 per cent between 2005 and
2012, increasing from 5.46 deaths per 100,000
people to 6.37. In absolute terms, this represents an
increase in the number of people killed per year of
over 95,000. In total, IEP estimates that over three
and a half million people were intentionally killed
in the eight-year period between 2005 and 2012.
However, over the same time period, 85 countries
actually saw improvements in their homicide rate
with declines in 73 countries.
Figure 19 highlights the trend in the global homicide
rate compared to the GPI country average and
median homicide rates in the 162 countries
measured in the GPI. The global homicide rate
represents the total number of homicides divided by
the world population, expressed as a rate per
100,000 people.
53GLOBAL PEACE INDEX 2015 | Trends in Peace
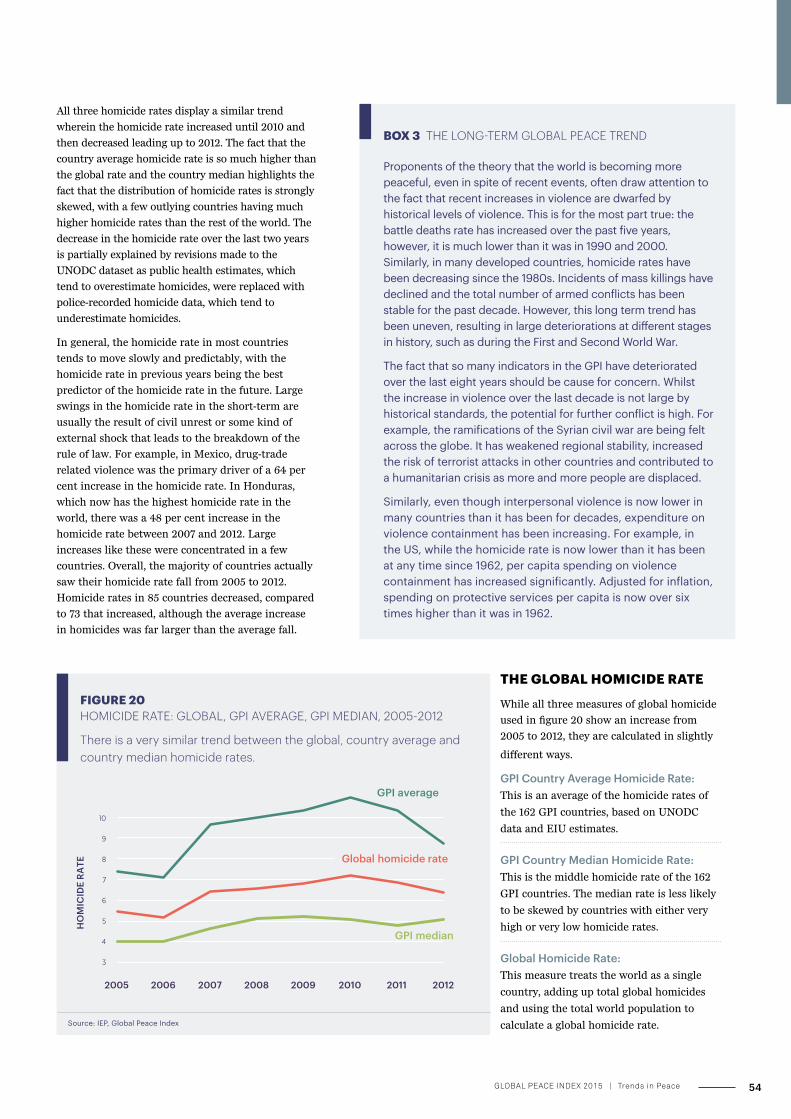
FIGURE 20 HOMICIDE RATE: GLOBAL, GPI AVERAGE, GPI MEDIAN, 2005-2012
There is a very similar trend between the global, country average and country median homicide rates.
Source: IEP, Global Peace Index
Global homicide rate
GPI median
GPI average
4
6
8
10
3
5
7
9
2005 2006 2007 2008 2009 2010 2011 2012
HO
MIC
IDE
RATE
All three homicide rates display a similar trend
wherein the homicide rate increased until 2010 and
then decreased leading up to 2012. The fact that the
country average homicide rate is so much higher than
the global rate and the country median highlights the
fact that the distribution of homicide rates is strongly
skewed, with a few outlying countries having much
higher homicide rates than the rest of the world. The
decrease in the homicide rate over the last two years
is partially explained by revisions made to the
UNODC dataset as public health estimates, which
tend to overestimate homicides, were replaced with
police-recorded homicide data, which tend to
underestimate homicides.
In general, the homicide rate in most countries
tends to move slowly and predictably, with the
homicide rate in previous years being the best
predictor of the homicide rate in the future. Large
swings in the homicide rate in the short-term are
usually the result of civil unrest or some kind of
external shock that leads to the breakdown of the
rule of law. For example, in Mexico, drug-trade
related violence was the primary driver of a 64 per
cent increase in the homicide rate. In Honduras,
which now has the highest homicide rate in the
world, there was a 48 per cent increase in the
homicide rate between 2007 and 2012. Large
increases like these were concentrated in a few
countries. Overall, the majority of countries actually
saw their homicide rate fall from 2005 to 2012.
Homicide rates in 85 countries decreased, compared
to 73 that increased, although the average increase
in homicides was far larger than the average fall.
THE GLOBAL HOMICIDE RATE
While all three measures of global homicide
used in figure 20 show an increase from
2005 to 2012, they are calculated in slightly
different ways.
GPI Country Average Homicide Rate: This is an average of the homicide rates of
the 162 GPI countries, based on UNODC
data and EIU estimates.
GPI Country Median Homicide Rate: This is the middle homicide rate of the 162
GPI countries. The median rate is less likely
to be skewed by countries with either very
high or very low homicide rates.
Global Homicide Rate: This measure treats the world as a single
country, adding up total global homicides
and using the total world population to
calculate a global homicide rate.
BOX 3 THE LONG-TERM GLOBAL PEACE TREND
Proponents of the theory that the world is becoming more peaceful, even in spite of recent events, often draw attention to the fact that recent increases in violence are dwarfed by historical levels of violence. This is for the most part true: the battle deaths rate has increased over the past five years, however, it is much lower than it was in 1990 and 2000. Similarly, in many developed countries, homicide rates have been decreasing since the 1980s. Incidents of mass killings have declined and the total number of armed conflicts has been stable for the past decade. However, this long term trend has been uneven, resulting in large deteriorations at different stages in history, such as during the First and Second World War.
The fact that so many indicators in the GPI have deteriorated over the last eight years should be cause for concern. Whilst the increase in violence over the last decade is not large by historical standards, the potential for further conflict is high. For example, the ramifications of the Syrian civil war are being felt across the globe. It has weakened regional stability, increased the risk of terrorist attacks in other countries and contributed to a humanitarian crisis as more and more people are displaced.
Similarly, even though interpersonal violence is now lower in many countries than it has been for decades, expenditure on violence containment has been increasing. For example, in the US, while the homicide rate is now lower than it has been at any time since 1962, per capita spending on violence containment has increased significantly. Adjusted for inflation, spending on protective services per capita is now over six times higher than it was in 1962.
54GLOBAL PEACE INDEX 2015 | Trends in Peace
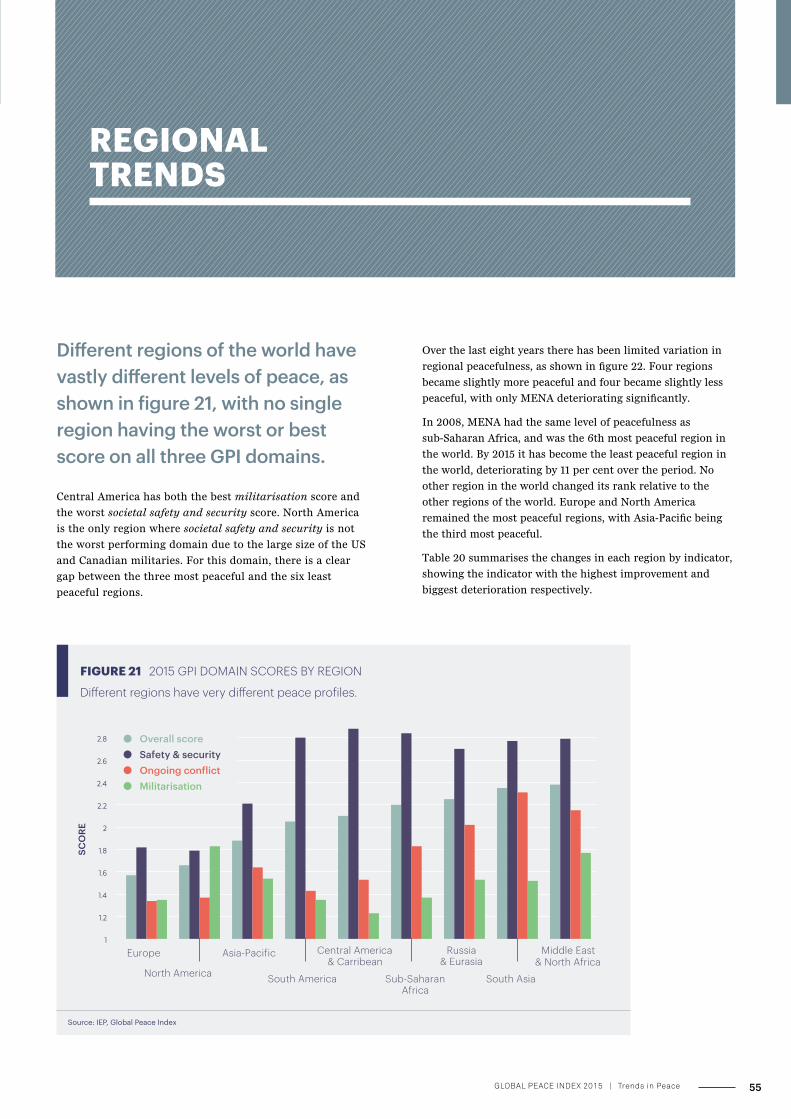
REGIONAL TRENDS
Central America has both the best militarisation score and
the worst societal safety and security score. North America
is the only region where societal safety and security is not
the worst performing domain due to the large size of the US
and Canadian militaries. For this domain, there is a clear
gap between the three most peaceful and the six least
peaceful regions.
Over the last eight years there has been limited variation in
regional peacefulness, as shown in figure 22. Four regions
became slightly more peaceful and four became slightly less
peaceful, with only MENA deteriorating significantly.
In 2008, MENA had the same level of peacefulness as
sub-Saharan Africa, and was the 6th most peaceful region in
the world. By 2015 it has become the least peaceful region in
the world, deteriorating by 11 per cent over the period. No
other region in the world changed its rank relative to the
other regions of the world. Europe and North America
remained the most peaceful regions, with Asia-Pacific being
the third most peaceful.
Table 20 summarises the changes in each region by indicator,
showing the indicator with the highest improvement and
biggest deterioration respectively.
Different regions of the world have vastly different levels of peace, as shown in figure 21, with no single region having the worst or best score on all three GPI domains.
FIGURE 21 2015 GPI DOMAIN SCORES BY REGION
Di�erent regions have very di�erent peace profiles.
Source: IEP, Global Peace Index
1
1.2
1.4
1.6
1.8
2
2.2
2.4
2.6
2.8
Europe
North America
Asia-Pacific
South America
Central America& Carribean
Sub-SaharanAfrica
Russia& Eurasia
South Asia
Middle East& North Africa
SCO
RE
Overall scoreSafety & securityOngoing conflictMilitarisation
55GLOBAL PEACE INDEX 2015 | Trends in Peace
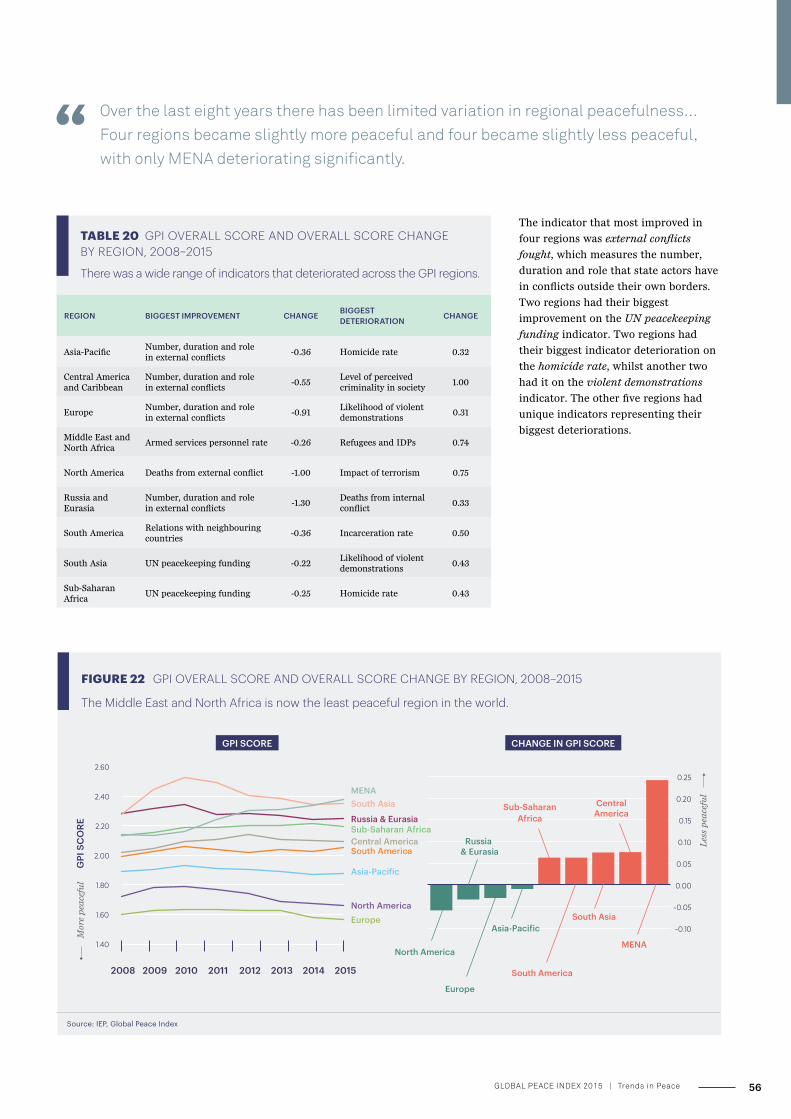
Source: IEP, Global Peace Index
FIGURE 22 GPI OVERALL SCORE AND OVERALL SCORE CHANGE BY REGION, 2008–2015
The Middle East and North Africa is now the least peaceful region in the world.
CHANGE IN GPI SCORE
-0.10
-0.05
0.00
0.05
0.10
0.15
0.20
0.25
Europe
North America
Asia-Pacific
South America
Sub-SaharanAfrica
Russia & Eurasia
CentralAmerica
South Asia
MENA
North America
Russia & Eurasia
Europe
Sub-Saharan Africa
South America
South Asia
Central America
MENA
1.40
1.60
1.80
2.00
2.20
2.40
2.60
2008 2009 2010 2011 2012 2013 2014 2015
GPI SCORE
Asia-Pacific
GPI
SC
ORE
Mor
e p
eace
ful
Les
s p
eace
ful
REGION BIGGEST IMPROVEMENT CHANGE BIGGEST DETERIORATION CHANGE
Asia-PacificNumber, duration and role in external conflicts
-0.36 Homicide rate 0.32
Central America and Caribbean
Number, duration and role in external conflicts
-0.55Level of perceived criminality in society
1.00
EuropeNumber, duration and role in external conflicts
-0.91Likelihood of violent demonstrations
0.31
Middle East and North Africa
Armed services personnel rate -0.26 Refugees and IDPs 0.74
North America Deaths from external conflict -1.00 Impact of terrorism 0.75
Russia and Eurasia
Number, duration and role in external conflicts
-1.30Deaths from internal conflict
0.33
South AmericaRelations with neighbouring countries
-0.36 Incarceration rate 0.50
South Asia UN peacekeeping funding -0.22Likelihood of violent demonstrations
0.43
Sub-Saharan Africa
UN peacekeeping funding -0.25 Homicide rate 0.43
TABLE 20 GPI OVERALL SCORE AND OVERALL SCORE CHANGE BY REGION, 2008–2015
There was a wide range of indicators that deteriorated across the GPI regions.
The indicator that most improved in
four regions was external conflicts
fought, which measures the number,
duration and role that state actors have
in conflicts outside their own borders.
Two regions had their biggest
improvement on the UN peacekeeping
funding indicator. Two regions had
their biggest indicator deterioration on
the homicide rate, whilst another two
had it on the violent demonstrations
indicator. The other five regions had
unique indicators representing their
biggest deteriorations.
Over the last eight years there has been limited variation in regional peacefulness…Four regions became slightly more peaceful and four became slightly less peaceful, with only MENA deteriorating significantly.
56GLOBAL PEACE INDEX 2015 | Trends in Peace
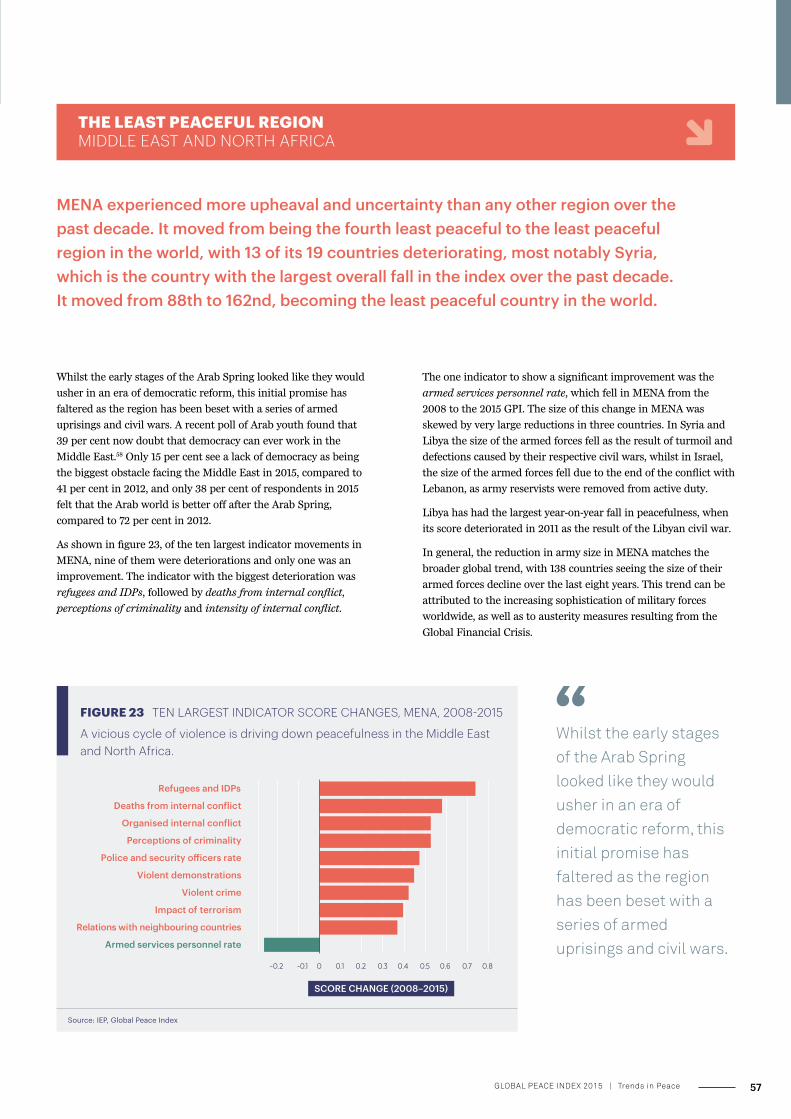
THE LEAST PEACEFUL REGION MIDDLE EAST AND NORTH AFRICA
MENA experienced more upheaval and uncertainty than any other region over the past decade. It moved from being the fourth least peaceful to the least peaceful region in the world, with 13 of its 19 countries deteriorating, most notably Syria, which is the country with the largest overall fall in the index over the past decade. It moved from 88th to 162nd, becoming the least peaceful country in the world.
Whilst the early stages of the Arab Spring looked like they would
usher in an era of democratic reform, this initial promise has
faltered as the region has been beset with a series of armed
uprisings and civil wars. A recent poll of Arab youth found that
39 per cent now doubt that democracy can ever work in the
Middle East.58 Only 15 per cent see a lack of democracy as being
the biggest obstacle facing the Middle East in 2015, compared to
41 per cent in 2012, and only 38 per cent of respondents in 2015
felt that the Arab world is better off after the Arab Spring,
compared to 72 per cent in 2012.
As shown in figure 23, of the ten largest indicator movements in
MENA, nine of them were deteriorations and only one was an
improvement. The indicator with the biggest deterioration was
refugees and IDPs, followed by deaths from internal conflict,
perceptions of criminality and intensity of internal conflict.
The one indicator to show a significant improvement was the
armed services personnel rate, which fell in MENA from the
2008 to the 2015 GPI. The size of this change in MENA was
skewed by very large reductions in three countries. In Syria and
Libya the size of the armed forces fell as the result of turmoil and
defections caused by their respective civil wars, whilst in Israel,
the size of the armed forces fell due to the end of the conflict with
Lebanon, as army reservists were removed from active duty.
Libya has had the largest year-on-year fall in peacefulness, when
its score deteriorated in 2011 as the result of the Libyan civil war.
In general, the reduction in army size in MENA matches the
broader global trend, with 138 countries seeing the size of their
armed forces decline over the last eight years. This trend can be
attributed to the increasing sophistication of military forces
worldwide, as well as to austerity measures resulting from the
Global Financial Crisis.
FIGURE 23 TEN LARGEST INDICATOR SCORE CHANGES, MENA, 2008-2015
A vicious cycle of violence is driving down peacefulness in the Middle East and North Africa.
Source: IEP, Global Peace Index
0 0.2 0.4 0.6-0.2 0.8
Armed services personnel rate
Relations with neighbouring countries
Impact of terrorism
Violent crime
Violent demonstrations
Police and security o�icers rate
Perceptions of criminality
Organised internal conflict
Deaths from internal conflict
Refugees and IDPs
-0.1 0.1 0.3 0.5 0.7
SCORE CHANGE (2008–2015)
Whilst the early stages of the Arab Spring looked like they would usher in an era of democratic reform, this initial promise has faltered as the region has been beset with a series of armed uprisings and civil wars.
57GLOBAL PEACE INDEX 2015 | Trends in Peace
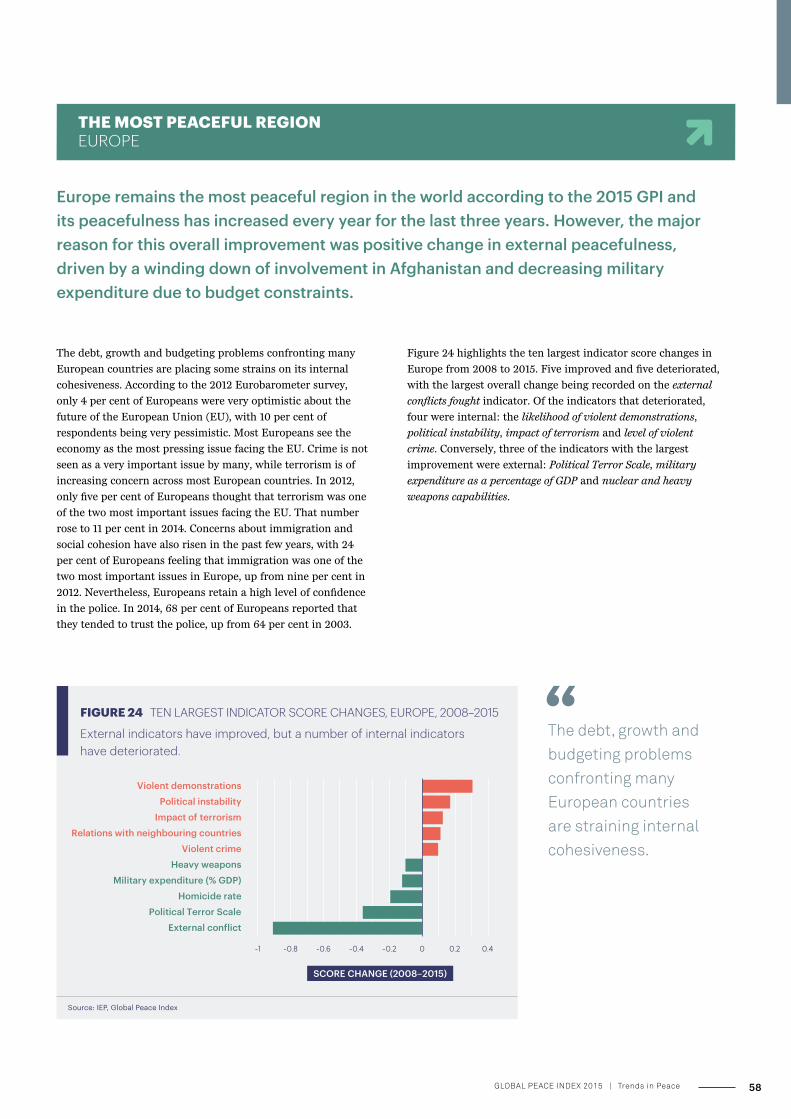
THE MOST PEACEFUL REGION EUROPE
FIGURE 24 TEN LARGEST INDICATOR SCORE CHANGES, EUROPE, 2008–2015
External indicators have improved, but a number of internal indicators have deteriorated.
Source: IEP, Global Peace Index
-1 -0.8 -0.6 -0.4 -0.2 0 0.2 0.4
External conflict
Political Terror Scale
Homicide rate
Military expenditure (% GDP)
Heavy weapons
Violent crime
Relations with neighbouring countries
Impact of terrorism
Political instability
Violent demonstrations
SCORE CHANGE (2008–2015)
The debt, growth and budgeting problems confronting many
European countries are placing some strains on its internal
cohesiveness. According to the 2012 Eurobarometer survey,
only 4 per cent of Europeans were very optimistic about the
future of the European Union (EU), with 10 per cent of
respondents being very pessimistic. Most Europeans see the
economy as the most pressing issue facing the EU. Crime is not
seen as a very important issue by many, while terrorism is of
increasing concern across most European countries. In 2012,
only five per cent of Europeans thought that terrorism was one
of the two most important issues facing the EU. That number
rose to 11 per cent in 2014. Concerns about immigration and
social cohesion have also risen in the past few years, with 24
per cent of Europeans feeling that immigration was one of the
two most important issues in Europe, up from nine per cent in
2012. Nevertheless, Europeans retain a high level of confidence
in the police. In 2014, 68 per cent of Europeans reported that
they tended to trust the police, up from 64 per cent in 2003.
Figure 24 highlights the ten largest indicator score changes in
Europe from 2008 to 2015. Five improved and five deteriorated,
with the largest overall change being recorded on the external
conflicts fought indicator. Of the indicators that deteriorated,
four were internal: the likelihood of violent demonstrations,
political instability, impact of terrorism and level of violent
crime. Conversely, three of the indicators with the largest
improvement were external: Political Terror Scale, military
expenditure as a percentage of GDP and nuclear and heavy
weapons capabilities.
The debt, growth and budgeting problems confronting many European countries are straining internal cohesiveness.
Europe remains the most peaceful region in the world according to the 2015 GPI and its peacefulness has increased every year for the last three years. However, the major reason for this overall improvement was positive change in external peacefulness, driven by a winding down of involvement in Afghanistan and decreasing military expenditure due to budget constraints.
58GLOBAL PEACE INDEX 2015 | Trends in Peace
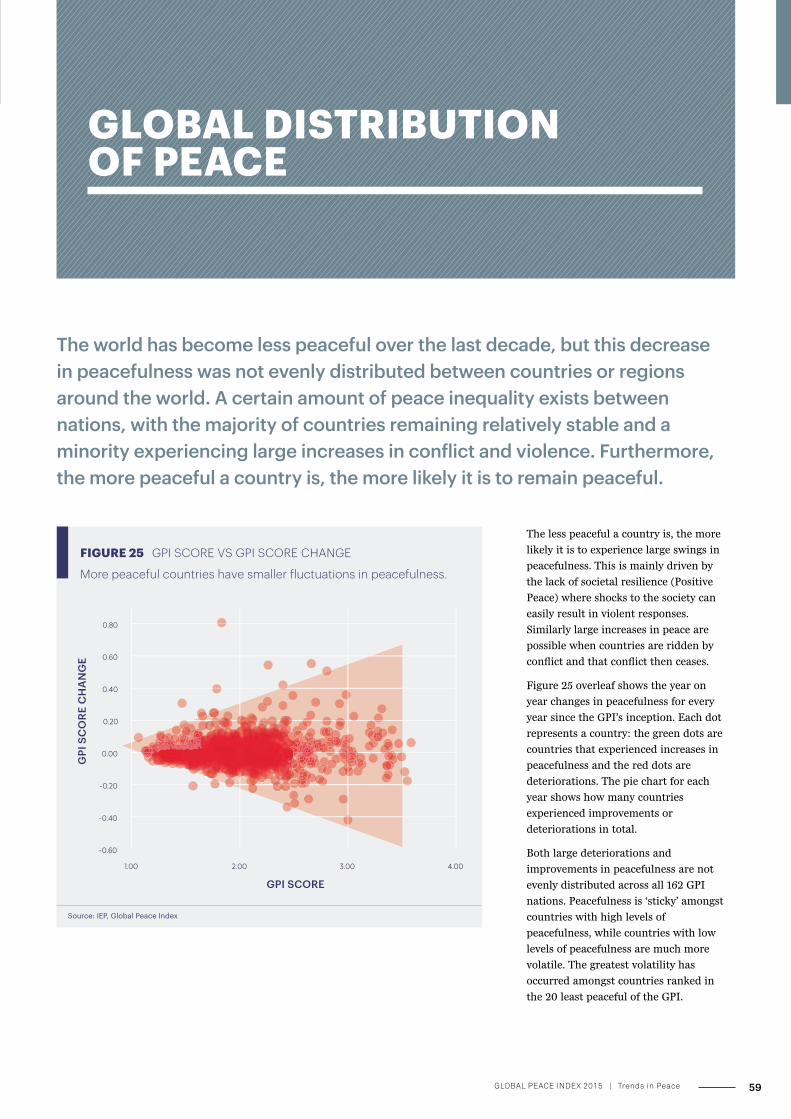
GLOBAL DISTRIBUTION OF PEACE
The world has become less peaceful over the last decade, but this decrease in peacefulness was not evenly distributed between countries or regions around the world. A certain amount of peace inequality exists between nations, with the majority of countries remaining relatively stable and a minority experiencing large increases in conflict and violence. Furthermore, the more peaceful a country is, the more likely it is to remain peaceful.
The less peaceful a country is, the more
likely it is to experience large swings in
peacefulness. This is mainly driven by
the lack of societal resilience (Positive
Peace) where shocks to the society can
easily result in violent responses.
Similarly large increases in peace are
possible when countries are ridden by
conflict and that conflict then ceases.
Figure 25 overleaf shows the year on
year changes in peacefulness for every
year since the GPI’s inception. Each dot
represents a country: the green dots are
countries that experienced increases in
peacefulness and the red dots are
deteriorations. The pie chart for each
year shows how many countries
experienced improvements or
deteriorations in total.
Both large deteriorations and
improvements in peacefulness are not
evenly distributed across all 162 GPI
nations. Peacefulness is ‘sticky’ amongst
countries with high levels of
peacefulness, while countries with low
levels of peacefulness are much more
volatile. The greatest volatility has
occurred amongst countries ranked in
the 20 least peaceful of the GPI.
FIGURE 25 GPI SCORE VS GPI SCORE CHANGE
More peaceful countries have smaller fluctuations in peacefulness.
Source: IEP, Global Peace Index
-0.60
-0.40
-0.20
0.00
0.20
0.40
0.60
0.80
1.00 2.00 3.00 4.00
GPI
SC
ORE
CH
AN
GE
GPI SCORE
59GLOBAL PEACE INDEX 2015 | Trends in Peace
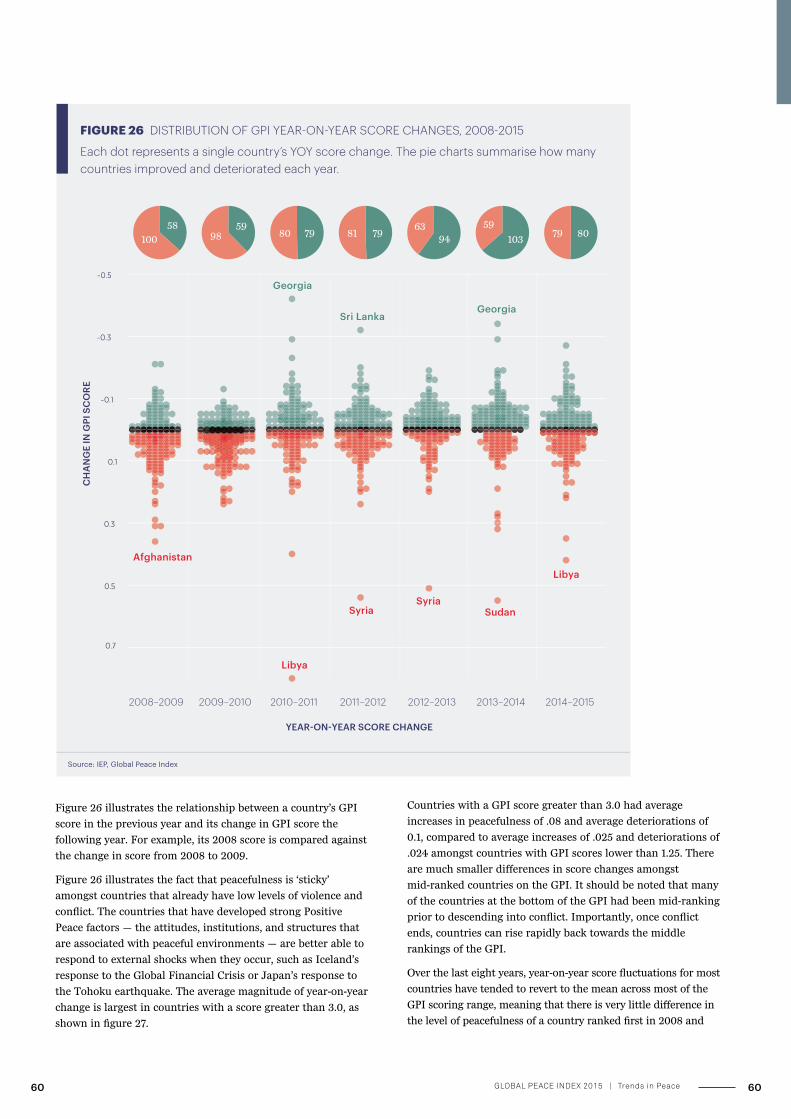
FIGURE 26 DISTRIBUTION OF GPI YEAR-ON-YEAR SCORE CHANGES, 2008-2015
Each dot represents a single country’s YOY score change. The pie charts summarise how many countries improved and deteriorated each year.
Afghanistan
Georgia
Sri LankaGeorgia
Libya
SyriaSyria
Sudan
Libya
-0.5
-0.3
-0.1
0.1
0.3
0.5
0.7
CH
AN
GE
IN G
PI S
CO
RE
2008–2009 2009–2010 2010–2011 2011–2012 2012–2013 2013–2014 2014–2015
n
58100
5998 7980 7981
9463
103
598079
YEAR-ON-YEAR SCORE CHANGE
Source: IEP, Global Peace Index
Figure 26 illustrates the relationship between a country’s GPI
score in the previous year and its change in GPI score the
following year. For example, its 2008 score is compared against
the change in score from 2008 to 2009.
Figure 26 illustrates the fact that peacefulness is ‘sticky’
amongst countries that already have low levels of violence and
conflict. The countries that have developed strong Positive
Peace factors — the attitudes, institutions, and structures that
are associated with peaceful environments — are better able to
respond to external shocks when they occur, such as Iceland’s
response to the Global Financial Crisis or Japan’s response to
the Tohoku earthquake. The average magnitude of year-on-year
change is largest in countries with a score greater than 3.0, as
shown in figure 27.
Countries with a GPI score greater than 3.0 had average
increases in peacefulness of .08 and average deteriorations of
0.1, compared to average increases of .025 and deteriorations of
.024 amongst countries with GPI scores lower than 1.25. There
are much smaller differences in score changes amongst
mid-ranked countries on the GPI. It should be noted that many
of the countries at the bottom of the GPI had been mid-ranking
prior to descending into conflict. Importantly, once conflict
ends, countries can rise rapidly back towards the middle
rankings of the GPI.
Over the last eight years, year-on-year score fluctuations for most
countries have tended to revert to the mean across most of the
GPI scoring range, meaning that there is very little difference in
the level of peacefulness of a country ranked first in 2008 and
60GLOBAL PEACE INDEX 2015 | Trends in Peace60
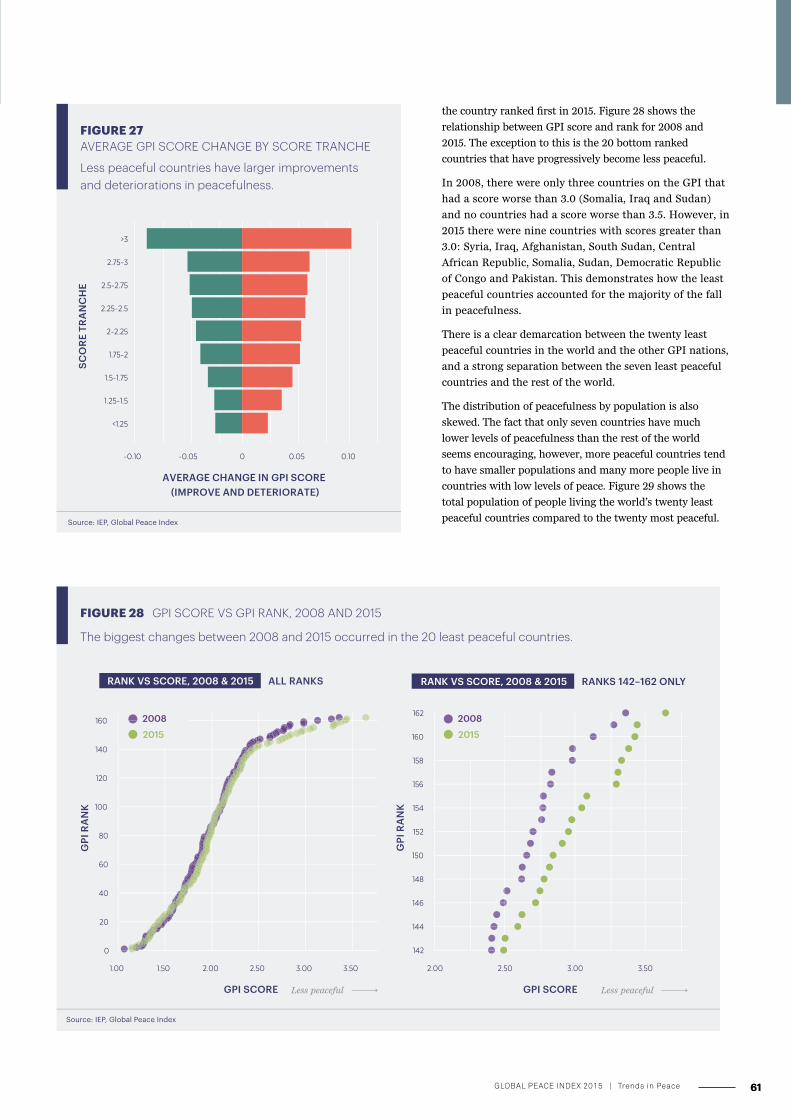
the country ranked first in 2015. Figure 28 shows the
relationship between GPI score and rank for 2008 and
2015. The exception to this is the 20 bottom ranked
countries that have progressively become less peaceful.
In 2008, there were only three countries on the GPI that
had a score worse than 3.0 (Somalia, Iraq and Sudan)
and no countries had a score worse than 3.5. However, in
2015 there were nine countries with scores greater than
3.0: Syria, Iraq, Afghanistan, South Sudan, Central
African Republic, Somalia, Sudan, Democratic Republic
of Congo and Pakistan. This demonstrates how the least
peaceful countries accounted for the majority of the fall
in peacefulness.
There is a clear demarcation between the twenty least
peaceful countries in the world and the other GPI nations,
and a strong separation between the seven least peaceful
countries and the rest of the world.
The distribution of peacefulness by population is also
skewed. The fact that only seven countries have much
lower levels of peacefulness than the rest of the world
seems encouraging, however, more peaceful countries tend
to have smaller populations and many more people live in
countries with low levels of peace. Figure 29 shows the
total population of people living the world’s twenty least
peaceful countries compared to the twenty most peaceful.
FIGURE 27 AVERAGE GPI SCORE CHANGE BY SCORE TRANCHE
Less peaceful countries have larger improvements and deteriorations in peacefulness.
Source: IEP, Global Peace Index
-0.05 0.05 0.10-0.10 0
<1.25
1.25-1.5
1.5-1.75
1.75-2
2-2.25
2.25-2.5
2.5-2.75
2.75-3
>3
AVERAGE CHANGE IN GPI SCORE (IMPROVE AND DETERIORATE)
SCO
RE T
RAN
CH
E
Source: IEP, Global Peace Index
FIGURE 28 GPI SCORE VS GPI RANK, 2008 AND 2015
The biggest changes between 2008 and 2015 occurred in the 20 least peaceful countries.
142
144
146
148
150
152
154
156
158
160
162
2.00 2.50 3.00 3.50
GPI
RA
NK
GPI SCORE
RANK VS SCORE, 2008 & 2015 RANKS 142–162 ONLY
2008
2015
1.00 1.50 2.00 2.50 3.00 3.50
RANK VS SCORE, 2008 & 2015 ALL RANKS
0
20
40
60
80
100
120
140
160
GPI
RA
NK
2008
2015
Less peaceful Less peacefulGPI SCORE
61GLOBAL PEACE INDEX 2015 | Trends in Peace 61
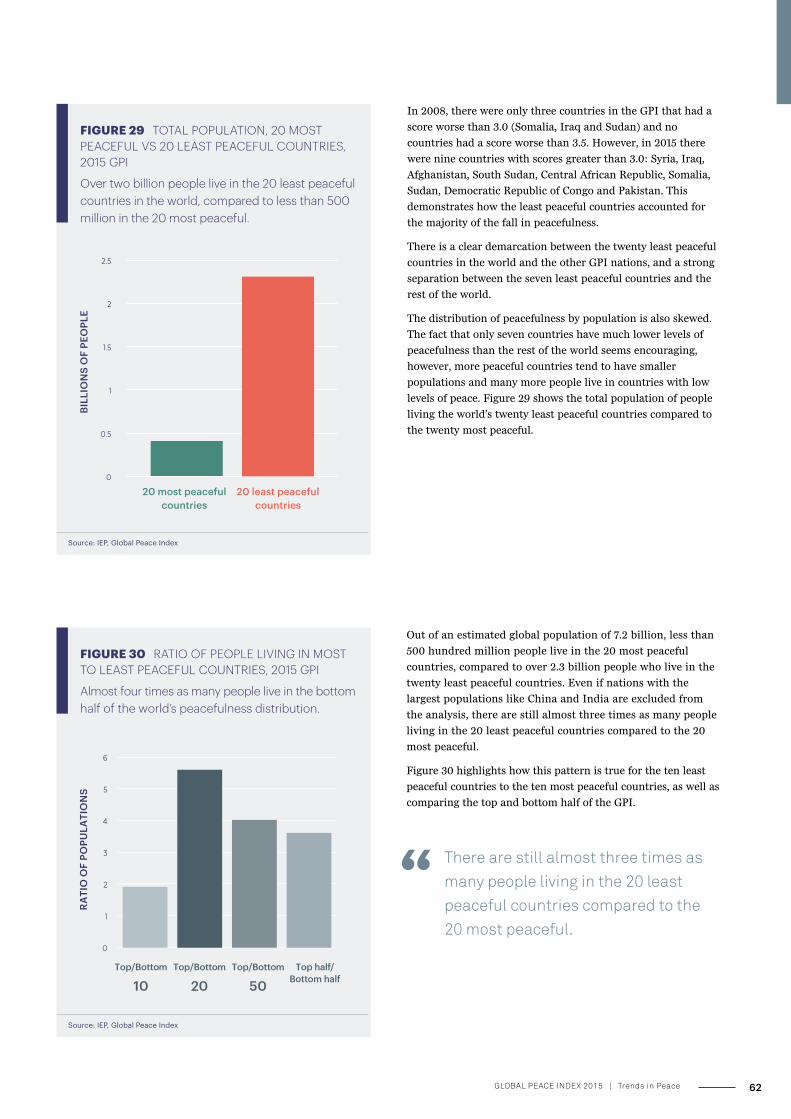
In 2008, there were only three countries in the GPI that had a
score worse than 3.0 (Somalia, Iraq and Sudan) and no
countries had a score worse than 3.5. However, in 2015 there
were nine countries with scores greater than 3.0: Syria, Iraq,
Afghanistan, South Sudan, Central African Republic, Somalia,
Sudan, Democratic Republic of Congo and Pakistan. This
demonstrates how the least peaceful countries accounted for
the majority of the fall in peacefulness.
There is a clear demarcation between the twenty least peaceful
countries in the world and the other GPI nations, and a strong
separation between the seven least peaceful countries and the
rest of the world.
The distribution of peacefulness by population is also skewed.
The fact that only seven countries have much lower levels of
peacefulness than the rest of the world seems encouraging,
however, more peaceful countries tend to have smaller
populations and many more people live in countries with low
levels of peace. Figure 29 shows the total population of people
living the world’s twenty least peaceful countries compared to
the twenty most peaceful.
FIGURE 29 TOTAL POPULATION, 20 MOST PEACEFUL VS 20 LEAST PEACEFUL COUNTRIES, 2015 GPI
Over two billion people live in the 20 least peaceful countries in the world, compared to less than 500 million in the 20 most peaceful.
Source: IEP, Global Peace Index
0
0.5
1
1.5
2
2.5
20 most peacefulcountries
BILL
ION
S O
F PE
OPL
E
20 least peacefulcountries
FIGURE 30 RATIO OF PEOPLE LIVING IN MOST TO LEAST PEACEFUL COUNTRIES, 2015 GPI
Almost four times as many people live in the bottom half of the world’s peacefulness distribution.
Source: IEP, Global Peace Index
0
1
2
3
4
5
6
RATI
O O
F PO
PULA
TIO
NS
Top/Bottom 10
Top/Bottom 20
Top half/Bottom half
Top/Bottom 50
Out of an estimated global population of 7.2 billion, less than
500 hundred million people live in the 20 most peaceful
countries, compared to over 2.3 billion people who live in the
twenty least peaceful countries. Even if nations with the
largest populations like China and India are excluded from
the analysis, there are still almost three times as many people
living in the 20 least peaceful countries compared to the 20
most peaceful.
Figure 30 highlights how this pattern is true for the ten least
peaceful countries to the ten most peaceful countries, as well as
comparing the top and bottom half of the GPI.
There are still almost three times as many people living in the 20 least peaceful countries compared to the 20 most peaceful.
62GLOBAL PEACE INDEX 2015 | Trends in Peace
GLOBAL ECONOMIC VALUE OF PEACE
63GLOBAL PEACE INDEX 2015
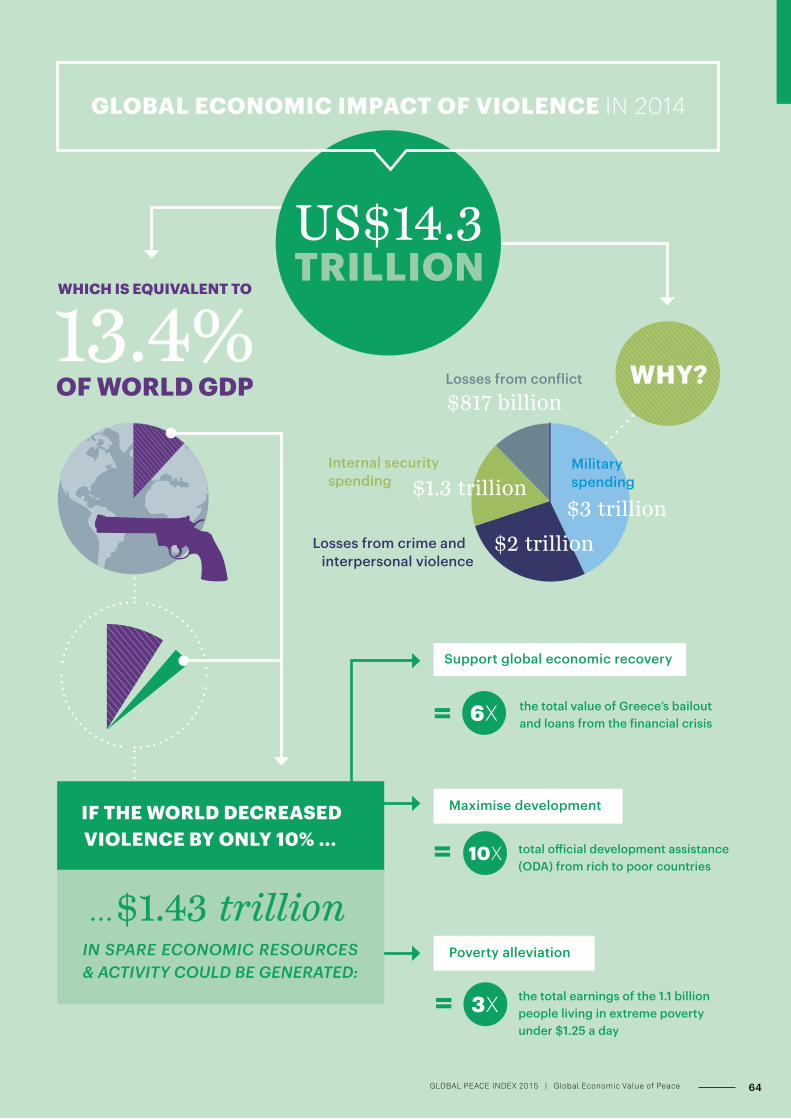
GLOBAL ECONOMIC IMPACT OF VIOLENCE IN 2014
WHY?Losses from conflict
$817 billion
Internal security spending
$2 trillion
Military spending
Losses from crime and interpersonal violence
$1.3 trillion$3 trillion
IF THE WORLD DECREASED VIOLENCE BY ONLY 10% ...
IN SPARE ECONOMIC RESOURCES & ACTIVITY COULD BE GENERATED:
...$1.43 trillion
WHICH IS EQUIVALENT TO
= the total earnings of the 1.1 billion people living in extreme poverty under $1.25 a day
Poverty alleviation
3X
Maximise development
= total official development assistance (ODA) from rich to poor countries
10X
Support global economic recovery
the total value of Greece’s bailout and loans from the financial crisis6X =
64GLOBAL PEACE INDEX 2015 | Global Economic Value of Peace

The amount is comprised of US$7.16 trillion in current yearly costs and an economic multiplier of the same amount. The economic multiplier represents the additional economic activity that would flow from the more productive redirection of expenditure resulting from the reduction in violence.
If global violence were to decrease by ten per cent uniformly, an additional US$1.43 trillion would effectively be added to the world economy each year. This is more than six times the total value of Greece’s bailout and loans from the International Monetary Fund (IMF), European Central Bank (ECB) and other Eurozone countries combined.
Since 2008, the total economic impact of violence has increased by 15.3 per cent, from US$12.4 trillion to US$14.3 trillion PPP. Large increases in costs have occurred due to deaths from internal conflict, IDPs and refugee support, UN peacekeeping and GDP losses from conflict. This reflects the deterioration in global peace.
Half of the increase in violence containment costs since 2008 is due to deteriorations in the conflict indicators. The violence containment indicator that deteriorated the most in percentage terms was deaths from internal conflict which increased 378 per cent. In absolute terms, GDP losses from conflict increased US$360 billion globally.
HIGHLIGHTS
The economic impact of violence on the global economy was US$14.3 trillion in 2014, which represents 13.4 per cent of world GDP. This is equivalent to the combined economies of Brazil, Canada, France, Germany, Spain and the United Kingdom.
IEP’s comprehensive calculation of military expenditure accounts for over US$3 trillion globally, which is twice as much as the four largest companies in the United States (Apple, ExxonMobil, Google and Microsoft).
Total internal security expenditure, encompassing police, private security guards and national security agencies, now accounts for 18 per cent of violence containment expenditure.
The only category of violence containment to improve was deaths from external conflict, reflecting the trend away from external conflicts between states to internal conflicts within states.
The number of refugees and IDPs numbers has increased substantially to over 50 million, according to the Internal Displacement Monitoring Centre (IDMC), the highest number since the end of World War II. Related costs increased by 267 per cent to US$93 billion dollars since 2008.
While UN peacekeeping costs have more than doubled since 2008, it is important to note they only account for less than 0.17 per cent of total violence containment expenditure.
65GLOBAL PEACE INDEX 2015 | Global Economic Value of Peace
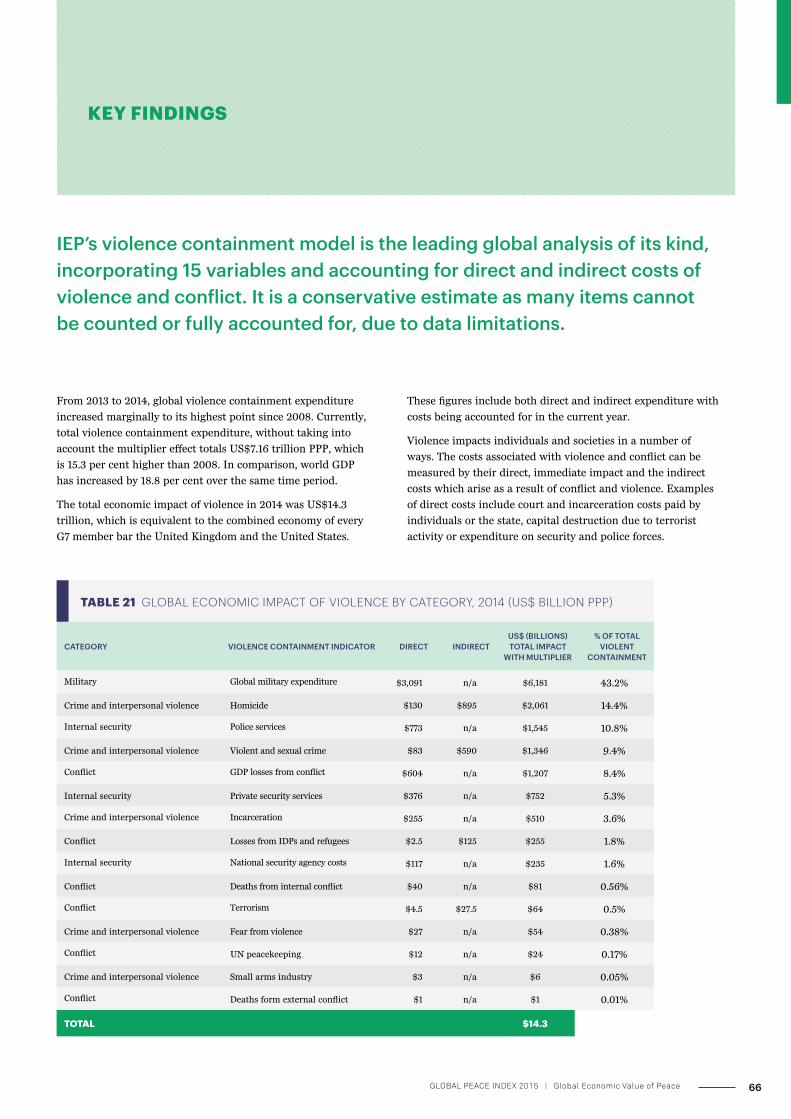
KEY FINDINGS
IEP’s violence containment model is the leading global analysis of its kind, incorporating 15 variables and accounting for direct and indirect costs of violence and conflict. It is a conservative estimate as many items cannot be counted or fully accounted for, due to data limitations.
From 2013 to 2014, global violence containment expenditure
increased marginally to its highest point since 2008. Currently,
total violence containment expenditure, without taking into
account the multiplier effect totals US$7.16 trillion PPP, which
is 15.3 per cent higher than 2008. In comparison, world GDP
has increased by 18.8 per cent over the same time period.
The total economic impact of violence in 2014 was US$14.3
trillion, which is equivalent to the combined economy of every
G7 member bar the United Kingdom and the United States.
CATEGORY VIOLENCE CONTAINMENT INDICATOR DIRECT INDIRECTUS$ (BILLIONS) TOTAL IMPACT
WITH MULTIPLIER
% OF TOTAL VIOLENT
CONTAINMENT
Military Global military expenditure $3,091 n/a $6,181 43.2%
Crime and interpersonal violence Homicide $130 $895 $2,061 14.4%
Internal security Police services $773 n/a $1,545 10.8%
Crime and interpersonal violence Violent and sexual crime $83 $590 $1,346 9.4%
Conflict GDP losses from conflict $604 n/a $1,207 8.4%
Internal security Private security services $376 n/a $752 5.3%
Crime and interpersonal violence Incarceration $255 n/a $510 3.6%
Conflict Losses from IDPs and refugees $2.5 $125 $255 1.8%
Internal security National security agency costs $117 n/a $235 1.6%
Conflict Deaths from internal conflict $40 n/a $81 0.56%
Conflict Terrorism $4.5 $27.5 $64 0.5%
Crime and interpersonal violence Fear from violence $27 n/a $54 0.38%
Conflict UN peacekeeping $12 n/a $24 0.17%
Crime and interpersonal violence Small arms industry $3 n/a $6 0.05%
Conflict Deaths form external conflict $1 n/a $1 0.01%
TOTAL $14.3
TABLE 21 GLOBAL ECONOMIC IMPACT OF VIOLENCE BY CATEGORY, 2014 (US$ BILLION PPP)
These figures include both direct and indirect expenditure with
costs being accounted for in the current year.
Violence impacts individuals and societies in a number of
ways. The costs associated with violence and conflict can be
measured by their direct, immediate impact and the indirect
costs which arise as a result of conflict and violence. Examples
of direct costs include court and incarceration costs paid by
individuals or the state, capital destruction due to terrorist
activity or expenditure on security and police forces.
66GLOBAL PEACE INDEX 2015 | Global Economic Value of Peace
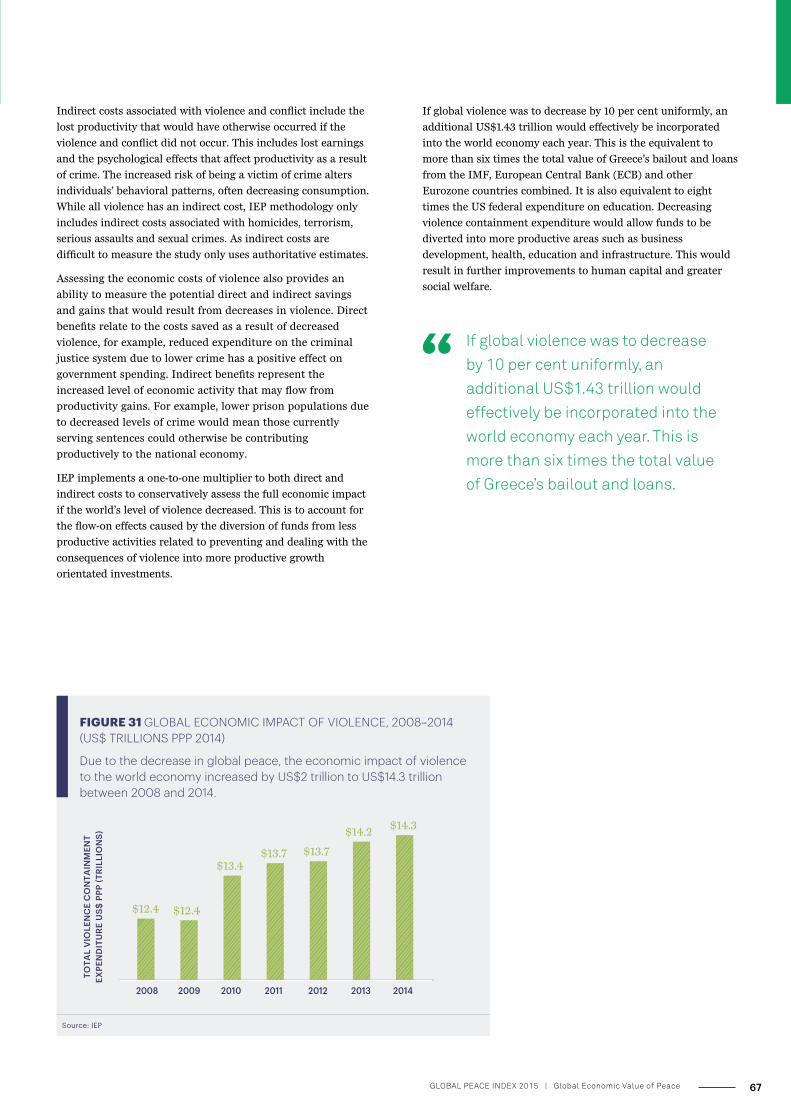
FIGURE 31 GLOBAL ECONOMIC IMPACT OF VIOLENCE, 2008–2014 (US$ TRILLIONS PPP 2014)
Due to the decrease in global peace, the economic impact of violence to the world economy increased by US$2 trillion to US$14.3 trillion between 2008 and 2014.
Source: IEP
$12.4 $12.4
$13.4 $13.7 $13.7
$14.2 $14.3
2008 2009 2010 2011 2012 2013 2014
TOTA
L V
IOLE
NC
E C
ON
TAIN
MEN
TEX
PEN
DIT
URE
US$
PPP
(TRI
LLIO
NS)
Indirect costs associated with violence and conflict include the
lost productivity that would have otherwise occurred if the
violence and conflict did not occur. This includes lost earnings
and the psychological effects that affect productivity as a result
of crime. The increased risk of being a victim of crime alters
individuals’ behavioral patterns, often decreasing consumption.
While all violence has an indirect cost, IEP methodology only
includes indirect costs associated with homicides, terrorism,
serious assaults and sexual crimes. As indirect costs are
difficult to measure the study only uses authoritative estimates.
Assessing the economic costs of violence also provides an
ability to measure the potential direct and indirect savings
and gains that would result from decreases in violence. Direct
benefits relate to the costs saved as a result of decreased
violence, for example, reduced expenditure on the criminal
justice system due to lower crime has a positive effect on
government spending. Indirect benefits represent the
increased level of economic activity that may flow from
productivity gains. For example, lower prison populations due
to decreased levels of crime would mean those currently
serving sentences could otherwise be contributing
productively to the national economy.
IEP implements a one-to-one multiplier to both direct and
indirect costs to conservatively assess the full economic impact
if the world’s level of violence decreased. This is to account for
the flow-on effects caused by the diversion of funds from less
productive activities related to preventing and dealing with the
consequences of violence into more productive growth
orientated investments.
If global violence was to decrease by 10 per cent uniformly, an
additional US$1.43 trillion would effectively be incorporated
into the world economy each year. This is the equivalent to
more than six times the total value of Greece’s bailout and loans
from the IMF, European Central Bank (ECB) and other
Eurozone countries combined. It is also equivalent to eight
times the US federal expenditure on education. Decreasing
violence containment expenditure would allow funds to be
diverted into more productive areas such as business
development, health, education and infrastructure. This would
result in further improvements to human capital and greater
social welfare.
If global violence was to decrease by 10 per cent uniformly, an additional US$1.43 trillion would effectively be incorporated into the world economy each year. This is more than six times the total value of Greece’s bailout and loans.
67GLOBAL PEACE INDEX 2015 | Global Economic Value of Peace

Military expenditure Includes military expenditure as a percentage of GDP and spending on other key government budget items such as Veterans Affairs Departments which deal with the consequences of war and conflict.
CONCEPTUAL OVERVIEW & METHODOLOGY
Violence destroys human and physical capital as well as social and political institutions.
It can lead to disruptions in consumption, investment, trade
and production. Further, violence requires the diversion of
investment from productive areas such as business
development, education, infrastructure and health into areas of
violence containment such as large security forces, high prison
populations or the military. While it has been found in a wide
range of studies that the cost of violence on society is large,
there is no universally agreed upon method to holistically
aggregate the current and future financial effects of violence
and conflict.
IEP’s approach is conservative and holistic and stands as one of
the few regularly updated attempts to account for direct and
indirect expenditures that are incurred because of violence. IEP
takes a holistic and comprehensive approach to counting the
costs of violence that looks at both the costs of preventing
violence, creating it and dealing with its consequences. This
concept of accounting for the holistic costs associated with
violence is referred to as violence containment expenditure.
The definition of violence containment expenditure is: forms of
economic activity related to dealing with the consequences or
prevention of violence, where the violence is directed against
people or property.
Within the violence containment framework there are 15
indicators grouped into four categories of violence
containment. These four categories are military, crime and
interpersonal violence, conflict and internal security and
include the following 15 line items:
1. Military
Homicide Counts the number of homicides recorded each year multiplied by the direct costs of loss of life which are average court, investigation and health costs. Indirect costs are lost earnings and productivity as well as the cost of grievance accrued in the current year.
Violent and sexual crime Counts the number of severe violent physical attacks on individuals including severe sexual assault and rape and is based on UNODC data. Average underreporting rates are also applied to account for underreporting. Minor assaults such as slapping, punching and threats are not included.
Incarceration Based on the average cost of incarcerating an individual based on incarceration rate per 100,000. Also includes those on pre-trial detention for the current year.
Fear from violence Counts the reduction of individuals’ consumption as a consequence of fear of violence. Based on a conservative average of existing studies and Gallup World Poll data on fear.
2. Crime and interpersonal violence
68GLOBAL PEACE INDEX 2015 | Global Economic Value of Peace
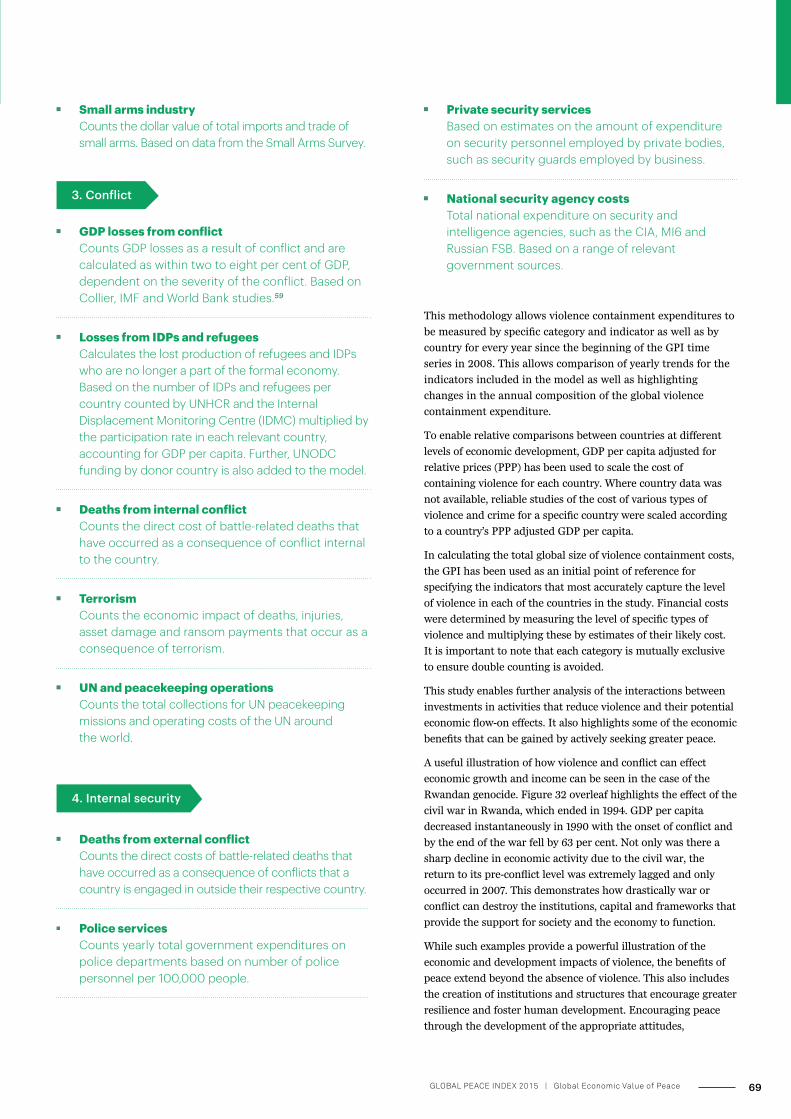
Small arms industry Counts the dollar value of total imports and trade of small arms. Based on data from the Small Arms Survey.
4. Internal security
Private security services Based on estimates on the amount of expenditure on security personnel employed by private bodies, such as security guards employed by business.
National security agency costs Total national expenditure on security and intelligence agencies, such as the CIA, MI6 and Russian FSB. Based on a range of relevant government sources.
This methodology allows violence containment expenditures to
be measured by specific category and indicator as well as by
country for every year since the beginning of the GPI time
series in 2008. This allows comparison of yearly trends for the
indicators included in the model as well as highlighting
changes in the annual composition of the global violence
containment expenditure.
To enable relative comparisons between countries at different
levels of economic development, GDP per capita adjusted for
relative prices (PPP) has been used to scale the cost of
containing violence for each country. Where country data was
not available, reliable studies of the cost of various types of
violence and crime for a specific country were scaled according
to a country’s PPP adjusted GDP per capita.
In calculating the total global size of violence containment costs,
the GPI has been used as an initial point of reference for
specifying the indicators that most accurately capture the level
of violence in each of the countries in the study. Financial costs
were determined by measuring the level of specific types of
violence and multiplying these by estimates of their likely cost.
It is important to note that each category is mutually exclusive
to ensure double counting is avoided.
This study enables further analysis of the interactions between
investments in activities that reduce violence and their potential
economic flow-on effects. It also highlights some of the economic
benefits that can be gained by actively seeking greater peace.
A useful illustration of how violence and conflict can effect
economic growth and income can be seen in the case of the
Rwandan genocide. Figure 32 overleaf highlights the effect of the
civil war in Rwanda, which ended in 1994. GDP per capita
decreased instantaneously in 1990 with the onset of conflict and
by the end of the war fell by 63 per cent. Not only was there a
sharp decline in economic activity due to the civil war, the
return to its pre-conflict level was extremely lagged and only
occurred in 2007. This demonstrates how drastically war or
conflict can destroy the institutions, capital and frameworks that
provide the support for society and the economy to function.
While such examples provide a powerful illustration of the
economic and development impacts of violence, the benefits of
peace extend beyond the absence of violence. This also includes
the creation of institutions and structures that encourage greater
resilience and foster human development. Encouraging peace
through the development of the appropriate attitudes,
3. Conflict
Deaths from external conflict Counts the direct costs of battle-related deaths that have occurred as a consequence of conflicts that a country is engaged in outside their respective country.
Police services Counts yearly total government expenditures on police departments based on number of police personnel per 100,000 people.
GDP losses from conflict Counts GDP losses as a result of conflict and are calculated as within two to eight per cent of GDP, dependent on the severity of the conflict. Based on Collier, IMF and World Bank studies.59
Losses from IDPs and refugees Calculates the lost production of refugees and IDPs who are no longer a part of the formal economy. Based on the number of IDPs and refugees per country counted by UNHCR and the Internal Displacement Monitoring Centre (IDMC) multiplied by the participation rate in each relevant country, accounting for GDP per capita. Further, UNODC funding by donor country is also added to the model.
Deaths from internal conflict Counts the direct cost of battle-related deaths that have occurred as a consequence of conflict internal to the country.
Terrorism Counts the economic impact of deaths, injuries, asset damage and ransom payments that occur as a consequence of terrorism.
UN and peacekeeping operations Counts the total collections for UN peacekeeping missions and operating costs of the UN around the world.
69GLOBAL PEACE INDEX 2015 | Global Economic Value of Peace
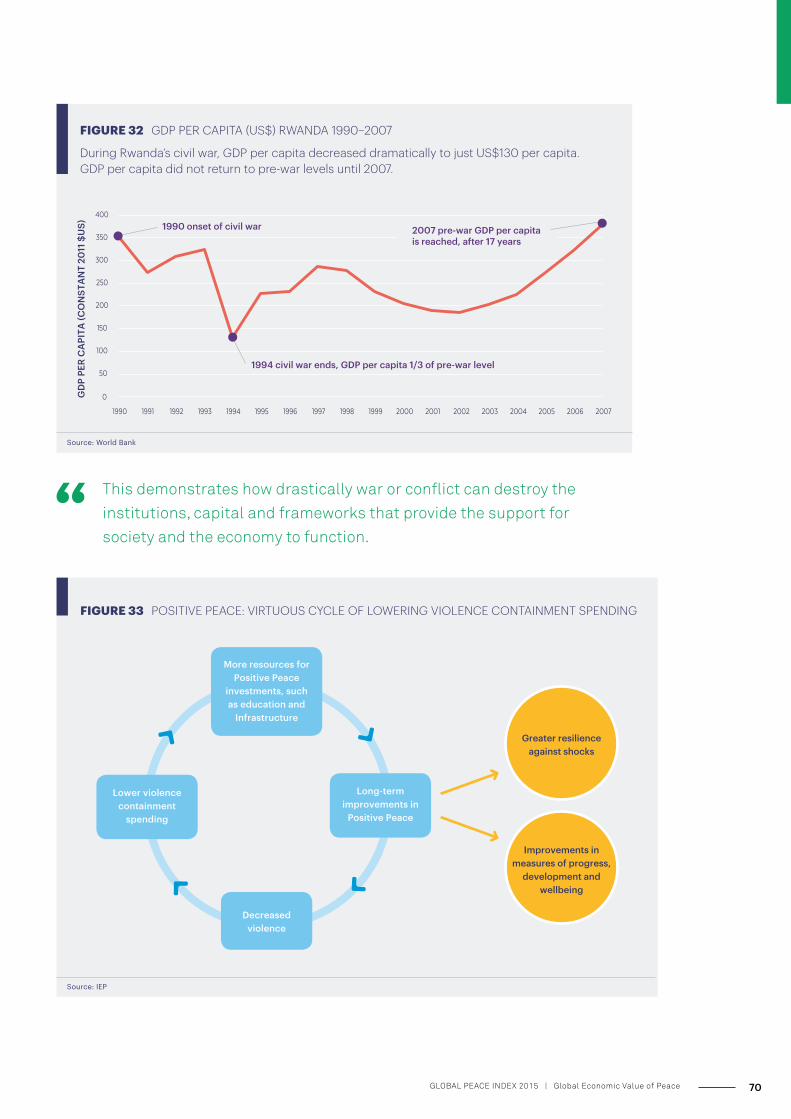
0
50
100
150
200
250
300
350
400
1990 1991 1992 1993 1994 1995 1996 1997 1998 1999 2000 2001 2002 2003 2004 2005 2006 2007
GD
P PE
R C
API
TA (C
ON
STA
NT
2011
$U
S)
1990 onset of civil war 2007 pre-war GDP per capita is reached, after 17 years
1994 civil war ends, GDP per capita 1/3 of pre-war level
FIGURE 32 GDP PER CAPITA (US$) RWANDA 1990–2007
During Rwanda’s civil war, GDP per capita decreased dramatically to just US$130 per capita. GDP per capita did not return to pre-war levels until 2007.
Source: World Bank
This demonstrates how drastically war or conflict can destroy the institutions, capital and frameworks that provide the support for society and the economy to function.
More resources for Positive Peace
investments, such as education and
Infrastructure
Decreased violence
Long-term improvements in
Positive Peace
Lower violence containment
spending
Improvements in measures of progress,
development and wellbeing
Greater resilience against shocks
Source: IEP
FIGURE 33 POSITIVE PEACE: VIRTUOUS CYCLE OF LOWERING VIOLENCE CONTAINMENT SPENDING
70GLOBAL PEACE INDEX 2015 | Global Economic Value of Peace
The multiplier effect is a commonly used concept in economics that describes the extent to which redirected expenditure has positive flow-on impacts on the wider economy. Every time there is an injection of new income into an economy this will lead to more spending which will, in turn, create employment, further income and additional spending. This mutually reinforcing economic cycle is why one dollar of expenditure can create more than one dollar of economic activity.
Although the exact magnitude of this effect is difficult to measure, it is likely to be particularly high in the case of violence containment expenditure, as individuals would spend less time and resources protecting themselves against violence and contribute more to the wider economy as a consequence of lower levels of injury and death. Because of this decrease in violence, there are likely to be substantial flow-on effects for the wider economy, as money is diverted towards more productive areas such as health, education and infrastructure. For this reason, IEP uses the concept of a ‘peace multiplier’ which, in addition to the economic multiplier, incorporates the more productive use of resources. For instance, when a homicide is avoided, the direct costs, such as the money spent on medical treatment and a funeral could be spent elsewhere. Furthermore, in avoiding a death
BOX 4 THE MULTIPLIER EFFECT
the economy also stands to gain the lost lifetime income of the victim. The economic benefits from greater peace can therefore be significant. This was also noted by Brauer and Marlin (2009) who argued that violence or the fear of violence may result in some activity not occurring at all, thereby stunting economic activity.60
For example, a study looking at the effect of terrorism in Spain estimated that each transnational terrorism incident from the years 1970-91 was estimated to dissuade 140,000 tourists.61 This had the effect of decreasing large amounts of revenue from tourist expenditure and flow-on effects within the local economy. Consequently, with greater levels of violence it is likely that we would expect lower levels of employment and economic productivity over the long-term, as the incentives faced discourage new employment creation and longer-term investment.62
This study assumes that the peace multiplier approaches two, signifying that for every dollar saved on violence containment, there will be an additional dollar of economic activity. This is a relatively conservative multiplier and broadly in line with the established literature.
By understanding the social and economic drivers of violence, policymakers and business leaders can better understand the costs and benefits of particular social and economic investment programs.
Furthermore, by directing resources towards addressing the root causes of violence, society can begin to make long-term investments in the creation of a virtuous cycle of peace and economic prosperity.
institutions and structures which create and sustain peaceful
societies both reduces violence containment expenditure and
supports the optimum environment for human potential to
flourish. This is known as Positive Peace.
By understanding the social and economic drivers of violence,
policymakers and business leaders can better understand the
costs and benefits of particular social and economic investment
programs. Furthermore, by directing resources towards
addressing the root causes of violence, society can begin to make
long-term investments in the creation of a virtuous cycle of
peace and economic prosperity.
71GLOBAL PEACE INDEX 2015 | Global Economic Value of Peace
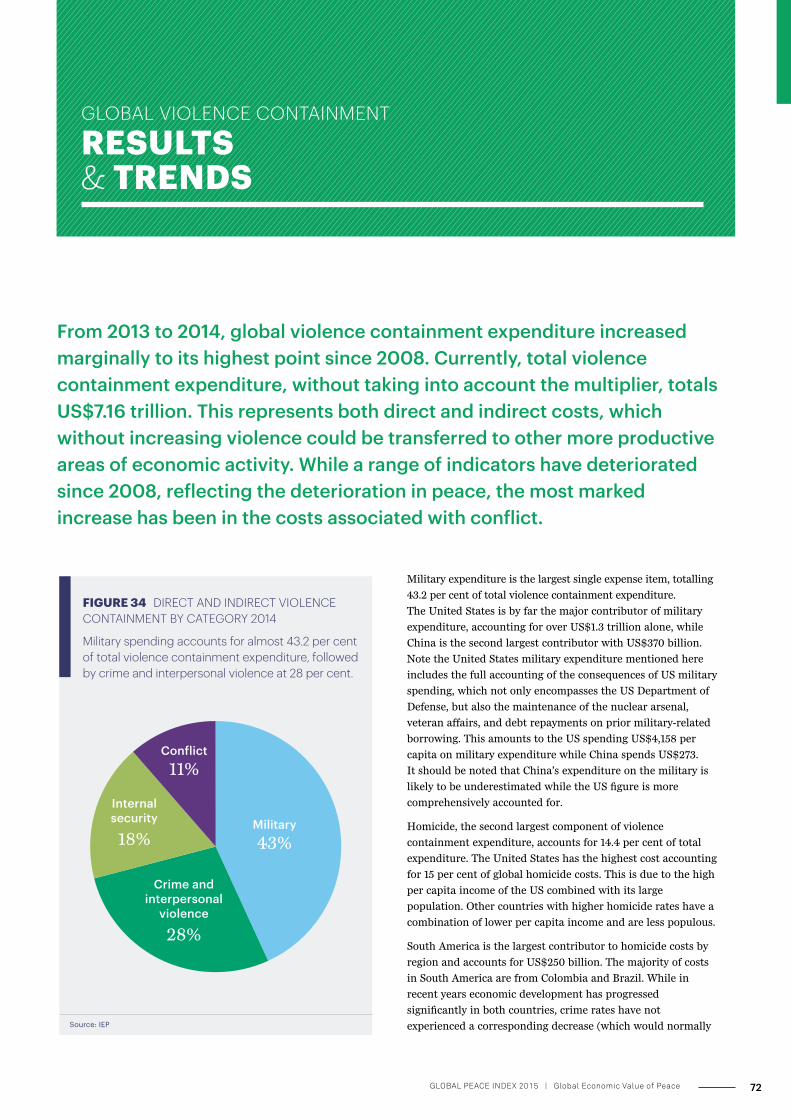
GLOBAL VIOLENCE CONTAINMENT RESULTS & TRENDS
From 2013 to 2014, global violence containment expenditure increased marginally to its highest point since 2008. Currently, total violence containment expenditure, without taking into account the multiplier, totals US$7.16 trillion. This represents both direct and indirect costs, which without increasing violence could be transferred to other more productive areas of economic activity. While a range of indicators have deteriorated since 2008, reflecting the deterioration in peace, the most marked increase has been in the costs associated with conflict.
Conflict11%
Crime and interpersonal
violence
28%
Internalsecurity
18%Military43%
FIGURE 34 DIRECT AND INDIRECT VIOLENCE CONTAINMENT BY CATEGORY 2014
Military spending accounts for almost 43.2 per cent of total violence containment expenditure, followed by crime and interpersonal violence at 28 per cent.
Source: IEP
Military expenditure is the largest single expense item, totalling
43.2 per cent of total violence containment expenditure.
The United States is by far the major contributor of military
expenditure, accounting for over US$1.3 trillion alone, while
China is the second largest contributor with US$370 billion.
Note the United States military expenditure mentioned here
includes the full accounting of the consequences of US military
spending, which not only encompasses the US Department of
Defense, but also the maintenance of the nuclear arsenal,
veteran affairs, and debt repayments on prior military-related
borrowing. This amounts to the US spending US$4,158 per
capita on military expenditure while China spends US$273.
It should be noted that China’s expenditure on the military is
likely to be underestimated while the US figure is more
comprehensively accounted for.
Homicide, the second largest component of violence
containment expenditure, accounts for 14.4 per cent of total
expenditure. The United States has the highest cost accounting
for 15 per cent of global homicide costs. This is due to the high
per capita income of the US combined with its large
population. Other countries with higher homicide rates have a
combination of lower per capita income and are less populous.
South America is the largest contributor to homicide costs by
region and accounts for US$250 billion. The majority of costs
in South America are from Colombia and Brazil. While in
recent years economic development has progressed
significantly in both countries, crime rates have not
experienced a corresponding decrease (which would normally
72GLOBAL PEACE INDEX 2015 | Global Economic Value of Peace
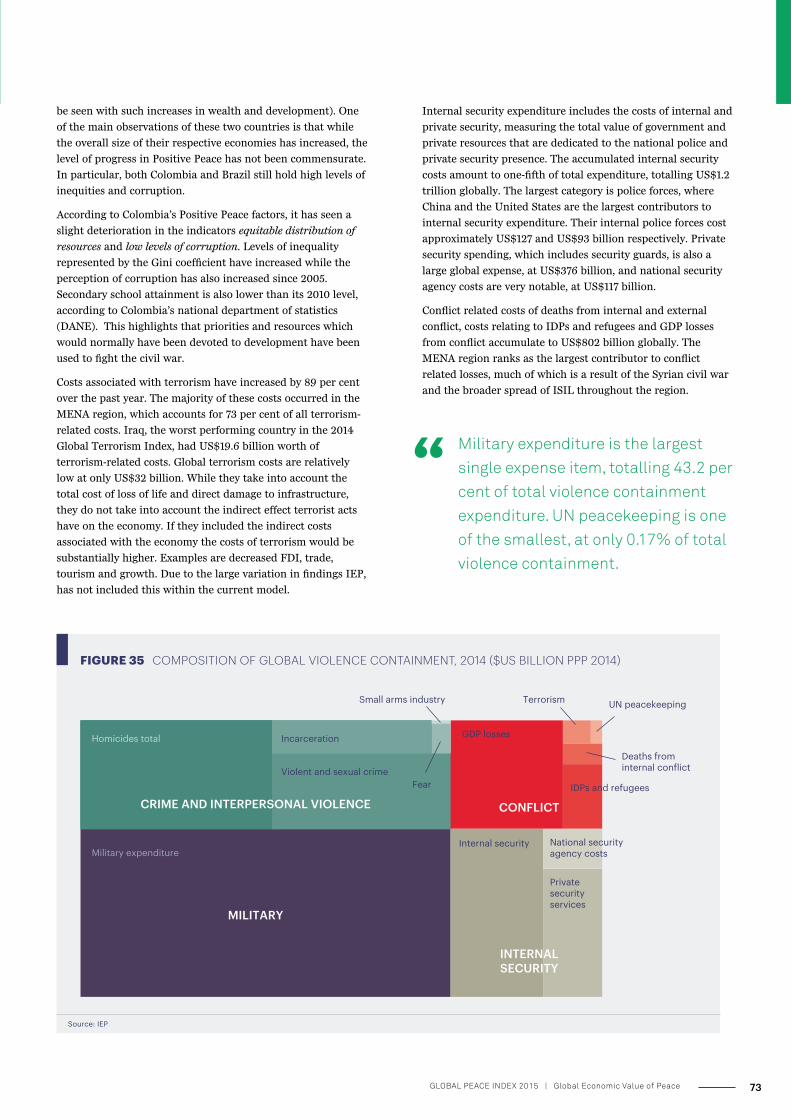
be seen with such increases in wealth and development). One
of the main observations of these two countries is that while
the overall size of their respective economies has increased, the
level of progress in Positive Peace has not been commensurate.
In particular, both Colombia and Brazil still hold high levels of
inequities and corruption.
According to Colombia’s Positive Peace factors, it has seen a
slight deterioration in the indicators equitable distribution of
resources and low levels of corruption. Levels of inequality
represented by the Gini coefficient have increased while the
perception of corruption has also increased since 2005.
Secondary school attainment is also lower than its 2010 level,
according to Colombia’s national department of statistics
(DANE). This highlights that priorities and resources which
would normally have been devoted to development have been
used to fight the civil war.
Costs associated with terrorism have increased by 89 per cent
over the past year. The majority of these costs occurred in the
MENA region, which accounts for 73 per cent of all terrorism-
related costs. Iraq, the worst performing country in the 2014
Global Terrorism Index, had US$19.6 billion worth of
terrorism-related costs. Global terrorism costs are relatively
low at only US$32 billion. While they take into account the
total cost of loss of life and direct damage to infrastructure,
they do not take into account the indirect effect terrorist acts
have on the economy. If they included the indirect costs
associated with the economy the costs of terrorism would be
substantially higher. Examples are decreased FDI, trade,
tourism and growth. Due to the large variation in findings IEP,
has not included this within the current model.
Internal security expenditure includes the costs of internal and
private security, measuring the total value of government and
private resources that are dedicated to the national police and
private security presence. The accumulated internal security
costs amount to one-fifth of total expenditure, totalling US$1.2
trillion globally. The largest category is police forces, where
China and the United States are the largest contributors to
internal security expenditure. Their internal police forces cost
approximately US$127 and US$93 billion respectively. Private
security spending, which includes security guards, is also a
large global expense, at US$376 billion, and national security
agency costs are very notable, at US$117 billion.
Conflict related costs of deaths from internal and external
conflict, costs relating to IDPs and refugees and GDP losses
from conflict accumulate to US$802 billion globally. The
MENA region ranks as the largest contributor to conflict
related losses, much of which is a result of the Syrian civil war
and the broader spread of ISIL throughout the region.
Military expenditure is the largest single expense item, totalling 43.2 per cent of total violence containment expenditure. UN peacekeeping is one of the smallest, at only 0.17% of total violence containment.
Source: IEP
FIGURE 35 COMPOSITION OF GLOBAL VIOLENCE CONTAINMENT, 2014 ($US BILLION PPP 2014)
MILITARY
Military expenditure
CRIME AND INTERPERSONAL VIOLENCE CONFLICT
INTERNALSECURITY
Homicides total
Internal security
GDP losses
UN peacekeepingTerrorism
IDPs and refugees
Deaths from internal conflict
Private security services
National security agency costs
Incarceration
Violent and sexual crimeFear
Small arms industry
73GLOBAL PEACE INDEX 2015 | Global Economic Value of Peace
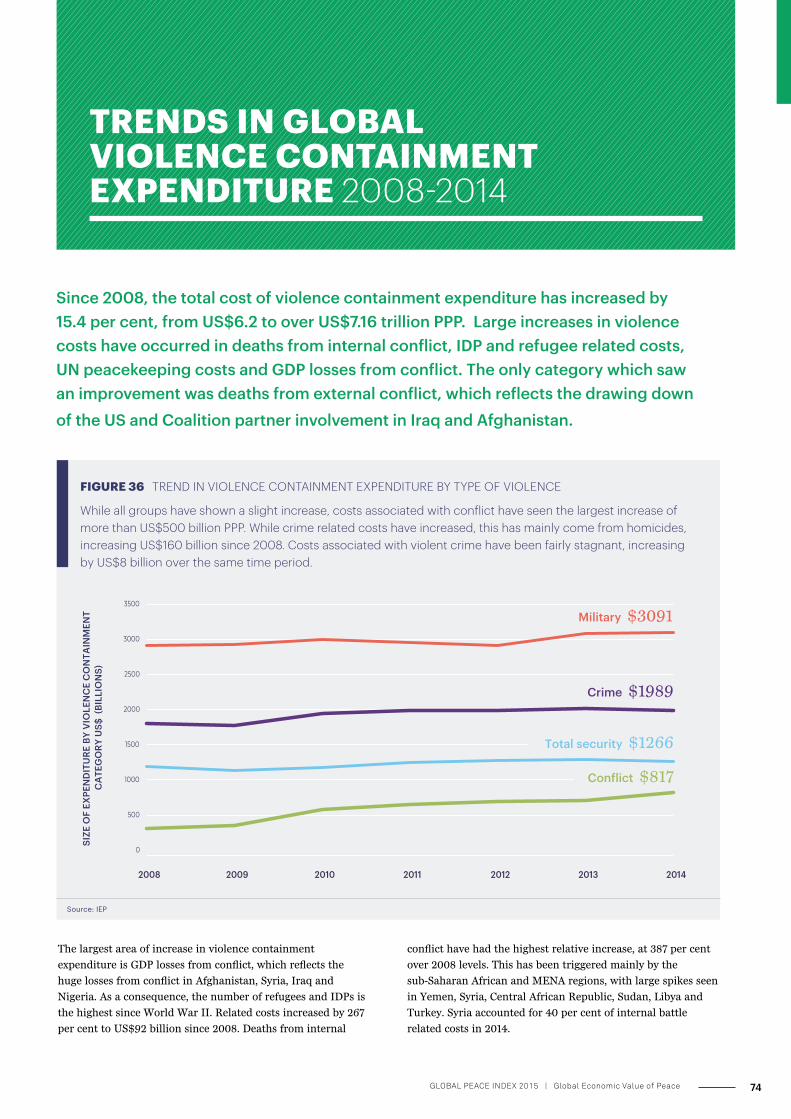
TRENDS IN GLOBAL VIOLENCE CONTAINMENT EXPENDITURE 2008-2014
Since 2008, the total cost of violence containment expenditure has increased by 15.4 per cent, from US$6.2 to over US$7.16 trillion PPP. Large increases in violence costs have occurred in deaths from internal conflict, IDP and refugee related costs, UN peacekeeping costs and GDP losses from conflict. The only category which saw an improvement was deaths from external conflict, which reflects the drawing down of the US and Coalition partner involvement in Iraq and Afghanistan.
FIGURE 36 TREND IN VIOLENCE CONTAINMENT EXPENDITURE BY TYPE OF VIOLENCE
While all groups have shown a slight increase, costs associated with conflict have seen the largest increase of more than US$500 billion PPP. While crime related costs have increased, this has mainly come from homicides, increasing US$160 billion since 2008. Costs associated with violent crime have been fairly stagnant, increasing by US$8 billion over the same time period.
Source: IEP
SIZE
OF
EXPE
ND
ITU
RE B
Y V
IOLE
NC
E C
ON
TAIN
MEN
T C
ATE
GO
RY U
S$ (
BILL
ION
S)
0
500
1000
1500
2000
2500
3000
3500
2008 2009 2010 2011 2012 2013 2014
Military $3091
Crime $1989
Total security $1266
Conflict $817
The largest area of increase in violence containment
expenditure is GDP losses from conflict, which reflects the
huge losses from conflict in Afghanistan, Syria, Iraq and
Nigeria. As a consequence, the number of refugees and IDPs is
the highest since World War II. Related costs increased by 267
per cent to US$92 billion since 2008. Deaths from internal
conflict have had the highest relative increase, at 387 per cent
over 2008 levels. This has been triggered mainly by the
sub-Saharan African and MENA regions, with large spikes seen
in Yemen, Syria, Central African Republic, Sudan, Libya and
Turkey. Syria accounted for 40 per cent of internal battle
related costs in 2014.
74GLOBAL PEACE INDEX 2015 | Global Economic Value of Peace
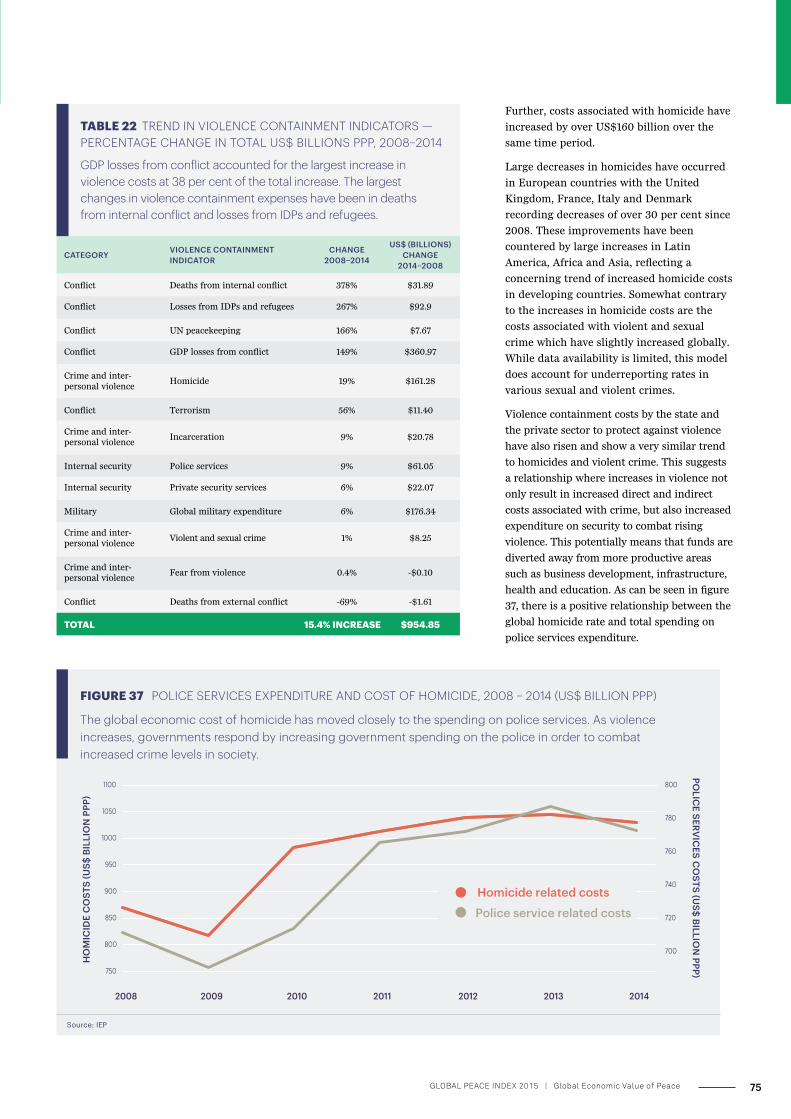
CATEGORY VIOLENCE CONTAINMENT INDICATOR
CHANGE 2008–2014
US$ (BILLIONS) CHANGE
2014–2008
Conflict Deaths from internal conflict 378% $31.89
Conflict Losses from IDPs and refugees 267% $92.9
Conflict UN peacekeeping 166% $7.67
Conflict GDP losses from conflict 149% $360.97
Crime and inter-personal violence
Homicide 19% $161.28
Conflict Terrorism 56% $11.40
Crime and inter-personal violence
Incarceration 9% $20.78
Internal security Police services 9% $61.05
Internal security Private security services 6% $22.07
Military Global military expenditure 6% $176.34
Crime and inter-personal violence
Violent and sexual crime 1% $8.25
Crime and inter-personal violence
Fear from violence 0.4% -$0.10
Conflict Deaths from external conflict -69% -$1.61
TOTAL 15.4% INCREASE $954.85
TABLE 22 TREND IN VIOLENCE CONTAINMENT INDICATORS — PERCENTAGE CHANGE IN TOTAL US$ BILLIONS PPP, 2008–2014
GDP losses from conflict accounted for the largest increase in violence costs at 38 per cent of the total increase. The largest changes in violence containment expenses have been in deaths from internal conflict and losses from IDPs and refugees.
Further, costs associated with homicide have
increased by over US$160 billion over the
same time period.
Large decreases in homicides have occurred
in European countries with the United
Kingdom, France, Italy and Denmark
recording decreases of over 30 per cent since
2008. These improvements have been
countered by large increases in Latin
America, Africa and Asia, reflecting a
concerning trend of increased homicide costs
in developing countries. Somewhat contrary
to the increases in homicide costs are the
costs associated with violent and sexual
crime which have slightly increased globally.
While data availability is limited, this model
does account for underreporting rates in
various sexual and violent crimes.
Violence containment costs by the state and
the private sector to protect against violence
have also risen and show a very similar trend
to homicides and violent crime. This suggests
a relationship where increases in violence not
only result in increased direct and indirect
costs associated with crime, but also increased
expenditure on security to combat rising
violence. This potentially means that funds are
diverted away from more productive areas
such as business development, infrastructure,
health and education. As can be seen in figure
37, there is a positive relationship between the
global homicide rate and total spending on
police services expenditure.
Source: IEP
FIGURE 37 POLICE SERVICES EXPENDITURE AND COST OF HOMICIDE, 2008 – 2014 (US$ BILLION PPP)
The global economic cost of homicide has moved closely to the spending on police services. As violence increases, governments respond by increasing government spending on the police in order to combat increased crime levels in society.
700
720
740
760
780
800
750
800
850
900
950
1000
1050
1100
2008 2009 2010 2011 2012 2013 2014
HO
MIC
IDE
CO
STS
(US$
BIL
LIO
N P
PP)
POLIC
E SERVIC
ES CO
STS (US$ BILLIO
N PPP)
Homicide related costs
Police service related costs
75GLOBAL PEACE INDEX 2015 | Global Economic Value of Peace
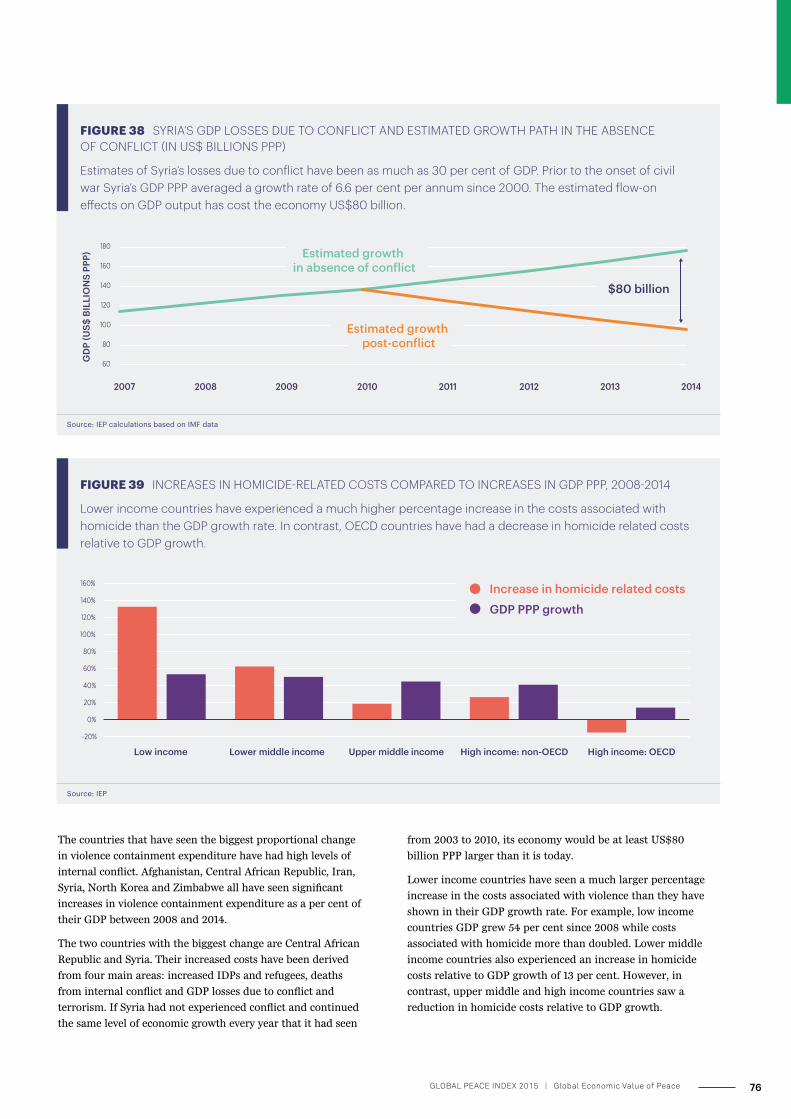
FIGURE 39 INCREASES IN HOMICIDE-RELATED COSTS COMPARED TO INCREASES IN GDP PPP, 2008-2014
Lower income countries have experienced a much higher percentage increase in the costs associated with homicide than the GDP growth rate. In contrast, OECD countries have had a decrease in homicide related costs relative to GDP growth.
Source: IEP
-20%
0%
20%
40%
60%
80%
100%
120%
140%
160%
Low income Lower middle income Upper middle income High income: non-OECD High income: OECD
Increase in homicide related costs
GDP PPP growth
FIGURE 38 SYRIA’S GDP LOSSES DUE TO CONFLICT AND ESTIMATED GROWTH PATH IN THE ABSENCE OF CONFLICT (IN US$ BILLIONS PPP)
Estimates of Syria’s losses due to conflict have been as much as 30 per cent of GDP. Prior to the onset of civil war Syria’s GDP PPP averaged a growth rate of 6.6 per cent per annum since 2000. The estimated flow-on e�ects on GDP output has cost the economy US$80 billion.
Source: IEP calculations based on IMF data
GD
P (U
S$ B
ILLI
ON
S PP
P)
60
80
100
120
140
160
180
2007 2008 2009 2010 2011 2012 2013 2014
Estimated growth in absence of conflict
Estimated growth post-conflict
$80 billion
The countries that have seen the biggest proportional change
in violence containment expenditure have had high levels of
internal conflict. Afghanistan, Central African Republic, Iran,
Syria, North Korea and Zimbabwe all have seen significant
increases in violence containment expenditure as a per cent of
their GDP between 2008 and 2014.
The two countries with the biggest change are Central African
Republic and Syria. Their increased costs have been derived
from four main areas: increased IDPs and refugees, deaths
from internal conflict and GDP losses due to conflict and
terrorism. If Syria had not experienced conflict and continued
the same level of economic growth every year that it had seen
from 2003 to 2010, its economy would be at least US$80
billion PPP larger than it is today.
Lower income countries have seen a much larger percentage
increase in the costs associated with violence than they have
shown in their GDP growth rate. For example, low income
countries GDP grew 54 per cent since 2008 while costs
associated with homicide more than doubled. Lower middle
income countries also experienced an increase in homicide
costs relative to GDP growth of 13 per cent. However, in
contrast, upper middle and high income countries saw a
reduction in homicide costs relative to GDP growth.
76GLOBAL PEACE INDEX 2015 | Global Economic Value of Peace
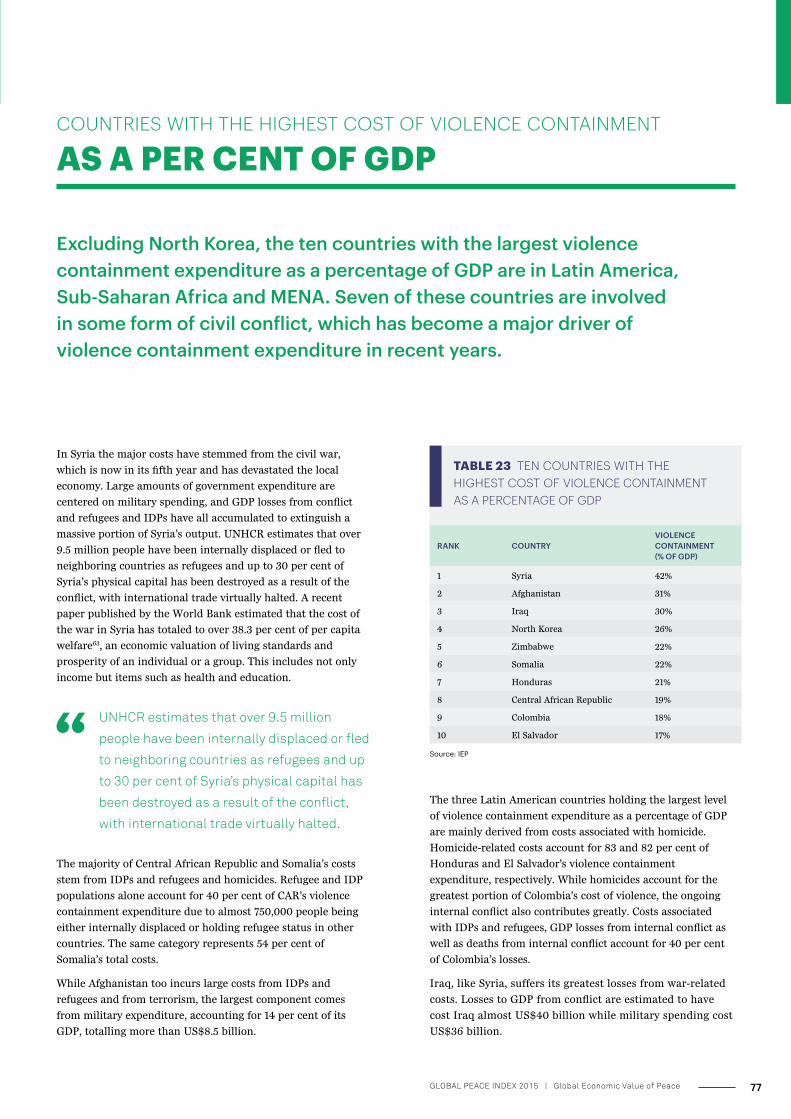
Excluding North Korea, the ten countries with the largest violence containment expenditure as a percentage of GDP are in Latin America, Sub-Saharan Africa and MENA. Seven of these countries are involved in some form of civil conflict, which has become a major driver of violence containment expenditure in recent years.
In Syria the major costs have stemmed from the civil war,
which is now in its fifth year and has devastated the local
economy. Large amounts of government expenditure are
centered on military spending, and GDP losses from conflict
and refugees and IDPs have all accumulated to extinguish a
massive portion of Syria’s output. UNHCR estimates that over
9.5 million people have been internally displaced or fled to
neighboring countries as refugees and up to 30 per cent of
Syria’s physical capital has been destroyed as a result of the
conflict, with international trade virtually halted. A recent
paper published by the World Bank estimated that the cost of
the war in Syria has totaled to over 38.3 per cent of per capita
welfare63, an economic valuation of living standards and
prosperity of an individual or a group. This includes not only
income but items such as health and education.
RANK COUNTRYVIOLENCE CONTAINMENT (% OF GDP)
1 Syria 42%
2 Afghanistan 31%
3 Iraq 30%
4 North Korea 26%
5 Zimbabwe 22%
6 Somalia 22%
7 Honduras 21%
8 Central African Republic 19%
9 Colombia 18%
10 El Salvador 17%
Source: IEP
TABLE 23 TEN COUNTRIES WITH THE HIGHEST COST OF VIOLENCE CONTAINMENT AS A PERCENTAGE OF GDP
COUNTRIES WITH THE HIGHEST COST OF VIOLENCE CONTAINMENT AS A PER CENT OF GDP
UNHCR estimates that over 9.5 million
people have been internally displaced or fled
to neighboring countries as refugees and up
to 30 per cent of Syria’s physical capital has
been destroyed as a result of the conflict,
with international trade virtually halted.
The three Latin American countries holding the largest level
of violence containment expenditure as a percentage of GDP
are mainly derived from costs associated with homicide.
Homicide-related costs account for 83 and 82 per cent of
Honduras and El Salvador’s violence containment
expenditure, respectively. While homicides account for the
greatest portion of Colombia’s cost of violence, the ongoing
internal conflict also contributes greatly. Costs associated
with IDPs and refugees, GDP losses from internal conflict as
well as deaths from internal conflict account for 40 per cent
of Colombia’s losses.
Iraq, like Syria, suffers its greatest losses from war-related
costs. Losses to GDP from conflict are estimated to have
cost Iraq almost US$40 billion while military spending cost
US$36 billion.
The majority of Central African Republic and Somalia’s costs
stem from IDPs and refugees and homicides. Refugee and IDP
populations alone account for 40 per cent of CAR’s violence
containment expenditure due to almost 750,000 people being
either internally displaced or holding refugee status in other
countries. The same category represents 54 per cent of
Somalia’s total costs.
While Afghanistan too incurs large costs from IDPs and
refugees and from terrorism, the largest component comes
from military expenditure, accounting for 14 per cent of its
GDP, totalling more than US$8.5 billion.
77GLOBAL PEACE INDEX 2015 | Global Economic Value of Peace
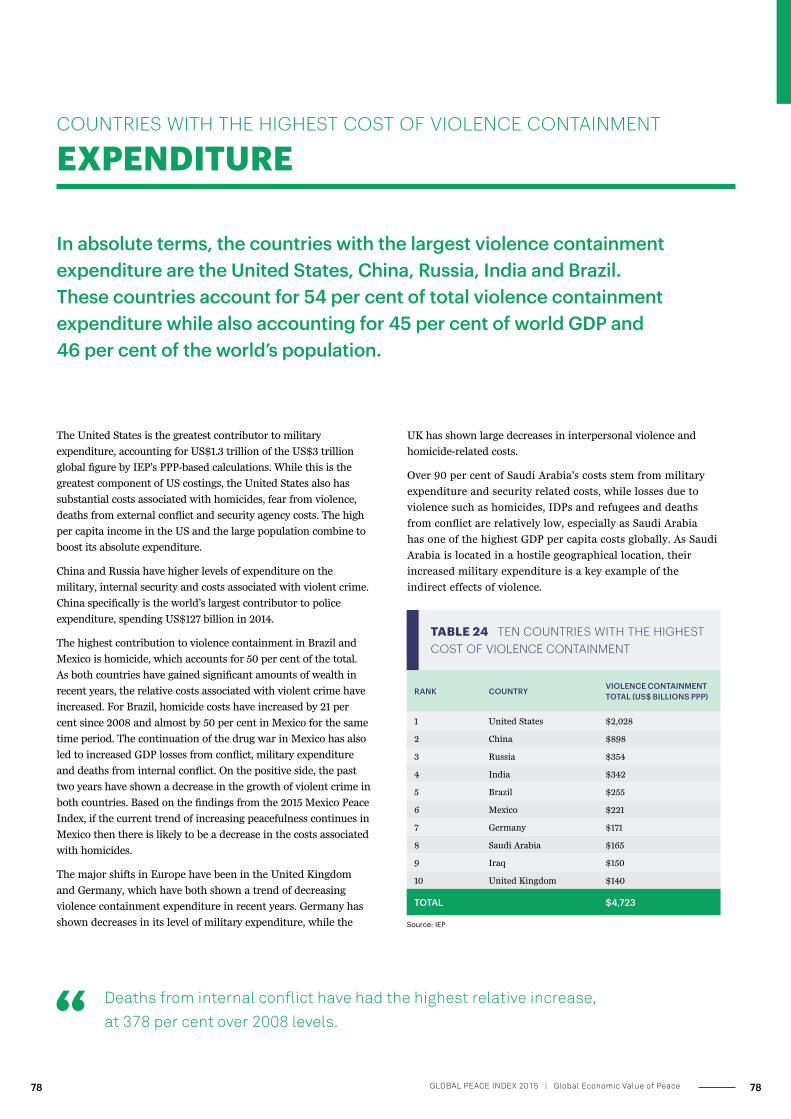
RANK COUNTRY VIOLENCE CONTAINMENT TOTAL (US$ BILLIONS PPP)
1 United States $2,028
2 China $898
3 Russia $354
4 India $342
5 Brazil $255
6 Mexico $221
7 Germany $171
8 Saudi Arabia $165
9 Iraq $150
10 United Kingdom $140
TOTAL $4,723
Source: IEP
TABLE 24 TEN COUNTRIES WITH THE HIGHEST COST OF VIOLENCE CONTAINMENT
The United States is the greatest contributor to military
expenditure, accounting for US$1.3 trillion of the US$3 trillion
global figure by IEP’s PPP-based calculations. While this is the
greatest component of US costings, the United States also has
substantial costs associated with homicides, fear from violence,
deaths from external conflict and security agency costs. The high
per capita income in the US and the large population combine to
boost its absolute expenditure.
China and Russia have higher levels of expenditure on the
military, internal security and costs associated with violent crime.
China specifically is the world’s largest contributor to police
expenditure, spending US$127 billion in 2014.
The highest contribution to violence containment in Brazil and
Mexico is homicide, which accounts for 50 per cent of the total.
As both countries have gained significant amounts of wealth in
recent years, the relative costs associated with violent crime have
increased. For Brazil, homicide costs have increased by 21 per
cent since 2008 and almost by 50 per cent in Mexico for the same
time period. The continuation of the drug war in Mexico has also
led to increased GDP losses from conflict, military expenditure
and deaths from internal conflict. On the positive side, the past
two years have shown a decrease in the growth of violent crime in
both countries. Based on the findings from the 2015 Mexico Peace
Index, if the current trend of increasing peacefulness continues in
Mexico then there is likely to be a decrease in the costs associated
with homicides.
The major shifts in Europe have been in the United Kingdom
and Germany, which have both shown a trend of decreasing
violence containment expenditure in recent years. Germany has
shown decreases in its level of military expenditure, while the
UK has shown large decreases in interpersonal violence and
homicide-related costs.
Over 90 per cent of Saudi Arabia’s costs stem from military
expenditure and security related costs, while losses due to
violence such as homicides, IDPs and refugees and deaths
from conflict are relatively low, especially as Saudi Arabia
has one of the highest GDP per capita costs globally. As Saudi
Arabia is located in a hostile geographical location, their
increased military expenditure is a key example of the
indirect effects of violence.
COUNTRIES WITH THE HIGHEST COST OF VIOLENCE CONTAINMENT EXPENDITURE
In absolute terms, the countries with the largest violence containment expenditure are the United States, China, Russia, India and Brazil. These countries account for 54 per cent of total violence containment expenditure while also accounting for 45 per cent of world GDP and 46 per cent of the world’s population.
Deaths from internal conflict have had the highest relative increase, at 378 per cent over 2008 levels.
78GLOBAL PEACE INDEX 2015 | Global Economic Value of Peace78
POSITIVE PEACE
79GLOBAL PEACE INDEX 2015
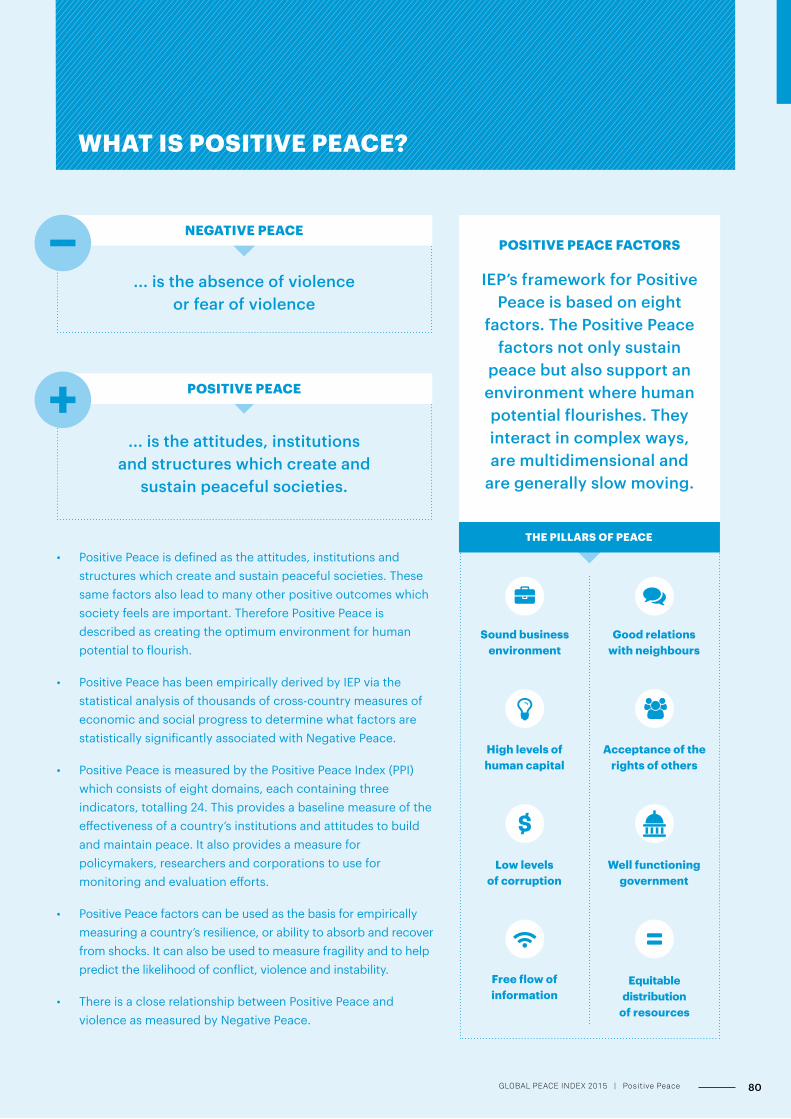
WHAT IS POSITIVE PEACE?
• Positive Peace is defined as the attitudes, institutions and structures which create and sustain peaceful societies. These same factors also lead to many other positive outcomes which society feels are important. Therefore Positive Peace is described as creating the optimum environment for human potential to flourish.
• Positive Peace has been empirically derived by IEP via the statistical analysis of thousands of cross-country measures of economic and social progress to determine what factors are statistically significantly associated with Negative Peace.
• Positive Peace is measured by the Positive Peace Index (PPI) which consists of eight domains, each containing three indicators, totalling 24. This provides a baseline measure of the effectiveness of a country’s institutions and attitudes to build and maintain peace. It also provides a measure for policymakers, researchers and corporations to use for monitoring and evaluation efforts.
• Positive Peace factors can be used as the basis for empirically measuring a country’s resilience, or ability to absorb and recover from shocks. It can also be used to measure fragility and to help predict the likelihood of conflict, violence and instability.
• There is a close relationship between Positive Peace and violence as measured by Negative Peace.
IEP’s framework for Positive Peace is based on eight
factors. The Positive Peace factors not only sustain
peace but also support an environment where human potential flourishes. They interact in complex ways, are multidimensional and
are generally slow moving.
POSITIVE PEACE
Sound business environment
High levels of human capital
Low levels of corruption
Free flow of information
Good relations with neighbours
Acceptance of the rights of others
Well functioning government
Equitable distribution
of resources
THE PILLARS OF PEACE
... is the absence of violence or fear of violence
... is the attitudes, institutions and structures which create and
sustain peaceful societies.
NEGATIVE PEACEPOSITIVE PEACE FACTORS
80GLOBAL PEACE INDEX 2015 | Positive Peace
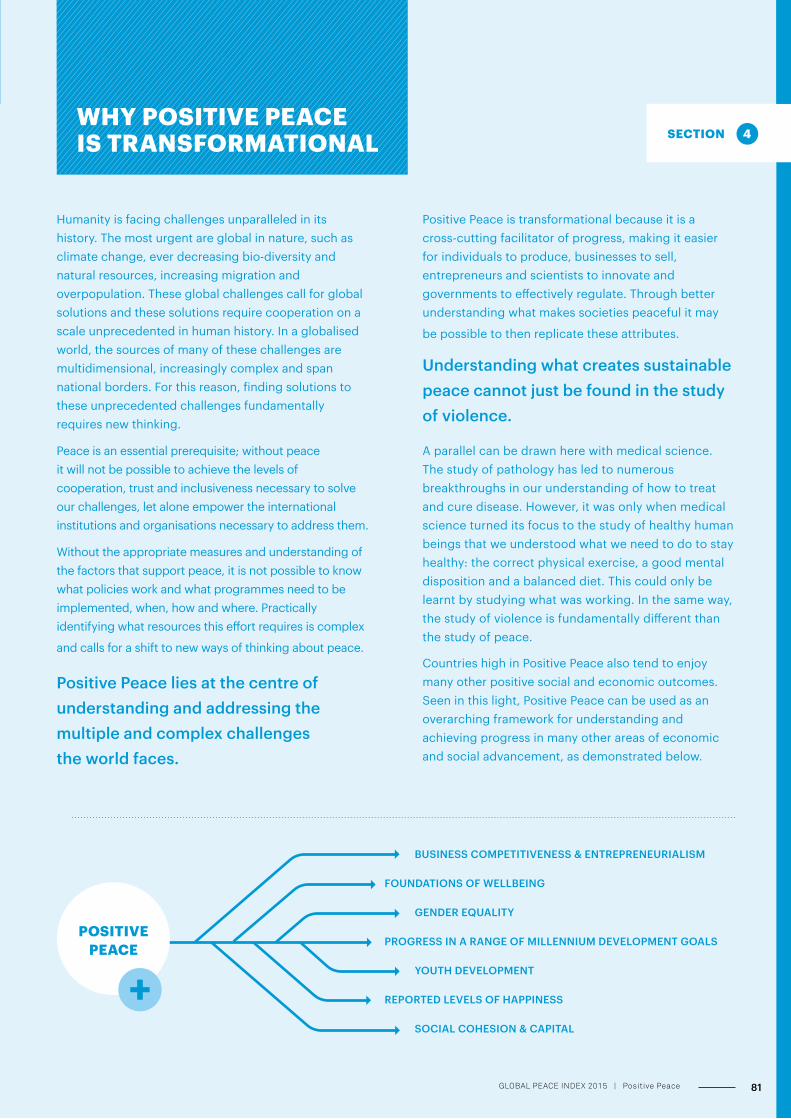
WHY POSITIVE PEACE IS TRANSFORMATIONAL
Humanity is facing challenges unparalleled in its history. The most urgent are global in nature, such as climate change, ever decreasing bio-diversity and natural resources, increasing migration and overpopulation. These global challenges call for global solutions and these solutions require cooperation on a scale unprecedented in human history. In a globalised world, the sources of many of these challenges are multidimensional, increasingly complex and span national borders. For this reason, finding solutions to these unprecedented challenges fundamentally requires new thinking.
Peace is an essential prerequisite; without peace it will not be possible to achieve the levels of cooperation, trust and inclusiveness necessary to solve our challenges, let alone empower the international institutions and organisations necessary to address them.
Without the appropriate measures and understanding of the factors that support peace, it is not possible to know what policies work and what programmes need to be implemented, when, how and where. Practically identifying what resources this effort requires is complex
and calls for a shift to new ways of thinking about peace.
Positive Peace lies at the centre of understanding and addressing the multiple and complex challenges the world faces.
Positive Peace is transformational because it is a cross-cutting facilitator of progress, making it easier for individuals to produce, businesses to sell, entrepreneurs and scientists to innovate and governments to effectively regulate. Through better understanding what makes societies peaceful it may
be possible to then replicate these attributes.
Understanding what creates sustainable peace cannot just be found in the study of violence.
A parallel can be drawn here with medical science. The study of pathology has led to numerous breakthroughs in our understanding of how to treat and cure disease. However, it was only when medical science turned its focus to the study of healthy human beings that we understood what we need to do to stay healthy: the correct physical exercise, a good mental disposition and a balanced diet. This could only be learnt by studying what was working. In the same way, the study of violence is fundamentally different than the study of peace.
Countries high in Positive Peace also tend to enjoy many other positive social and economic outcomes. Seen in this light, Positive Peace can be used as an overarching framework for understanding and achieving progress in many other areas of economic and social advancement, as demonstrated below.
POSITIVE PEACE
BUSINESS COMPETITIVENESS & ENTREPRENEURIALISM
FOUNDATIONS OF WELLBEING
GENDER EQUALITY
PROGRESS IN A RANGE OF MILLENNIUM DEVELOPMENT GOALS
YOUTH DEVELOPMENT
REPORTED LEVELS OF HAPPINESS
SOCIAL COHESION & CAPITAL
81GLOBAL PEACE INDEX 2015 | Positive Peace
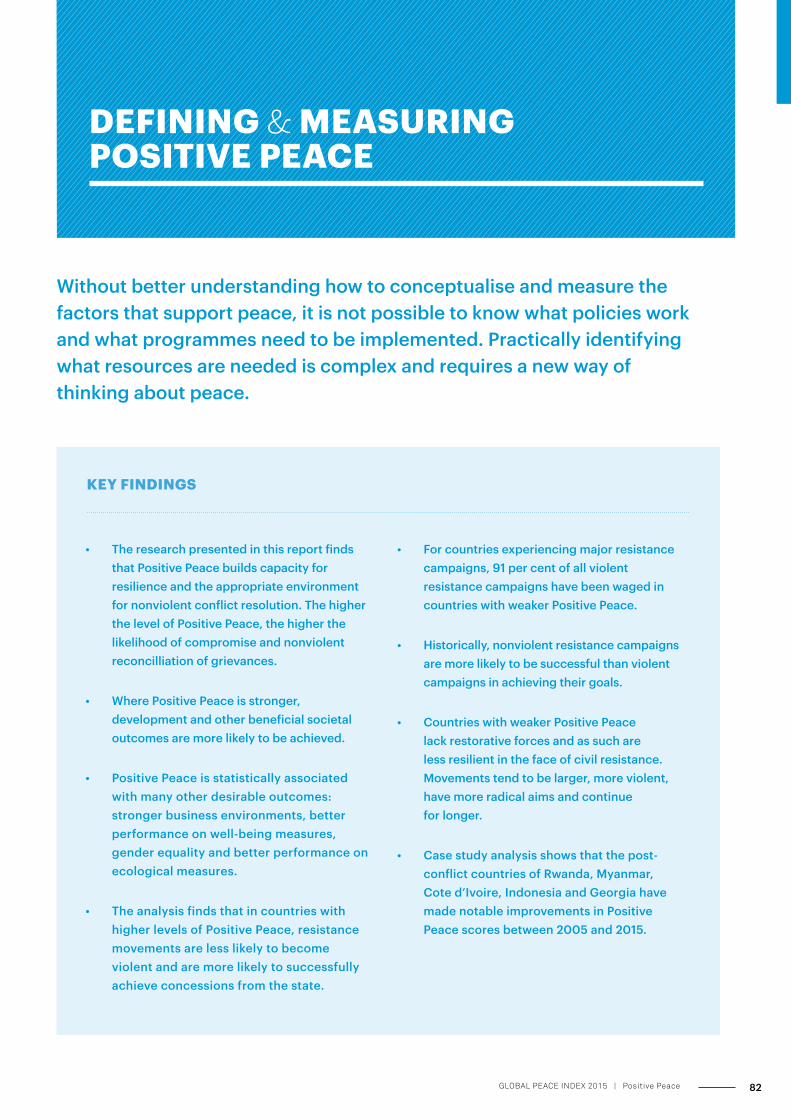
KEY FINDINGS
DEFINING & MEASURING POSITIVE PEACE
Without better understanding how to conceptualise and measure the factors that support peace, it is not possible to know what policies work and what programmes need to be implemented. Practically identifying what resources are needed is complex and requires a new way of thinking about peace.
• The research presented in this report finds that Positive Peace builds capacity for resilience and the appropriate environment for nonviolent conflict resolution. The higher the level of Positive Peace, the higher the likelihood of compromise and nonviolent reconcilliation of grievances.
• Where Positive Peace is stronger, development and other beneficial societal outcomes are more likely to be achieved.
• Positive Peace is statistically associated with many other desirable outcomes: stronger business environments, better performance on well-being measures, gender equality and better performance on ecological measures.
• The analysis finds that in countries with higher levels of Positive Peace, resistance movements are less likely to become violent and are more likely to successfully achieve concessions from the state.
• For countries experiencing major resistance campaigns, 91 per cent of all violent resistance campaigns have been waged in countries with weaker Positive Peace.
• Historically, nonviolent resistance campaigns are more likely to be successful than violent campaigns in achieving their goals.
• Countries with weaker Positive Peace lack restorative forces and as such are less resilient in the face of civil resistance. Movements tend to be larger, more violent, have more radical aims and continue for longer.
• Case study analysis shows that the post-conflict countries of Rwanda, Myanmar, Cote d’Ivoire, Indonesia and Georgia have made notable improvements in Positive Peace scores between 2005 and 2015.
82GLOBAL PEACE INDEX 2015 | Positive Peace
The analysis in this report is based on two simple but useful
definitions of peace, both of which have a long history in peace
studies — Negative Peace and Positive Peace. These two
commonly referred to types of peace were defined by one of the
founders of peace studies, Johan Galtung.
Negative Peace is the absence of violence or fear of violence –
an intuitive definition that many agree with and that can be
more easily measured than other definitions of peace. The
definition of Negative Peace is used to construct the GPI, which
is the main focus of this report. The 23 GPI indicators are
broken into two main domains: external peace and internal
peace. External peace measures how a country interacts with
other countries beyond its borders while internal peace
measures how peaceful it is within its borders.
A more ambitious conceptualisation of peace is Positive Peace,
which the IEP defines as the attitudes, institutions and
structures that create and sustain peaceful societies. These
same factors also create the underlying conditions to achieve
outcomes that many in society find desirable. Positive Peace
can therefore be understood as a process which underpins the
optimal environment for human potential to flourish. The
distinguishing feature of IEP’s work on Positive Peace is that it
has been empirically derived through statistical analysis. There
are few known empirical frameworks available to analyse
Positive Peace; historically it has largely been understood
qualitatively and largely subject to value judgment.
In order to address this gap, IEP utilised several years of GPI
data in combination with existing literature in peace and
development studies to statistically analyse what can be
learnt from the most peaceful countries in the GPI. The
practical starting point for this research is simply, ‘what do
the most peaceful countries in the GPI have that those at the
bottom don’t have?’ An important aspect of this approach is
to derive these factors not through value judgement but by
letting the statistical analysis, as best as possible, explain the
key drivers of peace.
This section introduces new thinking and evidence about
Positive Peace, is defined as the attitudes, institutions and
structures which create and sustain peaceful societies. These
same factors also lead to many other positive outcomes that
support the optimum environment for human potential
to flourish.
Understanding what prevents conflict and violence is one of
the key challenges for policymakers and practitioners working
in the fields of development and peacebuilding. It is equally
critical for business, as the economic cost of violence is
enormous. Even the small increases in violence and conflict
recorded by the Global Peace Index (GPI) over the last eight
years demonstrate how expensive this has been to the global
economy. The uptick in violence since 2008 has destroyed
hundreds of billions of dollars of economic opportunity and
capital and has also come with a huge human and social cost.
The shift in global development circles to understanding
fragility, resilience and peace is underscored by the potential
inclusion of peace and governance in the Sustainable
Development Goals (SDG). This is especially important as the
SDGs will replace the Millennium Development Goals after
2015. This reflects the growing recognition of the importance of
identifying the drivers of peace. However, in spite of this, there
is little prevailing guidance about how to conceptualise,
measure and ultimately support the key factors that develop
peace. The research presented in this report is aimed at helping
to address this need.
Without better understanding how to conceptualise and
measure the factors that support peace, it is not possible to
know what policies work and what programmes need to be
implemented, when, how and where. In addition, practically
identifying what resources are needed is complex and requires
a shift to a new way of thinking about what creates peace.
Positive Peace provides a framework for addressing many of
these conceptual and empirical challenges. It can advance
understanding about whether countries are moving towards
peace and away from violent conflict and whether they are
building resilience against future shocks or becoming resistant
to societal change.
The attitudes, institutions, and structures, or Positive Peace
factors, which build peace are complex, multidimensional,
non-linear in their progress, hard to observe and multi-causal
depending on their context.
This report identifies how systems thinking can be applied to
Positive Peace, what other indicators of progress are empirically
related to Positive Peace and how non-violence is closely related
to the factors of Positive Peace.
Both Negative and Positive Peace can be seen as the producer
and product of forms of societal trust and cohesion that are a
pre-requisite for well-functioning and prosperous societies.
Countries higher in Positive Peace also tend to have many other
fundamentally positive social and economic outcomes. Seen in
this light, Positive Peace can be used as an overarching
framework for understanding and measuring progress in many
other areas of economic and social advancement.
Furthermore, the Positive Peace framework presented here can
be used to measure other development frameworks adopted by
various multilateral organisations. Positive Peace can be used
to better understand:
• Resilience
• Fragility
• Institutional capacity and political economy
• Goal 16 of the Sustainable Development Goals
• Other developmental outcomes
• Country risk
83GLOBAL PEACE INDEX 2015 | Positive Peace
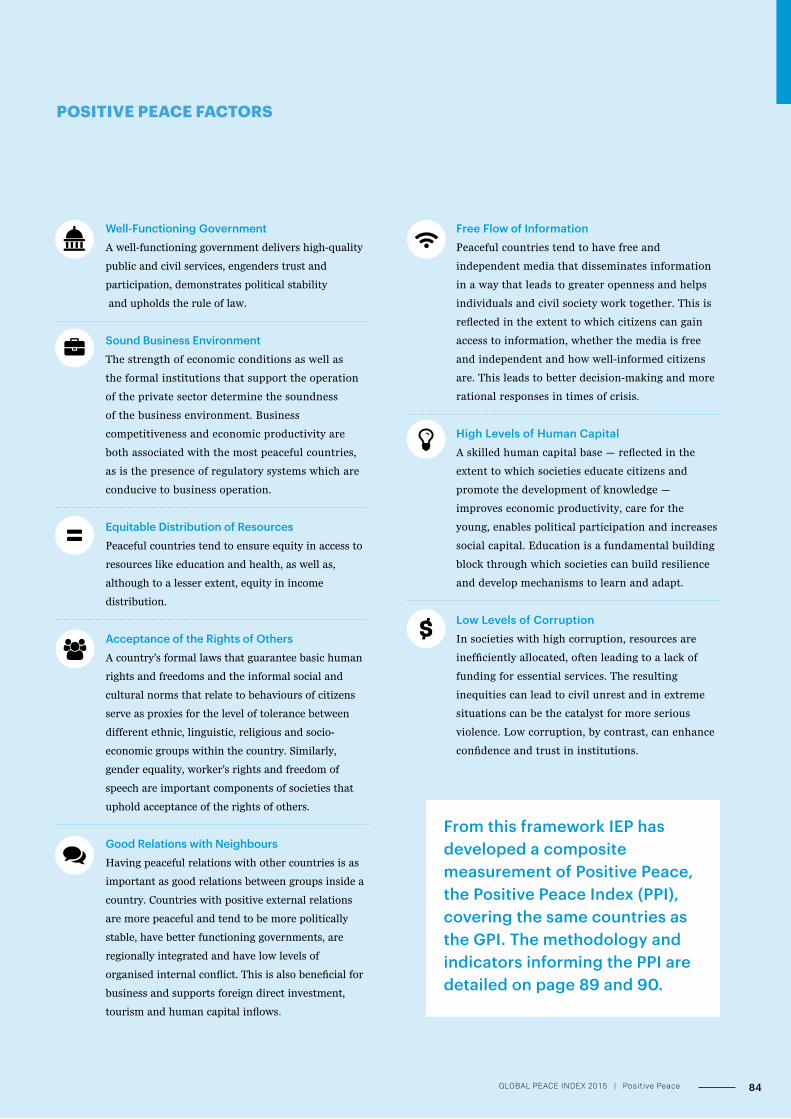
• Well-Functioning Government A well-functioning government delivers high-quality
public and civil services, engenders trust and
participation, demonstrates political stability
and upholds the rule of law.
• Sound Business Environment The strength of economic conditions as well as
the formal institutions that support the operation
of the private sector determine the soundness
of the business environment. Business
competitiveness and economic productivity are
both associated with the most peaceful countries,
as is the presence of regulatory systems which are
conducive to business operation.
• Equitable Distribution of Resources Peaceful countries tend to ensure equity in access to
resources like education and health, as well as,
although to a lesser extent, equity in income
distribution.
• Acceptance of the Rights of Others A country’s formal laws that guarantee basic human
rights and freedoms and the informal social and
cultural norms that relate to behaviours of citizens
serve as proxies for the level of tolerance between
different ethnic, linguistic, religious and socio-
economic groups within the country. Similarly,
gender equality, worker’s rights and freedom of
speech are important components of societies that
uphold acceptance of the rights of others.
• Good Relations with Neighbours Having peaceful relations with other countries is as
important as good relations between groups inside a
country. Countries with positive external relations
are more peaceful and tend to be more politically
stable, have better functioning governments, are
regionally integrated and have low levels of
organised internal conflict. This is also beneficial for
business and supports foreign direct investment,
tourism and human capital inflows.
• Free Flow of Information Peaceful countries tend to have free and
independent media that disseminates information
in a way that leads to greater openness and helps
individuals and civil society work together. This is
reflected in the extent to which citizens can gain
access to information, whether the media is free
and independent and how well-informed citizens
are. This leads to better decision-making and more
rational responses in times of crisis.
• High Levels of Human Capital A skilled human capital base — reflected in the
extent to which societies educate citizens and
promote the development of knowledge —
improves economic productivity, care for the
young, enables political participation and increases
social capital. Education is a fundamental building
block through which societies can build resilience
and develop mechanisms to learn and adapt.
• Low Levels of Corruption In societies with high corruption, resources are
inefficiently allocated, often leading to a lack of
funding for essential services. The resulting
inequities can lead to civil unrest and in extreme
situations can be the catalyst for more serious
violence. Low corruption, by contrast, can enhance
confidence and trust in institutions.
POSITIVE PEACE FACTORS
From this framework IEP has developed a composite measurement of Positive Peace, the Positive Peace Index (PPI), covering the same countries as the GPI. The methodology and indicators informing the PPI are detailed on page 89 and 90.
84GLOBAL PEACE INDEX 2015 | Positive Peace
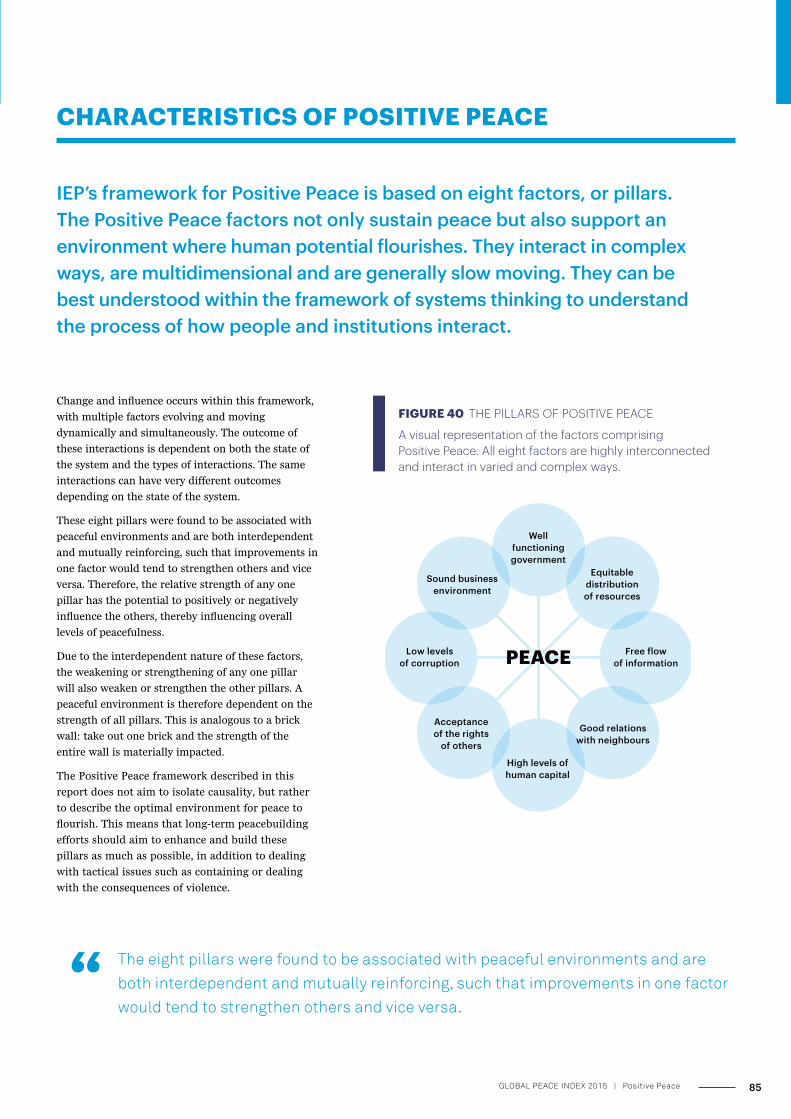
IEP’s framework for Positive Peace is based on eight factors, or pillars. The Positive Peace factors not only sustain peace but also support an environment where human potential flourishes. They interact in complex ways, are multidimensional and are generally slow moving. They can be best understood within the framework of systems thinking to understand the process of how people and institutions interact.
Change and influence occurs within this framework,
with multiple factors evolving and moving
dynamically and simultaneously. The outcome of
these interactions is dependent on both the state of
the system and the types of interactions. The same
interactions can have very different outcomes
depending on the state of the system.
These eight pillars were found to be associated with
peaceful environments and are both interdependent
and mutually reinforcing, such that improvements in
one factor would tend to strengthen others and vice
versa. Therefore, the relative strength of any one
pillar has the potential to positively or negatively
influence the others, thereby influencing overall
levels of peacefulness.
Due to the interdependent nature of these factors,
the weakening or strengthening of any one pillar
will also weaken or strengthen the other pillars. A
peaceful environment is therefore dependent on the
strength of all pillars. This is analogous to a brick
wall: take out one brick and the strength of the
entire wall is materially impacted.
The Positive Peace framework described in this
report does not aim to isolate causality, but rather
to describe the optimal environment for peace to
flourish. This means that long-term peacebuilding
efforts should aim to enhance and build these
pillars as much as possible, in addition to dealing
with tactical issues such as containing or dealing
with the consequences of violence.
Well functioning government
Sound businessenvironment
Low levels of corruption
Acceptance of the rights
of others
High levels ofhuman capital
Good relations with neighbours
Free flow of information
Equitable distribution of resources
PEACE
FIGURE 40 THE PILLARS OF POSITIVE PEACE
A visual representation of the factors comprising Positive Peace. All eight factors are highly interconnected and interact in varied and complex ways.
CHARACTERISTICS OF POSITIVE PEACE
The eight pillars were found to be associated with peaceful environments and are both interdependent and mutually reinforcing, such that improvements in one factor would tend to strengthen others and vice versa.
85GLOBAL PEACE INDEX 2015 | Positive Peace
Positive Peace has the following characteristics:
• Systemic and Complex It is complex; progress occurs in non-linear ways and can
be better understood through systems thinking.
• Preventative Though Positive Peace feactors tends to move slowly
overtime, by focusing on Positive Peace it can be possible
to prevent violence and violent conflict.
• Informal and Formal It includes both formal and informal factors.
This implies that societal and attitudinal factors are
equally important as state institutions.
• Underpins Resilience and Non-Violence Positive Peace builds capacity for resilience and the
possibility and incentives for nonviolent conflict
resolution. It provides an empirical framework to
measure an otherwise amorphous concept, resilience.
• Virtuous or Vicious It can evolve in a cyclical process where negative
feedback loops create vicious cycles of violence whereas
positive feedback loops create virtuous cycles of peace.
POSITIVE PEACE AND SYSTEMS THINKING
A system at its most simplistic level can be understood as a
collection of components which interact together to perform a
function. An example of this may be the simple analogy of a
forest which is comprised of individual components such as
trees, grass, soil and fauna. Each of these individual components
interact and share varying degrees of dependence with each
other. The collection of the individual components and their
interactions form the system and together, the interdependent
system is more than the sum of the component parts.
When thinking of complex systems and how this idea pertains
to conflict-affected or peaceful environments, it is not possible
to simply isolate cause from effect because of the multitudinous
ways in which different variables react to each other. Consider
the example of an increase in the incidence and perception of
corruption. This will undoubtedly have an effect on business,
the functioning of government and the free flow of information.
But changes in corruption may also be caused in part by
negative or positive changes in the very same variables.
Alternatively, consider restrictions on the free flow of
information and its impact on financial transparency, thereby
affecting business, the functioning of government and the ability
for individuals to engage in corruption. It is not possible to say
that when certain attributes reach a certain level we will see
violence, but rather that when one variable deteriorates, others
are likely to as well. Together, these dynamics cause community
stress and grievances that can lead to violence.
When investigating the levels of violence or peace in a society,
understanding society as a system can inform the understanding
of interactions in many different ways. Systemic change can best
be managed by understanding what are the most relevant
actions that can be taken in a given context. All contexts are
different; therefore a situational analysis is needed to best
understand how to interact with the system. The practical goal is
to use this information to define an action or set of actions and
to then focus on key factors which can create a positive feedback
loop to stimulate the whole system.
In the context of peace, the relationship between Positive and
Negative Peace within a country is dependent on the relative
strengths and weaknesses of each at any given time. If all eight
Positive Peace factors are strong, they all become good
predictors of levels of peace. The interaction between grievances
and positive peace can be best understood at the micro, meso
and macro levels.
For instance, a high Positive Peace environment would lower the
potential for violence at the micro, meso and macro levels by:
• High Positive Peace at the Micro Level Reduced potential for grievances to occur. Higher levels
of equity, justice and fairness as well as trust.
• High Positive Peace at the Meso Level More viable pathways for trusted non-violent resolution
of grievances when and if they occur.
• High Positive Peace at the Macro Level Resilient and adaptive system of social institutions that
can address grievances and avoid escalation of large scale
violence.
Conversely, violence can occur if Positive Peace is low within
a country:
• Low Positive Peace at the Micro Level Increased potential for grievances to occur. Lower levels
of equity, justice, fairness and trust.
• Low Positive Peace at the Meso Level Fewer viable alternatives to using violence to deal with
grievances and conflict resolution.
• Low Positive Peace at the Macro Level Weak social institutions unable to adapt and deal with
sudden rise in grievances and difficulty avoiding
escalation to large scale violence.
An example of this framework can be seen in the case of
Tunisia in the lead up to the Arab Spring. The perceived
unfairness of the treatment of Mohammed Bouazizi by officials
created a serious number of micro-level grievances. Despite his
86GLOBAL PEACE INDEX 2015 | Positive Peace
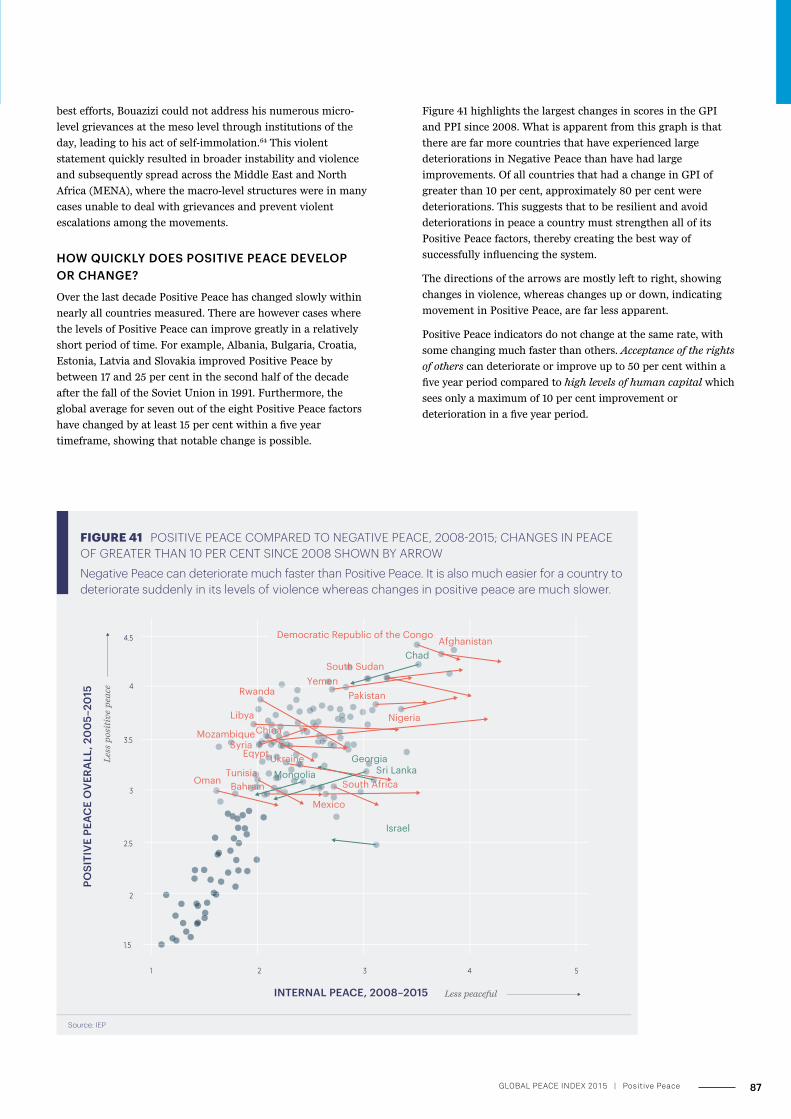
best efforts, Bouazizi could not address his numerous micro-
level grievances at the meso level through institutions of the
day, leading to his act of self-immolation.64 This violent
statement quickly resulted in broader instability and violence
and subsequently spread across the Middle East and North
Africa (MENA), where the macro-level structures were in many
cases unable to deal with grievances and prevent violent
escalations among the movements.
HOW QUICKLY DOES POSITIVE PEACE DEVELOP OR CHANGE?
Over the last decade Positive Peace has changed slowly within
nearly all countries measured. There are however cases where
the levels of Positive Peace can improve greatly in a relatively
short period of time. For example, Albania, Bulgaria, Croatia,
Estonia, Latvia and Slovakia improved Positive Peace by
between 17 and 25 per cent in the second half of the decade
after the fall of the Soviet Union in 1991. Furthermore, the
global average for seven out of the eight Positive Peace factors
have changed by at least 15 per cent within a five year
timeframe, showing that notable change is possible.
Figure 41 highlights the largest changes in scores in the GPI
and PPI since 2008. What is apparent from this graph is that
there are far more countries that have experienced large
deteriorations in Negative Peace than have had large
improvements. Of all countries that had a change in GPI of
greater than 10 per cent, approximately 80 per cent were
deteriorations. This suggests that to be resilient and avoid
deteriorations in peace a country must strengthen all of its
Positive Peace factors, thereby creating the best way of
successfully influencing the system.
The directions of the arrows are mostly left to right, showing
changes in violence, whereas changes up or down, indicating
movement in Positive Peace, are far less apparent.
Positive Peace indicators do not change at the same rate, with
some changing much faster than others. Acceptance of the rights
of others can deteriorate or improve up to 50 per cent within a
five year period compared to high levels of human capital which
sees only a maximum of 10 per cent improvement or
deterioration in a five year period.
FIGURE 41 POSITIVE PEACE COMPARED TO NEGATIVE PEACE, 2008-2015; CHANGES IN PEACE OF GREATER THAN 10 PER CENT SINCE 2008 SHOWN BY ARROW
Negative Peace can deteriorate much faster than Positive Peace. It is also much easier for a country to deteriorate suddenly in its levels of violence whereas changes in positive peace are much slower.
Less peaceful
Les
s p
osit
ive
pea
ce
Source: IEP
POSI
TIV
E PE
ACE
OV
ERA
LL, 2
00
5–20
15
INTERNAL PEACE, 2008–2015
2
1.5
2.5
3.5
4.5
3
4
1 2 3 4 5
AfghanistanChad
South Sudan
Oman
Libya
TunisiaBahrain
UkraineMongolia
South Africa
Mexico
Georgia
ChinaSyria
Eqypt
Rwanda
Mozambique
Sri Lanka
Israel
YemenPakistan
Nigeria
Democratic Republic of the Congo
87GLOBAL PEACE INDEX 2015 | Positive Peace
HOW IMPORTANT ARE INFORMAL ATTITUDES AND BEHAVIOURS TO POSITIVE PEACE?
Having stable state institutions is clearly important to
maintaining peace, with improvements in these institutions
advancing Positive Peace. However, societal views and attitudes
of how well these institutions function is also highly important
for maintaining and supporting peace. Similarly, socially
organised forms of cooperation and production can play an
important role in supplanting formal institutions where they
do not exist or are not properly functioning.
For example, having a police force that violently maintains the
rule of law which results in low levels of crime does not mean
that the community will trust or utilise the police force to
assist with solving crimes. For a society to be peaceful, the
community’s perception of the police must also be positive.
Trust within a community and of the police and judiciary are
an important part of proper functioning governance and rule
of law. Similarly, institutions may function well for a majority
of a population but exclude different religious or ethnic
minority groups and thus be the source of grievances which
could be the source of future violent conflict.
In countries where capacity is lacking in formal institutions,
informal processes may also fill the void. For instance, tribal
justice and tribal courts are often more trusted by communities
than what are seen as corrupt or insufficient national judicial
systems. Many such informal institutions are ongoing or done
in partnership with formal institutions.
Following the genocide in Rwanda in 1994, the judicial system
acknowledged the lack of capacity to deal with the large number
of cases related to the genocide because of both the magnitude
of cases and the deterioration of the system and loss of ranked
officials. As such the government agreed to the setting up of
traditional community Gacaca courts, or grassroots courts.
While there are both positive and negative stories attached to
these courts, they tackled as many as two million cases and are
often heralded as one of the reasons Rwanda has not fallen into
even deeper entrenched violence65.
POSITIVE PEACE AND RESILIENCE
Positive Peace is a concept that not only involves how a society
sustains peace within its own sphere of influence but also how
it can deal with unforeseen shocks, such as economic crises,
natural disasters or disease epidemics. In 2011, the UN
Development Programme (UNDP) defined resilience as the
ability of a country to quickly recover from or withstand and
absorb the impact of a shock.66
Resilient social systems have three broad characteristics:67
1. Coping capacities
The ability of the system to cope withand overcome
adversities or shocks.
2. Adaptive capacities
The ability to learn from past experiences and adjust for
the future accordingly.
3. Transformative capacities
The ability to build institutions to foster individual and
societal robustness.
IEP’s Positive Peace framework explicitly includes factors that
measure countries’ adaptive and transformative capacities.
For example, a country’s adaptive capability is dependent on
its ability to foster high levels of human capital, as measured
through education levels and number of scientific publications.
As countries and the world become more interconnected,
acceptance of the rights of others also assists in this adaptive
dimension. Equitable distribution of resources helps foster
individual and societal robustness, which in turn enables a
society to transform and improve with time.
VICIOUS AND VIRTUOUS CYCLES OF PEACE
The link between positive and negative peace is cyclical in that
changes to one variable can result in knock-on effects to other
variables which in turn interact with other variables thereby
creating the cyclical effect. In a societal system there can be
self-destructive phenomena termed “vicious cycles” and
positive reinforcing cycles called “virtuous cycles”.
The relationship between Positive and Negative Peace can
also be thought of in these terms. Figure 42 shows the stages
of a virtuous peace cycle. Increasing investment in Positive
Peace will lead to an improvement in one or more Positive
Peace factors. Improvements in Positive Peace will also
improve a country’s resilience to external shocks. Stronger
Positive Peace will decrease the level of violence within a
society in two ways, firstly by removing the source of
grievances that could generate violence and secondly by
offering legitimate and effective nonviolent resolution
avenues. This decrease in violence will lead to less capital
being spent on violence containment, allowing for further
investment in Positive Peace.
Positive Peace is a concept that not only involves how a society sustains peace within its own sphere of influence but also how it can deal with unforeseen shocks, such as economic crises, natural disasters or disease epidemics.
88GLOBAL PEACE INDEX 2015 | Positive Peace
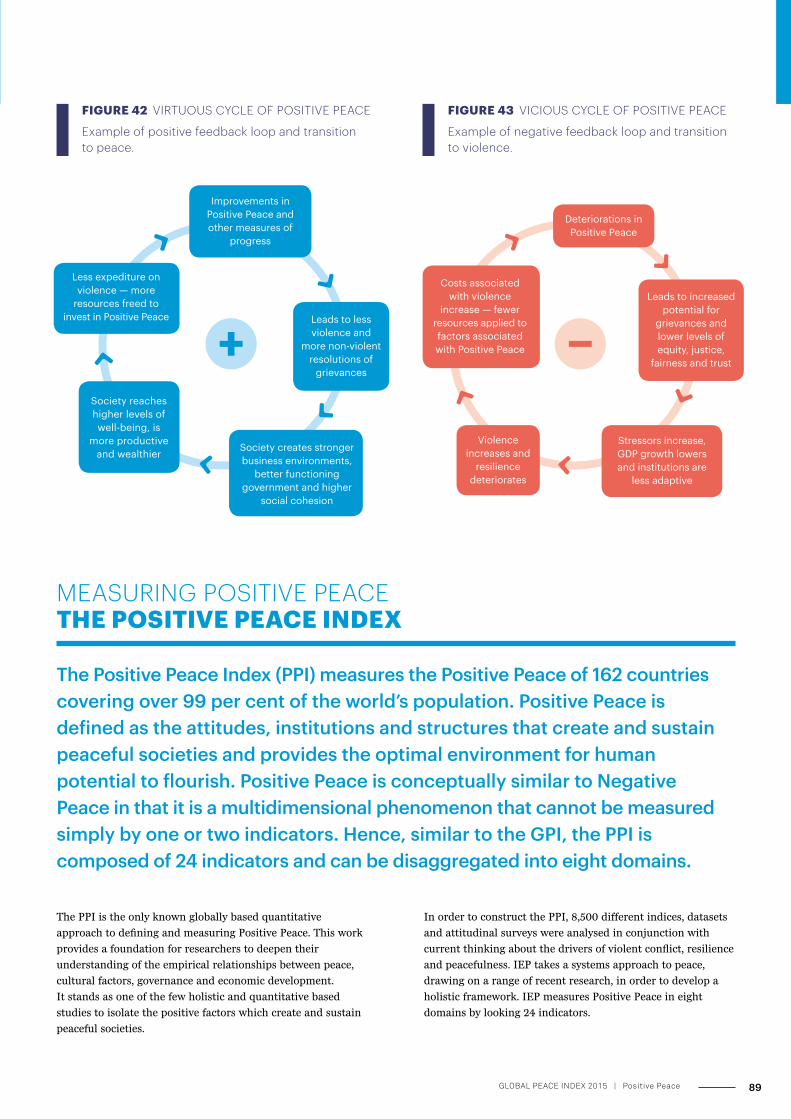
The PPI is the only known globally based quantitative
approach to defining and measuring Positive Peace. This work
provides a foundation for researchers to deepen their
understanding of the empirical relationships between peace,
cultural factors, governance and economic development.
It stands as one of the few holistic and quantitative based
studies to isolate the positive factors which create and sustain
peaceful societies.
MEASURING POSITIVE PEACE THE POSITIVE PEACE INDEX
The Positive Peace Index (PPI) measures the Positive Peace of 162 countries covering over 99 per cent of the world’s population. Positive Peace is defined as the attitudes, institutions and structures that create and sustain peaceful societies and provides the optimal environment for human potential to flourish. Positive Peace is conceptually similar to Negative Peace in that it is a multidimensional phenomenon that cannot be measured simply by one or two indicators. Hence, similar to the GPI, the PPI is composed of 24 indicators and can be disaggregated into eight domains.
FIGURE 42 VIRTUOUS CYCLE OF POSITIVE PEACE
Example of positive feedback loop and transition to peace.
Improvements in Positive Peace and other measures of
progress
Leads to less violence and
more non-violent resolutions of
grievances
Less expediture on violence — more
resources freed to invest in Positive Peace
Society reaches higher levels of well-being, is
more productive and wealthier
Society creates stronger business environments,
better functioning government and higher
social cohesion
FIGURE 43 VICIOUS CYCLE OF POSITIVE PEACE
Example of negative feedback loop and transition to violence.
Deteriorations in Positive Peace
Violence increases and
resilience deteriorates
Costs associated with violence
increase — fewer resources applied to factors associated with Positive Peace
Leads to increased potential for
grievances and lower levels of equity, justice,
fairness and trust
Stressors increase, GDP growth lowers and institutions are
less adaptive
In order to construct the PPI, 8,500 different indices, datasets
and attitudinal surveys were analysed in conjunction with
current thinking about the drivers of violent conflict, resilience
and peacefulness. IEP takes a systems approach to peace,
drawing on a range of recent research, in order to develop a
holistic framework. IEP measures Positive Peace in eight
domains by looking 24 indicators.
89GLOBAL PEACE INDEX 2015 | Positive Peace
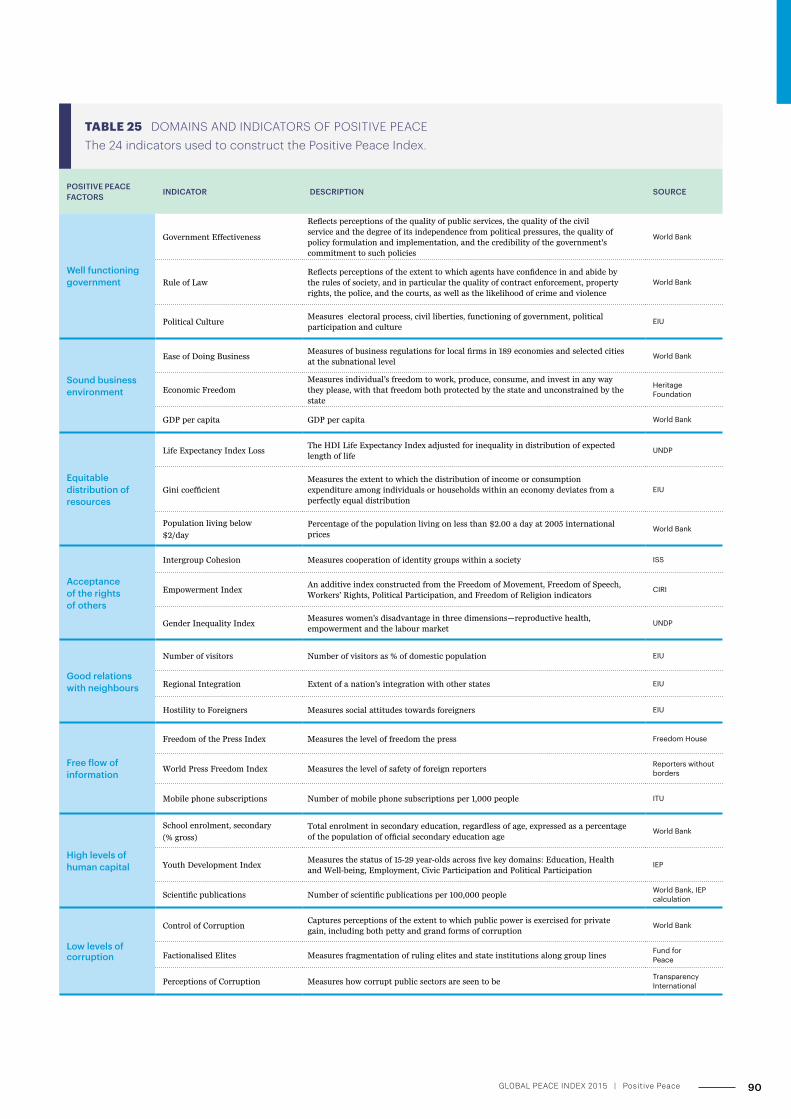
POSITIVE PEACE FACTORS INDICATOR DESCRIPTION SOURCE
Well functioning government
Government Effectiveness
Reflects perceptions of the quality of public services, the quality of the civil service and the degree of its independence from political pressures, the quality of policy formulation and implementation, and the credibility of the government's commitment to such policies
World Bank
Rule of LawReflects perceptions of the extent to which agents have confidence in and abide by the rules of society, and in particular the quality of contract enforcement, property rights, the police, and the courts, as well as the likelihood of crime and violence
World Bank
Political CultureMeasures electoral process, civil liberties, functioning of government, political participation and culture
EIU
Sound business environment
Ease of Doing BusinessMeasures of business regulations for local firms in 189 economies and selected cities at the subnational level
World Bank
Economic FreedomMeasures individual’s freedom to work, produce, consume, and invest in any way they please, with that freedom both protected by the state and unconstrained by the state
Heritage Foundation
GDP per capita GDP per capita World Bank
Equitable distribution of resources
Life Expectancy Index LossThe HDI Life Expectancy Index adjusted for inequality in distribution of expected length of life
UNDP
Gini coefficientMeasures the extent to which the distribution of income or consumption expenditure among individuals or households within an economy deviates from a perfectly equal distribution
EIU
Population living below
$2/dayPercentage of the population living on less than $2.00 a day at 2005 international prices
World Bank
Acceptance of the rights of others
Intergroup Cohesion Measures cooperation of identity groups within a society ISS
Empowerment IndexAn additive index constructed from the Freedom of Movement, Freedom of Speech, Workers’ Rights, Political Participation, and Freedom of Religion indicators
CIRI
Gender Inequality IndexMeasures women’s disadvantage in three dimensions—reproductive health, empowerment and the labour market
UNDP
Good relations with neighbours
Number of visitors Number of visitors as % of domestic population EIU
Regional Integration Extent of a nation’s integration with other states EIU
Hostility to Foreigners Measures social attitudes towards foreigners EIU
Free flow of information
Freedom of the Press Index Measures the level of freedom the press Freedom House
World Press Freedom Index Measures the level of safety of foreign reportersReporters without borders
Mobile phone subscriptions Number of mobile phone subscriptions per 1,000 people ITU
High levels of human capital
School enrolment, secondary
(% gross)Total enrolment in secondary education, regardless of age, expressed as a percentage of the population of official secondary education age
World Bank
Youth Development IndexMeasures the status of 15-29 year-olds across five key domains: Education, Health and Well-being, Employment, Civic Participation and Political Participation
IEP
Scientific publications Number of scientific publications per 100,000 peopleWorld Bank, IEP calculation
Low levels of corruption
Control of CorruptionCaptures perceptions of the extent to which public power is exercised for private gain, including both petty and grand forms of corruption
World Bank
Factionalised Elites Measures fragmentation of ruling elites and state institutions along group linesFund for Peace
Perceptions of Corruption Measures how corrupt public sectors are seen to beTransparency International
TABLE 25 DOMAINS AND INDICATORS OF POSITIVE PEACE The 24 indicators used to construct the Positive Peace Index.
90GLOBAL PEACE INDEX 2015 | Positive Peace
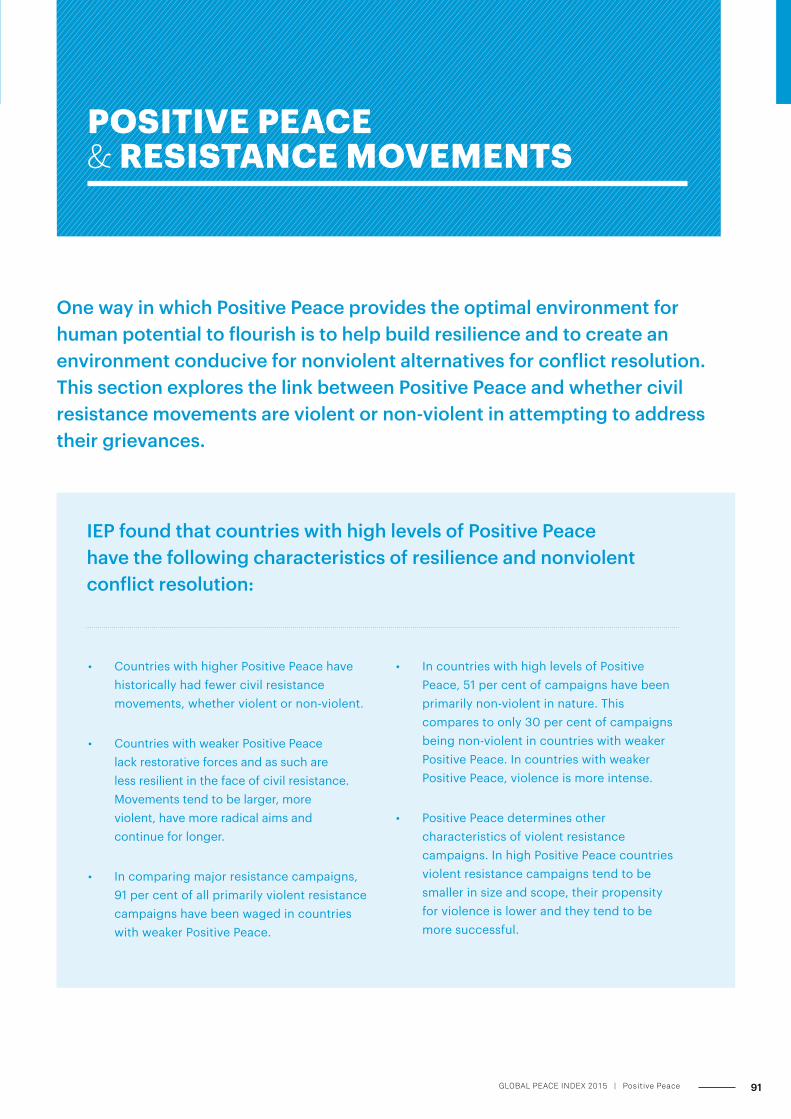
POSITIVE PEACE & RESISTANCE MOVEMENTS
One way in which Positive Peace provides the optimal environment for human potential to flourish is to help build resilience and to create an environment conducive for nonviolent alternatives for conflict resolution. This section explores the link between Positive Peace and whether civil resistance movements are violent or non-violent in attempting to address their grievances.
• In countries with high levels of Positive Peace, 51 per cent of campaigns have been primarily non-violent in nature. This compares to only 30 per cent of campaigns being non-violent in countries with weaker Positive Peace. In countries with weaker Positive Peace, violence is more intense.
• Positive Peace determines other characteristics of violent resistance campaigns. In high Positive Peace countries violent resistance campaigns tend to be smaller in size and scope, their propensity for violence is lower and they tend to be more successful.
IEP found that countries with high levels of Positive Peace have the following characteristics of resilience and nonviolent conflict resolution:
• Countries with higher Positive Peace have historically had fewer civil resistance movements, whether violent or non-violent.
• Countries with weaker Positive Peace lack restorative forces and as such are less resilient in the face of civil resistance. Movements tend to be larger, more violent, have more radical aims and continue for longer.
• In comparing major resistance campaigns, 91 per cent of all primarily violent resistance campaigns have been waged in countries with weaker Positive Peace.
91GLOBAL PEACE INDEX 2015 | Positive Peace
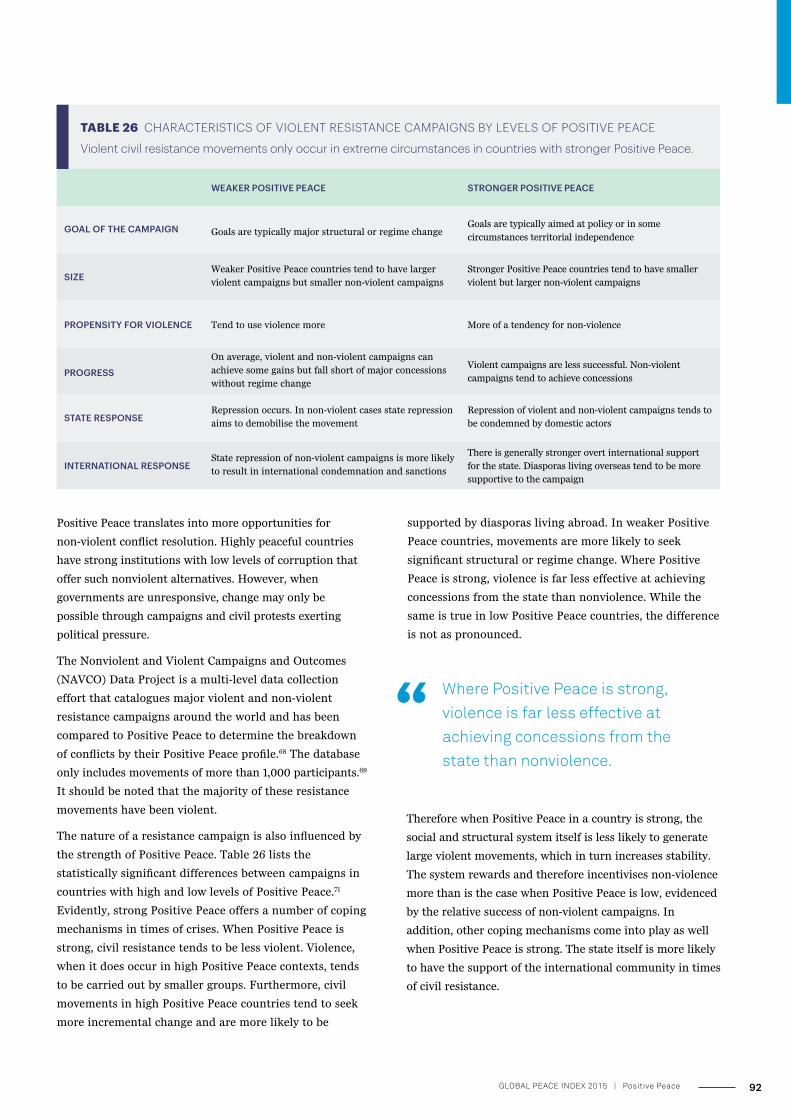
WEAKER POSITIVE PEACE STRONGER POSITIVE PEACE
GOAL OF THE CAMPAIGN Goals are typically major structural or regime changeGoals are typically aimed at policy or in some
circumstances territorial independence
SIZEWeaker Positive Peace countries tend to have larger
violent campaigns but smaller non-violent campaigns
Stronger Positive Peace countries tend to have smaller
violent but larger non-violent campaigns
PROPENSITY FOR VIOLENCE Tend to use violence more More of a tendency for non-violence
PROGRESS
On average, violent and non-violent campaigns can
achieve some gains but fall short of major concessions
without regime change
Violent campaigns are less successful. Non-violent
campaigns tend to achieve concessions
STATE RESPONSERepression occurs. In non-violent cases state repression
aims to demobilise the movement
Repression of violent and non-violent campaigns tends to
be condemned by domestic actors
INTERNATIONAL RESPONSEState repression of non-violent campaigns is more likely
to result in international condemnation and sanctions
There is generally stronger overt international support
for the state. Diasporas living overseas tend to be more
supportive to the campaign
TABLE 26 CHARACTERISTICS OF VIOLENT RESISTANCE CAMPAIGNS BY LEVELS OF POSITIVE PEACE
Violent civil resistance movements only occur in extreme circumstances in countries with stronger Positive Peace.
Positive Peace translates into more opportunities for
non-violent conflict resolution. Highly peaceful countries
have strong institutions with low levels of corruption that
offer such nonviolent alternatives. However, when
governments are unresponsive, change may only be
possible through campaigns and civil protests exerting
political pressure.
The Nonviolent and Violent Campaigns and Outcomes
(NAVCO) Data Project is a multi-level data collection
effort that catalogues major violent and non-violent
resistance campaigns around the world and has been
compared to Positive Peace to determine the breakdown
of conflicts by their Positive Peace profile.68 The database
only includes movements of more than 1,000 participants.69
It should be noted that the majority of these resistance
movements have been violent.
The nature of a resistance campaign is also influenced by
the strength of Positive Peace. Table 26 lists the
statistically significant differences between campaigns in
countries with high and low levels of Positive Peace.71
Evidently, strong Positive Peace offers a number of coping
mechanisms in times of crises. When Positive Peace is
strong, civil resistance tends to be less violent. Violence,
when it does occur in high Positive Peace contexts, tends
to be carried out by smaller groups. Furthermore, civil
movements in high Positive Peace countries tend to seek
more incremental change and are more likely to be
Where Positive Peace is strong, violence is far less effective at achieving concessions from the state than nonviolence.
supported by diasporas living abroad. In weaker Positive
Peace countries, movements are more likely to seek
significant structural or regime change. Where Positive
Peace is strong, violence is far less effective at achieving
concessions from the state than nonviolence. While the
same is true in low Positive Peace countries, the difference
is not as pronounced.
Therefore when Positive Peace in a country is strong, the
social and structural system itself is less likely to generate
large violent movements, which in turn increases stability.
The system rewards and therefore incentivises non-violence
more than is the case when Positive Peace is low, evidenced
by the relative success of non-violent campaigns. In
addition, other coping mechanisms come into play as well
when Positive Peace is strong. The state itself is more likely
to have the support of the international community in times
of civil resistance.
92GLOBAL PEACE INDEX 2015 | Positive Peace
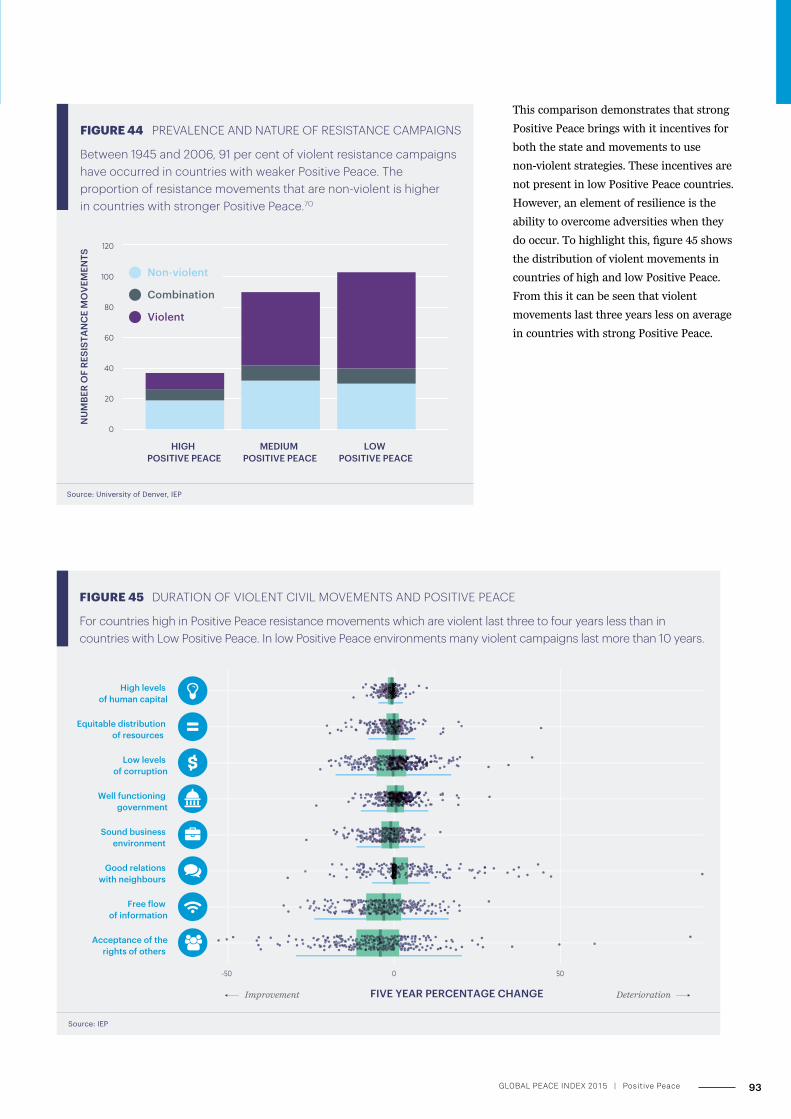
FIGURE 44 PREVALENCE AND NATURE OF RESISTANCE CAMPAIGNS
Between 1945 and 2006, 91 per cent of violent resistance campaigns have occurred in countries with weaker Positive Peace. The proportion of resistance movements that are non-violent is higher in countries with stronger Positive Peace.7O
Source: University of Denver, IEP
0
20
40
60
80
100
120
HIGH POSITIVE PEACE
MEDIUM POSITIVE PEACE
LOW POSITIVE PEACE
NU
MBE
R O
F RE
SIST
AN
CE
MO
VEM
ENTS
Non-violent
Combination
Violent
0
FIGURE 45 DURATION OF VIOLENT CIVIL MOVEMENTS AND POSITIVE PEACE
For countries high in Positive Peace resistance movements which are violent last three to four years less than in countries with Low Positive Peace. In low Positive Peace environments many violent campaigns last more than 10 years.
Source: IEP
-50 50
Sound business environment
High levels of human capital
Good relations with neighbours
Acceptance of therights of others
Low levels of corruption
Free �ow of information
Well functioning government
Equitable distribution of resources
FIVE YEAR PERCENTAGE CHANGE DeteriorationImprovement
This comparison demonstrates that strong
Positive Peace brings with it incentives for
both the state and movements to use
non-violent strategies. These incentives are
not present in low Positive Peace countries.
However, an element of resilience is the
ability to overcome adversities when they
do occur. To highlight this, figure 45 shows
the distribution of violent movements in
countries of high and low Positive Peace.
From this it can be seen that violent
movements last three years less on average
in countries with strong Positive Peace.
93GLOBAL PEACE INDEX 2015 | Positive Peace
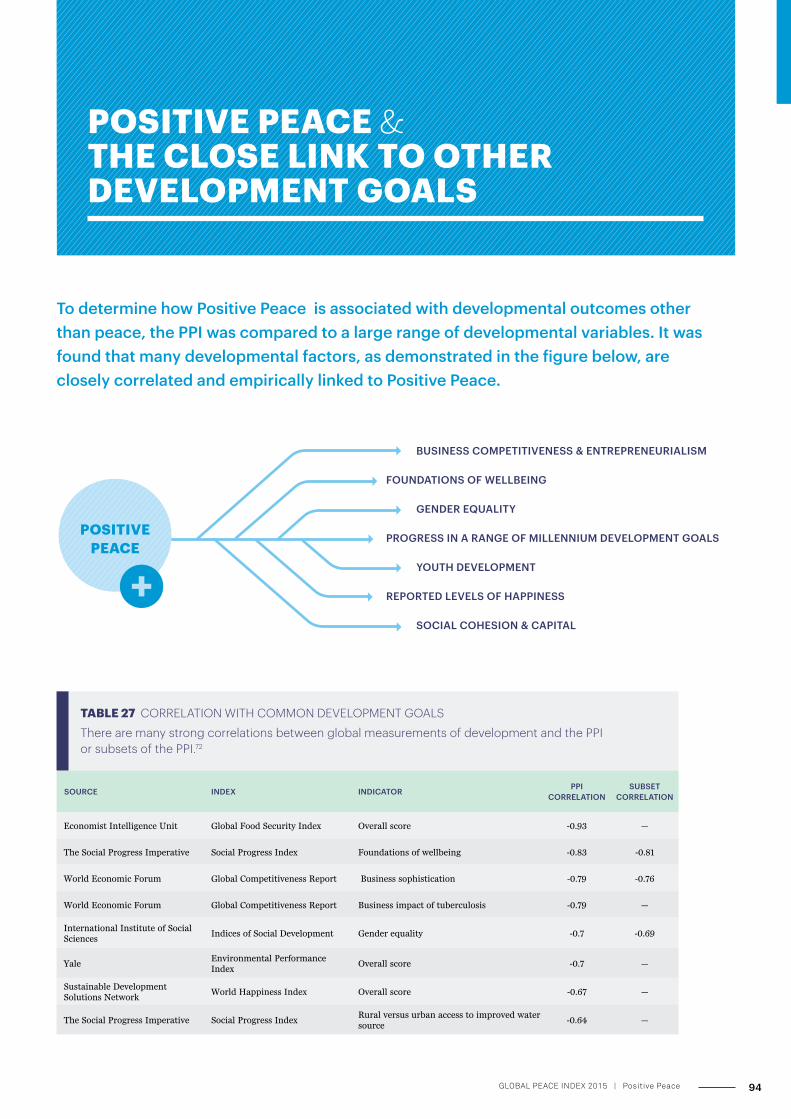
POSITIVE PEACE & THE CLOSE LINK TO OTHER DEVELOPMENT GOALS
SOURCE INDEX INDICATOR PPI CORRELATION
SUBSET CORRELATION
Economist Intelligence Unit Global Food Security Index Overall score -0.93 —
The Social Progress Imperative Social Progress Index Foundations of wellbeing -0.83 -0.81
World Economic Forum Global Competitiveness Report Business sophistication -0.79 -0.76
World Economic Forum Global Competitiveness Report Business impact of tuberculosis -0.79 —
International Institute of Social Sciences
Indices of Social Development Gender equality -0.7 -0.69
YaleEnvironmental Performance Index
Overall score -0.7 —
Sustainable Development Solutions Network
World Happiness Index Overall score -0.67 —
The Social Progress Imperative Social Progress IndexRural versus urban access to improved water source
-0.64 —
TABLE 27 CORRELATION WITH COMMON DEVELOPMENT GOALS
There are many strong correlations between global measurements of development and the PPI or subsets of the PPI.72
To determine how Positive Peace is associated with developmental outcomes other than peace, the PPI was compared to a large range of developmental variables. It was found that many developmental factors, as demonstrated in the figure below, are closely correlated and empirically linked to Positive Peace.
POSITIVE PEACE
BUSINESS COMPETITIVENESS & ENTREPRENEURIALISM
FOUNDATIONS OF WELLBEING
GENDER EQUALITY
PROGRESS IN A RANGE OF MILLENNIUM DEVELOPMENT GOALS
YOUTH DEVELOPMENT
REPORTED LEVELS OF HAPPINESS
SOCIAL COHESION & CAPITAL
94GLOBAL PEACE INDEX 2015 | Positive Peace
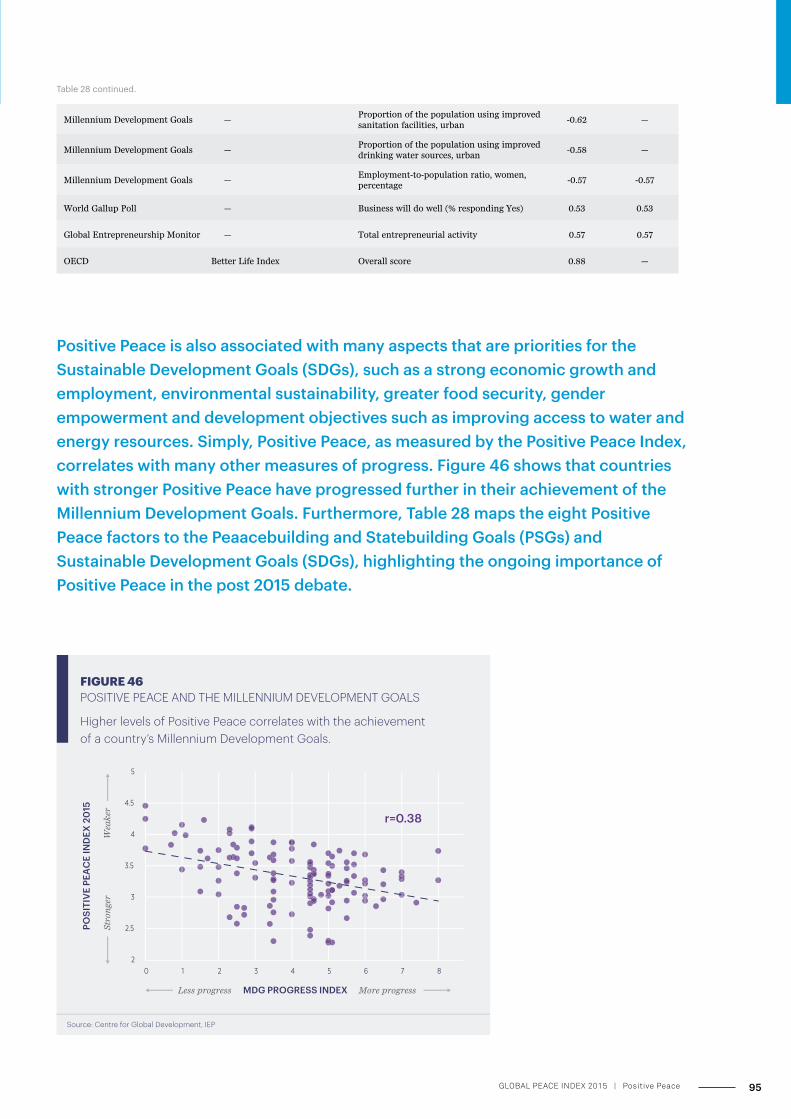
FIGURE 46 POSITIVE PEACE AND THE MILLENNIUM DEVELOPMENT GOALS
Higher levels of Positive Peace correlates with the achievement of a country’s Millennium Development Goals.
Source: Centre for Global Development, IEP
2
2.5
3
3.5
4
4.5
5
0 1 2 3 4 5 6 7 8
Less progress MDG PROGRESS INDEX More progress
r=0.38
POSI
TIV
E PE
AC
E IN
DEX
20
15
Stro
nge
r
Wea
ker
Positive Peace is also associated with many aspects that are priorities for the Sustainable Development Goals (SDGs), such as a strong economic growth and employment, environmental sustainability, greater food security, gender empowerment and development objectives such as improving access to water and energy resources. Simply, Positive Peace, as measured by the Positive Peace Index, correlates with many other measures of progress. Figure 46 shows that countries with stronger Positive Peace have progressed further in their achievement of the Millennium Development Goals. Furthermore, Table 28 maps the eight Positive Peace factors to the Peaacebuilding and Statebuilding Goals (PSGs) and Sustainable Development Goals (SDGs), highlighting the ongoing importance of Positive Peace in the post 2015 debate.
Table 28 continued.
Millennium Development Goals —Proportion of the population using improved sanitation facilities, urban
-0.62 —
Millennium Development Goals — Proportion of the population using improved drinking water sources, urban
-0.58 —
Millennium Development Goals —Employment-to-population ratio, women, percentage
-0.57 -0.57
World Gallup Poll — Business will do well (% responding Yes) 0.53 0.53
Global Entrepreneurship Monitor — Total entrepreneurial activity 0.57 0.57
OECD Better Life Index Overall score 0.88 —
95GLOBAL PEACE INDEX 2015 | Positive Peace
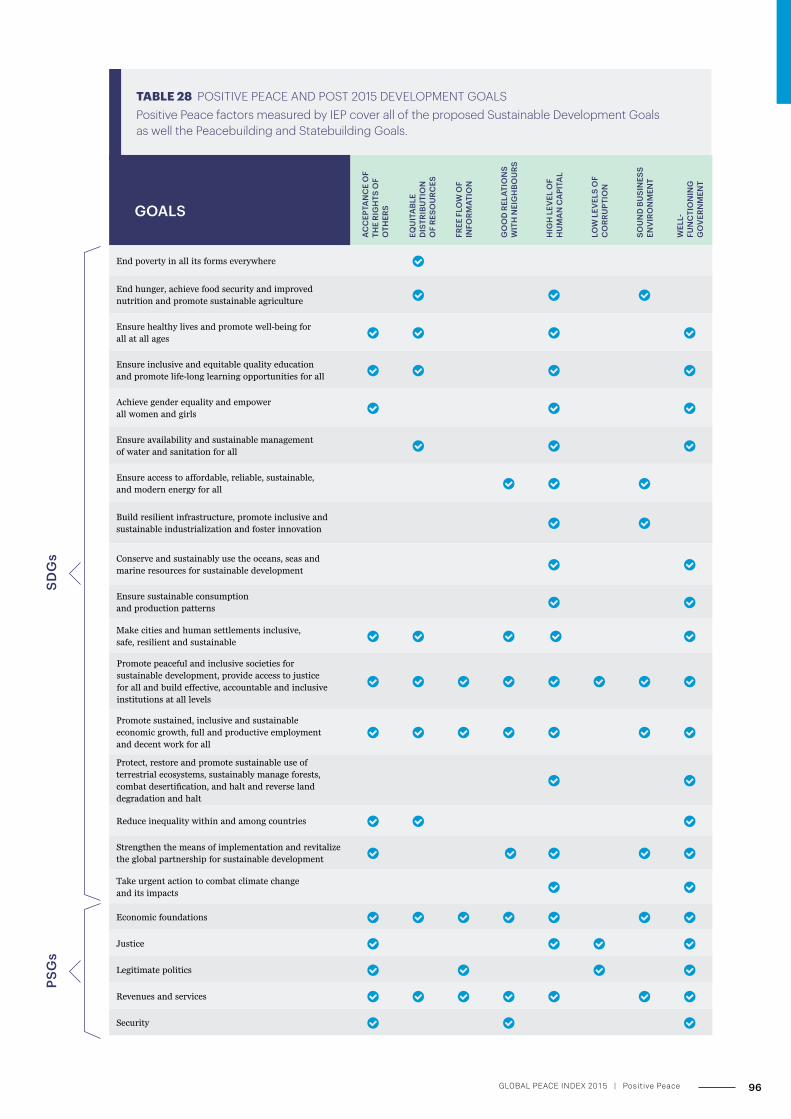
SDG
sPS
Gs
AC
CEP
TAN
CE
OF
THE
RIG
HTS
OF
OTH
ERS
EQU
ITA
BLE
DIS
TRIB
UTI
ON
O
F RE
SOU
RCES
FREE
FLO
W O
F IN
FORM
ATIO
N
GO
OD
REL
ATIO
NS
WIT
H N
EIG
HBO
URS
HIG
H L
EVEL
OF
HU
MA
N C
API
TAL
LOW
LEV
ELS
OF
CO
RRU
PTIO
N
SOU
ND
BU
SIN
ESS
ENV
IRO
NM
ENT
WEL
L-FU
NC
TIO
NIN
G
GO
VER
NM
ENT
End poverty in all its forms everywhere
End hunger, achieve food security and improved nutrition and promote sustainable agriculture
Ensure healthy lives and promote well-being for all at all ages
Ensure inclusive and equitable quality education and promote life-long learning opportunities for all
Achieve gender equality and empower all women and girls
Ensure availability and sustainable management of water and sanitation for all
Ensure access to affordable, reliable, sustainable, and modern energy for all
Build resilient infrastructure, promote inclusive and sustainable industrialization and foster innovation
Conserve and sustainably use the oceans, seas and marine resources for sustainable development
Ensure sustainable consumption and production patterns
Make cities and human settlements inclusive, safe, resilient and sustainable
Promote peaceful and inclusive societies for sustainable development, provide access to justice for all and build effective, accountable and inclusive institutions at all levels
Promote sustained, inclusive and sustainable economic growth, full and productive employment and decent work for all
Protect, restore and promote sustainable use of terrestrial ecosystems, sustainably manage forests, combat desertification, and halt and reverse land degradation and halt
Reduce inequality within and among countries
Strengthen the means of implementation and revitalize the global partnership for sustainable development
Take urgent action to combat climate change and its impacts
Economic foundations
Justice
Legitimate politics
Revenues and services
Security
TABLE 28 POSITIVE PEACE AND POST 2015 DEVELOPMENT GOALSPositive Peace factors measured by IEP cover all of the proposed Sustainable Development Goals as well the Peacebuilding and Statebuilding Goals.
GOALS
96GLOBAL PEACE INDEX 2015 | Positive Peace
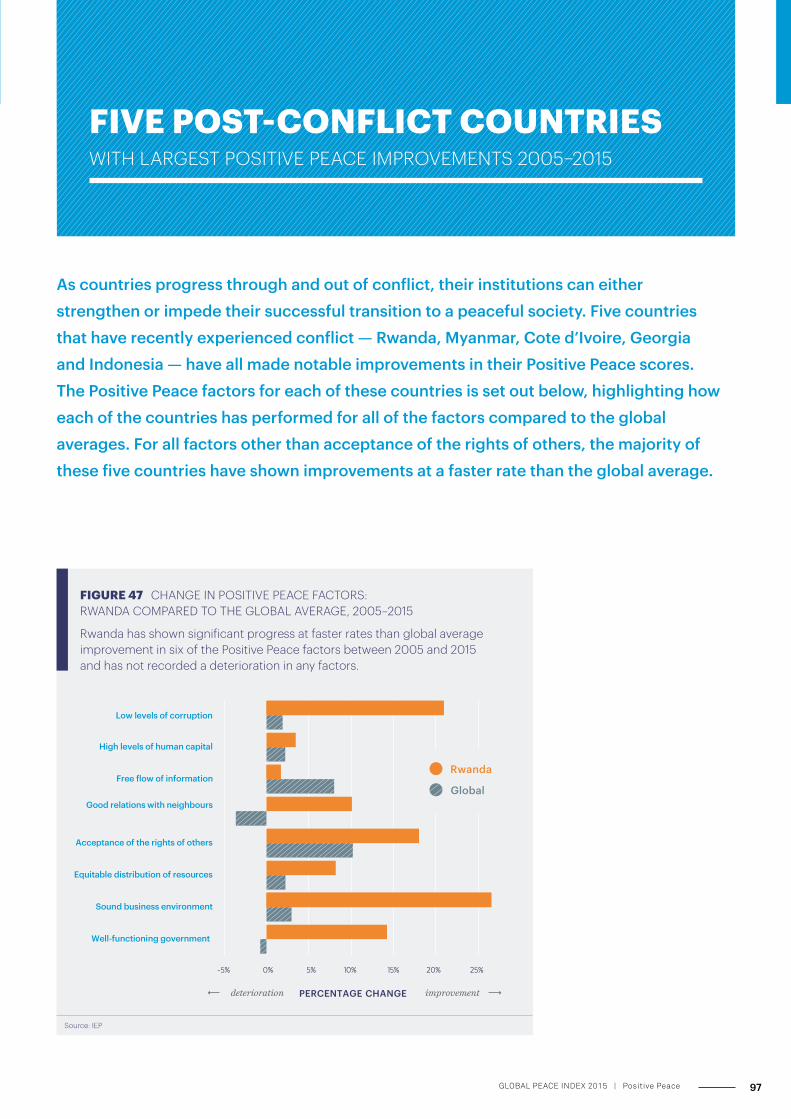
FIVE POST-CONFLICT COUNTRIES WITH LARGEST POSITIVE PEACE IMPROVEMENTS 2005–2015
As countries progress through and out of conflict, their institutions can either strengthen or impede their successful transition to a peaceful society. Five countries that have recently experienced conflict — Rwanda, Myanmar, Cote d’Ivoire, Georgia and Indonesia — have all made notable improvements in their Positive Peace scores. The Positive Peace factors for each of these countries is set out below, highlighting how each of the countries has performed for all of the factors compared to the global averages. For all factors other than acceptance of the rights of others, the majority of these five countries have shown improvements at a faster rate than the global average.
FIGURE 47 CHANGE IN POSITIVE PEACE FACTORS: RWANDA COMPARED TO THE GLOBAL AVERAGE, 2005–2015
Rwanda has shown significant progress at faster rates than global average improvement in six of the Positive Peace factors between 2005 and 2015 and has not recorded a deterioration in any factors.
-5% 0% 5% 10% 15% 20% 25%
Well-functioning government
Sound business environment
Equitable distribution of resources
Acceptance of the rights of others
Good relations with neighbours
Free flow of information
High levels of human capital
Low levels of corruption
PERCENTAGE CHANGE
Rwanda
Global
deterioration improvement
Source: IEP
97GLOBAL PEACE INDEX 2015 | Positive Peace
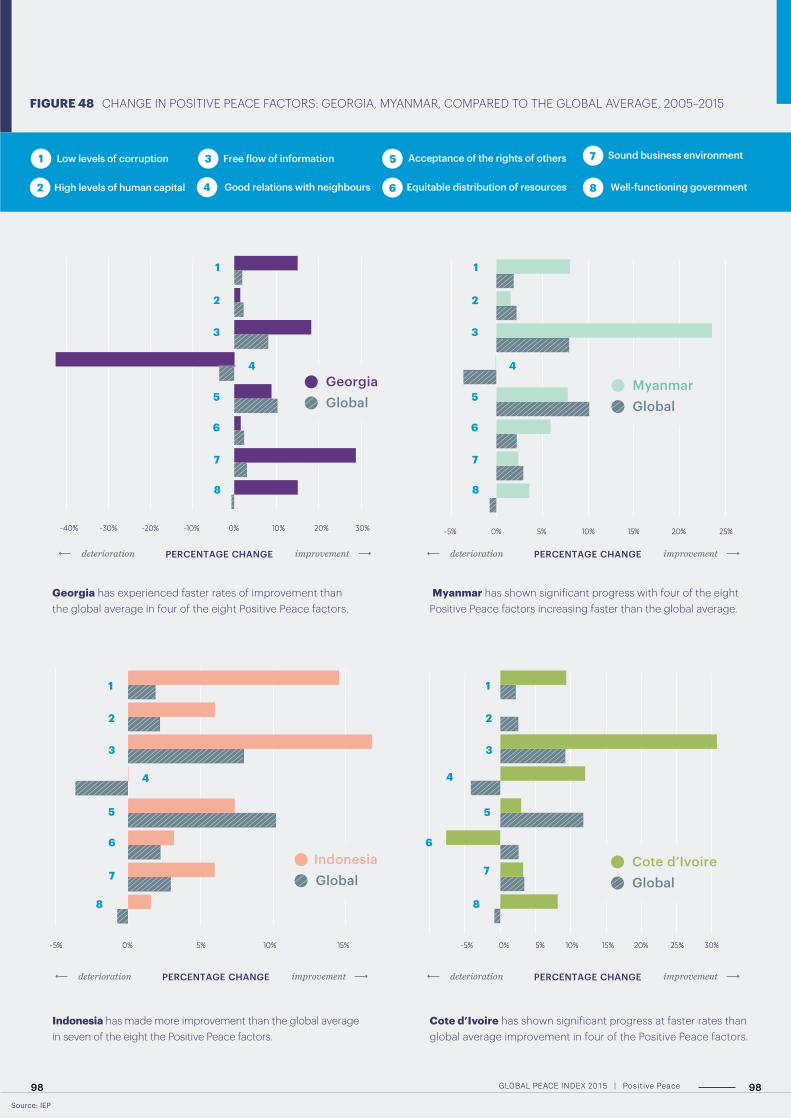
FIGURE 48 CHANGE IN POSITIVE PEACE FACTORS: GEORGIA, MYANMAR, COMPARED TO THE GLOBAL AVERAGE, 2005–2015
Source: IEP
Cote d’Ivoire has shown significant progress at faster rates than global average improvement in four of the Positive Peace factors.
PERCENTAGE CHANGEdeterioration improvement
-5% 0% 5% 10% 15% 20% 25% 30%
Cote d’IvoireGlobal
Low levels of corruption1
Equitable distribution of resources6Good relations with neighbours4
Sound business environment7
Well-functioning government8High levels of human capital2
Free flow of information3 Acceptance of the rights of others5
5
3
2
1
6
7
8
Indonesia has made more improvement than the global average in seven of the eight the Positive Peace factors.
PERCENTAGE CHANGEdeterioration improvement
-5% 0% 5% 10% 15%
IndonesiaGlobal
5
3
2
1
6
7
-5% 0% 5% 10% 15% 20% 25%
MyanmarGlobal
Myanmar has shown significant progress with four of the eight Positive Peace factors increasing faster than the global average.
PERCENTAGE CHANGEdeterioration improvement
4
1
2
6
3
5
7
8
Georgia has experienced faster rates of improvement than the global average in four of the eight Positive Peace factors.
-20%-30%-40% -10% 0% 10% 20% 30%
PERCENTAGE CHANGEdeterioration improvement
GeorgiaGlobal
1
2
6
3
4
5
7
8
8
4 4
98GLOBAL PEACE INDEX 2015 | Positive Peace98

ANNEXES
99GLOBAL PEACE INDEX 2015
ANNEX A GPI METHODOLOGY
The first domain, ongoing domestic and international conflict,
investigates the extent to which countries are involved in
internal and external conflicts, as well as their role and
duration of involvement in conflicts.
The second domain evaluates the level of harmony or discord
within a nation; ten indicators broadly assess what might be
described as societal safety and security. The assertion is that
low crime rates, minimal terrorist activity and violent
demonstrations, harmonious relations with neighbouring
countries, a stable political scene and a small proportion of the
population being internally displaced or made refugees can be
equated with peacefulness.
Seven further indicators are related to a country’s militarisation
—reflecting the link between a country’s level of military
build-up and access to weapons and its level of peacefulness,
both domestically and internationally. Comparable data on
military expenditure as a percentage of GDP and the number of
armed service officers per head are gauged, as are financial
contributions to UN peacekeeping missions.
THE RESEARCH TEAMThe GPI was founded by Steve Killelea, an Australian technology
entrepreneur and philanthropist. It is produced by the Institute
for Economics and Peace, a global think tank dedicated to
building a greater understanding of the relationship between
economics, business and peace. The GPI is collated and
calculated by The Economist Intelligence Unit (EIU), which has
also contributed to some sections of this report, including the
regional analysis and the risers and fallers. An international
panel of independent experts played a key role in establishing
the GPI in 2007—in selecting the indicators that best assess a
nation’s level of peace and in assigning their weightings. The
panel has overseen each edition of the GPI; this year, it included:
MEASURING THE STATE OF PEACE Peace is notoriously difficult to define. The simplest way of approaching it is in terms of the harmony achieved by the absence of violence or the fear of violence, which has been described as Negative Peace. Negative Peace is a compliment to Positive Peace which is defined as the attitudes, institutions and structures which create and sustain peaceful societies. The Global Peace Index measures a country’s level of Negative Peace using three domains of peacefulness.
Professor Kevin P. Clements, chairperson Foundation Chair of Peace and Conflict Studies and director,
National Centre for Peace and Conflict Studies, University of
Otago, Dunedin, New Zealand
Dr Sabina Alkire Director, Oxford Poverty & Human Development Initiative
(OPHI), University of Oxford, United Kingdom
Dr Ian Anthony Director a.i., Stockholm International Peace Research Institute
(SIPRI), Sweden
Mr Vasu Gounden Founder and Executive Director of the African Centre for the
Constructive Resolution of Disputes (ACCORD), Durban,
South Africa
Mr Nick Grono CEO, Freedom Fund, London, United Kingdom
Dr Manuela Mesa Director, Centre for Education and Peace Research (CEIPAZ)
and president, Spanish Association for Peace Research (AIPAZ),
Madrid, Spain
Dr Ekaterina Stepanova Head, Unit on Peace and Conflict Studies, Institute of the
World Economy and International Relations (IMEMO),
Russian Academy of Sciences, Moscow, Russia
100GLOBAL PEACE INDEX 2015 | Annex A
THE INDICATORSThe GPI comprises 23 indicators of the existence of violence or fear
of violence. The indicators were originally selected with the
assistance of an international panel of independent experts in 2007
and have been reviewed by the expert panel on an annual basis. In
the 2015 edition of the index two new indicators have been
introduced: number and duration of internal conflicts and
number, duration and role in external conflicts (which replace
number of external and internal conflicts fought). These indicators,
produced by the Institute for Economics and Peace, improve the
methodological structure of the index by distinguishing between
domestic and international conflict and adding a degree of
complexity to the scoring (see full explanation in Annex B). All
scores for each indicator are normalised on a scale of 1-5, whereby
qualitative indicators are banded into five groupings and
quantitative ones are either banded into ten groupings or rounded
to the first decimal point. The Economist Intelligence Unit’s team
of country analysts has scored seven of the eight qualitative
indicators and also provided estimates where there have been gaps
in the quantitative data. A detailed explanation of the scoring
criteria used for each indicator is supplied in Annex B.
Number and duration of internal conflicts Uppsala Conflict Data Program (UCDP) Battle-Related Deaths
Dataset, Non-State Conflict Dataset and One-sided Violence
Dataset; Institute for Economics and Peace (IEP)
Number of deaths from organised conflict (external) UCDP Armed Conflict Dataset
Number of deaths from organised conflict (internal)International Institute for Strategic Studies (IISS) Armed
Conflict Database (ACD)
Number, duration and role in external conflicts UCDP Battle-Related Deaths Dataset; IEP
Intensity of organised internal conflict Qualitative assessment by EIU analysts
Relations with neighbouring countries Qualitative assessment by EIU analysts
Level of perceived criminality in society Qualitative assessment by EIU analysts
Number of refugees and internally displaced people as a percentage of the population Office of the High Commissioner for Refugees (UNHCR)
Mid-Year Trends; Internal Displacement Monitoring Centre
(IDMC)
Political instability Qualitative assessment by EIU analysts
Political Terror Scale Qualitative assessment of Amnesty International and
US State Department yearly reports
Impact of terrorism IEP Global Terrorism Index (GTI)
Number of homicides per 100,000 people United Nations Office on Drugs and Crime (UNODC) Surveys
on Crime Trends and the Operations of Criminal Justice
Systems (CTS); EIU estimates
Level of violent crime Qualitative assessment by EIU analysts
Likelihood of violent demonstrations Qualitative assessment by EIU analysts
Number of jailed population per 100,000 people World Prison Brief, International Centre for Prison Studies,
University of Essex
Number of internal security officers and police per 100,000 people UNODC; EIU estimates
Military expenditure as a percentage of GDP The Military Balance, IISS
Number of armed services personnel per 100,000 people The Military Balance, IISS
Volume of transfers of major conventional weapons as recipient (imports) per 100,000 people Stockholm International Peace Research Institute (SIPRI) Arms
Transfers Database
Volume of transfers of major conventional weapons as supplier (exports) per 100,000 people SIPRI Arms Transfers Database
Financial contribution to UN peacekeeping missions United Nations Committee on Contributions; IEP
Nuclear and heavy weapons capabilities The Military Balance, IISS; SIPRI; UN Register of Conventional
Arms; IEP
Ease of access to small arms and light weapons Qualitative assessment by EIU analysts
ONGOING DOMESTIC AND INTERNATIONAL CONFLICT
MILITARISATION
SOCIETAL SAFETY AND SECURITY
101GLOBAL PEACE INDEX 2015 | Annex A
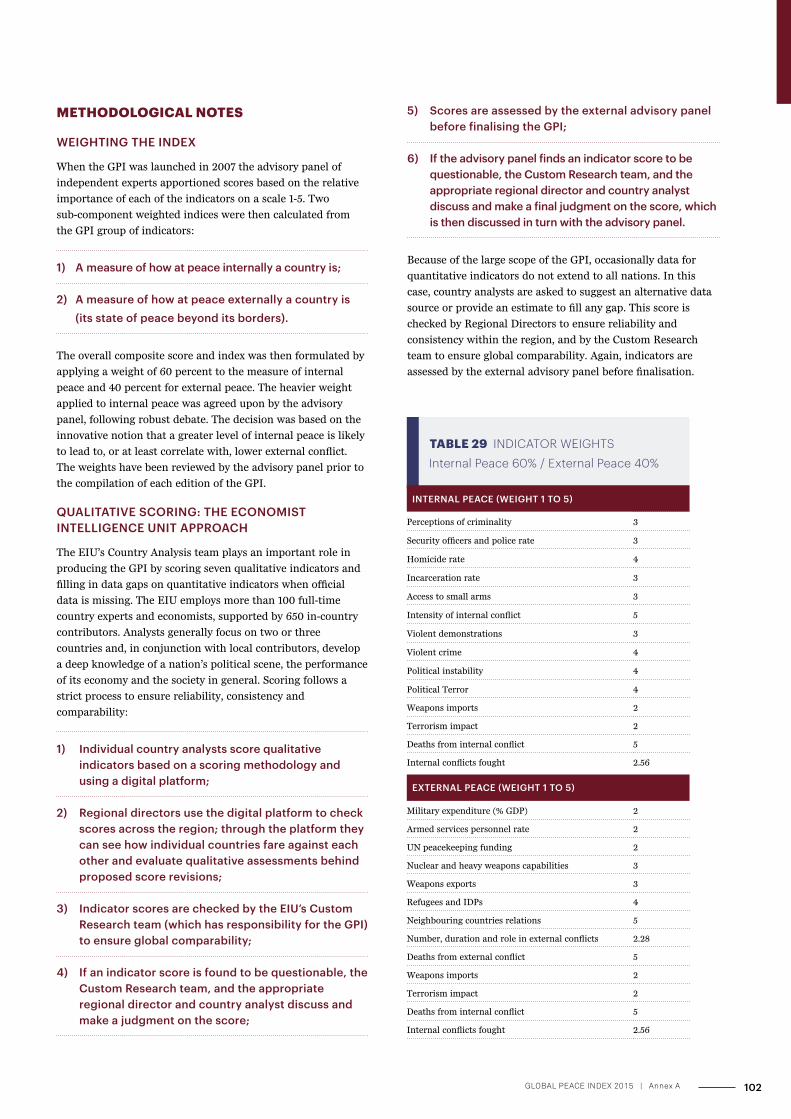
METHODOLOGICAL NOTES
WEIGHTING THE INDEX
When the GPI was launched in 2007 the advisory panel of
independent experts apportioned scores based on the relative
importance of each of the indicators on a scale 1-5. Two
sub-component weighted indices were then calculated from
the GPI group of indicators:
1) A measure of how at peace internally a country is;
2) A measure of how at peace externally a country is (its state of peace beyond its borders).
The overall composite score and index was then formulated by
applying a weight of 60 percent to the measure of internal
peace and 40 percent for external peace. The heavier weight
applied to internal peace was agreed upon by the advisory
panel, following robust debate. The decision was based on the
innovative notion that a greater level of internal peace is likely
to lead to, or at least correlate with, lower external conflict.
The weights have been reviewed by the advisory panel prior to
the compilation of each edition of the GPI.
QUALITATIVE SCORING: THE ECONOMIST INTELLIGENCE UNIT APPROACH
The EIU’s Country Analysis team plays an important role in
producing the GPI by scoring seven qualitative indicators and
filling in data gaps on quantitative indicators when official
data is missing. The EIU employs more than 100 full-time
country experts and economists, supported by 650 in-country
contributors. Analysts generally focus on two or three
countries and, in conjunction with local contributors, develop
a deep knowledge of a nation’s political scene, the performance
of its economy and the society in general. Scoring follows a
strict process to ensure reliability, consistency and
comparability:
1) Individual country analysts score qualitative indicators based on a scoring methodology and using a digital platform;
2) Regional directors use the digital platform to check scores across the region; through the platform they can see how individual countries fare against each other and evaluate qualitative assessments behind proposed score revisions;
3) Indicator scores are checked by the EIU’s Custom Research team (which has responsibility for the GPI) to ensure global comparability;
4) If an indicator score is found to be questionable, the Custom Research team, and the appropriate regional director and country analyst discuss and make a judgment on the score;
TABLE 29 INDICATOR WEIGHTSInternal Peace 60% / External Peace 40%
INTERNAL PEACE (WEIGHT 1 TO 5)
Perceptions of criminality 3
Security officers and police rate 3
Homicide rate 4
Incarceration rate 3
Access to small arms 3
Intensity of internal conflict 5
Violent demonstrations 3
Violent crime 4
Political instability 4
Political Terror 4
Weapons imports 2
Terrorism impact 2
Deaths from internal conflict 5
Internal conflicts fought 2.56
EXTERNAL PEACE (WEIGHT 1 TO 5)
Military expenditure (% GDP) 2
Armed services personnel rate 2
UN peacekeeping funding 2
Nuclear and heavy weapons capabilities 3
Weapons exports 3
Refugees and IDPs 4
Neighbouring countries relations 5
Number, duration and role in external conflicts 2.28
Deaths from external conflict 5
Weapons imports 2
Terrorism impact 2
Deaths from internal conflict 5
Internal conflicts fought 2.56
5) Scores are assessed by the external advisory panel before finalising the GPI;
6) If the advisory panel finds an indicator score to be questionable, the Custom Research team, and the appropriate regional director and country analyst discuss and make a final judgment on the score, which is then discussed in turn with the advisory panel.
Because of the large scope of the GPI, occasionally data for
quantitative indicators do not extend to all nations. In this
case, country analysts are asked to suggest an alternative data
source or provide an estimate to fill any gap. This score is
checked by Regional Directors to ensure reliability and
consistency within the region, and by the Custom Research
team to ensure global comparability. Again, indicators are
assessed by the external advisory panel before finalisation.
102GLOBAL PEACE INDEX 2015 | Annex A
NUMBER OF INTERNAL SECURITY OFFICERS AND POLICE PER 100,000 PEOPLE
Indicator type Quantitative
Indicator weight 3
Indicator Weight (% of total Index) 4%
Data Source UNODC Survey of Crime Trends and Operations of Criminal Justice Systems, 2013
Measurement period 2012
Alternative Source: EIU. Where data is not provided, the
EIU’s analysts have filled them based on likely scores from the
set bands of the actual data.
Definition: This indicator is sourced from the UNODC Survey of
Crime Trends and Operations of Criminal Justice Systems and
refers to the civil police force. Police means personnel in public
agencies whose principal functions are the prevention, detection
and investigation of crime and the apprehension of alleged
offenders. It is distinct from national guards or local militia.
Scoring Bands
1/5 2/5 3/5 4/5 5/5
0–199.8 199.9–399.8 399.9–599.8 599.9–799.8 > 799.9
LEVEL OF PERCEIVED CRIMINALITY IN SOCIETY
Indicator type Qualitative
Indicator weight 3
Indicator Weight (% of total Index) 4%
Data Source EIU
Measurement period 16 March 2014 to 15 March 2015
Definition: Assessment of the level of perceived criminality in
society, ranked from 1-5 (very low to very high) by the EIU’s
Country Analysis team. Country analysts assess this indicator
on an annual basis, for the period March to March.
Scoring Criteria:
1 = Very low: The majority of other citizens can be trusted;
very low levels of domestic security.
2 = Low: An overall positive climate of trust with other
citizens.
3 = Moderate: Reasonable degree of trust in other citizens.
4 = High: High levels of distrust in other citizens; high levels
of domestic security.
5 = Very high: Very high levels of distrust in other citizens;
people are extremely cautious in their dealings with
others; large number of gated communities, high
prevalence of security guards.
INTERNAL PEACE INDICATORS
The information below details the sources, definitions, and scoring criteria of the 23 indicators that form the Global Peace Index. All scores for each indicator are banded or normalised either on a scale of 1-5, whereby qualitative indicators are banded into five groupings and quantitative ones are either banded into ten groupings or rounded to the first decimal point. The Economist Intelligence Unit has provided imputed estimates in the rare event there are gaps in the quantitative data.
ANNEX B GPI INDICATOR SOURCES, DEFINITIONS AND SCORING CRITERIA
103GLOBAL PEACE INDEX 2015 | Annex A
NUMBER OF HOMICIDES PER 100,000 PEOPLE
Indicator Type Quantitative
Indicator Weight 4
Indicator Weight (% of total Index) 5.3%
Data Source UNODC Survey of Crime Trends and Operations of Criminal Justice Systems, 2013
Measurement period 2012
Alternative Source: EIU. Where data is not provided, the
EIU’s analysts have filled them based on likely scores from the
set bands of the actual data.
Definition: Figures are from the International Centre for
Prison Studies, and are compiled from a variety of sources. In
almost all cases the original source is the national prison
administration of the country concerned, or else the Ministry
responsible for the prison administration. Prison population
rates per 100,000 people are based on estimates of the
national population. In order to compare prison population
rates, and to estimate the number of persons held in prison in
the countries for which information is not available, median
rates have been used by the International Centre for Prison
Studies to minimise the effect of countries with rates that are
untypically high or low. Indeed, comparability can be
compromised by different practice in different countries, for
example with regard to pre-trial detainees and juveniles, but
also psychiatrically ill offenders and offenders being detained
for treatment for alcoholism and drug addiction.
Scoring Bands
1/5 1.5/5 2/5 2.5/5 3/5
0–109.74 109.75–199.4 199.5–289.24 289.25–378.9 379.0–468.74
3.5/5 4/5 4.5/5 5/5
468.75–558.4 558.5– 648.24 648.25–737.9 > 738
Additional Notes: The data provided by World Prison Briefs
are not annual averages but indicate the number of jailed
population per 100,000 inhabitants in a particular month
during the year. The year and month may differ from country
to country.
EASE OF ACCESS TO SMALL ARMS AND LIGHT WEAPONS
Indicator Type Qualitative
Indicator Weight 3
Indicator Weight (% of total Index) 4.0%
Data Source EIU
Measurement period 16 March 2014 to 15 March 2015
Definition: Assessment of the accessibility of small arms and
light weapons (SALW), ranked from 1-5 (very limited access to
very easy access) by the EIU’s Country Analysis team. Country
analysts are asked to assess this indicator on an annual basis,
for the period from March to March.
Scoring Criteria:
1 = Very limited access: The country has developed policy
instruments and best practices, such as firearm licences,
strengthening of export controls, codes of conduct,
firearms or ammunition marking.
Definition: This indicator comes from the UNODC Survey of
Crime Trends and Operations of Criminal Justice Systems.
Intentional homicide refers to death deliberately inflicted on a
person by another person, including infanticide. The figures
refer to the total number of penal code offences or their
equivalent, but exclude minor road traffic and other petty
offences, brought to the attention of the police or other law
enforcement agencies and recorded by one of those agencies.
Scoring Bands
1/5 2/5 3/5 4/5 5/5
0–1.99 2–5.99 6–9.99 10–19.99 > 20
Additional Notes: The scores for the listed countries have
been smoothed following an update of UNODC data:
NUMBER OF JAILED POPULATION PER 100,000 PEOPLE
Indicator Type Quantitative
Indicator Weight 3
Indicator Weight (% of total Index) 4.0%
Data Source International Centre for Prison Studies, University of Essex, World Prison Brief
Measurement period 2004–14, depending upon data availability
• Afghanistan
• Djibouti
• Guinea
• Guinea-Bissau
• Iraq
• Kenya
• Liberia
• Malawi
• Mauritania
• Mozambique
• Niger
• North Korea
• Sierra Leone
• Somalia
• Turkmenistan
104GLOBAL PEACE INDEX 2015 | Annex B
2 = Limited access: The regulation implies that it is difficult,
time-consuming and costly to obtain firearms; domestic
firearms regulation also reduces the ease with which legal
arms are diverted to illicit markets.
3 = Moderate access: There are regulations and
commitment to ensure controls on civilian possession of
firearms, although inadequate controls are not sufficient
to stem the flow of illegal weapons.
4 = Easy access: There are basic regulations, but they are
not effectively enforced; obtaining firearms is
straightforward.
5 = Very easy access: There is no regulation of civilian
possession, ownership, storage, carriage and use of
firearms.
INTENSITY OF ORGANISED INTERNAL CONFLICT
Indicator Type Qualitative
Indicator Weight 5
Indicator Weight (% of total Index) 6.7%
Data Source EIU
Measurement period 16 March 2014 to 15 March 2015
Definition: Assessment of the intensity of conflicts within the
country, ranked from 1-5 (no conflict to severe crisis) by the
EIU’s Country Analysis team. Country analysts are asked to
assess this indicator on an annual basis, for the period March
to March.
Scoring Criteria:
1 = No conflict.
2 = Latent conflict: Positional differences over definable
values of national importance.
3 = Manifest conflict: Explicit threats of violence; imposition
of economic sanctions by other countries.
4 = Crisis: A tense situation across most of the country; at
least one group uses violent force in sporadic incidents.
5 = Severe crisis: Civil war; violent force is used with a
certain continuity in an organised and systematic way
throughout the country.
LIKELIHOOD OF VIOLENT DEMONSTRATIONS
Indicator Type Qualitative
Indicator Weight 3
Indicator Weight (% of total Index) 4.0%
Data Source EIU
Measurement period 16 March 2014 to 15 March 2015
Definition: Assessment of the likelihood of violent
demonstrations ranked from 1-5 (very low to very high) by the
EIU’s Country Analysis team, based on the question, “Are
violent demonstrations or violent civil/labour unrest likely to
pose a threat to property or the conduct of business over the
next two years?” Country analysts assess this question on a
quarterly basis. The score provided for March 2014 - March
2015 is the average of the scores given for each quarter.
Scoring Criteria
“Are violent demonstrations or violent civil/labour unrest
likely to pose a threat to property or the conduct of business
over the next two years?”
1/5 Strongly no
2/5 No
3/5 Somewhat of a problem
4/5 Yes
5/5 Strongly yes
LEVEL OF VIOLENT CRIME
Indicator Type Qualitative
Indicator Weight 4
Indicator Weight (% of total Index) 5.3%
Data Source EIU
Measurement period 16 March 2014 to 15 March 2015
Definition: Assessment of the likelihood of violent crime
ranked from 1 to 5 (very low to very high) by the EIU’s Country
Analysis team based on the question, “Is violent crime likely to
pose a significant problem for government and/or business
over the next two years?” Country analysts assess this question
on a quarterly basis. The score provided for March 2014 -
March 2015 is the average of the scores given for each quarter.
Scoring Criteria
“Is violent crime likely to pose a significant problem for
government and/or business over the next two years?”
1/5 Strongly no
2/5 No
3/5 Somewhat of a problem
4/5 Yes
5/5 Strongly yes
105GLOBAL PEACE INDEX 2015 | Annex B

given year based on a 5-level “terror scale” originally developed
by Freedom House. The data used in compiling this index
comes from two different sources: the yearly country reports of
Amnesty International and the US Department of State’s
Country Reports on Human Rights Practices. The average of
the two scores is taken.
Scoring Criteria:
1 = Countries under a secure rule of law, people are not
imprisoned for their view, and torture is rare or exceptional.
Political murders are extremely rare.
2 = There is a limited amount of imprisonment for nonviolent
political activity. However, few persons are affected, torture
and beatings are exceptional. Political murder is rare.
3 = There is extensive political imprisonment, or a recent history
of such imprisonment. Execution or other political murders
and brutality may be common. Unlimited detention, with or
without a trial, for political views is accepted.
4 = Civil and political rights violations have expanded to large
numbers of the population. Murders, disappearances, and
torture are a common part of life. In spite of its generality,
on this level terror affects those who interest themselves in
politics or ideas.
5 = Terror has expanded to the whole population. The leaders
of these societies place no limits on the means or
thoroughness with which they pursue personal or
ideological goals.
VOLUME OF TRANSFERS OF MAJOR CONVENTIONAL WEAPONS, AS RECIPIENT (IMPORTS) PER 100,000 PEOPLE
Indicator Type Quantitative
Indicator Weight 2
Indicator Weight (% of total Index) 2.7%
Data Source SIPRI Arms Transfers Database; EIU
Measurement period 2009-2013
Definition: Measures the total volume of major conventional
weapons imported by a country between 2009 and 2013,
divided by the average population in this time period at the
100,000 people level (population data supplied by the EIU).
The SIPRI Arms Transfers Database covers all international
sales and gifts of major conventional weapons and the
technology necessary for their production. The transfer
equipment or technology is from one country, rebel force or
international organisation to another country, rebel force or
international organisation. Major conventional weapons
include: aircraft, armoured vehicles, artillery, radar systems,
missiles, ships, engines.
POLITICAL INSTABILITY
Indicator Type Qualitative
Indicator Weight 4
Indicator Weight (% of total Index) 5.3%
Data Source EIU
Measurement period 16 March 2014 to 15 March 2015
Definition: Assessment of political instability ranked from
0 to 100 (very low to very high instability) by the EIU’s Country
Analysis team, based on five questions. This indicator aggregates
five other questions on social unrest, orderly transfers, opposition
stance, excessive executive authority and an international tension
sub-index. Country analysts assess this question on a quarterly
basis. The score provided for March 2014–March 2015 is the
average of the scores given for each quarter.
Specific Questions:
• What is the risk of significant social unrest during the next
two years?
• How clear, established and accepted are constitutional
mechanisms for the orderly transfer of power from one
government to another?
• How likely is it that an opposition party or group will come to
power and cause a significant deterioration in business
operating conditions?
• Is excessive power concentrated or likely to be concentrated in
the executive so that executive authority lacks accountability
and possesses excessive discretion?
• Is there a risk that international disputes/tensions will
negatively affect the economy and/or polity?
Scoring Bands
1/5 2/5 3/5 4/5 5/5
0–20.4 20.5–40.4 40.5–60.4 60.5–80.4 80.5–100
POLITICAL TERROR SCALE
Indicator Type Qualitative
Indicator Weight 4
Indicator Weight (% of total Index) 5.3%
Data Source Gibney, M., Cornett, L. & Wood, R. (2011): Political Terror Scale 1976-2013
Measurement period 2013
Definition: The Political Terror Scale (PTS) measures levels of
political violence and terror that a country experiences in a
106GLOBAL PEACE INDEX 2015 | Annex B
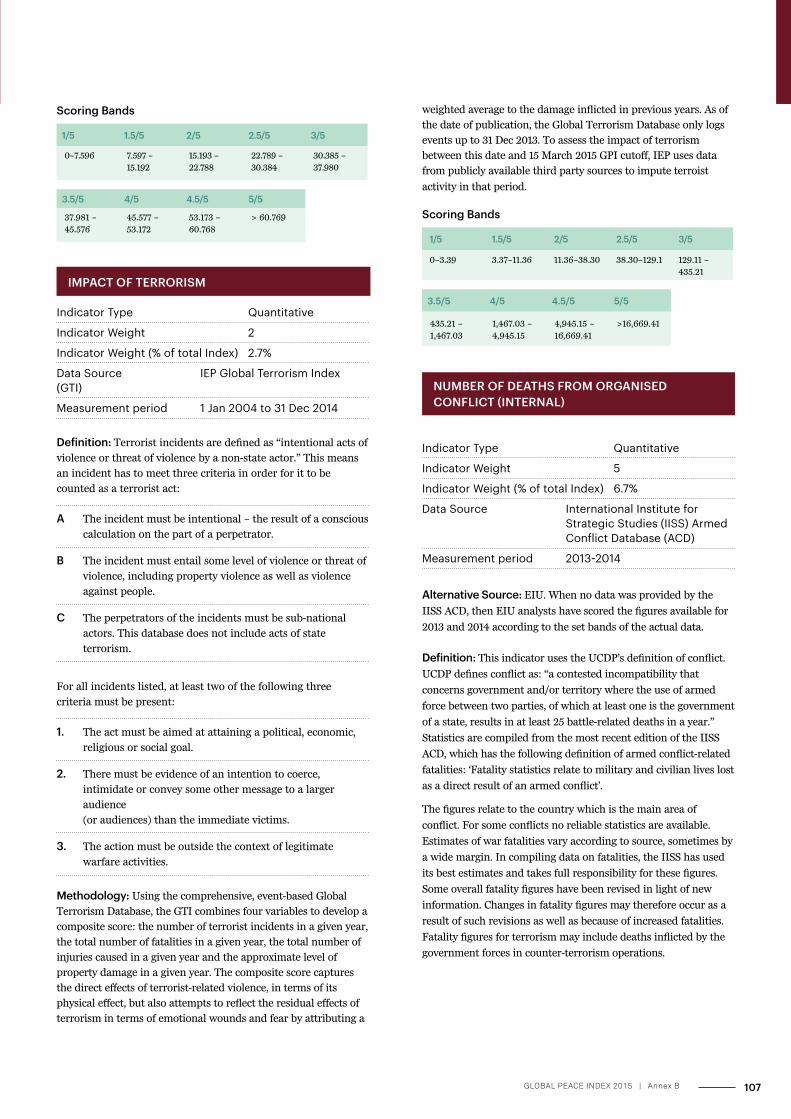
weighted average to the damage inflicted in previous years. As of
the date of publication, the Global Terrorism Database only logs
events up to 31 Dec 2013. To assess the impact of terrorism
between this date and 15 March 2015 GPI cutoff, IEP uses data
from publicly available third party sources to impute terroist
activity in that period.
Scoring Bands
1/5 1.5/5 2/5 2.5/5 3/5
0–3.39 3.37–11.36 11.36–38.30 38.30–129.1 129.11 – 435.21
3.5/5 4/5 4.5/5 5/5
435.21 – 1,467.03
1,467.03 – 4,945.15
4,945.15 – 16,669.41
>16,669.41
NUMBER OF DEATHS FROM ORGANISED CONFLICT (INTERNAL)
Indicator Type Quantitative
Indicator Weight 5
Indicator Weight (% of total Index) 6.7%
Data Source International Institute for Strategic Studies (IISS) Armed Conflict Database (ACD)
Measurement period 2013-2014
Alternative Source: EIU. When no data was provided by the
IISS ACD, then EIU analysts have scored the figures available for
2013 and 2014 according to the set bands of the actual data.
Definition: This indicator uses the UCDP’s definition of conflict.
UCDP defines conflict as: “a contested incompatibility that
concerns government and/or territory where the use of armed
force between two parties, of which at least one is the government
of a state, results in at least 25 battle-related deaths in a year.”
Statistics are compiled from the most recent edition of the IISS
ACD, which has the following definition of armed conflict-related
fatalities: ‘Fatality statistics relate to military and civilian lives lost
as a direct result of an armed conflict’.
The figures relate to the country which is the main area of
conflict. For some conflicts no reliable statistics are available.
Estimates of war fatalities vary according to source, sometimes by
a wide margin. In compiling data on fatalities, the IISS has used
its best estimates and takes full responsibility for these figures.
Some overall fatality figures have been revised in light of new
information. Changes in fatality figures may therefore occur as a
result of such revisions as well as because of increased fatalities.
Fatality figures for terrorism may include deaths inflicted by the
government forces in counter-terrorism operations.
Scoring Bands
1/5 1.5/5 2/5 2.5/5 3/5
0–7.596 7.597 – 15.192
15.193 – 22.788
22.789 – 30.384
30.385 – 37.980
3.5/5 4/5 4.5/5 5/5
37.981 – 45.576
45.577 – 53.172
53.173 – 60.768
> 60.769
IMPACT OF TERRORISM
Indicator Type Quantitative
Indicator Weight 2
Indicator Weight (% of total Index) 2.7%
Data Source IEP Global Terrorism Index (GTI)
Measurement period 1 Jan 2004 to 31 Dec 2014
Definition: Terrorist incidents are defined as “intentional acts of
violence or threat of violence by a non-state actor.” This means
an incident has to meet three criteria in order for it to be
counted as a terrorist act:
A The incident must be intentional – the result of a conscious
calculation on the part of a perpetrator.
B The incident must entail some level of violence or threat of
violence, including property violence as well as violence
against people.
C The perpetrators of the incidents must be sub-national
actors. This database does not include acts of state
terrorism.
For all incidents listed, at least two of the following three
criteria must be present:
1. The act must be aimed at attaining a political, economic,
religious or social goal.
2. There must be evidence of an intention to coerce,
intimidate or convey some other message to a larger
audience
(or audiences) than the immediate victims.
3. The action must be outside the context of legitimate
warfare activities.
Methodology: Using the comprehensive, event-based Global
Terrorism Database, the GTI combines four variables to develop a
composite score: the number of terrorist incidents in a given year,
the total number of fatalities in a given year, the total number of
injuries caused in a given year and the approximate level of
property damage in a given year. The composite score captures
the direct effects of terrorist-related violence, in terms of its
physical effect, but also attempts to reflect the residual effects of
terrorism in terms of emotional wounds and fear by attributing a
107GLOBAL PEACE INDEX 2015 | Annex B
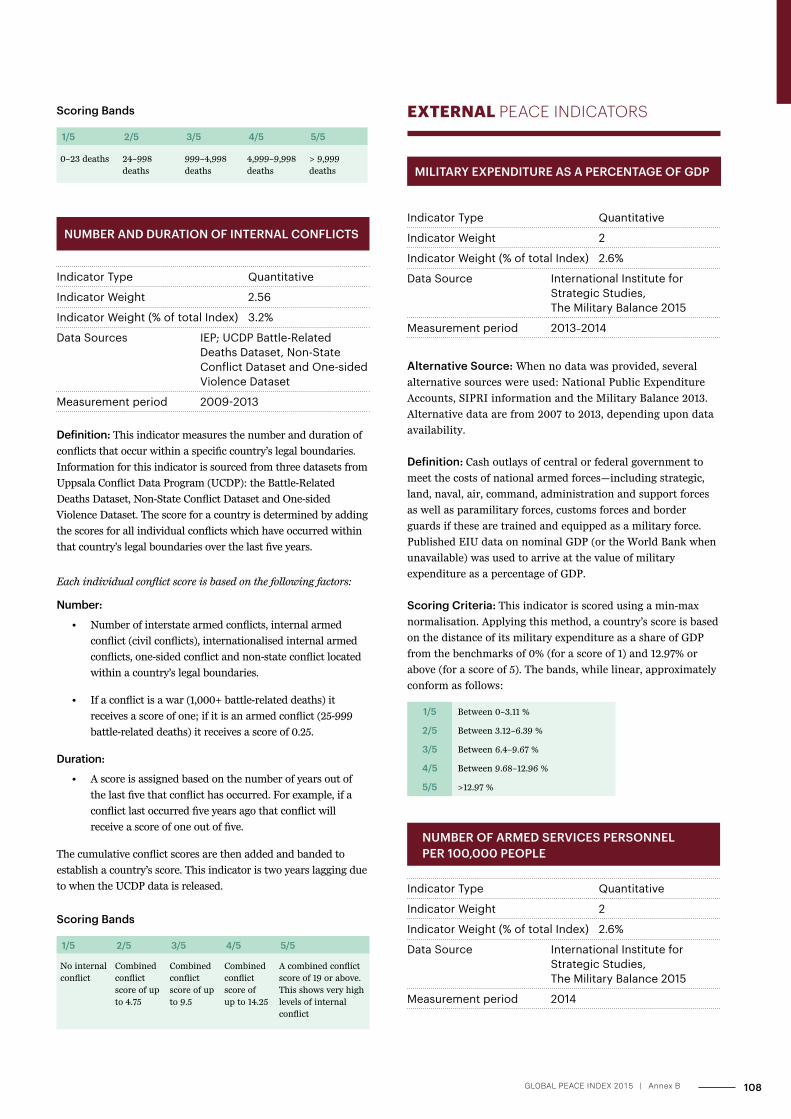
MILITARY EXPENDITURE AS A PERCENTAGE OF GDP
Indicator Type Quantitative
Indicator Weight 2
Indicator Weight (% of total Index) 2.6%
Data Source International Institute for Strategic Studies, The Military Balance 2015
Measurement period 2013–2014
Alternative Source: When no data was provided, several
alternative sources were used: National Public Expenditure
Accounts, SIPRI information and the Military Balance 2013.
Alternative data are from 2007 to 2013, depending upon data
availability.
Definition: Cash outlays of central or federal government to
meet the costs of national armed forces—including strategic,
land, naval, air, command, administration and support forces
as well as paramilitary forces, customs forces and border
guards if these are trained and equipped as a military force.
Published EIU data on nominal GDP (or the World Bank when
unavailable) was used to arrive at the value of military
expenditure as a percentage of GDP.
Scoring Criteria: This indicator is scored using a min-max
normalisation. Applying this method, a country’s score is based
on the distance of its military expenditure as a share of GDP
from the benchmarks of 0% (for a score of 1) and 12.97% or
above (for a score of 5). The bands, while linear, approximately
conform as follows:
1/5 Between 0–3.11 %
2/5 Between 3.12–6.39 %
3/5 Between 6.4–9.67 %
4/5 Between 9.68–12.96 %
5/5 >12.97 %
NUMBER OF ARMED SERVICES PERSONNEL PER 100,000 PEOPLE
Indicator Type Quantitative
Indicator Weight 2
Indicator Weight (% of total Index) 2.6%
Data Source International Institute for Strategic Studies, The Military Balance 2015
Measurement period 2014
NUMBER AND DURATION OF INTERNAL CONFLICTS
Indicator Type Quantitative
Indicator Weight 2.56
Indicator Weight (% of total Index) 3.2%
Data Sources IEP; UCDP Battle-Related Deaths Dataset, Non-State Conflict Dataset and One-sided Violence Dataset
Measurement period 2009-2013
Definition: This indicator measures the number and duration of
conflicts that occur within a specific country’s legal boundaries.
Information for this indicator is sourced from three datasets from
Uppsala Conflict Data Program (UCDP): the Battle-Related
Deaths Dataset, Non-State Conflict Dataset and One-sided
Violence Dataset. The score for a country is determined by adding
the scores for all individual conflicts which have occurred within
that country’s legal boundaries over the last five years.
Each individual conflict score is based on the following factors:
Number:
• Number of interstate armed conflicts, internal armed
conflict (civil conflicts), internationalised internal armed
conflicts, one-sided conflict and non-state conflict located
within a country’s legal boundaries.
• If a conflict is a war (1,000+ battle-related deaths) it
receives a score of one; if it is an armed conflict (25-999
battle-related deaths) it receives a score of 0.25.
Duration:
• A score is assigned based on the number of years out of
the last five that conflict has occurred. For example, if a
conflict last occurred five years ago that conflict will
receive a score of one out of five.
The cumulative conflict scores are then added and banded to
establish a country’s score. This indicator is two years lagging due
to when the UCDP data is released.
Scoring Bands
1/5 2/5 3/5 4/5 5/5
No internal conflict
Combined conflict score of up to 4.75
Combined conflict score of up to 9.5
Combined conflict score of up to 14.25
A combined conflict score of 19 or above. This shows very high levels of internal conflict
Scoring Bands
1/5 2/5 3/5 4/5 5/5
0–23 deaths 24–998 deaths
999–4,998 deaths
4,999–9,998 deaths
> 9,999 deaths
EXTERNAL PEACE INDICATORS
108GLOBAL PEACE INDEX 2015 | Annex B
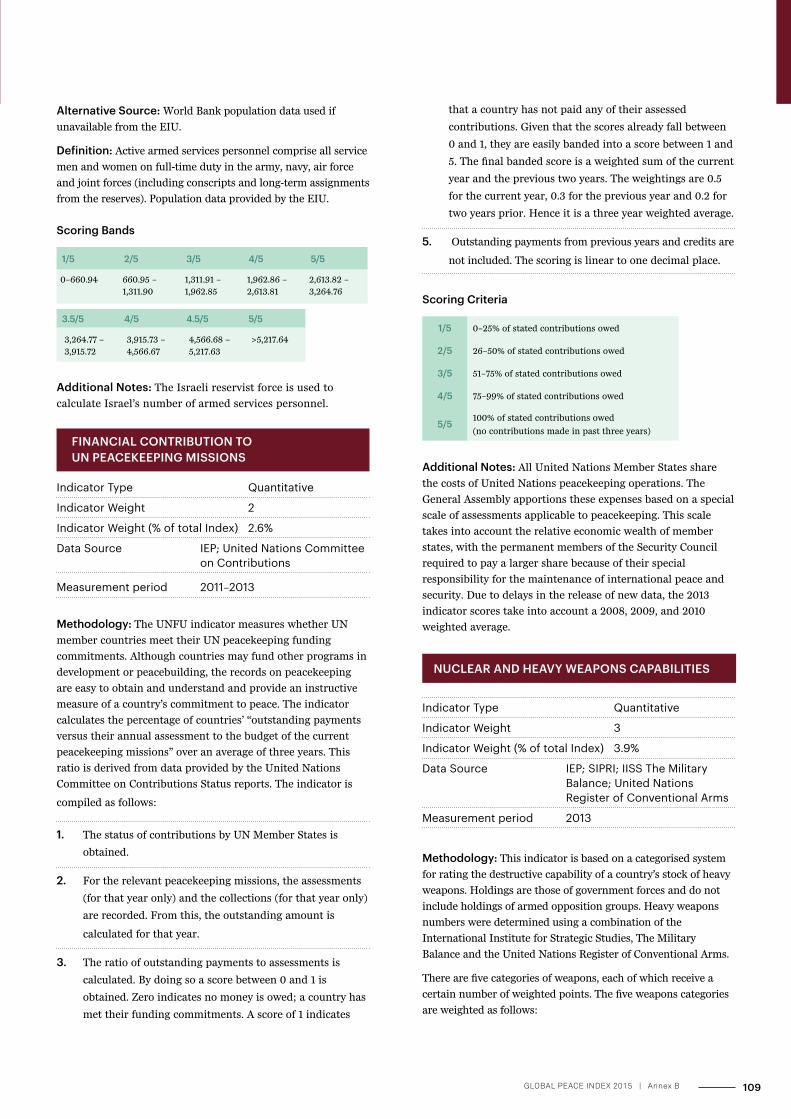
that a country has not paid any of their assessed
contributions. Given that the scores already fall between
0 and 1, they are easily banded into a score between 1 and
5. The final banded score is a weighted sum of the current
year and the previous two years. The weightings are 0.5
for the current year, 0.3 for the previous year and 0.2 for
two years prior. Hence it is a three year weighted average.
5. Outstanding payments from previous years and credits are
not included. The scoring is linear to one decimal place.
Scoring Criteria
1/5 0–25% of stated contributions owed
2/5 26–50% of stated contributions owed
3/5 51–75% of stated contributions owed
4/5 75–99% of stated contributions owed
5/5100% of stated contributions owed
(no contributions made in past three years)
Additional Notes: All United Nations Member States share
the costs of United Nations peacekeeping operations. The
General Assembly apportions these expenses based on a special
scale of assessments applicable to peacekeeping. This scale
takes into account the relative economic wealth of member
states, with the permanent members of the Security Council
required to pay a larger share because of their special
responsibility for the maintenance of international peace and
security. Due to delays in the release of new data, the 2013
indicator scores take into account a 2008, 2009, and 2010
weighted average.
NUCLEAR AND HEAVY WEAPONS CAPABILITIES
Indicator Type Quantitative
Indicator Weight 3
Indicator Weight (% of total Index) 3.9%
Data Source IEP; SIPRI; IISS The Military Balance; United Nations Register of Conventional Arms
Measurement period 2013
Methodology: This indicator is based on a categorised system
for rating the destructive capability of a country’s stock of heavy
weapons. Holdings are those of government forces and do not
include holdings of armed opposition groups. Heavy weapons
numbers were determined using a combination of the
International Institute for Strategic Studies, The Military
Balance and the United Nations Register of Conventional Arms.
There are five categories of weapons, each of which receive a
certain number of weighted points. The five weapons categories
are weighted as follows:
Alternative Source: World Bank population data used if
unavailable from the EIU.
Definition: Active armed services personnel comprise all service
men and women on full-time duty in the army, navy, air force
and joint forces (including conscripts and long-term assignments
from the reserves). Population data provided by the EIU.
Scoring Bands
1/5 2/5 3/5 4/5 5/5
0–660.94 660.95 – 1,311.90
1,311.91 – 1,962.85
1,962.86 – 2,613.81
2,613.82 – 3,264.76
3.5/5 4/5 4.5/5 5/5
3,264.77 – 3,915.72
3,915.73 – 4,566.67
4,566.68 – 5,217.63
>5,217.64
Additional Notes: The Israeli reservist force is used to
calculate Israel’s number of armed services personnel.
FINANCIAL CONTRIBUTION TO UN PEACEKEEPING MISSIONS
Indicator Type Quantitative
Indicator Weight 2
Indicator Weight (% of total Index) 2.6%
Data Source IEP; United Nations Committee on Contributions
Measurement period 2011–2013
Methodology: The UNFU indicator measures whether UN
member countries meet their UN peacekeeping funding
commitments. Although countries may fund other programs in
development or peacebuilding, the records on peacekeeping
are easy to obtain and understand and provide an instructive
measure of a country’s commitment to peace. The indicator
calculates the percentage of countries’ “outstanding payments
versus their annual assessment to the budget of the current
peacekeeping missions” over an average of three years. This
ratio is derived from data provided by the United Nations
Committee on Contributions Status reports. The indicator is
compiled as follows:
1. The status of contributions by UN Member States is
obtained.
2. For the relevant peacekeeping missions, the assessments
(for that year only) and the collections (for that year only)
are recorded. From this, the outstanding amount is
calculated for that year.
3. The ratio of outstanding payments to assessments is
calculated. By doing so a score between 0 and 1 is
obtained. Zero indicates no money is owed; a country has
met their funding commitments. A score of 1 indicates
109GLOBAL PEACE INDEX 2015 | Annex B
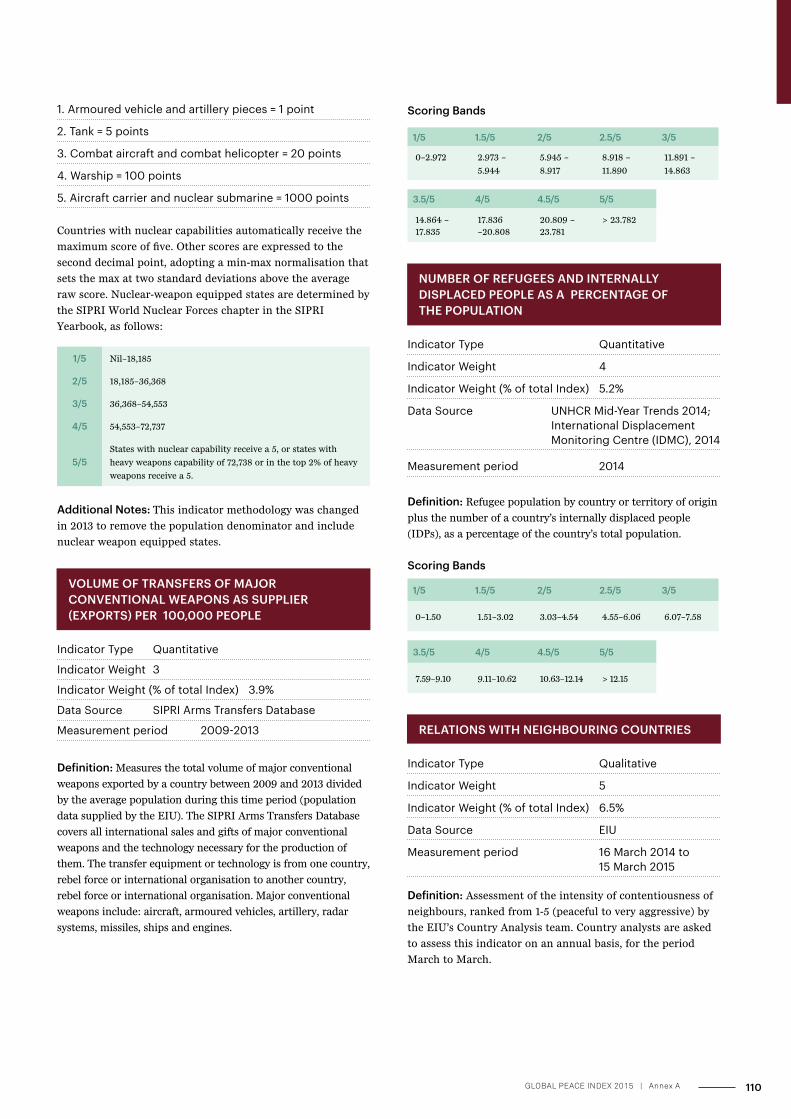
1. Armoured vehicle and artillery pieces = 1 point
2. Tank = 5 points
3. Combat aircraft and combat helicopter = 20 points
4. Warship = 100 points
5. Aircraft carrier and nuclear submarine = 1000 points
Countries with nuclear capabilities automatically receive the
maximum score of five. Other scores are expressed to the
second decimal point, adopting a min-max normalisation that
sets the max at two standard deviations above the average
raw score. Nuclear-weapon equipped states are determined by
the SIPRI World Nuclear Forces chapter in the SIPRI
Yearbook, as follows:
1/5 Nil–18,185
2/5 18,185–36,368
3/5 36,368–54,553
4/5 54,553–72,737
5/5States with nuclear capability receive a 5, or states with
heavy weapons capability of 72,738 or in the top 2% of heavy
weapons receive a 5.
Additional Notes: This indicator methodology was changed
in 2013 to remove the population denominator and include
nuclear weapon equipped states.
VOLUME OF TRANSFERS OF MAJOR CONVENTIONAL WEAPONS AS SUPPLIER (EXPORTS) PER 100,000 PEOPLE
Indicator Type Quantitative
Indicator Weight 3
Indicator Weight (% of total Index) 3.9%
Data Source SIPRI Arms Transfers Database
Measurement period 2009-2013
Definition: Measures the total volume of major conventional
weapons exported by a country between 2009 and 2013 divided
by the average population during this time period (population
data supplied by the EIU). The SIPRI Arms Transfers Database
covers all international sales and gifts of major conventional
weapons and the technology necessary for the production of
them. The transfer equipment or technology is from one country,
rebel force or international organisation to another country,
rebel force or international organisation. Major conventional
weapons include: aircraft, armoured vehicles, artillery, radar
systems, missiles, ships and engines.
Scoring Bands
1/5 1.5/5 2/5 2.5/5 3/5
0–2.972 2.973 –
5.944
5.945 –
8.917
8.918 –
11.890
11.891 –
14.863
3.5/5 4/5 4.5/5 5/5
14.864 – 17.835
17.836 –20.808
20.809 – 23.781
> 23.782
NUMBER OF REFUGEES AND INTERNALLY DISPLACED PEOPLE AS A PERCENTAGE OF THE POPULATION
Indicator Type Quantitative
Indicator Weight 4
Indicator Weight (% of total Index) 5.2%
Data Source UNHCR Mid-Year Trends 2014; International Displacement Monitoring Centre (IDMC), 2014
Measurement period 2014
Definition: Refugee population by country or territory of origin
plus the number of a country’s internally displaced people
(IDPs), as a percentage of the country’s total population.
Scoring Bands
1/5 1.5/5 2/5 2.5/5 3/5
0–1.50 1.51–3.02 3.03–4.54 4.55–6.06 6.07–7.58
3.5/5 4/5 4.5/5 5/5
7.59–9.10 9.11–10.62 10.63–12.14 > 12.15
RELATIONS WITH NEIGHBOURING COUNTRIES
Indicator Type Qualitative
Indicator Weight 5
Indicator Weight (% of total Index) 6.5%
Data Source EIU
Measurement period 16 March 2014 to 15 March 2015
Definition: Assessment of the intensity of contentiousness of
neighbours, ranked from 1-5 (peaceful to very aggressive) by
the EIU’s Country Analysis team. Country analysts are asked
to assess this indicator on an annual basis, for the period
March to March.
110GLOBAL PEACE INDEX 2015 | Annex A
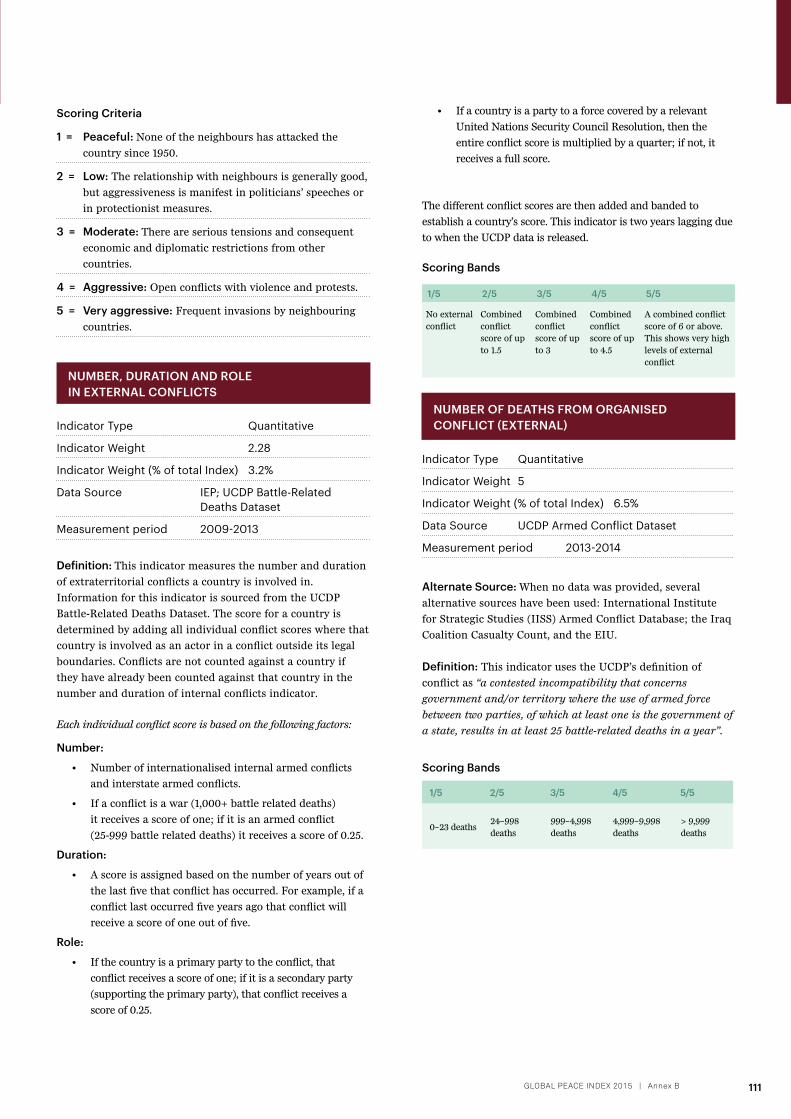
• If a country is a party to a force covered by a relevant
United Nations Security Council Resolution, then the
entire conflict score is multiplied by a quarter; if not, it
receives a full score.
The different conflict scores are then added and banded to
establish a country’s score. This indicator is two years lagging due
to when the UCDP data is released.
Scoring Bands
1/5 2/5 3/5 4/5 5/5
No external conflict
Combined conflict score of up to 1.5
Combined conflict score of up to 3
Combined conflict score of up to 4.5
A combined conflict score of 6 or above. This shows very high levels of external conflict
NUMBER OF DEATHS FROM ORGANISED CONFLICT (EXTERNAL)
Indicator Type Quantitative
Indicator Weight 5
Indicator Weight (% of total Index) 6.5%
Data Source UCDP Armed Conflict Dataset
Measurement period 2013-2014
Alternate Source: When no data was provided, several
alternative sources have been used: International Institute
for Strategic Studies (IISS) Armed Conflict Database; the Iraq
Coalition Casualty Count, and the EIU.
Definition: This indicator uses the UCDP’s definition of
conflict as “a contested incompatibility that concerns
government and/or territory where the use of armed force
between two parties, of which at least one is the government of
a state, results in at least 25 battle-related deaths in a year”.
Scoring Bands
1/5 2/5 3/5 4/5 5/5
0–23 deaths24–998 deaths
999–4,998 deaths
4,999–9,998 deaths
> 9,999 deaths
Scoring Criteria
1 = Peaceful: None of the neighbours has attacked the
country since 1950.
2 = Low: The relationship with neighbours is generally good,
but aggressiveness is manifest in politicians’ speeches or
in protectionist measures.
3 = Moderate: There are serious tensions and consequent
economic and diplomatic restrictions from other
countries.
4 = Aggressive: Open conflicts with violence and protests.
5 = Very aggressive: Frequent invasions by neighbouring
countries.
NUMBER, DURATION AND ROLE IN EXTERNAL CONFLICTS
Indicator Type Quantitative
Indicator Weight 2.28
Indicator Weight (% of total Index) 3.2%
Data Source IEP; UCDP Battle-Related Deaths Dataset
Measurement period 2009-2013
Definition: This indicator measures the number and duration
of extraterritorial conflicts a country is involved in.
Information for this indicator is sourced from the UCDP
Battle-Related Deaths Dataset. The score for a country is
determined by adding all individual conflict scores where that
country is involved as an actor in a conflict outside its legal
boundaries. Conflicts are not counted against a country if
they have already been counted against that country in the
number and duration of internal conflicts indicator.
Each individual conflict score is based on the following factors:
Number:
• Number of internationalised internal armed conflicts
and interstate armed conflicts.
• If a conflict is a war (1,000+ battle related deaths)
it receives a score of one; if it is an armed conflict
(25-999 battle related deaths) it receives a score of 0.25.
Duration:
• A score is assigned based on the number of years out of
the last five that conflict has occurred. For example, if a
conflict last occurred five years ago that conflict will
receive a score of one out of five.
Role:
• If the country is a primary party to the conflict, that
conflict receives a score of one; if it is a secondary party
(supporting the primary party), that conflict receives a
score of 0.25.
111GLOBAL PEACE INDEX 2015 | Annex B
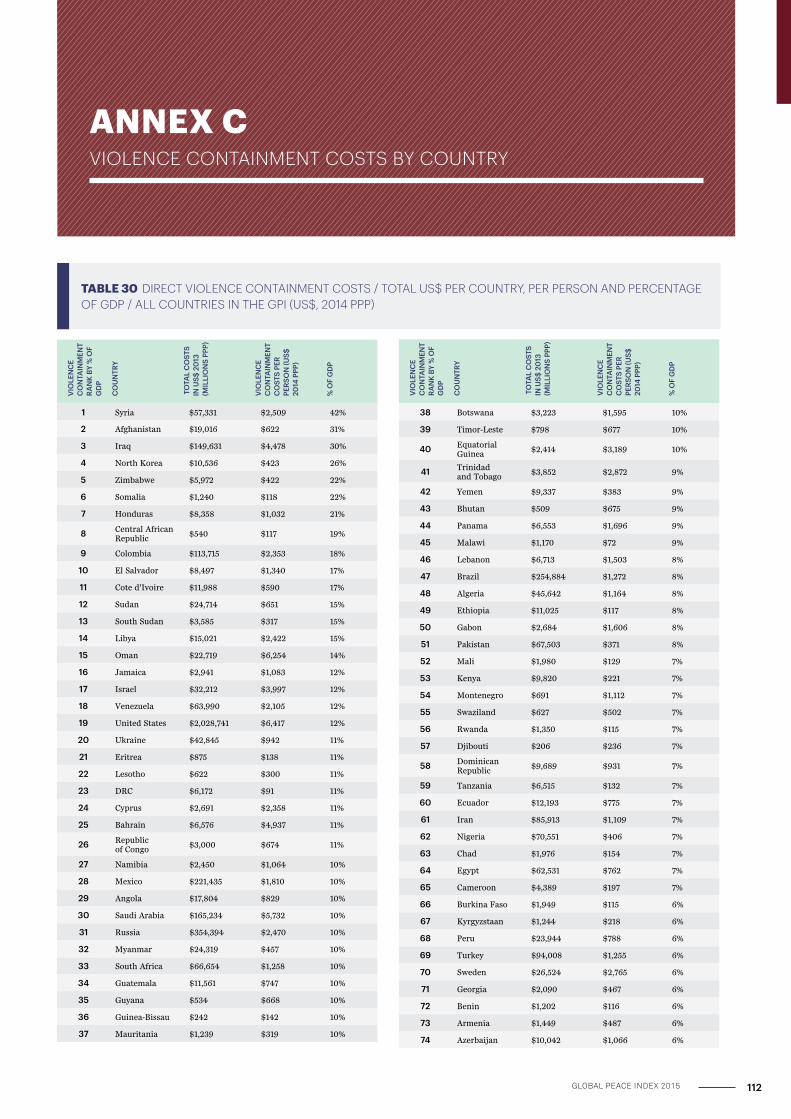
TABLE 30 DIRECT VIOLENCE CONTAINMENT COSTS / TOTAL US$ PER COUNTRY, PER PERSON AND PERCENTAGE OF GDP / ALL COUNTRIES IN THE GPI (US$, 2014 PPP)
ANNEX C VIOLENCE CONTAINMENT COSTS BY COUNTRY
VIO
LEN
CE
CO
NTA
INM
ENT
RAN
K BY
% O
F G
DP
CO
UN
TRY
TO
TAL
CO
STS
IN U
S$ 2
013
(M
ILLI
ON
S PP
P)
VIO
LEN
CE
CO
NTA
INM
ENT
CO
STS
PER
PERS
ON
(US$
20
14 P
PP)
% O
F G
DP
1 Syria $57,331 $2,509 42%
2 Afghanistan $19,016 $622 31%
3 Iraq $149,631 $4,478 30%
4 North Korea $10,536 $423 26%
5 Zimbabwe $5,972 $422 22%
6 Somalia $1,240 $118 22%
7 Honduras $8,358 $1,032 21%
8 Central African Republic
$540 $117 19%
9 Colombia $113,715 $2,353 18%
10 El Salvador $8,497 $1,340 17%
11 Cote d'Ivoire $11,988 $590 17%
12 Sudan $24,714 $651 15%
13 South Sudan $3,585 $317 15%
14 Libya $15,021 $2,422 15%
15 Oman $22,719 $6,254 14%
16 Jamaica $2,941 $1,083 12%
17 Israel $32,212 $3,997 12%
18 Venezuela $63,990 $2,105 12%
19 United States $2,028,741 $6,417 12%
20 Ukraine $42,845 $942 11%
21 Eritrea $875 $138 11%
22 Lesotho $622 $300 11%
23 DRC $6,172 $91 11%
24 Cyprus $2,691 $2,358 11%
25 Bahrain $6,576 $4,937 11%
26 Republic of Congo
$3,000 $674 11%
27 Namibia $2,450 $1,064 10%
28 Mexico $221,435 $1,810 10%
29 Angola $17,804 $829 10%
30 Saudi Arabia $165,234 $5,732 10%
31 Russia $354,394 $2,470 10%
32 Myanmar $24,319 $457 10%
33 South Africa $66,654 $1,258 10%
34 Guatemala $11,561 $747 10%
35 Guyana $534 $668 10%
36 Guinea-Bissau $242 $142 10%
37 Mauritania $1,239 $319 10%
VIO
LEN
CE
CO
NTA
INM
ENT
RAN
K BY
% O
F G
DP
CO
UN
TRY
TO
TAL
CO
STS
IN U
S$ 2
013
(M
ILLI
ON
S PP
P)
VIO
LEN
CE
CO
NTA
INM
ENT
CO
STS
PER
PERS
ON
(US$
20
14 P
PP)
% O
F G
DP
38 Botswana $3,223 $1,595 10%
39 Timor-Leste $798 $677 10%
40 Equatorial Guinea
$2,414 $3,189 10%
41 Trinidad and Tobago
$3,852 $2,872 9%
42 Yemen $9,337 $383 9%
43 Bhutan $509 $675 9%
44 Panama $6,553 $1,696 9%
45 Malawi $1,170 $72 9%
46 Lebanon $6,713 $1,503 8%
47 Brazil $254,884 $1,272 8%
48 Algeria $45,642 $1,164 8%
49 Ethiopia $11,025 $117 8%
50 Gabon $2,684 $1,606 8%
51 Pakistan $67,503 $371 8%
52 Mali $1,980 $129 7%
53 Kenya $9,820 $221 7%
54 Montenegro $691 $1,112 7%
55 Swaziland $627 $502 7%
56 Rwanda $1,350 $115 7%
57 Djibouti $206 $236 7%
58 Dominican Republic
$9,689 $931 7%
59 Tanzania $6,515 $132 7%
60 Ecuador $12,193 $775 7%
61 Iran $85,913 $1,109 7%
62 Nigeria $70,551 $406 7%
63 Chad $1,976 $154 7%
64 Egypt $62,531 $762 7%
65 Cameroon $4,389 $197 7%
66 Burkina Faso $1,949 $115 6%
67 Kyrgyzstaan $1,244 $218 6%
68 Peru $23,944 $788 6%
69 Turkey $94,008 $1,255 6%
70 Sweden $26,524 $2,765 6%
71 Georgia $2,090 $467 6%
72 Benin $1,202 $116 6%
73 Armenia $1,449 $487 6%
74 Azerbaijan $10,042 $1,066 6%
112GLOBAL PEACE INDEX 2015
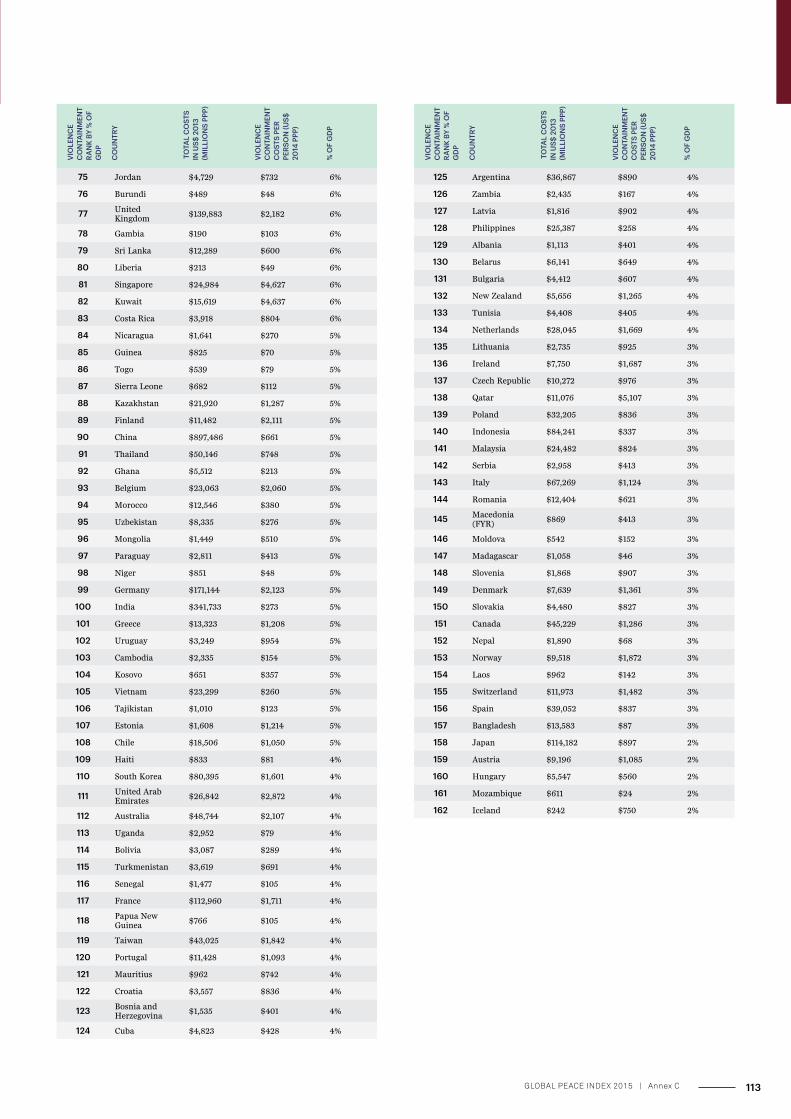
VIO
LEN
CE
CO
NTA
INM
ENT
RAN
K BY
% O
F G
DP
CO
UN
TRY
TO
TAL
CO
STS
IN U
S$ 2
013
(M
ILLI
ON
S PP
P)
VIO
LEN
CE
CO
NTA
INM
ENT
CO
STS
PER
PERS
ON
(US$
20
14 P
PP)
% O
F G
DP
75 Jordan $4,729 $732 6%
76 Burundi $489 $48 6%
77 United Kingdom
$139,883 $2,182 6%
78 Gambia $190 $103 6%
79 Sri Lanka $12,289 $600 6%
80 Liberia $213 $49 6%
81 Singapore $24,984 $4,627 6%
82 Kuwait $15,619 $4,637 6%
83 Costa Rica $3,918 $804 6%
84 Nicaragua $1,641 $270 5%
85 Guinea $825 $70 5%
86 Togo $539 $79 5%
87 Sierra Leone $682 $112 5%
88 Kazakhstan $21,920 $1,287 5%
89 Finland $11,482 $2,111 5%
90 China $897,486 $661 5%
91 Thailand $50,146 $748 5%
92 Ghana $5,512 $213 5%
93 Belgium $23,063 $2,060 5%
94 Morocco $12,546 $380 5%
95 Uzbekistan $8,335 $276 5%
96 Mongolia $1,449 $510 5%
97 Paraguay $2,811 $413 5%
98 Niger $851 $48 5%
99 Germany $171,144 $2,123 5%
100 India $341,733 $273 5%
101 Greece $13,323 $1,208 5%
102 Uruguay $3,249 $954 5%
103 Cambodia $2,335 $154 5%
104 Kosovo $651 $357 5%
105 Vietnam $23,299 $260 5%
106 Tajikistan $1,010 $123 5%
107 Estonia $1,608 $1,214 5%
108 Chile $18,506 $1,050 5%
109 Haiti $833 $81 4%
110 South Korea $80,395 $1,601 4%
111 United Arab Emirates
$26,842 $2,872 4%
112 Australia $48,744 $2,107 4%
113 Uganda $2,952 $79 4%
114 Bolivia $3,087 $289 4%
115 Turkmenistan $3,619 $691 4%
116 Senegal $1,477 $105 4%
117 France $112,960 $1,711 4%
118 Papua New Guinea
$766 $105 4%
119 Taiwan $43,025 $1,842 4%
120 Portugal $11,428 $1,093 4%
121 Mauritius $962 $742 4%
122 Croatia $3,557 $836 4%
123 Bosnia and Herzegovina
$1,535 $401 4%
124 Cuba $4,823 $428 4%
VIO
LEN
CE
CO
NTA
INM
ENT
RAN
K BY
% O
F G
DP
CO
UN
TRY
TO
TAL
CO
STS
IN U
S$ 2
013
(M
ILLI
ON
S PP
P)
VIO
LEN
CE
CO
NTA
INM
ENT
CO
STS
PER
PERS
ON
(US$
20
14 P
PP)
% O
F G
DP
125 Argentina $36,867 $890 4%
126 Zambia $2,435 $167 4%
127 Latvia $1,816 $902 4%
128 Philippines $25,387 $258 4%
129 Albania $1,113 $401 4%
130 Belarus $6,141 $649 4%
131 Bulgaria $4,412 $607 4%
132 New Zealand $5,656 $1,265 4%
133 Tunisia $4,408 $405 4%
134 Netherlands $28,045 $1,669 4%
135 Lithuania $2,735 $925 3%
136 Ireland $7,750 $1,687 3%
137 Czech Republic $10,272 $976 3%
138 Qatar $11,076 $5,107 3%
139 Poland $32,205 $836 3%
140 Indonesia $84,241 $337 3%
141 Malaysia $24,482 $824 3%
142 Serbia $2,958 $413 3%
143 Italy $67,269 $1,124 3%
144 Romania $12,404 $621 3%
145 Macedonia (FYR)
$869 $413 3%
146 Moldova $542 $152 3%
147 Madagascar $1,058 $46 3%
148 Slovenia $1,868 $907 3%
149 Denmark $7,639 $1,361 3%
150 Slovakia $4,480 $827 3%
151 Canada $45,229 $1,286 3%
152 Nepal $1,890 $68 3%
153 Norway $9,518 $1,872 3%
154 Laos $962 $142 3%
155 Switzerland $11,973 $1,482 3%
156 Spain $39,052 $837 3%
157 Bangladesh $13,583 $87 3%
158 Japan $114,182 $897 2%
159 Austria $9,196 $1,085 2%
160 Hungary $5,547 $560 2%
161 Mozambique $611 $24 2%
162 Iceland $242 $750 2%
113GLOBAL PEACE INDEX 2015 | Annex C
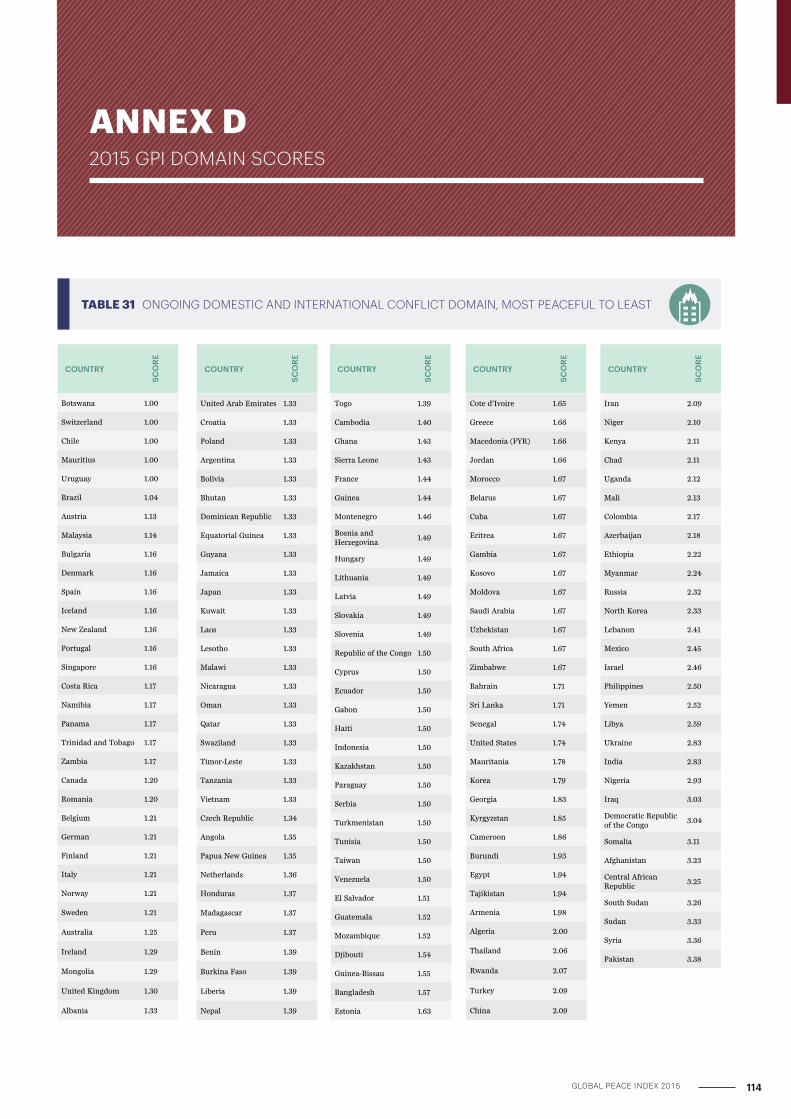
ANNEX D 2015 GPI DOMAIN SCORES
TABLE 31 ONGOING DOMESTIC AND INTERNATIONAL CONFLICT DOMAIN, MOST PEACEFUL TO LEAST
COUNTRY
SC
ORE
Botswana 1.00
Switzerland 1.00
Chile 1.00
Mauritius 1.00
Uruguay 1.00
Brazil 1.04
Austria 1.13
Malaysia 1.14
Bulgaria 1.16
Denmark 1.16
Spain 1.16
Iceland 1.16
New Zealand 1.16
Portugal 1.16
Singapore 1.16
Costa Rica 1.17
Namibia 1.17
Panama 1.17
Trinidad and Tobago 1.17
Zambia 1.17
Canada 1.20
Romania 1.20
Belgium 1.21
German 1.21
Finland 1.21
Italy 1.21
Norway 1.21
Sweden 1.21
Australia 1.25
Ireland 1.29
Mongolia 1.29
United Kingdom 1.30
Albania 1.33
United Arab Emirates 1.33
Croatia 1.33
Poland 1.33
Argentina 1.33
Bolivia 1.33
Bhutan 1.33
Dominican Republic 1.33
Equatorial Guinea 1.33
Guyana 1.33
Jamaica 1.33
Japan 1.33
Kuwait 1.33
Laos 1.33
Lesotho 1.33
Malawi 1.33
Nicaragua 1.33
Oman 1.33
Qatar 1.33
Swaziland 1.33
Timor-Leste 1.33
Tanzania 1.33
Vietnam 1.33
Czech Republic 1.34
Angola 1.35
Papua New Guinea 1.35
Netherlands 1.36
Honduras 1.37
Madagascar 1.37
Peru 1.37
Benin 1.39
Burkina Faso 1.39
Liberia 1.39
Nepal 1.39
Togo 1.39
Cambodia 1.40
Ghana 1.43
Sierra Leone 1.43
France 1.44
Guinea 1.44
Montenegro 1.46
Bosnia and Herzegovina
1.49
Hungary 1.49
Lithuania 1.49
Latvia 1.49
Slovakia 1.49
Slovenia 1.49
Republic of the Congo 1.50
Cyprus 1.50
Ecuador 1.50
Gabon 1.50
Haiti 1.50
Indonesia 1.50
Kazakhstan 1.50
Paraguay 1.50
Serbia 1.50
Turkmenistan 1.50
Tunisia 1.50
Taiwan 1.50
Venezuela 1.50
El Salvador 1.51
Guatemala 1.52
Mozambique 1.52
Djibouti 1.54
Guinea-Bissau 1.55
Bangladesh 1.57
Estonia 1.63
Cote d'Ivoire 1.65
Greece 1.66
Macedonia (FYR) 1.66
Jordan 1.66
Morocco 1.67
Belarus 1.67
Cuba 1.67
Eritrea 1.67
Gambia 1.67
Kosovo 1.67
Moldova 1.67
Saudi Arabia 1.67
Uzbekistan 1.67
South Africa 1.67
Zimbabwe 1.67
Bahrain 1.71
Sri Lanka 1.71
Senegal 1.74
United States 1.74
Mauritania 1.78
Korea 1.79
Georgia 1.83
Kyrgyzstan 1.85
Cameroon 1.86
Burundi 1.93
Egypt 1.94
Tajikistan 1.94
Armenia 1.98
Algeria 2.00
Thailand 2.06
Rwanda 2.07
Turkey 2.09
China 2.09
Iran 2.09
Niger 2.10
Kenya 2.11
Chad 2.11
Uganda 2.12
Mali 2.13
Colombia 2.17
Azerbaijan 2.18
Ethiopia 2.22
Myanmar 2.24
Russia 2.32
North Korea 2.33
Lebanon 2.41
Mexico 2.45
Israel 2.46
Philippines 2.50
Yemen 2.52
Libya 2.59
Ukraine 2.83
India 2.83
Nigeria 2.93
Iraq 3.03
Democratic Republic of the Congo
3.04
Somalia 3.11
Afghanistan 3.23
Central African Republic
3.25
South Sudan 3.26
Sudan 3.33
Syria 3.36
Pakistan 3.38
COUNTRY
SC
ORE
COUNTRY
SC
ORE
COUNTRY
SC
ORE
COUNTRY
SC
ORE
114GLOBAL PEACE INDEX 2015

TABLE 32 SOCIETAL SAFETY & SECURITY DOMAIN, MOST PEACEFUL TO LEAST
COUNTRY
SC
ORE
Japan 1.20
Iceland 1.21
Denmark 1.26
Sweden 1.30
Switzerland 1.37
Finland 1.38
Slovenia 1.38
Austria 1.39
New Zealand 1.39
Norway 1.47
Netherlands 1.51
Canada 1.52
Australia 1.52
German 1.54
Czech Republic 1.54
Bhutan 1.59
Portugal 1.60
Korea 1.60
Qatar 1.61
Ireland 1.63
Hungary 1.63
Poland 1.64
Belgium 1.64
Singapore 1.66
Slovakia 1.68
Spain 1.78
Taiwan 1.80
France 1.90
Croatia 1.91
United Kingdom 1.95
Kuwait 1.95
Romania 1.98
Estonia 2.00
Mauritius 2.03
Lithuania 2.05
Malaysia 2.05
Senegal 2.08
Botswana 2.10
Indonesia 2.12
United Arab Emirates 2.12
Laos 2.13
Serbia 2.13
Latvia 2.15
Bulgaria 2.17
Chile 2.19
Armenia 2.21
Mongolia 2.22
Italy 2.23
United States 2.23
Vietnam 2.25
Costa Rica 2.26
Morocco 2.26
Jordan 2.28
Greece 2.28
Cyprus 2.32
Oman 2.33
Timor-Leste 2.33
Ghana 2.34
Sierra Leone 2.35
Saudi Arabia 2.35
Moldova 2.35
Bosnia and Herzegovina
2.35
Malawi 2.38
Georgia 2.39
Gabon 2.40
Namibia 2.41
Zambia 2.41
Albania 2.42
Argentina 2.44
Macedonia (FYR) 2.44
Cuba 2.45
Montenegro 2.46
Kosovo 2.46
Uruguay 2.46
China 2.49
Lesotho 2.50
Madagascar 2.50
Togo 2.51
Algeria 2.51
Nepal 2.52
Gambia 2.54
Uganda 2.54
Benin 2.56
Azerbaijan 2.56
Tajikistan 2.57
Equatorial Guinea 2.58
Ecuador 2.60
Tanzania 2.60
Liberia 2.61
Tunisia 2.62
Mozambique 2.62
Nicaragua 2.62
India 2.63
Angola 2.63
Bangladesh 2.63
Ethiopia 2.63
Israel 2.63
Uzbekistan 2.66
Panama 2.67
Bolivia 2.67
Myanmar 2.68
Paraguay 2.68
Kazakhstan 2.71
Djibouti 2.71
Kyrgyzstan 2.72
Mali 2.74
Burkina Faso 2.74
Belarus 2.74
Haiti 2.76
Peru 2.76
Papua New Guinea 2.76
Sri Lanka 2.76
Bahrain 2.79
Guyana 2.79
Dominican Republic 2.81
Iran 2.83
Mauritania 2.83
Cote d'Ivoire 2.85
Cambodia 2.86
Republic of the Congo 2.87
Turkey 2.87
Niger 2.88
Guinea-Bissau 2.88
Eritrea 2.89
Swaziland 2.89
Burundi 2.90
Turkmenistan 2.91
Chad 2.92
Jamaica 2.94
Egypt 2.98
Thailand 2.98
Guinea 3.01
Philippines 3.02
Cameroon 3.02
Trinidad and Tobago 3.04
Kenya 3.05
Rwanda 3.05
Zimbabwe 3.06
Guatemala 3.07
North Korea 3.09
Lebanon 3.11
Brazil 3.14
Honduras 3.15
El Salvador 3.17
Ukraine 3.19
Pakistan 3.29
Mexico 3.30
South Africa 3.30
Russia 3.37
Yemen 3.37
Venezuela 3.38
Libya 3.40
Colombia 3.60
Nigeria 3.68
Democratic Republic of the Congo
3.78
Sudan 3.87
Central African Republic
3.95
South Sudan 4.03
Somalia 4.07
Afghanistan 4.23
Syria 4.25
Iraq 4.40
COUNTRY
SC
ORE
COUNTRY
SC
ORE
COUNTRY
SC
ORE
115GLOBAL PEACE INDEX 2015 | Annex D
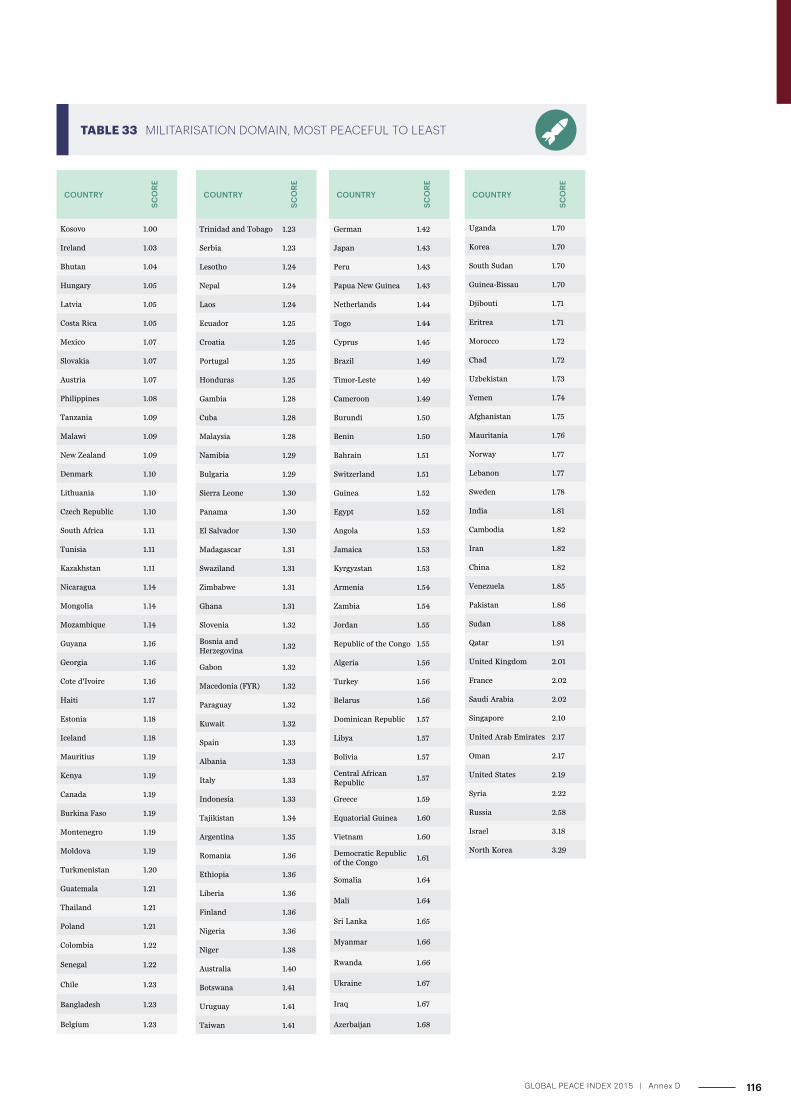
TABLE 33 MILITARISATION DOMAIN, MOST PEACEFUL TO LEAST
COUNTRY
SC
ORE
Kosovo 1.00
Ireland 1.03
Bhutan 1.04
Hungary 1.05
Latvia 1.05
Costa Rica 1.05
Mexico 1.07
Slovakia 1.07
Austria 1.07
Philippines 1.08
Tanzania 1.09
Malawi 1.09
New Zealand 1.09
Denmark 1.10
Lithuania 1.10
Czech Republic 1.10
South Africa 1.11
Tunisia 1.11
Kazakhstan 1.11
Nicaragua 1.14
Mongolia 1.14
Mozambique 1.14
Guyana 1.16
Georgia 1.16
Cote d'Ivoire 1.16
Haiti 1.17
Estonia 1.18
Iceland 1.18
Mauritius 1.19
Kenya 1.19
Canada 1.19
Burkina Faso 1.19
Montenegro 1.19
Moldova 1.19
Turkmenistan 1.20
Guatemala 1.21
Thailand 1.21
Poland 1.21
Colombia 1.22
Senegal 1.22
Chile 1.23
Bangladesh 1.23
Belgium 1.23
Trinidad and Tobago 1.23
Serbia 1.23
Lesotho 1.24
Nepal 1.24
Laos 1.24
Ecuador 1.25
Croatia 1.25
Portugal 1.25
Honduras 1.25
Gambia 1.28
Cuba 1.28
Malaysia 1.28
Namibia 1.29
Bulgaria 1.29
Sierra Leone 1.30
Panama 1.30
El Salvador 1.30
Madagascar 1.31
Swaziland 1.31
Zimbabwe 1.31
Ghana 1.31
Slovenia 1.32
Bosnia and Herzegovina
1.32
Gabon 1.32
Macedonia (FYR) 1.32
Paraguay 1.32
Kuwait 1.32
Spain 1.33
Albania 1.33
Italy 1.33
Indonesia 1.33
Tajikistan 1.34
Argentina 1.35
Romania 1.36
Ethiopia 1.36
Liberia 1.36
Finland 1.36
Nigeria 1.36
Niger 1.38
Australia 1.40
Botswana 1.41
Uruguay 1.41
Taiwan 1.41
German 1.42
Japan 1.43
Peru 1.43
Papua New Guinea 1.43
Netherlands 1.44
Togo 1.44
Cyprus 1.45
Brazil 1.49
Timor-Leste 1.49
Cameroon 1.49
Burundi 1.50
Benin 1.50
Bahrain 1.51
Switzerland 1.51
Guinea 1.52
Egypt 1.52
Angola 1.53
Jamaica 1.53
Kyrgyzstan 1.53
Armenia 1.54
Zambia 1.54
Jordan 1.55
Republic of the Congo 1.55
Algeria 1.56
Turkey 1.56
Belarus 1.56
Dominican Republic 1.57
Libya 1.57
Bolivia 1.57
Central African Republic
1.57
Greece 1.59
Equatorial Guinea 1.60
Vietnam 1.60
Democratic Republic of the Congo
1.61
Somalia 1.64
Mali 1.64
Sri Lanka 1.65
Myanmar 1.66
Rwanda 1.66
Ukraine 1.67
Iraq 1.67
Azerbaijan 1.68
Uganda 1.70
Korea 1.70
South Sudan 1.70
Guinea-Bissau 1.70
Djibouti 1.71
Eritrea 1.71
Morocco 1.72
Chad 1.72
Uzbekistan 1.73
Yemen 1.74
Afghanistan 1.75
Mauritania 1.76
Norway 1.77
Lebanon 1.77
Sweden 1.78
India 1.81
Cambodia 1.82
Iran 1.82
China 1.82
Venezuela 1.85
Pakistan 1.86
Sudan 1.88
Qatar 1.91
United Kingdom 2.01
France 2.02
Saudi Arabia 2.02
Singapore 2.10
United Arab Emirates 2.17
Oman 2.17
United States 2.19
Syria 2.22
Russia 2.58
Israel 3.18
North Korea 3.29
COUNTRY
SC
ORE
COUNTRY
SC
ORE
COUNTRY
SC
ORE
116GLOBAL PEACE INDEX 2015 | Annex D
“76021 people killed in Syria in 2014,” Syrian Observatory for
Human Rights, January 2015, http://syriahr.com/en/2015/01/76021-
people-killed-in-20014/, (accessed 23 March 2015).
ASDA’A Burson-Marsteller, Arab Youth Survey 2015, 2015. Available
from www.arabyouthsurvey.com (accessed 30 April 2015).
BADIL Resource Centre for Palestinian Residency and Refugee
Rights, Survey of Palestinian Refugees and Internally Displaced
Persons 2010-2012, Bethlehem, 2012, p. xvii. Available from: http://
www.badil.org/phocadownload/Badil_docs/publications/
Survey2012.pdf (accessed 28 April 2015).
Balousha, H., “Hamas unwilling to jeopardize Palestinian
reconciliation,” Al-Monitor, 6 February 2015, http://www.al-
monitor.com/pulse/originals/2015/02/hamas-fatah-unity-
government-work-gaza.html#, (accessed 20 April 2015).
Bayoumy, Y. and Ghobari, M., “Iranian support seen crucial for
Yemen’s Houthis,” Reuters, 15 December 2014, http://www.reuters.
com/article/2014/12/15/us-yemen-houthis-iran-insight-
idUSKBN0JT17A20141215, (accessed 24 April 2015).
Beaumont, P., “Israel condemns US for backing Palestinian unity
government,” The Guardian, 4 June 2014, http://www.theguardian.
com/world/2014/jun/03/israel-us-palestinian-unity-government-
netanyahu (accessed 4 May 2015).
Brauer, J., and Marlin, J. T., “Nonkilling economics: Calculating the
size of a peace gross world product,” Toward a Nonkilling
Paradigm, Honolulu, Center for Global Nonkilling, 2009, p. 125-148.
Center for Foreign Relations, “Sectarian Violence in Lebanon,”
Global Conflict Tracker, 2015, http://www.cfr.org/global/global-
conflict-tracker/p32137#!/?marker=15, (accessed 8 April 2015).
Chenoweth, E. and Lewis, O. A., “Unpacking nonviolent campaigns:
Introducing the NAVCO 2.0 dataset,” Journal of Peace Research,
vol. 50, no. 3, May 2013, p. 415-423.
Chenoweth, E. and Lewis, O. A., Nonviolent and Violent Campaigns
and Outcomes Dataset v. 2.0, University of Denver, 2013.
Collier, P. and Hoeffler, A., “On economic consequences of civil
war,” Oxford Economic Papers, vol. 50, no. 4, 1998, p. 168-183.
Enders, W. and Sandler, T., “Causality between transnational
terrorism and tourism: The case of Spain,” Terrorism, vol. 14, no. 1,
1991, p. 49-58.
Escola de Cultura de Pau, 2015 Yearbook of Peace Processes,
Barcelona, 2015, pp. 237. Available from: http://escolapau.uab.cat/
img/programas/procesos/15anuarii.pdf (accessed 20 April 2015).
Escola de Cultura de Pau, Alert! 2014 Report on conflicts, human
rights and peacebuilding, Barcelona, p. 79. Available from: http://
escolapau.uab.cat/index.php?option=com_content&view=article&id
=532%3Aanuarios-alerta&catid=46&Itemid=66&lang=en (accessed
30 March 2015).
Escola de Cultura de Pau, Alert! 2015 Report on conflicts, human
rights and peacebuilding, Barcelona, forthcoming 2015.
Grebe, J., “Global Militarisation Index 2014,” Bonn International
Centre for Conversion, Bonn, 2014. Available from https://www.bicc.
de/uploads/tx_bicctools/141209_GMI_ENG.pdf (accessed 8 April 2015).
Hiatt, S. and Sine, W., “Clear and present danger: Planning and new
venture survival amid political and civil violence,” Strategic
Management Journal, vol. 35, no. 5, 2013, p. 773-785.
Ianchovichina, E. and Ivanic, M., “Economic Effects of the Syrian
war and the spread of the Islamic State on the Levant,” World Bank
Policy Research Working Paper, no. 7135, December 2014.
International Crisis Group, A Precarious Balancing Act: Lebanon and
the Syrian Conflict, Middle East Report No. 132, 22 November 2012.
Available from: http://www.crisisgroup.org/en/regions/middle-east-
north-africa/syria-lebanon/lebanon/132-a-precarious-balancing-act-
lebanon-and-the-syrian-conflict.aspx (accessed 7 April 2015).
International Crisis Group, Gaza and Israel: New Obstacles, New
Solutions, Middle East Briefing No. 39, 14 July 2014. Available from:
http://www.crisisgroup.org/~/media/Files/Middle%20East%20
North%20Africa/Israel%20Palestine/b039-gaza-and-israel-new-
obstacles-new-solutions.pdf (accessed 20 April 2015);
REFERENCES
117GLOBAL PEACE INDEX 2015
International Crisis Group, Iraq’s Jihadi Jack-in-the-Box, Middle
East Briefing No. 38, 20 June 2014. Available from: http://www.
crisisgroup.org/~/media/Files/Middle%20East%20North%20Africa/
Iraq%20Syria%20Lebanon/Iraq/b038-iraq-s-jihadi-jack-in-the-box
(accessed 30 March 2015).
International Crisis Group, Lebanon’s Hizbollah Turns Eastward to
Syria, Middle East Report No. 153, 27 May 2014, pp. 3. Available
from: http://www.crisisgroup.org/~/media/Files/Middle%20East%20
North%20Africa/Iraq%20Syria%20Lebanon/Lebanon/153-lebanon-s-
hizbollah-turns-eastward-to-syria.pdf (accessed 30 March 2015).
International Crisis Group, Libya: Getting Geneva Right, Middle
East and North Africa Report No. 157, 26 February 2015. Available
from: http://www.crisisgroup.org/~/media/Files/Middle%20
East%20North%20Africa/North%20Africa/libya/157-libya-getting-
geneva-right.pdf (accessed 31 March 2015).
International Crisis Group, Rigged Cars and Barrel Bombs: Aleppo
and the State of the Syrian War, Middle East Report No. 155, 9
September 2014. Available from: http://www.crisisgroup.org/en/
regions/middle-east-north-africa/syria-lebanon/syria/155-rigged-
cars-and-barrel-bombs-aleppo-and-the-state-of-the-syrian-war.aspx
(accessed 30 March 2015).
International Crisis Group, The Houthis: From Saada to Sanaa,
Middle East Report No. 154, 10 June 2014. Available from: http://
www.crisisgroup.org/~/media/Files/Middle%20East%20North%20
Africa/Iran%20Gulf/Yemen/154-the-huthis-from-saada-to-sanaa.pdf
(accessed 31 March 2015).
International Crisis Group, The Next Round in Gaza, Middle East
Report No. 149, 25 March 2014. Available from: http://www.
crisisgroup.org/en/regions/middle-east-north-africa/israel-
palestine/149-the-next-round-in-gaza.aspx (accessed 20 April 2015).
International Crisis Group, Yemen At War, Middle East Briefing No.
45, 27 March 2015. Available from: http://www.crisisgroup.org/~/
media/Files/Middle%20East%20North%20Africa/Iran%20Gulf/
Yemen/b045-yemen-at-war.pdf (accessed 31 March 2015).
International Displacement Monitoring Centre, Global Overview
2015: People internally displaced by conflict and violence, Geneva,
2015. Available from: http://www.internal-displacement.org/assets/
library/Media/201505-Global-Overview-2015/20150506-global-
overview-2015-en.pdf (accessed 20 April 2015).
International Institute for Strategic Studies, “Al-Houthi Rebels/
Shabab al-Mumineen (Believing Youth),” Armed Conflict Database,
2015. Available from: https://acd-iiss-org.mutex.gmu.edu/en/
conflicts/yemen--houthis-aqap-smm-9651 (accessed 31 March 2015).
Israeli Defense Forces, “Special Report: Operation Protective Edge,”
January 2015, http://www.idfblog.com/operationgaza2014/#Home,
(accessed 30 April 2014).
Keck, M., & Sakdapolrak, P., “What is social resilience: Lessons
learned and ways forward,” Erdkunde, 67(1), 5–18, 2013.
“Lebanese army cracks down on ‘ISIL suspects’,” Al Jazerra, 26
October 2014, http://www.aljazeera.com/news/middleeast/2014/10/
lebanese-army-battles-gunmen-tripoli-2014102592151943.html,
(accessed 8 April 2015).
Menaldo, V., “The Middle East and North Africa’s Resilient
Monarchs,” The Journal of Politics, vol 74, no. 3, July 2012.
Mezzofiore, G., “Iraq Crisis: Sadddam Hussein’s Generals Fighting
with Jihadist ISIS Insurgency,” International Business Times, 12 June
2014, http://www.ibtimes.co.uk/iraq-crisis-saddam-husseins-generals-
fighting-jihadist-isis-insurgency-1452365, (accessed 30 April 2015).
Muggah, R., Researching the Urban Dilemma: Urbanization, Poverty
and Violence, 2012. Available from http://www.idrc.ca/EN/
PublishingImages/Researching-the-Urban-Dilemma-Baseline-study.
pdf (accessed 19 March 2015).
Neumann, R., “Foreign fighter total in Syria/Iraq now exceeds
20,000; surpasses Afghanistan conflict in the 1980s,”International
Centre for the Study of Radicalisation and Political Violence, 26
January 2015, http://icsr.info/2015/01/foreign-fighter-total-syriairaq-
now-exceeds-20000-surpasses-afghanistan-conflict-1980s/
(accessed 24 March 2015).
Office of the United Nations High Commissioner for Refugees, 2014
Syria Regional Response Plan: Lebanon, 2014, p. 2. Available from:
http://www.unhcr.org/syriarrp6/docs/syria-rrp6-lebanon-response-
plan.pdf (accessed 9 April 2015).
Pinker, S., The Better Angels of Our Nature: Why Violence Has
Declined, New York, Penguin Books, 2011.
Rainey, V., “Lebanon: No formal refugee camps for Syrians,” Al
Jazerra, 11 March 2015, http://www.aljazeera.com/news/2015/03/
lebanon-formal-refugee-camps-syrians-150310073219002.html,
(accessed 7 April 2015).
Rudoren, J. and Kershner, I., “Israel’s Search for 3 Teenagers Ends in
Grief,” The New York Times, 30 June 2014, http://www.nytimes.
com/2014/07/01/world/middleeast/Israel-missing-teenagers.html,
(accessed 30 April 2015).
“Rwanda ‘gacaca’ genocide courts finish work,” BBC News, 18 June
2012, http://www.bbc.com/news/world-africa-18490348,
(accessed 15 May 2015).
118GLOBAL PEACE INDEX 2015 | References
Sadjadpour, K., “Iran’s Unwavering Support to Assad’s Syria,”
Carnegie Endowment for International Peace, 27 August 2013,
http://carnegieendowment.org/2013/08/27/iran-s-unwavering-
support-to-assad-s-syria, (accessed 8 April 2015).
Small Arms Survey, Urban Armed Violence, Research Notes: Armed
Violence, no. 23, November 2012. Available from http://www.
smallarmssurvey.org/fileadmin/docs/H-Research_Notes/SAS-
Research-Note-23.pdf (accessed 21 April 2015).
“Sunni rebels declare new ‘Islamic caliphate’,” Al Jazeera, 30 June
2014, http://www.aljazeera.com/news/middleeast/2014/06/
isil-declares-new-islamic-caliphate-201462917326669749.html
accessed 20 May 2015.
“Syria war fuels sectarian tension in Lebanon,” Al Jazerra, 02
November 2014, http://www.aljazeera.com/news/
middleeast/2014/10/syria-war-fuels-sectarian-tension-
lebanon-2014102963054535228.html (accessed 8 April 2015);
Terrorism Research & Analysis Consortium, “Islamic State of Iraq
and ash Sham / Islamic State (Islamic State of Iraq, ISIS or ISIL,
IS),” Groups, 2014. Available from: http://www.trackingterrorism.
org/group/islamic-state-iraq-and-ash-sham-islamic-state-islamic-
state-iraq-isis-or-isil (accessed 11 May 2015).
United Nations Assistance Mission for Iraq Human Rights Office,
Report on the Protection of Civilians in the Non International Armed
Conflict in Iraq: 5 June – 5 July 2014, 2014. Available from: http://
www.ohchr.org/Documents/Countries/IQ/UNAMI_OHCHR_
POC%20Report_FINAL_18July2014A.pdf (accessed 30 April 2015).
United Nations Department of Economic and Social Affairs, World
Urbanization Prospects: The 2014 Revision, Highlights, 2014.
Available from http://esa.un.org/unpd/wup/Highlights/WUP2014-
Highlights.pdf (accessed 17 April 2015).
United Nations Development Program, Towards Human Resilience:
Sustaining MDG Progress in an Age of Economic Uncertainty, New
York, September 2011. Available from: http://www.undp.org/
content/dam/undp/library/Poverty%20Reduction/Towards_
SustainingMDG_Web1005.pdf (accessed 1 May 2015).
“UN chief welcomes formation of Palestinian unity government,”
UN News Centre, 3 June 2014, http://www.un.org/apps/news/story.
asp?NewsID=47947#.VUdG3iGqqko (accessed 4 May 2015).
United Nations High Commissioner for Refugees, Mid-Year Trends
2014, Geneva, 7 January 2015. Available from: http://unhcr.
org/54aa91d89.html (accessed 20 April 2015).
United States Department of State, “International Religious
Freedom Report for 2013,” 2013, http://www.state.gov/j/drl/rls/irf/
religiousfreedom/index.htm#wrapper (accessed 30 April 2015).
United States Department of State, “Foreign Military Financing
Account Summary,” 2015, http://www.state.gov/t/pm/ppa/sat/
c14560.htm, (accessed April 17, 2015).
Wood, G., “What ISIS Really Wants,” The Atlantic, March 2015,
http://www.theatlantic.com/features/archive/2015/02/what-isis-
really-wants/384980/ (accessed 24 March 2015).
“Yemen violence death toll tops 1,000: UN,” Zee News, 24 April
2015, http://zeenews.india.com/news/world/yemen-violence-death-
toll-tops-1000-un_1583977.html, (accessed 24 April 2015).
Zelin, A. Y., “ICSR Insight: Up to 11,000 foreign fighters in Syria;
steep rise among Western Europeans,” International Centre for the
Study of Radicalisation and Political Violence, 17 December 2013,
http://icsr.info/2013/12/icsr-insight-11000-foreign-fighters-syria-
steep-rise-among-western-europeans/, (accessed 26 March 2015).
119GLOBAL PEACE INDEX 2015 | References
END NOTES
1 Represents the total number of country nationals displaced
either inside the country (IDPs) or outside the country
(refugees).
2 BADIL Resource Centre for Palestinian Residency and Refugee
Rights, Survey of Palestinian Refugees and Internally Displaced
Persons 2010-2012, Bethlehem, 2012, p. xvii. Available from:
http://www.badil.org/phocadownload/Badil_docs/
publications/Survey2012.pdf (accessed 28 April 2015).
3 Escola de Cultura de Pau, Alert! 2015 Report on conflicts,
human rights and peacebuilding, Barcelona, forthcoming 2015.
4 Terrorism Research & Analysis Consortium, “Islamic State of
Iraq and ash Sham / Islamic State (Islamic State of Iraq, ISIS
or ISIL, IS),” Groups, 2014, and Mezzofiore, G., “Iraq Crisis:
Sadddam Hussein’s Generals Fighting with Jihadist ISIS
Insurgency,” International Business Times, 12 June 2014,
http://www.ibtimes.co.uk/iraq-crisis-saddam-husseins-
generals-fighting-jihadist-isis-insurgency-1452365
(accessed 30 April 2015).
5 The Positive Peace Index scores countries on a scale of one to
five, in which a score of one represents the highest level of
Positive Peace and five represents the lowest.
6 International Crisis Group, Yemen At War, Middle East Briefing
No. 45, 27 March 2015.
7 “Sunni rebels declare new ‘Islamic caliphate’,” Al Jazeera,
30 June 2014, http://www.aljazeera.com/news/
middleeast/2014/06/isil-declares-new-islamic-
caliphate-201462917326669749.html (accessed 20 May 2015).
8 Wood, G., “What ISIS Really Wants,” The Atlantic, March 2015,
http://www.theatlantic.com/features/archive/2015/02/
what-isis-really-wants/384980/ (accessed 24 March 2015).
9 Wood, G., “What ISIS Really Wants,” The Atlantic, March 2015,
http://www.theatlantic.com/features/archive/2015/02/
what-isis-really-wants/384980/ (accessed 24 March 2015).
10 IISS’s ACD records 71,667 deaths in 2014, while the UK-based
Syrian Observatory for Human Rights reports 76,021. Syrian
Observatory for Human Rights, “76021 people killed in Syria in
2014,” January 2015, http://syriahr.com/en/2015/01/76021-
people-killed-in-20014/, (accessed 23 March 2015).
11 Escola de Cultura de Pau, Alert! 2014 Report on conflicts,
human rights and peacebuilding, Barcelona, p. 79.
12 United States Department of State, International Religious
Freedom Report for 2013, 2013, http://www.state.gov/j/drl/rls/
irf/religiousfreedom/index.htm#wrapper
(accessed 30 April 2015).
13 Neumann, R., “Foreign fighter total in Syria/Iraq now exceeds
20,000; surpasses Afghanistan conflict in the 1980s,
”International Centre for the Study of Radicalisation and
Political Violence, 26 January 2015, http://icsr.info/2015/01/
foreign-fighter-total-syriairaq-now-exceeds-20000-surpasses-
afghanistan-conflict-1980s/ (accessed 24 March 2015); and
Zelin, A. Y., “ICSR Insight: Up to 11,000 foreign fighters in
Syria; steep rise among Western Europeans,” International
Centre for the Study of Radicalisation and Political Violence,
17 December 2013, http://icsr.info/2013/12/icsr-insight-11000-
foreign-fighters-syria-steep-rise-among-western-europeans/
(accessed 26 March 2015).
14 International Crisis Group, Lebanon’s Hizbollah Turns
Eastward to Syria, Middle East Report No. 153, 27 May 2014.
15 Escola de Cultura de Pau, Alert! 2015 Report on conflicts,
human rights and peacebuilding, Barcelona, forthcoming 2015;
and International Crisis Group, Rigged Cars and Barrel Bombs:
Aleppo and the State of the Syrian War, Middle East Report No.
155, 9 September 2014.
16 International Crisis Group, Rigged Cars and Barrel Bombs:
Aleppo and the State of the Syrian War, Middle East Report No.
155, 9 September 2014.
17 The year’s diplomatic efforts were frustrated by the breakdown
of the Geneva II peace talks, the resignation of mediator and
joint UN and the Arab League special representative Lakhdar
Brahimi and Russia and China’s veto of a UN Security Council
proposal to refer the conflict to the International Criminal
Court. Escola de Cultura de Pau, “Iraq 2014,” Database on
Conflict and Peacebuilding, September 2014.
18 Sadjadpour, K., “Iran’s Unwavering Support to Assad’s Syria,”
Carnegie Endowment for International Peace, 27 August 2013,
http://carnegieendowment.org/2013/08/27/iran-s-unwavering-
support-to-assad-s-syria (accessed 8 April 2015).
19 United Nations Assistance Mission for Iraq Human Rights
Office, Report on the Protection of Civilians in the Non
International Armed Conflict in Iraq: 5 June-5 July 2014, 2014.
20 International Crisis Group, Iraq’s Jihadi Jack-in-the-Box,
Middle East Briefing No. 38, 20 June 2014.
21 Wood, G., “What ISIS Really Wants,” The Atlantic, March 2015,
http://www.theatlantic.com/features/archive/2015/02/
what-isis-really-wants/384980/ (accessed 24 March 2015).
22 “Yemen violence death toll tops 1,000: UN,” Zee News, 24 April
2015, http://zeenews.india.com/news/world/yemen-violence-
death-toll-tops-1000-un_1583977.html (accessed 24 April 2015).
23 International Crisis Group, The Houthis: From Saada to Sanaa,
Middle East Report No. 154, 10 June 2014.
120GLOBAL PEACE INDEX 2015 | Endnotes
24 International Institute for Strategic Studies, “Al-Houthi Rebels/
Shabab al-Mumineen (Believing Youth),” Armed Conflict
Database, 2015.
25 Bayoumy, Y. and Ghobari, M., “Iranian support seen crucial for
Yemen’s Houthis,” Reuters, 15 December 2014, http://www.
reuters.com/article/2014/12/15/us-yemen-houthis-iran-insight-
idUSKBN0JT17A20141215 (accessed 24 April 2015).
26 International Crisis Group, Yemen At War, Middle East Briefing
No. 45, 27 March 2015.
27 International Crisis Group, Yemen At War, Middle East Briefing
No. 45, 27 March 2015.
28 International Crisis Group, Libya: Getting Geneva Right, Middle
East and North Africa Report No. 157,
26 February 2015.
29 International Crisis Group, Libya: Getting Geneva Right, Middle
East and North Africa Report No. 157,
26 February 2015.
30 International Crisis Group, The Next Round in Gaza, Middle
East Report No. 149, 25 March 2014.
31 Rudoren, J. and Kershner, I., “Israel’s Search for 3 Teenagers
Ends in Grief,” The New York Times, 30 June 2014, http://www.
nytimes.com/2014/07/01/world/middleeast/Israel-missing-
teenagers.html (accessed 30 April 2015).
32 Israeli Defense Forces, “Special Report: Operation Protective
Edge,” January 2015, http://www.idfblog.com/
operationgaza2014/#Home (accessed 30 April 2014).
33 Escola de Cultura de Pau, Alert! 2015 Report on conflicts,
human rights and peacebuilding, Barcelona, forthcoming 2015.
34 International Crisis Group, The Next Round in Gaza, Middle
East Report No. 149, 25 March 2014.
35 Escola de Cultura de Pau, 2015 Yearbook of Peace Processes,
Barcelona, 2015, pp. 237.
36 International Crisis Group, Gaza and Israel: New Obstacles,
New Solutions, Middle East Briefing No. 39, 14 July 2014; UN
News Centre, “UN chief welcomes formation of Palestinian
unity government,” 3 June 2014, http://www.un.org/apps/
news/story.asp?NewsID=47947#.VUdG3iGqqko (accessed
4 May 2015); and Beaumont, P., “Israel condemns US for
backing Palestinian unity government,” The Guardian, 4 June
2014, http://www.theguardian.com/world/2014/jun/03/
israel-us-palestinian-unity-government-netanyahu
(accessed 4 May 2015).
37 International Crisis Group, The Next Round in Gaza, Middle
East Report No. 149, 25 March 2014.
38 Balousha, H., “Hamas unwilling to jeopardize Palestinian
reconciliation,” Al-Monitor, 6 February 2015, http://www.
al-monitor.com/pulse/originals/2015/02/hamas-fatah-unity-
government-work-gaza.html (accessed 20 April 2015).
39 International Crisis Group, A Precarious Balancing Act:
Lebanon and the Syrian Conflict, Middle East Report No. 132,
22 November 2012.
40 Office of the United Nations High Commissioner for Refugees,
2014 Syria Regional Response Plan: Lebanon, 2014, p. 2.
41 International Crisis Group, Lebanon’s Hizbollah Turns
Eastward to Syria, Middle East Report No. 153,
27 May 2014, pp. 3.
42 “Syria war fuels sectarian tension in Lebanon,” Al Jazerra,
2 November 2014, http://www.aljazeera.com/news/
middleeast/2014/10/syria-war-fuels-sectarian-tension-
lebanon-2014102963054535228.html (accessed 8 April 2015);
“Lebanese army cracks down on ‘ISIL suspects’,” Al Jazerra,
26 October 2014, http://www.aljazeera.com/news/
middleeast/2014/10/lebanese-army-battles-gunmen-
tripoli-2014102592151943.html, (accessed 8 April 2015); and
Center for Foreign Relations, “Sectarian Violence in
Lebanon,” Global Conflict Tracker, 2015, http://www.cfr.org/
global/global-conflict-tracker/p32137#!/?marker=15
(accessed 8 April 2015).
43 See Table 30 (Annex C) for the cost of violence in each
individual country. IEP’s methodology attributes the majority
of refugee-associated costs to the country of origin, meaning
that this combined figure is the best indicator of the total
burden being borne by these two neighbours. Figures are
reported in 2014 PPP-adjusted US dollars.
44 Rainey, V., “Lebanon: No formal refugee camps for Syrians,”
Al Jazerra, 11 March 2015, http://www.aljazeera.com/
news/2015/03/lebanon-formal-refugee-camps-
syrians-150310073219002.html (accessed 7 April 2015).
45 Ianchovichina, E. and Ivanic, M., “Economic Effects of the
Syrian war and the spread of the Islamic State on the
Levant,” World Bank Policy Research Working Paper, no. 7135,
December 2014.
46 Rainey, V., “Lebanon: No formal refugee camps for Syrians,”
Al Jazerra, 11 March 2015, http://www.aljazeera.com/
news/2015/03/lebanon-formal-refugee-camps-
syrians-150310073219002.html (accessed 7 April 2015).
47 United Nations Department of Economic and Social Affairs,
World Urbanization Prospects: The 2014 Revision,
Highlights, 2014.
48 Muggah, R., Researching the Urban Dilemma: Urbanization,
Poverty and Violence, 2012.
49 Small Arms Survey, Urban Armed Violence, Research Notes:
Armed Violence, no. 23, November 2012.
50 A negative coefficient reflects increasing peacefulness. As the
level of urbanisation increases, the societal safety and security
score gets closer to 1.
51 In this model, high levels of urbanisation are associated with
poor scores for societal safety and security when rule of law,
intergroup grievance and income inequality are held
constant. Urbanisation generally has a direct relationship
with increasing peacefulness. However, after accounting for
the variation in scores that can be explained by the other
three variables, the relationship changes direction.
Controlling for the effect of these variables reveals a slight
reduction in societal safety and security scores as a result
of increasing urbanisation.
121GLOBAL PEACE INDEX 2015 | Endnotes
52 This analysis used a total of eight different variables for the
pace of urbanisation, which are grouped in two ways. The first
group includes the percentage change in the urban population
measured from four different starting points (1980, 1990, 2000
and 2005) to 2015. The second group uses the difference in
percentage points of the population living in an urban area,
also measured from four different starting points (1985, 1990,
2000 and 2005) to 2015. None of these variables had a
statistically significant relationship with societal safety and
security scores.
53 Muggah, R., Researching the Urban Dilemma: Urbanization,
Poverty and Violence, 2012.
54 According to the IEP comprehensive calculation of military
spending, detailed further in the economic cost of violence
section of this report.
55 U.S. Department of State, “Foreign Military Financing Account
Summary,” 2015, http://www.state.gov/t/pm/ppa/sat/c14560.
htm, (accessed April 17, 2015).
56 Grebe, J., “Global Militarisation Index 2014,” Bonn
International Centre for Conversion, Bonn, 2014.
57 Pinker, S., The Better Angels of Our Nature: Why Violence Has
Declined, New York, Penguin Books, 2011.
58 ASDA’A Burson-Marsteller, Arab Youth Survey 2015, 2015.
59 Collier, P. and Hoeffler, A., “On economic consequences of civil
war,” Oxford Economic Papers, vol. 50, no. 4, 1998, p. 168-183.
And Ianchovichina, E. and Ivanic, M., “Economic Effects of the
Syrian war and the spread of the Islamic State on the
Levant,” World Bank Policy Research Working Paper, no. 7135,
December 2014.
60 Brauer, J., and Marlin, J. T., “Nonkilling economics:
Calculating the size of a peace gross world product,” Toward a
Nonkilling Paradigm, Honolulu, Center for Global Nonkilling,
2009, p. 125-148.
61 Enders, W. and Sandler, T., “Causality between transnational
terrorism and tourism: The case of Spain,” Terrorism, vol. 14,
no. 1, 1991, p. 49-58.
62 Hiatt, S. and Sine, W., “Clear and present danger: Planning and
new venture survival amid political and civil
violence,” Strategic Management Journal, vol. 35, no. 5, 2013,
p. 773-785.
63 Ianchovichina, E. and Ivanic, M., “Economic Effects of the
Syrian war and the spread of the Islamic State on the
Levant,” World Bank Policy Research Working Paper, no. 7135,
December 2014.
64 Menaldo, V., “The Middle East and North Africa’s Resilient
Monarchs,” The Journal of Politics, vol 74, no. 3, July 2012.
65 “Rwanda ‘gacaca’ genocide courts finish work,” BBC News, 18
June 2012, http://www.bbc.com/news/world-africa-18490348
(accessed 15 May 2015).
66 United Nations Development Program, Towards Human
Resilience: Sustaining MDG Progress in an Age of Economic
Uncertainty, New York, September 2011.
67 Keck, M., & Sakdapolrak, P., “What is social resilience: Lessons
learned and ways forward,” Erdkunde, 67(1), 5–18, 2013.
68 Chenoweth, E. and Lewis, O. A., Nonviolent and Violent
Campaigns and Outcomes Dataset, v. 2.0, University of
Denver, 2013.
69 Chenoweth, E. and Lewis, O. A., “Unpacking nonviolent
campaigns: Introducing the NAVCO 2.0 dataset,” Journal of
Peace Research, vol. 50, no. 3, May 2013, p. 415-423.
70 To measure this, the strength of Positive Peace has been
estimated for every year since 1945 using the Polity IV
Governance indicator which has a time series spanning
1800-2010. Information of health, education and income have
been imputed from the Human Development Index (1980-2014).
71 Statistical significance is established by using t-tests at the 95
per cent confidence level to compare the means of the NAVCO
database scores of the top third of countries in Positive Peace
to the bottom third of countries in any given year.
72 Where indices contain similar variables, e.g. fertility in health,
further correlations were performed on subsets of the PPIs
without the domain containing the similar variable to avoid
collineariety. Tests found that the indicators still correlated
with the subset PPIs.
122GLOBAL PEACE INDEX 2015 | Endnotes
NOTES
123GLOBAL PEACE INDEX 2015

NOTES
124GLOBAL PEACE INDEX 2015

AVAILABLE FOR DOWNLOAD AT WWW.ECONOMICSANDPEACE.ORG
2014
MEASURING AND UNDERSTANDING THE IMPACT OF TERRORISM
A GLOBAL STATISTICAL ANALYSIS ON THE EMPIRICAL LINK BETWEEN PEACE AND RELIGION
2014 Global Peace IndexInstitute for Economics and Peace, Feb 2014
The 2014 GPI Report analyses the state of peace
around the world and identifies countries most at risk
of becoming less peaceful.
2014 Global Terrorism Index ReportInstitute for Economics and Peace, Nov 2014
The 2014 Global Terrorism Index Report analyses the
impact of terrorism in 162 countries and identifies the
social, economic and political factors associated with it.
The Link between Peace and ReligionInstitute for Economics and Peace, Oct 2014
A global statistical analysis on the empirical link
between peace and religion.
2015 Mexico Peace IndexInstitute for Economics and Peace, Mar 2014
The Mexico Peace Index measures the state of peace in
all 32 Mexican states analysing trends and drivers of
peace over the last decade.
The Economic Cost of Violence ContainmentInstitute for Economics and Peace, Feb 2014
A new methodology that calculates the cost of preventing
and containing violence in over 150 countries.
2013 Mexico Peace IndexInstitute for Economics and Peace, Nov 2013
The Mexico Peace Index measures the state of peace in
all 32 Mexican states analysing trends and drivers of
peace over the last ten years.
Violence Containment Spending in the United StatesInstitute for Economics and Peace, Sept 2012
Violence Containment Spending provides a new
methodology to categorise and account for the
public and private expenditure on containing violence.
2013 United Kingdom Peace IndexInstitute for Economics and Peace, Apr 2013
The UK Peace Index report analyses the fabric of
peace in the UK over the last decade and has found
that since 2003 the UK has become more peaceful.
2012 Global Terrorism IndexInstitute for Economics and Peace, Dec 2012
A global statistical analysis on the empirical link
between peace and religion.
2012 Global Peace IndexInstitute for Economics and Peace, June 2012
The Global Peace Index is the world’s preeminent
measure of peacefulness. This is the 6th edition of the
Global Peace Index.
2012 United States Peace IndexInstitute for Economics and Peace, Apr 2012
The 2012 United States Peace Index has found that the
U.S. is more peaceful now than at any other time over
the last twenty years.
2013 Global Peace IndexInstitute for Economics and Peace, June 2013
The 2013 GPI Report analyses the state of peace
around the world, identifying trends in violence and
conflict, as well as the key drivers of peace.
GLOBAL PEACE INDEX 2013 /01/ RESULTS, FINDINGS & METHODOLOGY
1
MEASURING THE STATE OF GLOBAL PEACE
GLOBALPEACEINDEX2013
Pillars of PeaceInstitute for Economics and Peace, Sept 2013
Pillars of Peace is a new conceptual framework for
understanding and describing the factors that create
a peaceful society.
Peace and CorruptionInstitute for Economics and Peace, May 2015
The relationship between peace and corruption is
statistically significant, as corruption is a leading
indicator of peace.LOWERING CORRUPTION
— A TRANSFORMATIVE FACTOR FOR PEACE
GlobalPeaceIndex
Other publications from the Institute for Economics and Peace