global online payment methods: second half … · nigeria, poland, qatar, russia, saudi arabia ......
TRANSCRIPT
GLOBAL ONLINE PAYMENT METHODS: SECOND HALF 2017
PUBLICATION DATE: FEBRUARY 2018
PAGE 2 GENERAL INFORMATION I PAGE 3 KEY FINDINGS I PAGE 4-10 TABLE OF CONTENTS I PAGE 11 REPORT-SPECIFIC SAMPLE
CHARTS I PAGE 12 METHODOLOGY I PAGE 13 RELATED REPORTS I PAGE 14 CLIENTS I PAGE 15-16 FREQUENTLY ASKED QUESTIONS
PAGE 17 ORDER FORM I PAGE 18 TERMS AND CONDITIONS
2
2
PRODUCT DETAILS Title:
Type of Product:
Category:
Covered Regions:
Covered Countries:
Language:
Formats:
Number of Charts:
Global Online Payment Methods: Second Half 2017
Market Report
Online Payment
Africa, Asia-Pacific, Europe, Latin America, North America, Middle
East
Australia, Bahrain, Belgium, Brazil, Canada, China, Colombia, Czech
Republic, Egypt, France, Germany, India, Indonesia, Iran, Israel, Italy,
Japan, Kenya, Kuwait, Lebanon, Malaysia, Mexico, Netherlands,
Nigeria, Poland, Qatar, Russia, Saudi Arabia, Singapore, South Africa,
South Korea, Spain, Sweden, Switzerland, Thailand, Turkey, UAE, UK,
USA, Vietnam
English
PDF & PowerPoint
176
PRICES* Single User License:
Site License:
Global Site License:
€ 1,950 (exc. VAT)
€ 2,925 (exc. VAT)
€ 3,900 (exc. VAT)
We occasionally offer a discount on selected reports as newer reports are published.
Please see the most up-to-date pricing on our website www.ystats.com.
QUESTIONS
ANSWERED
IN THIS REPORT
What are the key online and mobile payment trends worldwide?
Which payment methods are preferred by online shoppers in 30+ countries?
Which factors influence the choice of payment methods?
How is mobile payment evolving in various regions and countries?
What is consumers’ attitude to online and mobile payment security?
SECONDARY MARKET
RESEARCH
Our reports are exclusively based on secondary market research. Our researchers derive
information and data from a variety of reliable published sources and compile the data into
understandable and easy-to-use formats.
ADVANTAGES Maximum Objectivity
Reliable Sources
Up-To-Date Analysis
Boardroom-Ready PowerPoint Presentations
Guidance For Strategic Company Decisions
GLOBAL ONLINE PAYMENT METHODS: SECOND HALF 2017
E-WALLETS TO OVERTAKE PAYMENT CARDS IN GLOBAL B2C E-COMMERCE
The rise of alternative payment methods represents one of the top payment trends
in global B2C E-Commerce. According to one projection cited in the yStats.com’s report, the
share of credit and debit card payments in worldwide online sales could decline to less than
one-quarter in four years’ time. E-Wallets, such as PayPal and Alipay, are expected to
dominate online payments with a sales share of close to one-half by 2021.
In China, the world’s largest E-Commerce market, online and mobile payments
processed by third-party services count several trillions of U.S. dollars per year, and are still
growing at double-digit rates for online and triple-digit rates for mobile payments. In
Europe, digital wallet is the most preferred online payment method on a regional average,
although in multiple countries such as France, Belgium and Sweden, payment cards remain
in the lead. Also in the U.S. a higher share of online shoppers preferred to pay by filling out
a standard credit card form than using a digital wallet such as PayPal, as of 2017.
Overall, the yStats.com report reveals that preferences of online shoppers with
regard to payment methods vary by country. For example, many consumers in Brazil use
local banking method Boleto, with this method ranking second only to credit cards. In
Germany, more shoppers pay by PayPal or invoice than by credit card, while in Indonesia
digital buyers would rather pay via ATM. In several countries of Eastern Europe and Middle
East cash on delivery remains the top payment choice of online shoppers, as consumers are
vary of online payment security or lack means to pay over the Internet.
Another finding of the yStats.com report is the growth of mobile payments
worldwide. Among the global regions, the highest mobile payment penetration rate among
Internet users was in Asia-Pacific, followed by Latin America and the Middle East and Africa,
as of mid-2017. Also in North America and Europe, mobile payment usage has grown, with
competition among mobile wallet providers increasing.
GLOBAL ONLINE PAYMENT METHODS: SECOND HALF 2017
3
MANAGEMENT SUMMARY
GLOBAL DEVELOPMENTS
Breakdown of E-Commerce Sales by Payment Methods, in %, 2021f
Top Two Payment Methods Preferred in Cross-Border Online Shopping, in % of Cross-Border Online Shoppers, 2016
& 2017
Penetration of Bank Account Holders Willing to Share Personal Financial Data with Third-Party Providers to Use Their
Services, in %, by Selected Countries, August 2017
Share of Internet Users Who Believe That Mobile Payment is Not Secure, in %, October 2016
Mobile Payment User Penetration, in % of Internet Users, by Regions, Q4 2015 & Q2 2017
Apple Pay User Penetration Compared to Overall Mobile Payment User Penetration, in % of Internet Users, by
Penetrated Markets, Q2 2017
FinTech Adoption Rate, in % of Internet Users, by Selected Countries, 2017
Most Used FinTech Services According to Internet Users, in %, 2017
Most Relevant Emerging Technologies for Large FinTech and Financial Companies to Invest In, in % of Respondents in
Each Group, April 2017
Top 10 VC-Backed FinTech Unicorns by Valuation, in USD billion, Q3 2017
ASIA-PACIFIC
3.1. REGIONAL
Breakdown of E-Commerce Sales by Payment Methods, in %, 2017e
Breakdown of General Payment Methods Used Most Frequently, in % of Consumers, August 2017
3.2. ADVANCED MARKETS
3.2.1. JAPAN
Online and Mobile Payment Trends, January 2018
Payment Methods Used in E-Commerce, in % of Online Shoppers, 2016
Awareness and Usage of E-Money Services and Smartphone Payment Services, in % of Smartphone Users, November
2017
Most Used Smartphone Payment Services, in % of Smartphone Payment Users, November 2017
3.2.2. SOUTH KOREA
Daily Average Personal Credit Card Payment Value by Major Consumption Types, incl. Online and Home Shopping, in
KRW billion, H1 2016 - H1 2017
Daily Average Value of Mobile Card Payments, in KRW billion, H1 2015 - H1 2017
Top 5 Mobile Payment Services by Payment Volume, in KRW billion, January-August 2017
3.2.3. AUSTRALIA
Breakdown of Online Payments by Payment Method, in %, 2013 & 2016
Breakdown of Online Payments by PC/Tablet and Mobile, in %, 2013 & 2016
3
2
GLOBAL ONLINE PAYMENT METHODS: SECOND HALF 2017
TABLE OF CONTENTS (1 of 7)
4
1
5
2
ASIA-PACIFIC (CONT.)
3.3. EMERGING MARKETS
3.3.1. CHINA
Online and Mobile Payment Trends, January 2018
Number of Online Payment Users, in millions, and Penetration, in % of Internet Users, 2012 – 2016 & June 2017
Third-Party Online Payment Volume, in CNY trillion, by Two Comparative Estimates, Q1 2016 – Q2 2017
Breakdown of Third-Party Online Payment GMV by Players, in %, by Two Comparative Estimates, Q2 2017
Number of Mobile Payment Users, in millions, and Penetration, in % of Mobile Internet Users, 2014 - 2016 & June
2017
Third-Party Mobile Payment Volume, in CNY trillion, by Two Comparative Estimates, Q1 2016 – Q2 2017
Breakdown of Third-Party Mobile Payment GMV by Players, in %, by Two Comparative Estimates, Q2 2017
Payment Methods Used for In-Store Purchases, in % of Internet Users, June 2017
Selected Mobile Payment Services Used Regularly to Make Payments, in % of Urban Consumers, 2017
3.3.2. INDIA
Share of Urban Online Shoppers Who Switched from Cash on Delivery to Online Payment Methods Following
Demonetization, in % of Online Shoppers, 2017
Breakdown Payment Methods Preferred in E-Commerce, in % of Urban Online Shoppers, 2017
Share of Digital and Mobile Wallets in E-Commerce Sales, in %, 2013 & 2017e
Value of Payment Transactions by Selected Non-Cash Payment Methods, in INR billion, and Volume, in millions, incl.
Mobile Wallets, FY 2014-2015 - FY 2016-2017
3.2.3. INDONESIA
Top 3 Payment Methods Used in E-Commerce, in % of Internet Users, 2016
3.2.4. SINGAPORE
Share of Cards and Digital Wallets in E-Commerce Sales, in %, 2013 & 2017e
Share of Credit Card Holders Who Used Mobile Wallets to Make Payments from Credit Card, 2016 & 2017
3.2.5. THAILAND
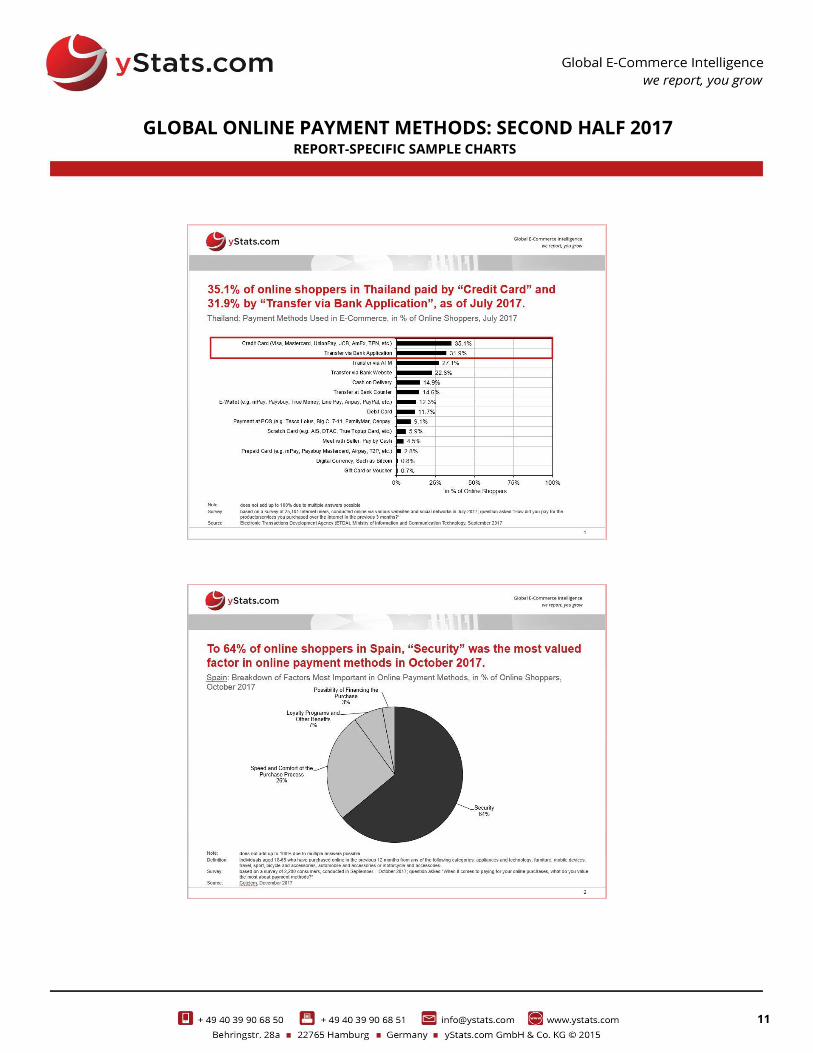
Payment Methods Used in E-Commerce, in % of Online Shoppers, July 2017
3.2.6. MALAYSIA
Payment Methods Used in E-Commerce, in % of Online Shoppers, February 2017
3.2.7. VIETNAM
Payment Methods Used in E-Commerce, in % of Online Shoppers, 2015 & 2016
TABLE OF CONTENTS (2 OF 7)
GLOBAL ONLINE PAYMENT METHODS: SECOND HALF 2017
3
5
6
2
EUROPE
4.1. REGIONAL
Top 10 Payment Methods Preferred in E-Commerce, in % of Online Shoppers, 2016 & 2017
Concerns That Internet Users in the EU Have About Using The Internet for Online Banking or Buying Things Online, in
% of Internet Users, June 2013 & June 2017
Overview of PSD2 Implementation Timeline, January 2018
4.2. ADVANCED MARKETS
4.2.1. UK
Online and Mobile Payment Trends, January 2018
Top 3 Payment Methods Used in E-Commerce, in % of Internet Users, 2017
Top 3 Reasons for Checkout Abandonment, in % of Internet Users, 2017
Share of Consumers Willing to Give Online Retailers Permission to Initiate Payments Directly From Their Bank
Account Using Apps or Websites, in %, by Total Consumers, Millennials and Generation Z, August 2017
Reasons for Not Shopping Online, incl. Payment-Related, in % of Adults Who Have Not Purchased Online, by Age
Group, Q1 2017
Card-Not-Present Purchase Fraud Loss on UK-Issued Cards, by E-Commerce, Mail Order and Telephone Order and
Total Remote, in GBP million, and Share of Total Card Purchase Fraud Loss, in %, 2011 - 2016 & H1 2017
Proximity Mobile Payment Users Number, in millions, and Penetration, in % of Smartphone Users, 2016 -2021f
4.2.2. GERMANY
Online and Mobile Payment Trends, January 2018
Payment Methods Used in E-Commerce, in % of Online Shoppers, May 2017
Payment Methods Offered, in % of Top 1,000 Online Shops, 2015 & 2016
Most Important Payment Trends for the Next 3 Years According to Online Merchants, in % of Online Merchants, 2017
Breakdown of Implementation of Express Checkout Solutions, in % of Online Merchants, 2017
Breakdown of Optimization of Payment Process for Mobile, in % of Online Merchants, 2017
Share of Consumers Who Have Used Payment via Smartphone, in %, and Share of Non-Users Who Could Imagine
Paying With a Smartphone in the Future, in %, April 2017
4.2.3. FRANCE
Payment Methods Preferred in E-Commerce, in % of Online Shoppers, June 2017
Breakdown of Main Barriers That Make Consumers Hesitant to Purchase Online, in %, by Total Population and Online
Shoppers, June 2017
Mobile Payment User Penetration, in % of Smartphone Users, March 2017
4.2.4. SPAIN
Payment Methods Used in E-Commerce, in % of Online Shoppers, 2016 & 2017
Breakdown of Factors Most Important in Online Payment Methods, in % of Online Shoppers, October 2017
4
GLOBAL ONLINE PAYMENT METHODS: SECOND HALF 2017
TABLE OF CONTENTS (3 of 7)
6
7
2
EUROPE (CONT.)
4.2. ADVANCED MARKETS (Cont.)
4.2.5. ITALY
Payment Methods Preferred in E-Commerce, in % of Online Shoppers, June 2017
Breakdown of Awareness and Usage of New FinTech Services, in % of Internet Users, 2017
4.2.6. NETHERLANDS
Payment Methods Preferred in E-Commerce, in % of Online Shoppers, June 2017
4.2.7. SWEDEN
Payment Methods Used and Preferred in Online and Mobile Shopping, in % of Online Shoppers, Q2 2017
Awareness and Usage of Mobile Payment Solutions, in % of Internet Users, Q2 2017
4.2.8. SWITZERLAND
Payment Methods Preferred in E-Commerce, in % of Online Shoppers, June 2017
Mobile Payment User Penetration, by Current User and Potential Use, in % of Consumers, August 2017
4.2.9. BELGIUM
Payment Methods Preferred in E-Commerce, in % of Online Shoppers, June 2017
4.3. EMERGING MARKETS
4.3.1. RUSSIA
Payment Methods Used in E-Commerce, in % of Active Internet Users, H1 2017
Payment Methods Used in E-Commerce, in % of Online Shoppers, 2016 & 2017
Breakdown of Last Online Purchase by Payment Method, in %, 2016 & 2017
Breakdown of Awareness of Cryptocurrencies, in % of Adults, July 2017
Breakdown of Perception of Cryptocurrencies, in % of Adults Who Heard About Cryptocurrencies, in %, July 2017
4.3.2. POLAND
Payment Methods That Encourage Online Shoppers to Purchase Online, in % of Online Shoppers, April 2017
4.3.3. TURKEY
Number of Domestic E-Commerce Transactions with Bank Cards, in millions, and Value, in TRY million, Q1 2015 – Q3
2017
Number of Cross-Border E-Commerce Transactions with Domestic Bank Cards, in millions, and Value, in TRY million,
Q1 2015 – Q1 2017
4.3.4. CZECH REPUBLIC
Payment Methods Preferred in E-Commerce, in % of Online Shoppers, June 2017
4
TABLE OF CONTENTS (4 of 7)
GLOBAL ONLINE PAYMENT METHODS: SECOND HALF 2017
3 7
8
2
NORTH AMERICA
5.1. REGIONAL
Share of Consumers Using Mobile Payment Apps at Least Weekly, by Apps from Retailers and Other Apps, 2016 &
2017
Breakdown of Current and Planned Mobile Payment Solutions Acceptance, in % of Retailers, February 2017
5.2. USA
Online and Mobile Payment Trends, February 2018
Breakdown of Payment Methods Preferred in E-Commerce, in % of Online Shoppers, February 2017
Ways in Which Fear of Hacking Has Influenced Online Shopping Behavior, in % of Online Shoppers, January 2017
E-Commerce Website Types Most Trusted with Financial Information When Shopping Online, in % of Online
Shoppers, January 2017
Share of Consumers Who Are Worried About Their Personal Information When Using a Mobile Payment App, in %,
2015 – 2017
Awareness and Usage of Emerging Technologies in Shopping, incl. Mobile Payment, in % of Consumers, July 2017
Mobile Payment Transactions, in USD billion, 2011, 2016 & 2021f
Mobile Wallets Used, in % of Internet Users, July 2017
Mobile Payment Apps Used for Making Payments In Store, in % of In-Store Mobile Payment Users, February 2017
Mobile Payment Apps Used for Preordering Food or Coffee, in % of Users, February 2017
P2P Mobile Payment Users, in millions, and Penetration, in % of Smartphone Users, 2016 -2021f
P2P Payment Services Used, in % of Users, 2017
Voice Payment Users, in millions, and Penetration, in % of Adults, 2017 - 2022f
Breakdown of Voice Assistants Trusted to Securely Make a Payment, in % of Adults, April 2017
5.3. CANADA
Top 3 Payment Methods Preferred in E-Commerce, in % of Respondents, March 2017
Breakdown of E-Commerce Sales by Payment Systems, in %, 2015 & 2016
Breakdown of Total Payment Volume, in millions, and Value, in CAD million, by Payment Methods, incl. Online
Transfers, 2015 & 2016
Share of Online Shoppers Who Have Used Mobile Payment or Digital Wallet Service to Make a Purchase, in %,
2016 & 2017
Share of Cardholders Who Loaded Credit/Debit Card Information on Their Mobile Phone/Wallet, in %, 2017
Awareness of Contactless Payment Methods, in % of Credit/Debit Cardholders, H1 2017
Breakdown of Contactless Card Payment Users and Apple Pay Users by Age Group, in %, Q2 2017
Share of Smartphone Users Indicating Security Concerns as a Hindrance to Making Mobile Payments, in %, by Age
Group, May 2017
LATIN AMERICA
6.1. REGIONAL
Use of Second Factor Authentication Systems in E-Commerce, incl. Methods Used and Attitude, in % of Banked
Online Shoppers, by Selected Countries, 2017
TABLE OF CONTENTS (5 OF 7)
GLOBAL ONLINE PAYMENT METHODS: SECOND HALF 2017
6
5
8
9
2
LATIN AMERICA (CONT.)
6.2. BRAZIL
Share of Top 10 B2C E-Commerce Payment Methods of Orders Placed and Approved Orders, in %, and Approval Rate
by Payment Method, in %, Q1 2017
Breakdown of the Number of Payment Installments Used, in % of Online Shoppers, 2016 & 2017e
Factors Important for the Decision to Purchase in E-Commerce, incl. Payment-Related, in % of Online Shoppers, April
2017
Payment Methods Used in M-Commerce, in % of Mobile Shoppers, September 2017
6.3. MEXICO
Online Payment Methods Used in E-Commerce, by Device Used, in % of Online Shoppers, August 2017
Offline Payment Methods Used in E-Commerce, by Device Used, in % of Online Shoppers, August 2017
Share of Online Shoppers Who Stored Information With an Online Merchant and Type of Information Stored with an
Online Merchant, in % of Online Shoppers, 2016 & 2017
Reasons for Not Storing Credit/Debit Card Information With Online Shops, in % of Online Shoppers, 2016 & 2017
Top 5 Most Important Aspects in E-Commerce Payments, in % of Online Shoppers, February 2017
Number of Authorized Payment Transactions on E-Commerce Websites, in millions, Value, in MXN billion, and
Authorization Rate, in % of Transactions and in % of Transaction Value, by Credit Cards and Debit Cards, Q1 2016 –
Q3 2017
Chargeback Rate, in % of Number of Authorized Payment Transactions on E-Commerce Websites and in % of Their
Value, by Credit Cards and Debit Cards, Q1 2016 – Q3 2017
6.4. COLUMBIA
Payment Methods Used in E-Commerce, in % of Online Shoppers, August 2016
Top 5 Motivations for Online Shopping, in % of Online Shoppers, August 2016
MIDDLE EAST
7.1. REGIONAL
Top 3 Barriers to Online Shopping, in % of Local Millennials in the GCC Who Did Not Shop Online, July 2017
7.2. UAE
Breakdown of Payment Methods Preferred in Online Shopping, in % of Online Shoppers, 2016
7.3. SAUDI ARABIA
Payment Methods Used in E-Commerce, in % of Online Shoppers, May 2017
Breakdown of Payment Methods Preferred in Online Shopping, in % of Online Shoppers, 2016
Breakdown of Payment Methods Most Used in Online Shops According to E-Commerce Merchants, in % of Surveyed
E-Commerce Merchants, June 2017
Perception of Increase in Credit Card Payments in Online Shops Over the Previous Year According to E-Commerce
Merchants, in % of Surveyed E-Commerce Merchants, June 2017
Reasons for Not Offering Credit Card Payments in Online Shops, in % of Surveyed E-Commerce Merchants Who Do
Not Accept Credit Card Payments in Their Shops, June 2017
6
GLOBAL ONLINE PAYMENT METHODS: SECOND HALF 2017 TABLE OF CONTENTS (6 OF 7)
7
9
10
2
MIDDLE EAST (CONT.)
7.4. ISRAEL
Perceived Disadvantages of Online Shopping, incl. Payment-Related, in % of Internet Users, September 2016
Share of Adult Internet Users in Israel Who Use Mobile Wallet Apps to Purchase Goods or Services At Least Once a
Month, in %, May 2017
7.5. IRAN
Market Shares of the Top 3 Online Payment Gateway Operators, in %, December 2016
7.6. QATAR
Payment Methods Preferred in E-Commerce, in % of Online Shoppers, 2016
7.7. KUWAIT
Breakdown of Payment Methods Preferred in Online Shopping, in % of Online Shoppers, 2016
7.8. LEBANON
Payment Methods Preferred in E-Commerce, in % of Online Shoppers, 2016
List of Selected Payment Providers, by Category, 2016
7.9. BAHRAIN
Barriers to Shopping Online, incl. Payment-Related, in % of Non-Online Shoppers, 2016
AFRICA
8.1. SOUTH AFRICA
Breakdown of Payment Methods Preferred in E-Commerce, in % of Online Shoppers, August 2017
Breakdown of Factors that Would Encourage to Shop Online More, incl. Payment-Related, in % of Online Shoppers,
August 2017
Breakdown of Barriers to E-Commerce, incl. Payment-Related, in % of Internet Users Who Do Not Shop Online,
August 2017
Breakdown of Types of Purchases for Which Non-Online Shoppers Would be Most Comfortable to Make Their First
Online Payment, in % of Internet Users Who Do Not Shop Online, August 2017
8.2. NIGERIA
Number and Value of Internet (Web) and Mobile Payment Transactions, in millions and in NGN billion, 2011- 2016 &
H1 2017
Breakdown of Experience with Mobile Money, in % Adults, 2016
Main Purposes of Using Mobile Money Services, in % Mobile Money Users, 2016
8.3. EGYPT
Top 3 Payment Methods Preferred in E-Commerce, in % of Online Shoppers, 2016
8.4. KENYA
Mobile Payment Statistics, incl. Number of Transactions, in millions, Value of Transactions, in KES billion, Number of
Accounts, in millions, and Number of Agents, in thousands, 2008 – 2017
7
8
10
TABLE OF CONTENTS (7 OF 7)
GLOBAL ONLINE PAYMENT METHODS: SECOND HALF 2017
11
2
11
REPORT-SPECIFIC SAMPLE CHARTS
GLOBAL ONLINE PAYMENT METHODS: SECOND HALF 2017
12
2
GENERAL METHODOLOGY OF OUR MARKET REPORTS Secondary Market Research
The reports are compiled based on secondary market research.
Secondary research is information gathered from previously published
sources. Our reports are solely based on information and data acquired
from national and international statistical offices, industry and trade
associations, business reports, business and company databases,
journals, company registries, news portals and many other reliable
sources. By using various sources we ensure maximum objectivity for all
obtained data. As a result, companies gain a precise and unbiased
impression of the market situation.
Cross referencing of data is conducted in order to ensure
validity and reliability.
The source of information and its release date are provided on
every chart. It is possible that the information contained in one chart is
derived from several sources. If this is the case, all sources are mentioned
on the chart.
The reports include mainly data from the last 12 months prior
to the date of report publication. Exact publication dates are mentioned in
every chart.
Definitions
The reports take into account a broad definition of B2C E-
Commerce, which might include mobile commerce. As definitions may
vary among sources, exact definition used by the source (if available) is
included at the bottom of the chart.
Chart Types
Our reports include text charts, pie charts, bar charts, rankings,
line graphs and tables. Every chart contains an Action Title, which
summarizes the main idea/finding of the chart and a Subtitle, which
provides necessary information about the country, the topic, units or
measures of currency, and the applicable time period(s) to which the data
refers. With respect to rankings, it is possible that the summation of all
categories amounts to more than 100%. In this case, multiple answers were
possible, which is noted at the bottom of the chart.
Report Structure
Reports are comprised of the following elements, in the following
order: Cover page, preface, legal notice, methodology, definitions, table of
contents, management summary (summarizing main information
contained in each section of report) and report content (divided into
sections and chapters). When available, we also include forecasts in our
report content. These forecasts are not our own; they are published by
reliable sources. Within Global and Regional reports, we include all major
developed and emerging markets, ranked in order of importance by using
evaluative criteria such as sales figures.
Notes and Currency Values
If available, additional information about the data collection, for
example the time of survey and number of people surveyed, is provided in
the form of a note. In some cases, the note (also) contains additional
information needed to fully understand the contents of the respective data.
When providing information about amounts of money, local
currencies are most often used. When referencing currency values in the
Action Title, the EUR values are also provided in brackets. The conversions
are always made using the average currency exchange rate for the
respective time period. Should the currency figure be in the future, the
average exchange rate of the past 12 months is used.
METHODOLOGY OF OUR GLOBAL ONLINE PAYMENT METHODS: SECOND HALF 2017
Report Coverage
This report covers the global online payment market. It takes
into account a wide definition of online payment, including payment
methods used in online shopping and mobile payment, such as remote
and in-store (proximity) payments.
Major B2C E-Commerce markets in all global regions are
covered, including advanced and emerging, while data availability varied
across the countries.
The report includes data mostly published within the second
half of 2017. The exact date of publication of the source is stated on each
chart. The time period which the data refers to differs by source.
Report Structure
The global chapter opens the report, featuring an overview of
global online and mobile payment developments.
The rest of the report is divided by regions presented in the
descending order of B2C E-Commerce sales. Within each region, the
countries are grouped by advanced and emerging markets, where
applicable, and ranked by online sales. Furthermore, where available,
regional information was also included.
Depending on data availability, the following types of market
information are included: payment methods most used by online and
mobile shoppers, breakdown of E-Commerce sales by payment methods,
number and value of online/mobile payment transactions, rankings of
online and mobile payment providers, mobile payment usage and
consumer awareness of mobile payment services. Not all the mentioned
types of information are available for each of the covered countries. For the
top 5 countries leading worldwide in terms of B2C E-Commerce sales, also
online and mobile payment trends and news about major players, such as
payment providers, banks and retailers are presented on text charts.
GLOBAL ONLINE PAYMENT METHODS: SECOND HALF 2017
METHODOLOGY
8 12
Asia-Pacific Online Payment Methods: Second Half 2017 February 2018 € 750
Europe Online Payment Methods: Second Half 2017 February 2018 € 950
Innovation Trends in Global Retail and Payments 2017 October 2017 € 950
Top 5 Country B2C E-Commerce Sales Forecasts: 2017 to 2021 December 2017 € 1,950
China B2C E-Commerce Sales Forecasts: 2017 to 2021 November 2017 € 450
Japan B2C E-Commerce Sales Forecasts: 2017 to 2021
USA B2C E-Commerce Sales Forecasts: 2017 to 2021
UK B2C E-Commerce Sales Forecasts: 2017 to 2021
Germany B2C E-Commerce Sales Forecasts: 2017 to 2021
November 2017
November 2017
November 2017
November 2017
€ 450
€ 450
€ 450
€ 450
Middle East B2C E-Commerce Market 2018
North America B2C E-Commerce Market 2017
Latin America B2C E-Commerce Market 2017
Europe B2C E-Commerce Market 2017
Western Europe Asia B2C E-Commerce Market 2017
Asia-Pacific B2C E-Commerce Market 2017
Southeast Asia B2C E-Commerce Market 2017
January 2018
December 2017
October 2017
July 2017
July 2017
June 2017
May 2017
€ 1,950
€ 950
€ 1,950
€ 3,950
€ 2,950
€ 3,950
€ 1,950
Global M-Commerce 2017 June 2017 € 1, 950
Global Cross-Border B2C E-Commerce 2017 February 2017 € 2,950
UPCOMING RELATED REPORTS
REPORT PUBLICATION
DATE
PRICE*
Global Alternative Online Payment Methods: Second Half 2017
Global Mobile Payment Methods: Second Half 2017
February 2018
February 2018
€ 950
€ 950
GLOBAL ONLINE PAYMENT METHODS: SECOND HALF 2017
9 13
10 14
11 15
12 16
13 17
14 18