global mobile wallets 2017: competitors and … · global mobile wallets 2017: competitors and...
TRANSCRIPT
GLOBAL MOBILE WALLETS 2017: COMPETITORS AND MARKET OPPORTUNITIES PUBLICATION DATE: JANUARY 2017
PAGE 2 GENERAL INFORMATION I PAGE 3 KEY FINDINGS I PAGE 4-5 TABLE OF CONTENTS I PAGE 6 REPORT-SPECIFIC SAMPLE
CHARTS I PAGE 7 METHODOLOGY I PAGE 8 RELATED REPORTS I PAGE 9 CLIENTS I PAGE 10-11 FREQUENTLY ASKED QUESTIONS
PAGE 12 ORDER FORM I PAGE 13 TERMS AND CONDITIONS
2
2
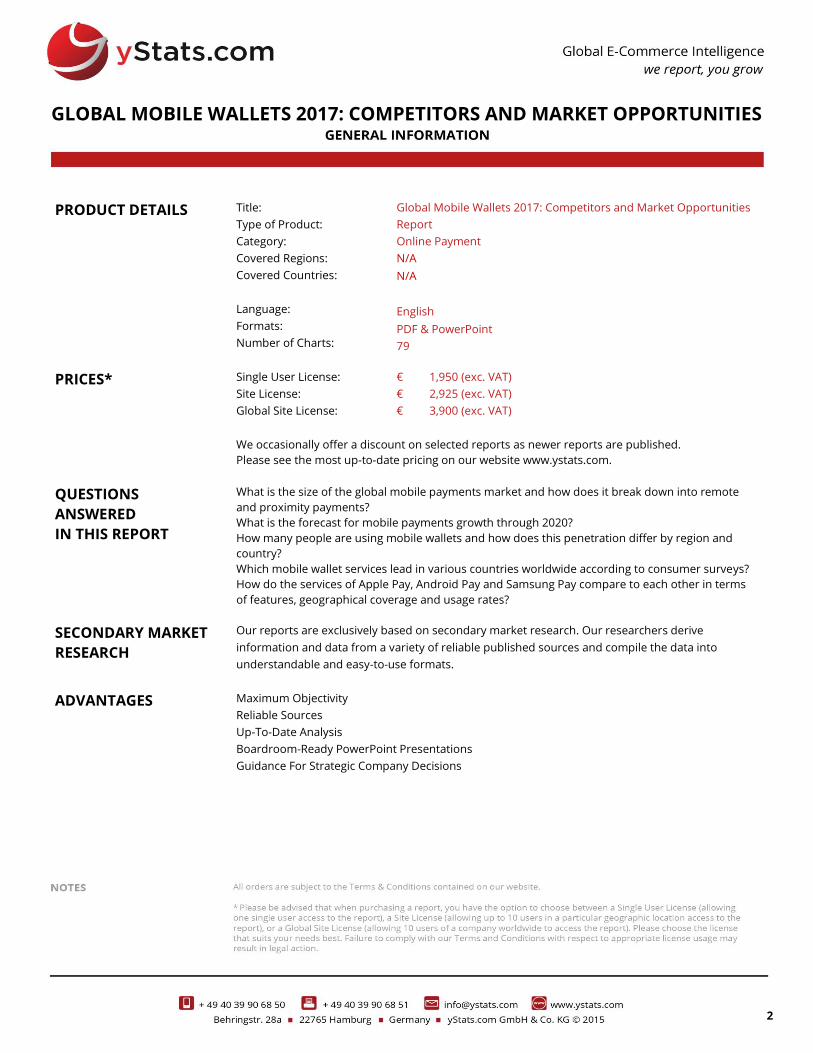
PRODUCT DETAILS Title:
Type of Product:
Category:
Covered Regions:
Covered Countries:
Language:
Formats:
Number of Charts:
Global Mobile Wallets 2017: Competitors and Market Opportunities
Report
Online Payment
N/A
N/A
English
PDF & PowerPoint
79
PRICES* Single User License:
Site License:
Global Site License:
€ 1,950 (exc. VAT)
€ 2,925 (exc. VAT)
€ 3,900 (exc. VAT)
We occasionally offer a discount on selected reports as newer reports are published.
Please see the most up-to-date pricing on our website www.ystats.com.
QUESTIONS
ANSWERED
IN THIS REPORT
What is the size of the global mobile payments market and how does it break down into remote
and proximity payments?
What is the forecast for mobile payments growth through 2020?
How many people are using mobile wallets and how does this penetration differ by region and
country?
Which mobile wallet services lead in various countries worldwide according to consumer surveys?
How do the services of Apple Pay, Android Pay and Samsung Pay compare to each other in terms
of features, geographical coverage and usage rates?
SECONDARY MARKET
RESEARCH
Our reports are exclusively based on secondary market research. Our researchers derive
information and data from a variety of reliable published sources and compile the data into
understandable and easy-to-use formats.
ADVANTAGES Maximum Objectivity
Reliable Sources
Up-To-Date Analysis
Boardroom-Ready PowerPoint Presentations
Guidance For Strategic Company Decisions
GLOBAL MOBILE WALLETS 2017: COMPETITORS AND MARKET OPPORTUNITIES
THE GROWTH OF MOBILE WALLETS IS HIGHLIGHTED
IN A NEW REPORT FROM YSTATS.COM
The explosive growth of mobile payments worldwide triggered the emergence of
various new payment options, the most prominent of which are mobile wallets. Tech giants,
banks, card networks, telecom operators, payment companies and merchants have
introduced multiple digital wallet solutions to the market, attracted by the multi-billion
mobile payments opportunity, as detailed in the yStats.com report.
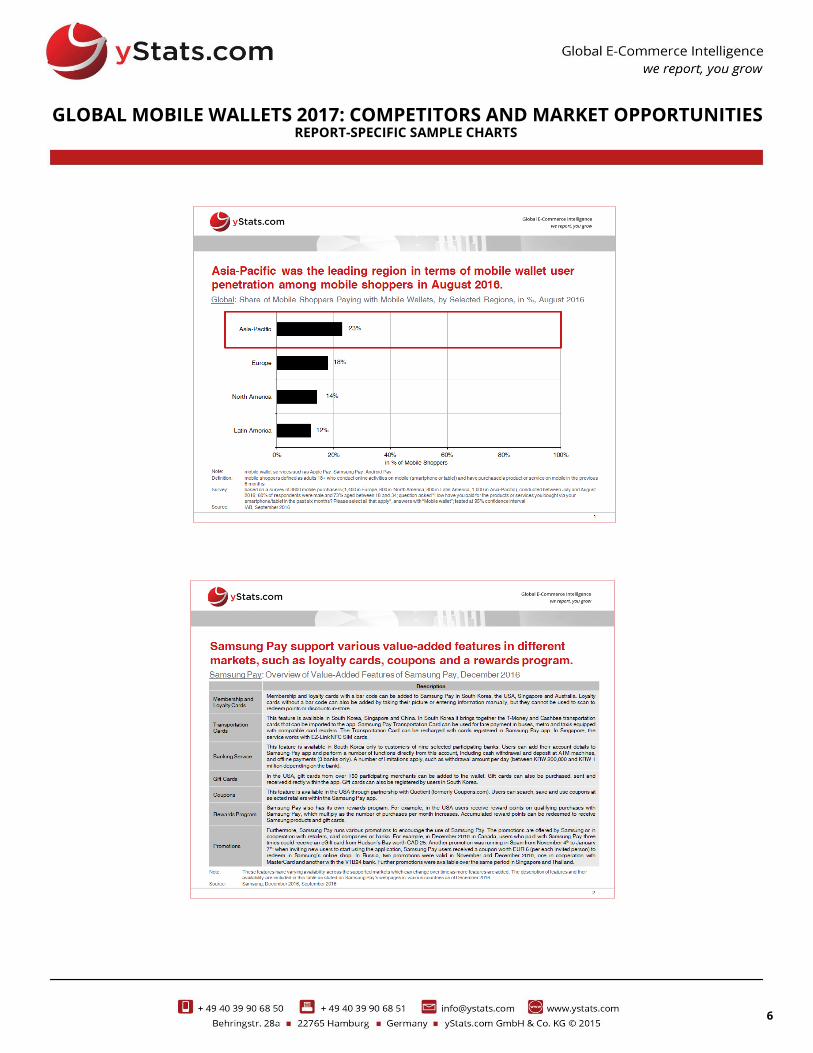
Consumers in Asia-Pacific were most responsive to the numerous mobile wallets
offerings, compared to other global regions, but even there less than a quarter of mobile
shoppers pay with mobile wallets, according to a recent survey cited in the yStats.com
report. Overall, smartphone owners in emerging markets, such as India, South Africa and
the UAE are more likely to adapt mobile wallets in the future than consumers in some
advanced economies, such as Germany.
Nevertheless, the currently more advanced and digitalized market in the USA was the
first choice of Apple and Google for launching their respective mobile wallet solutions, Apple
Pay and Android Pay. The yStats.com publication provides comprehensive profiles of these
solutions and that of Samsung Pay, and compares them in terms of features, geographical
availability and usage rates.
GLOBAL MOBILE WALLETS 2017: COMPETITORS AND MARKET OPPORTUNITIES
3
MANAGEMENT SUMMARY
GLOBAL MOBILE PAYMENT AND MOBILE WALLET MARKET INFORMATION
Mobile Payments Share of Total Consumer Card Payments, in %, 2016fe & 2021f
Mobile Payments, in USD billion, 2014 & 2020f
Proximity Mobile Payments, in USD billion, 2014 & 2019f
Number of Proximity Mobile Payment Users, in millions, 2014 – 2019f
Mobile and Wearable Contactless Payments, in USD billion, 2015 & 2018f
Payment Volume of Digital Wallets Compared to Closed Loop Cards/Mobile Apps, Mobile Money, and Virtual
Currencies, by Lower Range and Higher Range, in USD billion, 2014
Breakdown of Mobile Payments by Usage Case, by Europe and North America, 2016e
Mobile Payment Usage In-Store and Online, in % of Respondents, by Generation, 2015
Perception of Security of Mobile Payments, in % of Respondents, by Generations, 2015
Number of Active Mobile Wallet Users, in millions, 2015 & 2023f
Products and Services Paid for via Mobile Wallet, in % of Mobile Shoppers Who Paid with Mobile Wallet, August 2016
Share of Mobile Shoppers Paying with Mobile Wallets, by Selected Regions, in %, August 2016
Share of Mobile Shoppers Paying with Mobile Wallets, by Selected Countries, in %, August 2016
Probability of Using Mobile Wallets, in % of Smartphone Owners, by Selected Countries, July 2016
RANKINGS OF MOBILE PAYMENT SERVICES AND MOBILE WALLETS IN SELECTED
COUNTRIES
Number of Active Users of Selected Mobile Payment Services in China, in millions, Q4 2015
Overview of Four Selected Mobile Payment Services in South Korea, incl. Provider, Launch Date and Number of
Users, June 2016
Top 3 Mobile Wallet Apps, by Penetration in India, in % of Mobile Payment App Users, and Average Time Spent Per
User Per Month, in minutes, December 2015 & April 2016
Digital Wallets Used in the USA, in % of Internet Users, August 2016
Mobile Payment Apps Used in Canada, in % of Mobile Payments Users, by Gender, Generation and Total, April 2016
Brands Most Trusted by Consumers in the UK for Delivering a Smartphone Wallet App, in % of Smartphone Owners,
September 2015, February 2016, June 2016
Awareness of Mobile Payment Providers in Germany, incl. Mobile Wallets, in % of Adults, January 2016
Mobile Payment Apps Installed in Spain, in % of Mobile Payment App Users, July 2016
PROFILES OF APPLE PAY, ANDROID PAY AND SAMSUNG PAY
4.1. OVERVIEW AND COMPARISON
Comparative Overview of Android Pay, Apple Pay and Samsung Pay, December 2016
Volume of In-App Purchases and Website Retail Payments via Apple Pay and Android Pay (As Total), in USD billion,
2016f & 2018f
Volume of In-Store Payments with Android Pay, Apple Pay and Samsung Pay in the USA, in USD billion, 2016e
Number of In-Store Monthly Users of Android Pay, Apple Pay and Samsung Pay in the USA, in millions, 2016e
Selected Data Related to Usage of Android Pay, Apple Pay and Samsung Pay in the USA, incl. Awareness, Usage for
Purchase, Frequency of Usage, Average Number of Cards Loaded, and Satisfaction Rating, June 2016
Types of Cards Loaded into Android Pay, Apple Pay and Samsung Pay in the USA, in % of Users, June 2016
3
2
4
GLOBAL MOBILE WALLETS 2017: COMPETITORS AND MARKET OPPORTUNITIES
TABLE OF CONTENTS
4
1
5
5
PROFILES OF APPLE PAY, ANDROID PAY AND SAMSUNG PAY (Cont.)
4.2. APPLE PAY PROFILE
Overview of Apple Pay, December 2016
Overview of Countries/Territories Supported by Apple Pay, incl. Date of Launch, October 2014 – December 2016
Payment Card Types Supported by Apple Pay, by Country/Territory, December 2016
Overview of Security Features of Apple Pay, December 2016
Overview of Features Available to Online Merchants with Apple Pay, December 2016
Selected Payment Providers Supporting Acceptance of Apple Pay on Website and In-App, by Country/Territory,
December 2016
Overview of Information Related to Fees Charged by Apple Pay, December 2016
Examples of Merchants Accepting Apple Pay, by Country/Territory, December 2016
Number of Locations in the USA Accepting Apple Pay, in millions, October 2014 & December 2016
Selected Data Related to Usage of Apple Pay in the USA, incl. Awareness, Usage for Purchase, Frequency of Usage,
Average Number of Cards Loaded, and Satisfaction Rating, May 2015, December 2015, June 2016
Usage of Apple Pay for In-Store and In-App Credit Card Transactions, in % of Apple Pay Users, and Breakdown of
Apple Pay Credit Card Transactions by In-Store and In-App Purchase, in %, 2015
4.3. SAMSUNG PAY PROFILE
Overview of Samsung Pay, December 2016
Overview of Countries/Territories Supported by Samsung Pay, incl. Date of Launch, August 2015 – December 2016 &
Upcoming, as of December 2016
Overview of Payment Features of Samsung Pay, December 2016
Types of Payment Cards by Samsung Pay, by Country/Territory, December 2016
Overview of Security Features of Samsung Pay, December 2016
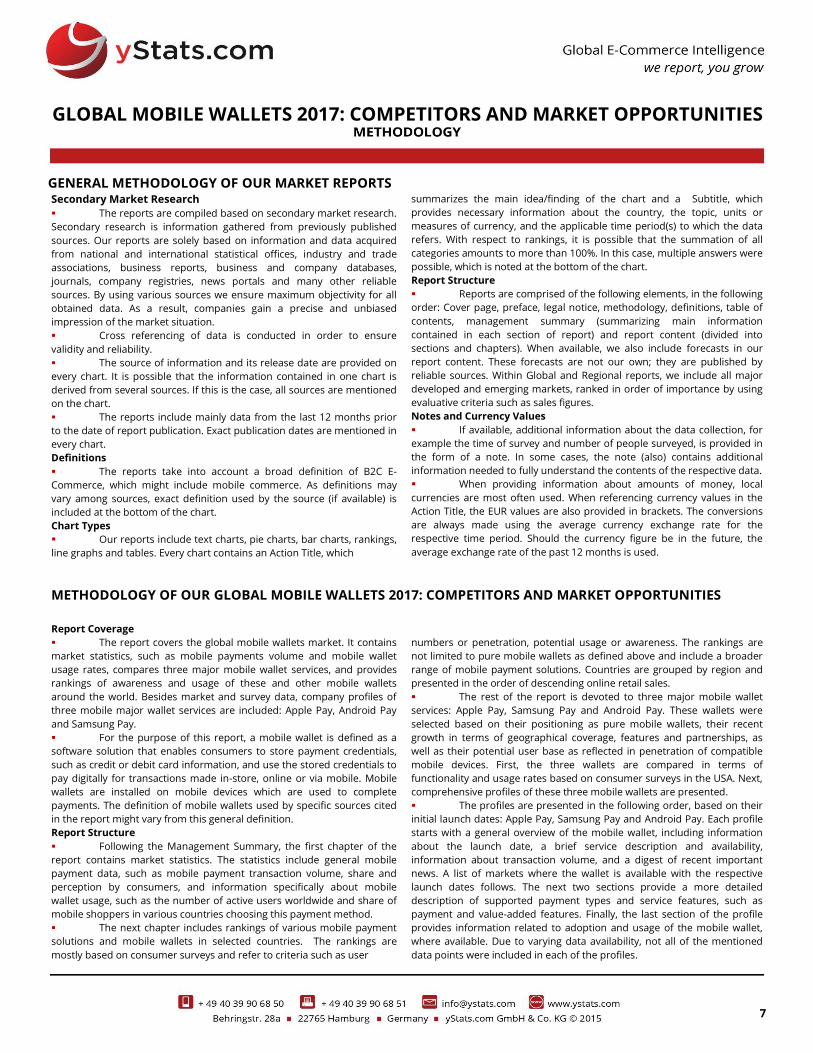
Overview of Value-Added Features of Samsung Pay, December 2016
Share of Samsung Pay Transactions in South Korea Made Online, in % and in KRW trillion, Year to August 2016
Number of Samsung Pay Users in South Korea, in millions, October 2015 & March 2016
4.4. ANDROID PAY PROFILE
Overview of Android Pay, December 2016
Overview of Countries/Territories Supported by Android Pay, incl. Date of Launch, September 2015 – December
2016
Overview of Payment Features of Android Pay, December 2016
Overview of Security Features of Android Pay, December 2016
Types of Payment Cards Supported by Android Pay, by Country/Territory, December 2016
Overview of Value-Added Features of Android Pay, December 2016
Examples of Merchants Accepting Android Pay, by Country/Territory, December 2016
GLOBAL MOBILE WALLETS 2017: COMPETITORS AND MARKET OPPORTUNITIES
TABLE OF CONTENTS
4
6
6
GLOBAL MOBILE WALLETS 2017: COMPETITORS AND MARKET OPPORTUNITIES
REPORT-SPECIFIC SAMPLE CHARTS
GENERAL METHODOLOGY OF OUR MARKET REPORTS Secondary Market Research
The reports are compiled based on secondary market research.
Secondary research is information gathered from previously published
sources. Our reports are solely based on information and data acquired
from national and international statistical offices, industry and trade
associations, business reports, business and company databases,
journals, company registries, news portals and many other reliable
sources. By using various sources we ensure maximum objectivity for all
obtained data. As a result, companies gain a precise and unbiased
impression of the market situation.
Cross referencing of data is conducted in order to ensure
validity and reliability.
The source of information and its release date are provided on
every chart. It is possible that the information contained in one chart is
derived from several sources. If this is the case, all sources are mentioned
on the chart.
The reports include mainly data from the last 12 months prior
to the date of report publication. Exact publication dates are mentioned in
every chart.
Definitions
The reports take into account a broad definition of B2C E-
Commerce, which might include mobile commerce. As definitions may
vary among sources, exact definition used by the source (if available) is
included at the bottom of the chart.
Chart Types
Our reports include text charts, pie charts, bar charts, rankings,
line graphs and tables. Every chart contains an Action Title, which
summarizes the main idea/finding of the chart and a Subtitle, which
provides necessary information about the country, the topic, units or
measures of currency, and the applicable time period(s) to which the data
refers. With respect to rankings, it is possible that the summation of all
categories amounts to more than 100%. In this case, multiple answers were
possible, which is noted at the bottom of the chart.
Report Structure
Reports are comprised of the following elements, in the following
order: Cover page, preface, legal notice, methodology, definitions, table of
contents, management summary (summarizing main information
contained in each section of report) and report content (divided into
sections and chapters). When available, we also include forecasts in our
report content. These forecasts are not our own; they are published by
reliable sources. Within Global and Regional reports, we include all major
developed and emerging markets, ranked in order of importance by using
evaluative criteria such as sales figures.
Notes and Currency Values
If available, additional information about the data collection, for
example the time of survey and number of people surveyed, is provided in
the form of a note. In some cases, the note (also) contains additional
information needed to fully understand the contents of the respective data.
When providing information about amounts of money, local
currencies are most often used. When referencing currency values in the
Action Title, the EUR values are also provided in brackets. The conversions
are always made using the average currency exchange rate for the
respective time period. Should the currency figure be in the future, the
average exchange rate of the past 12 months is used.
METHODOLOGY OF OUR GLOBAL MOBILE WALLETS 2017: COMPETITORS AND MARKET OPPORTUNITIES
Report Coverage
The report covers the global mobile wallets market. It contains
market statistics, such as mobile payments volume and mobile wallet
usage rates, compares three major mobile wallet services, and provides
rankings of awareness and usage of these and other mobile wallets
around the world. Besides market and survey data, company profiles of
three mobile major wallet services are included: Apple Pay, Android Pay
and Samsung Pay.
For the purpose of this report, a mobile wallet is defined as a
software solution that enables consumers to store payment credentials,
such as credit or debit card information, and use the stored credentials to
pay digitally for transactions made in-store, online or via mobile. Mobile
wallets are installed on mobile devices which are used to complete
payments. The definition of mobile wallets used by specific sources cited
in the report might vary from this general definition.
Report Structure
Following the Management Summary, the first chapter of the
report contains market statistics. The statistics include general mobile
payment data, such as mobile payment transaction volume, share and
perception by consumers, and information specifically about mobile
wallet usage, such as the number of active users worldwide and share of
mobile shoppers in various countries choosing this payment method.
The next chapter includes rankings of various mobile payment
solutions and mobile wallets in selected countries. The rankings are
mostly based on consumer surveys and refer to criteria such as user
numbers or penetration, potential usage or awareness. The rankings are
not limited to pure mobile wallets as defined above and include a broader
range of mobile payment solutions. Countries are grouped by region and
presented in the order of descending online retail sales.
The rest of the report is devoted to three major mobile wallet
services: Apple Pay, Samsung Pay and Android Pay. These wallets were
selected based on their positioning as pure mobile wallets, their recent
growth in terms of geographical coverage, features and partnerships, as
well as their potential user base as reflected in penetration of compatible
mobile devices. First, the three wallets are compared in terms of
functionality and usage rates based on consumer surveys in the USA. Next,
comprehensive profiles of these three mobile wallets are presented.
The profiles are presented in the following order, based on their
initial launch dates: Apple Pay, Samsung Pay and Android Pay. Each profile
starts with a general overview of the mobile wallet, including information
about the launch date, a brief service description and availability,
information about transaction volume, and a digest of recent important
news. A list of markets where the wallet is available with the respective
launch dates follows. The next two sections provide a more detailed
description of supported payment types and service features, such as
payment and value-added features. Finally, the last section of the profile
provides information related to adoption and usage of the mobile wallet,
where available. Due to varying data availability, not all of the mentioned
data points were included in each of the profiles.
GLOBAL MOBILE WALLETS 2017: COMPETITORS AND MARKET OPPORTUNITIES
7
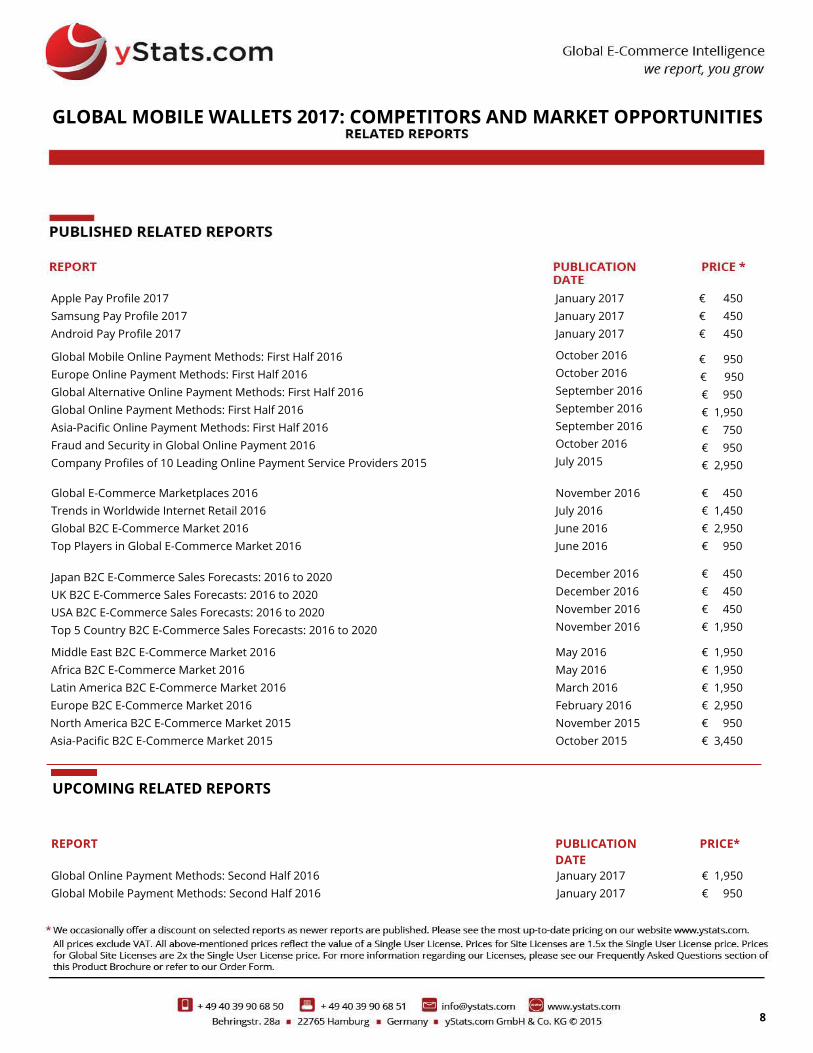
Apple Pay Profile 2017 January 2017 € 450
Samsung Pay Profile 2017
Android Pay Profile 2017
January 2017
January 2017
€ 450
€ 450
Global Mobile Online Payment Methods: First Half 2016
Europe Online Payment Methods: First Half 2016
Global Alternative Online Payment Methods: First Half 2016
Global Online Payment Methods: First Half 2016
Asia-Pacific Online Payment Methods: First Half 2016
Fraud and Security in Global Online Payment 2016
Company Profiles of 10 Leading Online Payment Service Providers 2015
October 2016
October 2016
September 2016
September 2016
September 2016
October 2016
July 2015
€ 950
€ 950
€ 950
€ 1,950
€ 750
€ 950
€ 2,950
Global E-Commerce Marketplaces 2016
Trends in Worldwide Internet Retail 2016
Global B2C E-Commerce Market 2016
Top Players in Global E-Commerce Market 2016
November 2016
July 2016
June 2016
June 2016
€ 450
€ 1,450
€ 2,950
€ 950
Japan B2C E-Commerce Sales Forecasts: 2016 to 2020
UK B2C E-Commerce Sales Forecasts: 2016 to 2020
USA B2C E-Commerce Sales Forecasts: 2016 to 2020
Top 5 Country B2C E-Commerce Sales Forecasts: 2016 to 2020
December 2016
December 2016
November 2016
November 2016
€ 450
€ 450
€ 450
€ 1,950
Middle East B2C E-Commerce Market 2016 May 2016 € 1,950
Africa B2C E-Commerce Market 2016 May 2016 € 1,950
Latin America B2C E-Commerce Market 2016
Europe B2C E-Commerce Market 2016
North America B2C E-Commerce Market 2015
Asia-Pacific B2C E-Commerce Market 2015
March 2016
February 2016
November 2015
October 2015
€ 1,950
€ 2,950
€ 950
€ 3,450
UPCOMING RELATED REPORTS
REPORT PUBLICATION
DATE
PRICE*
Global Online Payment Methods: Second Half 2016 January 2017 € 1,950
Global Mobile Payment Methods: Second Half 2016 January 2017 € 950
GLOBAL MOBILE WALLETS 2017: COMPETITORS AND MARKET OPPORTUNITIES
8
9
10
11
12
13