global analysis of g-protein-coupled receptor signaling in human tissues
TRANSCRIPT

Global analysis of G-protein-coupled receptor signaling in human tissues
Yaron Hakak�, Devin Shrestha, Moira C. Goegel, Dominic P. Behan, Derek T. ChalmersArena Pharmaceuticals, 6166 Nancy Ridge Drive, San Diego, CA 92121, USA
Received 28 May 2003; revised 30 June 2003; accepted 30 June 2003
First published online 31 July 2003
Edited by Robert B. Russell
Abstract The G-protein-coupled receptor (GPCR) family me-diates a host of cell^cell communications upon activation bydiverse ligands. Numerous GPCRs have been shown to displayanatomically selective patterns of gene expression, however, ourunderstanding of the complexity of GPCR signaling within hu-man tissues remains unclear. In an e¡ort to characterize globalpatterns of GPCR signaling in the human body, microarrayanalysis was performed on a large panel of tissues to monitorthe gene expression levels of the receptors as well as relatedsignaling and regulatory molecules. Analysis of the data re-vealed complex signaling networks in many tissue types, withtissue-speci¢c patterns of gene expression observed for the ma-jority of the receptors and a number of components and regu-lators of GPCR signaling.* 2003 Published by Elsevier B.V. on behalf of the Federationof European Biochemical Societies.
Key words: GPCR; G-protein; Microarray; Gene expression
1. Introduction
G-protein-coupled receptors (GPCRs) constitute the largestfamily of cell-surface proteins. A wide variety of extracellularstimuli (such as hormones, chemokines, odorants, and neuro-transmitters) signal through this receptor family. GPCRs forwhich the natural ligands have been identi¢ed are referred toas ‘known’ receptors, while those for which no natural ligandshave yet been found are referred to as ‘orphan’ receptors.Upon binding of extracellular ligands, GPCRs interact with
GTP-binding proteins (G-proteins). G-proteins are heterotri-meric complexes composed of an K, L, and Q subunit, each ofwhich has multiple isoforms [1]. Their interaction withGPCRs results in the dissociation of the GK subunit fromthe GLQ complex. The dissociated subunits may subsequentlyinhibit or activate e¡ector enzymes that modulate secondarysignaling pathways [2,3]. Regulation of G-proteins by RGSs(regulator of G-protein signaling) and GPCR tra⁄cking byRAMPs (receptor activity modifying proteins) have also beendescribed as mechanisms of modulating receptor signaling[4,5]. The various mechanisms of GPCR signaling likely allowfor the range of extracellular stimuli to selectively induce cel-lular responses in target tissues. While the extent of diversity
in GPCR signaling is unclear, results from a number of stud-ies illustrate the tendency for GPCR gene expression to beenriched in particular tissues. Restricted tissue distributionof GPCRs has frequently re£ected their physiological func-tions, as is the case of the role for the central nervous system(CNS)-enriched dopamine receptors in neurotransmission [6].Assessment of the tissue distribution of GPCRs and relatedsignaling molecules may therefore clarify the complexity ofthe molecular mechanisms by which receptors act to transduceextracellular stimuli.The sequencing of the human genome has brought new
avenues by which global approaches can be undertaken toinvestigate the breadth of GPCR signaling. It is now esti-mated that the GPCR superfamily consists of 600^1000 re-ceptors [7]. The advent of microarray technology allows for alarge sampling of the receptor family to be performed. Thistechnology permits one to monitor the message levels of thou-sands of genes simultaneously in a given sample [8,9]. In thisstudy, we have used a custom high-density oligonucleotidemicroarray containing probes designed to measure the geneexpression levels of over 700 human GPCRs, along with anumber of molecules involved in GPCR signaling and regu-lation. Evaluation of the transcriptional levels for these genesacross a large panel of tissues would thus provide a globalview of GPCR signaling in the human body. This custommicroarray, in addition, was designed to monitor gene expres-sion levels in the mouse, a common model organism used tostudy the function of human GPCRs. Comparative analysis ofthe gene expression levels of putative ortholog GPCR pairsacross a panel of tissues may characterize the concordance inreceptor signaling between the two species.
2. Materials and methods
2.1. Sample information and preparation of total RNAGross dissections of brain tissues from normal human donors were
obtained from the Harvard Brain Tissue Resource Center (McLeanHospital, Belmont, MA, USA) and Clinomics Biosciences (Frederick,MD, USA). Selection of normal donors was based on gross and mi-croscopic examinations of multiple brain regions that indicated unre-markable pathology. Total RNA was extracted from brain tissueswith TRIzol Reagent (Invitrogen, Carlsbad, CA, USA) followingthe manufacturer’s protocol. The quality of total RNA was then as-sessed using an Agilent 2100 bioanalyzer (visible absence of signi¢cant28S and 18S band degradation) and by spectrophotometry. High-quality total RNA derived from the same brain region of a minimumof three donors was pooled in an e¡ort to avoid biological variability.Total RNA from normal human peripheral tissues of multiple donorswas purchased from commercial sources. Stable cell lines were ac-quired from American Type Culture Collection (Manassas, VA,USA). Cells were cultured under recommended conditions to nearcon£uence. Mouse tissues were dissected from 8^15 C57/BL6 miceages 8^10 weeks.
0014-5793 / 03 / $22.00 J 2003 Published by Elsevier B.V. on behalf of the Federation of European Biochemical Societies.doi:10.1016/S0014-5793(03)00762-2
*Corresponding author. Fax: (1)-858-453-7210.E-mail address: [email protected] (Y. Hakak).
Abbreviations: GPCR, G-protein-coupled receptor; G-protein, GTP-binding protein; RGS, regulator of G-protein signaling; RAMP, re-ceptor activity modifying protein; CNS, central nervous system
FEBS 27484 13-8-03 Cyaan Magenta Geel Zwart
FEBS 27484 FEBS Letters 550 (2003) 11^17

2.2. Microarray procedure and data analysisHigh-density oligonucleotide microarray analysis was performed
essentially as previously described [10] using the A¡ymetrix (SantaClara, CA, USA) GeneChip technology. A custom dual-species mi-croarray was designed to contain probes that monitor the expressionof over 700 known, orphan, and olfactory-like human GPCRs. Addi-tionally, probes for a comparable number of putative mouse orthologGPCRs were designed. Putative mouse ortholog receptors were iden-ti¢ed by reciprocal BLAST searches. Probes for mediators and regu-lators of GPCR signaling described in the literature were also in-cluded. Microarray analysis of total RNA was performed induplicate for each sample.GeneChip software MAS 5.0 was used to analyze the relative
abundance of labeled cRNA hybridized to the microarray fromthe scanned image. A threshold signal (Avg. Di¡.) level was de¢nedfor human and mouse samples to call a gene transcript presentor detectable based on polymerase chain reaction (PCR) valida-tion of the microarray data and the expression levels of genes reportedin the literature to be expressed in particular tissues. Tissues weregrouped based on functional similarity and classi¢ed as primaryand stable cell lines, adipose, endocrine, CNS, immune, reproduc-tive, gastrointestinal, or other tissue types. Hierarchical clusteranalysis was performed on genes that were detected in at least onetissue sample and di¡erentially expressed (ANOVA, Ps 0.05) by ahierarchical clustering algorithm [11] using an average linkage method[12].
2.3. Comparative analysis of human and mouse microarray dataA set of common human and mouse tissues were used for the
analysis. Receptors that were detected and di¡erentially expressed(ratio of standard deviation to mean greater than 0.5) in at leastone of the common tissues from both human and mouse sampleswere incorporated into the analysis. Retained ortholog pairs werecompared by Pearson’s correlation coe⁄cient.
2.4. PCR validation of microarray dataPCR validation was assessed for 87 receptors for which expression
was detected by microarray analysis in at least one of six selectedtissues. cDNA was synthesized from the total RNA samples pro¢ledfollowing the same protocols used for microarray analysis. Primerswere designed with the nucleotide sequence used to devise the oligo-nucleotides synthesized on the microarrays. For each receptor, PCRwas performed with 100 ng cDNA of the tissues that showed detect-able receptor expression by microarray analysis (total of 120 reac-tions). Reactions were scored based on successful ampli¢cation ofreceptor fragments from each cDNA. The incidence of receptor ex-pression as determined by microarray analysis was then assessed ineach of the reactions.
3. Results
3.1. GPCR detection by microarray analysisThe gene expression levels of over 400 known and orphan
receptors and approximately 300 olfactory-like receptors wereassayed using a high-density oligonucleotide microarray. Mi-croarray analysis was performed on 80 CNS and peripheralnon-diseased tissues, as well as primary cells and stable celllines. Results from the microarray experiments were validatedby PCR of 87 receptors in six di¡erent tissues. GPCRs thatwere detected by microarray analysis were successfully ampli-¢ed by PCR 85% of the time, while 15% of the reactionsshowed no expression (data not shown). Of the GPCRs as-sayed, 373 receptors had detectable transcriptional levels in atleast one of the tissues pro¢led. The lack of detection of theother receptors represented on the microarray may, in part, bedue to non-optimal probe design, inadequate pro¢ling of oth-er tissue types and developmental stages, or signal dilutioncaused by cell types present in the sample assayed that donot express the receptor.
3.2. Hierarchical cluster analysis of expression dataHierarchical cluster analysis of the 373 detected receptors
was performed to identify tissue-speci¢c patterns of GPCRexpression (Fig. 1A). Dendrogram representation of the sam-ple clustering partitioned the tissues into neuronal and periph-eral groupings. These data, not surprisingly, show a greatersimilarity in GPCR expression patterns among neuronal tis-sues relative to peripheral tissues. Most notably expressedwithin the neuronal tissues was a cluster of 67 GPCRs.Among these receptors were the dopamine, GABA, andbrain-speci¢c angiogenesis inhibitor receptors (Fig. 1B). Tis-sue-speci¢c clusters of GPCR expression were also present ina number of peripheral tissues. Immune-related sample pro-¢les revealed a cluster of 65 enriched GPCRs, with a numberof selectively expressed receptors in eosinophils, neutrophils,and natural killer cells. Prominent clusters of GPCRs wereadditionally found in the pro¢les of the pancreas, liver, testes,and adipose tissues. The speci¢city in receptor tissue distribu-tion indicates that functionally related tissues share subsets ofGPCRs with overlapping expression, while other tissues hav-ing specialized physiological functions express clusters ofGPCRs with more distinct expression patterns. Additionally,a set of cultured primary and stable cell lines derived fromunrelated tissues (including neural progenitors and PC-3)showed similar patterns of GPCR expression. Clustering ofthese samples in the same dendrogram branch may indicatethat in vitro culturing environments may signi¢cantly modu-late GPCR expression.Cellular responses induced by GPCR activation are medi-
ated by a number of signaling and regulatory molecules. Thetissue distribution for over 100 expressed genes was thereforeexamined by hierarchical cluster analysis to determinewhether particular mechanisms of GPCR signaling and regu-lation are predominant in certain tissue types. Three promi-nent gene clusters were identi¢ed in neuronal tissues, immune-related cell and tissue types, and a set of peripheral tissues.Among the gene clusters found were a set of 10 G-proteinsand eight RGSs enriched in neuronal tissues and ¢ve G-pro-teins and three RGSs enriched in immune cell types (Fig. 1C,upper and middle panels). Another set of genes found to beenriched in the peripheral tissues contained RAMPs 1^3 aswell as two RGSs and two G-proteins (Fig. 1C, lower panel).Approximately half of these peripheral tissues are adipose-related samples, implying a signi¢cant regulatory role forthe genes in GPCR signaling within adipose tissues. Genesthat displayed ubiquitous expression with nominal tissue spec-i¢city included dynamin2, the heavy and light polypeptidechains of clathrin, and L-arrestin 1 and 2. L-arrestin 2, how-ever, was more highly expressed in monocytes, eosinophils,and neutrophils in comparison to the other tissues (data notshown). Such patterns in tissue distribution imply broad em-ployment of receptor internalization mediated by these genes.
3.3. Expression and enrichment of GPCRsFurther examination of the microarray data revealed that
nearly all tissues pro¢led expressed between 40 and 120 recep-tors (Fig. 2A). The pancreas, followed by CNS tissues, hadthe greatest number of expressed receptors, suggesting a highdegree of cellular regulation by GPCR signal transduction.Approximately 210 of the detected receptors were expressedin CNS tissues, alluding to the complexity of regulating neu-ronal networks. Interestingly, a number of peripheral tissues
FEBS 27484 13-8-03 Cyaan Magenta Geel Zwart
Y. Hakak et al./FEBS Letters 550 (2003) 11^1712

Fig. 1. Hierarchical cluster analysis of gene expression in human tissues. Expression data for genes detected in at least one tissue were used forhierarchical cluster analysis. Expression levels were normalized for each gene across all tissue samples (red, above median expression; black,median expression; green, below median expression). Genes were clustered based on correlations in tissue distributions. Tissues were clusteredbased on correlations in gene expression pro¢les. A: Dendrogram of tissue relations is generated using the expression pro¢les of 373 GPCRs.Expression data from hierarchical cluster analysis of (B) a select set of GPCRs with respective UniGene numbers and (C) select clusters of sig-naling and regulatory molecules are shown.
FEBS 27484 13-8-03 Cyaan Magenta Geel Zwart
Y. Hakak et al./FEBS Letters 550 (2003) 11^17 13

Fig. 2. Expression and enrichment of GPCRs. A: Identi¢cation of the number of GPCRs expressed in tissue samples. GPCRs that were detected in each tissue were classi¢ed as known (ligandidenti¢ed), orphan (no ligand identi¢ed), or olfactory-like. B: Identi¢cation of the number of GPCRs enriched in individual tissues. GPCRs detected within each tissue that had greater than ¢ve-fold above-median expression levels across all tissues were classi¢ed as described above. The total number of non-overlapping receptors found within related tissue types is represented for eachtissue group as a total.
FEBS27484
13-8-03Cyaan
Magenta
Geel
Zwart
Y.Hakak
etal./F
EBSLetters
550(2003)
11^1714
likewise expressed a large subset of GPCRs. In contrast, cul-tured primary and stable cell lines trended towards having theleast number of expressed receptors. Classi¢cation of all ex-pressed GPCRs revealed that 281 of these receptors wereknown or orphan and 92 were olfactory-like. The majorityof the samples pro¢led displayed comparable percentages ofknown and orphan receptors. Olfactory-like receptors gener-ally composed 0^20% of the expressed GPCRs.GPCRs whose expression is enriched in particular tissues
are postulated to play a speci¢c regulatory role related tothose tissues. Analysis of the relative expression levels ofGPCRs revealed that 66.5% of the detected receptors wereenriched ¢ve-fold or greater above median levels across all
tissues pro¢led (Fig. 2B). These enriched receptors werelargely comprised of known as well as orphan GPCRs. Fewof the enriched receptors were olfactory-like, most likely dueto their generally low gene expression levels. Tissues havingthe greatest occurrence of enriched receptors included variousbrain regions and immune cell types. The large number ofenriched receptors suggests the necessity for complex and se-lective regulatory mechanisms in these tissues.
3.4. Comparative analysis of human and mouse GPCRexpression
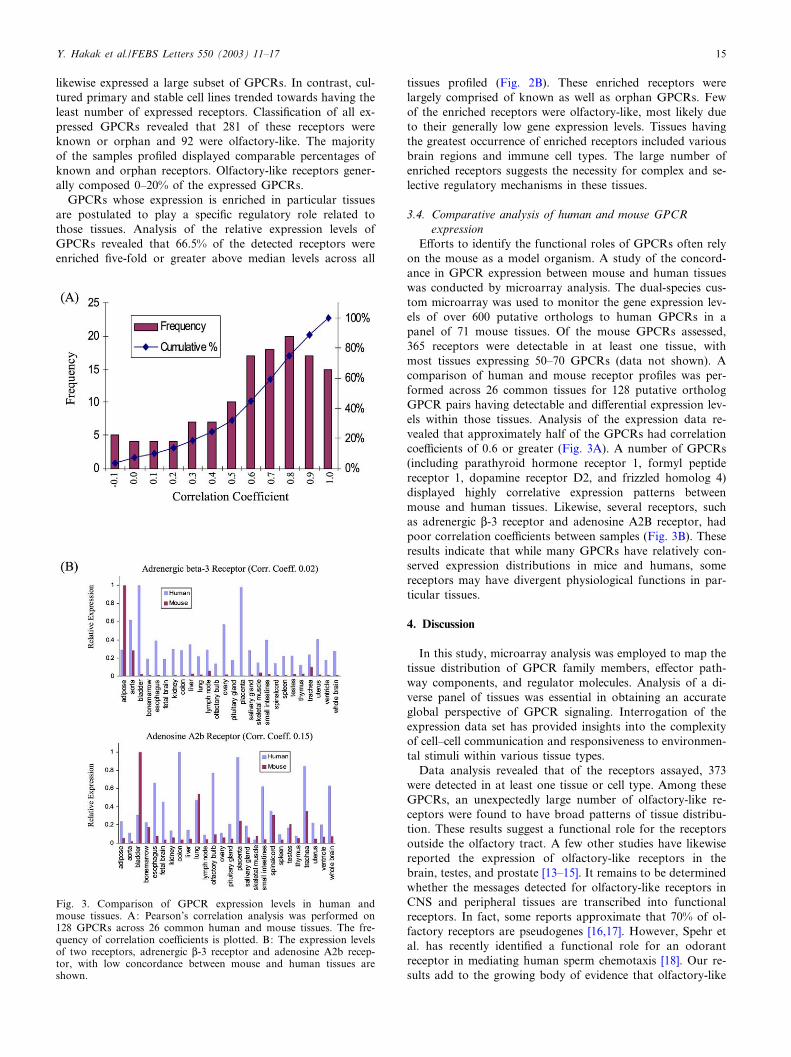
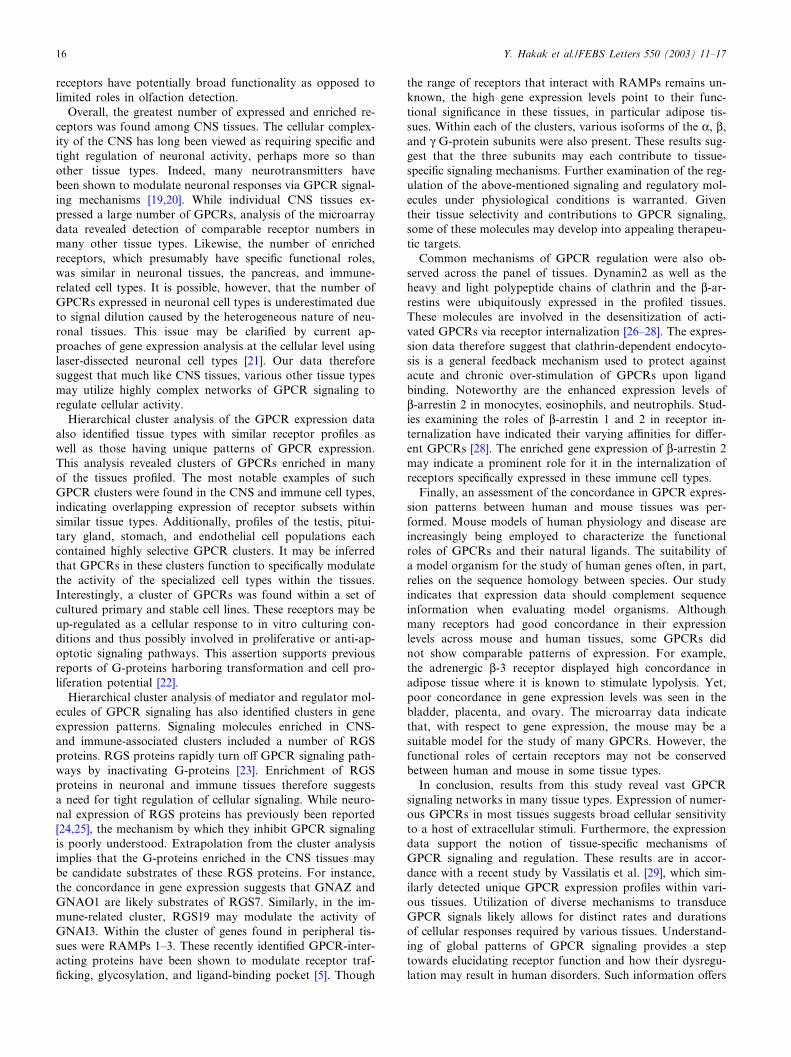
E¡orts to identify the functional roles of GPCRs often relyon the mouse as a model organism. A study of the concord-ance in GPCR expression between mouse and human tissueswas conducted by microarray analysis. The dual-species cus-tom microarray was used to monitor the gene expression lev-els of over 600 putative orthologs to human GPCRs in apanel of 71 mouse tissues. Of the mouse GPCRs assessed,365 receptors were detectable in at least one tissue, withmost tissues expressing 50^70 GPCRs (data not shown). Acomparison of human and mouse receptor pro¢les was per-formed across 26 common tissues for 128 putative orthologGPCR pairs having detectable and di¡erential expression lev-els within those tissues. Analysis of the expression data re-vealed that approximately half of the GPCRs had correlationcoe⁄cients of 0.6 or greater (Fig. 3A). A number of GPCRs(including parathyroid hormone receptor 1, formyl peptidereceptor 1, dopamine receptor D2, and frizzled homolog 4)displayed highly correlative expression patterns betweenmouse and human tissues. Likewise, several receptors, suchas adrenergic L-3 receptor and adenosine A2B receptor, hadpoor correlation coe⁄cients between samples (Fig. 3B). Theseresults indicate that while many GPCRs have relatively con-served expression distributions in mice and humans, somereceptors may have divergent physiological functions in par-ticular tissues.
4. Discussion
In this study, microarray analysis was employed to map thetissue distribution of GPCR family members, e¡ector path-way components, and regulator molecules. Analysis of a di-verse panel of tissues was essential in obtaining an accurateglobal perspective of GPCR signaling. Interrogation of theexpression data set has provided insights into the complexityof cell^cell communication and responsiveness to environmen-tal stimuli within various tissue types.Data analysis revealed that of the receptors assayed, 373
were detected in at least one tissue or cell type. Among theseGPCRs, an unexpectedly large number of olfactory-like re-ceptors were found to have broad patterns of tissue distribu-tion. These results suggest a functional role for the receptorsoutside the olfactory tract. A few other studies have likewisereported the expression of olfactory-like receptors in thebrain, testes, and prostate [13^15]. It remains to be determinedwhether the messages detected for olfactory-like receptors inCNS and peripheral tissues are transcribed into functionalreceptors. In fact, some reports approximate that 70% of ol-factory receptors are pseudogenes [16,17]. However, Spehr etal. has recently identi¢ed a functional role for an odorantreceptor in mediating human sperm chemotaxis [18]. Our re-sults add to the growing body of evidence that olfactory-like
Fig. 3. Comparison of GPCR expression levels in human andmouse tissues. A: Pearson’s correlation analysis was performed on128 GPCRs across 26 common human and mouse tissues. The fre-quency of correlation coe⁄cients is plotted. B: The expression levelsof two receptors, adrenergic L-3 receptor and adenosine A2b recep-tor, with low concordance between mouse and human tissues areshown.
FEBS 27484 13-8-03 Cyaan Magenta Geel Zwart
Y. Hakak et al./FEBS Letters 550 (2003) 11^17 15
receptors have potentially broad functionality as opposed tolimited roles in olfaction detection.Overall, the greatest number of expressed and enriched re-
ceptors was found among CNS tissues. The cellular complex-ity of the CNS has long been viewed as requiring speci¢c andtight regulation of neuronal activity, perhaps more so thanother tissue types. Indeed, many neurotransmitters havebeen shown to modulate neuronal responses via GPCR signal-ing mechanisms [19,20]. While individual CNS tissues ex-pressed a large number of GPCRs, analysis of the microarraydata revealed detection of comparable receptor numbers inmany other tissue types. Likewise, the number of enrichedreceptors, which presumably have speci¢c functional roles,was similar in neuronal tissues, the pancreas, and immune-related cell types. It is possible, however, that the number ofGPCRs expressed in neuronal cell types is underestimated dueto signal dilution caused by the heterogeneous nature of neu-ronal tissues. This issue may be clari¢ed by current ap-proaches of gene expression analysis at the cellular level usinglaser-dissected neuronal cell types [21]. Our data thereforesuggest that much like CNS tissues, various other tissue typesmay utilize highly complex networks of GPCR signaling toregulate cellular activity.Hierarchical cluster analysis of the GPCR expression data
also identi¢ed tissue types with similar receptor pro¢les aswell as those having unique patterns of GPCR expression.This analysis revealed clusters of GPCRs enriched in manyof the tissues pro¢led. The most notable examples of suchGPCR clusters were found in the CNS and immune cell types,indicating overlapping expression of receptor subsets withinsimilar tissue types. Additionally, pro¢les of the testis, pitui-tary gland, stomach, and endothelial cell populations eachcontained highly selective GPCR clusters. It may be inferredthat GPCRs in these clusters function to speci¢cally modulatethe activity of the specialized cell types within the tissues.Interestingly, a cluster of GPCRs was found within a set ofcultured primary and stable cell lines. These receptors may beup-regulated as a cellular response to in vitro culturing con-ditions and thus possibly involved in proliferative or anti-ap-optotic signaling pathways. This assertion supports previousreports of G-proteins harboring transformation and cell pro-liferation potential [22].Hierarchical cluster analysis of mediator and regulator mol-
ecules of GPCR signaling has also identi¢ed clusters in geneexpression patterns. Signaling molecules enriched in CNS-and immune-associated clusters included a number of RGSproteins. RGS proteins rapidly turn o¡ GPCR signaling path-ways by inactivating G-proteins [23]. Enrichment of RGSproteins in neuronal and immune tissues therefore suggestsa need for tight regulation of cellular signaling. While neuro-nal expression of RGS proteins has previously been reported[24,25], the mechanism by which they inhibit GPCR signalingis poorly understood. Extrapolation from the cluster analysisimplies that the G-proteins enriched in the CNS tissues maybe candidate substrates of these RGS proteins. For instance,the concordance in gene expression suggests that GNAZ andGNAO1 are likely substrates of RGS7. Similarly, in the im-mune-related cluster, RGS19 may modulate the activity ofGNAI3. Within the cluster of genes found in peripheral tis-sues were RAMPs 1^3. These recently identi¢ed GPCR-inter-acting proteins have been shown to modulate receptor traf-¢cking, glycosylation, and ligand-binding pocket [5]. Though
the range of receptors that interact with RAMPs remains un-known, the high gene expression levels point to their func-tional signi¢cance in these tissues, in particular adipose tis-sues. Within each of the clusters, various isoforms of the K, L,and Q G-protein subunits were also present. These results sug-gest that the three subunits may each contribute to tissue-speci¢c signaling mechanisms. Further examination of the reg-ulation of the above-mentioned signaling and regulatory mol-ecules under physiological conditions is warranted. Giventheir tissue selectivity and contributions to GPCR signaling,some of these molecules may develop into appealing therapeu-tic targets.Common mechanisms of GPCR regulation were also ob-
served across the panel of tissues. Dynamin2 as well as theheavy and light polypeptide chains of clathrin and the L-ar-restins were ubiquitously expressed in the pro¢led tissues.These molecules are involved in the desensitization of acti-vated GPCRs via receptor internalization [26^28]. The expres-sion data therefore suggest that clathrin-dependent endocyto-sis is a general feedback mechanism used to protect againstacute and chronic over-stimulation of GPCRs upon ligandbinding. Noteworthy are the enhanced expression levels ofL-arrestin 2 in monocytes, eosinophils, and neutrophils. Stud-ies examining the roles of L-arrestin 1 and 2 in receptor in-ternalization have indicated their varying a⁄nities for di¡er-ent GPCRs [28]. The enriched gene expression of L-arrestin 2may indicate a prominent role for it in the internalization ofreceptors speci¢cally expressed in these immune cell types.Finally, an assessment of the concordance in GPCR expres-
sion patterns between human and mouse tissues was per-formed. Mouse models of human physiology and disease areincreasingly being employed to characterize the functionalroles of GPCRs and their natural ligands. The suitability ofa model organism for the study of human genes often, in part,relies on the sequence homology between species. Our studyindicates that expression data should complement sequenceinformation when evaluating model organisms. Althoughmany receptors had good concordance in their expressionlevels across mouse and human tissues, some GPCRs didnot show comparable patterns of expression. For example,the adrenergic L-3 receptor displayed high concordance inadipose tissue where it is known to stimulate lypolysis. Yet,poor concordance in gene expression levels was seen in thebladder, placenta, and ovary. The microarray data indicatethat, with respect to gene expression, the mouse may be asuitable model for the study of many GPCRs. However, thefunctional roles of certain receptors may not be conservedbetween human and mouse in some tissue types.In conclusion, results from this study reveal vast GPCR
signaling networks in many tissue types. Expression of numer-ous GPCRs in most tissues suggests broad cellular sensitivityto a host of extracellular stimuli. Furthermore, the expressiondata support the notion of tissue-speci¢c mechanisms ofGPCR signaling and regulation. These results are in accor-dance with a recent study by Vassilatis et al. [29], which sim-ilarly detected unique GPCR expression pro¢les within vari-ous tissues. Utilization of diverse mechanisms to transduceGPCR signals likely allows for distinct rates and durationsof cellular responses required by various tissues. Understand-ing of global patterns of GPCR signaling provides a steptowards elucidating receptor function and how their dysregu-lation may result in human disorders. Such information o¡ers
FEBS 27484 13-8-03 Cyaan Magenta Geel Zwart
Y. Hakak et al./FEBS Letters 550 (2003) 11^1716

important insights into the identi¢cation of novel GPCRs astherapeutic targets.
Acknowledgements: We thank J. Leonard, D. Bagnol, and L. Cronerfor scienti¢c contributions and J. Richman for critical reading of themanuscript. Brain tissues were provided by the Harvard Brain TissueResource Center, which is supported in part by PHS Grant numberMH/NS 31862.
References
[1] Hamm, H.E. (1998) J. Biol. Chem. 273, 669^672.[2] Neves, S.R., Ram, P.T. and Iyengar, R. (2002) Science 296,
1636^1639.[3] Marinissen, M.J. and Gutkind, J.S. (2001) Trends Pharmacol.
Sci. 22, 368^376.[4] De Vries, L., Zheng, B., Fischer, T., Elenko, E. and Farquhar,
M.G. (2000) Annu. Rev. Pharmacol. Toxicol. 40, 235^271.[5] Sexton, P.M., Albiston, A., Mor¢s, M. and Tilakaratne, N.
(2001) Cell Signal. 13, 73^83.[6] Jaber, M., Robinson, S.W., Missale, C. and Caron, M.G. (1996)
Neuropharmacology 35, 1503^1519.[7] Marchese, A., George, S.R., Kolakowski Jr., L.F., Lynch, K.R.
and O’Dowd, B.F. (1999) Trends Pharmacol. Sci. 20, 370^375.[8] Wodicka, L., Dong, H., Mittmann, M., Ho, M.H. and Lockhart,
D.J. (1997) Nat. Biotechnol. 15, 1359^1367.[9] Lockhart, D.J. et al. (1996) Nat. Biotechnol. 14, 1675^1680.[10] Hakak, Y., Walker, J.R., Li, C., Wong, W.H., Davis, K.L.,
Buxbaum, J.D., Haroutunian, V. and Fienberg, A.A. (2001)Proc. Natl. Acad. Sci. USA 98, 4746^4751.
[11] Eisen, M.B., Spellman, P.T., Brown, P.O. and Botstein, D. (1998)Proc. Natl. Acad. Sci. USA 95, 14863^14868.
[12] Sokal, R.R. and Michener, C.D. (1958) Univ. Kansas Sci. Bull.38, 1409^1438.
[13] Yuan, T.T., Toy, P., McClary, J.A., Lin, R.J., Miyamoto, N.G.and Kretschmer, P.J. (2001) Gene 278, 41^51.
[14] Vanderhaeghen, P., Schurmans, S., Vassart, G. and Parmentier,M. (1993) J. Cell Biol. 123, 1441^1452.
[15] Xu, L.L. et al. (2000) Cancer Res. 60, 6568^6572.[16] Rouquier, S., Taviaux, S., Trask, B.J., Brand-Arpon, V., van den
Engh, G., Demaille, J. and Giorgi, D. (1998) Nat. Genet. 18,243^250.
[17] Zozulya, S., Echeverri, F. and Nguyen, T. (2001) Genome Biol.2, research0018.1^research0018.2.
[18] Spehr, M., Gisselmann, G., Poplawski, A., Ri¡ell, J.A., Wetzel,C.H., Zimmer, R.K. and Hatt, H. (2003) Science 299, 2054^2058.
[19] Watling, K.J. (2001) Sigma-RBI, Natick.[20] Civelli, O., Nothacker, H.P., Saito, Y., Wang, Z., Lin, S.H. and
Reinscheid, R.K. (2001) Trends Neurosci. 24, 230^237.[21] Fend, F. and Ra¡eld, M. (2000) J. Clin. Pathol. 53, 666^672.[22] Dhanasekaran, N., Tsim, S.T., Dermott, J.M. and Onesime, D.
(1998) Oncogene 17, 1383^1394.[23] Neubig, R.R. and Siderovski, D.P. (2002) Nat. Rev. Drug Dis-
cov. 1, 187^197.[24] Gold, S.J., Ni, Y.G., Dohlman, H.G. and Nestler, E.J. (1997)
J. Neurosci. 17, 8024^8037.[25] Bruch, R.C. and Medler, K.F. (1996) NeuroReport 7, 2941^2944.[26] Ferguson, S.S. (2001) Pharmacol. Rev. 53, 1^24.[27] Tsao, P. and von Zastrow, M. (2000) Curr. Opin. Neurobiol. 10,
365^369.[28] Claing, A., Laporte, S.A., Caron, M.G. and Lefkowitz, R.J.
(2002) Prog. Neurobiol. 66, 61^79.[29] Vassilatis, D.K. et al. (2003) Proc. Natl. Acad. Sci. USA 100,
4903^4908.
FEBS 27484 13-8-03 Cyaan Magenta Geel Zwart
Y. Hakak et al./FEBS Letters 550 (2003) 11^17 17