gfoa june 2012 presentation
TRANSCRIPT
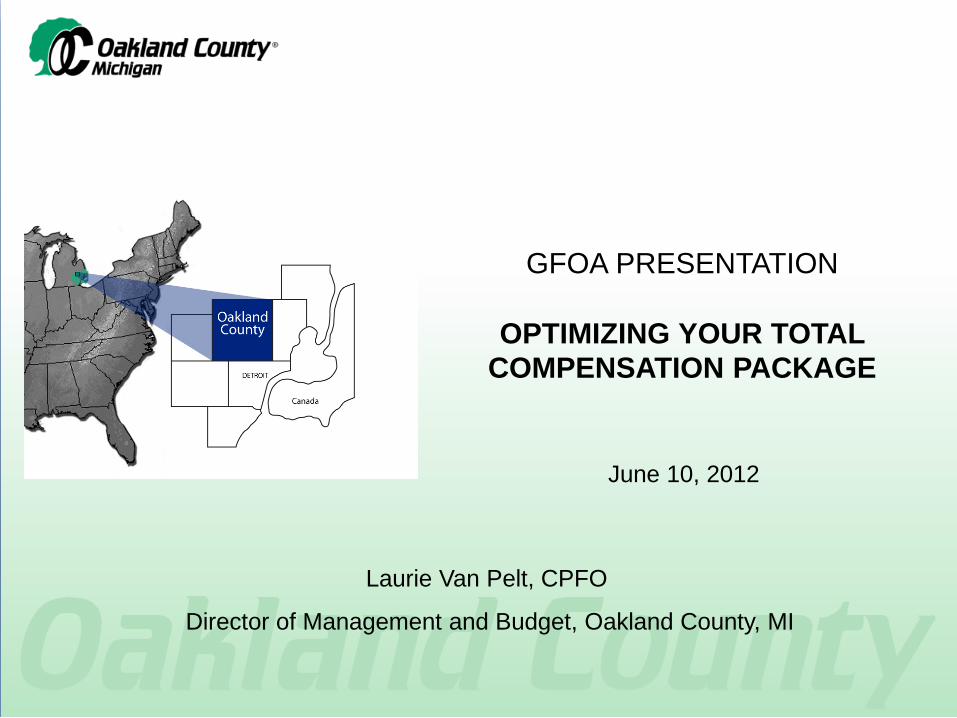
GFOA PRESENTATION
OPTIMIZING YOUR TOTAL COMPENSATION PACKAGE
Laurie Van Pelt, CPFO
Director of Management and Budget, Oakland County, MI
June 10, 2012
Presentation Outline
• Overview of Oakland County • What level of compensation is “optimal”? • What is TOTAL compensation? • How can measuring total compensation
benefit or challenge an organization? • How can the concept of total
compensation be used to retain talent and attract future employees?
Profile of Oakland County • Elected County Executive - similar to a strong mayor
organization • Six county-wide elected officials • 25 elected commissioners • Elected judiciary • 80 departments and agencies • Total budget = $759.3 million • 4,304 employee positions (3,562 are full-time) • AAA bond rating • 910 square miles • 1.2 million residents
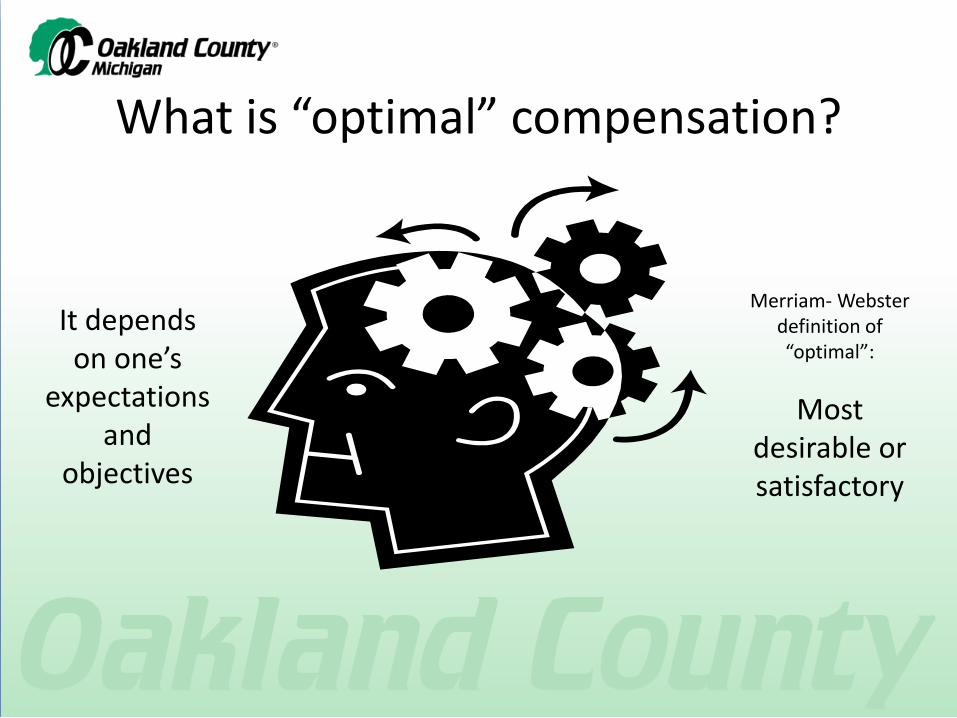
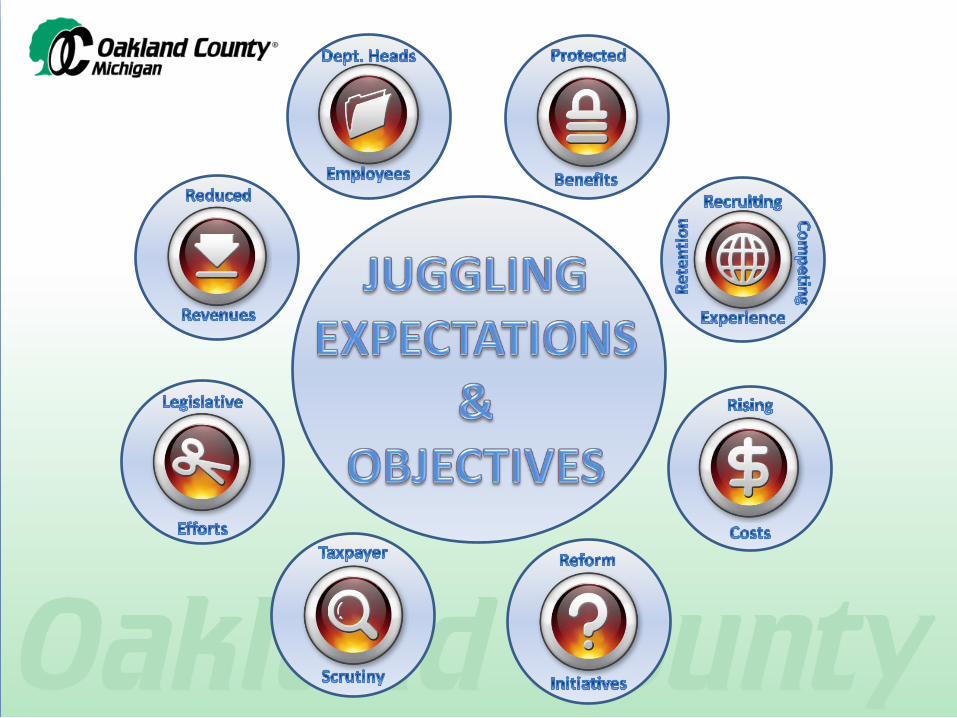
What is “optimal” compensation?
It depends on one’s
expectations and
objectives
Merriam- Webster definition of “optimal”:
Most desirable or satisfactory
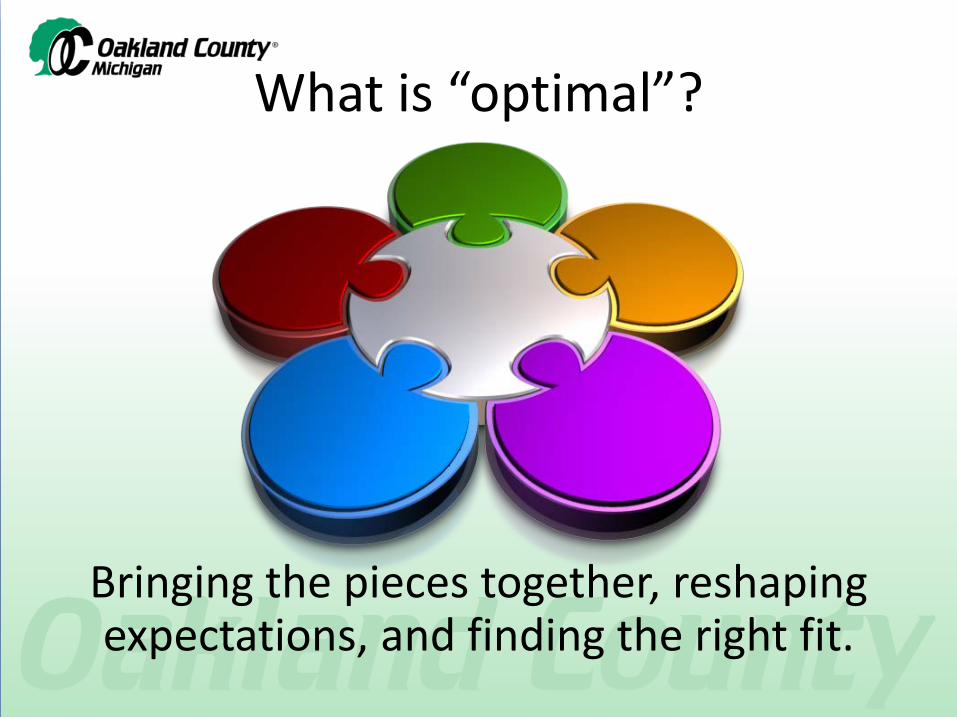
What is “optimal”?
Bringing the pieces together, reshaping expectations, and finding the right fit.
Shaping Expectations
• Providing information in terms of TOTAL compensation can help establish realistic expectations.
• How do you measure TOTAL compensation? – At a minimum, all measurable costs should be
included: • Annual salary/hourly wage rate • Fringe benefits
– In addition to active employment benefits, are you also including benefits that have been earned but will be paid in the future such as pension costs and other post-employment benefits (OPEB)?
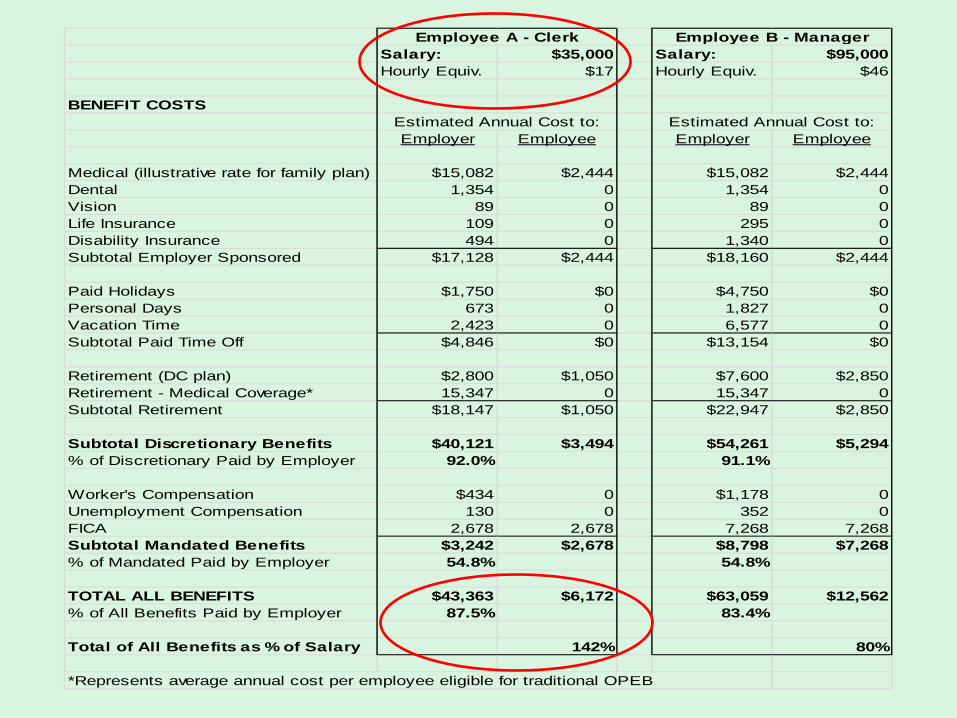
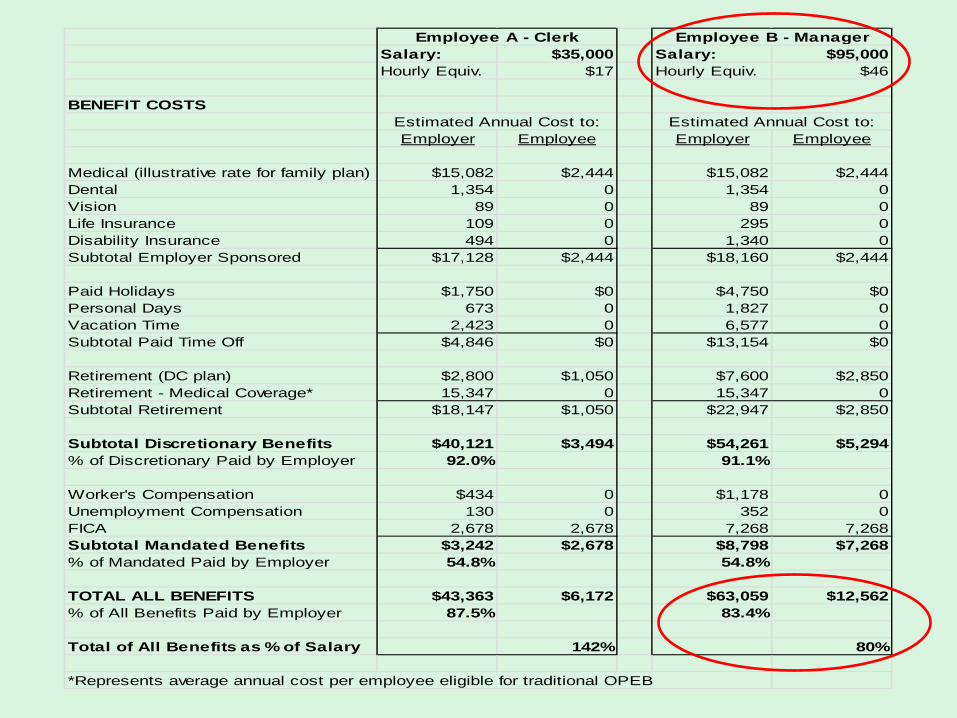
Shaping Expectations An Employee’s Perspective
• As part of the annual employee benefit selection process, Oakland County informs each employee of the estimated annual cost for each benefit.
• Each benefit is categorized as either discretionary or mandated.
• Employees are informed regarding how much the County pays annually for each benefit on behalf of the individual employee and how much the employee contributes.
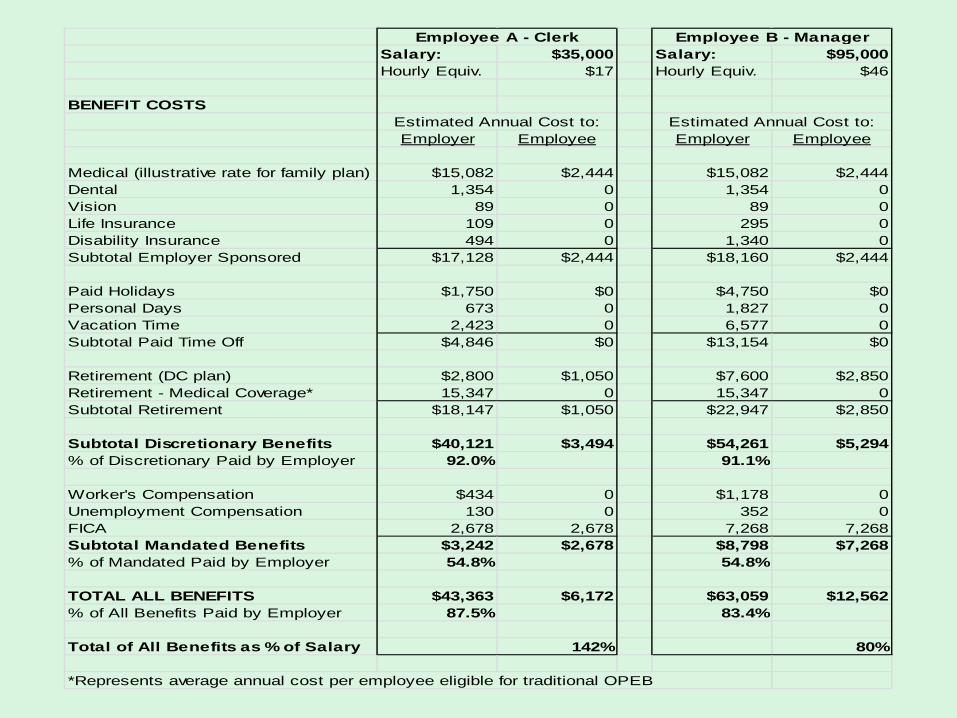
Salary: $35,000 Salary: $95,000Hourly Equiv. $17 Hourly Equiv. $46
BENEFIT COSTS
Employer Employee Employer Employee
Medical (illustrative rate for family plan) $15,082 $2,444 $15,082 $2,444Dental 1,354 0 1,354 0Vision 89 0 89 0Life Insurance 109 0 295 0Disability Insurance 494 0 1,340 0Subtotal Employer Sponsored $17,128 $2,444 $18,160 $2,444
Paid Holidays $1,750 $0 $4,750 $0Personal Days 673 0 1,827 0Vacation Time 2,423 0 6,577 0Subtotal Paid Time Off $4,846 $0 $13,154 $0
Retirement (DC plan) $2,800 $1,050 $7,600 $2,850Retirement - Medical Coverage* 15,347 0 15,347 0Subtotal Retirement $18,147 $1,050 $22,947 $2,850
Subtotal Discretionary Benefits $40,121 $3,494 $54,261 $5,294% of Discretionary Paid by Employer 92.0% 91.1%
Worker's Compensation $434 0 $1,178 0Unemployment Compensation 130 0 352 0FICA 2,678 2,678 7,268 7,268Subtotal Mandated Benefits $3,242 $2,678 $8,798 $7,268% of Mandated Paid by Employer 54.8% 54.8%
TOTAL ALL BENEFITS $43,363 $6,172 $63,059 $12,562% of All Benefits Paid by Employer 87.5% 83.4%
Total of All Benefits as % of Salary 142% 80%
*Represents average annual cost per employee eligible for traditional OPEB
Employee A - Clerk Employee B - Manager
Estimated Annual Cost to: Estimated Annual Cost to:
Shaping Expectations An Employee’s Perspective
• The County’s share of employer-sponsored benefits for each employee is also included on the biweekly paycheck stub in addition to routine payroll information. – Includes current period and year-to-date amounts for:
• Medical • Dental • Vision • Life insurance • Retirement
Shaping Expectations An Employer’s Perspective
• Unlike private employers, public employers have very little ability to “grow” revenues, such as through new product lines or by increasing market share.
• Rather, there is a limit on how much taxpayers are willing to be taxed for public services which results in revenue constraints for public employers.
Shaping Expectations An Employer’s Perspective
• Thus, costs need to be constrained as well to stay in balance.
• Most governments rely on employees to provide public services.
• Therefore, employee compensation tends to be the largest expenditure category, requiring significant attention and scrutiny, particularly when budgets are shrinking.
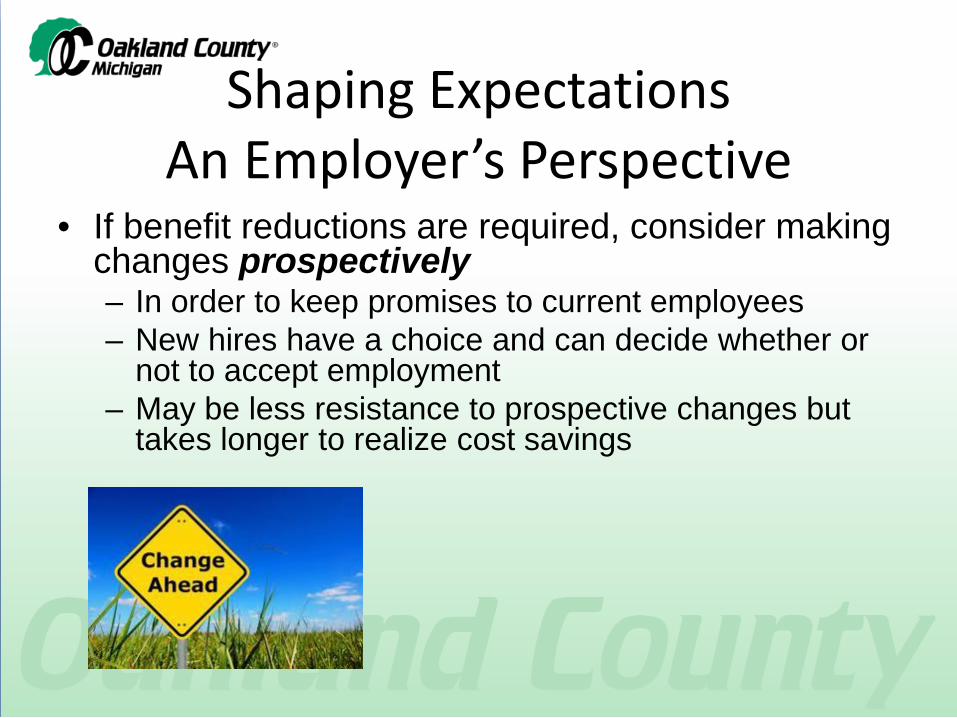
• If benefit reductions are required, consider making changes prospectively – In order to keep promises to current employees – New hires have a choice and can decide whether or
not to accept employment – May be less resistance to prospective changes but
takes longer to realize cost savings
Shaping Expectations An Employer’s Perspective
Shaping Expectations An Employer’s Perspective
• Oakland County has continually made incremental adjustments to employee benefits over the past several decades in an effort to control overall compensation costs.
• The cumulative effort over time has yielded big savings for the County.
• See the Government Finance Review article in the April 2012 edition, “Incremental Changes Can Yield Big Savings Over Time,” for further discussion regarding Oakland County’s approach for adjusting benefits.
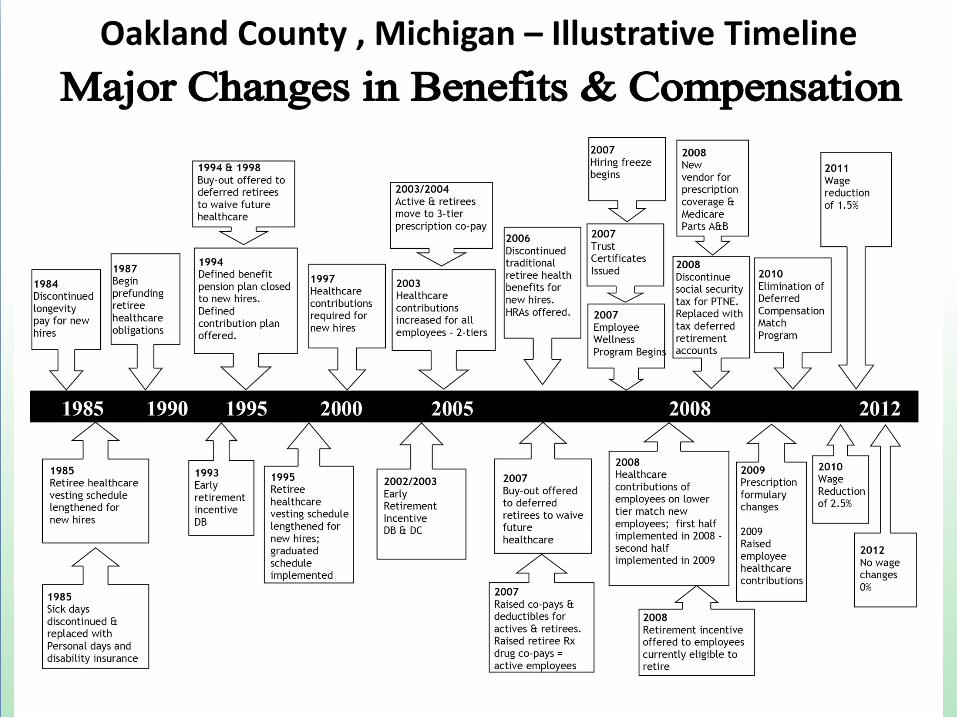
Oakland County , Michigan – Illustrative Timeline

Shaping Expectations An Employer’s Perspective
Following are examples which illustrate Oakland County’s use of the “total compensation” concept to frame budgetary discussions.
Shaping Expectations An Employer’s Perspective
• In preparation for the 2008 budget, fringe benefit costs were projected to rise at that time by $8.1 million, primarily in the area of employee health care.
• The County has a “rolling” multi-year budget process. – The FY 2008 budget was initially developed in 2006, and a
3% general salary increase was being considered at the time. Expectations had to be adjusted in 2007 prior to adoption of the FY 2008 General Appropriations Act.
– The $8.1 million increase in the cost of fringe benefits was equivalent to a 4% general salary increase.
– No revenue growth was available to absorb the increase, primarily as a result of the falling property values.
Shaping Expectations An Employer’s Perspective
• The general salary increase in FY 2008 was reduced from an expectation of 3% down to the recommendation of 1%.
• To reshape expectations, the discussion was centered on the overall 5% increase in total compensation (1% increase in salary + the increase in cost of benefits equivalent to 4% of salary).
• Information was shared with employees through meetings, web casts, and FAQ’s available on the intranet, which resulted in very minimal objection.
Shaping Expectations An Employer’s Perspective
• Efforts were also directed toward reducing or at least minimizing increases in health care costs. – Wellness program initiated – Adjustments to employee contributions, co-pays, and
deductibles – New vendor selected for prescription coverage – Changes made to the prescription formulary
• There was also a reduction in number of positions. • In 2011, employee health care costs were slightly
less than in 2007 when costs peaked.
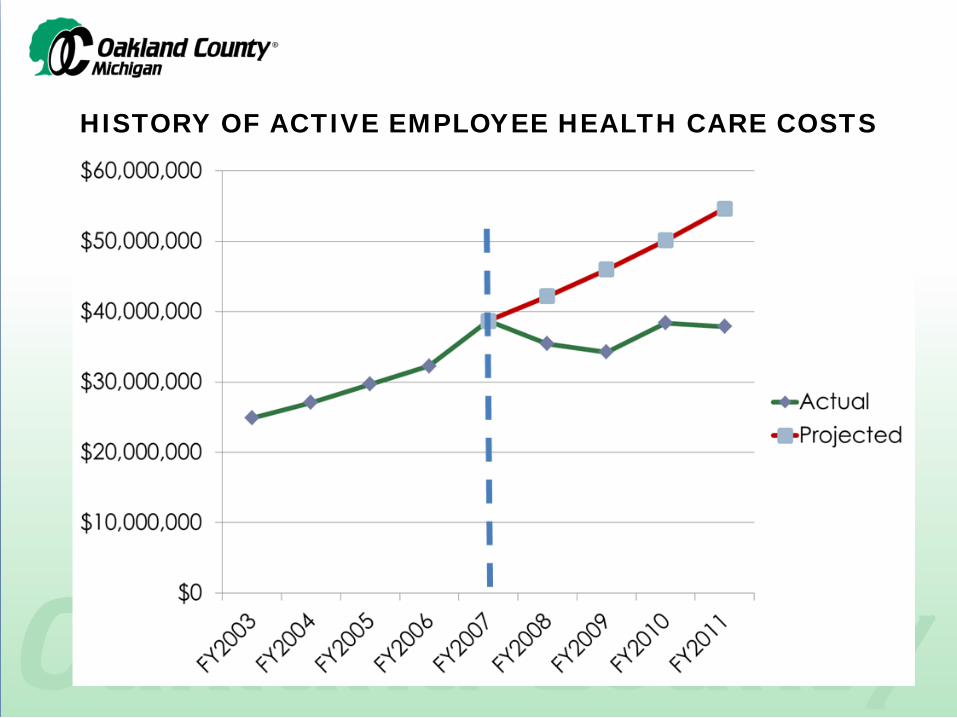
HISTORY OF ACTIVE EMPLOYEE HEALTH CARE COSTS
Shaping Expectations An Employer’s Perspective
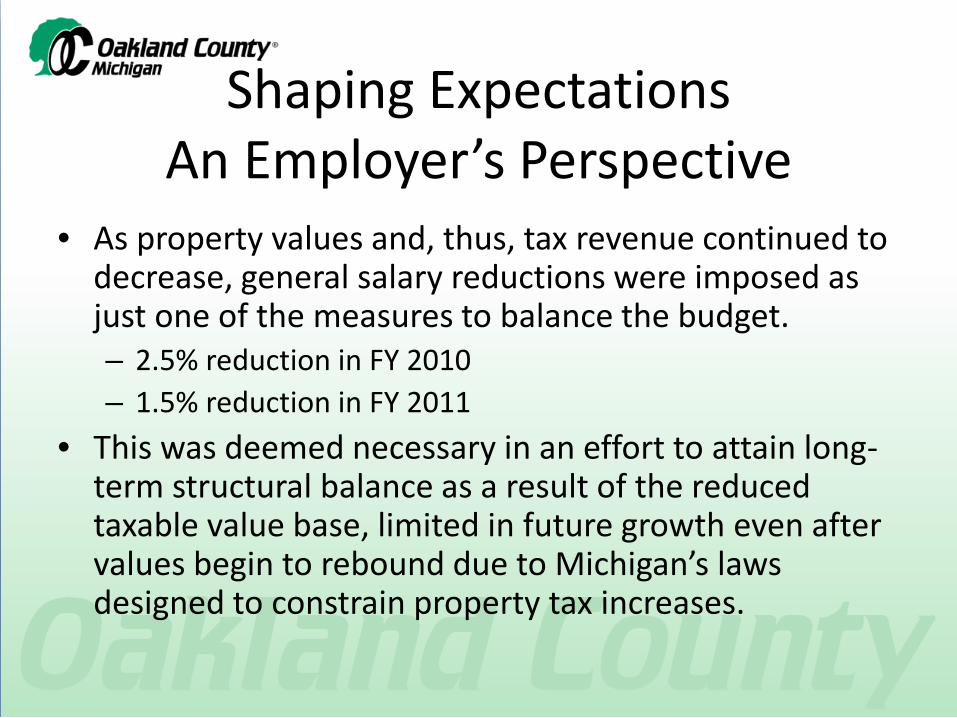
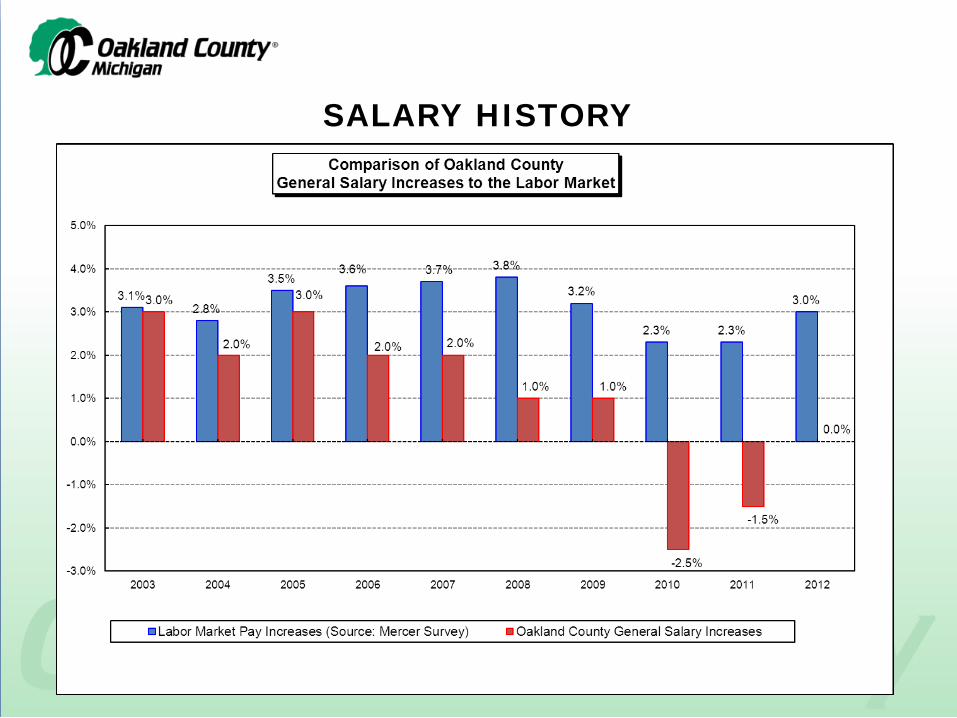
• As property values and, thus, tax revenue continued to decrease, general salary reductions were imposed as just one of the measures to balance the budget. – 2.5% reduction in FY 2010 – 1.5% reduction in FY 2011
• This was deemed necessary in an effort to attain long-term structural balance as a result of the reduced taxable value base, limited in future growth even after values begin to rebound due to Michigan’s laws designed to constrain property tax increases.
SALARY HISTORY
Shaping Expectations An Employer’s Perspective
• To furlough or not to furlough? • There was much debate and consideration
given to unpaid furlough days in lieu of salary reductions.
• Ultimately, based on an analysis which considered cost and other factors, the County decided against the use of furlough days.
Shaping Expectations An Employer’s Perspective
• To avoid additional overtime costs, essential employees in 24/7 programs (such as the jail) would have to be excluded from imposed furlough days.
• The other employees in non-excluded programs would have to make up the difference to attain the required amount of cost reduction.
• For affected employees, 10 furlough days would be required annually to achieve savings equivalent to a 2.5% salary reduction.
• The unpaid days would have resulted in approximately 3.8% less pay for affected employees – inequitable since this approach could not be applied to all groups of employees.
Shaping Expectations An Employer’s Perspective
• An additional 6 furlough days would be required to offset the subsequent year’s 1.5% salary reduction for a total of 16 furlough days.
• Although furlough days are unpaid, employees would be absent from work an additional 16 days per year in addition to paid days off (holidays, vacation, etc.).
• If employees are earning full-time benefits while working fewer days on the job, the cost to produce the same unit of service goes up (i.e., the total compensation per productive work hour goes up).
Shaping Expectations An Employer’s Perspective
• Consider that some governments are imposing 52 furlough days per year – 1 day per week out of a 5-day week reduces service or production levels by 20%.
• Essentially, furloughed employees become part-time employees earning full-time benefits.
• In the long-term, use of furlough days is not sustainable nor cost effective.
• Many governments that initially utilized furlough days have eliminated them and implemented pay reductions instead.
Shaping Expectations An Employer’s Perspective
• Oakland County has cut about 300 full-time positions (FTEs) since 2008. – Through reorganizations, many departments have replaced deleted
FTE positions with part-time positions (PTNE).
• The fringe benefit rate for an average FTE employee can range from 47.9% to 73.6% of salary, depending on the individual’s eligibility for certain benefits based on hire date (rate does not include holidays and other paid leave time).
• The fringe rate for mandated benefits for PTNEs is 4.6% (PTNE employees do not participate in Social Security, so there is no FICA tax).
Shaping Expectations An Employer’s Perspective
• Also, vacant budgeted FTE positions are often multi-filled with PTNE employees. PTNEs can work up to 1,000 hours annually. The fringe benefit savings from this practice often allows 3 PTNE employees to fill 1 budgeted FTE position. – 1 FTE is budgeted for 2,080 hours. After adjusting for paid
holidays, vacations, and personal days, the net on-the-job hours are less.
• An FTE employee is actually on the job working approximately 1,800 hours on average depending on the number of vacation days the employee earns each year.
• Alternatively, 3 PTNEs could work 3,000 hours each year in that same FTE position.
Shaping Expectations An Employer’s Perspective
• Some retirees come back to work as PTNE employees which has many benefits for the County and the employee. – Requires no additional training investment if
employee is performing in same field of expertise. – Provides an opportunity for transition for both the
County and the employee. – High productivity and efficiency resulting from
employee’s experience as compared to a learning curve period for a new employee.
– Reduced labor cost from fringe benefit savings.
Benefits of Measuring Total Compensation
• When labor rates reflect TOTAL cost, there are financial benefits: – Enhances cost recovery from grants and contracted
services provided to other organizations (such as assessing and road patrol services.
• Including legacy costs, such as for OPEB, ensures that the funding source is paying for these costs which are earned in the current period but paid in the future.
– Operational decisions are based on a more complete analysis inclusive of total compensation costs (for example, when considering whether to outsource or directly provide a service).
Challenges
• When pay or benefits are revised incrementally and applied to future new hires, while total cost is lowered and result in significant savings, the fringe benefit rates vary.
• The variance in fringe rates becomes more pronounced over time and can result in several “tiers”.
• This can make financial analyses more complex. • As the employee base turns over, it can become
difficult to explain rate differentials to elected officials, program managers, and the general public.
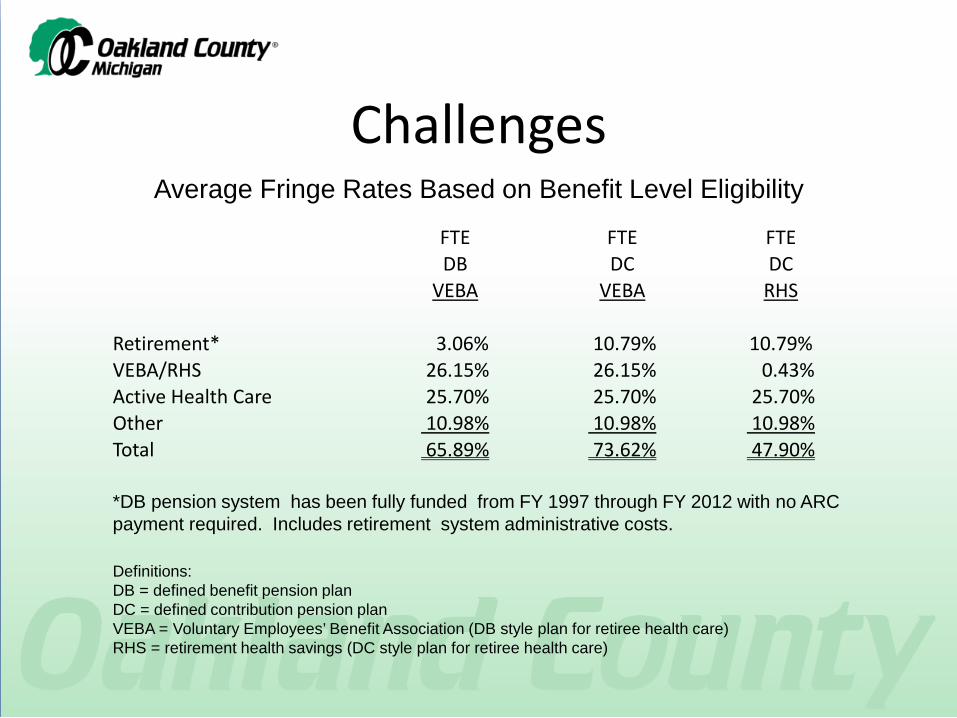
Challenges Average Fringe Rates Based on Benefit Level Eligibility
FTE FTE FTE DB DC DC
VEBA VEBA RHS
Retirement* 3.06% 10.79% 10.79% VEBA/RHS 26.15% 26.15% 0.43% Active Health Care 25.70% 25.70% 25.70% Other 10.98% 10.98% 10.98% Total 65.89% 73.62% 47.90%
*DB pension system has been fully funded from FY 1997 through FY 2012 with no ARC payment required. Includes retirement system administrative costs. Definitions: DB = defined benefit pension plan DC = defined contribution pension plan VEBA = Voluntary Employees’ Benefit Association (DB style plan for retiree health care) RHS = retirement health savings (DC style plan for retiree health care)
Challenges
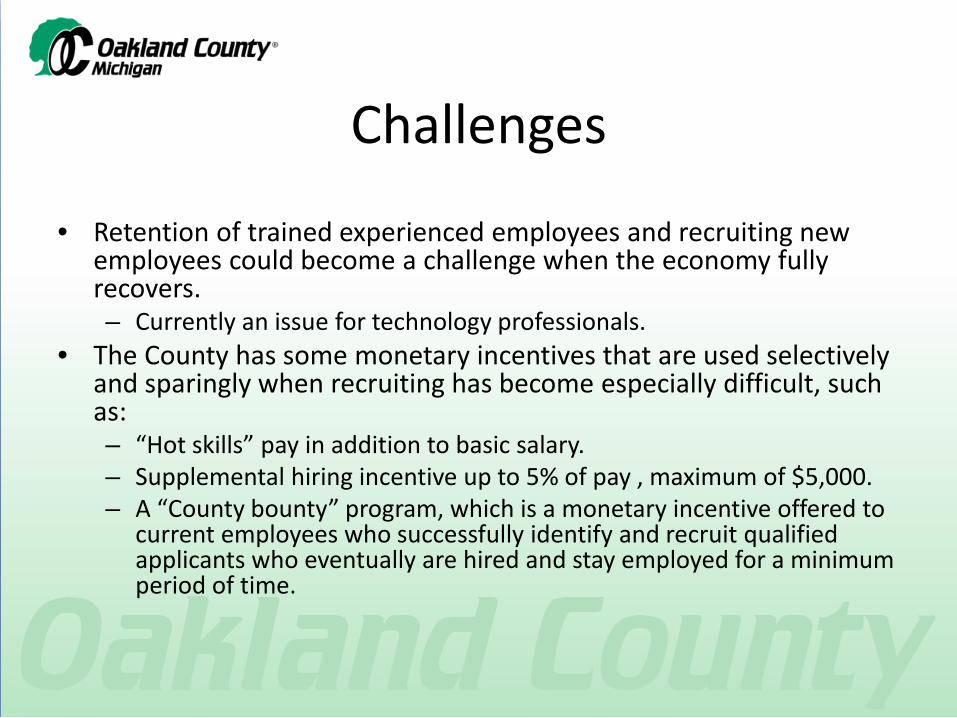
• Retention of trained experienced employees and recruiting new employees could become a challenge when the economy fully recovers. – Currently an issue for technology professionals.
• The County has some monetary incentives that are used selectively and sparingly when recruiting has become especially difficult, such as: – “Hot skills” pay in addition to basic salary. – Supplemental hiring incentive up to 5% of pay , maximum of $5,000. – A “County bounty” program, which is a monetary incentive offered to
current employees who successfully identify and recruit qualified applicants who eventually are hired and stay employed for a minimum period of time.
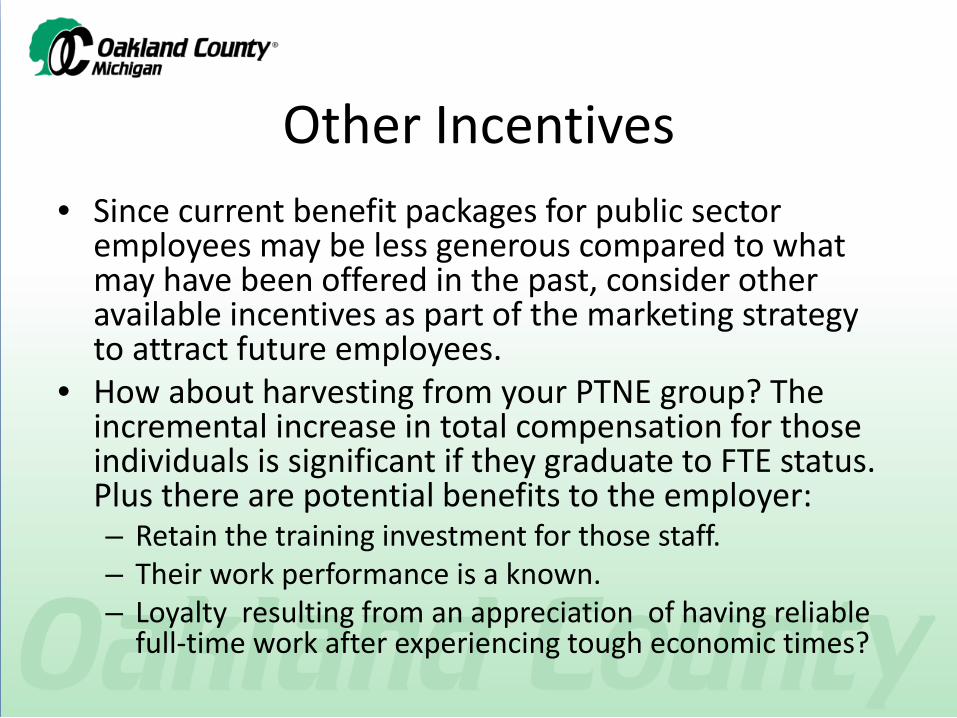
Other Incentives • Since current benefit packages for public sector
employees may be less generous compared to what may have been offered in the past, consider other available incentives as part of the marketing strategy to attract future employees.
• How about harvesting from your PTNE group? The incremental increase in total compensation for those individuals is significant if they graduate to FTE status. Plus there are potential benefits to the employer: – Retain the training investment for those staff. – Their work performance is a known. – Loyalty resulting from an appreciation of having reliable
full-time work after experiencing tough economic times?
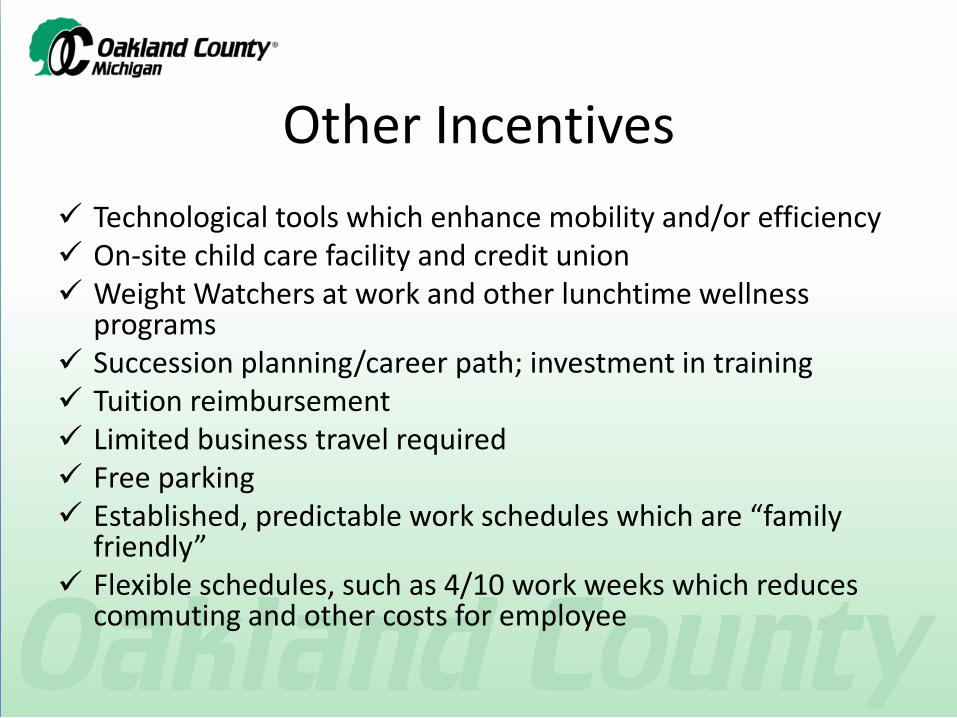
Other Incentives Technological tools which enhance mobility and/or efficiency On-site child care facility and credit union Weight Watchers at work and other lunchtime wellness
programs Succession planning/career path; investment in training Tuition reimbursement Limited business travel required Free parking Established, predictable work schedules which are “family
friendly” Flexible schedules, such as 4/10 work weeks which reduces
commuting and other costs for employee
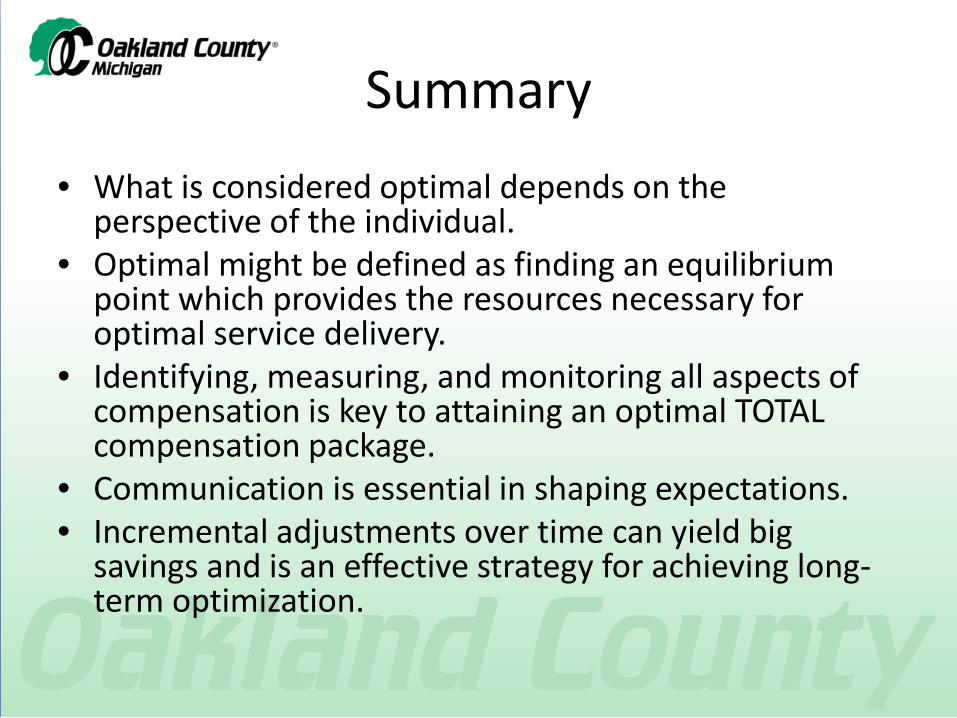
Summary • What is considered optimal depends on the
perspective of the individual. • Optimal might be defined as finding an equilibrium
point which provides the resources necessary for optimal service delivery.
• Identifying, measuring, and monitoring all aspects of compensation is key to attaining an optimal TOTAL compensation package.
• Communication is essential in shaping expectations. • Incremental adjustments over time can yield big
savings and is an effective strategy for achieving long-term optimization.