gfk - how good is your user experience (ux)?
TRANSCRIPT
1 © GfK 2014 | How Good is your User Experience? | 26. June 2014
HOW GOOD IS YOUR
USER EXPERIENCE?
2 © GfK 2014 | How Good is your User Experience? | 26. June 2014
3 © GfK 2014 | How Good is your User Experience? | 26. June 2014
UX
WHAT IS IT?
4 © GfK 2014 | How Good is your User Experience? | 26. June 2014
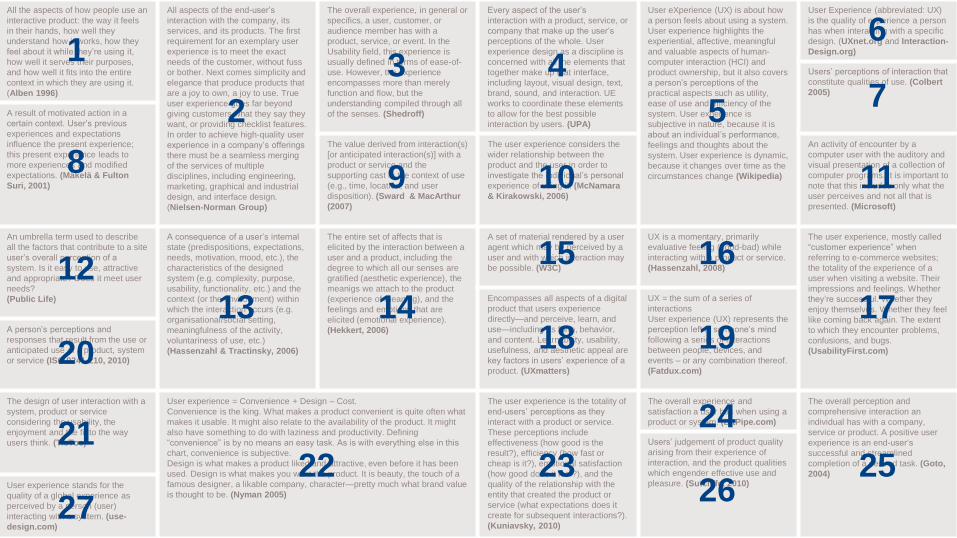
All the aspects of how people use an
interactive product: the way it feels
in their hands, how well they
understand how it works, how they
feel about it while they’re using it,
how well it serves their purposes,
and how well it fits into the entire
context in which they are using it.
(Alben 1996)
All aspects of the end-user’s
interaction with the company, its
services, and its products. The first
requirement for an exemplary user
experience is to meet the exact
needs of the customer, without fuss
or bother. Next comes simplicity and
elegance that produce products that
are a joy to own, a joy to use. True
user experience goes far beyond
giving customers what they say they
want, or providing checklist features.
In order to achieve high-quality user
experience in a company’s offerings
there must be a seamless merging
of the services of multiple
disciplines, including engineering,
marketing, graphical and industrial
design, and interface design.
(Nielsen-Norman Group)
The overall experience, in general or
specifics, a user, customer, or
audience member has with a
product, service, or event. In the
Usability field, this experience is
usually defined in terms of ease-of-
use. However, the experience
encompasses more than merely
function and flow, but the
understanding compiled through all
of the senses. (Shedroff)
Every aspect of the user’s
interaction with a product, service, or
company that make up the user’s
perceptions of the whole. User
experience design as a discipline is
concerned with all the elements that
together make up that interface,
including layout, visual design, text,
brand, sound, and interaction. UE
works to coordinate these elements
to allow for the best possible
interaction by users. (UPA)
User eXperience (UX) is about how
a person feels about using a system.
User experience highlights the
experiential, affective, meaningful
and valuable aspects of human-
computer interaction (HCI) and
product ownership, but it also covers
a person’s perceptions of the
practical aspects such as utility,
ease of use and efficiency of the
system. User experience is
subjective in nature, because it is
about an individual’s performance,
feelings and thoughts about the
system. User experience is dynamic,
because it changes over time as the
circumstances change (Wikipedia)
User Experience (abbreviated: UX)
is the quality of experience a person
has when interacting with a specific
design. (UXnet.org and Interaction-
Design.org)
Users’ perceptions of interaction that
constitute qualities of use. (Colbert
2005)
A result of motivated action in a
certain context. User’s previous
experiences and expectations
influence the present experience;
this present experience leads to
more experiences and modified
expectations. (Mäkelä & Fulton
Suri, 2001)
The value derived from interaction(s)
[or anticipated interaction(s)] with a
product or service and the
supporting cast in the context of use
(e.g., time, location, and user
disposition). (Sward & MacArthur
(2007)
The user experience considers the
wider relationship between the
product and the user in order to
investigate the individual’s personal
experience of using it. (McNamara
& Kirakowski, 2006)
An activity of encounter by a
computer user with the auditory and
visual presentation of a collection of
computer programs. It is important to
note that this includes only what the
user perceives and not all that is
presented. (Microsoft)
An umbrella term used to describe
all the factors that contribute to a site
user’s overall perception of a
system. Is it easy to use, attractive
and appropriate? Does it meet user
needs?
(Public Life)
A consequence of a user’s internal
state (predispositions, expectations,
needs, motivation, mood, etc.), the
characteristics of the designed
system (e.g. complexity, purpose,
usability, functionality, etc.) and the
context (or the environment) within
which the interaction occurs (e.g.
organisational/social setting,
meaningfulness of the activity,
voluntariness of use, etc.)
(Hassenzahl & Tractinsky, 2006)
The entire set of affects that is
elicited by the interaction between a
user and a product, including the
degree to which all our senses are
gratified (aesthetic experience), the
meanigs we attach to the product
(experience of meaning), and the
feelings and emotions that are
elicited (emotional experience).
(Hekkert, 2006)
A set of material rendered by a user
agent which may be perceived by a
user and with which interaction may
be possible. (W3C)
UX is a momentary, primarily
evaluative feeling (good-bad) while
interacting with a product or service.
(Hassenzahl, 2008)
The user experience, mostly called
“customer experience” when
referring to e-commerce websites;
the totality of the experience of a
user when visiting a website. Their
impressions and feelings. Whether
they’re successful. Whether they
enjoy themselves. Whether they feel
like coming back again. The extent
to which they encounter problems,
confusions, and bugs.
(UsabilityFirst.com)
Encompasses all aspects of a digital
product that users experience
directly—and perceive, learn, and
use—including its form, behavior,
and content. Learnability, usability,
usefulness, and aesthetic appeal are
key factors in users’ experience of a
product. (UXmatters)
UX = the sum of a series of
interactions
User experience (UX) represents the
perception left in someone’s mind
following a series of interactions
between people, devices, and
events – or any combination thereof.
(Fatdux.com)
A person’s perceptions and
responses that result from the use or
anticipated use of a product, system
or service (ISO 9241-210, 2010)
The design of user interaction with a
system, product or service
considering the usability, the
enjoyment and the fit to the way
users think. (TicToc)
User experience = Convenience + Design – Cost.
Convenience is the king. What makes a product convenient is quite often what
makes it usable. It might also relate to the availability of the product. It might
also have something to do with laziness and productivity. Defining
“convenience” is by no means an easy task. As is with everything else in this
chart, convenience is subjective.
Design is what makes a product liked and attractive, even before it has been
used. Design is what makes you want the product. It is beauty, the touch of a
famous designer, a likable company, character—pretty much what brand value
is thought to be. (Nyman 2005)
The user experience is the totality of
end-users’ perceptions as they
interact with a product or service.
These perceptions include
effectiveness (how good is the
result?), efficiency (how fast or
cheap is it?), emotional satisfaction
(how good does it feel?), and the
quality of the relationship with the
entity that created the product or
service (what expectations does it
create for subsequent interactions?).
(Kuniavsky, 2010)
The overall experience and
satisfaction a user has when using a
product or system. (BitPipe.com)
The overall perception and
comprehensive interaction an
individual has with a company,
service or product. A positive user
experience is an end-user‘s
successful and streamlined
completion of a desired task. (Goto,
2004)
Users’ judgement of product quality
arising from their experience of
interaction, and the product qualities
which engender effective use and
pleasure. (Sutcliffe, 2010)
User experience stands for the
quality of a global experience as
perceived by a person (user)
interacting with a system. (use-
design.com)
1
2
3 4
5
6
7
8 9 10 11
12 13 14
15 16
17 18 19 20
21 22 23
24
25 26
27
5 © GfK 2014 | How Good is your User Experience? | 26. June 2014
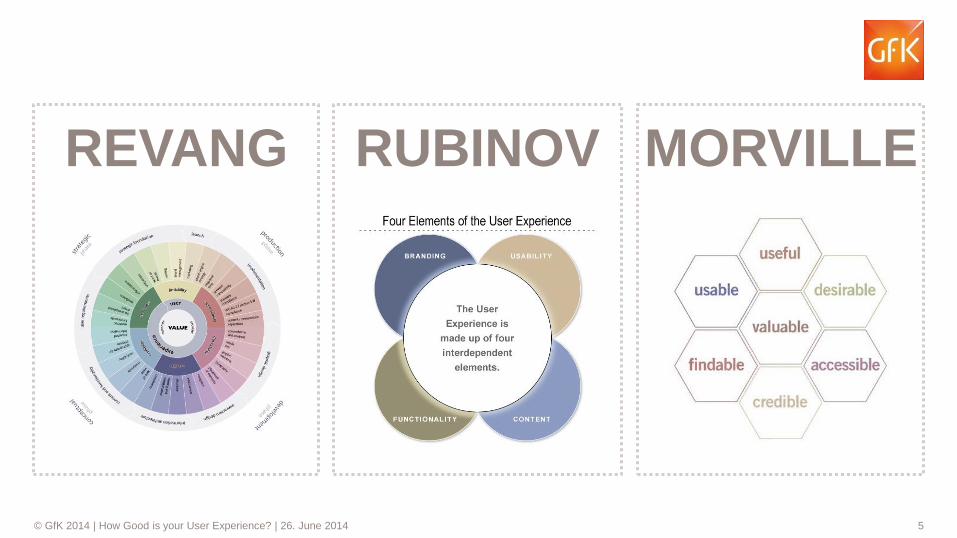
REVANG RUBINOV MORVILLE
6 © GfK 2014 | How Good is your User Experience? | 26. June 2014
HOW CAN YOU
MEASURE THAT?
7 © GfK 2014 | How Good is your User Experience? | 26. June 2014
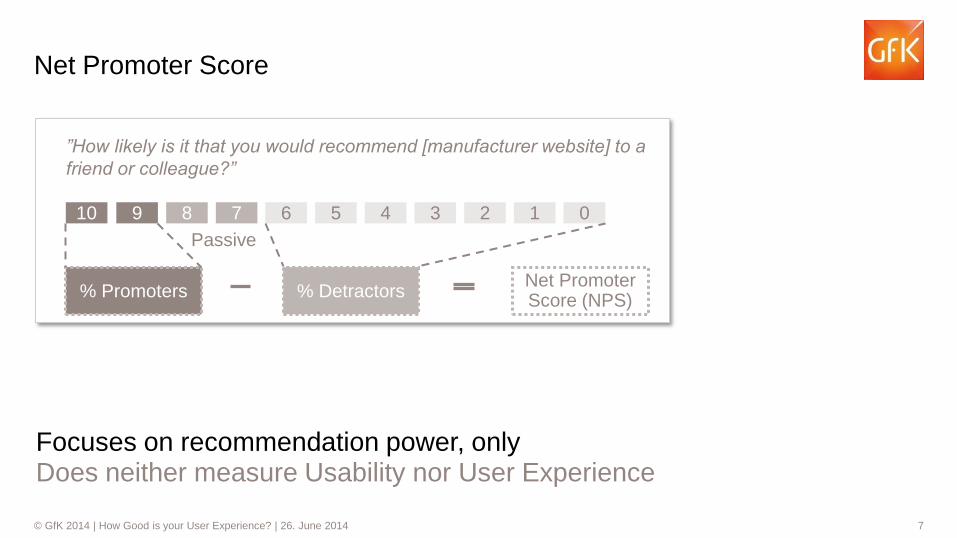
Net Promoter Score (NPS)
% Promoters % Detractors
10 9 8 7 6 5 4 3 2 1 0
Passive
”How likely is it that you would recommend [manufacturer website] to a
friend or colleague?”
Net Promoter Score
Focuses on recommendation power, only Does neither measure Usability nor User Experience
8 © GfK 2014 | How Good is your User Experience? | 26. June 2014
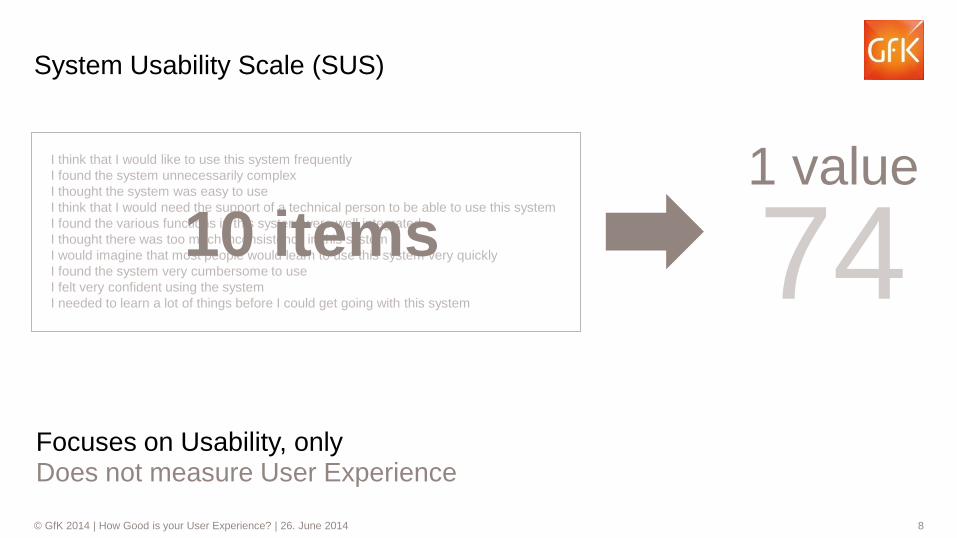
System Usability Scale (SUS)
I think that I would like to use this system frequently
I found the system unnecessarily complex
I thought the system was easy to use
I think that I would need the support of a technical person to be able to use this system
I found the various functions in this system were well integrated
I thought there was too much inconsistency in this system
I would imagine that most people would learn to use this system very quickly
I found the system very cumbersome to use
I felt very confident using the system
I needed to learn a lot of things before I could get going with this system
10 items 74 1 value
Focuses on Usability, only Does not measure User Experience
9 © GfK 2014 | How Good is your User Experience? | 26. June 2014
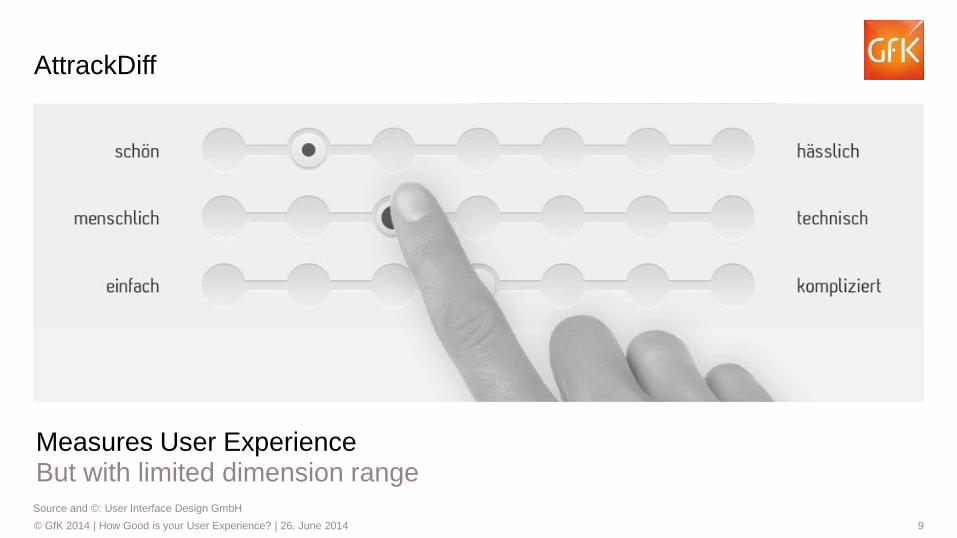
AttrackDiff
Source and ©: User Interface Design GmbH
Variante 2
Measures User Experience But with limited dimension range
10 © GfK 2014 | How Good is your User Experience? | 26. June 2014
GfK’s UX SCORE
MEASURES THAT!
11 © GfK 2014 | How Good is your User Experience? | 26. June 2014
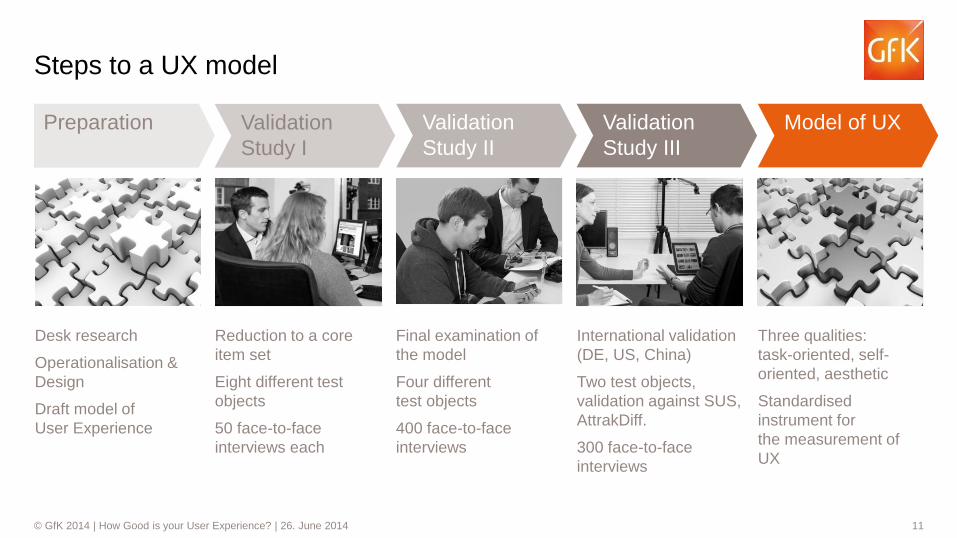
Desk research
Operationalisation &
Design
Draft model of
User Experience
Reduction to a core
item set
Eight different test
objects
50 face-to-face
interviews each
Final examination of
the model
Four different
test objects
400 face-to-face
interviews
Three qualities:
task-oriented, self-
oriented, aesthetic
Standardised
instrument for
the measurement of
UX
International validation
(DE, US, China)
Two test objects,
validation against SUS,
AttrakDiff.
300 face-to-face
interviews
Steps to a UX model
Preparation Validation
Study I
Validation
Study II
Validation
Study III
Model of UX
12 © GfK 2014 | How Good is your User Experience? | 26. June 2014
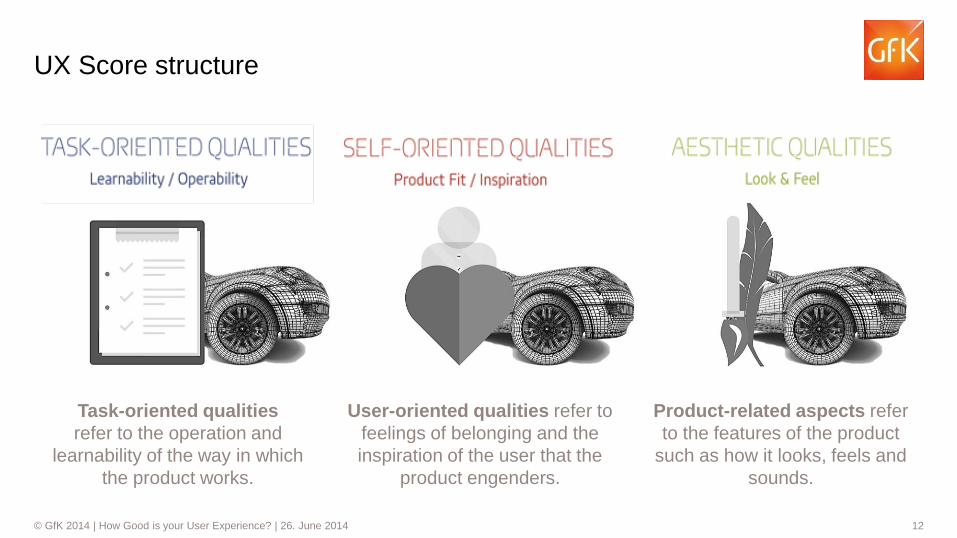
Task-oriented qualities
refer to the operation and
learnability of the way in which
the product works.
User-oriented qualities refer to
feelings of belonging and the
inspiration of the user that the
product engenders.
Product-related aspects refer
to the features of the product
such as how it looks, feels and
sounds.
Variante 2
UX Score structure

13 © GfK 2014 | How Good is your User Experience? | 26. June 2014
STUDY
SETUP
14 © GfK 2014 | How Good is your User Experience? | 26. June 2014
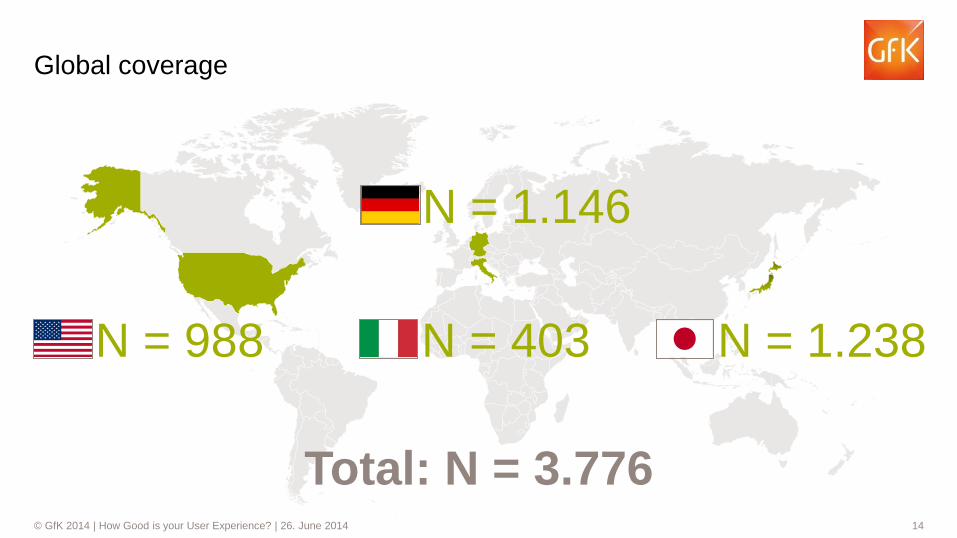
N = 988
N = 1.146
N = 403 N = 1.238
Total: N = 3.776
Global coverage
15 © GfK 2014 | How Good is your User Experience? | 26. June 2014
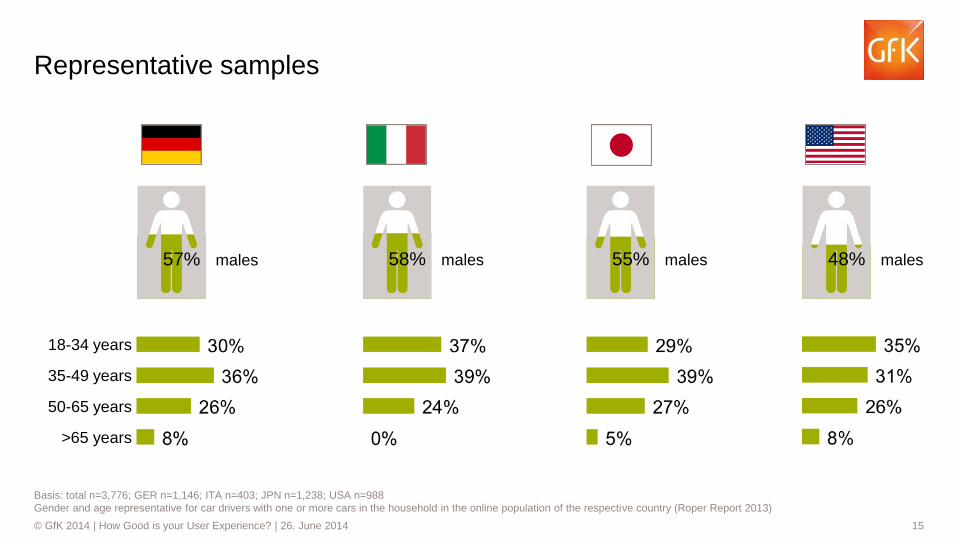
48% males
55% males
Representative samples
Basis: total n=3,776; GER n=1,146; ITA n=403; JPN n=1,238; USA n=988
Gender and age representative for car drivers with one or more cars in the household in the online population of the respective country (Roper Report 2013)
57% males
18-34 years
58% males
35-49 years
50-65 years
>65 years
16 © GfK 2014 | How Good is your User Experience? | 26. June 2014
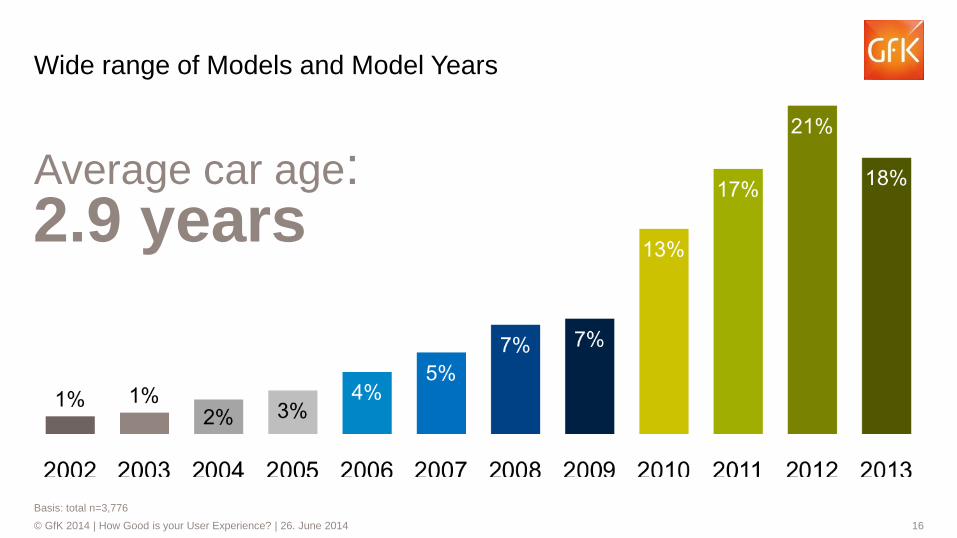
Wide range of Models and Model Years
Basis: total n=3,776
Average car age: 2.9 years
17 © GfK 2014 | How Good is your User Experience? | 26. June 2014
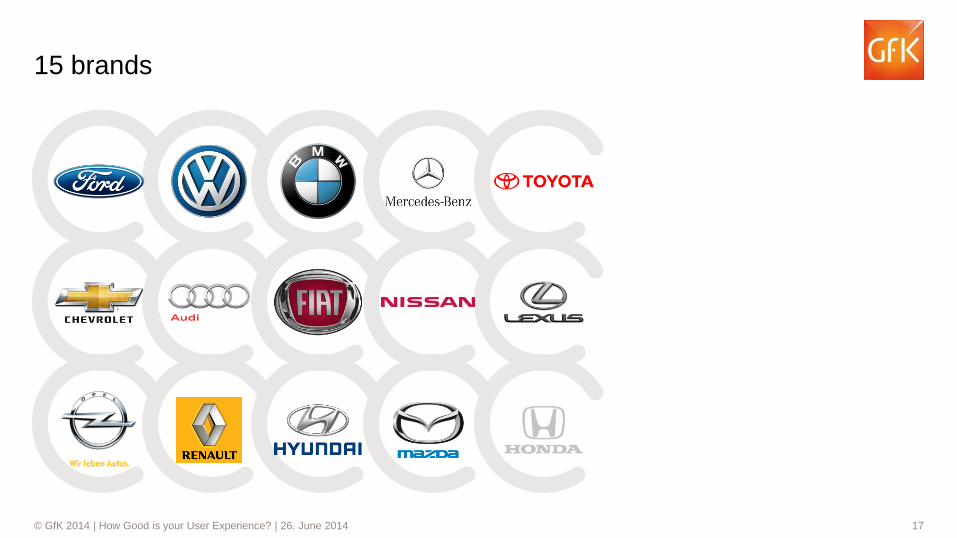
15 brands
18 © GfK 2014 | How Good is your User Experience? | 26. June 2014
STUDY
RESULTS
19 © GfK 2014 | How Good is your User Experience? | 26. June 2014
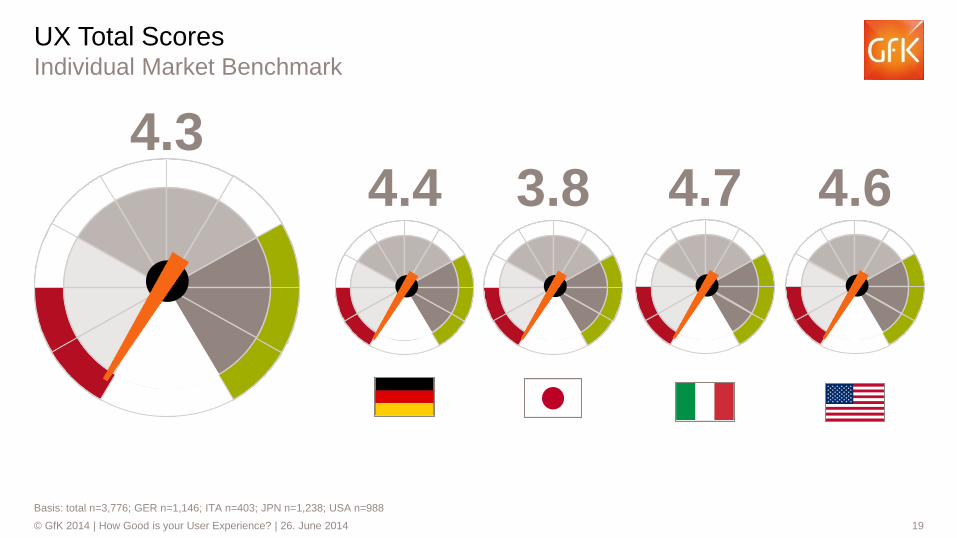
UX Total Scores Individual Market Benchmark
4.3 4.4 4.7 3.8 4.6
Basis: total n=3,776; GER n=1,146; ITA n=403; JPN n=1,238; USA n=988
20 © GfK 2014 | How Good is your User Experience? | 26. June 2014
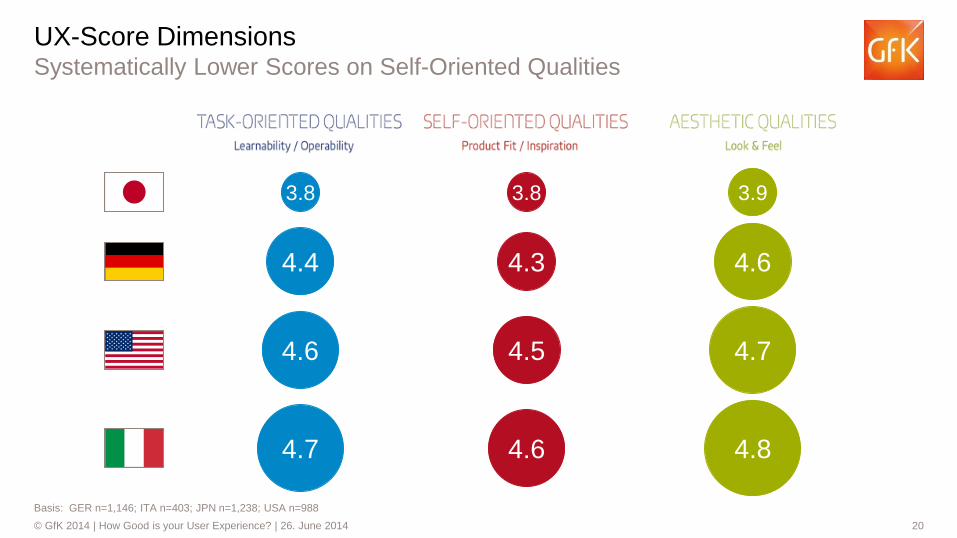
UX-Score Dimensions Systematically Lower Scores on Self-Oriented Qualities
Basis: GER n=1,146; ITA n=403; JPN n=1,238; USA n=988
3.8
4.4
4.6
4.7
3.8
4.3
4.5
4.6 4.8
4.7
4.6
3.9
21 © GfK 2014 | How Good is your User Experience? | 26. June 2014
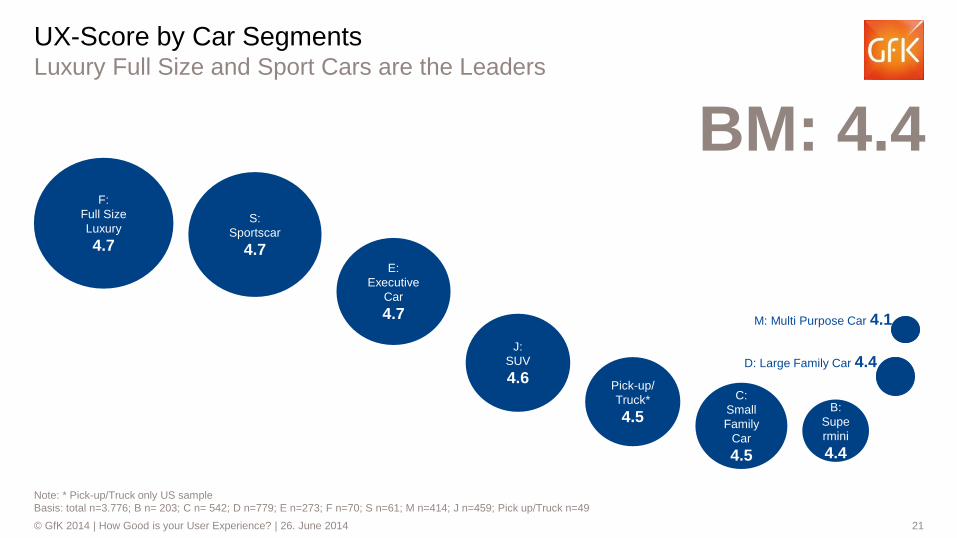
F:
Full Size
Luxury
4.7
S:
Sportscar
4.7 E:
Executive
Car
4.7
J:
SUV
4.6 Pick-up/
Truck*
4.5
C:
Small
Family
Car
4.5
B:
Supe
rmini
4.4
M: Multi Purpose Car 4.1
D: Large Family Car 4.4
BM: 4.4
UX-Score by Car Segments Luxury Full Size and Sport Cars are the Leaders
Note: * Pick-up/Truck only US sample
Basis: total n=3.776; B n= 203; C n= 542; D n=779; E n=273; F n=70; S n=61; M n=414; J n=459; Pick up/Truck n=49
22 © GfK 2014 | How Good is your User Experience? | 26. June 2014
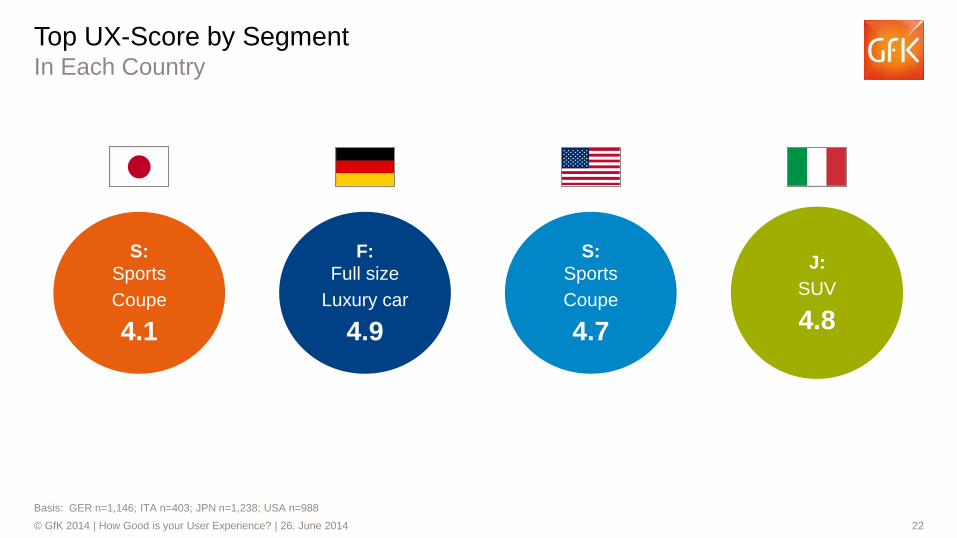
J:
SUV
4.8
Basis: GER n=1,146; ITA n=403; JPN n=1,238; USA n=988
F:
Full size
Luxury car
4.9
S:
Sports
Coupe
4.1
S:
Sports
Coupe
4.7
Top UX-Score by Segment In Each Country
23 © GfK 2014 | How Good is your User Experience? | 26. June 2014
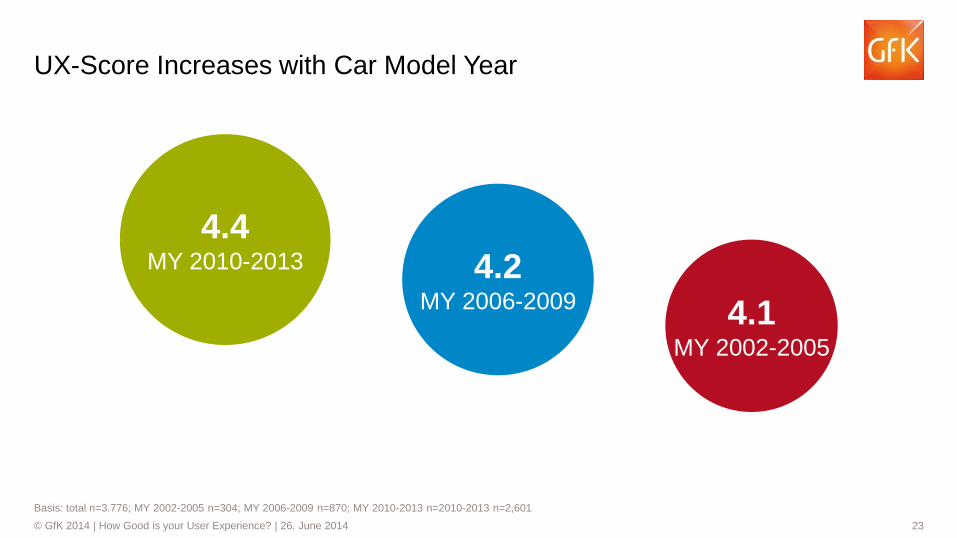
UX-Score Increases with Car Model Year
Basis: total n=3.776; MY 2002-2005 n=304; MY 2006-2009 n=870; MY 2010-2013 n=2010-2013 n=2,601
4.1 MY 2002-2005
4.4 MY 2010-2013 4.2
MY 2006-2009
24 © GfK 2014 | How Good is your User Experience? | 26. June 2014
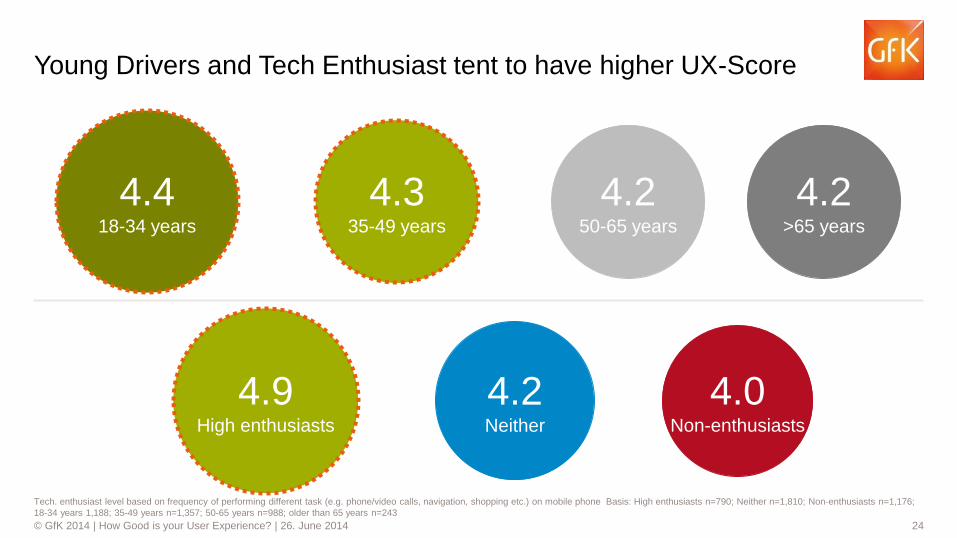
Young Drivers and Tech Enthusiast tent to have higher UX-Score
4.4 18-34 years
4.3 35-49 years
4.2 50-65 years
4.2 >65 years
4.9 High enthusiasts
4.2 Neither
4.0 Non-enthusiasts
Tech. enthusiast level based on frequency of performing different task (e.g. phone/video calls, navigation, shopping etc.) on mobile phone Basis: High enthusiasts n=790; Neither n=1,810; Non-enthusiasts n=1,176;
18-34 years 1,188; 35-49 years n=1,357; 50-65 years n=988; older than 65 years n=243
25 © GfK 2014 | How Good is your User Experience? | 26. June 2014
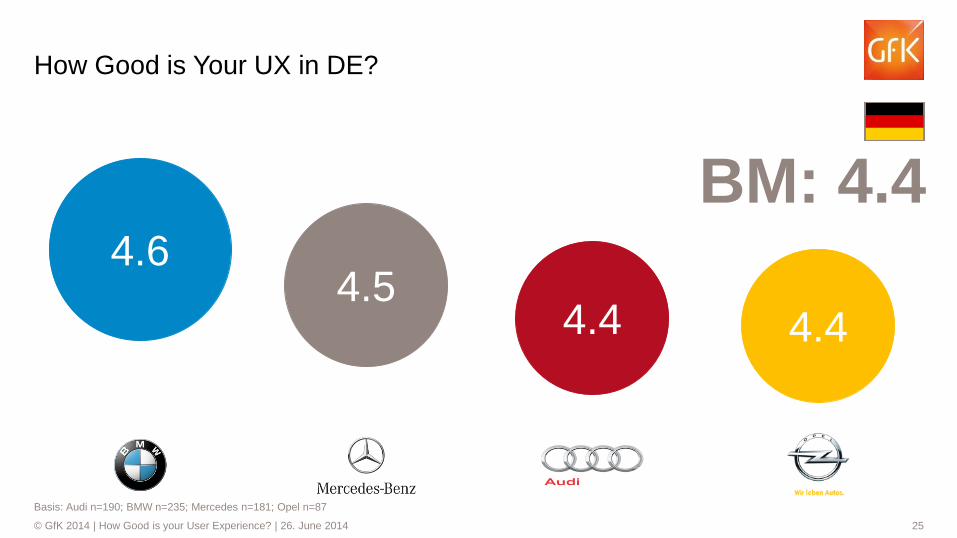
4.6 4.5
4.4 4.4
How Good is Your UX in DE?
BM: 4.4
Basis: Audi n=190; BMW n=235; Mercedes n=181; Opel n=87
26 © GfK 2014 | How Good is your User Experience? | 26. June 2014
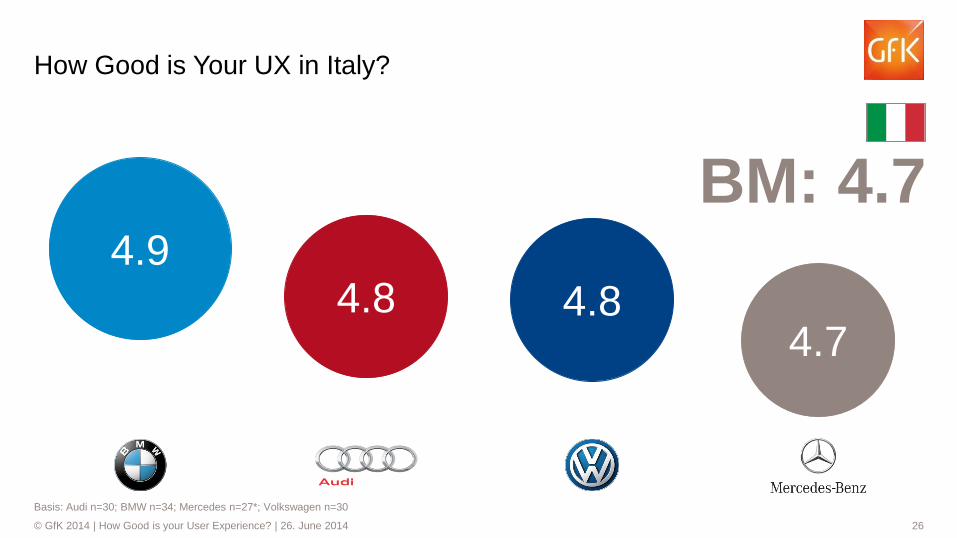
4.9 4.8 4.8
4.7
How Good is Your UX in Italy?
BM: 4.7
Basis: Audi n=30; BMW n=34; Mercedes n=27*; Volkswagen n=30
27 © GfK 2014 | How Good is your User Experience? | 26. June 2014
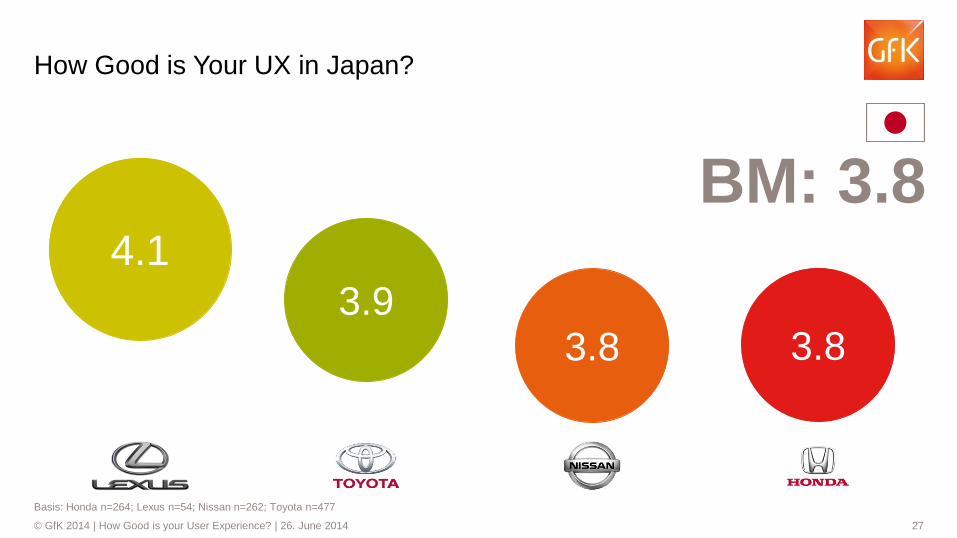
4.1 3.9
3.8 3.8
How Good is Your UX in Japan?
BM: 3.8
Basis: Honda n=264; Lexus n=54; Nissan n=262; Toyota n=477
28 © GfK 2014 | How Good is your User Experience? | 26. June 2014
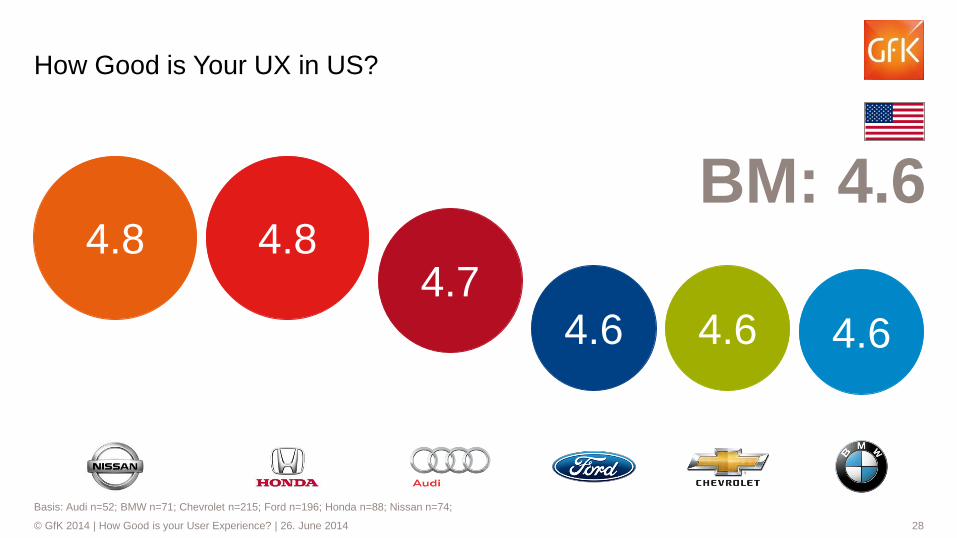
4.6 4.6 4.6 4.7
4.8 4.8
How Good is Your UX in US?
BM: 4.6
Basis: Audi n=52; BMW n=71; Chevrolet n=215; Ford n=196; Honda n=88; Nissan n=74;
29 © GfK 2014 | How Good is your User Experience? | 26. June 2014
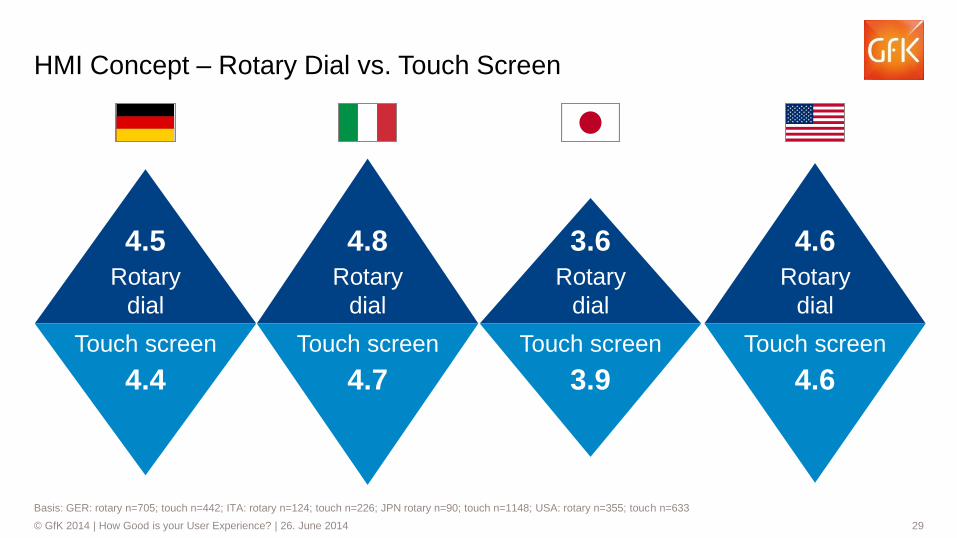
4.5 Rotary
dial
4.8 Rotary
dial
3.6 Rotary
dial
4.6 Rotary
dial
HMI Concept – Rotary Dial vs. Touch Screen
Basis: GER: rotary n=705; touch n=442; ITA: rotary n=124; touch n=226; JPN rotary n=90; touch n=1148; USA: rotary n=355; touch n=633
Touch screen
4.4
Touch screen
4.7
Touch screen
3.9
Touch screen
4.6
30 © GfK 2014 | How Good is your User Experience? | 26. June 2014
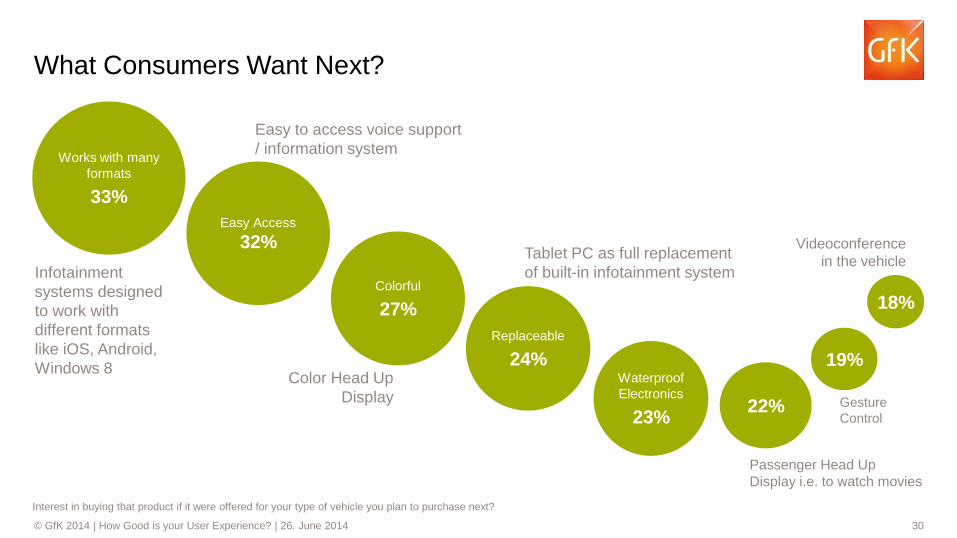
Works with many
formats
33%
Easy Access
32%
Colorful
27%
Replaceable
24% Waterproof
Electronics
23% 22%
19%
18%
Infotainment
systems designed
to work with
different formats
like iOS, Android,
Windows 8
Easy to access voice support
/ information system
Tablet PC as full replacement
of built-in infotainment system
Passenger Head Up
Display i.e. to watch movies
Gesture
Control
Videoconference
in the vehicle
Color Head Up
Display
What Consumers Want Next?
Interest in buying that product if it were offered for your type of vehicle you plan to purchase next?
31 © GfK 2014 | How Good is your User Experience? | 26. June 2014
CONCLUSION
32 © GfK 2014 | How Good is your User Experience? | 26. June 2014
WHAT?
SO
WHAT?
NOW
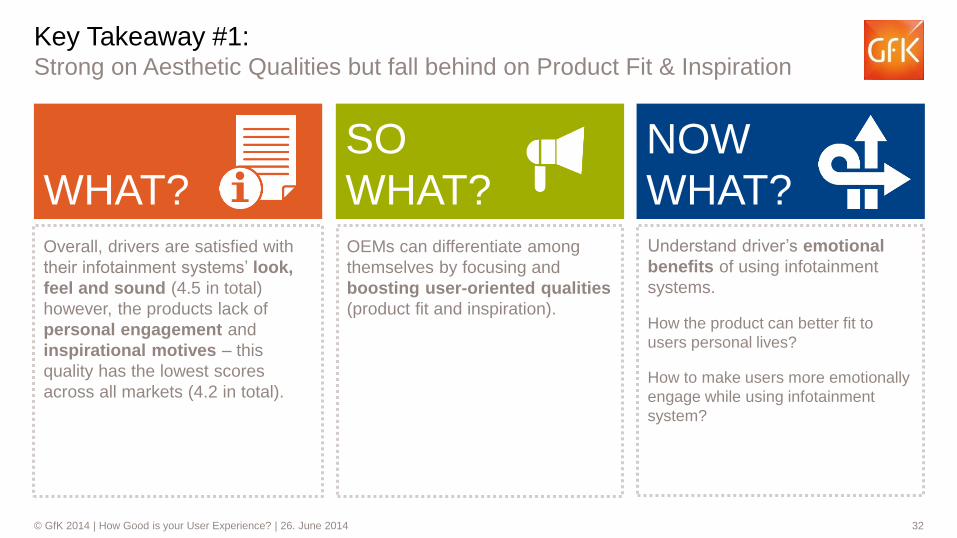
WHAT? OEMs can differentiate among
themselves by focusing and
boosting user-oriented qualities
(product fit and inspiration).
Understand driver’s emotional
benefits of using infotainment
systems.
How the product can better fit to
users personal lives?
How to make users more emotionally
engage while using infotainment
system?
Key Takeaway #1: Strong on Aesthetic Qualities but fall behind on Product Fit & Inspiration
Overall, drivers are satisfied with
their infotainment systems’ look,
feel and sound (4.5 in total)
however, the products lack of
personal engagement and
inspirational motives – this
quality has the lowest scores
across all markets (4.2 in total).
33 © GfK 2014 | How Good is your User Experience? | 26. June 2014
WHAT?
SO
WHAT?
NOW
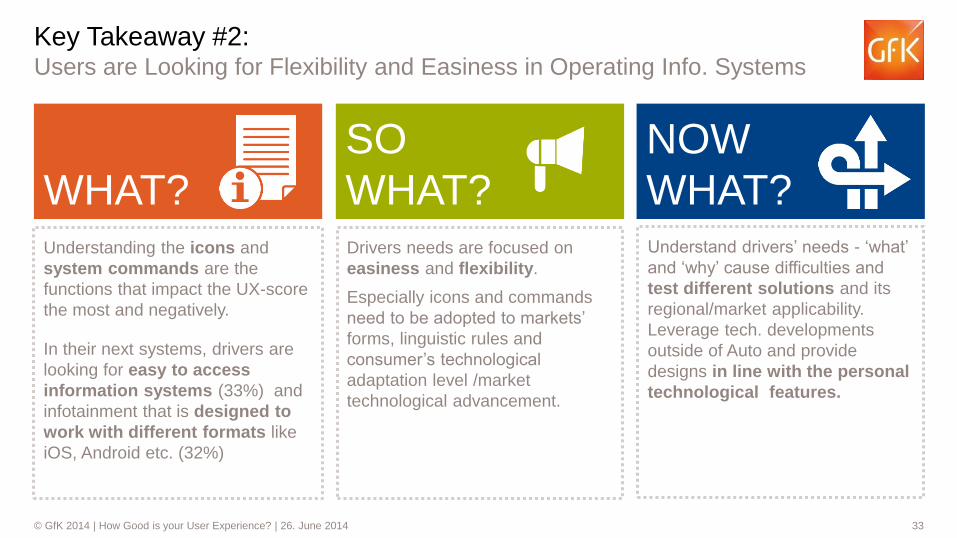
WHAT? Drivers needs are focused on
easiness and flexibility.
Especially icons and commands
need to be adopted to markets’
forms, linguistic rules and
consumer’s technological
adaptation level /market
technological advancement.
Understand drivers’ needs - ‘what’
and ‘why’ cause difficulties and
test different solutions and its
regional/market applicability.
Leverage tech. developments
outside of Auto and provide
designs in line with the personal
technological features.
Key Takeaway #2: Users are Looking for Flexibility and Easiness in Operating Info. Systems
Understanding the icons and
system commands are the
functions that impact the UX-score
the most and negatively.
In their next systems, drivers are
looking for easy to access
information systems (33%) and
infotainment that is designed to
work with different formats like
iOS, Android etc. (32%)
34 © GfK 2014 | How Good is your User Experience? | 26. June 2014
WHAT?
SO
WHAT?
NOW
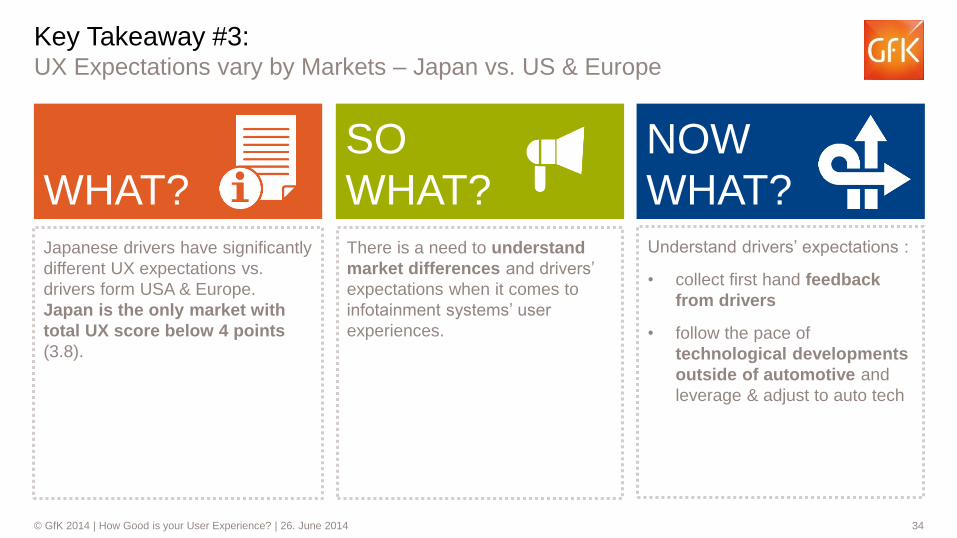
WHAT? There is a need to understand
market differences and drivers’
expectations when it comes to
infotainment systems’ user
experiences.
Understand drivers’ expectations :
• collect first hand feedback
from drivers
• follow the pace of
technological developments
outside of automotive and
leverage & adjust to auto tech
Key Takeaway #3: UX Expectations vary by Markets – Japan vs. US & Europe
Japanese drivers have significantly
different UX expectations vs.
drivers form USA & Europe.
Japan is the only market with
total UX score below 4 points
(3.8).
35 © GfK 2014 | How Good is your User Experience? | 26. June 2014
THANK YOU
QUESTIONS PLEASE
36 © GfK 2014 | How Good is your User Experience? | 26. June 2014
Contact
Tim Bosenick
Head of User Experience
+49 40 696669 134
@GfK_UX